chapter 10 - wiley: 2000, john wiley & sons, inc. nise/control systems engineering, 3/e 2...
TRANSCRIPT

©2000, John Wiley & Sons, Inc.Nise/Control Systems Engineering, 3/e
Chapter 10: Frequency Response Techniques1
Chapter 10
Frequency Response Techniques

©2000, John Wiley & Sons, Inc.Nise/Control Systems Engineering, 3/e
Chapter 10: Frequency Response Techniques2
Figure 10.1The HP 35670A Dynamic Signal Analyzer obtainsfrequency responsedata from a physicalsystem. Thedisplayed data can be used to analyze, design, or determine a mathematical modelfor the system.
Courtesy of Hewlett-Packard.

©2000, John Wiley & Sons, Inc.Nise/Control Systems Engineering, 3/e
Chapter 10: Frequency Response Techniques3
Figure 10.2Sinusoidal frequencyresponse:a. system;b. transfer function;c. input and outputwaveforms

©2000, John Wiley & Sons, Inc.Nise/Control Systems Engineering, 3/e
Chapter 10: Frequency Response Techniques4
Figure 10.3System withsinusoidal input
©2000, John Wiley & Sons, Inc.Nise/Control Systems Engineering, 3/e
Chapter 10: Frequency Response Techniques5
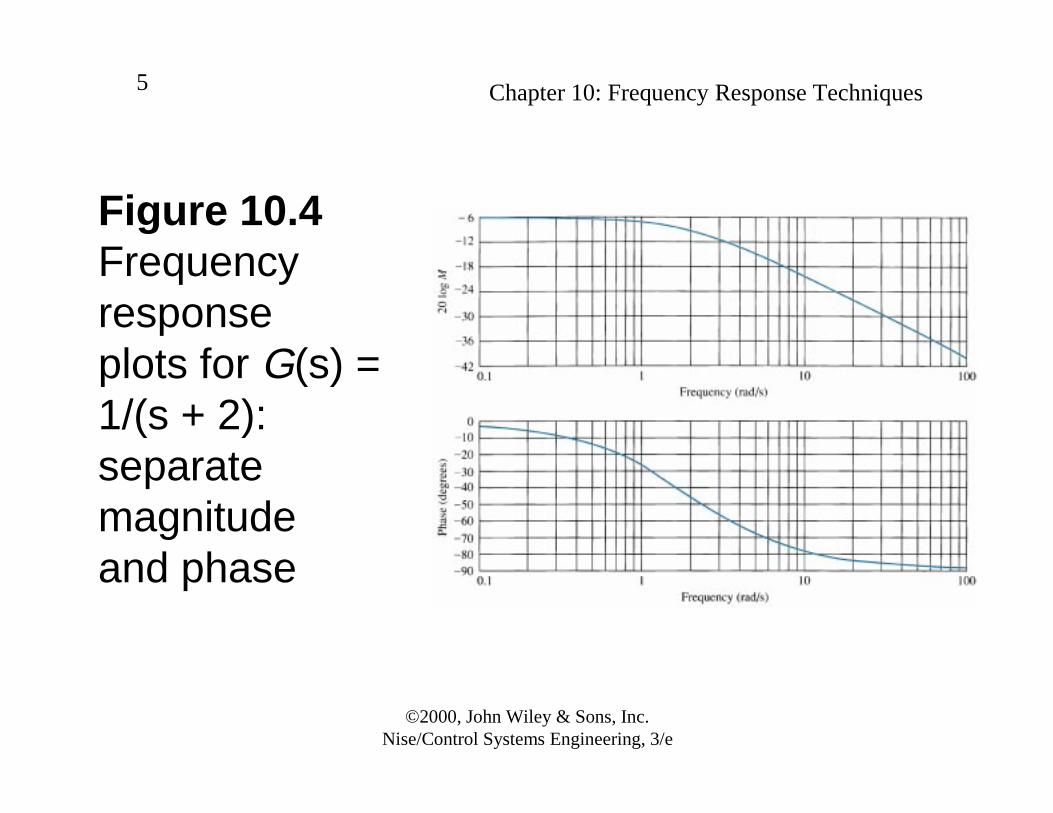
Figure 10.4Frequency responseplots for G(s) =1/(s + 2):separate magnitudeand phase
©2000, John Wiley & Sons, Inc.Nise/Control Systems Engineering, 3/e
Chapter 10: Frequency Response Techniques6
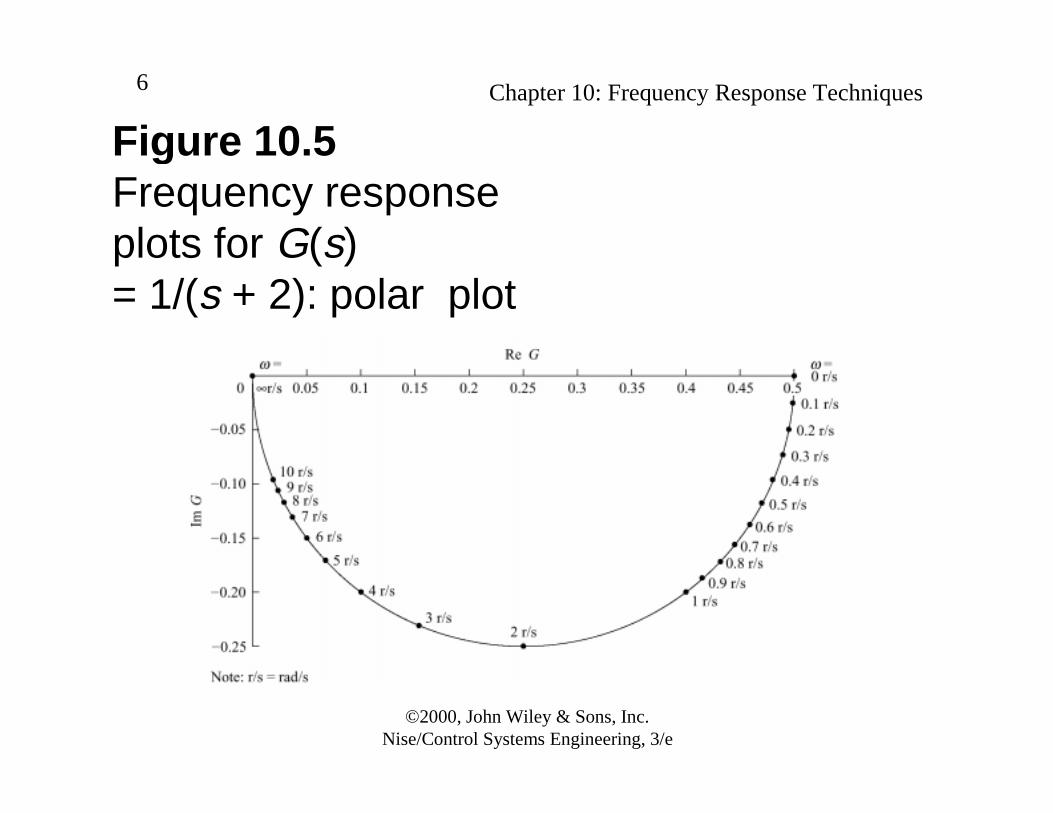
Figure 10.5Frequency responseplots for G(s)= 1/(s + 2): polar plot

©2000, John Wiley & Sons, Inc.Nise/Control Systems Engineering, 3/e
Chapter 10: Frequency Response Techniques7
Figure 10.6Bode plots of(s + a):a. magnitude plot;b. phase plot.
©2000, John Wiley & Sons, Inc.Nise/Control Systems Engineering, 3/e
Chapter 10: Frequency Response Techniques8
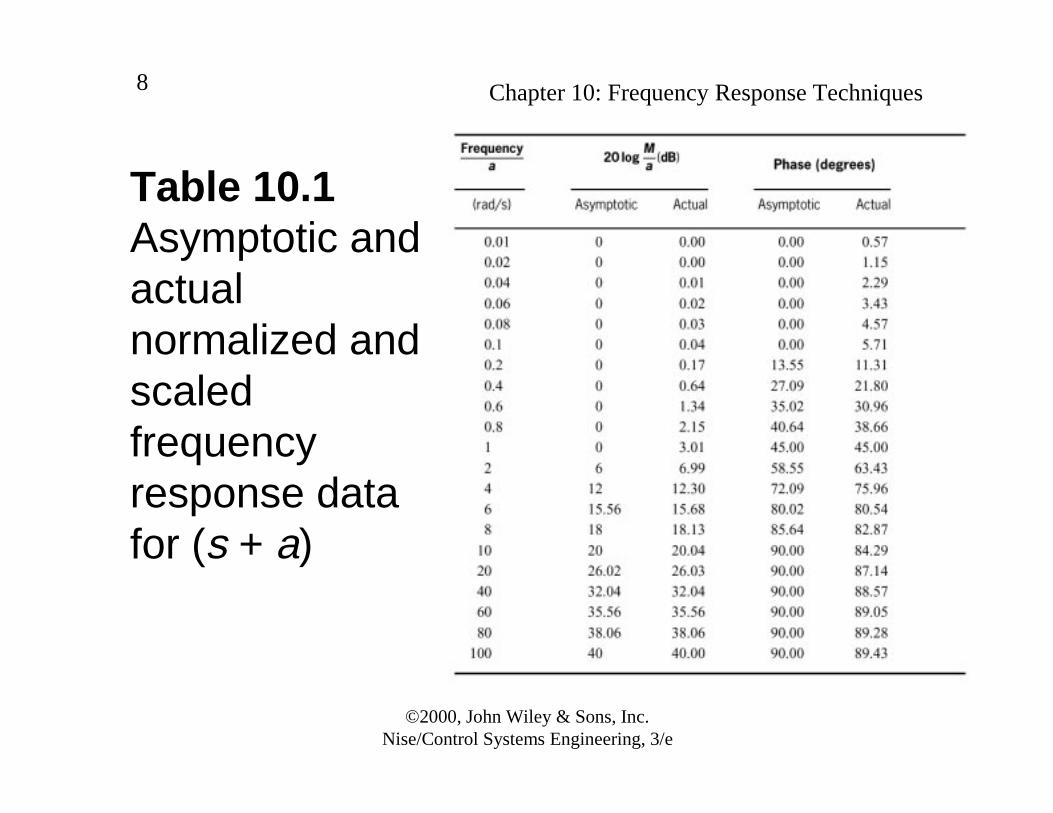
Table 10.1Asymptotic and actual normalized and scaledfrequency response data for (s + a)
©2000, John Wiley & Sons, Inc.Nise/Control Systems Engineering, 3/e
Chapter 10: Frequency Response Techniques9
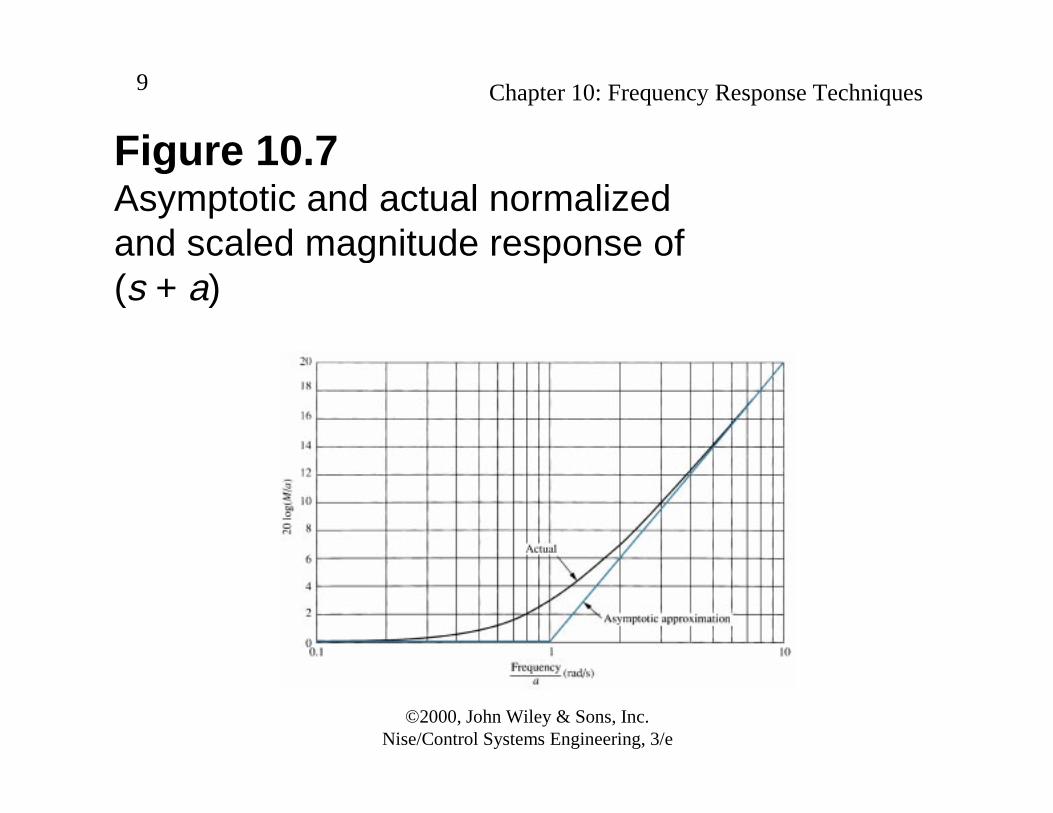
Figure 10.7Asymptotic and actual normalized and scaled magnitude response of(s + a)

©2000, John Wiley & Sons, Inc.Nise/Control Systems Engineering, 3/e
Chapter 10: Frequency Response Techniques10
Figure 10.8Asymptotic and actual normalized and scaled phase response of (s + a)

©2000, John Wiley & Sons, Inc.Nise/Control Systems Engineering, 3/e
Chapter 10: Frequency Response Techniques11
Figure 10.9Normalized and scaledBode plots fora. G(s) = s;b. G(s) = 1/s;c. G(s) = (s + a);d. G(s) = 1/(s + a)

©2000, John Wiley & Sons, Inc.Nise/Control Systems Engineering, 3/e
Chapter 10: Frequency Response Techniques12
Figure 10.10Closed-loop unityfeedback system
©2000, John Wiley & Sons, Inc.Nise/Control Systems Engineering, 3/e
Chapter 10: Frequency Response Techniques13
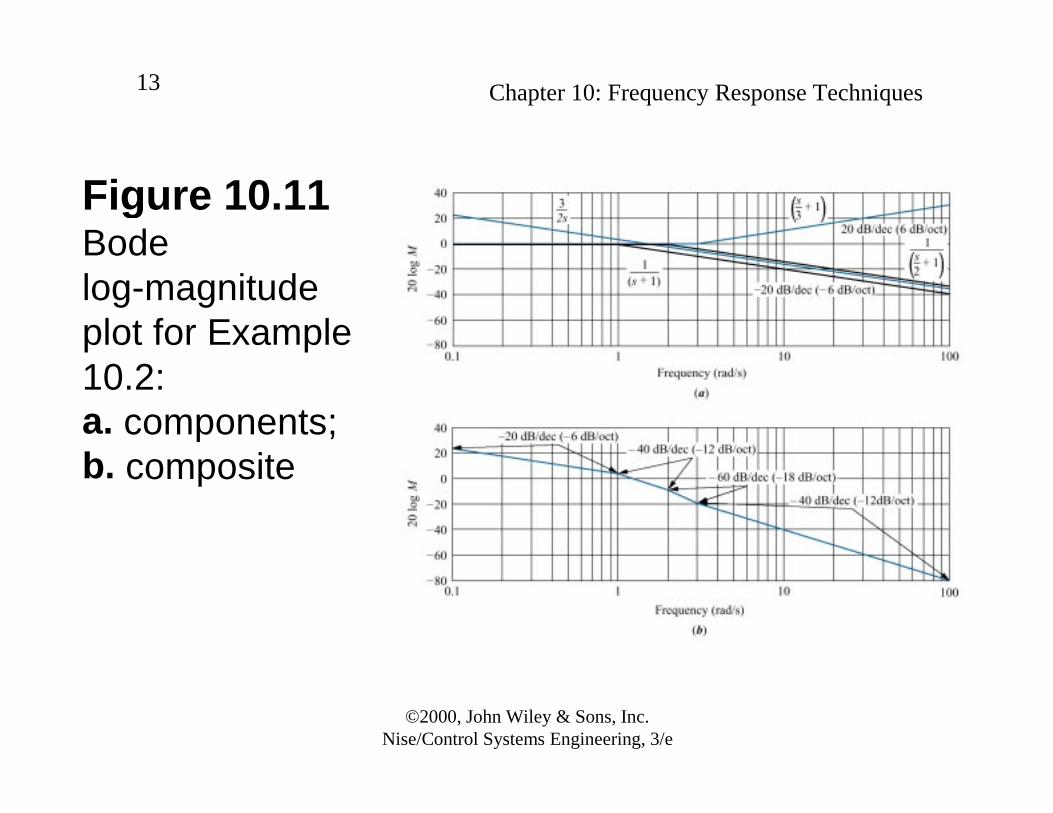
Figure 10.11Bode log-magnitudeplot for Example 10.2:a. components;b. composite

©2000, John Wiley & Sons, Inc.Nise/Control Systems Engineering, 3/e
Chapter 10: Frequency Response Techniques14
Table 10.2Bode magnitude plot: slope contribution from each pole and zero in Example 10.2
©2000, John Wiley & Sons, Inc.Nise/Control Systems Engineering, 3/e
Chapter 10: Frequency Response Techniques15
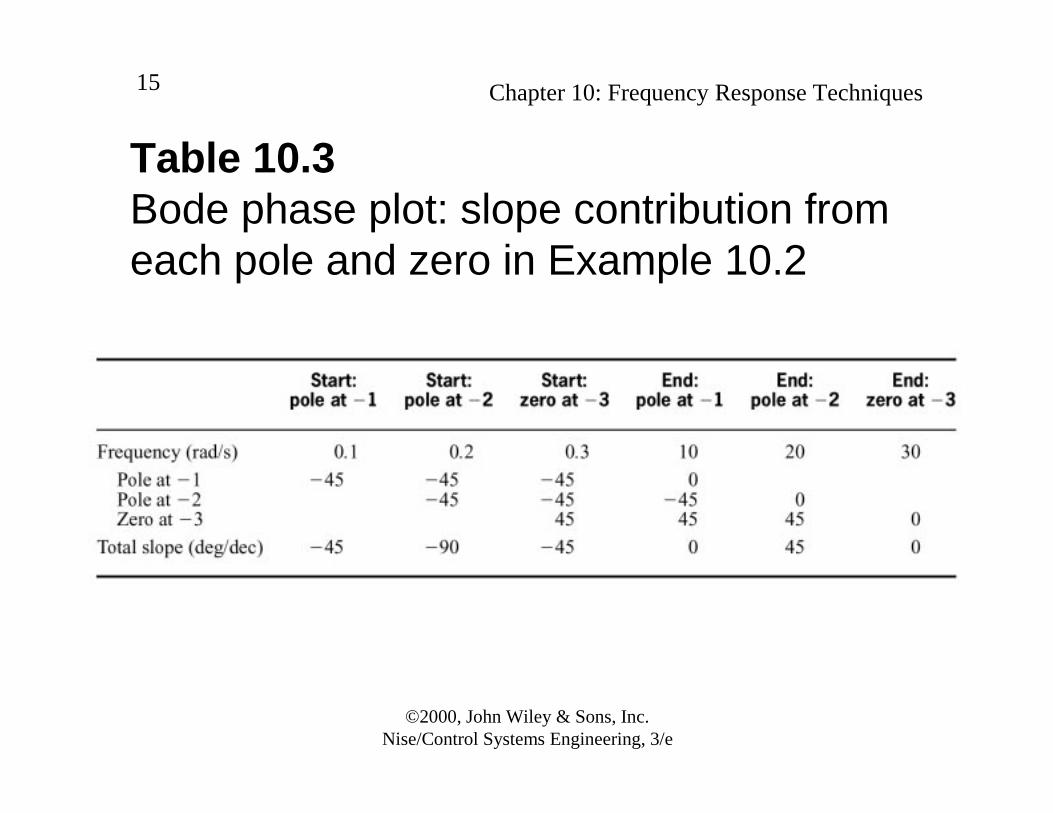
Table 10.3Bode phase plot: slope contribution from each pole and zero in Example 10.2
©2000, John Wiley & Sons, Inc.Nise/Control Systems Engineering, 3/e
Chapter 10: Frequency Response Techniques16
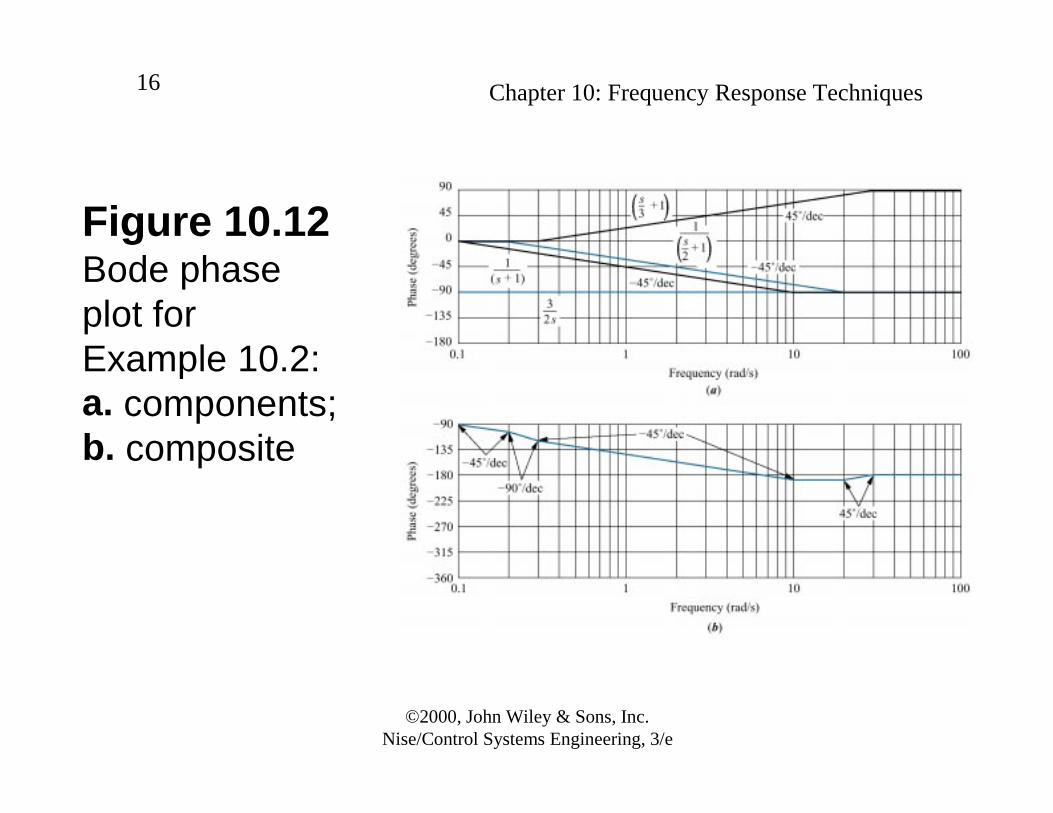
Figure 10.12Bode phaseplot for Example 10.2:a. components;b. composite
©2000, John Wiley & Sons, Inc.Nise/Control Systems Engineering, 3/e
Chapter 10: Frequency Response Techniques17
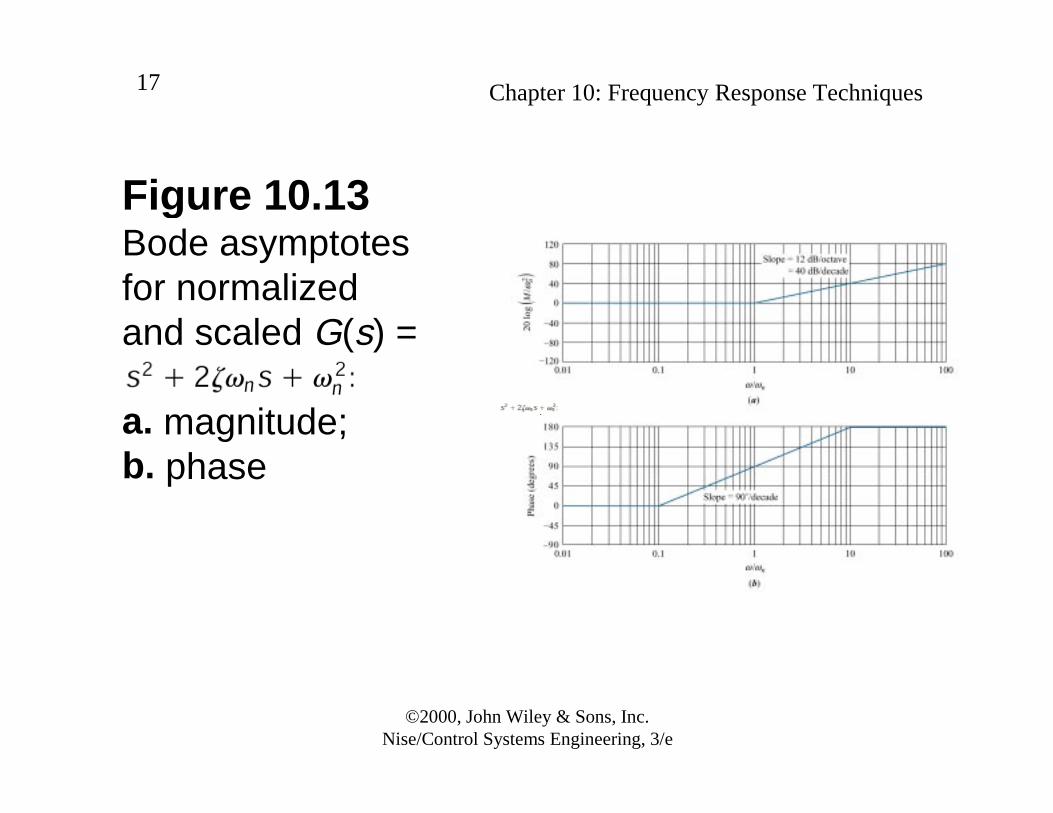
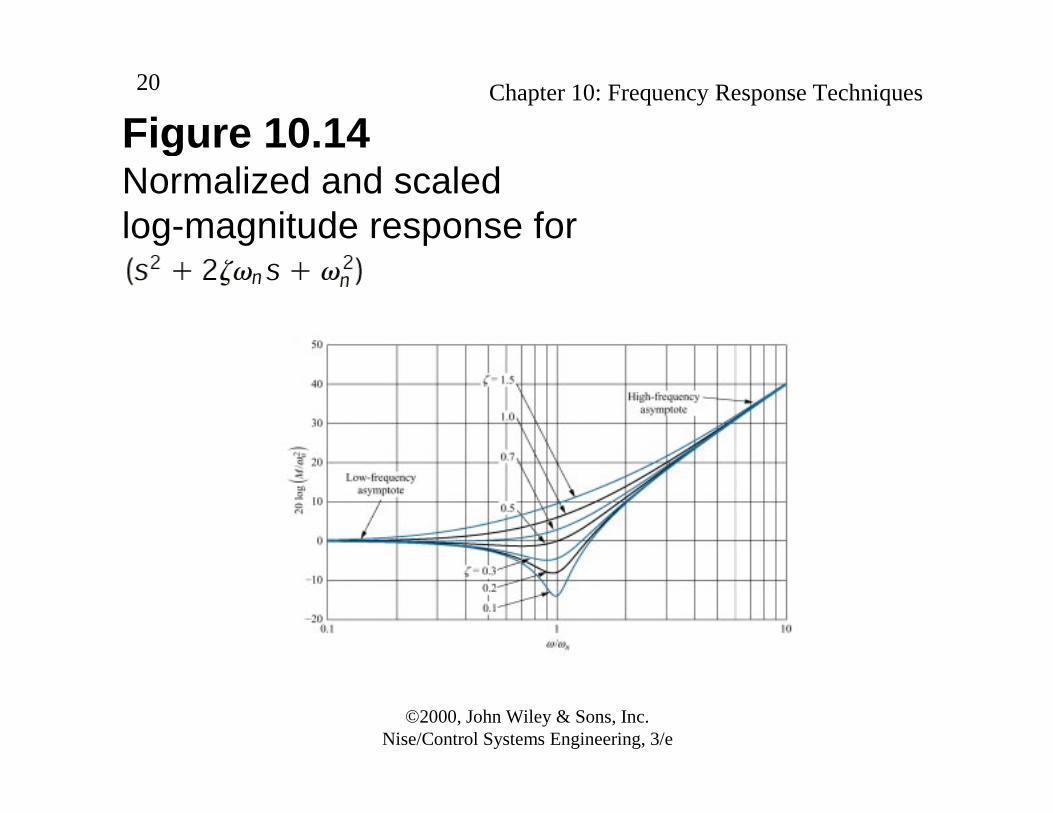
ζω22 +s
Figure 10.13Bode asymptotesfor normalizedand scaled G(s) =
a. magnitude;b. phase

©2000, John Wiley & Sons, Inc.Nise/Control Systems Engineering, 3/e
Chapter 10: Frequency Response Techniques18
Table 10.4Data for normalized and scaled log-magnitude and phase plots for(s2 + 2ζωns + ωn
2).Mag = 20 log(M/ωn
2) (table continues)
Freq.ω/ωn
Mag(dB)
ζ = 0.1
Phase(deg)
ζ = 0.1
Mag(dB)
ζ = 0.2
Phase(deg)
ζ = 0.2
Mag(dB)
ζ = 0.3
Phase(deg)
ζ = 0.3

©2000, John Wiley & Sons, Inc.Nise/Control Systems Engineering, 3/e
Chapter 10: Frequency Response Techniques19
Table 10.4 (continued)
Freq.ω/ωn
Mag(dB)
ζ = 0.5
Phase(deg)
ζ = 0.5
Mag(dB)
ζ = 0.7
Phase(deg)
ζ = 0.7
Mag(dB)ζ = 1
Phase(deg)ζ = 1
©2000, John Wiley & Sons, Inc.Nise/Control Systems Engineering, 3/e
Chapter 10: Frequency Response Techniques20
Figure 10.14Normalized and scaledlog-magnitude response for

©2000, John Wiley & Sons, Inc.Nise/Control Systems Engineering, 3/e
Chapter 10: Frequency Response Techniques21
Figure 10.15Scaled phase response for
©2000, John Wiley & Sons, Inc.Nise/Control Systems Engineering, 3/e
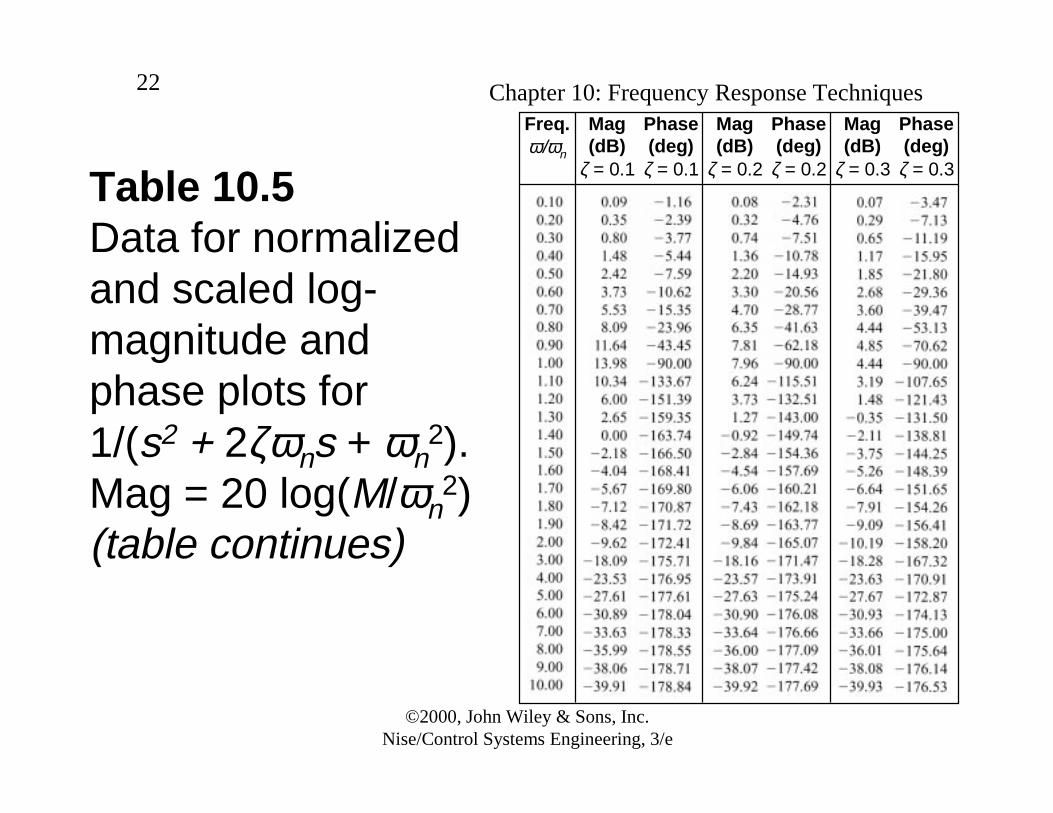
Chapter 10: Frequency Response Techniques22
Table 10.5Data for normalized and scaled log-magnitude and phase plots for1/(s2 + 2ζωns + ωn
2).Mag = 20 log(M/ωn
2) (table continues)
Freq.ω/ωn
Mag(dB)
ζ = 0.1
Phase(deg)
ζ = 0.1
Mag(dB)
ζ = 0.2
Phase(deg)
ζ = 0.2
Mag(dB)
ζ = 0.3
Phase(deg)
ζ = 0.3

©2000, John Wiley & Sons, Inc.Nise/Control Systems Engineering, 3/e
Chapter 10: Frequency Response Techniques23
Table 10.5 (continued)
Freq.ω/ωn
Mag(dB)
ζ = 0.5
Phase(deg)
ζ = 0.5
Mag(dB)
ζ = 0.7
Phase(deg)
ζ = 0.7
Mag(dB)ζ = 1
Phase(deg)ζ = 1
©2000, John Wiley & Sons, Inc.Nise/Control Systems Engineering, 3/e
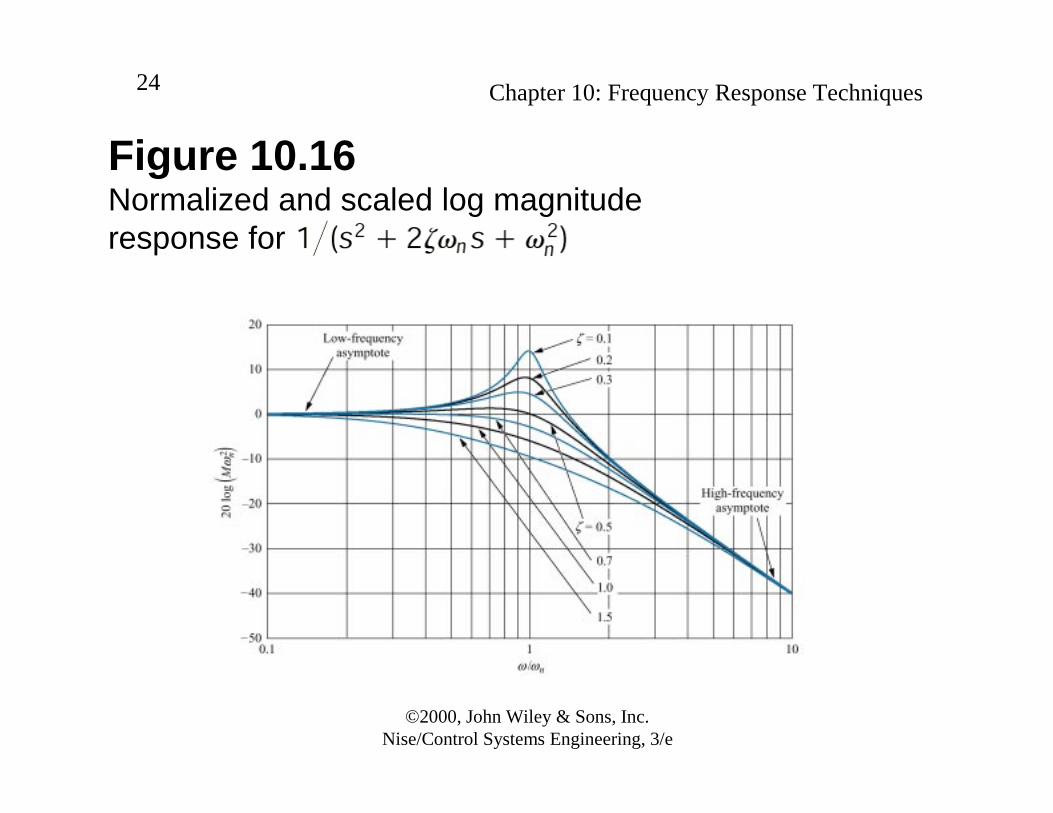
Chapter 10: Frequency Response Techniques24
Figure 10.16Normalized and scaled log magnitude response for

©2000, John Wiley & Sons, Inc.Nise/Control Systems Engineering, 3/e
Chapter 10: Frequency Response Techniques25
Figure 10.17Scaled phase response for
©2000, John Wiley & Sons, Inc.Nise/Control Systems Engineering, 3/e
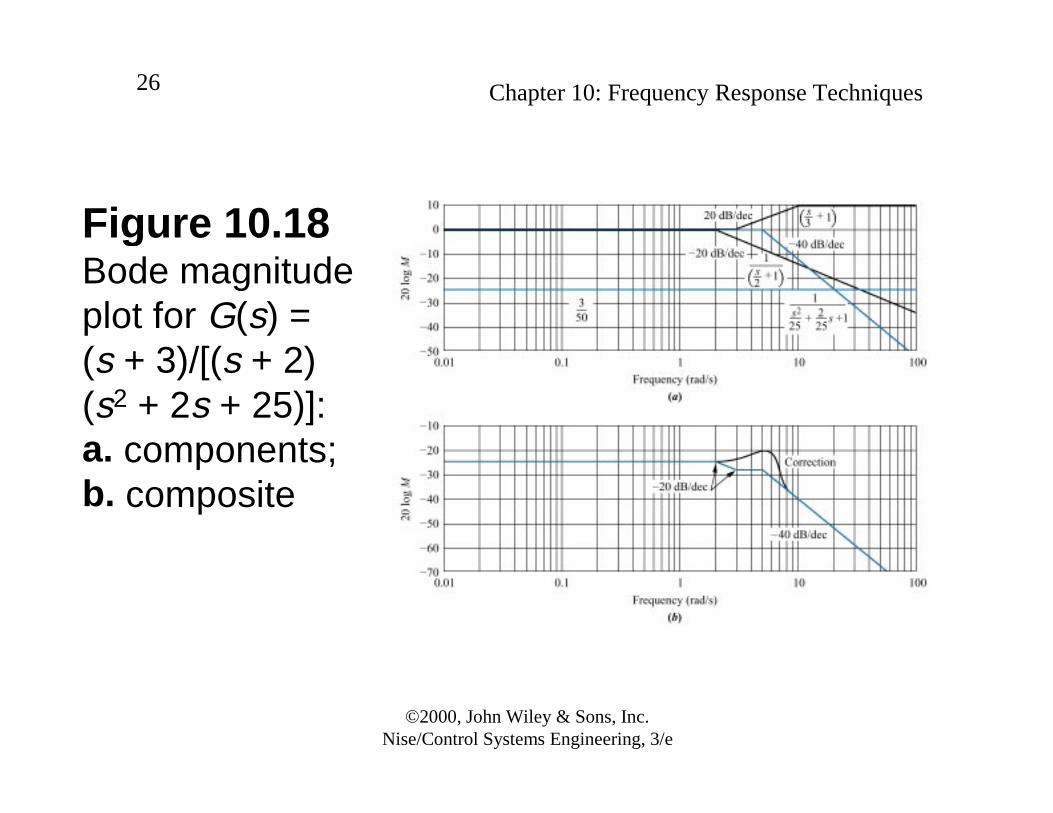
Chapter 10: Frequency Response Techniques26
Figure 10.18Bode magnitudeplot for G(s) =(s + 3)/[(s + 2)(s2 + 2s + 25)]:a. components;b. composite

©2000, John Wiley & Sons, Inc.Nise/Control Systems Engineering, 3/e
Chapter 10: Frequency Response Techniques27
Table 10.6Magnitude diagram slopes for Example 10.3
©2000, John Wiley & Sons, Inc.Nise/Control Systems Engineering, 3/e
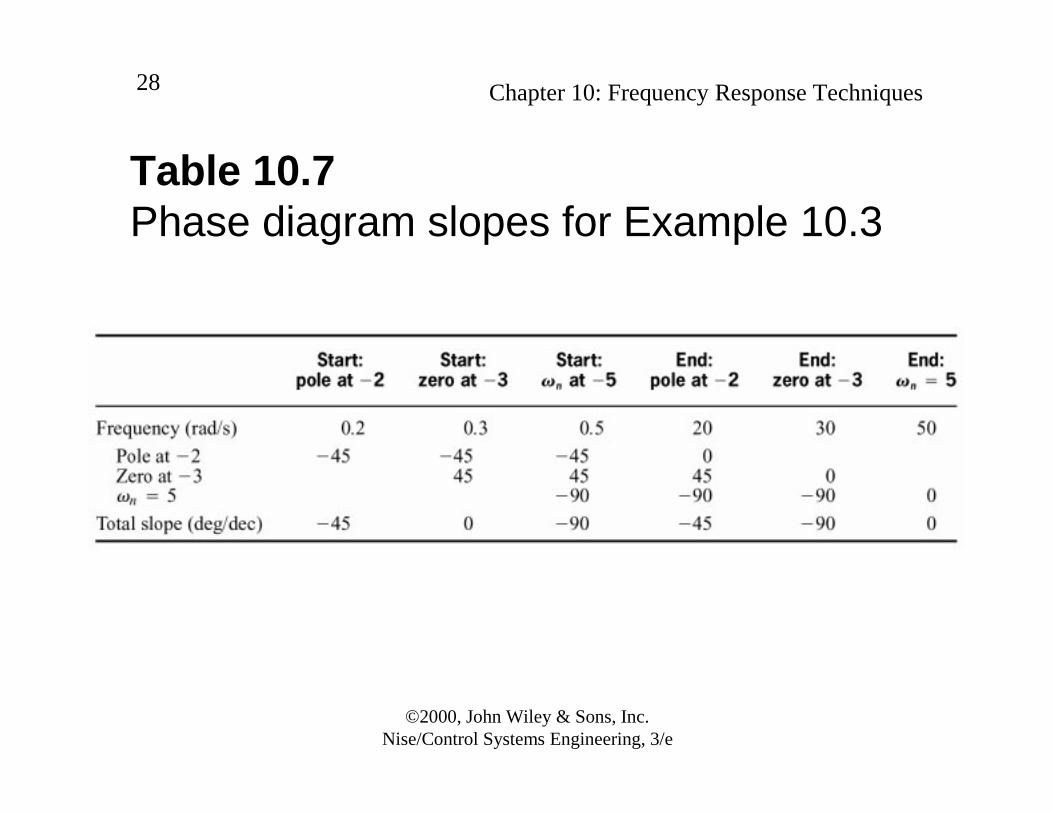
Chapter 10: Frequency Response Techniques28
Table 10.7Phase diagram slopes for Example 10.3

©2000, John Wiley & Sons, Inc.Nise/Control Systems Engineering, 3/e
Chapter 10: Frequency Response Techniques29
Figure 10.19Bode phase plot forG(s) = (s + 3)/[(s +2)(s2 + 2s + 25)]:a. components;b. composite
©2000, John Wiley & Sons, Inc.Nise/Control Systems Engineering, 3/e
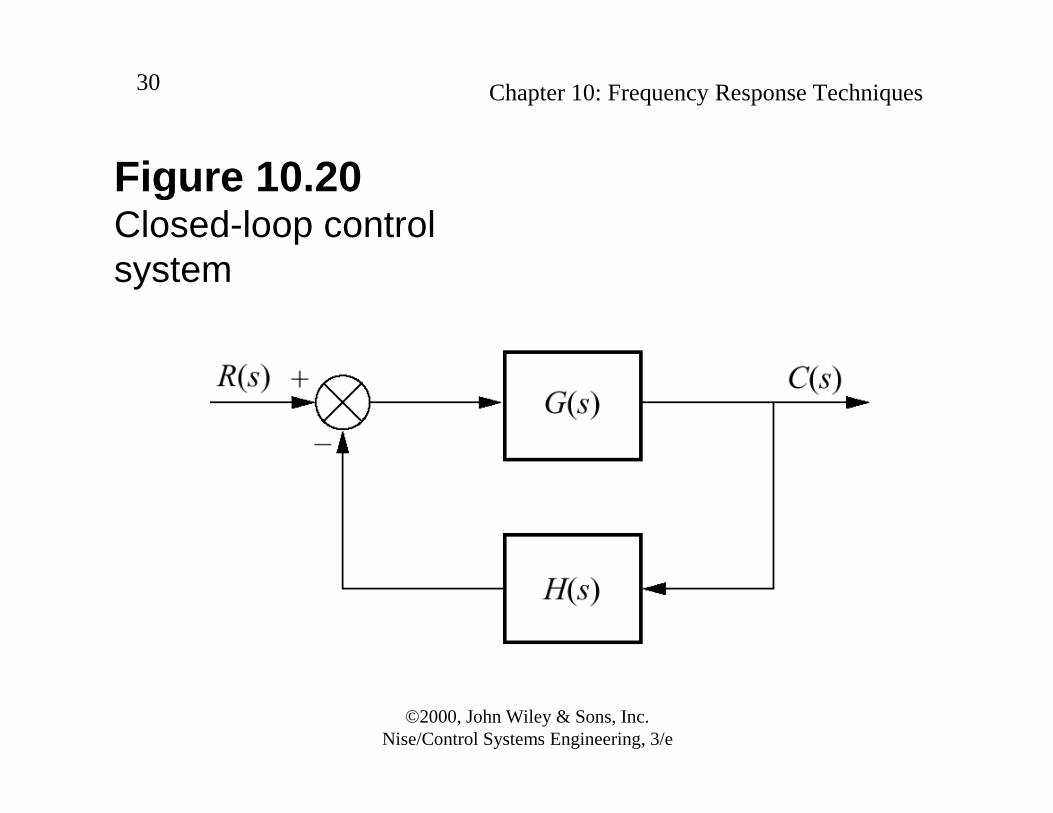
Chapter 10: Frequency Response Techniques30
Figure 10.20Closed-loop controlsystem
©2000, John Wiley & Sons, Inc.Nise/Control Systems Engineering, 3/e
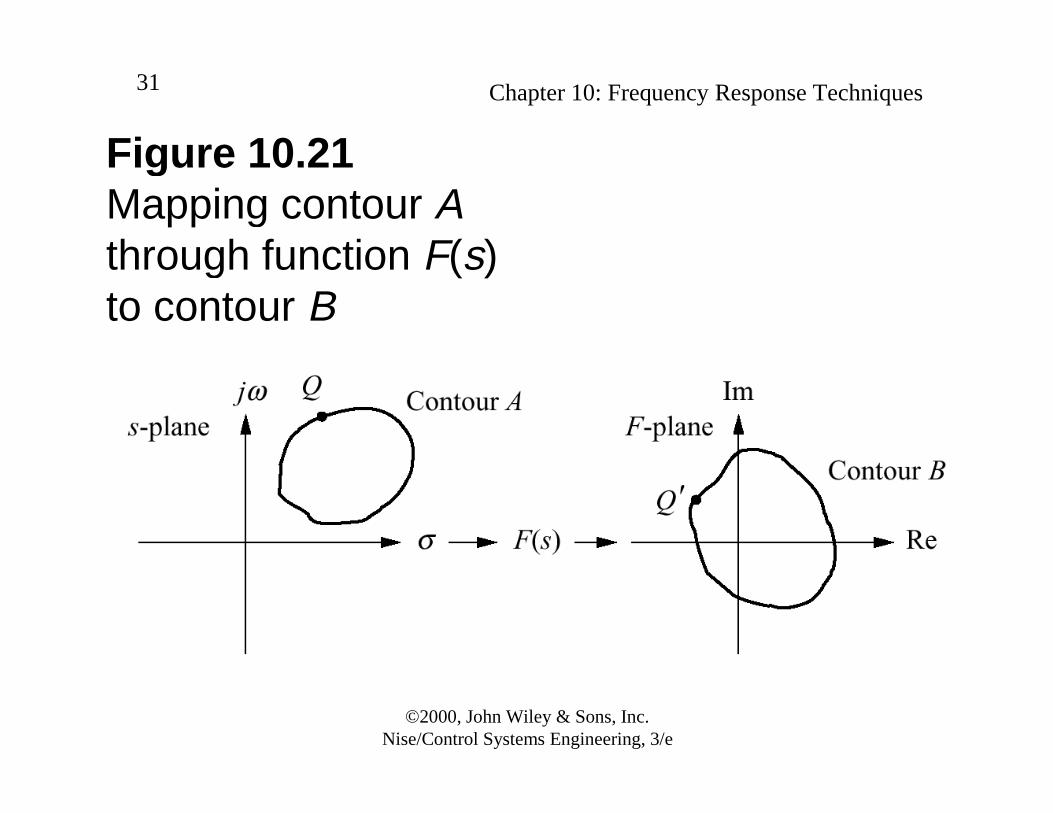
Chapter 10: Frequency Response Techniques31
Figure 10.21Mapping contour Athrough function F(s)to contour B

©2000, John Wiley & Sons, Inc.Nise/Control Systems Engineering, 3/e
Chapter 10: Frequency Response Techniques32
Figure 10.22Examples of contourmapping

©2000, John Wiley & Sons, Inc.Nise/Control Systems Engineering, 3/e
Chapter 10: Frequency Response Techniques33
Figure 10.23Vector representationof mapping

©2000, John Wiley & Sons, Inc.Nise/Control Systems Engineering, 3/e
Chapter 10: Frequency Response Techniques34
Figure 10.24Contour enclosingright half-planeto determine stability
©2000, John Wiley & Sons, Inc.Nise/Control Systems Engineering, 3/e
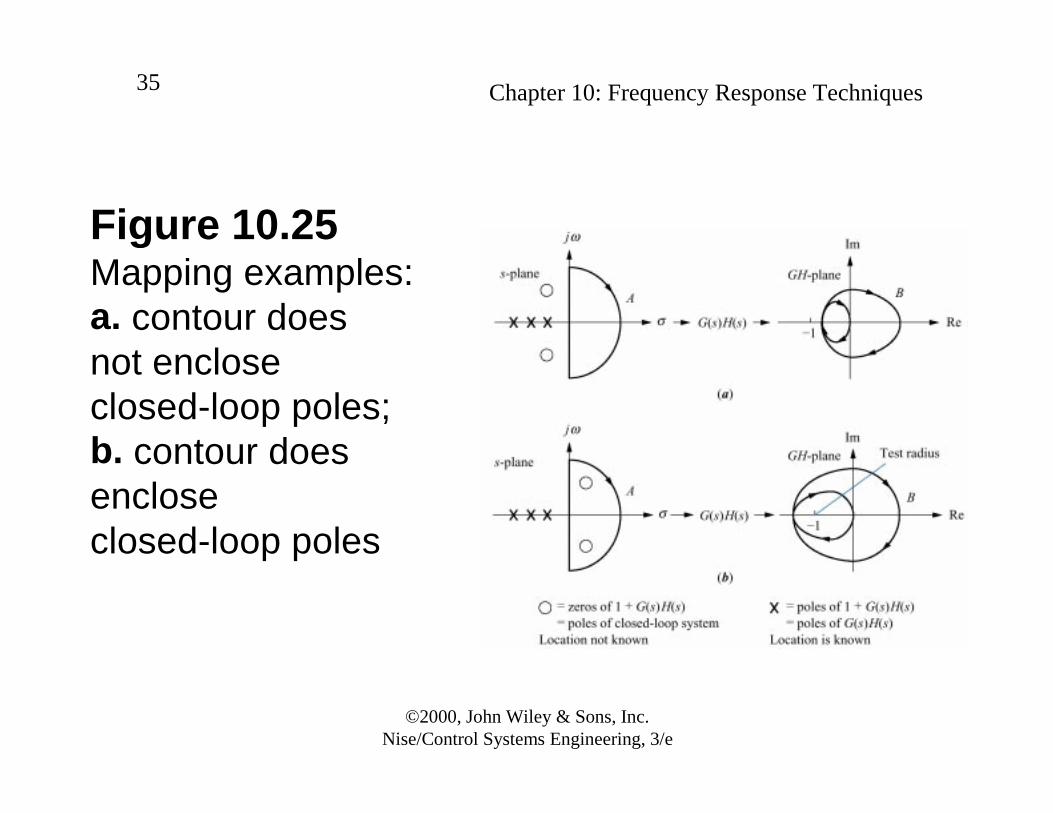
Chapter 10: Frequency Response Techniques35
Figure 10.25Mapping examples:a. contour doesnot enclose closed-loop poles;b. contour doesenclose closed-loop poles

©2000, John Wiley & Sons, Inc.Nise/Control Systems Engineering, 3/e
Chapter 10: Frequency Response Techniques36
Figure 10.26a. Turbine andgenerator;b. block diagram of speed control system forExample 10.4

©2000, John Wiley & Sons, Inc.Nise/Control Systems Engineering, 3/e
Chapter 10: Frequency Response Techniques37
Figure 10.27Vector evaluation ofthe Nyquist diagramfor Example 10.4:a. vectors on contour at low frequency;b. vectors on contour around infinity;c. Nyquist diagram

©2000, John Wiley & Sons, Inc.Nise/Control Systems Engineering, 3/e
Chapter 10: Frequency Response Techniques38
Figure 10.28Detouring around open-loop poles:a. poles on contour;b. detour right;c. detour left
©2000, John Wiley & Sons, Inc.Nise/Control Systems Engineering, 3/e
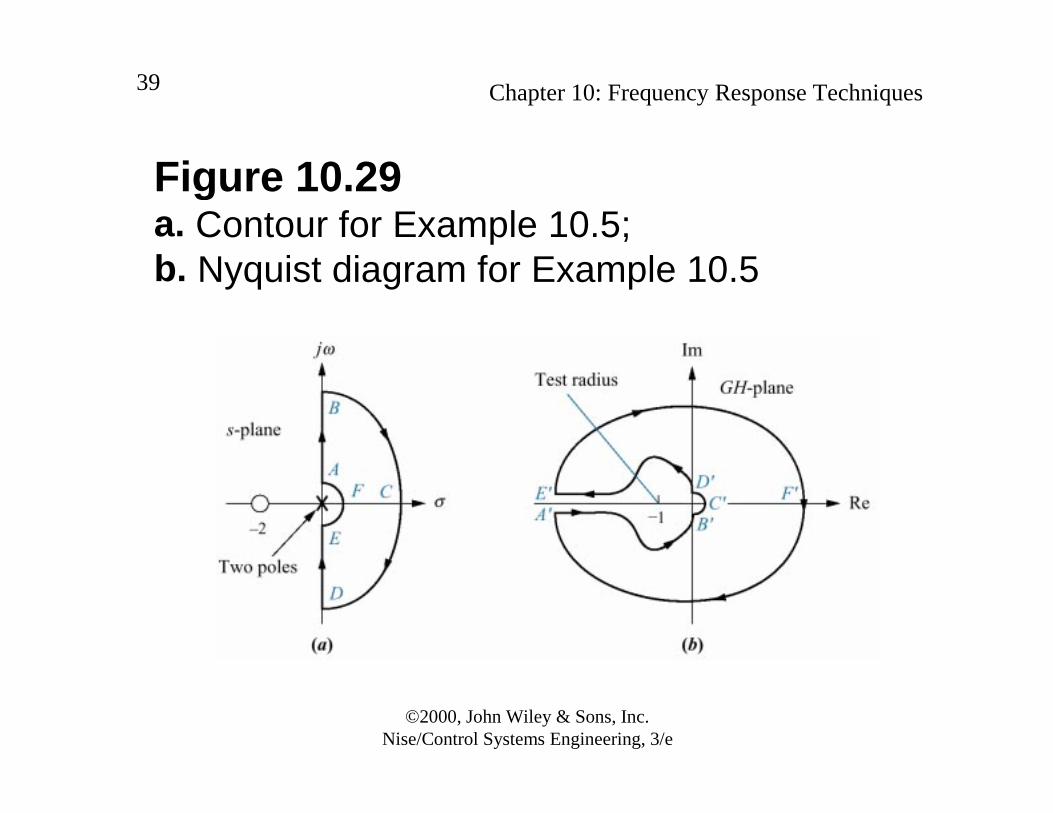
Chapter 10: Frequency Response Techniques39
Figure 10.29a. Contour for Example 10.5;b. Nyquist diagram for Example 10.5
©2000, John Wiley & Sons, Inc.Nise/Control Systems Engineering, 3/e
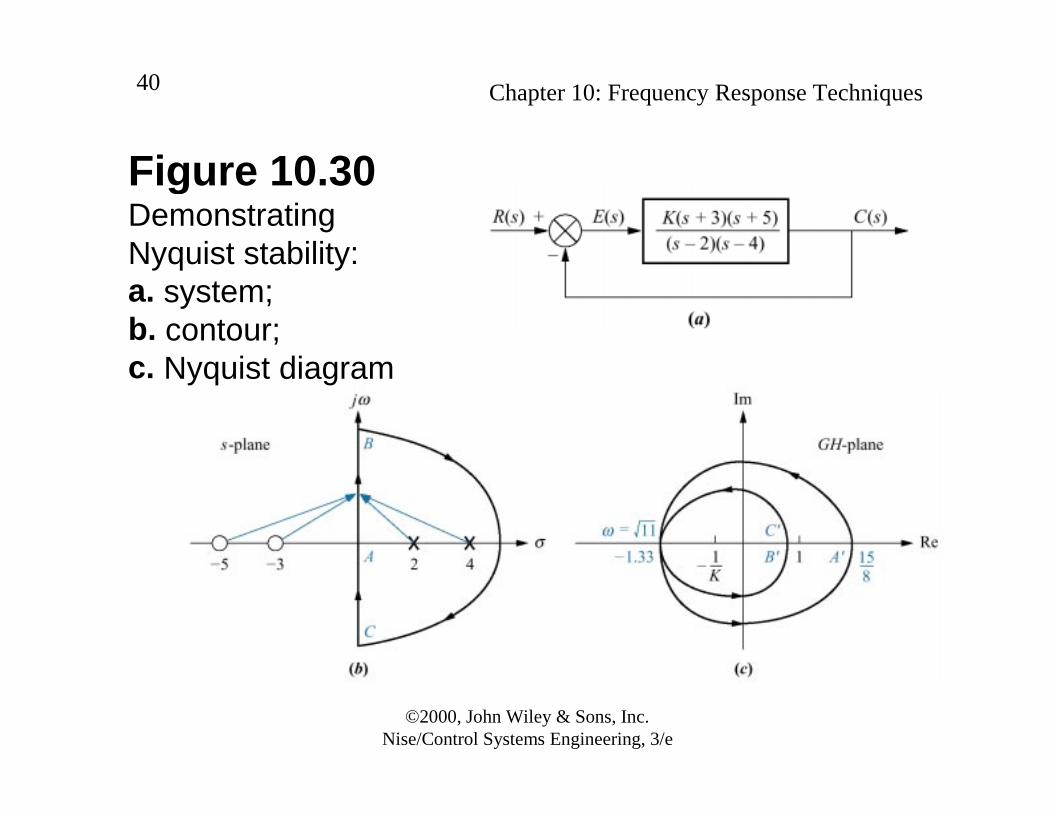
Chapter 10: Frequency Response Techniques40
Figure 10.30DemonstratingNyquist stability:a. system;b. contour;c. Nyquist diagram

©2000, John Wiley & Sons, Inc.Nise/Control Systems Engineering, 3/e
Chapter 10: Frequency Response Techniques41
Figure 10.31a. Contour for Example 10.6;b. Nyquist diagram

©2000, John Wiley & Sons, Inc.Nise/Control Systems Engineering, 3/e
Chapter 10: Frequency Response Techniques42
Figure 10.32a. Contour and root locus of system thatis stable for small gain and unstable for large gain;b. Nyquist diagram
©2000, John Wiley & Sons, Inc.Nise/Control Systems Engineering, 3/e
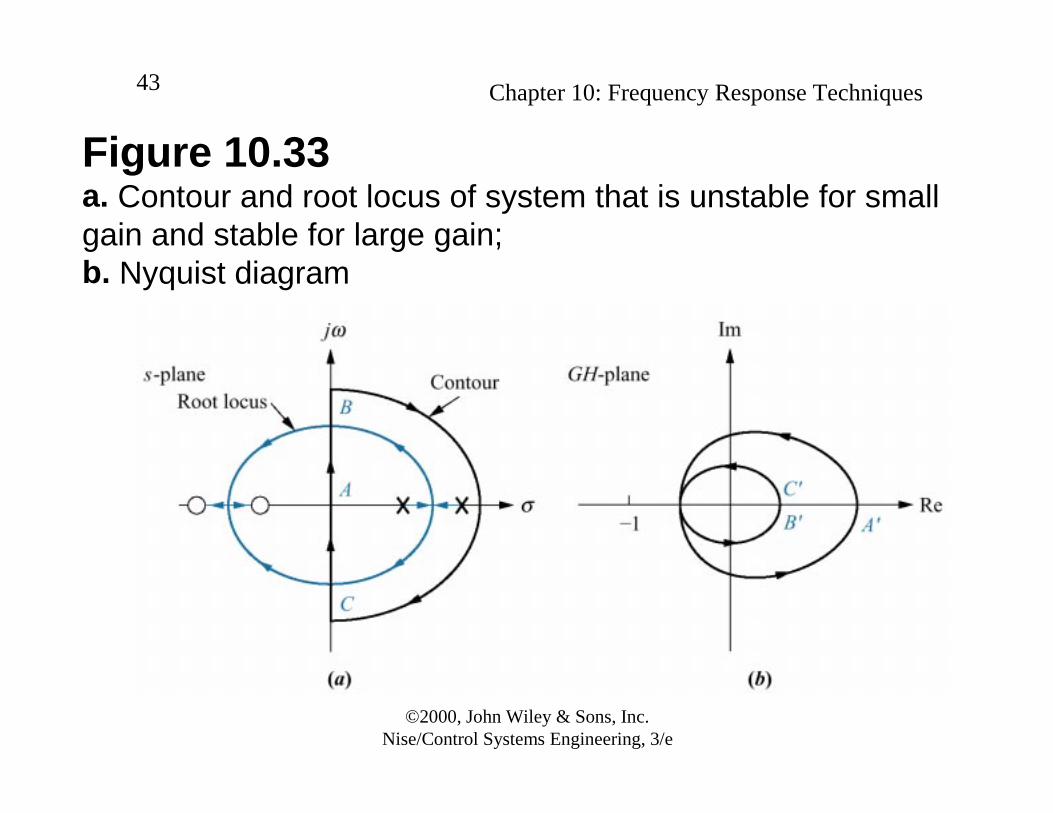
Chapter 10: Frequency Response Techniques43
Figure 10.33a. Contour and root locus of system that is unstable for small gain and stable for large gain;b. Nyquist diagram

©2000, John Wiley & Sons, Inc.Nise/Control Systems Engineering, 3/e
Chapter 10: Frequency Response Techniques44
Figure 10.34a. Portion of contour to be mapped for Example 10.7;b. Nyquist diagram of mapping of positive imaginary axis
©2000, John Wiley & Sons, Inc.Nise/Control Systems Engineering, 3/e
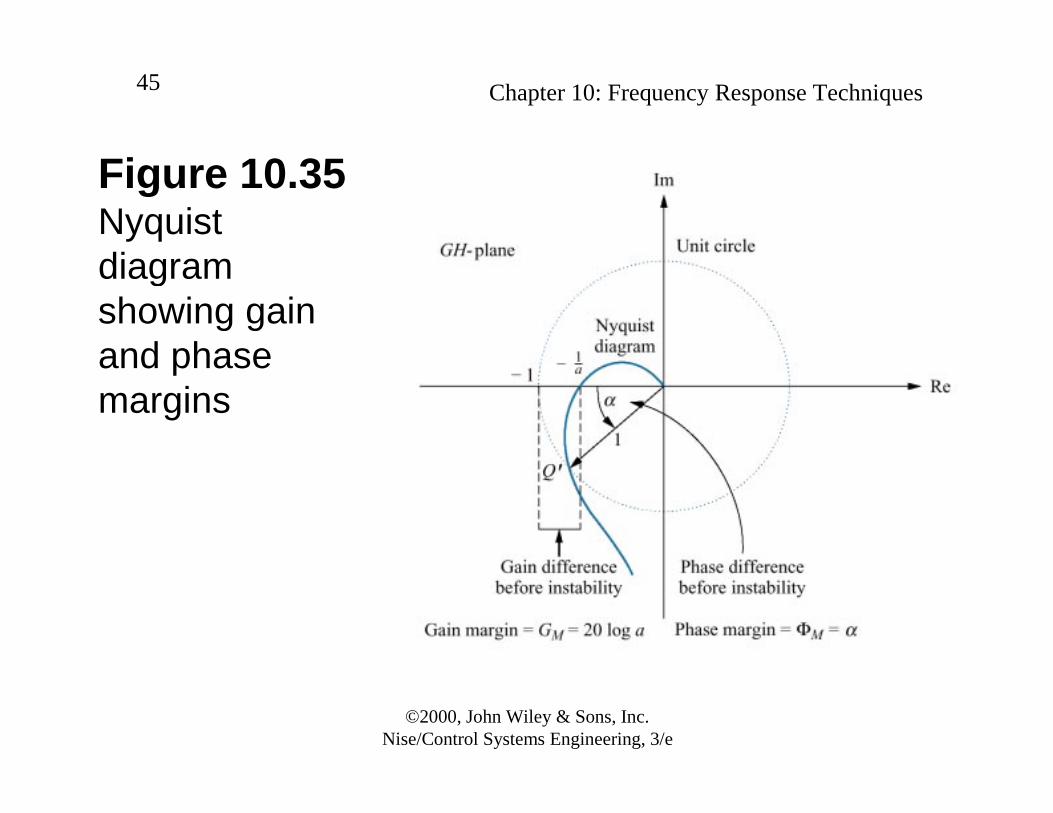
Chapter 10: Frequency Response Techniques45
Figure 10.35Nyquistdiagramshowing gainand phasemargins
©2000, John Wiley & Sons, Inc.Nise/Control Systems Engineering, 3/e
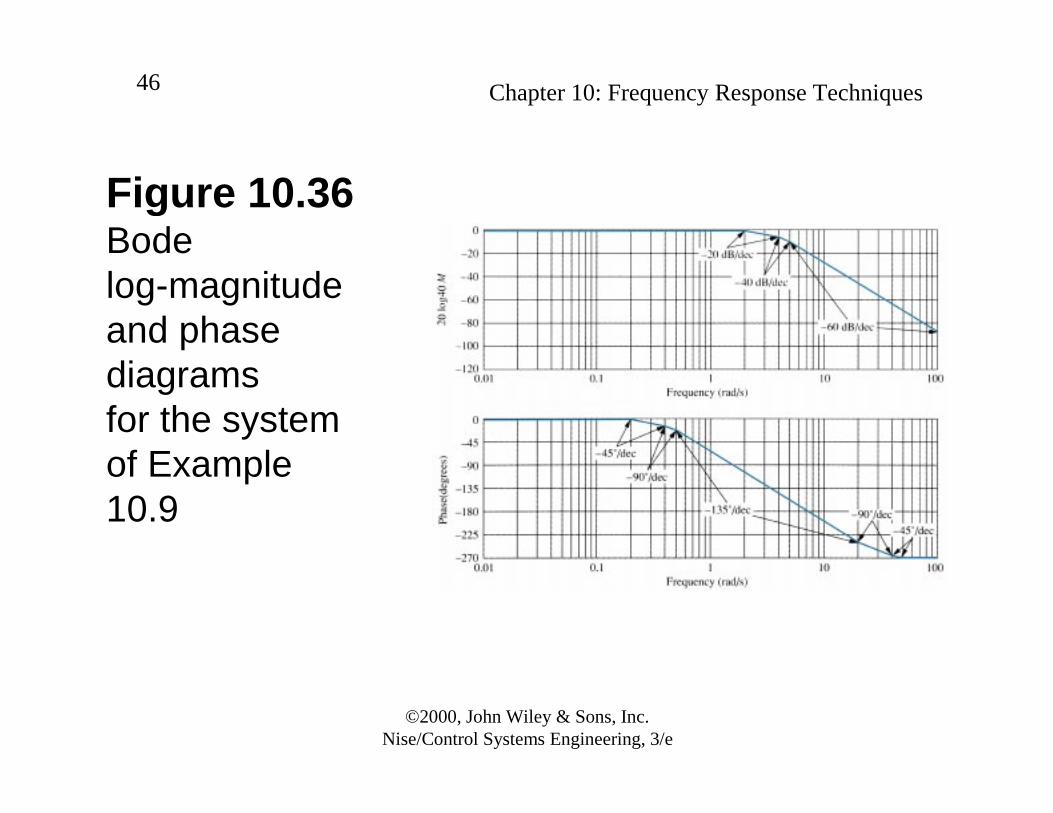
Chapter 10: Frequency Response Techniques46
Figure 10.36Bodelog-magnitudeand phase diagramsfor the system of Example 10.9

©2000, John Wiley & Sons, Inc.Nise/Control Systems Engineering, 3/e
Chapter 10: Frequency Response Techniques47
Figure 10.37Gain and phasemargins on the Bodediagrams
©2000, John Wiley & Sons, Inc.Nise/Control Systems Engineering, 3/e
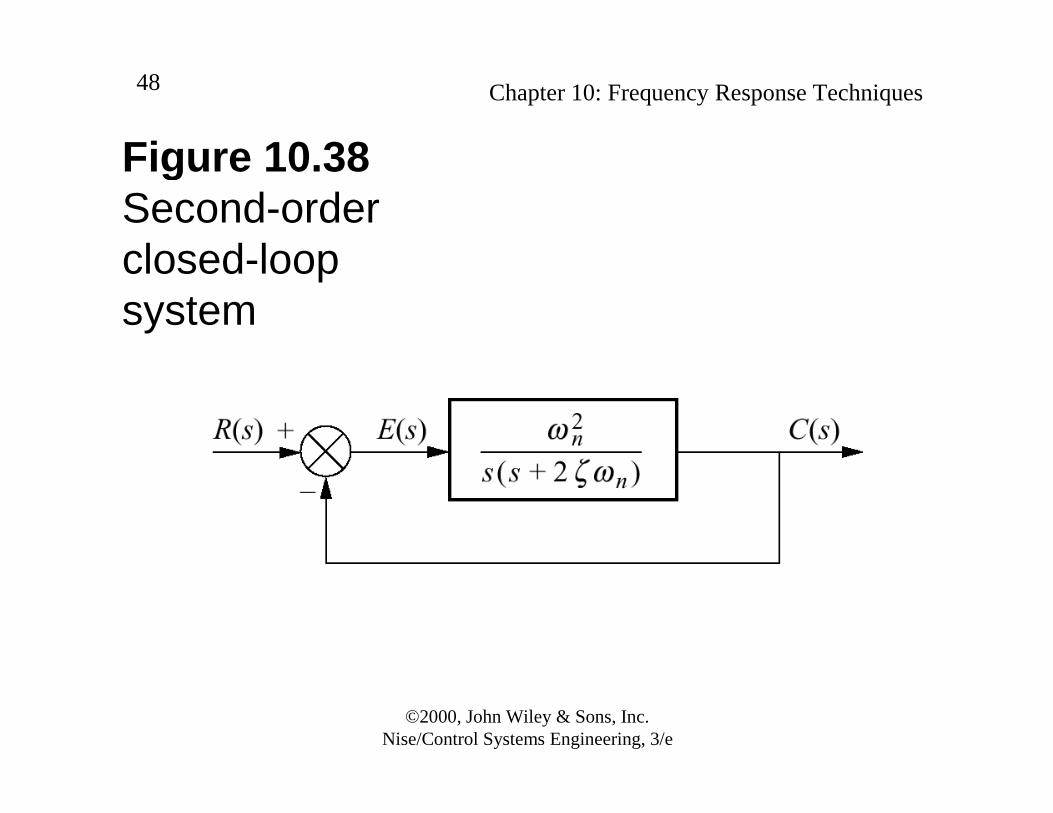
Chapter 10: Frequency Response Techniques48
Figure 10.38Second-order closed-loopsystem

©2000, John Wiley & Sons, Inc.Nise/Control Systems Engineering, 3/e
Chapter 10: Frequency Response Techniques49
Figure 10.39Representative log-magnitude plot ofEq. (10.51)

©2000, John Wiley & Sons, Inc.Nise/Control Systems Engineering, 3/e
Chapter 10: Frequency Response Techniques50
Figure 10.40Closed-loop frequency percentovershoot for a two-pole system
©2000, John Wiley & Sons, Inc.Nise/Control Systems Engineering, 3/e
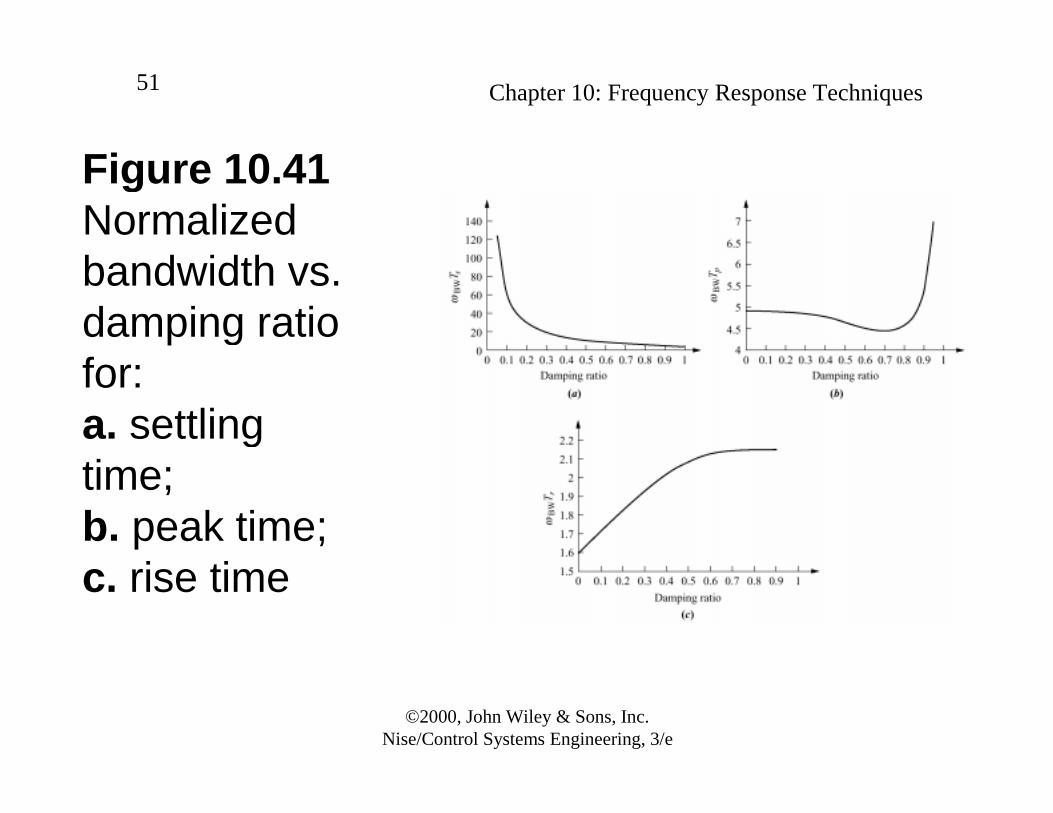
Chapter 10: Frequency Response Techniques51
Figure 10.41Normalized bandwidth vs. damping ratiofor:a. settling time;b. peak time;c. rise time
©2000, John Wiley & Sons, Inc.Nise/Control Systems Engineering, 3/e
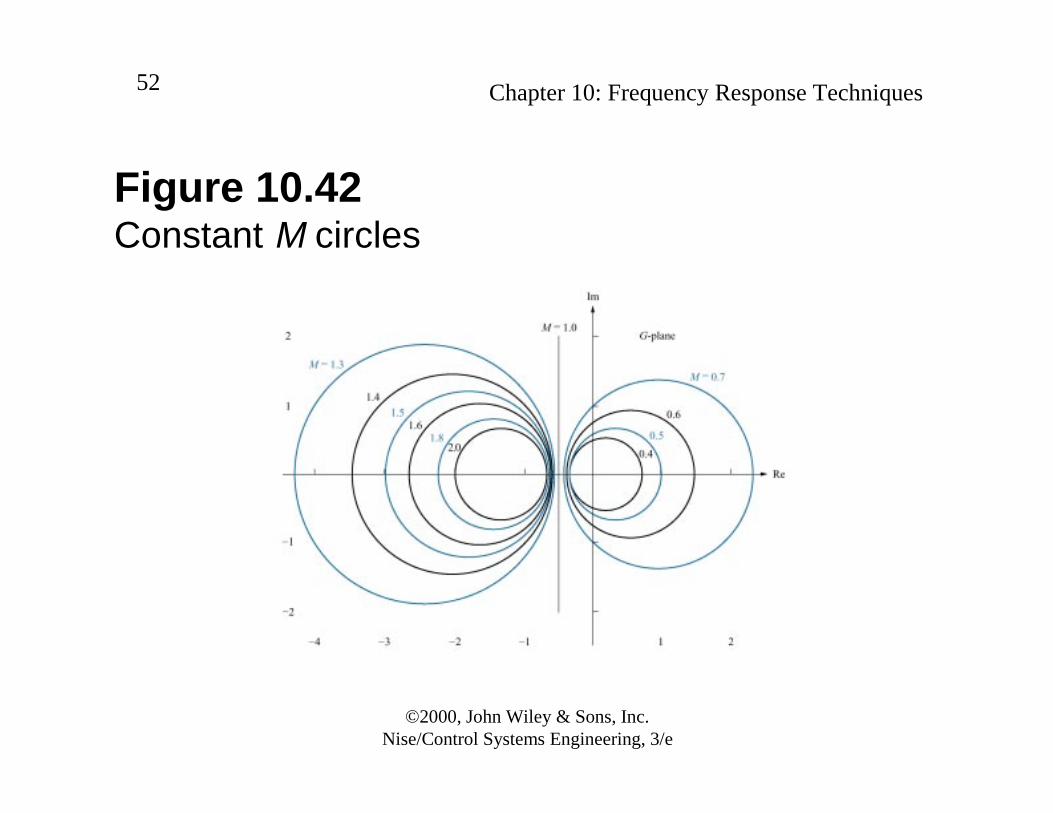
Chapter 10: Frequency Response Techniques52
Figure 10.42Constant M circles

©2000, John Wiley & Sons, Inc.Nise/Control Systems Engineering, 3/e
Chapter 10: Frequency Response Techniques53
Figure 10.43Constant N circles
©2000, John Wiley & Sons, Inc.Nise/Control Systems Engineering, 3/e
Chapter 10: Frequency Response Techniques54
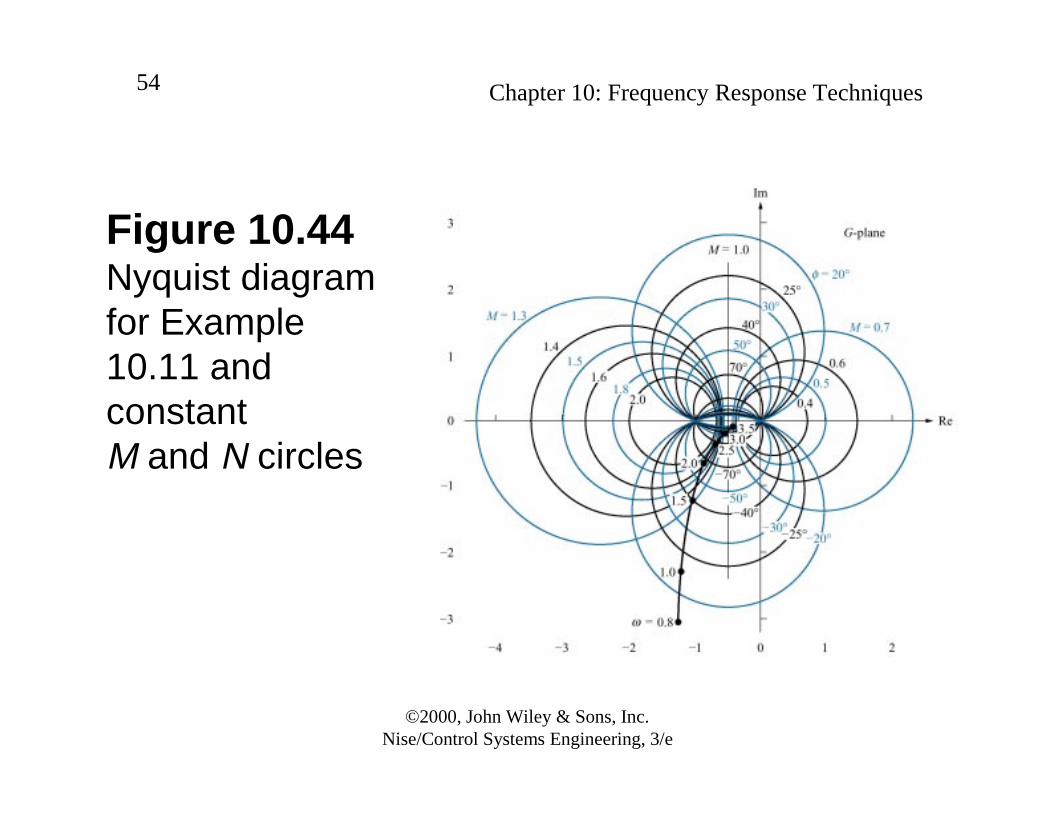
Figure 10.44Nyquist diagramfor Example 10.11 and constant M and N circles

©2000, John Wiley & Sons, Inc.Nise/Control Systems Engineering, 3/e
Chapter 10: Frequency Response Techniques55
Figure 10.45Closed-loopfrequency responsefor Example 10.11

©2000, John Wiley & Sons, Inc.Nise/Control Systems Engineering, 3/e
Chapter 10: Frequency Response Techniques56
Figure 10.46Nichols chart
©2000, John Wiley & Sons, Inc.Nise/Control Systems Engineering, 3/e
Chapter 10: Frequency Response Techniques57
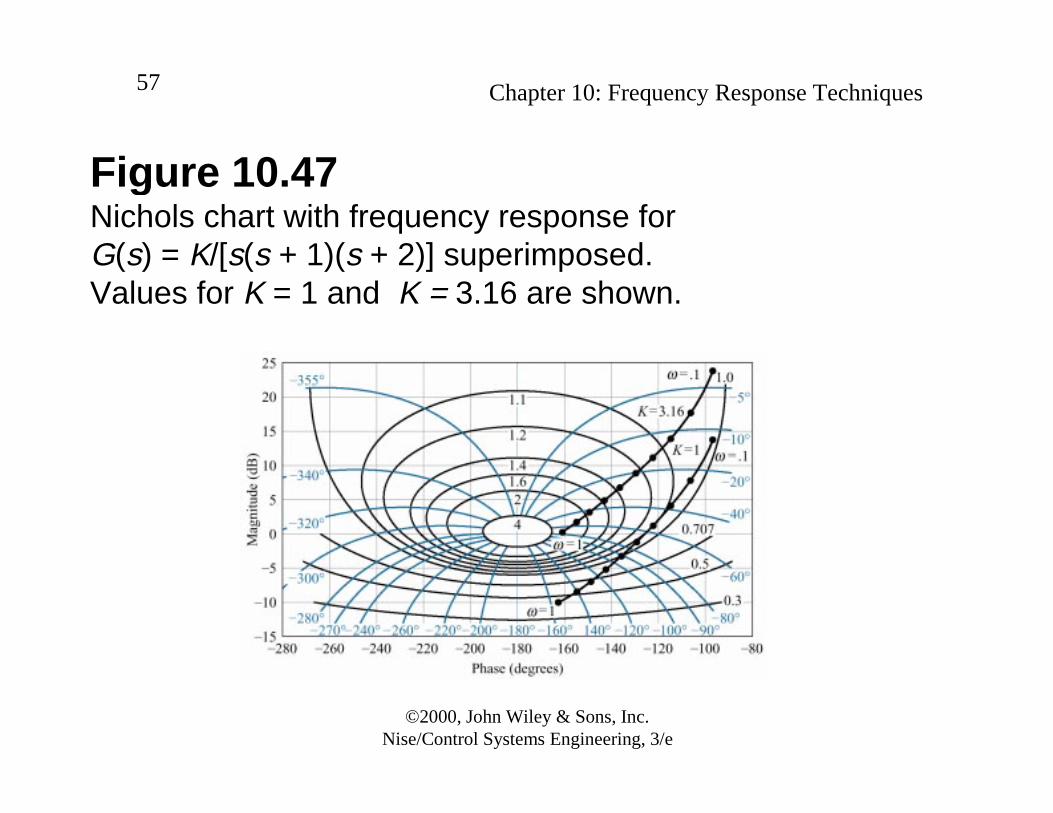
Figure 10.47Nichols chart with frequency response forG(s) = K/[s(s + 1)(s + 2)] superimposed. Values for K = 1 and K = 3.16 are shown.
©2000, John Wiley & Sons, Inc.Nise/Control Systems Engineering, 3/e
Chapter 10: Frequency Response Techniques58
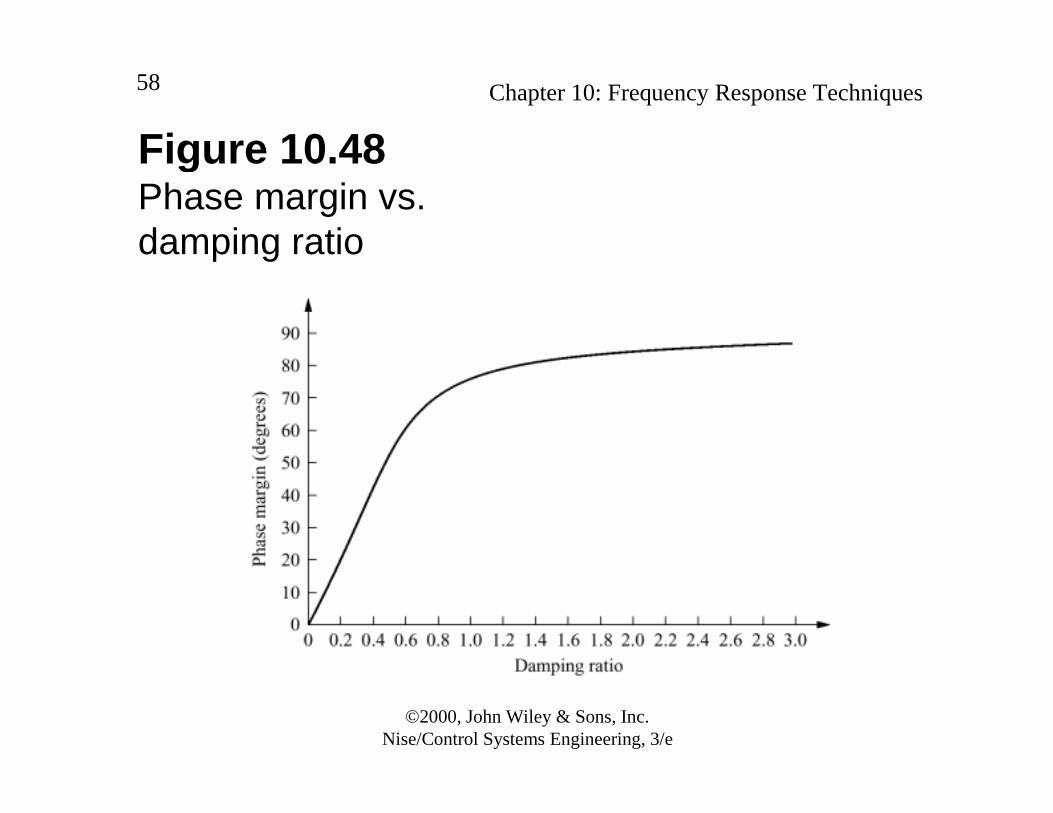
Figure 10.48Phase margin vs.damping ratio

©2000, John Wiley & Sons, Inc.Nise/Control Systems Engineering, 3/e
Chapter 10: Frequency Response Techniques59
Figure 10.49Open-loop gain vs. open-loop phase angle for –3 dB closed-loop gain
©2000, John Wiley & Sons, Inc.Nise/Control Systems Engineering, 3/e
Chapter 10: Frequency Response Techniques60
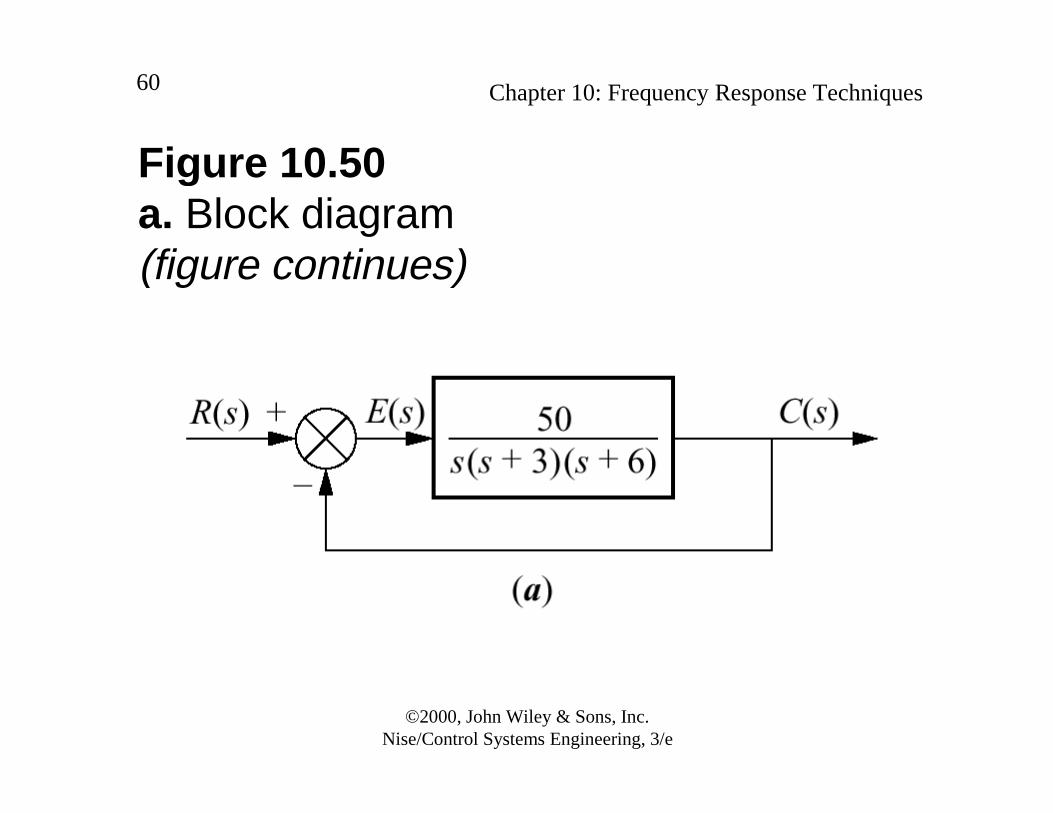
Figure 10.50a. Block diagram(figure continues)