changes in snowmelt runoff timing in western north america
TRANSCRIPT
CHANGES IN SNOWMELT RUNOFF TIMING
IN WESTERN NORTH AMERICA UNDER A ‘BUSINESS AS USUAL’
CLIMATE CHANGE SCENARIO
IRIS T. STEWART 1, DANIEL R. CAYAN 1, 2 and MICHAEL D. DETTINGER 2, 1
1Scripps Institution of Oceanography, 9500 Gilman Drive, La Jolla, CA 92093-0224, U.S.A.
E-mail: [email protected]. Geological Survey, La Jolla, California, U.S.A.
Abstract. Spring snowmelt is the most important contribution of many rivers in western North
America. If climate changes, this contribution may change. A shift in the timing of springtime
snowmelt towards earlier in the year already is observed during 1948–2000 in many western rivers.
Streamflow timing changes for the 1995–2099 period are projected using regression relations be-
tween observed streamflow-timing responses in each river, measured by the temporal centroid of
streamflow (CT) each year, and local temperature (TI) and precipitation (PI) indices. Under 21st
century warming trends predicted by the Parallel Climate Model (PCM) under business-as-usual
greenhouse-gas emissions, streamflow timing trends across much of western North America suggest
even earlier springtime snowmelt than observed to date. Projected CT changes are consistent with
observed rates and directions of change during the past five decades, and are strongest in the Pacific
Northwest, Sierra Nevada, and Rocky Mountains, where many rivers eventually run 30–40 days
earlier. The modest PI changes projected by PCM yield minimal CT changes. The responses of CT to
the simultaneous effects of projected TI and PI trends are dominated by the TI changes. Regression-
based CT projections agree with those from physically-based simulations of rivers in the Pacific
Northwest and Sierra Nevada.
1. Introduction
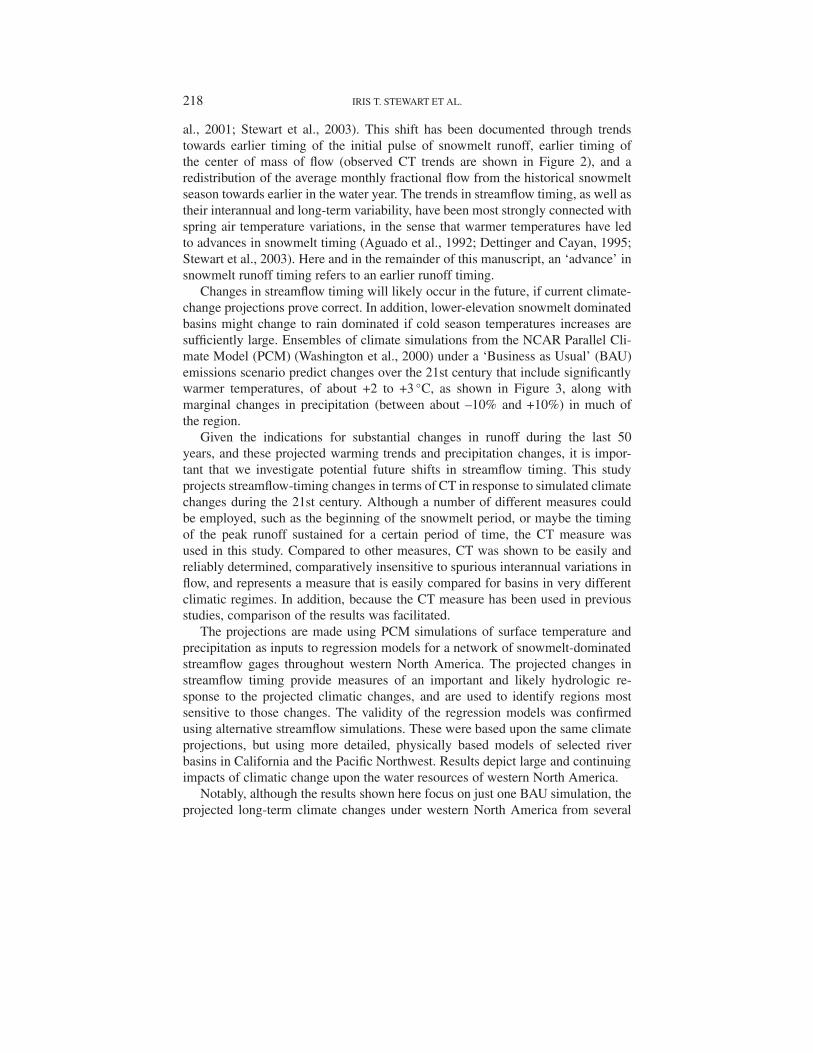
For snowmelt dominated rivers in the North American West, spring and summer
runoff is the largest contribution to annual flow, often comprising 50–80% of the
total, as shown in Figure 1a. The timing of this snowmelt discharge, as indicated
by the timing of the center of mass of flow, or ‘center time’ (CT; see Section 3)
measure, ranges from as early as February in some of the rivers along the Pacific
coast to as late as June for rivers in the Rocky Mountains and in parts of Alaska. An
average CT for each gage for the 1951–1980 period is shown in Figure 1b. An ear-
lier timing of snowmelt runoff poses difficulties for water supply management and
ecosystem health, and also provides seasonally and spatially integrated indications
of climate change impacts in the river basins of the region.
In this context it is important, that since the late 1940s a shift in the timing of
snowmelt runoff towards earlier in the water year (October–September) has been
observed in many rivers of western North America (Roos, 1987, 1991; Aguado
et al., 1992; Wahl, 1992; Pupacko, 1993; Dettinger and Cayan, 1995; Cayan et
Climatic Change 62: 217–232, 2004.
© 2004 Kluwer Academic Publishers. Printed in the Netherlands.
218 IRIS T. STEWART ET AL.
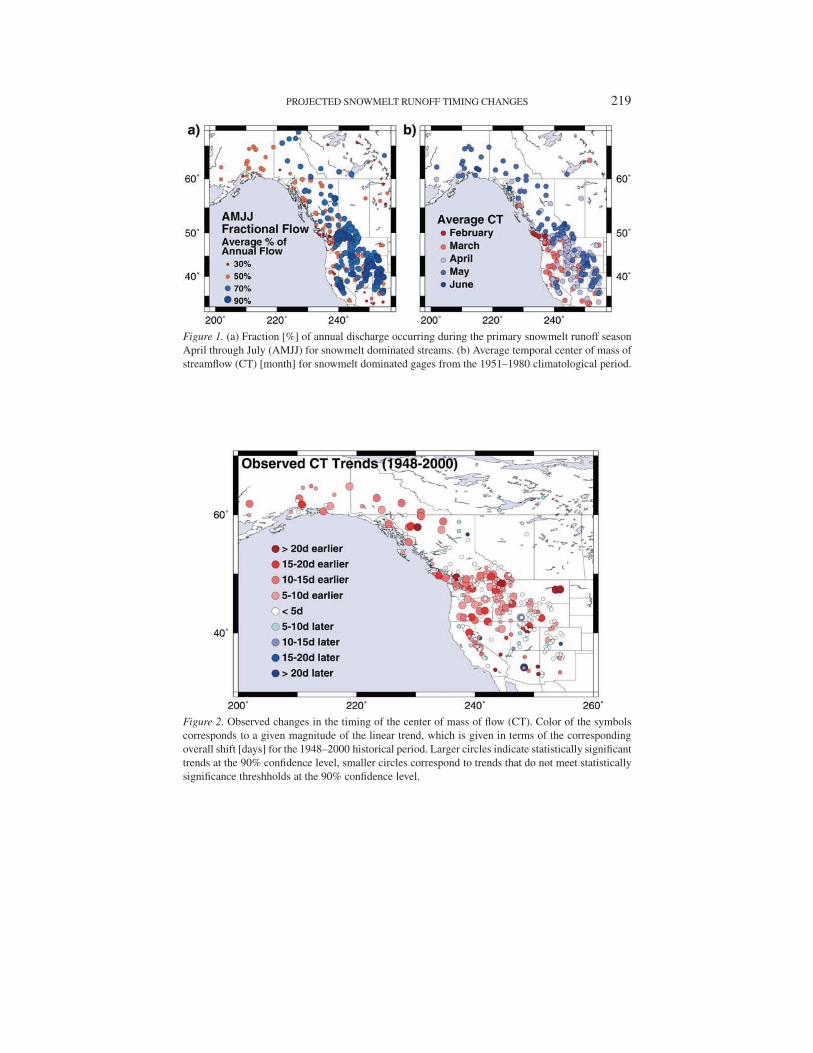
al., 2001; Stewart et al., 2003). This shift has been documented through trends
towards earlier timing of the initial pulse of snowmelt runoff, earlier timing of
the center of mass of flow (observed CT trends are shown in Figure 2), and a
redistribution of the average monthly fractional flow from the historical snowmelt
season towards earlier in the water year. The trends in streamflow timing, as well as
their interannual and long-term variability, have been most strongly connected with
spring air temperature variations, in the sense that warmer temperatures have led
to advances in snowmelt timing (Aguado et al., 1992; Dettinger and Cayan, 1995;
Stewart et al., 2003). Here and in the remainder of this manuscript, an ‘advance’ in
snowmelt runoff timing refers to an earlier runoff timing.
Changes in streamflow timing will likely occur in the future, if current climate-
change projections prove correct. In addition, lower-elevation snowmelt dominated
basins might change to rain dominated if cold season temperatures increases are
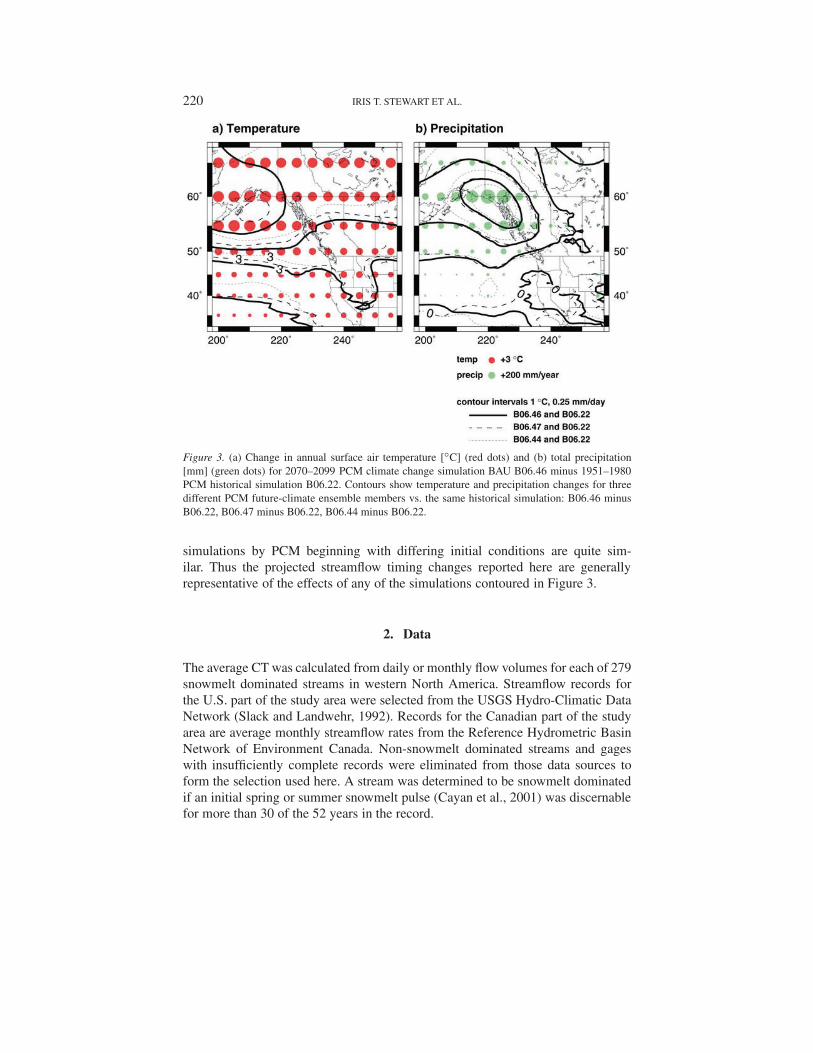
sufficiently large. Ensembles of climate simulations from the NCAR Parallel Cli-
mate Model (PCM) (Washington et al., 2000) under a ‘Business as Usual’ (BAU)
emissions scenario predict changes over the 21st century that include significantly
warmer temperatures, of about +2 to +3 ◦C, as shown in Figure 3, along with
marginal changes in precipitation (between about –10% and +10%) in much of
the region.
Given the indications for substantial changes in runoff during the last 50
years, and these projected warming trends and precipitation changes, it is impor-
tant that we investigate potential future shifts in streamflow timing. This study
projects streamflow-timing changes in terms of CT in response to simulated climate
changes during the 21st century. Although a number of different measures could
be employed, such as the beginning of the snowmelt period, or maybe the timing
of the peak runoff sustained for a certain period of time, the CT measure was
used in this study. Compared to other measures, CT was shown to be easily and
reliably determined, comparatively insensitive to spurious interannual variations in
flow, and represents a measure that is easily compared for basins in very different
climatic regimes. In addition, because the CT measure has been used in previous
studies, comparison of the results was facilitated.
The projections are made using PCM simulations of surface temperature and
precipitation as inputs to regression models for a network of snowmelt-dominated
streamflow gages throughout western North America. The projected changes in
streamflow timing provide measures of an important and likely hydrologic re-
sponse to the projected climatic changes, and are used to identify regions most
sensitive to those changes. The validity of the regression models was confirmed
using alternative streamflow simulations. These were based upon the same climate
projections, but using more detailed, physically based models of selected river
basins in California and the Pacific Northwest. Results depict large and continuing
impacts of climatic change upon the water resources of western North America.
Notably, although the results shown here focus on just one BAU simulation, the
projected long-term climate changes under western North America from several
PROJECTED SNOWMELT RUNOFF TIMING CHANGES 219
Figure 1. (a) Fraction [%] of annual discharge occurring during the primary snowmelt runoff season
April through July (AMJJ) for snowmelt dominated streams. (b) Average temporal center of mass of
streamflow (CT) [month] for snowmelt dominated gages from the 1951–1980 climatological period.
Figure 2. Observed changes in the timing of the center of mass of flow (CT). Color of the symbols
corresponds to a given magnitude of the linear trend, which is given in terms of the corresponding
overall shift [days] for the 1948–2000 historical period. Larger circles indicate statistically significant
trends at the 90% confidence level, smaller circles correspond to trends that do not meet statistically
significance threshholds at the 90% confidence level.
220 IRIS T. STEWART ET AL.
Figure 3. (a) Change in annual surface air temperature [◦C] (red dots) and (b) total precipitation
[mm] (green dots) for 2070–2099 PCM climate change simulation BAU B06.46 minus 1951–1980
PCM historical simulation B06.22. Contours show temperature and precipitation changes for three
different PCM future-climate ensemble members vs. the same historical simulation: B06.46 minus
B06.22, B06.47 minus B06.22, B06.44 minus B06.22.
simulations by PCM beginning with differing initial conditions are quite sim-
ilar. Thus the projected streamflow timing changes reported here are generally
representative of the effects of any of the simulations contoured in Figure 3.
2. Data
The average CT was calculated from daily or monthly flow volumes for each of 279
snowmelt dominated streams in western North America. Streamflow records for
the U.S. part of the study area were selected from the USGS Hydro-Climatic Data
Network (Slack and Landwehr, 1992). Records for the Canadian part of the study
area are average monthly streamflow rates from the Reference Hydrometric Basin
Network of Environment Canada. Non-snowmelt dominated streams and gages
with insufficiently complete records were eliminated from those data sources to
form the selection used here. A stream was determined to be snowmelt dominated
if an initial spring or summer snowmelt pulse (Cayan et al., 2001) was discernable
for more than 30 of the 52 years in the record.
PROJECTED SNOWMELT RUNOFF TIMING CHANGES 221
These analyses used the time series of gridded average monthly temperature
and precipitation anomalies from the NOAA Climate Diagnostic Center (Eischeid
et al., 1995). Temperature [◦C] and precipitation [mm] anomalies were computed
with respect to the 1951–1980 climatological period and for the center of each 5◦
grid cell. Simulated daily temperatures and precipitation rates from a PCM simu-
lation of global climate variations in response to BAU greenhouse-gas and aerosol
emissions (described by Dai et al., 2001) were compiled into time series of monthly
mean air temperatures and precipitation rates on a 5◦ latitude-longitude grid from
February 1995 through November 2099. The calculated temperature and precipita-
tion anomalies, taken from a climatology from a PCM historical simulation, then
were used to project changes in CT.
To assess whether the (linear) statistical models of CT changes applied here
were adequate to project the levels of change indicated for the 21st century, the
statistical models were compared to detailed, physically based hydrologic models
under the same climatic conditions for several rivers where such detailed models
and simulations were available.
Flows in the Snake River, Ice Harbor Reservoir gage and in the Columbia River
at the Dalles in the Pacific Northwest were simulated by the large-scale Variable
Infiltration Capacity (VIC 4.0.3) hydrologic modeling system (Maurer et al., 2002;
Payne et al., 2004, this volume) running at 1/4◦ resolution. Input consisted of daily
precipitation and temperature series, based on historical meteorological observa-
tions conditioned by PCM BAU simulation B06.46 projected climate trends (Wood
et al., 2004, this volume).
In addition, simulated flows in the Merced, Carson, and American Rivers of the
Sierra Nevada were compared to the regression model output. Responses of water
and energy balances, and streamflow from the basins, to the BAU PCM simulation,
were simulated for the three basins using the USGS Precipitation-Runoff Modeling
System PRMS (Leavesley et al., 1983; Dettinger et al., 2004, this volume). The
physically-based models for the California gages were driven with daily precip-
itation and (minimum and maximum) temperatures from the PCM BAU B06.46
simulation, adjusted for elevation effects. Series with the same historical-period
statistics as those observed at selected weather stationswere obtained using an
algorithm described by Dettinger et al. (2004, this volume). The precipitation and
temperatures at these weather stations provide the inputs for the calibrated ver-
sions of watershed models of the Merced River above Happy Isles and the East
Fork of the Carson River. Application of the adjustments described above to BAU
B06.46 simulated climate change outputs was used to simulate site-specific climate
changes in these two watersheds.
222 IRIS T. STEWART ET AL.
3. Methods
Projections of future CT changes across western North America were obtained
in two stages. First, linear regression coefficients relating streamflow timing to
climate indices were estimated from historical data. Second, changes in streamflow
timing were projected for the 1995–2099 period by applying the regression models
to temperature and precipitation anomalies from the PCM BAU simulation.
The CT measure of runoff timing used here is the flow-weighted timing, or
‘center of mass’ of streamflow, calculated as
CT = 6(tiqi)/6qi , (1)
where ti is time in months (or days) from the beginning of the water year (Oc-
tober 1) and qi is the corresponding streamflow for month i (or water year day,
i). Therefore CT is a date given in days or months. The time series of historical
annual CT, as well as its average, were determined for each gage for a 1950–1981
climatological period.
A gage’s CT is a reflection of the climatic conditions that govern its snowmelt
runoff timing, to the extent that it is snowmelt dominated. Precipitation influences
on flow timing were characterized by a precipitation index (PI), defined as the
October–April average precipitation anomaly. This definition of PI measures the
‘bulk effect’ of the water year precipitation on streamflow timing. Historically,
at many snowmelt-driven watersheds, variations in the cumulative winter season
precipitation produce an effect on the timing of runoff that, for interannual fluc-
tuations, is of the same order of importance as spring temperature anomalies. The
PI measure, of course, does not capture fluctuations in the seasonal timing of pre-
cipitation, which indeed have a strong influence upon streamflow timing (Aguado
et al., 1992). But our analysis of the PCM BAU ensembles yields no indication
of changes in the seasonality of precipitation over the 21st century. Hence, for
the present analysis, we seek to understand whether overall changes in precipita-
tion, not fluctuations of its occurrence within the season, will influence streamflow
timing.
Similarly, a temperature index (TI) time series was calculated for each gage.
The TI measure is an average temperature anomaly over a gage-specific four-month
interval. That interval included the average month of CT for a given gage, the two
months prior, and the month after the average CT. TI therefore is a measure of air
temperature variations during the critical season of snowmelt runoff that is specific
to each gage.
The relationship between historical CT anomalies and the TI and PI anomalies
was estimated by fitting three linear-regression models:
CTTI = a1TI + εTI
CTPI = b1TI + εPI
CTTIPI = a2TI + b2PI + εTIPI .
(2)
PROJECTED SNOWMELT RUNOFF TIMING CHANGES 223
Here CTTI, CTPI, and CTTIPI refer to projected CT based on TI, PI, and TI and
PI respectively. These separate measures are introduced to quantify the effects of
temperature only, precipitation only, and the combined effects of temperature and
precipitation on streamflow timing. The subscripts a and b denote the regression
coefficients with respect to TI and PI, the subscripts 1 and 2 refer to simple and
multiple regression, and the εs represent the residual CT variations not linearly
related to PI or TI respectively. Note that in these experiments only the runoff
timing, and not the runoff volume is modeled. To project changes in CT, simulated
temperature and precipitation values for the 1995–2099 period were extracted from
the PCM B06.46 run. The temperatures and precipitations were analyzed onto a 5◦
latitude-longitude grid, and then interpolated to each gage, from which the TI and
PI values were derived. The changes in CT, compared to the 1951–1980 climatol-
ogy, were projected by driving each of the three regression models for each gage
with the simulated TI and PI anomalies. Anomalies of TI and PI were calculated
using mean values over 1951–1980 from the ACPI historical simulation B06.22.
Thus, three projections of anomalous CT change were obtained; one reflecting only
the TI changes, one reflecting only PI changes, and one reflecting the simultaneous
TI and PI changes. Subsequently, the absolute CT projections were calculated by
adding the average CT for each gage to the projected anomalous changes in CT.
Finally, projections with the statistical models were compared with projected
flows from selected physically-based models of snowmelt-driven streams in the
Pacific Northwest and in the California Sierra Nevada. This comparison allows
an assessment of whether historically based statistical models are adequate for
projecting the indicated levels of CT change.
4. Results
The timing of snowmelt runoff in rivers of western North America is not only
a function of latitude, but is also strongly dependent on the local climatic and
physiographic setting of each watershed. Thus, CT varies considerably across the
study area (Figure 1b). For example, the average CT for mid-elevation gages in
the southern and western regions is in April, whereas the average CT at higher
elevation gages and those located farther inland is in May or June. In spite of
this complex spatial variability in the CT climatology, observed year-to-year (and
longer term) variations of snowmelt-driven streamflow timing are widespread and
regionally coherent (Cayan et al., 2001).
As Figure 2 shows, a large majority of rivers in western North America have
exhibited trends toward earlier snowmelt timing during the last few decades; very
few streams have exhibited trends toward later streamflow timing. Many streams
have yielded CT advances of 10–30 days over the 1948–2000 observational period.
The greatest CT trends have occurred in the Pacific Northwest, Canada, Alaska,
and the mountain plateaus of Washington, Oregon, and western Idaho. Many of
224 IRIS T. STEWART ET AL.
these trends towards earlier flow (>30%) are statistically significant at the 90%
level, especially in the Pacific Northwest, Rocky Mountain, Canadian, and Alaskan
regions.
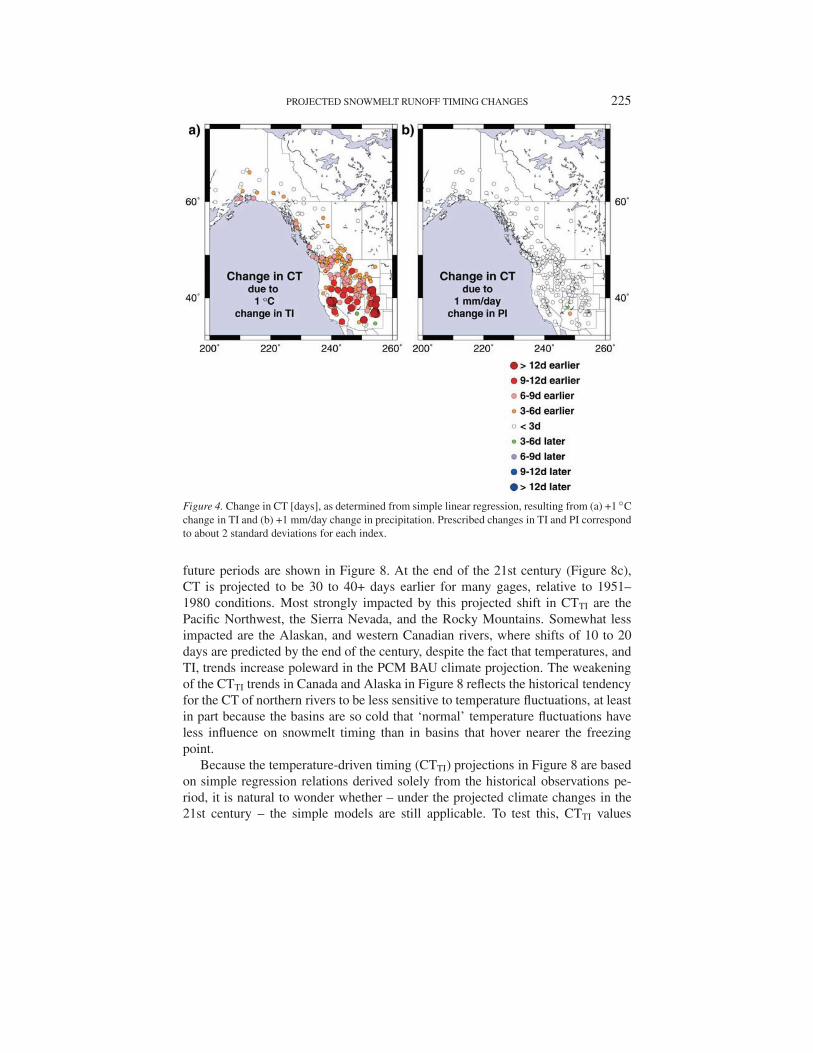
Important trends in streamflow timing will also occur under the climate changes
projected by the ACPI BAU simulations. The changes are driven by the broad scale
warming trends and the regional scale moistening (northwestern North America)
and drying (southwestern North America) shown in Figure 3. The timing of spring-
summer runoff from snowmelt dominated watersheds is most strongly dictated by
temperature and, to a lesser extent, by the volume of precipitation, as shown by the
responses to incremental changes in spring-summer temperatures (TI) and seasonal
total precipitation (PI) illustrated in Figure 4.
Thus, when CT trends are projected into the 21st century using the regression
models [2] it is clear that the warming contained in PCM would dominate over any
changes that are simulated in regional precipitation. Comparisons of the trends in
CTTI, CTPI, and CTTIPI indicate that projected CT trends are most strongly con-
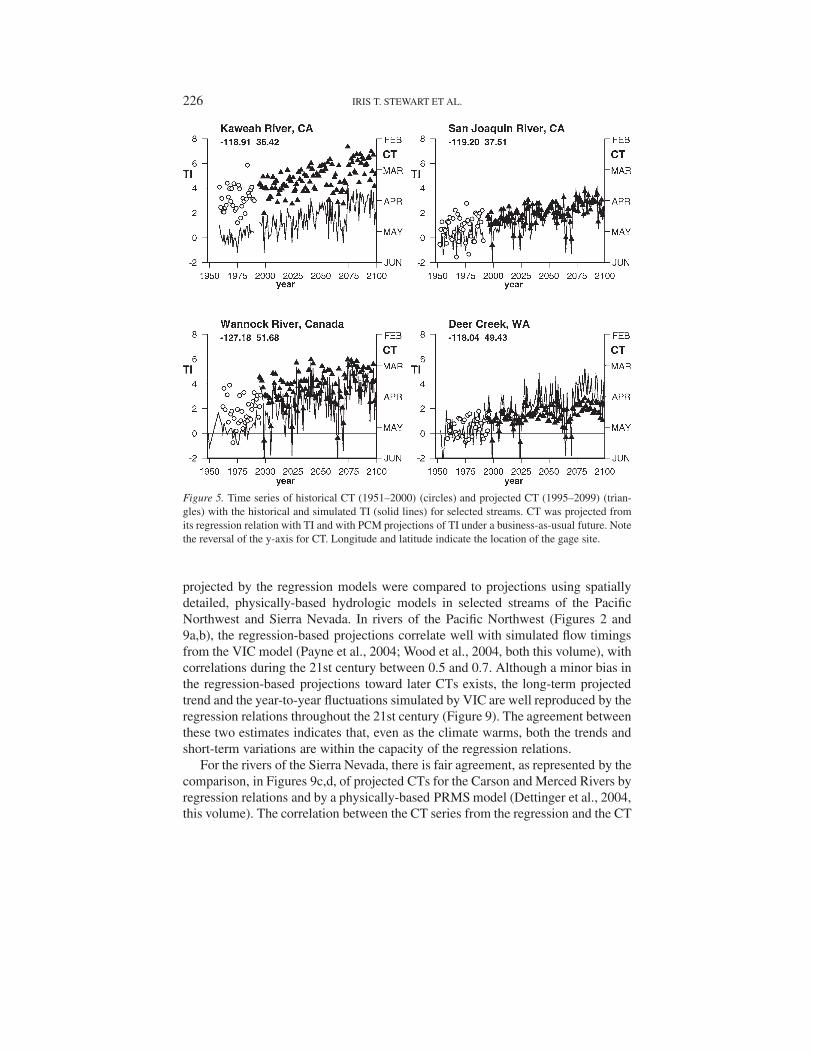
nected to the projected TI trends (e.g., Figures 5–8). Four examples of historical
(CT) and projected (CTTI) time series for basins from the more strongly impacted
regions are shown in Figure 5, along with the historical and simulated TI. Notably,
trends in CTTI towards earlier in the water year seem to transition quite smoothly
from recent observed trends (Figure 2). By contrast, the small projected changes in
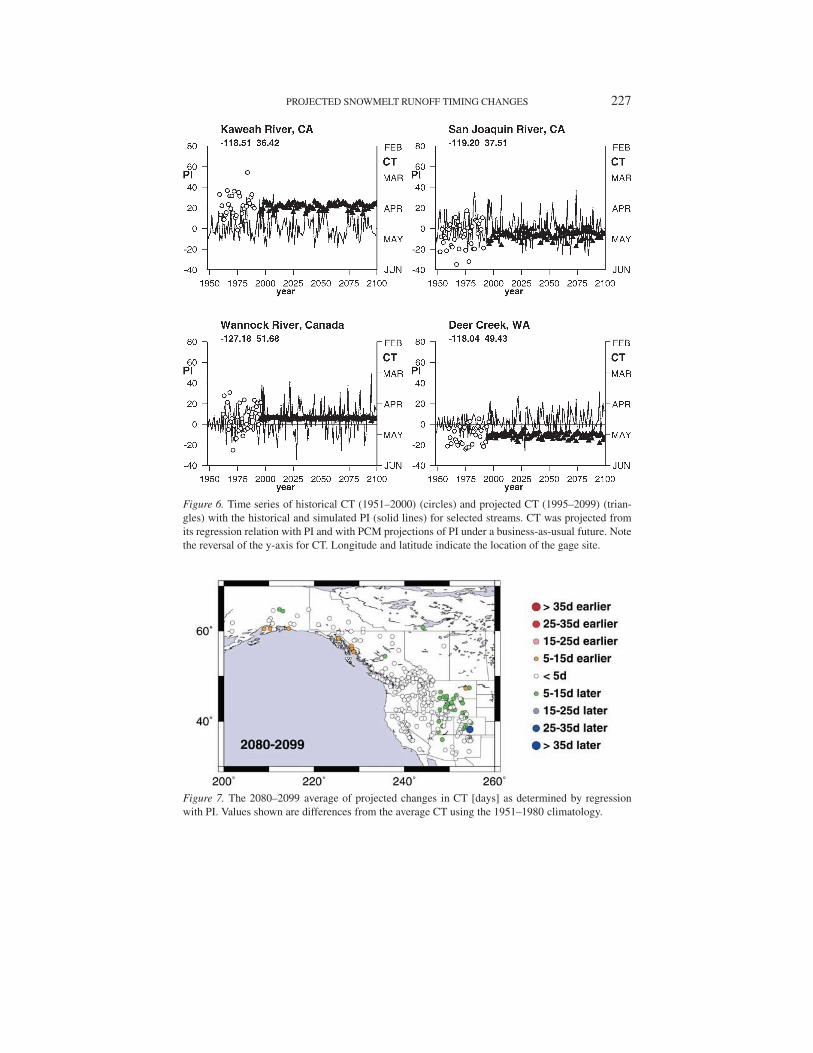
PI minimally affect CTPI timing, as shown in Figure 6 for the same four examples.
The projected TI-dependent CTTI trends (Figure 5) are larger than the PI-
dependent CTPI trends (Figure 6), because CT is much more sensitive to TI
variations than to PI variations (Figure 4). Notably, CTPI sensitivities (regression
coefficients) are such that in most regions like Central and Northern Rocky Moun-
tains and from Central Washington to Alaska, projected increases in PI yield later
runoff and would counteract some of the hastening of runoff due to projected
springtime warming trends. However, the PI influences on projected CT trends are
essentially negligible because the sensitivities of CT to PI are so small. To coun-
teract the effects of projected TI increases would require extremely large increases
in PIs much larger than those projected under the BAU scenarios. For example, the
CT sensitivities to PI in several rivers of the PNW (to be discussed later) are such
that PI would need to increase by +23 mm/day (or more than 8 m/yr) to produce
an opposing effect on CT that would balance the effect of +1 ◦C of springtime
warming.
Because the projected changes in PI contribute only small changes in CT,
the projected CTTIPI, from multiple regression, are almost entirely dominated by
changes in TI, as can be seen by comparing Figures 7 and 8. 20-yr averages of
CTTI changes (dependent on changes in TI only) in the 21st century are similar
in direction, and of equal or larger magnitude, to trends observed in the past 50
years (Figure 2). Notably, though, the magnitudes of the projected CT changes
are smaller in the north than in the south, while the observations tend to be larger
in the Pacific Northwest and smaller in the Southwest. Average changes for three
PROJECTED SNOWMELT RUNOFF TIMING CHANGES 225
Figure 4. Change in CT [days], as determined from simple linear regression, resulting from (a) +1 ◦C
change in TI and (b) +1 mm/day change in precipitation. Prescribed changes in TI and PI correspond
to about 2 standard deviations for each index.
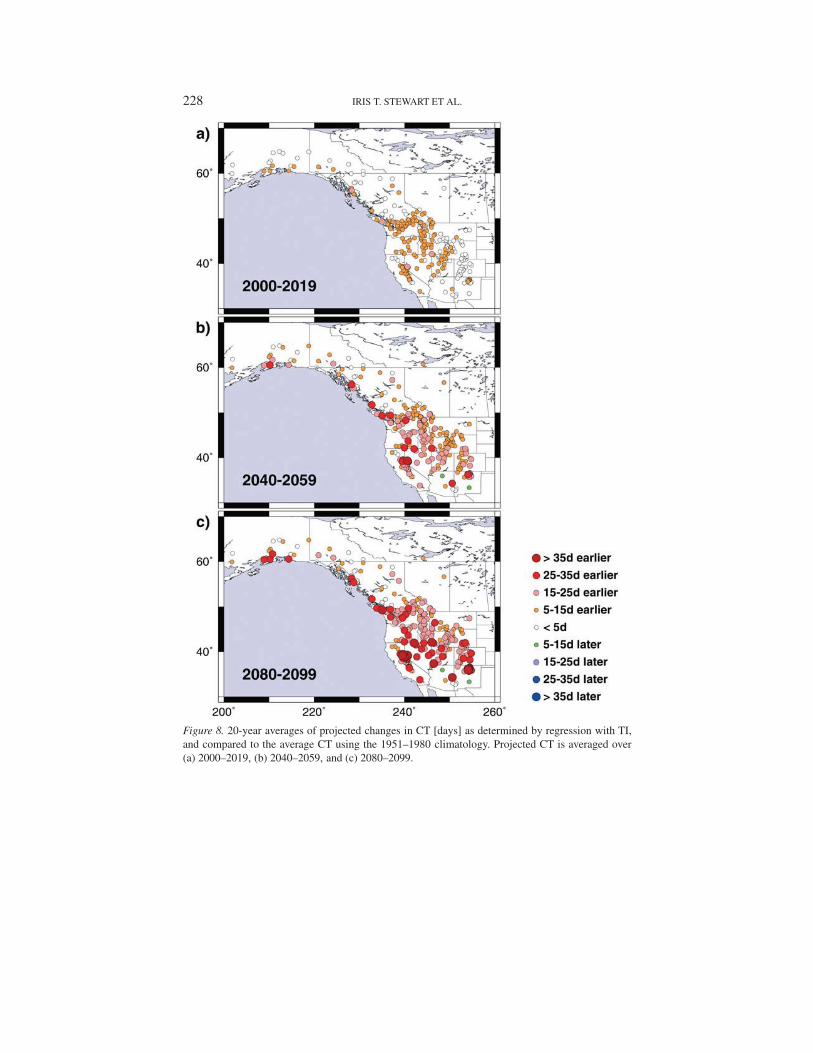
future periods are shown in Figure 8. At the end of the 21st century (Figure 8c),
CT is projected to be 30 to 40+ days earlier for many gages, relative to 1951–
1980 conditions. Most strongly impacted by this projected shift in CTTI are the
Pacific Northwest, the Sierra Nevada, and the Rocky Mountains. Somewhat less
impacted are the Alaskan, and western Canadian rivers, where shifts of 10 to 20
days are predicted by the end of the century, despite the fact that temperatures, and
TI, trends increase poleward in the PCM BAU climate projection. The weakening
of the CTTI trends in Canada and Alaska in Figure 8 reflects the historical tendency
for the CT of northern rivers to be less sensitive to temperature fluctuations, at least
in part because the basins are so cold that ‘normal’ temperature fluctuations have
less influence on snowmelt timing than in basins that hover nearer the freezing
point.
Because the temperature-driven timing (CTTI) projections in Figure 8 are based
on simple regression relations derived solely from the historical observations pe-
riod, it is natural to wonder whether – under the projected climate changes in the
21st century – the simple models are still applicable. To test this, CTTI values
226 IRIS T. STEWART ET AL.
Figure 5. Time series of historical CT (1951–2000) (circles) and projected CT (1995–2099) (trian-
gles) with the historical and simulated TI (solid lines) for selected streams. CT was projected from
its regression relation with TI and with PCM projections of TI under a business-as-usual future. Note
the reversal of the y-axis for CT. Longitude and latitude indicate the location of the gage site.
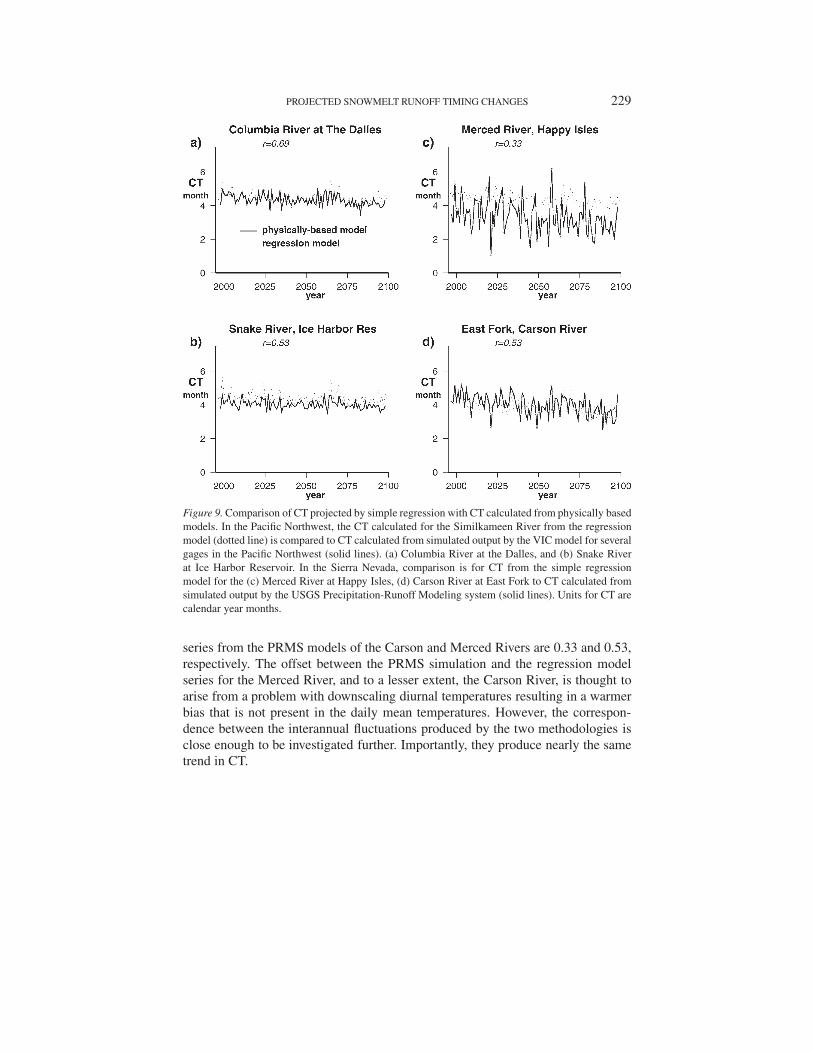
projected by the regression models were compared to projections using spatially
detailed, physically-based hydrologic models in selected streams of the Pacific
Northwest and Sierra Nevada. In rivers of the Pacific Northwest (Figures 2 and
9a,b), the regression-based projections correlate well with simulated flow timings
from the VIC model (Payne et al., 2004; Wood et al., 2004, both this volume), with
correlations during the 21st century between 0.5 and 0.7. Although a minor bias in
the regression-based projections toward later CTs exists, the long-term projected
trend and the year-to-year fluctuations simulated by VIC are well reproduced by the
regression relations throughout the 21st century (Figure 9). The agreement between
these two estimates indicates that, even as the climate warms, both the trends and
short-term variations are within the capacity of the regression relations.
For the rivers of the Sierra Nevada, there is fair agreement, as represented by the
comparison, in Figures 9c,d, of projected CTs for the Carson and Merced Rivers by
regression relations and by a physically-based PRMS model (Dettinger et al., 2004,
this volume). The correlation between the CT series from the regression and the CT
PROJECTED SNOWMELT RUNOFF TIMING CHANGES 227
Figure 6. Time series of historical CT (1951–2000) (circles) and projected CT (1995–2099) (trian-
gles) with the historical and simulated PI (solid lines) for selected streams. CT was projected from
its regression relation with PI and with PCM projections of PI under a business-as-usual future. Note
the reversal of the y-axis for CT. Longitude and latitude indicate the location of the gage site.
Figure 7. The 2080–2099 average of projected changes in CT [days] as determined by regression
with PI. Values shown are differences from the average CT using the 1951–1980 climatology.
228 IRIS T. STEWART ET AL.
Figure 8. 20-year averages of projected changes in CT [days] as determined by regression with TI,
and compared to the average CT using the 1951–1980 climatology. Projected CT is averaged over
(a) 2000–2019, (b) 2040–2059, and (c) 2080–2099.
PROJECTED SNOWMELT RUNOFF TIMING CHANGES 229
Figure 9. Comparison of CT projected by simple regression with CT calculated from physically based
models. In the Pacific Northwest, the CT calculated for the Similkameen River from the regression
model (dotted line) is compared to CT calculated from simulated output by the VIC model for several
gages in the Pacific Northwest (solid lines). (a) Columbia River at the Dalles, and (b) Snake River
at Ice Harbor Reservoir. In the Sierra Nevada, comparison is for CT from the simple regression
model for the (c) Merced River at Happy Isles, (d) Carson River at East Fork to CT calculated from
simulated output by the USGS Precipitation-Runoff Modeling system (solid lines). Units for CT are
calendar year months.
series from the PRMS models of the Carson and Merced Rivers are 0.33 and 0.53,
respectively. The offset between the PRMS simulation and the regression model
series for the Merced River, and to a lesser extent, the Carson River, is thought to
arise from a problem with downscaling diurnal temperatures resulting in a warmer
bias that is not present in the daily mean temperatures. However, the correspon-
dence between the interannual fluctuations produced by the two methodologies is
close enough to be investigated further. Importantly, they produce nearly the same
trend in CT.
230 IRIS T. STEWART ET AL.
5. Conclusions
Regional climate responses to a 21st century ‘Business as Usual’ emissions sce-
nario, as simulated by PCM, include significant springtime warming trends over
western North America. The warmer regional spring temperatures are the dominant
force that yields projections of trends toward earlier snowmelt runoff throughout
the region. Although precipitation also varies, its trends are much less significant.
The projected streamflow timing trends are quite consistent, in terms of both di-
rection and rate, with recent advances in streamflow timing observed over the past
50 years. The overall simulated response over the 21st century is larger than the
observed changes to date and would add to the observed changes. The projected
runoff-timing trends are most pronounced in the Pacific Northwest, Sierra Nevada,
and Rocky Mountain regions, where the eventual CT change amounts to 20–40
days at many streams.
Whether the response in CT to the temperature trend will level out or increase
at a certain threshold cannot be determined from a simple linear regression model.
Comparisons to more detailed, physically based hydrologic models suggest that
(in California and the Northwest) such nonlinear thresholds have not been reached
within this projection. In contrast to the strong influence of projected tempera-
ture trends on CT, the modest projected changes in precipitation, by PCM, do not
yield noticeable changes in CT. Thus, for the levels of changes projected by PCM,
the joint influence of temperature and precipitation on CT trends is completely
dominated by the temperature trends.
A one-month advance in the timing of snowmelt runoff could threaten storage
efficiencies for many reservoirs in the study area. Besides providing water sup-
ply, these reservoirs are operated for flood-protection purposes, and consequently
may release large amounts of otherwise useful water during the winter and early
spring. In such facilities, earlier flows would place more of the year’s runoff into
the category of hazard rather than resource. A one-month advance would also in-
crease the length of the summer drought that characterizes much of western North
America, with important consequences for water supply, ecosystem, and wildfire
management.
Acknowledgements
We gratefully acknowledge support for this work through a University Corpora-
tion for Atmospheric Research (UCAR) and National Oceanic and Atmospheric
Administration (NOAA) postdoctoral fellowship for ITS, the U.S. Department of
Energy’s (DOE) Office of Science (BER) Accelerated Climate Prediction Initiative
(ACPI), NOAA’s Office of Global Programs through the California Applications
Program (CAP) and the California Energy Commission through the California
Climate Change Center (CCCC) at Scripps Institution of Oceanography. We thank
PROJECTED SNOWMELT RUNOFF TIMING CHANGES 231
the DOE ACPI project for supplying model simulations, Jon Eischeid and Henry
Diaz for providing historical temperature and precipitation data, David Harvey of
Environment Canada for supplying Canadian Streamflow data, and Andrew Wood
for supplying the V.I.C. simulated streamflow data for rivers in the Pacific North-
west. Mary Meyer Tyree made crucial contributions of data, computations, and
illustrations.
References
Augado, E., Cayan, D., Riddle, L., and Roos, M.: 1992, ‘Climatic Fluctuations and the Timing of
West Coast Streamflow’, J. Climate 5, 1468–1481.
Cayan, D. R., Kammerdiener, S. A., Dettinger, M. D., Caprio, J. M., and Peterson, D. H.: 2001,
‘Changes in the Onset of Spring in the Western United States’, Bull. Amer. Meteorol. Soc. 82,
399–415.
Dai, A., Wigley, T. M. L., Boville, B. A., Kiehl, J. T., and Buja, L. E.: 2001, ‘Climates of the Twenti-
eth and Twenty-First Centuries Simulated by the NCAR Climate System Model’, J. Climate, 14,
485–519.
Dettinger, M. D. and Cayan, D. R.: 1995, ‘Large-Scale Atmospheric Forcing of Recent Trends toward
Early Snowmelt Runoff in California’, J. Climate 8, 606–623.
Dettinger, M. D., Cayan, D. R., Meyer, M. K., and Jeton, A. E.: 2004, ‘Simulated Hydrologic Re-
sponses to Climate Variations and Change in the Merced, Carson, and American River Basins,
Sierra Nevada, California, 1900–2099’, Clim. Change 62, 283–317.
Eischeid, J. K., Baker, C. B., Karl, T. R., and Diaz, H. F.: 1995, ‘The Quality Control of Long-Term
Climatological Data Using Objective Data Analysis’, J. Appl. Meteorol. 34, 2787–2795.
Leavesley, G. H., Lichty, R. W., Troutman, B. M., and Saindon, L. G.: 1983, ‘Precipitation-Runoff
Modeling System: User’s Manual’, U.S. Geological Survey Water-Resources Investigations
Report 83-4238, 207 pp.
Maurer, E. P., Wood, A. W., Adam, J. C., Lettenmaier, D. P., and Nijssen, B.: 2002, ‘A Long-Term
Hydrologically-Based Data Set of Land Surface Fluxes and States for the Conterminous United
States’, J. Climate 15, 3237–3251.
Payne, J. T., Wood, A. W., Hamlet, A. F., Palmer, R. N., and Lettenmaier, D. P.: 2004, ‘Mitigating the
Effects of Climate Change on the Water Resources of the Columbia River Basin’, Clim. Change
62, 233–256.
Pupacko, A.: 1993, ‘Variations in Northern Sierra Nevada Streamflow: Implications of Climate
Change’, Wat. Resour. Bull. 29, 283–290.
Roos, M.: 1987, ‘Possible Changes in California Snowmelt Patterns’, Proc., 4th Pacific Climate
Workshop, Pacific Grove, California, 22–31.
Roos, M.: 1991, ‘A Trend of Decreasing Snowmelt Runoff in Northern California’, Proc., 59th
Western Snow Conference, Juneau, Alaska, 29–36.
Slack, J. R. and Landwehr, J. M.: 1992, ‘Hydro-Climatic Data network (HCDN): A U.S. Geological
Survey Streamflow Data Set for the United States for the Study of Climate Variations, 1874–
1988’, U.S. Geological Survey Open-File Report 92-129, 193 pp.
Stewart, I. T., Cayan, D. R., and Dettinger, M. D.: 2003, ‘Changes towards Earlier Streamflow Timing
across Western North America’, in preparation.
Wahl, K. L.: 1992, ‘Evaluation of Trends in Runoff in the Western United States’, AWRA, Managing
Water Resources during Global Change, 701–710.
Washington, W. M., Weatherly, J. W., Meehl, G. A., Semtner, A. J., Bettge, T. W., Craig, A. P., Strand,
W. G., Arblaster, J., Wayland, V. B., James, R., and Zhang, Y.: 2000, ‘Parallel Climate Model
(PCM) Control and Transient Simulations’, Clim. Dyn. 16, 755–774.

232 IRIS T. STEWART ET AL.
Wood, A. W., Leung, L. R., Sridhar, V., and D. P. Lettenmaier, D. P.: 2004. ‘Hydrologic Implications
of Dynamical and Statistical Approaches to Downscaling Climate Model Surface Temperature
and Precipitation Fields’, Clim. Change 62, 189–216.
(Received 5 November 2002; in revised form 29 September 2003)