august 2015 109 application of the snowmelt runoff model...
TRANSCRIPT
Journal of Hydrology and Meteorology, Vol. 9, No. 1
August 2015 109
SOHAM-Nepal
ABSTRACT
This study is carried out on the Salang River basin, which is located at the northern part of the Kabul River basin, and in the south facing slope of the Hindu Kush Mountains. The basin drains through the Salang River, which is one of the tributaries of the Panjshir River. The basin covers an area of 485.9km2 with a minimum elevation of 1653 m a. s. l. and a maximum elevation of 4770 m a. s. l. The Salang River sustains a substantial flow of water in summer months due to the melting of snow. In this study, we estimate daily discharge of Salang River from 2009 to 2011 using the Snowmelt Runoff Model (SRM, Version 1.12, 2009), originally developed by J. Martinec in 1975. The model uses daily observed precipitation, air temperature and snow cover data as input variables from which discharge is computed. The model is calibrated for the year 2009 and validated for 2010 and 2011. The observed and calculated annual average discharges for the calibration year 2009 are 11.57m3s-1 and 10.73m3s-1, respectively. Similarly, the observed and calculated annual average discharges for the validation year 2010 are 11.55m3s-1 and 10.07m3s-1, respectively and for 2011, the discharges are 9.05 m3 s-1 and 9.6m3s-1, respectively. The model is also tested by changing temperature and precipitation for the year 2009. With an increase of 1°C in temperature and 10% in precipitation, the increases in discharge for winter, summer and annually are 21.8%, 13.5% and 14.8%, respectively. With an increase of 2°C in temperature and 20% in precipitation, the increases are 48.5%, 43.3% and 44.1%, respectively. The results obtained suggest that the SRM can be used as a promising tool to estimate the river discharge of the snow fed mountainous river basins of Afghanistan and to study the impact of climate change on river flow pattern of such basins.
Keywords: Snowmelt Runoff Model (SRM), Salang River basin, snowmelt, river discharge
Application of the Snowmelt Runoff Model in the Salang River Basin, Afghanistan Using MODIS Satellite Data
Hedayatullah Arian1,2, Rijan B. Kayastha1, Bikas C. Bhattarai1, Ahuti Shrestha1, Hafizullah Rasouli 1,3 Richard Armstrong4
1 Himalayan Cryosphere, Climate and Disaster Research Centre, Department of Environmental Science and Engineering, School of Science, Kathmandu University, Dhulikhel, Nepal
2 Department of Hydro-Meteorology, Faculty of Geosciences, Kabul University, Kabul, Afghanistan3 Department of Geology, Faculty of Geosciences, Kabul University, Kabul, Afghanistan4 National Snow and Ice Data Centre, The University of Colorado, Boulder, USA
1. INTRODUCTION
Afghanistan is a country dominated by a dry climate with most of the area represented by
arid land. The population of this country mostly uses mountain fed river water for irrigation, hydropower, and drinking water purposes. The
August 2015110
Journal of Hydrology and Meteorology, Vol. 9, No. 1 SOHAM-Nepal
effect of global climate change on hydrologic systems, especially on mountain snow and glacier melt, can modify the timing and amount of runoff in mountainous watersheds. Therefore, accurate stream flow simulation and forecast is of great importance to water resources management and planning (Abudu et al., 2010).
The high mountain snow and glaciers of Afghanistan are at high risk due to the climate change phenomenon. In the summer season, there is high snow melt and retreat of snow cover. The great amount of this melt water reliably occurs at this particular time of the year. To minimize the risk and loss from floods caused by rapid snow and glacier melt, accurate forecasting is essential (Li and Williams, 2008). However, water resource management and the evaluation of impacts of climatic change require quantification of stream flow variability and hydrologic models provide a framework to investigate these relationships (Leavesley, 1994). In addition potential impacts of climate change on stream-flow regimes can be evaluated if valid snow-glacier models are available (Hong and Guodong, 2003).
There are three methods to estimate snow melt runoff: (a) degree day method, (b) energy budget method, and (c) combination method. Of these three methods, the degree day method has the most application, because of the simplicity and accuracy (Raghunath, 2006). The Snowmelt Runoff Model (SRM) also referred as the “Martinec Model” or “Martinec-Rango Model” originally developed by Martinec (1975) in small European basins. This model is based on the degree day model and is designed to simulate and forecast the daily stream flow in mountain basins where snowmelt is a major runoff factor.
SRM also successfully underwent tests by the World Meteorological Organization (WMO)
with regard to runoff simulation (WMO, 1986) and to simulated conditions of real time runoff forecasts (WMO, 1992). The SRM with the progressive use of remote sensing data for snow cover is widely applied in practice by various agencies, institutes and universities in different parts of the world (Martinec et al., 1983). SRM or variations of it have been applied in over 100 basins in 25 countries around the world with basin sizes varying from <1 to 120,000km2 (Seidel and Martinec, 2004). With input of climatic variables and parameter selection methods, SRM has a potential in forecasting stream flow and evaluating the effects of climate change on runoff in mountainous watersheds, especially data-scarce watersheds in high-elevation regions. Therefore, we use this SRM model in Salang River basin having limited data.
2. STUDY AREA
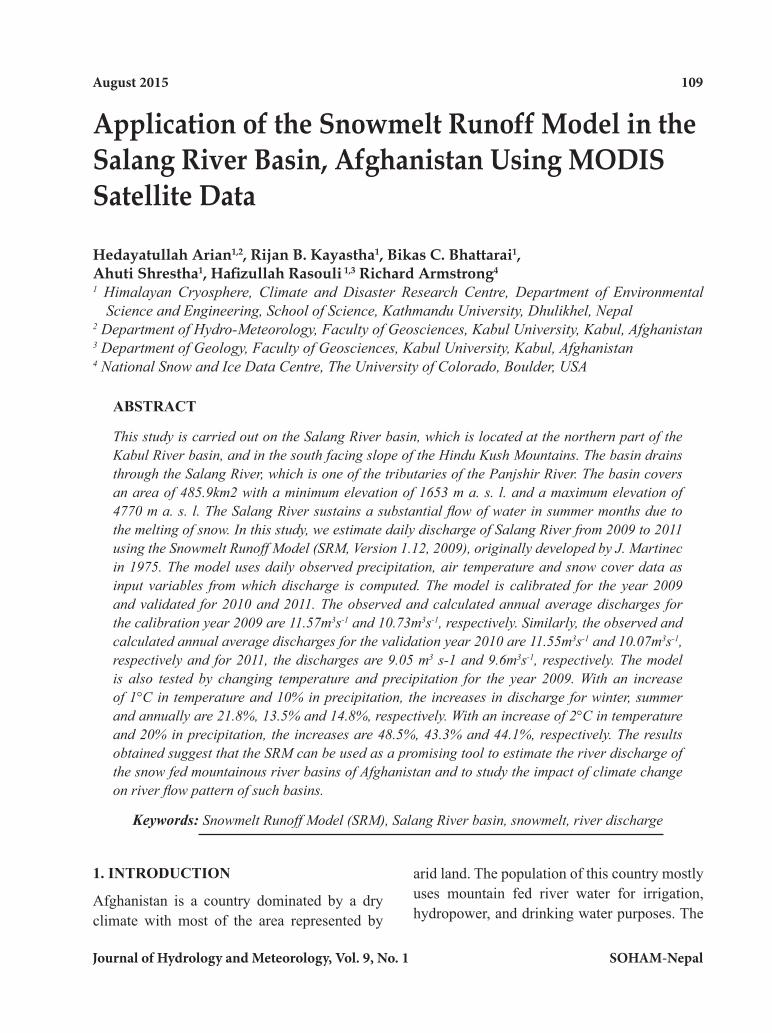
The Salang River basin is located at the northern part of the Kabul River basin and in the south facing slope of the Hindu Kush Mountains. It lies between the Panjshir and Ghorband Valleys, which drain water from the central Hindu Kush Mountains (Favre and Kamal, 2004). It
Application of the Snowmelt Runoff Model in the Salang River basin...
Figure 1 : Location map of Salang River basin, Afghanistan.
Journal of Hydrology and Meteorology, Vol. 9, No. 1
August 2015 111
SOHAM-Nepal
covers a total area of 485.9km2 and is situated between latitude 35.7°N and 35.25°N and longitude 69.0°E and 69.45°E. The minimum and maximum elevation of the basin ranges from 1653ma.s.l. to 4770ma.s.l., respectively, with an average elevation of 2953ma.s.l. The basin has one hydro-meteorological station and one meteorological station, namely, Bagh–e–ala hydro-meteorological station (1653ma.s.l.) and South Salang meteorological station (3172ma.s.l.). Figure 1 shows the location of the major river systems in the basin and the hydro-meteorological stations present in the basin.
The annual mean temperature recorded in Bagh–e–Lala hydro-meteorological station from January 2009 to May 2013 was 14.8°C with a maximum monthly mean temperature of 26.8°C in August 2009 and a minimum monthly mean temperature of -1.9°C in February 2012. Similarly, the annual total precipitation for the year 2009 was 587.4 mm. The annual mean discharge recorded in this station from January 2009 to December 2012 ranged from 9m3s-1
to 12m3s-1, with a maximum monthly mean discharge of 41m3s-1 recorded in April 2012 and a minimum monthly mean discharge of 1m3 s-1 in January 2012.
3. DATA COLLECTION AND METHODS
3.1 Data Collection
3.1.1 Basin area and elevation distribution
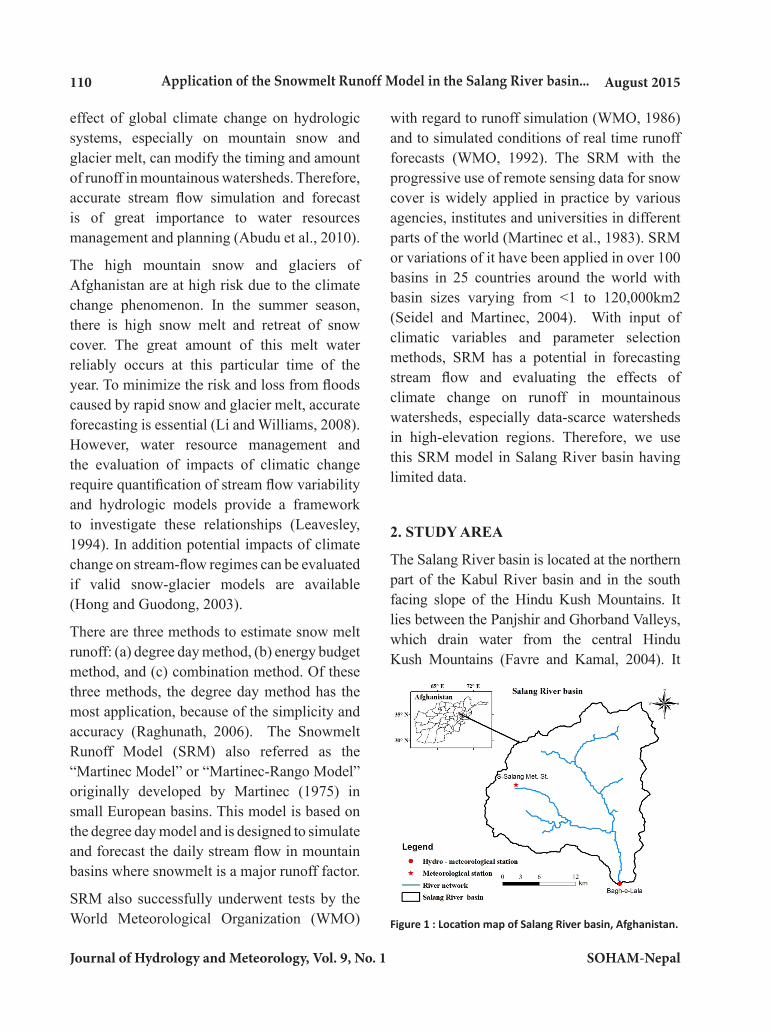
The Digital Elevation Model (DEM) downloaded from http://gdex.cr.usgs.gov/gdex/, with horizontal resolution of 30 × 30 m obtained from the United States Geological Survey (USGS) is used in this study. ArcMap 9.3 is used to calculate the area and the area-elevation distribution of the basin. As the physical environment varies drastically with
increasing altitudes, the basin’s great elevation range is divided into several zones to better describe the physical environment (Tahir et al., 2011). Hence, the study area is divided into 16 elevation zones, each with a vertical difference of 200m (Table 1). The area-elevation curve (Figure 2) is used to determine the zonal
Hedayatullah Arian, Rijan B. Kayastha, Bikas C. Bhattarai, Ahuti Shrestha, Hafizullah Rasouli & Richard Armstrong
1748
2148
2548
2948
3348
3748
4148
4548
4948
0 100 200 300 400 500
Mea
n el
evat
ion
(m a
.s.l.)
Area (km2)
♦ : Zone 1 to 16
Table 1 Elevation zone, elevation range, hyp-sometric mean elevation and zonal area for the 16 elevation zones of Salang River basin
Elevation zone
Elevation range
(m a.s.l.)
Hypsometric mean
elevation (m a.s.l.)
Zonal area (km2)
1 1653 - 1853 1748 3.52 1853 - 2053 1940 11.83 2053 - 2253 2150 26.84 2253 - 2453 2355 46.45 2453 - 2653 2540 57.26 2653 - 2853 2738 67.07 2853 - 3053 2955 63.18 3053 - 3253 3215 51.59 3253 - 3453 3370 45.210 3453 - 3653 3583 38.511 3653 - 3853 3783 29.712 3853 - 4053 3978 21.213 4053 - 4253 4178 15.814 4253 - 4453 4404 5.815 4453 - 4653 4620 1.916 4653 - 4770 4711 0.3
Figure 2 : Area – elevation curve of Salang River basin
August 2015112
Journal of Hydrology and Meteorology, Vol. 9, No. 1 SOHAM-Nepal
Qm+1
Qm
mean hypsometric elevations. Temperature and precipitation of each elevation zone are extrapolated for the calculation of zonal degree-days and zonal precipitation.
3.1.2 Temperature
In order to compute the daily snowmelt from the SRM, the number of degree-days must be determined from mean temperature data for each zone. In this study, the temperature obtained from Bagh–e–Lala hydro-meteorological station is used to estimate the mean temperature corresponding to the mean elevation of each zone using the temperature lapse rate. Due to the lack of historical data, the temperature lapse rate of Panjshir River basin situated nearby to the Salang River basin is used, which is calculated from the temperature data of two hydro-meteorological stations: Gul Bahar hydro-meteorological station (1605 m a.s.l.) and Du Ab hydro-meteorological station (2065 m a.s.l). The calculated average lapse rate of 0.91 ˚C per 100 m is used.
3.1.3 Precipitation
Extrapolating precipitation is particularly difficult in mountainous watersheds because of the lack of weather stations in the watershed and local factors, such as topography, which strongly influence the spatial distribution. In this study, precipitation recorded at Bagh–e–Lala hydro-meteorological station and South Salang meteorological station are used to calculate the precipitation gradient, which is found to be 1.7% increase per 100 m elevation rise. The calculated precipitation gradient is then used to estimate the precipitation at each elevation zone.
Precipitation usually occurs in two forms, i.e. rain or snow, which can be determined by a critical temperature in this model. When temperature is higher than the critical temperature, the precipitation is determined to be rain; otherwise, the precipitation is determined to be snow. The distinction between rain and snow is important in the SRM because the rain contribution to runoff occurs at about the same time as when rain occurs, whereas snow contribution to runoff is usually delayed until conditions for melt occur.
3.1.4 Snow Cover
Satellite-derived snow covered area is the best routinely available input for SRM, especially in remote and data-scarce mountain watersheds. Compared with other satellite platforms, the Moderate Resolution Imaging Spectro-radiometer (MODIS) derived snow cover area is the most suitable for use in snowmelt models because of a higher spatial resolution (500 m) and location accuracy (Tekeli et al., 2005). In this study, MODIS/Terra Snow Cover 8 – Day L3 Global 500 m (MOD10A2) data set is downloaded from National Aeronautics and Space Administration’s Earth Observing System Data and Information System. It is considered to be one of the best resources for remotely sensed information on the distribution of snow covered area over eight-day periods (Hall et al., 2002).
Although MODIS provides both daily and 8-day snow cover products, the 8 – day maximum snow-cover extent product is used to minimize cloud cover effect. The data sets thus obtained are processed through a MODIS Re-projection Tool (MRT) (Dwyer and Schmidt, 2006) with the WGS 1984 UTM Zone 42N projection system
Application of the Snowmelt Runoff Model in the Salang River basin...
Journal of Hydrology and Meteorology, Vol. 9, No. 1
August 2015 113
SOHAM-Nepal
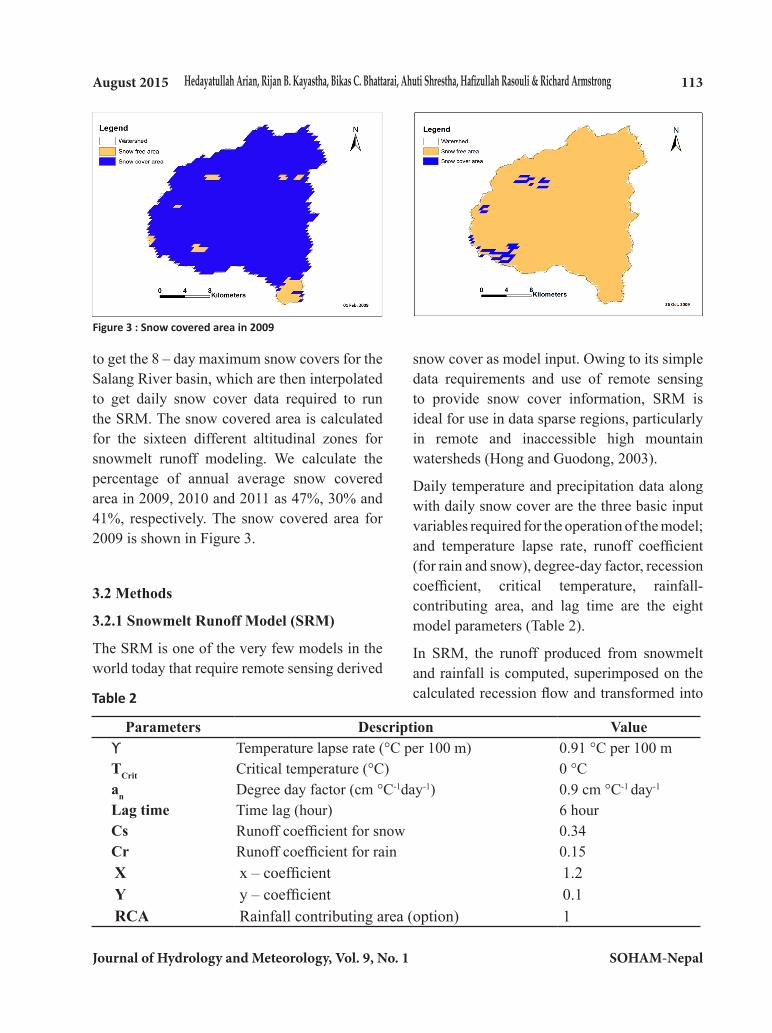
to get the 8 – day maximum snow covers for the Salang River basin, which are then interpolated to get daily snow cover data required to run the SRM. The snow covered area is calculated for the sixteen different altitudinal zones for snowmelt runoff modeling. We calculate the percentage of annual average snow covered area in 2009, 2010 and 2011 as 47%, 30% and 41%, respectively. The snow covered area for 2009 is shown in Figure 3.
3.2 Methods
3.2.1 Snowmelt Runoff Model (SRM)
The SRM is one of the very few models in the world today that require remote sensing derived
snow cover as model input. Owing to its simple data requirements and use of remote sensing to provide snow cover information, SRM is ideal for use in data sparse regions, particularly in remote and inaccessible high mountain watersheds (Hong and Guodong, 2003).
Daily temperature and precipitation data along with daily snow cover are the three basic input variables required for the operation of the model; and temperature lapse rate, runoff coefficient (for rain and snow), degree-day factor, recession coefficient, critical temperature, rainfall-contributing area, and lag time are the eight model parameters (Table 2).
In SRM, the runoff produced from snowmelt and rainfall is computed, superimposed on the calculated recession flow and transformed into
Figure 3 : Snow covered area in 2009
Table 2
Parameters Description Valueϒ Temperature lapse rate (°C per 100 m) 0.91 °C per 100 mTCrit Critical temperature (°C) 0 °Can Degree day factor (cm °C-1day-1) 0.9 cm °C-1 day-1
Lag time Time lag (hour) 6 hourCs Runoff coefficient for snow 0.34Cr Runoff coefficient for rain 0.15X x – coefficient 1.2Y y – coefficient 0.1RCA Rainfall contributing area (option) 1
Hedayatullah Arian, Rijan B. Kayastha, Bikas C. Bhattarai, Ahuti Shrestha, Hafizullah Rasouli & Richard Armstrong
August 2015114
Journal of Hydrology and Meteorology, Vol. 9, No. 1 SOHAM-Nepal
daily discharge from the basin according to the equation (1) given by Martinec et al. (2008):
most suitable for use in snowmelt models because of a higher spatial resolution (500 m) and
location accuracy (Tekeli et al., 2005). In this study, MODIS/Terra Snow Cover 8 – Day L3
Global 500 m (MOD10A2) data set is downloaded from National Aeronautics and Space
Administration’s Earth Observing System Data and Information System. It is considered to
be one of the best resources for remotely sensed information on the distribution of snow
covered area over eight-day periods (Hall et al., 2002).
Although MODIS provides both daily and 8-day snow cover products, the 8 – day maximum
snow-cover extent product is used to minimize cloud cover effect. The data sets thus obtained
are processed through a MODIS Re-projection Tool (MRT) with the WGS 1984 UTM Zone
42N projection system to get the 8 – day maximum snow covers for the Salang River basin,
which are then interpolated to get daily snow cover data required to run the SRM. The snow
covered area is calculated for the sixteen different altitudinal zones for snowmelt runoff
modeling. It is found that the percentage of annual average snow covered area in 2009, 2010
and 2011 were 47 %, 30 % and 41 %, respectively. The snow covered area for 2009 is shown
in Figure 3.
3.2 METHODS
3.2.1 Snowmelt Runoff Model (SRM)
The SRM is one of the very few models in the world today that require remote sensing
derived snow cover as model input. Owing to its simple data requirements and use of remote
sensing to provide snow cover information, SRM is ideal for use in data sparse regions,
particularly in remote and inaccessible high mountain watersheds (Hong and Guodong, 2003).
Daily temperature and precipitation data along with daily snow cover are the three basic input
variables required for the operation of the model; and temperature lapse rate, runoff
coefficient (for rain and snow), degree-day factor, recession coefficient, critical temperature,
rainfall-contributing area, and lag time are the eight model parameters (Table 2).
In SRM, the runoff produced from snowmelt and rainfall is computed, superimposed on the
calculated recession flow and transformed into daily discharge from the basin according to
the equation (1) given by Martinec et al. (2008):
𝑄𝑄𝑛𝑛 𝐶𝐶𝑆𝑆𝑛𝑛𝑎𝑎𝑛𝑛 𝑇𝑇𝑛𝑛 ∆𝑇𝑇𝑛𝑛 𝑆𝑆𝑛𝑛 𝐶𝐶𝑅𝑅𝑛𝑛𝑃𝑃𝑛𝑛 𝐴𝐴 − 𝐾𝐾𝑛𝑛 𝑄𝑄𝑛𝑛𝐾𝐾𝑛𝑛 …………… (1)
where Q is average daily discharge (m3 s-1); CS and CR are the runoff coefficients that expresses the losses to discharge (ratio of volume of snowmelt (rain) contributing to runoff to the total volume of snowmelt (rain)); a is degree-day factor (cm oC-1 d-1); T is number of degree days (oC d); ∆T is the adjustment by temperature lapse rate (oC d); S is ratio of the snow cover to the total area; P is the precipitation contributing to runoff (cm); TCRIT is the critical temperature that determines whether this contribution is rainfall and immediate runoff. If precipitation is determined by TCRIT to be new snow, it is kept on storage over the hitherto snow free area until melting conditions occur; A is area of the basin or zone (km2); n is sequence of days during
the discharge computation period; 1000086400
=
conversion from runoff depth (cmkm2 d-1) to discharge (m3 s-1). K is a recession coefficient indicating the decline of discharge in the period
without snowmelt or rainfall, K = Qm+1
Qm
(m,
m+1 are the sequence of days during a true recession flow period). The recession coefficient is an important model parameter since (1-k) is the proportion of the daily melt-water of snow contributing to the daily runoff. Recession coefficient can be obtained by the analysis of historical discharge data based on the following equation:
where Q is average daily discharge (m3s-1); C is a runoff coefficient that expresses the losses
as a ratio (runoff/precipitation), where Cs refers to snowmelt and CR to rain; a is degree-day
factor (cmoC-1day-1); T is number of degree days (oCd); ∆T is the adjustment by temperature
lapse rate (oC d); S is ratio of the snow cover to the total area; P is the precipitation
contributing to runoff (cm); TCRIT is the critical temperature that determines whether this
contribution is rainfall and immediate runoff. If precipitation is determined by TCRIT to be
new snow, it is kept on storage over the hitherto snow free area until melting conditions occur;
A is area of the basin or zone (km2); n is sequence of days during the discharge computation
period; = conversion from runoff depth (cm.km2 d-1) to discharge (m3 s-1). K is a
recession coefficient indicating the decline of discharge in the period without snowmelt or
rainfall, K = (m, m+1 are the sequence of days during a true recession flow period). The
recession coefficient is an important model parameter since (1-k) is the proportion of the
daily melt-water of snow contributing to the daily runoff. Recession coefficient can be
obtained by the analysis of historical discharge data based on the following equation:
𝐾𝐾𝑛𝑛 𝑥𝑥 𝑄𝑄𝑛𝑛−𝑦𝑦 ………………………
where Qn is discharge on day n; x and y are two constants. For the determination of x and y,
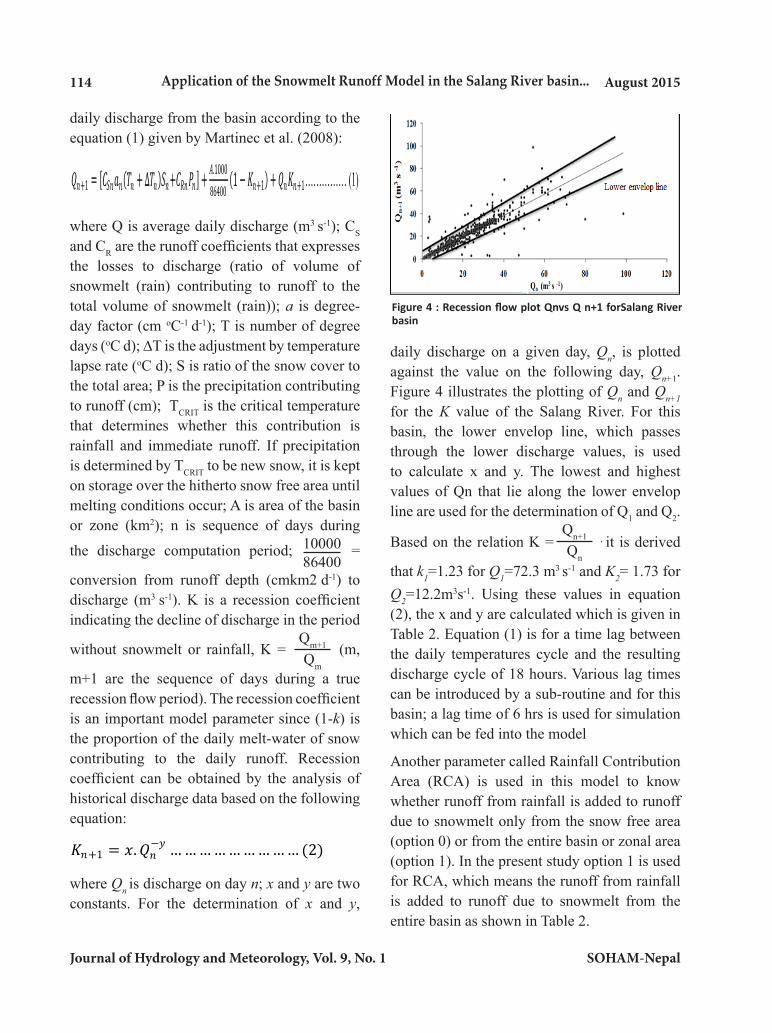
daily discharge on a given day, Qn, is plotted against the value on the following day, Qn+1.
Figure 4 illustrates the plotting of Qn and Qn+1 for the K value of the Salang River. For this
basin, the lower envelop line, which passes through the lower discharge values, is used to
calculate x and y. The lowest and highest values of Qn that lie along the lower envelop line
are used for the determination of Q1 and Q2. Based on the relation K = 𝐐𝐐𝐧𝐧 𝟏𝟏𝐐𝐐𝐧𝐧
,it is derived that
k1= 1.23 for Q1=72.3 m3s-1 and K2= 1.73 for Q2 = 12.2 m3 s-1. Using these values in equation
(2), the x and y are calculated which is given in Table 2. Equation (1) is for a time lag
between the daily temperatures cycle and the resulting discharge cycle of 18 hours. Various
lag times can be introduced by a sub-routine and for this basin, a lag time of 6 hrs is used for
simulation which can be fed into the model
Another parameter called Rainfall Contribution Area (RCA) is used in this model to know
whether runoff from rainfall is added to runoff due to snowmelt only from the snow free area
(option 0) or from the entire basin or zonal area (option 1). In the present study option 1 is
used for RCA, which means the runoff from rainfall is added to runoff due to snowmelt from
the entire basin as shown in Table 2.
where Qn is discharge on day n; x and y are two constants. For the determination of x and y,
daily discharge on a given day, Qn, is plotted against the value on the following day, Qn+1. Figure 4 illustrates the plotting of Qn and Qn+1 for the K value of the Salang River. For this basin, the lower envelop line, which passes through the lower discharge values, is used to calculate x and y. The lowest and highest values of Qn that lie along the lower envelop line are used for the determination of Q1 and Q2.
Based on the relation K =Qn+1
Qn , it is derived
that k1=1.23 for Q1=72.3 m3 s-1 and K2= 1.73 for Q2=12.2m3s-1. Using these values in equation (2), the x and y are calculated which is given in Table 2. Equation (1) is for a time lag between the daily temperatures cycle and the resulting discharge cycle of 18 hours. Various lag times can be introduced by a sub-routine and for this basin; a lag time of 6 hrs is used for simulation which can be fed into the model
Another parameter called Rainfall Contribution Area (RCA) is used in this model to know whether runoff from rainfall is added to runoff due to snowmelt only from the snow free area (option 0) or from the entire basin or zonal area (option 1). In the present study option 1 is used for RCA, which means the runoff from rainfall is added to runoff due to snowmelt from the entire basin as shown in Table 2.
Figure 4 : Recession flow plot Qnvs Q n+1 forSalang River basin
Application of the Snowmelt Runoff Model in the Salang River basin...
Journal of Hydrology and Meteorology, Vol. 9, No. 1
August 2015 115
SOHAM-Nepal
3.3 Evaluation of model performance
The computed and measured hydrographs show at the first glance whether the simulation is successful or not. In addition, SRM uses two accuracy criteria to evaluate model performance, namely, the coefficient of determination (R2), and the volume difference Dv (Martinec and Rango, 1989). The R2 is computed as:
3.3 Evaluation of model performance
The computed and measured hydrographs show at the first glance whether the simulation is
successful or not. In addition, SRM uses two accuracy criteria to evaluate model performance,
namely, the coefficient of determination (R2), and the volume difference Dv (Martinec and
Rango, 1989). The R2 is computed as:
R2 = 1- 𝑄𝑄𝑖𝑖−𝑄𝑄′
𝑖𝑖 𝑛𝑛𝑖𝑖 𝑄𝑄𝑖𝑖−𝑄𝑄 𝑛𝑛
𝑖𝑖 ……………..… (3)
where, Qi is measured daily discharge (m3s-1), 𝑄𝑄′𝑖𝑖 is simulated daily discharge (m3 s-1), 𝑄𝑄 is
average measured discharge of the given year or snowmelt season (m3 s-1) and n is the
number of daily discharge values. Similarly, the volume difference (Dv) in percentage is
computed as:
Dv = − ′𝑥𝑥 100 ……………..… (4)
where, 𝑉𝑉R is the measured runoff volume (m3) and ′ is the simulated runoff volume.
4. RESULT AND DISCUSSION
4.1 Model calibration and validation
In this study, the model has been calibrated for 2009 due to its good hydro-meteorological
records and validated for 2010 and 2011. Parameter adjustment is carried out manually by
using a trial-and-error method. The values of the main parameters for SRM in the Salang
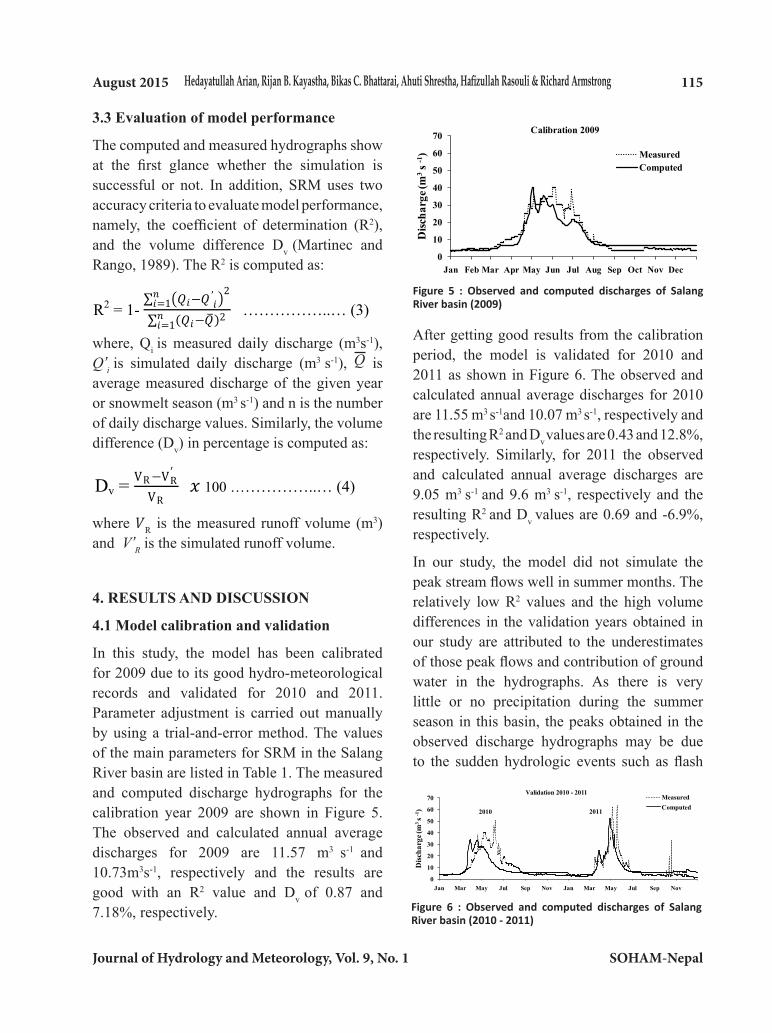
River basin are listed in Table 1. The measured and computed discharge hydrographs for the
calibration year 2009 are shown in Figure 5.The observed and calculated annual average
discharges for 2009 are 11.57 m3 s-1 and 10.73 m3 s-1, respectively and the results are good
with an R2 value and Dv of 0.87 and 7.18 %, respectively.
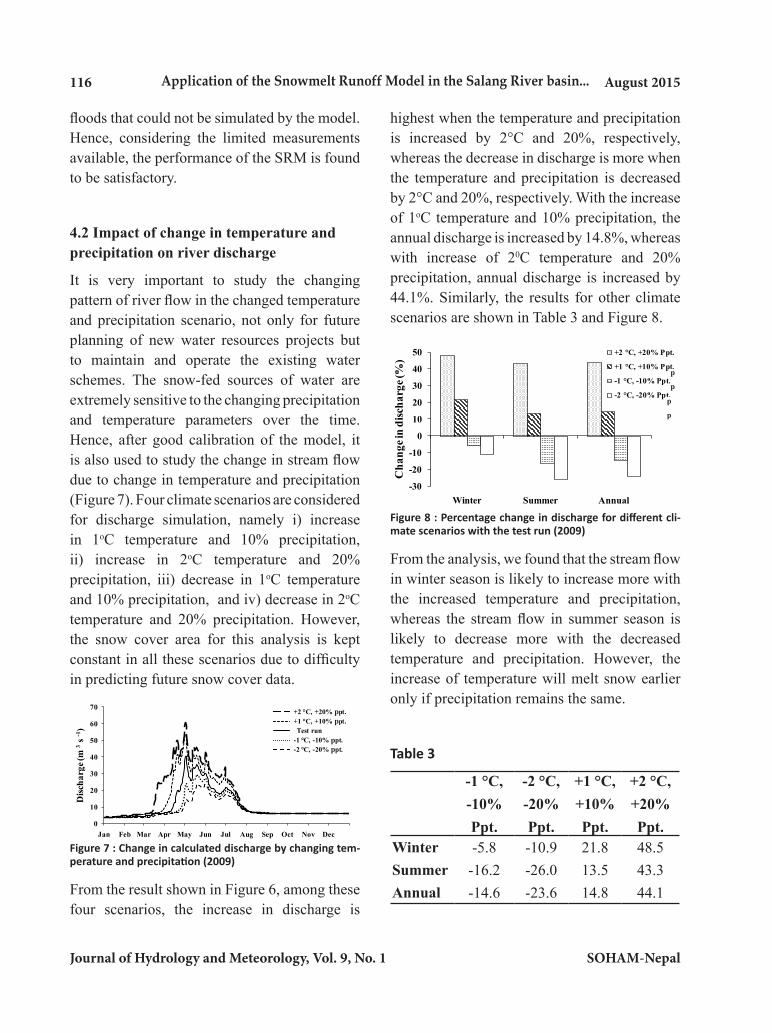
After getting good results from the calibration period, the model is validated for 2010 and
2011 as shown in Figure 6.The observed and calculated annual average discharges for 2010
are 11.55 m3 s-1and 10.07 m3 s-1, respectively and the resulting R2 and Dv values are0.43 and
12.8 %, respectively. Similarly, for 2011 the observed and calculated annual average
discharges are 9.05 m3 s-1 and 9.6 m3 s-1, respectively and the resulting R2and Dv values are
0.69 and -6.9 %, respectively.
where, Qi is measured daily discharge (m3s-1), Q’i is simulated daily discharge (m3 s-1), Q is average measured discharge of the given year or snowmelt season (m3 s-1) and n is the number of daily discharge values. Similarly, the volume difference (Dv) in percentage is computed as:
3.3 Evaluation of model performance
The computed and measured hydrographs show at the first glance whether the simulation is
successful or not. In addition, SRM uses two accuracy criteria to evaluate model performance,
namely, the coefficient of determination (R2), and the volume difference Dv (Martinec and
Rango, 1989). The R2 is computed as:
R2 = 1- 𝑄𝑄𝑖𝑖−𝑄𝑄′
𝑖𝑖 𝑛𝑛𝑖𝑖 𝑄𝑄𝑖𝑖−𝑄𝑄 𝑛𝑛
𝑖𝑖 ……………..… (3)
where, Qi is measured daily discharge (m3s-1), 𝑄𝑄′𝑖𝑖 is simulated daily discharge (m3 s-1), 𝑄𝑄 is
average measured discharge of the given year or snowmelt season (m3 s-1) and n is the
number of daily discharge values. Similarly, the volume difference (Dv) in percentage is
computed as:
Dv = − ′𝑥𝑥 100 ……………..… (4)
where, 𝑉𝑉R is the measured runoff volume (m3) and ′ is the simulated runoff volume.
4. RESULT AND DISCUSSION
4.1 Model calibration and validation
In this study, the model has been calibrated for 2009 due to its good hydro-meteorological
records and validated for 2010 and 2011. Parameter adjustment is carried out manually by
using a trial-and-error method. The values of the main parameters for SRM in the Salang
River basin are listed in Table 1. The measured and computed discharge hydrographs for the
calibration year 2009 are shown in Figure 5.The observed and calculated annual average
discharges for 2009 are 11.57 m3 s-1 and 10.73 m3 s-1, respectively and the results are good
with an R2 value and Dv of 0.87 and 7.18 %, respectively.
After getting good results from the calibration period, the model is validated for 2010 and
2011 as shown in Figure 6.The observed and calculated annual average discharges for 2010
are 11.55 m3 s-1and 10.07 m3 s-1, respectively and the resulting R2 and Dv values are0.43 and
12.8 %, respectively. Similarly, for 2011 the observed and calculated annual average
discharges are 9.05 m3 s-1 and 9.6 m3 s-1, respectively and the resulting R2and Dv values are
0.69 and -6.9 %, respectively.
where 𝑉R is the measured runoff volume (m3) and V’R is the simulated runoff volume.
4. RESULTS AND DISCUSSION
4.1 Model calibration and validation
In this study, the model has been calibrated for 2009 due to its good hydro-meteorological records and validated for 2010 and 2011. Parameter adjustment is carried out manually by using a trial-and-error method. The values of the main parameters for SRM in the Salang River basin are listed in Table 1. The measured and computed discharge hydrographs for the calibration year 2009 are shown in Figure 5. The observed and calculated annual average discharges for 2009 are 11.57 m3 s-1 and 10.73m3s-1, respectively and the results are good with an R2 value and Dv of 0.87 and 7.18%, respectively.
After getting good results from the calibration period, the model is validated for 2010 and 2011 as shown in Figure 6. The observed and calculated annual average discharges for 2010 are 11.55 m3 s-1and 10.07 m3 s-1, respectively and the resulting R2 and Dv values are 0.43 and 12.8%, respectively. Similarly, for 2011 the observed and calculated annual average discharges are 9.05 m3 s-1 and 9.6 m3 s-1, respectively and the resulting R2 and Dv values are 0.69 and -6.9%, respectively.
In our study, the model did not simulate the peak stream flows well in summer months. The relatively low R2 values and the high volume differences in the validation years obtained in our study are attributed to the underestimates of those peak flows and contribution of ground water in the hydrographs. As there is very little or no precipitation during the summer season in this basin, the peaks obtained in the observed discharge hydrographs may be due to the sudden hydrologic events such as flash
0
10
20
30
40
50
60
70
Jan Feb Mar Apr May Jun Jul Aug Sep Oct Nov Dec
Disc
harg
e (m
3s -1
)
Calibration 2009
MeasuredComputed
Figure 5 : Observed and computed discharges of Salang River basin (2009)
0
10
20
30
40
50
60
70
Jan Mar May Jul Sep Nov Jan Mar May Jul Sep Nov
Disc
harg
e (m
3 s -1
)
Validation 2010 - 2011MeasuredComputed20112010
Figure 6 : Observed and computed discharges of Salang River basin (2010 - 2011)
Hedayatullah Arian, Rijan B. Kayastha, Bikas C. Bhattarai, Ahuti Shrestha, Hafizullah Rasouli & Richard Armstrong
August 2015116
Journal of Hydrology and Meteorology, Vol. 9, No. 1 SOHAM-Nepal
floods that could not be simulated by the model. Hence, considering the limited measurements available, the performance of the SRM is found to be satisfactory.
4.2 Impact of change in temperature and precipitation on river discharge
It is very important to study the changing pattern of river flow in the changed temperature and precipitation scenario, not only for future planning of new water resources projects but to maintain and operate the existing water schemes. The snow-fed sources of water are extremely sensitive to the changing precipitation and temperature parameters over the time. Hence, after good calibration of the model, it is also used to study the change in stream flow due to change in temperature and precipitation (Figure 7). Four climate scenarios are considered for discharge simulation, namely i) increase in 1oC temperature and 10% precipitation, ii) increase in 2oC temperature and 20% precipitation, iii) decrease in 1oC temperature and 10% precipitation, and iv) decrease in 2oC temperature and 20% precipitation. However, the snow cover area for this analysis is kept constant in all these scenarios due to difficulty in predicting future snow cover data.
Figure 7 : Change in calculated discharge by changing tem-perature and precipitation (2009)
0
10
20
30
40
50
60
70
Jan Feb Mar Apr May Jun Jul Aug Sep Oct Nov Dec
Disc
harg
e (m
3s -1
)
+2 °C, +20% Ppt.+1 °C, +10% Ppt.Test run
-1 °C, -10% Ppt.-2 °C, -20% Ppt.
From the result shown in Figure 6, among these four scenarios, the increase in discharge is
highest when the temperature and precipitation is increased by 2°C and 20%, respectively, whereas the decrease in discharge is more when the temperature and precipitation is decreased by 2°C and 20%, respectively. With the increase of 1oC temperature and 10% precipitation, the annual discharge is increased by 14.8%, whereas with increase of 20C temperature and 20% precipitation, annual discharge is increased by 44.1%. Similarly, the results for other climate scenarios are shown in Table 3 and Figure 8.
Figure 8 : Percentage change in discharge for different cli-mate scenarios with the test run (2009)
-30
-20
-10
0
10
20
30
40
50
Winter Summer Annual
Cha
nge i
n di
scha
rge (
%)
+2 °C, +20% Ppt.
+1 °C, +10% Ppt.
-1 °C, -10% Ppt.
-2 °C, -20% Ppt.
From the analysis, we found that the stream flow in winter season is likely to increase more with the increased temperature and precipitation, whereas the stream flow in summer season is likely to decrease more with the decreased temperature and precipitation. However, the increase of temperature will melt snow earlier only if precipitation remains the same.
Table 3
-1 °C,-10% Ppt.
-2 °C,-20% Ppt.
+1 °C,+10% Ppt.
+2 °C,+20% Ppt.
Winter -5.8 -10.9 21.8 48.5Summer -16.2 -26.0 13.5 43.3Annual -14.6 -23.6 14.8 44.1
pp
pp
p
p
p
p
Application of the Snowmelt Runoff Model in the Salang River basin...
Journal of Hydrology and Meteorology, Vol. 9, No. 1
August 2015 117
SOHAM-Nepal
5. CONCLUSION
In this study, the SRM is used to estimate discharge from the Salang River basin, Afghanistan. The model is calibrated for 2009 and validated in 2010 and 2011. The observed and calculated annual average discharges for the calibration year are 11.57 m3 s-1 and 10.73m3s-1, respectively with R2 and Dv values of 0.87 and 7.18%, respectively. The observed and calculated annual average discharges for the validation year 2010 are 11.55 m3 s-1and 10.07 m3 s-1, respectively and the resulting R2 and Dv values are 0.43 and 12.8%, respectively. Similarly, for 2011, the observed and calculated annual average discharges are 9.05m3 s-1 and 9.6m3 s-1, respectively and the resulting R2 value and Dv are 0.69 and -6.9%. The model shows good results in the calibration year, however, it could not simulate the peak stream flows well in the validation years, thus the R2 values in these years are relatively lower. The model also estimates discharge of the basin by changing temperature and precipitation. When the temperature is increased by 1 oC and precipitation by 10%, the annual discharge will increase by 14.8%. Similarly, when the temperature is increased by 2 0C and precipitation by 20%, the increase in annual discharge is by 44.1%. The results obtained suggest that the SRM can be used to estimate the river discharge of snow fed mountainous river basins of Afghanistan.
ACKNOWLEDGEMENTS
We would like to acknowledge the Contribution to High Asia Runoff from Ice and Snow (CHARIS) project of the University of Colorado at Boulder, USA funded by the USAID for financial support to carry out this research. We thank the reviewer Mary Jo Brodzik, The
University of Colorado (CU), Boulder, USA for her constructive comments and suggestions. We also thank to Alana Wilson, CU, Boulder, USA for her kind help to improve the manuscript in the initial phase. We would like to thank the Geosciences Faculty, Department of Hydro-Meteorology, Kabul University, the Ministry of Water and Power, Government of Afghanistan, the Ministry of Mines, Government of Afghanistan, the Geodesy and Cartography Office, Government of Afghanistan for providing necessary data. We would also like to thank all members of the Himalayan Cryosphere, Climate and Disaster Research Center (HiCCDRC), Kathmandu University for their valuable supports.
REFERENCES
Abudu, S., Cui, C., King, J. P., Abudukadeer, K., 2010. Comparison of performance of statistical models in forecasting monthly streamflow of Kizil River, China. Water Science and Engineering, 3 (3), 269-281.
Dwyer, M. J., & Schmidt, G. (2006). The MODIS reprojection tool. In Earth science satellite remote sensing (pp. 162-177). Springer Berlin Heidelberg.
Favre, R., Kamal, G. M., 2004. Watershed ATLAS of Afghanistan, 1st edition – working document for planners, Afghanistan Information Management Services, Kabul, Afghanistan.
Hall, D. K., Riggs, G. A., Salomonson, V. V., Giromamo, N. D., Bayr, K. J., 2002. MODIS Snow-Cover Products. Remote Sensing of Environment, 83, 181–94
Hedayatullah Arian, Rijan B. Kayastha, Bikas C. Bhattarai, Ahuti Shrestha, Hafizullah Rasouli & Richard Armstrong
August 2015118
Journal of Hydrology and Meteorology, Vol. 9, No. 1 SOHAM-Nepal
Hong, M. A., Guodong, C., 2003. A test of Snowmelt Runoff Model (SRM) for the Gongnaisi River basin in the Western Tianshan Mountains, China. Chinese Science Bulletin.48 (20), 2253 - 2259.
Leavesley, G. H., 1994. Modeling the effects of climate change on water resources – a review. Climatic Change 28, 159-177
Li, X., Williams, M. W., 2008.Snowmelt runoff modeling in an arid mountain watershed, Tarim Basin, China. Hydrological Processes, 7098.
Martinec, J., Rango, A., 1989. Accuracy of snowmelt runoff simulation, Nordic Hydrology 12(4/5), 265 – 274.
Martinec. J., Rango, A., Major, E., 1983. The Snowmelt-Runoff Model (SRM) User’s Manual NASA Ref. Publ. 1100 Washington, DC
Martinec, J., Rango, A., Roberts, R., 2008. Snowmelt Runoff Model (SRM) User’s guide Manual. New Mexico, State University, Las Cruces, USA.
Raghunath, H. M., 2006. Hydrology: Principle, Analysis and Design. New Age International (P) Ltd, New Delhi, India, 407-412.
Seidel, K., Martinec, J., 2004.Remote sensing in snow hydrology.Springer.
Tahir, A. A., Chevallier, P., Arnaud, Y., Ahmad, B., 2011. Snow cover dynamics and hydrological regime of the Hunza River basin, Karakoram Range, Northern Pakistan. Hydrology and Earth System Sciences 15 (7), 2275–2290.
Tekeli, A. E., Akyurek, Z., Sorman, A. A., Sensoy, A., Sorman, A. U., 2005. Using MODIS snow cover maps in modeling snowmelt runoff process in the eastern part of Turkey. Remote Sensing of Environment, 97, 216–230.
World Meteorological Organization (WMO), 1986.Intercomparison of Models of Snowmelt Runoff.Operational Hydrology Report. (Geneva: Secretariat of the World Meteorological Organization).
World Meteorological Organization (WMO), 1992.Simulated real-time intercomparison of hydrological models Operational Hydrology Report. (Geneva: World Meteorological Organization)
Application of the Snowmelt Runoff Model in the Salang River basin...