cep discussion paper no 1124 february 2012 market leadership
TRANSCRIPT

ISSN 2042-2695
CEP Discussion Paper No 1124
February 2012
Market Leadership Through Technology – Backward
Compatibility in the U.S. Handheld Video Game Industry
Jörg Claussen, Tobias Kretschmer and Thomas Spengler
Abstract The introduction of a new product generation forces incumbents in network industries to
rebuild their installed base to maintain an advantage over potential entrants. We study if
backward compatibility moderates this process of rebuilding an installed base. Using a
structural model of the U.S. market for handheld game consoles, we show that backward
compatibility lets incumbents transfer network effects from the old generation to the new to
some extent but that it also reduces supply of new software. We examine the tradeoff
between technological progress and backward compatibility and find that backward
compatibility matters less if there is a large technological leap between two generations. We
subsequently use our results to assess the role of backward compatibility as a strategy to
sustain market leadership.
Keywords: backward compatibility, market leadership, network effects, video games, two-
sided markets
JEL Classifications: L15, L82, O33
This paper was produced as part of the Centre’s Productivity and Innovation Programme. The
Centre for Economic Performance is financed by the Economic and Social Research Council.
Acknowledgements We thank participants at EARIE 2009, seminar participants at Universidad Carlos III Madrid,
European Business School, EM Lyon, Hebrew University Jerusalem, INSEAD, LMU
Munich, TU Munich, Tel Aviv University, and Albert Banal-Estanol, Mélisande Cardona,
Sofronis Clerides, Thorsten Grohsjean, Erik Lehmann, Tim Simcoe, Mariana Stamm, Jan
Tonon, Stefan Wagner and Martin Watzinger for helpful comments and discussions. We
acknowledge financial support from Deutsche Telekom Foundation and Vodafone R&D.
Jörg Claussen is a Postdoc at the Ifo Institute for Economic Research at the University
of Munich. Tobias Kretschmer is an Associate in the Productivity and Innovation Programme
at the Centre for Economic Performance, London School of Economics. He is also a
Professor of Management at the University of Munich and Department Head at the Ifo
Institute. Thomas Spengler is a Management Consultant.
Published by
Centre for Economic Performance
London School of Economics and Political Science
Houghton Street
London WC2A 2AE
All rights reserved. No part of this publication may be reproduced, stored in a retrieval
system or transmitted in any form or by any means without the prior permission in writing of
the publisher nor be issued to the public or circulated in any form other than that in which it
is published.
Requests for permission to reproduce any article or part of the Working Paper should be sent
to the editor at the above address.
J. Claussen, T. Kretschmer and T. Spengler, submitted 2012
1
1. Introduction
Firms frequently achieve a position of (temporary) market leadership in high-technology
industries (Lee et al. 2010, Wade 1995). Especially in the early stages of a technology’s life
cycle, this can lead to a dominant design for a technology (Suarez and Utterback 1995). In
industries with significant network effects, the tendency for an industry (or a technological
generation) to be dominated by a single firm or standard is especially strong (Arthur 1989).
This pattern of market leadership in technology-intensive industries creates incentives for
firms to invest in continuous learning (Schilling 2002), build a technological community
(Wade 1995), exploit complementarities across products (Lee et al. 2010), or engage in
aggressive pricing (De Figueiredo and Silverman 2007), among others. Securing an early lead
can therefore translate into a competitive advantage throughout a technological generation
(Arthur 1989, Mascarenhas 1992, Lieberman 1989).
Interestingly, in network industries, market leadership often persists across
generations, which suggests that providers of successful technologies can carry over some of
their dominance to future generations. The strategy literature identifies a number of
mechanisms by which this intergenerational transfer of market leadership can take place. One
stream of literature proposes that incumbent firms possess dynamic capabilities developed
from prior generations that are useful in the new generation (De Figueiredo and Silverman
2007, Chen et al. 2012, Danneels 2002, Kotha et al. 2010, Eggers 2012). The core logic here
is that firms are better at managing a new technology because they have learned how to do so
in a prior one. Another line of research suggests that firms utilize complementary assets
acquired in a previous product generation (Rothaermel and Boeker 2008, Hill and
Rothaermel 2003, Jones 2003, Tripsas 1997). A specific form of leveraging complementary
assets from a previous technological generation is to maintain backward compatibility with
the old generation (Shapiro and Varian 1999).
Our paper studies if backward compatibility by the market leader can be a strategy to
sustain market leadership across generations. We pose three questions about the nature and
implications of backward compatibility in markets with network effects:
1. How does backward compatibility influence demand for a new product generation?
2. How does backward compatibility affect the supply of new complementary products?
3. Are the effects of backward compatibility moderated by technological progress?
2
We analyze the U.S. market for handheld game consoles, which is well-suited for our
questions because i) backward compatibility is possible, but not necessary and ii) generation
changes can be identified clearly. Handheld consoles are especially interesting as they exhibit
different degrees of technological change across generations, so we can analyze the tradeoff
between backward compatibility and technological progress across generations. Existing
work in the market for home video game consoles studies asymmetric network effects
(Shankar and Bayus 2003), changes of indirect network effects over the product life cycle
(Clements and Ohashi 2005), software exclusivity (Corts and Lederman 2009) and
blockbuster software (Stremersch and Binken 2009). While these papers handle multiple
generations they do not explore how backward compatibility affects generational change and
market leadership, except for Clements and Ohashi (2005), who address backward
compatibility by adding available games for the Playstation 1 to those of the Playstation 2.
The theoretical literature on cross-generational or ‘vertical’ compatibility (Katz and
Shapiro 1994) studies firm incentives for backward compatibility. Waldman (1993) and Choi
(1994) find that price discrimination increases compatibility incentives, while Kende (1994)
argues that backward compatibility is more likely as valuations for old and new technologies
are similar and building an installed base of complementary products is expensive. These
results are confirmed in a simulation model by Lee et al. (2003), who find that low valuation
for backward compatibility and a small installed base advantage of the old generation render
backward compatibility less likely. Nahm (2008) finds that profits for the incumbent are
higher with backward compatibility, which may increase its incentives to upgrade beyond the
social optimum (Ellison and Fudenberg 2000). From a demand perspective, Shy (1996) finds
that backward compatibility increases the rate of new technology adoption.
The empirical literature on cross-generational compatibility finds that backward
compatibility helps carry over some installed base advantage to future generations. Liikanen
et al. (2004) and Koski and Kretschmer (2005) study intergenerational effects between the
first and second generations of mobile telephony and confirm the positive impact of
backward compatibility. Greenstein (1993) finds that buyers are more likely to select a new
mainframe computer system if they own a compatible predecessor system. Gandal et al.
(2000) study audio technologies and run a counterfactual by assuming backward
compatibility of CD and vinyl. Compatibility would have accelerated diffusion by 1.5 years.
We estimate demand for handheld video consoles as well as supply of game titles.
Our estimation strategy builds on Clements and Ohashi (2005), extending their approach to
account for backward compatibility, console age and the level of technological progress from
3
one generation to the next. Further, we identify console characteristics to allow for a
meaningful comparison between the effects of backward compatibility and increased console
performance. In line with prior work, we find that backward compatibility positively affects
demand for a new generation. In addition, we find that: i) backward compatibility works
through the installed base of software of the compatible parent generation, ii) it increases
demand for hardware, but decreases supply of software, and iii) backward compatibility
matters less if there is a large technological leap between two generations.
We capture a (demand-enhancing) direct and a (demand-reducing) indirect effect of
backward compatibility. The former directly influences the adoption decision through the
installed base of software for the compatible parent generations. This effect weakens for
higher technological leaps between generations. The latter works indirectly as old software
partly substitutes for new software and thus lowers new software demand, reducing software
supply, which in turn decreases hardware demand. The demand-enhancing effect outweighs
the demand-reducing effect so that backward compatibility helps transfer network effects
across generations. Indeed, we find that the market leader, Nintendo, was able to maintain its
market leadership across multiple generations through a strategy of backward compatibility.
This paper is structured as follows. We first give an overview of the U.S. market for
handheld game consoles. We then develop our hypotheses and test them using a model of
hardware demand and software supply. A discussion of our results follows. Further, we
analyze the role of backward compatibility in maintaining market leadership by performing a
counterfactual experiment and considering alternative explanations. Finally, we conclude.
2. Industry Background
The market for handheld game consoles first took off with the appearance of Nintendo’s
Game Boy in 1989, the first device to sell to the mass market (Forster 2005). Handheld game
consoles are – just as their (immobile) home video game counterparts – part of a system
comprising both hard- and software. Hardware manufacturers supply consoles and often also
software titles,1 while software providers concentrate on the development and distribution of
games. Given indirect network effects (Clements and Ohashi 2005), hardware suppliers have
an interest to encourage development of complementary products, namely game titles. Since
the ‘Atari shock’ in the early 1980s (when the game console market collapsed due to a sharp
increase in poor game titles), hardware suppliers actively manage quality of the market’s
1 On average, hardware manufacturers produced 12.8% of game titles for their consoles.
4
software side: developers need to sign detailed licensing contracts which are then enforced by
legal and technological means such as security chips (Genakos 2001). This also prevents any
hardware manufacturer from developing consoles that are compatible with games for other
platforms.
Our sample ranges from 1995 to 2007.2 Industry observers typically separate consoles
into generations. In industry terminology, we study generations IV to VII (Forster 2005).
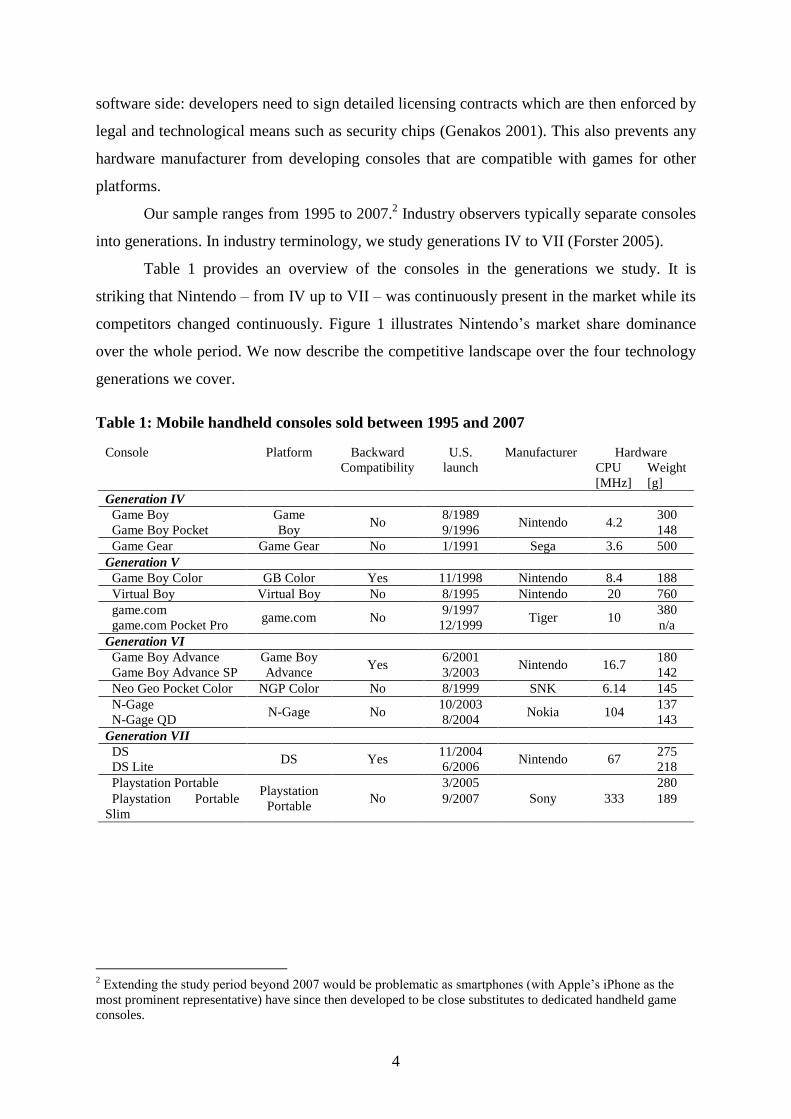
Table 1 provides an overview of the consoles in the generations we study. It is
striking that Nintendo – from IV up to VII – was continuously present in the market while its
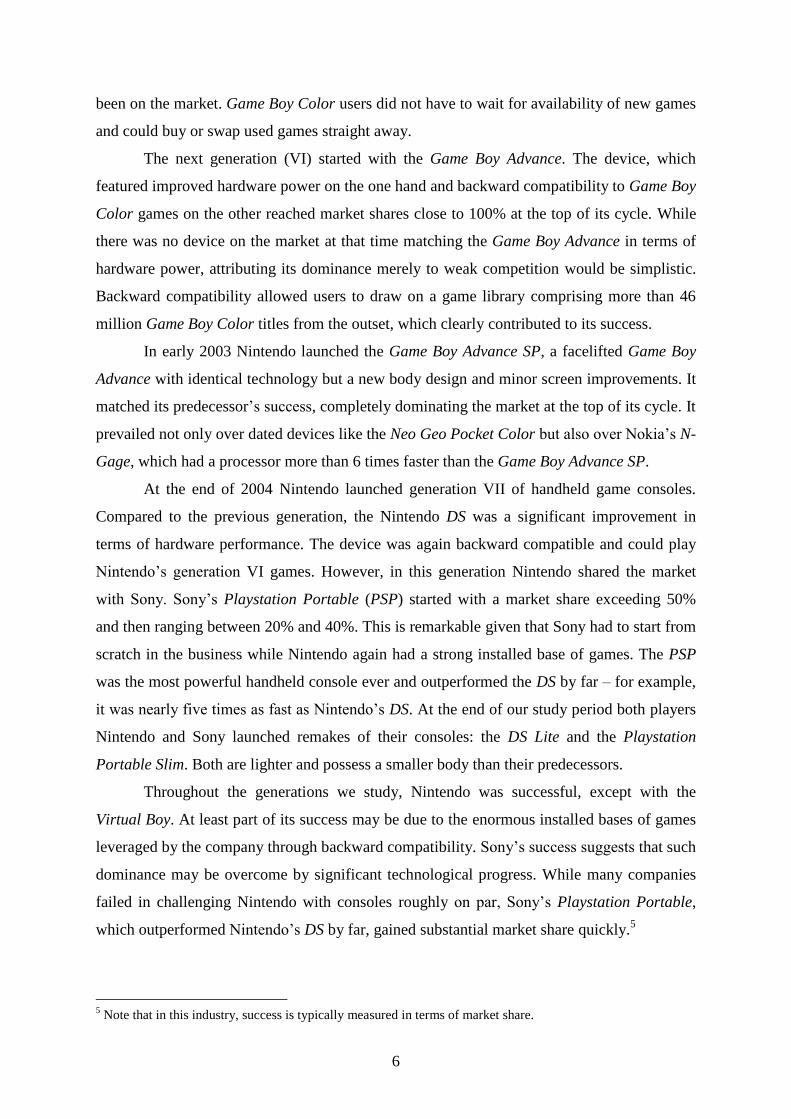
competitors changed continuously. Figure 1 illustrates Nintendo’s market share dominance
over the whole period. We now describe the competitive landscape over the four technology
generations we cover.
Table 1: Mobile handheld consoles sold between 1995 and 2007
Console Platform Backward U.S. Manufacturer Hardware
Compatibility launch CPU
[MHz]
Weight
[g]
Generation IV
Game Boy Game
Boy No
8/1989 Nintendo 4.2
300
Game Boy Pocket 9/1996 148
Game Gear Game Gear No 1/1991 Sega 3.6 500
Generation V
Game Boy Color GB Color Yes 11/1998 Nintendo 8.4 188
Virtual Boy Virtual Boy No 8/1995 Nintendo 20 760
game.com game.com No
9/1997 Tiger 10
380
game.com Pocket Pro 12/1999 n/a
Generation VI
Game Boy Advance Game Boy
Advance Yes
6/2001 Nintendo 16.7
180
Game Boy Advance SP 3/2003 142
Neo Geo Pocket Color NGP Color No 8/1999 SNK 6.14 145
N-Gage N-Gage No
10/2003 Nokia 104
137
N-Gage QD 8/2004 143
Generation VII
DS DS Yes
11/2004 Nintendo 67
275
DS Lite 6/2006 218
Playstation Portable Playstation
Portable No
3/2005
Sony 333
280
Playstation Portable
Slim
9/2007 189
2 Extending the study period beyond 2007 would be problematic as smartphones (with Apple’s iPhone as the
most prominent representative) have since then developed to be close substitutes to dedicated handheld game
consoles.

5
Figure 1: Monthly market shares from 1995 to 2007
Generation IV comprised Nintendo’s Game Boy and Game Boy Pocket, and Sega’s
Game Gear. At the start of our sample in 1995, these consoles had already been on the
market for some time. The devices basically shared the market, with Nintendo’s share
ranging between 60% and 80% and Sega’s moving between 20% and 40% accordingly.
The generation V console Game Boy Pocket reached market shares exceeding 80%
from 1998 on. This is remarkable considering that: i) the device was basically a remake with
a smaller body but the same hardware capabilities as its predecessor, the Game Boy, and ii)
Tiger Electronic’s Game.com, which had superior hardware capabilities, had also been
launched in the meantime. Nintendo’s Virtual Boy – in contrast to the company’s other
products – was comparably unsuccessful due to its bulkiness, problems during use3 and little
software available. It only reached substantial market share through a harsh price cut aimed at
reducing stockpiles.4 The Game.com Pocket Pro, a lighter and less bulky remake of the
Game.com, did not even reach 1% market share.
The next dominant device was Nintendo’s Game Boy Color, which again was not the
technically most advanced console of its time. Its main differentiating feature was the
enormous installed base of backward compatible software titles from its predecessors. While
its competitors did not have an installed base of existing games, the Game Boy Color could
build on millions of software copies sold in the almost ten years the Game Boy platform had
3 Nintendo Virtual Boy’s image generation was based on a combination of a LED unit and oscillating mirrors.
Users had to focus on these mirrors while playing which caused many players headaches. Hence, the Virtual
Boy bore a warning statement that it may cause headaches from the start of retail availability in the United States
(Kent 2002, pp. 513-515). 4 The maximum market share reached by the Virtual Boy was 44%, reached after cutting the initial price of more
than $160 to less than $30 in April 1997.
GAME BOY
GAME BOY POCKET
GAME BOY COLOR
GAME BOY ADVANCEGAME BOY ADVANCE SP
DS
GAME GEAR
DS LITE
PSP
0.2
.4.6
.81
Ma
rket S
ha
res
1995m1 1997m1 1999m1 2001m1 2003m1 2005m1 2007m1
Date
GAME BOY GAME GEAR
GAME BOY POCKET GAME BOY ADVANCE
GAME BOY ADVANCE SP GAME BOY COLOR
GAME.COM GAME.COM POCKET PRO
LYNX 2 N-GAGE
N-GAGE QD NEO GEO POCKET COLOR
NINTENDO DS NINTENDO DS LITE
PLAYSTATION PORTABLE
6
been on the market. Game Boy Color users did not have to wait for availability of new games
and could buy or swap used games straight away.
The next generation (VI) started with the Game Boy Advance. The device, which
featured improved hardware power on the one hand and backward compatibility to Game Boy
Color games on the other reached market shares close to 100% at the top of its cycle. While
there was no device on the market at that time matching the Game Boy Advance in terms of
hardware power, attributing its dominance merely to weak competition would be simplistic.
Backward compatibility allowed users to draw on a game library comprising more than 46
million Game Boy Color titles from the outset, which clearly contributed to its success.
In early 2003 Nintendo launched the Game Boy Advance SP, a facelifted Game Boy
Advance with identical technology but a new body design and minor screen improvements. It
matched its predecessor’s success, completely dominating the market at the top of its cycle. It
prevailed not only over dated devices like the Neo Geo Pocket Color but also over Nokia’s N-
Gage, which had a processor more than 6 times faster than the Game Boy Advance SP.
At the end of 2004 Nintendo launched generation VII of handheld game consoles.
Compared to the previous generation, the Nintendo DS was a significant improvement in
terms of hardware performance. The device was again backward compatible and could play
Nintendo’s generation VI games. However, in this generation Nintendo shared the market
with Sony. Sony’s Playstation Portable (PSP) started with a market share exceeding 50%
and then ranging between 20% and 40%. This is remarkable given that Sony had to start from
scratch in the business while Nintendo again had a strong installed base of games. The PSP
was the most powerful handheld console ever and outperformed the DS by far – for example,
it was nearly five times as fast as Nintendo’s DS. At the end of our study period both players
Nintendo and Sony launched remakes of their consoles: the DS Lite and the Playstation
Portable Slim. Both are lighter and possess a smaller body than their predecessors.
Throughout the generations we study, Nintendo was successful, except with the
Virtual Boy. At least part of its success may be due to the enormous installed bases of games
leveraged by the company through backward compatibility. Sony’s success suggests that such
dominance may be overcome by significant technological progress. While many companies
failed in challenging Nintendo with consoles roughly on par, Sony’s Playstation Portable,
which outperformed Nintendo’s DS by far, gained substantial market share quickly.5
5 Note that in this industry, success is typically measured in terms of market share.
7
3. Hypotheses
We now derive hypotheses on the effect of backward compatibility on hardware demand and
software supply. We first discuss how backward compatibility works directly and indirectly.
We then argue why we expect the effect of backward compatibility to be less strong for larger
technological leaps. To our knowledge, we are the first to empirically test both the positive
and negative effects of backward compatibility and the effect of technological progress.
3.1 Direct influence of backward compatibility on hardware demand
When an incumbent launches a technologically improved product generation, it usually faces
competition from two directions: from the incumbent’s parent generation and from products
offered by competing firms. The larger the incumbent’s installed base and the more
fragmented the new generation, the more difficult it is to overcome this startup problem,
causing excess inertia (Farrell and Saloner 1985, Kretschmer 2008) or technological lockout
(Schilling 2002). In markets with indirect network effects, firms face a chicken-and-egg
problem: it is not enough to offer a new video console; consumers also expect to choose from
a wide variety of games for it (Clements and Ohashi 2005, Corts and Lederman 2009, Gupta
et al. 1999, Gandal et al. 2000).
Gandal et al. (2000) identify three strategies for markets with indirect network effects
to overcome startup problems. Firms can (1) subsidize hardware, (2) increase software
availability by forward integration, and (3) make the product backward compatible with the
parent generation. All three strategies are used in the videogame market. Especially shortly
after product launch, consoles are often sold at or below marginal costs. Most console
manufacturers also develop and publish games on their own to increase availability of
software for their own consoles (Corts and Lederman 2009). The strategy we focus on in this
paper is the use of backward compatibility to transfer network effects across generations, also
widely used in the video games industry.
In the market for handheld game consoles, backward compatibility implies that game
cartridges of the parent generation can still be used with the new console generation. If the
physical format of the game cartridges changes, this may even require a second cartridge
slot.6 Backward compatibility is costly for the console manufacturer: the enclosure has to be
bigger, additional parts are needed, and the processor must be able to process the old games.
6 This was the case for the Game Boy Advance, which had one slot for old Game Boy Color cartridges and one
for new Game Boy Advance ones.
8
How will backward compatibility work exactly? Indirect network effects in the
videogame industry have so far been measured through the demand-increasing effect by the
number of games currently offered on the market (Clements and Ohashi 2005, Corts and
Lederman 2009). One way to assess the effect of backward compatibility could be to analyze
if and how much the number of games still available for the compatible parent generation
affect demand for the new generation. Alternatively, the stock (or installed base) of games
sold for the parent generation would proxy all games that could potentially be used with the
new console. This measure, which we feel is more plausible since buying old games for a
new console generation may be somewhat unattractive, implies that a larger installed base of
compatible games increases the likelihood that a potential adopter has access to some of these
games and thus benefit from backward compatibility. A person has access to old games if she
owns the parent console or gets old games from friends or through second-hand trading.7
The results by Greenstein’s (1993) support our intuition in another setting: he finds
the likelihood of adopting a new-generation mainframe to be higher if a firm owns a
previous-generation mainframe of the same brand. Given the switch of mainframes is a
binary (hardware) decision, while the software used on the previous mainframe can be used
with the new mainframe, the availability of existing software, and not sales or software
development post-hardware purchase, is what affects demand for hardware. This is
summarized in our first hypothesis:
Hypothesis 1: Backward compatibility increases hardware demand more the higher the
prior generation’s installed base of software.
3.2 The dark side of backward compatibility
In addition to the direct effect of complementary goods on the baseline product, backward
compatibility can also have a negative impact on the new generation. This negative impact
stems from the fact that complementary goods from both generations are substitutes for each
other. In the console market this implies that a new console can be used to run games from
the current generation as well as compatible games from the previous one. Given that most
games are provided by independent developers,8 this implies that developers of new games
will face more competition – not only from competitors in the same generation, but also from
their predecessors (Kretschmer 2008). Given the fixed-cost nature of game development,
7There is a sizable second-hand market for console games. E.g., on eBay.com, as of 24 January 2012, a total of
108,466 used games for mobile devices were offered. 8 In our sample, only 12% of games were published by one of the hardware manufacturers.
9
developers will expect less revenues to cover their (sunk) fixed costs, so that their incentive
to develop and release new games – basically, to enter the new generation – decreases (Sutton
1998). Therefore, what may be beneficial for the hardware market because there is a stock of
complementary goods available may be harmful for the software market because it decreases
the incentives to develop software for the new generation. This is summarized in our second
hypothesis:
Hypothesis 2: Backward compatibility decreases supply of software titles for the new
generation more the higher the prior generation’s installed base of
software.
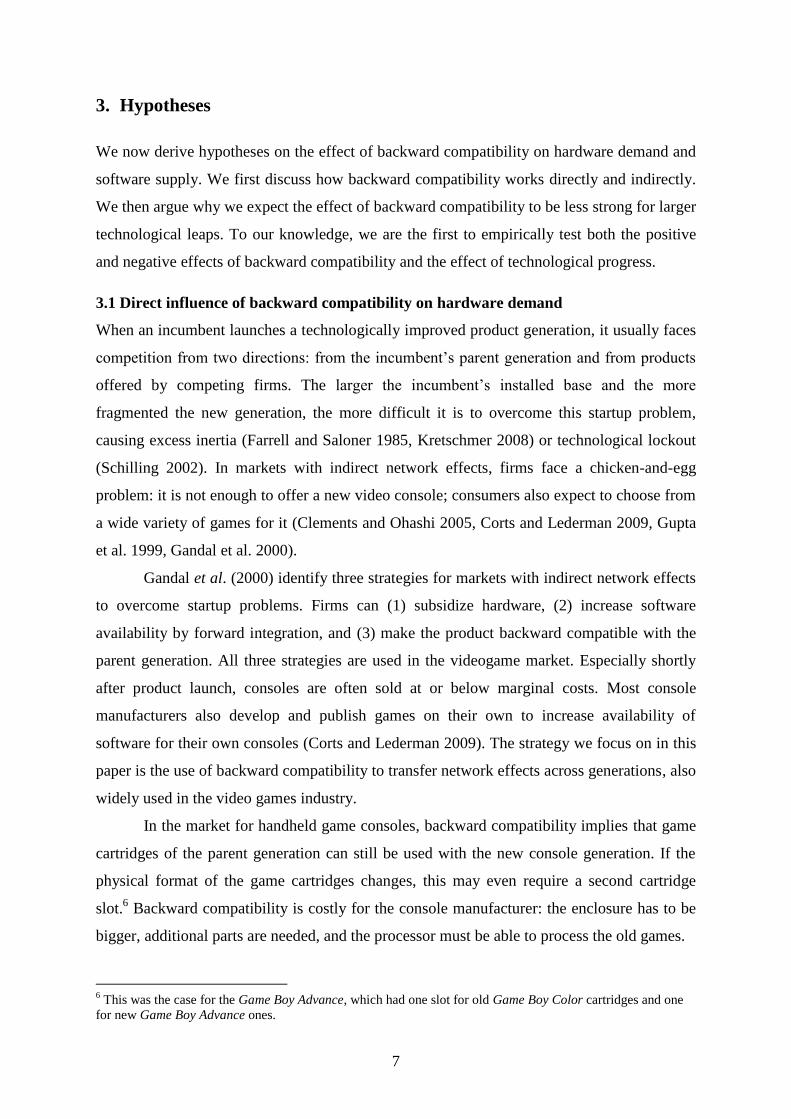
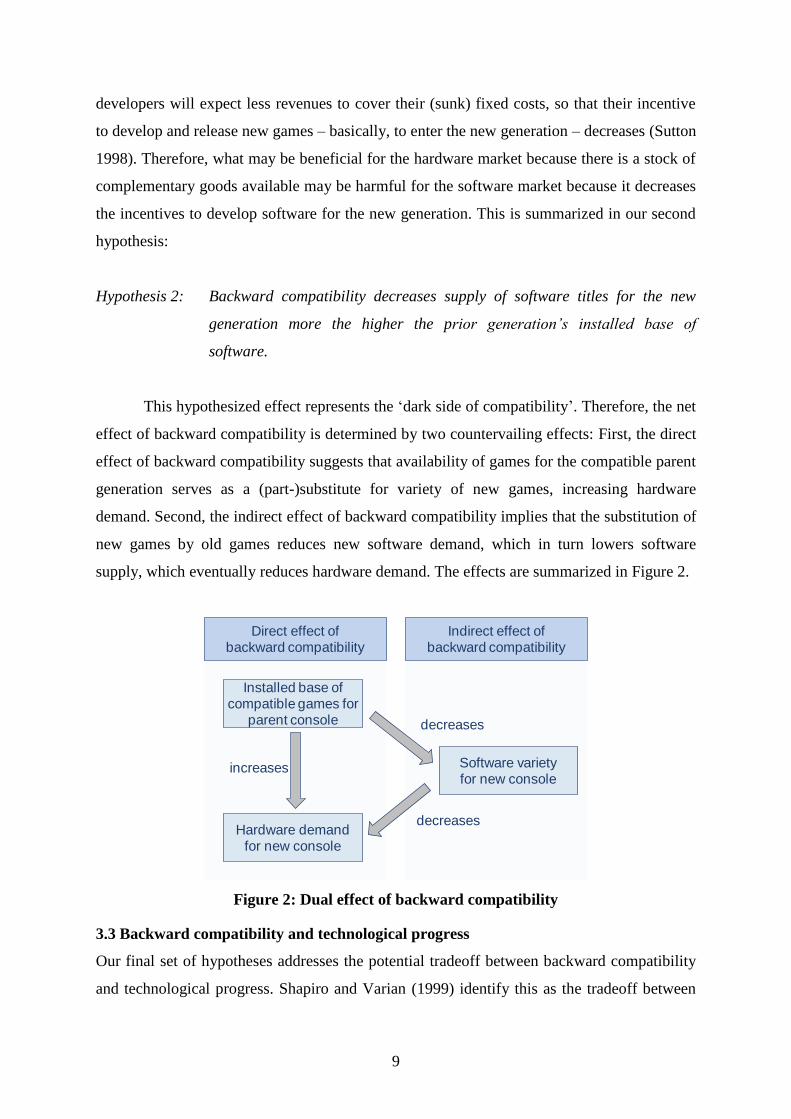
This hypothesized effect represents the ‘dark side of compatibility’. Therefore, the net
effect of backward compatibility is determined by two countervailing effects: First, the direct
effect of backward compatibility suggests that availability of games for the compatible parent
generation serves as a (part-)substitute for variety of new games, increasing hardware
demand. Second, the indirect effect of backward compatibility implies that the substitution of
new games by old games reduces new software demand, which in turn lowers software
supply, which eventually reduces hardware demand. The effects are summarized in Figure 2.
Figure 2: Dual effect of backward compatibility
3.3 Backward compatibility and technological progress
Our final set of hypotheses addresses the potential tradeoff between backward compatibility
and technological progress. Shapiro and Varian (1999) identify this as the tradeoff between
Direct effect of backward compatibility
Installed base of compatible games for
parent console
Hardware demand for new console
increases Software variety for new console
decreases
decreases
Indirect effect of backward compatibility
10
‘evolution’ (ensuring backward compatibility but offering limited technological
improvement) and ‘revolution’ (sacrificing backward compatibility, but offering drastically
increased performance) strategies. However, Shapiro and Varian (1999) conceptualize these
as decisions based on technological restrictions. The argument is that significant performance
increases can only be secured by using the latest technology, which in turn makes it more
difficult or costly to maintain backward compatibility. In our empirical setting, backward
compatibility is achieved without any performance losses (i.e. an old game runs just as well
on a new console as on an old one), so that one might assume that backward compatibility is
perfect and that technological improvements affect demand in general, but not the effect of
backward compatibility. In other words, for perfect compatibility the degree of
substitutability between old and new-generation games is independent of the technological
gap between the old and the new generation console.
However, the degree of substitutability rests on the extent to which games exploit the
technical capabilities of a particular console. As games for the old generation were designed
with a different set of technological restrictions, new games will differ significantly in their
performance especially if the set of restrictions imposed by the current generation console has
changed considerably (Shy 1996). Our empirical setting lets us identify the relative
importance of technological improvement and backward compatibility if both are present.
We expect technological progress and backward compatibility to be substitutes –
however, unlike Shapiro and Varian (1999) we assume substitutability to be consumer-driven
rather technologically determined. The degree of substitutability of old and new games
depends on the relative performance of the two game generations and backward
compatibility. As a large technological improvement on the hardware side permits the design
of better (i.e. more elaborately programmed) games, an old game will be a worse substitute as
the technological frontier is pushed out. We thus expect technological progress to have a
moderating effect on both the demand- and supply side effects of backward compatibility,
which is summarized in Hypotheses 3a and 3b:
Hypothesis 3a: The positive effect of backward compatibility on hardware demand is
negatively moderated by the degree of technological progress between
generations.
Hypothesis 3b: The negative effect of backward compatibility on software supply is
negatively moderated by the degree of technological progress between
generations.
11
4. Data and Estimation Model
4.1 Data
Data sources
The core data set for our analysis comes from the market research firm NPD Group and
consists of monthly unit sales and revenues in the market for handheld game consoles in the
U.S. for the period from 1/1995 to 11/2007.9 While, to the best of our knowledge, we are the
first to use the data about handheld game consoles, NPD data on video consoles has already
been used for several other studies (Shankar and Bayus 2003, Clements and Ohashi 2005,
Corts and Lederman 2009, Stremersch and Binken 2009, Mollick 2012).
Data on games for the different platforms is also supplied by NPD Group. The
software data consists of monthly unit sales and revenue data for all available game titles. For
each game title, the associated platform is reported. Note that game data is assigned on a
platform (not console) level. We define a platform by a common game format. A platform
can therefore consist of a single console (as for the Game Boy Color) or a family of consoles
(as for the Game Boy and Game Boy Pocket) that use the same game format but are distinct
regarding their hardware sales.10
Data on technical characteristics of the different consoles are also matched to our
data. We use two variables representing the key dimensions that influence user perception:
CPU speed as a proxy for processing power of the console and weight as a proxy for the
console’s mobility. The major data source for these technical characteristics is Forster (2005,
pp. 212-214). This is completed with specifications from suppliers’ websites, console
databases and console information websites.
All prices are deflated to enable comparison of console and game prices over the
entire period. We use the U.S. deflator provided by the International Monetary Fund.11
We
use monthly population estimates from the U.S. census bureau to proxy for market potential.
9 We include hardware-only sales, i.e. just the console, and packages comprising a console and a game. Both are
treated equally in the analysis as (i) package prices do not differ significantly from that of single consoles and
(ii) a clear separation is not possible with our data. Moreover, many consoles are rarely sold on their own. 10
The other platforms consisting of two consoles are Game Boy Advance and Game Boy Advance SP, Nintendo
DS and Nintendo DS Lite, game.com and game.com Pocket Pro, N-Gage and N-Gage QD, as well as
Playstation Portable and Playstation Portable Slim. There are no platforms with three or more consoles in our
data set. 11
We used the International Monetary Fund’s World Economic Outlook Database for this.

12
Finally, we use USD-JPY exchange rates from the Pacific Exchange Rate Service12
for a
price instrument discussed later.
Variables
The variables are described in Table 2 and Table 3 reports summary statistics. In line with
Corts and Lederman (2009), we eliminate the influence from outdated consoles selling
remainders or products that never reached a wider audience by considering only devices that
sold more than 500 units in a given month.13
Table 2: Variable definitions
Variable Definition
Market share of console j at time t (relative to market potential)
Market share of the outside good (no console purchase)
( ) Within-group market share (share within the handheld market)
Available software titles for current format
Deflated console price (1995 prices)
Normalized weight of the console
Normalized CPU speed of the console
Installed base of consoles for the current platform format (millions)
Installed base of games for the compatible parent platform (millions)
Age of the console (months)
Percentage improvement of CPU to compatible parent platform
Table 3: Summary statistics
Variable N Mean SD Min Max
( ) 502 -8.69 2.09 -13.07 -4.69
( ( ) ) 502 -2.33 1.97 -7.71 0.00
502 259.04 233.27 3.00 844.00
502 95.94 54.69 20.39 298.23
502 0.00 0.99 -1.57 3.52
502 -0.01 0.98 -1.44 3.25
502 11.68 10.35 0.00 34.18
502 22.78 31.56 0.00 106.83
502 35.18 30.67 0.00 131.00
502 0.65 0.89 0.00 3.02
12
Available at http://fx.sauder.ubc.ca/. 13
The mean monthly total number of units sold is 627,068.
13
Market shares in the market for handheld game consoles ( ) are directly
calculated by dividing the monthly unit sales of console by the total units sold in a given
month. To derive and , we have to define potential market size first. Unlike Clements
and Ohashi (2005), who use the TV households to determine the number of potential buyers,
we use the U.S. population numbers as several people in a household can own handheld
consoles and handheld use is independent of TV ownership. From this, we derive , which
is a console’s market share of the market potential14
and , the market share of the outside
good, i.e. the share of potential consumers that do not have a console and do not buy one in
the given time period. By cumulating the unit sales data of hardware sales, we also derive
each platform’s hardware installed base 15 16. Finally, we divide revenue by units to
calculate each console’s average monthly price . All prices are reported in 1995 USD.
Software variety is taken from the NPD data. For every platform we count the
number of game titles with positive sales to obtain . Therefore, can decline over time
if game titles are no longer sold. We also create the software installed base of the compatible
preceding generation .
17
The last set of variables concerns the hardware characteristics of the handheld
consoles. The dataset covers a twelve-year period in which technological progress for
handheld game consoles was remarkable. For example, the mean CPU speed of active
consoles grew from 3.93 MHz in 01/1995 to 187.43 MHz in 12/2007. As the data covers the
entire period this causes problems in comparing devices’ capabilities. Comparing a 2007
console that is technically below average to the best device from 1995 would make the first
one look far too good. We therefore normalize all variables containing technical data by the
characteristics of contemporaneously active consoles. This is done by calculating yearly
mean values and standard deviations for CPU speed and console weight. The yearly mean
values and standard deviations obtained were then used to construct a z-score for each
14
The market potential is defined as the size of the population minus the number of people who already bought
a handheld console. 15
We do not depreciate the installed base as (absolute) console performance does not deteriorate over time. 16
At the start of our dataset (1/1995), Nintendo’s Game Boy and Sega’s Game Gear have had already been on
the market since 8/1998 and 1/1991. We therefore use data from http://vgchartz.com to derive the initial
installed base of 12.7 respectively 2.9 million units for the Game Boy and the Game Gear. Data is derived by
weighing the lifetime sales for Americas with the consoles’ 1995 U.S. share from total Americas sales. 17
As for the hardware installed base, the software installed base for Game Boy and Game Gear is not directly
available in our dataset. We therefore assume that the number of software titles sold per console in the years
prior to the beginning of our dataset equals the number of software titles sold for each console in 1995.
14
console. Finally, is derived as the percentage improvement of the CPU speed
compared to the CPU speed of the compatible parent generation.18
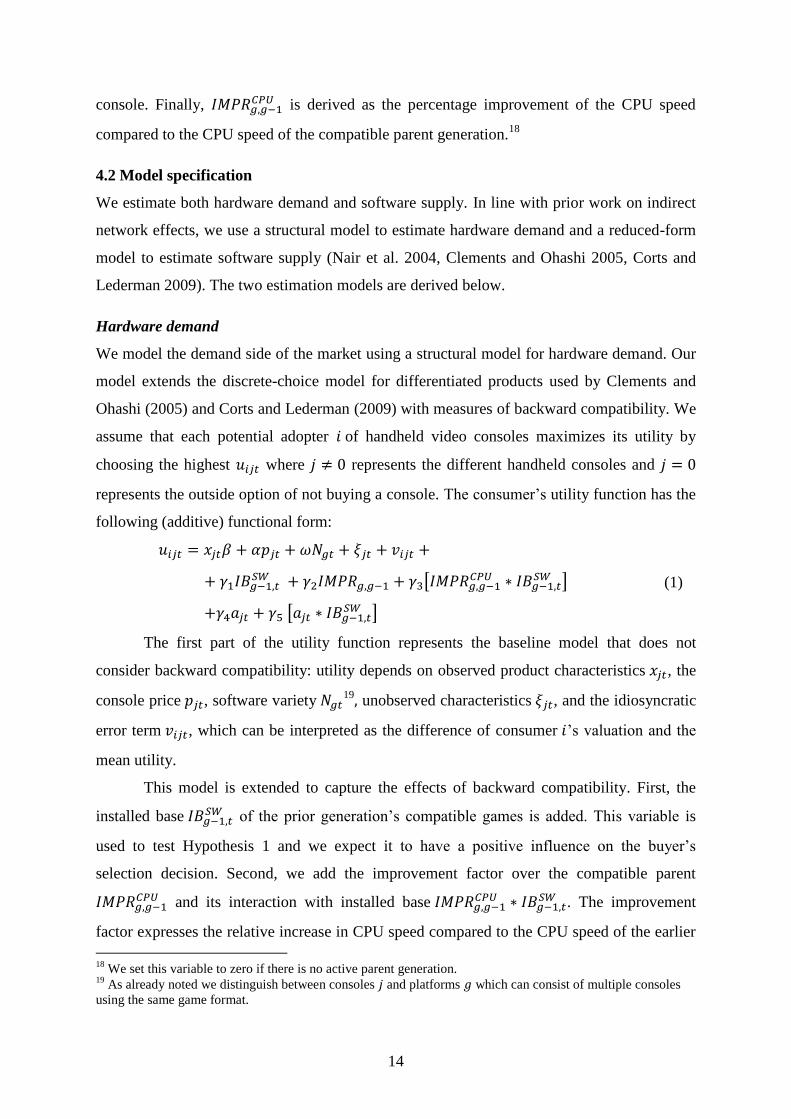
4.2 Model specification
We estimate both hardware demand and software supply. In line with prior work on indirect
network effects, we use a structural model to estimate hardware demand and a reduced-form
model to estimate software supply (Nair et al. 2004, Clements and Ohashi 2005, Corts and
Lederman 2009). The two estimation models are derived below.
Hardware demand
We model the demand side of the market using a structural model for hardware demand. Our
model extends the discrete-choice model for differentiated products used by Clements and
Ohashi (2005) and Corts and Lederman (2009) with measures of backward compatibility. We
assume that each potential adopter of handheld video consoles maximizes its utility by
choosing the highest where represents the different handheld consoles and
represents the outside option of not buying a console. The consumer’s utility function has the
following (additive) functional form:
[
]
[ ]
(1)
The first part of the utility function represents the baseline model that does not
consider backward compatibility: utility depends on observed product characteristics , the
console price , software variety 19 unobserved characteristics , and the idiosyncratic
error term , which can be interpreted as the difference of consumer ’s valuation and the
mean utility.
This model is extended to capture the effects of backward compatibility. First, the
installed base of the prior generation’s compatible games is added. This variable is
used to test Hypothesis 1 and we expect it to have a positive influence on the buyer’s
selection decision. Second, we add the improvement factor over the compatible parent
and its interaction with installed base
. The improvement
factor expresses the relative increase in CPU speed compared to the CPU speed of the earlier
18
We set this variable to zero if there is no active parent generation. 19
As already noted we distinguish between consoles and platforms which can consist of multiple consoles
using the same game format.
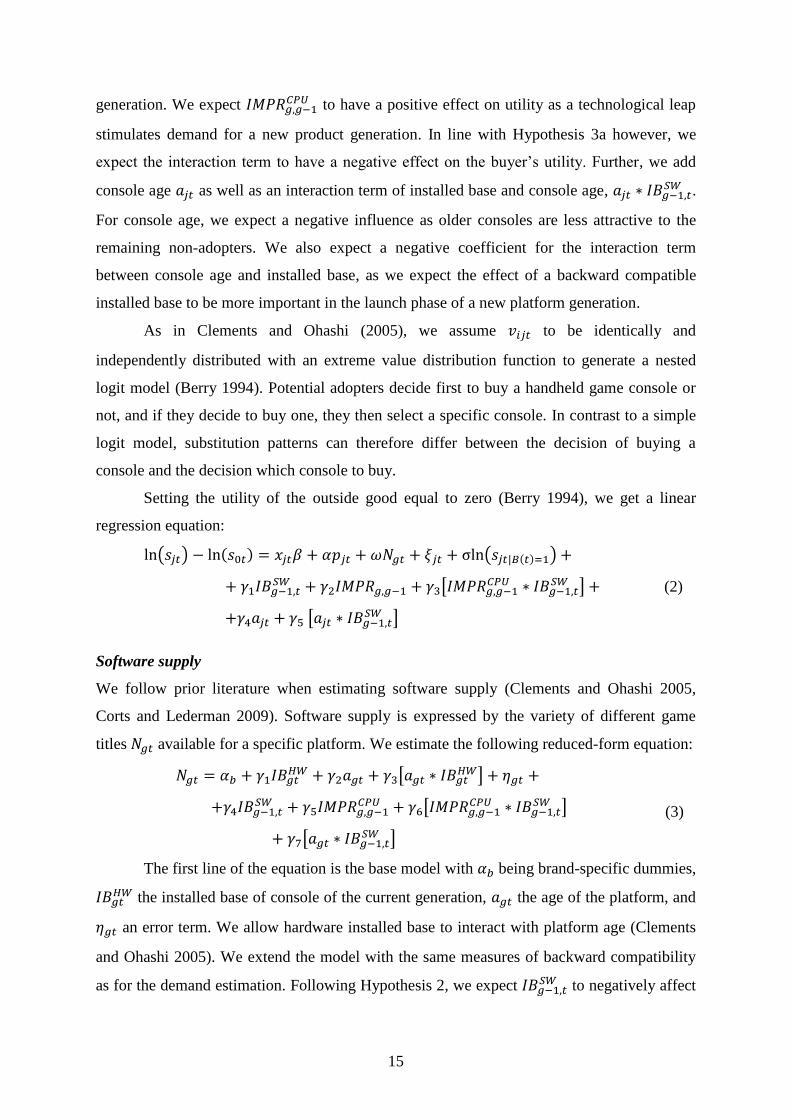
15
generation. We expect to have a positive effect on utility as a technological leap
stimulates demand for a new product generation. In line with Hypothesis 3a however, we
expect the interaction term to have a negative effect on the buyer’s utility. Further, we add
console age as well as an interaction term of installed base and console age, .
For console age, we expect a negative influence as older consoles are less attractive to the
remaining non-adopters. We also expect a negative coefficient for the interaction term
between console age and installed base, as we expect the effect of a backward compatible
installed base to be more important in the launch phase of a new platform generation.
As in Clements and Ohashi (2005), we assume to be identically and
independently distributed with an extreme value distribution function to generate a nested
logit model (Berry 1994). Potential adopters decide first to buy a handheld game console or
not, and if they decide to buy one, they then select a specific console. In contrast to a simple
logit model, substitution patterns can therefore differ between the decision of buying a
console and the decision which console to buy.
Setting the utility of the outside good equal to zero (Berry 1994), we get a linear
regression equation:
( ) ( ) ( ( ) )
[
]
[ ]
(2)
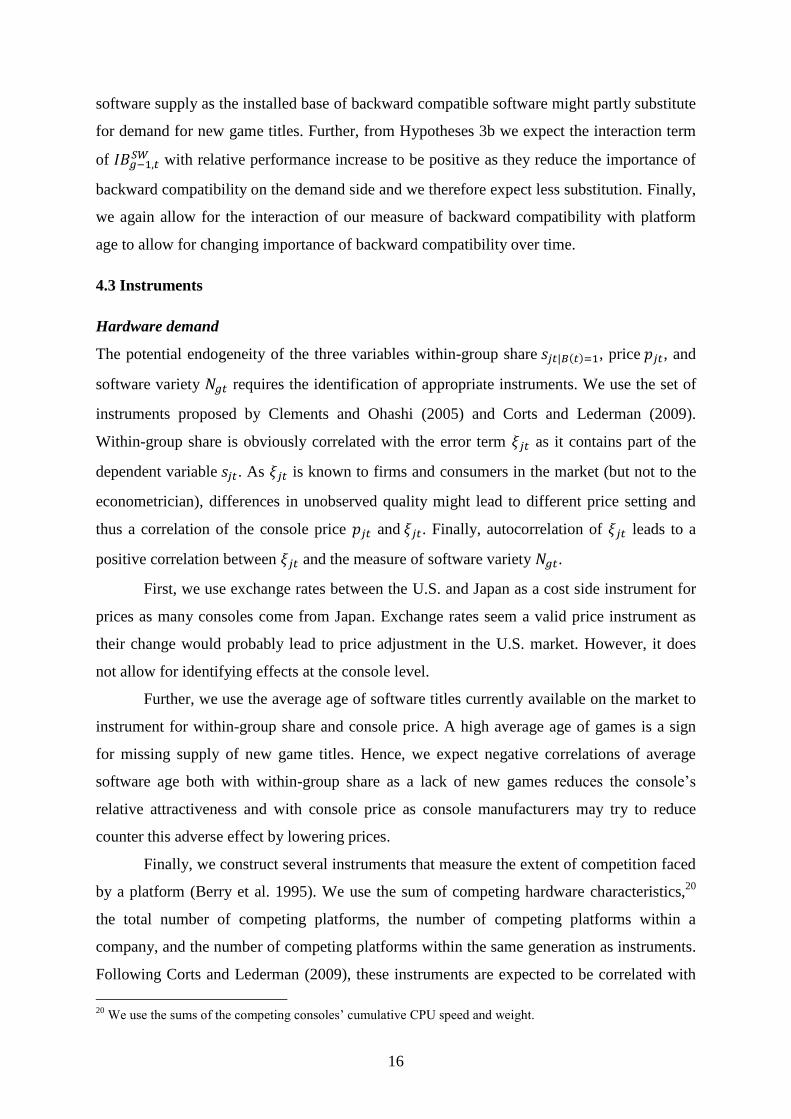
Software supply
We follow prior literature when estimating software supply (Clements and Ohashi 2005,
Corts and Lederman 2009). Software supply is expressed by the variety of different game
titles available for a specific platform. We estimate the following reduced-form equation:
[
]
[
]
[ ]
(3)
The first line of the equation is the base model with being brand-specific dummies,
the installed base of console of the current generation, the age of the platform, and
an error term. We allow hardware installed base to interact with platform age (Clements
and Ohashi 2005). We extend the model with the same measures of backward compatibility
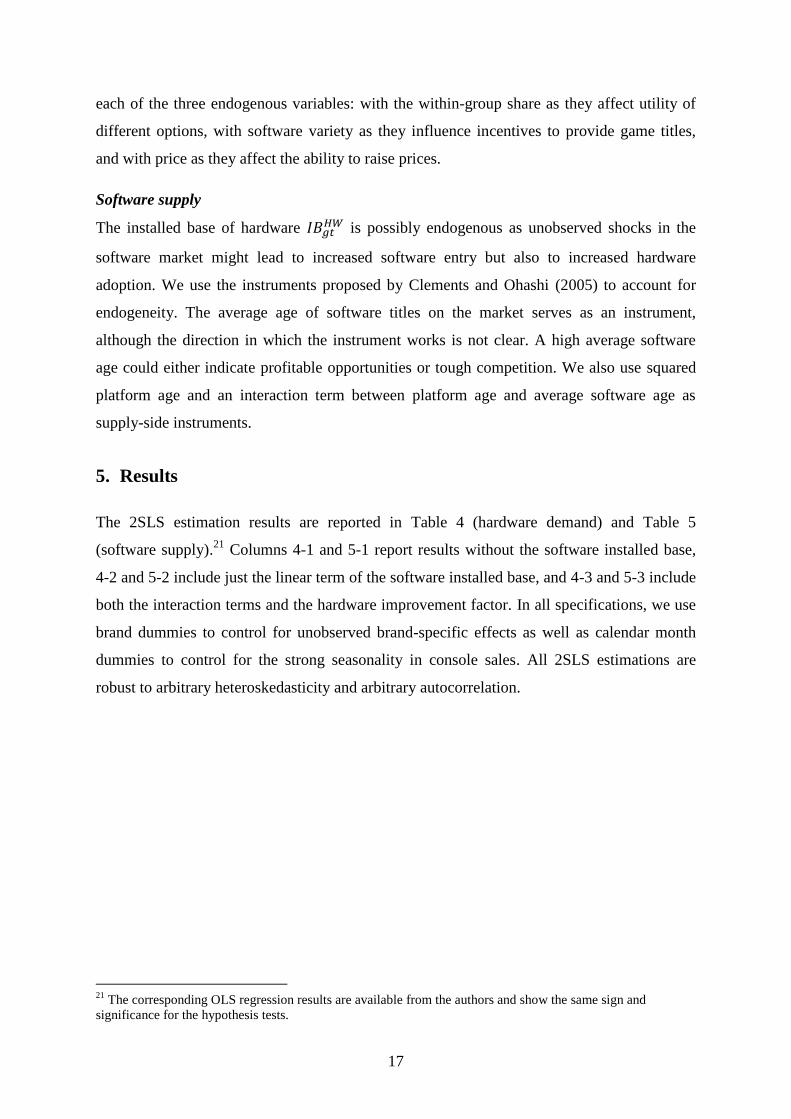
as for the demand estimation. Following Hypothesis 2, we expect to negatively affect
16
software supply as the installed base of backward compatible software might partly substitute
for demand for new game titles. Further, from Hypotheses 3b we expect the interaction term
of with relative performance increase to be positive as they reduce the importance of
backward compatibility on the demand side and we therefore expect less substitution. Finally,
we again allow for the interaction of our measure of backward compatibility with platform
age to allow for changing importance of backward compatibility over time.
4.3 Instruments
Hardware demand
The potential endogeneity of the three variables within-group share ( ) , price , and
software variety requires the identification of appropriate instruments. We use the set of
instruments proposed by Clements and Ohashi (2005) and Corts and Lederman (2009).
Within-group share is obviously correlated with the error term as it contains part of the
dependent variable . As is known to firms and consumers in the market (but not to the
econometrician), differences in unobserved quality might lead to different price setting and
thus a correlation of the console price and . Finally, autocorrelation of leads to a
positive correlation between and the measure of software variety .
First, we use exchange rates between the U.S. and Japan as a cost side instrument for
prices as many consoles come from Japan. Exchange rates seem a valid price instrument as
their change would probably lead to price adjustment in the U.S. market. However, it does
not allow for identifying effects at the console level.
Further, we use the average age of software titles currently available on the market to
instrument for within-group share and console price. A high average age of games is a sign
for missing supply of new game titles. Hence, we expect negative correlations of average
software age both with within-group share as a lack of new games reduces the console’s
relative attractiveness and with console price as console manufacturers may try to reduce
counter this adverse effect by lowering prices.
Finally, we construct several instruments that measure the extent of competition faced
by a platform (Berry et al. 1995). We use the sum of competing hardware characteristics,20
the total number of competing platforms, the number of competing platforms within a
company, and the number of competing platforms within the same generation as instruments.
Following Corts and Lederman (2009), these instruments are expected to be correlated with
20
We use the sums of the competing consoles’ cumulative CPU speed and weight.
17
each of the three endogenous variables: with the within-group share as they affect utility of
different options, with software variety as they influence incentives to provide game titles,
and with price as they affect the ability to raise prices.
Software supply
The installed base of hardware is possibly endogenous as unobserved shocks in the
software market might lead to increased software entry but also to increased hardware
adoption. We use the instruments proposed by Clements and Ohashi (2005) to account for
endogeneity. The average age of software titles on the market serves as an instrument,
although the direction in which the instrument works is not clear. A high average software
age could either indicate profitable opportunities or tough competition. We also use squared
platform age and an interaction term between platform age and average software age as
supply-side instruments.
5. Results
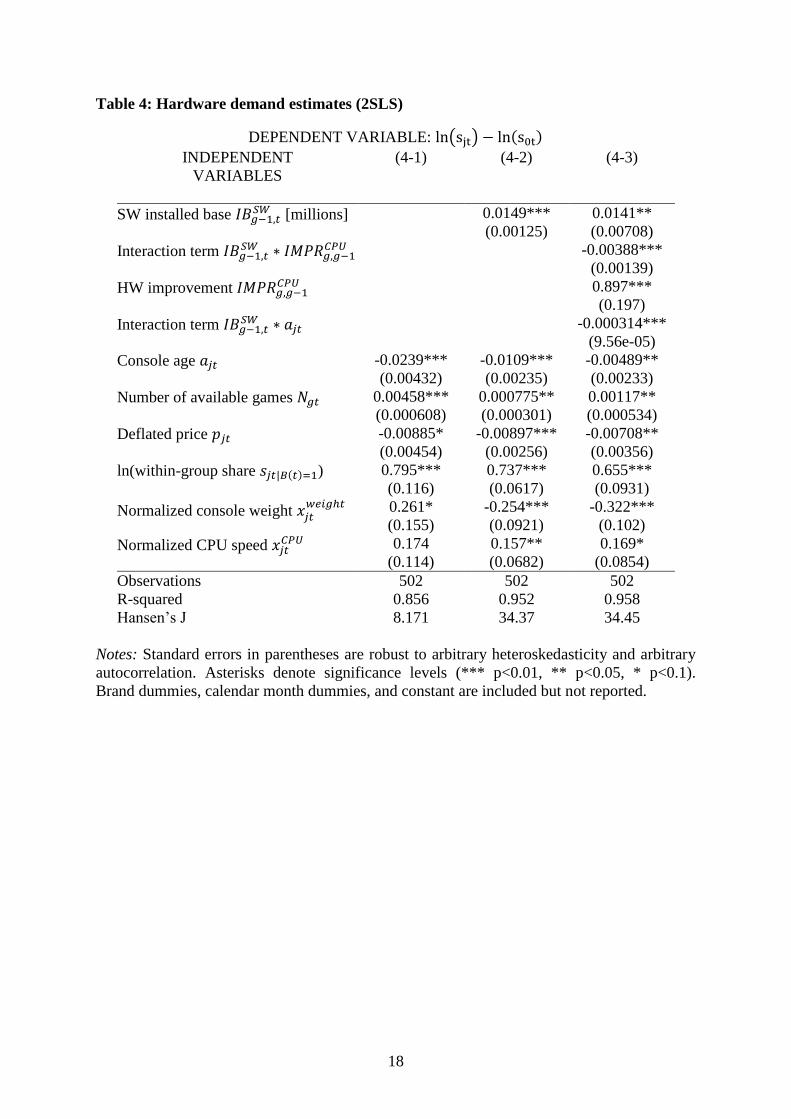
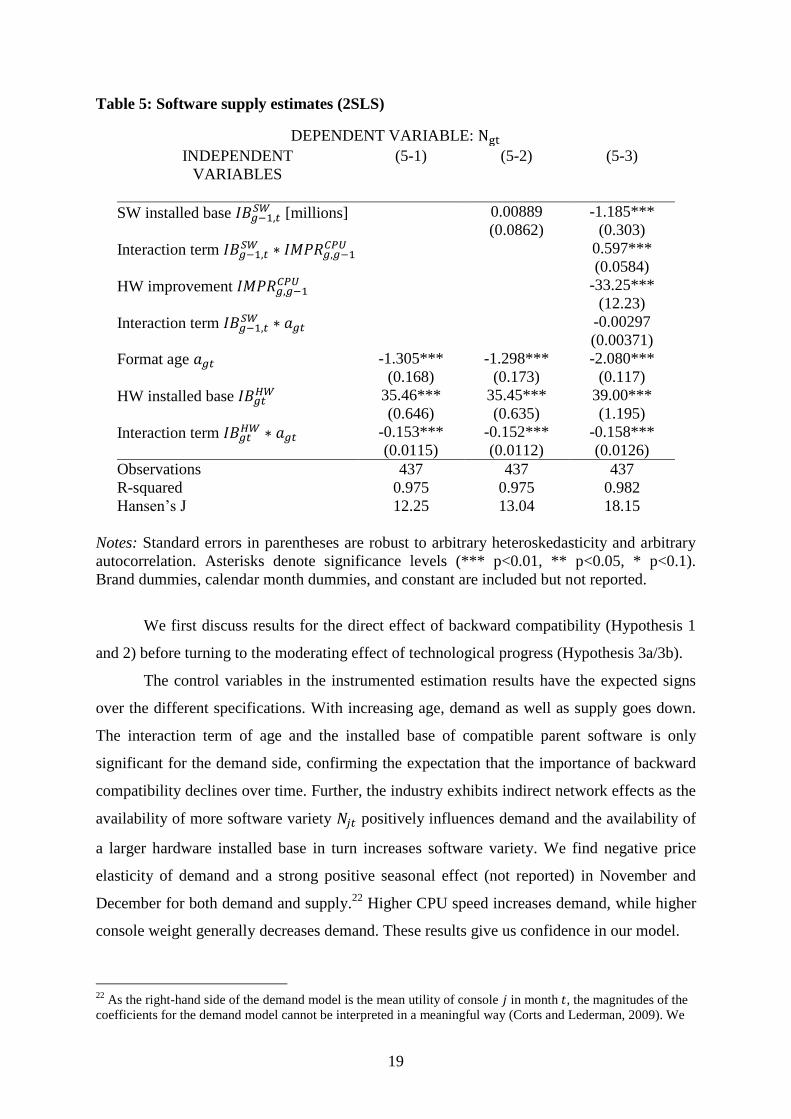
The 2SLS estimation results are reported in Table 4 (hardware demand) and Table 5
(software supply).21
Columns 4-1 and 5-1 report results without the software installed base,
4-2 and 5-2 include just the linear term of the software installed base, and 4-3 and 5-3 include
both the interaction terms and the hardware improvement factor. In all specifications, we use
brand dummies to control for unobserved brand-specific effects as well as calendar month
dummies to control for the strong seasonality in console sales. All 2SLS estimations are
robust to arbitrary heteroskedasticity and arbitrary autocorrelation.
21
The corresponding OLS regression results are available from the authors and show the same sign and
significance for the hypothesis tests.
18
Table 4: Hardware demand estimates (2SLS)
DEPENDENT VARIABLE: ( ) ( )
INDEPENDENT (4-1) (4-2) (4-3)
VARIABLES
SW installed base [millions] 0.0149*** 0.0141**
(0.00125) (0.00708)
Interaction term
-0.00388***
(0.00139)
HW improvement 0.897***
(0.197)
Interaction term -0.000314***
(9.56e-05)
Console age -0.0239*** -0.0109*** -0.00489**
(0.00432) (0.00235) (0.00233)
Number of available games 0.00458*** 0.000775** 0.00117**
(0.000608) (0.000301) (0.000534)
Deflated price -0.00885* -0.00897*** -0.00708**
(0.00454) (0.00256) (0.00356)
ln(within-group share ( ) ) 0.795*** 0.737*** 0.655***
(0.116) (0.0617) (0.0931)
Normalized console weight
0.261* -0.254*** -0.322***
(0.155) (0.0921) (0.102)
Normalized CPU speed 0.174 0.157** 0.169*
(0.114) (0.0682) (0.0854)
Observations 502 502 502
R-squared 0.856 0.952 0.958
Hansen’s J 8.171 34.37 34.45
Notes: Standard errors in parentheses are robust to arbitrary heteroskedasticity and arbitrary
autocorrelation. Asterisks denote significance levels (*** p<0.01, ** p<0.05, * p<0.1).
Brand dummies, calendar month dummies, and constant are included but not reported.
19
Table 5: Software supply estimates (2SLS)
DEPENDENT VARIABLE:
INDEPENDENT (5-1) (5-2) (5-3)
VARIABLES
SW installed base [millions] 0.00889 -1.185***
(0.0862) (0.303)
Interaction term
0.597***
(0.0584)
HW improvement -33.25***
(12.23)
Interaction term -0.00297
(0.00371)
Format age -1.305*** -1.298*** -2.080***
(0.168) (0.173) (0.117)
HW installed base 35.46*** 35.45*** 39.00***
(0.646) (0.635) (1.195)
Interaction term -0.153*** -0.152*** -0.158***
(0.0115) (0.0112) (0.0126)
Observations 437 437 437
R-squared 0.975 0.975 0.982
Hansen’s J 12.25 13.04 18.15
Notes: Standard errors in parentheses are robust to arbitrary heteroskedasticity and arbitrary
autocorrelation. Asterisks denote significance levels (*** p<0.01, ** p<0.05, * p<0.1).
Brand dummies, calendar month dummies, and constant are included but not reported.
We first discuss results for the direct effect of backward compatibility (Hypothesis 1
and 2) before turning to the moderating effect of technological progress (Hypothesis 3a/3b).
The control variables in the instrumented estimation results have the expected signs
over the different specifications. With increasing age, demand as well as supply goes down.
The interaction term of age and the installed base of compatible parent software is only
significant for the demand side, confirming the expectation that the importance of backward
compatibility declines over time. Further, the industry exhibits indirect network effects as the
availability of more software variety positively influences demand and the availability of
a larger hardware installed base in turn increases software variety. We find negative price
elasticity of demand and a strong positive seasonal effect (not reported) in November and
December for both demand and supply.22
Higher CPU speed increases demand, while higher
console weight generally decreases demand. These results give us confidence in our model.
22
As the right-hand side of the demand model is the mean utility of console in month , the magnitudes of the
coefficients for the demand model cannot be interpreted in a meaningful way (Corts and Lederman, 2009). We
20
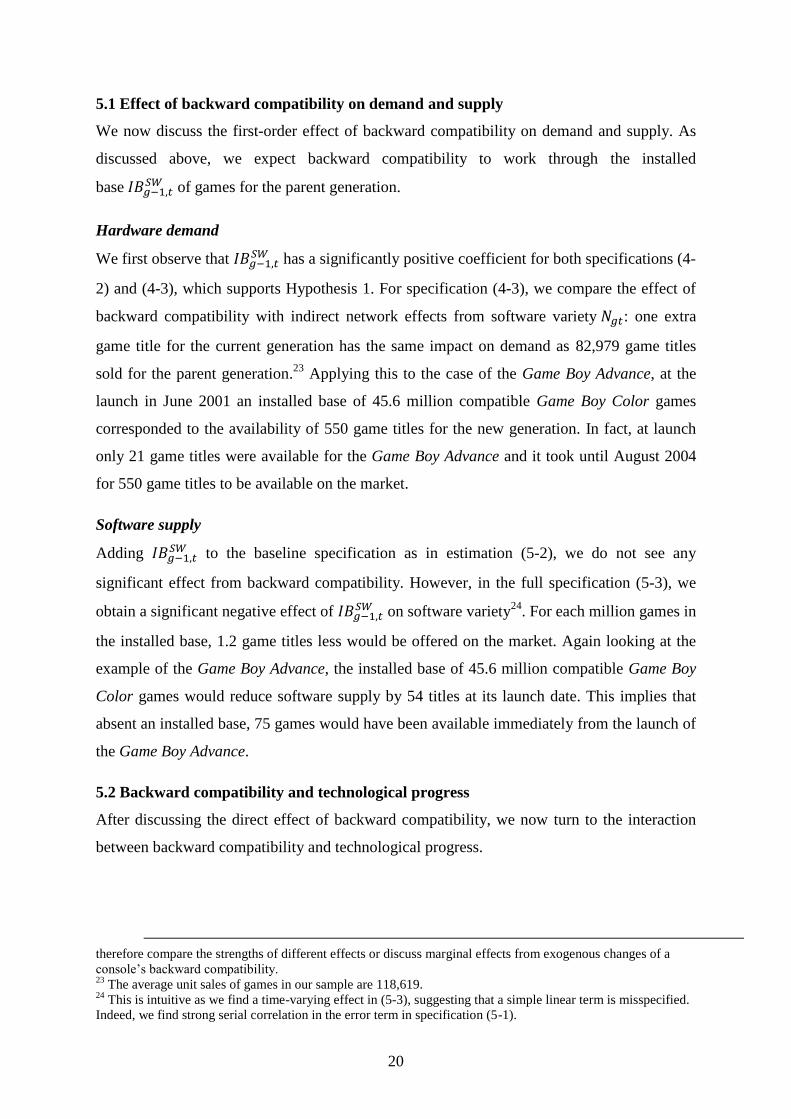
5.1 Effect of backward compatibility on demand and supply
We now discuss the first-order effect of backward compatibility on demand and supply. As
discussed above, we expect backward compatibility to work through the installed
base of games for the parent generation.
Hardware demand
We first observe that has a significantly positive coefficient for both specifications (4-
2) and (4-3), which supports Hypothesis 1. For specification (4-3), we compare the effect of
backward compatibility with indirect network effects from software variety : one extra
game title for the current generation has the same impact on demand as 82,979 game titles
sold for the parent generation.23
Applying this to the case of the Game Boy Advance, at the
launch in June 2001 an installed base of 45.6 million compatible Game Boy Color games
corresponded to the availability of 550 game titles for the new generation. In fact, at launch
only 21 game titles were available for the Game Boy Advance and it took until August 2004
for 550 game titles to be available on the market.
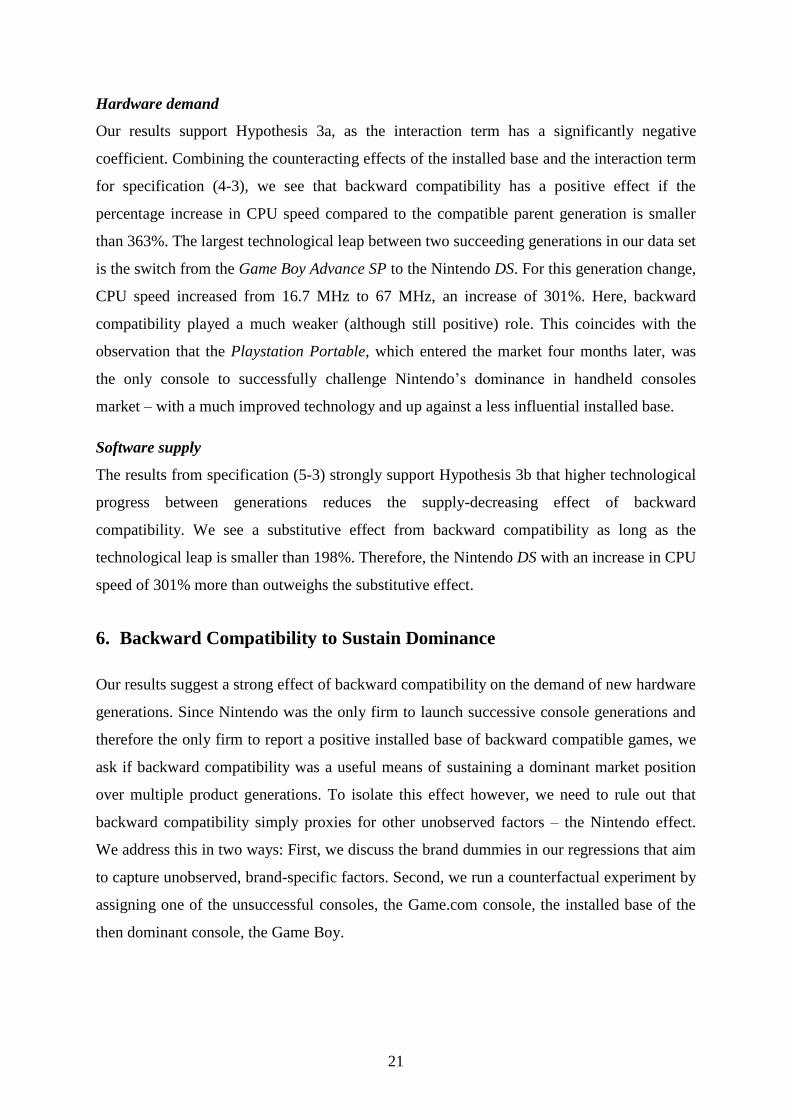
Software supply
Adding to the baseline specification as in estimation (5-2), we do not see any
significant effect from backward compatibility. However, in the full specification (5-3), we
obtain a significant negative effect of on software variety
24. For each million games in
the installed base, 1.2 game titles less would be offered on the market. Again looking at the
example of the Game Boy Advance, the installed base of 45.6 million compatible Game Boy
Color games would reduce software supply by 54 titles at its launch date. This implies that
absent an installed base, 75 games would have been available immediately from the launch of
the Game Boy Advance.
5.2 Backward compatibility and technological progress
After discussing the direct effect of backward compatibility, we now turn to the interaction
between backward compatibility and technological progress.
therefore compare the strengths of different effects or discuss marginal effects from exogenous changes of a
console’s backward compatibility. 23
The average unit sales of games in our sample are 118,619. 24
This is intuitive as we find a time-varying effect in (5-3), suggesting that a simple linear term is misspecified.
Indeed, we find strong serial correlation in the error term in specification (5-1).
21
Hardware demand
Our results support Hypothesis 3a, as the interaction term has a significantly negative
coefficient. Combining the counteracting effects of the installed base and the interaction term
for specification (4-3), we see that backward compatibility has a positive effect if the
percentage increase in CPU speed compared to the compatible parent generation is smaller
than 363%. The largest technological leap between two succeeding generations in our data set
is the switch from the Game Boy Advance SP to the Nintendo DS. For this generation change,
CPU speed increased from 16.7 MHz to 67 MHz, an increase of 301%. Here, backward
compatibility played a much weaker (although still positive) role. This coincides with the
observation that the Playstation Portable, which entered the market four months later, was
the only console to successfully challenge Nintendo’s dominance in handheld consoles
market – with a much improved technology and up against a less influential installed base.
Software supply
The results from specification (5-3) strongly support Hypothesis 3b that higher technological
progress between generations reduces the supply-decreasing effect of backward
compatibility. We see a substitutive effect from backward compatibility as long as the
technological leap is smaller than 198%. Therefore, the Nintendo DS with an increase in CPU
speed of 301% more than outweighs the substitutive effect.
6. Backward Compatibility to Sustain Dominance
Our results suggest a strong effect of backward compatibility on the demand of new hardware
generations. Since Nintendo was the only firm to launch successive console generations and
therefore the only firm to report a positive installed base of backward compatible games, we
ask if backward compatibility was a useful means of sustaining a dominant market position
over multiple product generations. To isolate this effect however, we need to rule out that
backward compatibility simply proxies for other unobserved factors – the Nintendo effect.
We address this in two ways: First, we discuss the brand dummies in our regressions that aim
to capture unobserved, brand-specific factors. Second, we run a counterfactual experiment by
assigning one of the unsuccessful consoles, the Game.com console, the installed base of the
then dominant console, the Game Boy.
22
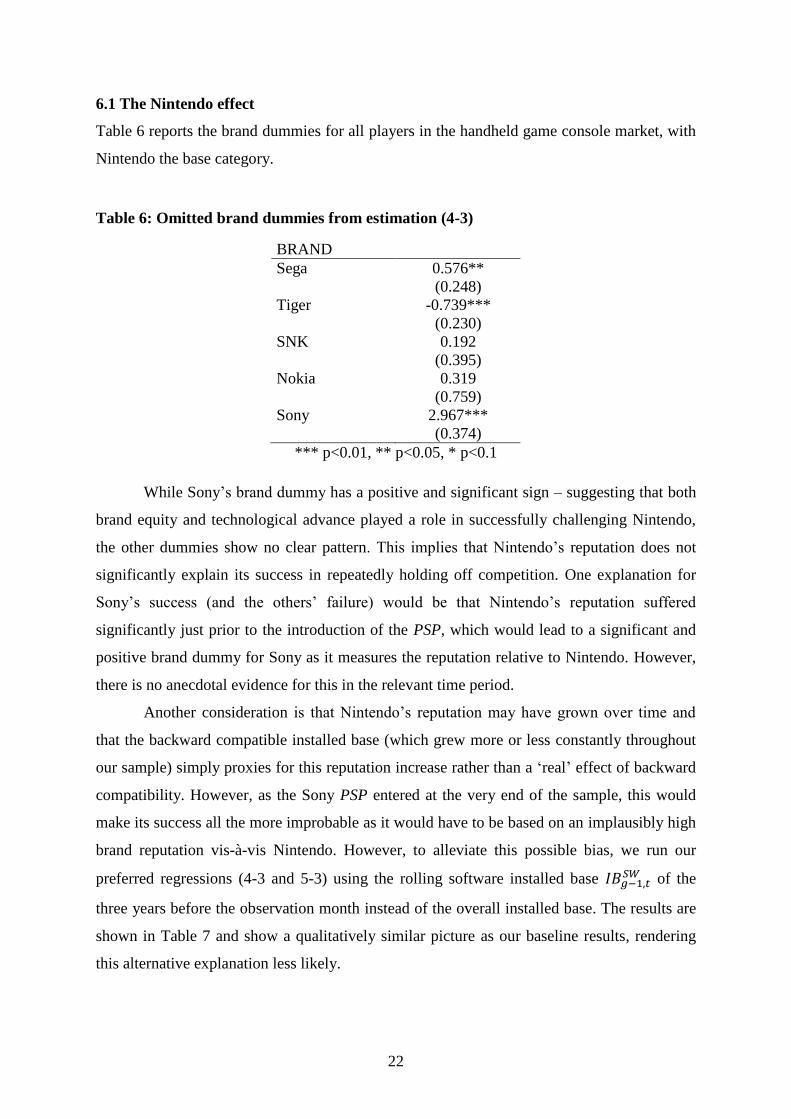
6.1 The Nintendo effect
Table 6 reports the brand dummies for all players in the handheld game console market, with
Nintendo the base category.
Table 6: Omitted brand dummies from estimation (4-3)
BRAND
Sega 0.576**
(0.248)
Tiger -0.739***
(0.230)
SNK 0.192
(0.395)
Nokia 0.319
(0.759)
Sony 2.967***
(0.374)
*** p<0.01, ** p<0.05, * p<0.1
While Sony’s brand dummy has a positive and significant sign – suggesting that both
brand equity and technological advance played a role in successfully challenging Nintendo,
the other dummies show no clear pattern. This implies that Nintendo’s reputation does not
significantly explain its success in repeatedly holding off competition. One explanation for
Sony’s success (and the others’ failure) would be that Nintendo’s reputation suffered
significantly just prior to the introduction of the PSP, which would lead to a significant and
positive brand dummy for Sony as it measures the reputation relative to Nintendo. However,
there is no anecdotal evidence for this in the relevant time period.
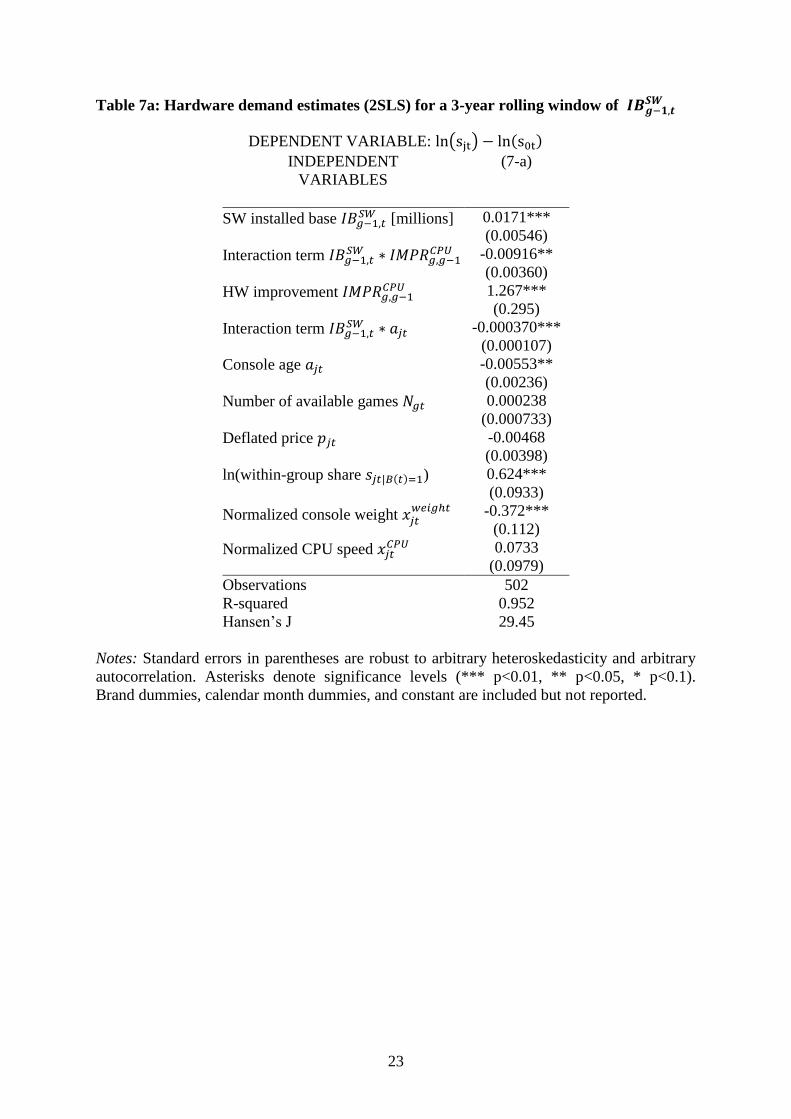
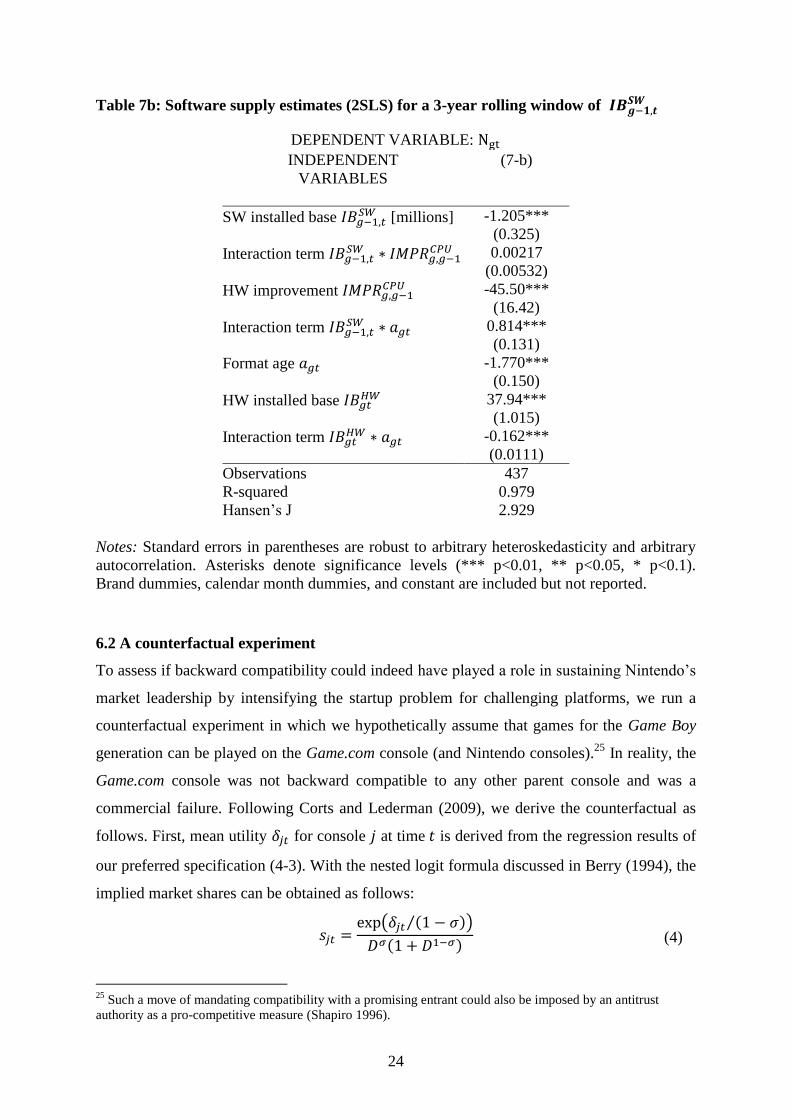
Another consideration is that Nintendo’s reputation may have grown over time and
that the backward compatible installed base (which grew more or less constantly throughout
our sample) simply proxies for this reputation increase rather than a ‘real’ effect of backward
compatibility. However, as the Sony PSP entered at the very end of the sample, this would
make its success all the more improbable as it would have to be based on an implausibly high
brand reputation vis-à-vis Nintendo. However, to alleviate this possible bias, we run our
preferred regressions (4-3 and 5-3) using the rolling software installed base of the
three years before the observation month instead of the overall installed base. The results are
shown in Table 7 and show a qualitatively similar picture as our baseline results, rendering
this alternative explanation less likely.
23
Table 7a: Hardware demand estimates (2SLS) for a 3-year rolling window of
DEPENDENT VARIABLE: ( ) ( )
INDEPENDENT (7-a)
VARIABLES
SW installed base [millions] 0.0171***
(0.00546)
Interaction term
-0.00916**
(0.00360)
HW improvement 1.267***
(0.295)
Interaction term -0.000370***
(0.000107)
Console age -0.00553**
(0.00236)
Number of available games 0.000238
(0.000733)
Deflated price -0.00468
(0.00398)
ln(within-group share ( ) ) 0.624***
(0.0933)
Normalized console weight
-0.372***
(0.112)
Normalized CPU speed 0.0733
(0.0979)
Observations 502
R-squared 0.952
Hansen’s J 29.45
Notes: Standard errors in parentheses are robust to arbitrary heteroskedasticity and arbitrary
autocorrelation. Asterisks denote significance levels (*** p<0.01, ** p<0.05, * p<0.1).
Brand dummies, calendar month dummies, and constant are included but not reported.
24
Table 7b: Software supply estimates (2SLS) for a 3-year rolling window of
DEPENDENT VARIABLE:
INDEPENDENT (7-b)
VARIABLES
SW installed base [millions] -1.205***
(0.325)
Interaction term
0.00217
(0.00532)
HW improvement -45.50***
(16.42)
Interaction term 0.814***
(0.131)
Format age -1.770***
(0.150)
HW installed base 37.94***
(1.015)
Interaction term -0.162***
(0.0111)
Observations 437
R-squared 0.979
Hansen’s J 2.929
Notes: Standard errors in parentheses are robust to arbitrary heteroskedasticity and arbitrary
autocorrelation. Asterisks denote significance levels (*** p<0.01, ** p<0.05, * p<0.1).
Brand dummies, calendar month dummies, and constant are included but not reported.
6.2 A counterfactual experiment
To assess if backward compatibility could indeed have played a role in sustaining Nintendo’s
market leadership by intensifying the startup problem for challenging platforms, we run a
counterfactual experiment in which we hypothetically assume that games for the Game Boy
generation can be played on the Game.com console (and Nintendo consoles).25
In reality, the
Game.com console was not backward compatible to any other parent console and was a
commercial failure. Following Corts and Lederman (2009), we derive the counterfactual as
follows. First, mean utility for console at time is derived from the regression results of
our preferred specification (4-3). With the nested logit formula discussed in Berry (1994), the
implied market shares can be obtained as follows:
( ( )⁄ )
( ) (4)
25
Such a move of mandating compatibility with a promising entrant could also be imposed by an antitrust
authority as a pro-competitive measure (Shapiro 1996).
25
with ∑ ( ( )⁄ ) . In a next step, we assume that the Game.com console, which
was launched in 9/1997 could have played titles for the Game Boy. The installed base of
compatible software titles for the parent generation , the performance increase of the
Game.com CPU compared to the Game Boy CPU , and the interaction terms from
equation (2) are adjusted accordingly. We then use the updated values to recalculate mean
utilities and implied market shares. We repeat these steps for every month in the first year
since the launch of the Game.com console and report average changes and the actual outcome
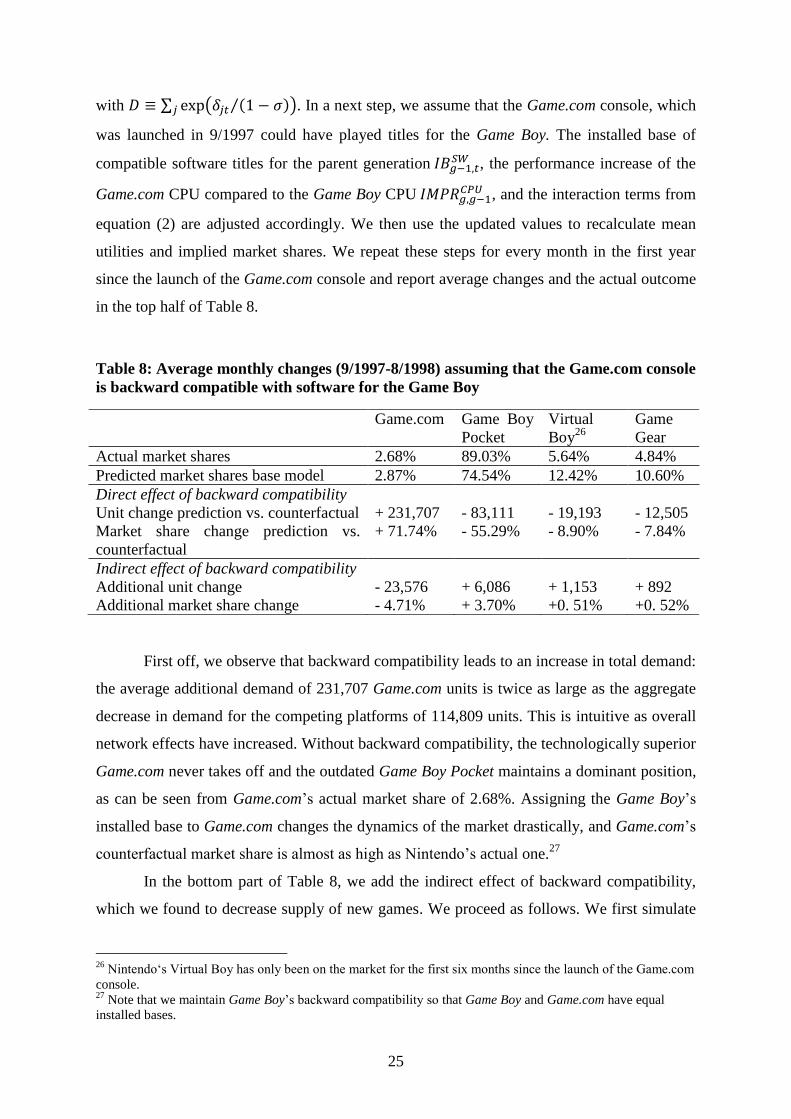
in the top half of Table 8.
Table 8: Average monthly changes (9/1997-8/1998) assuming that the Game.com console
is backward compatible with software for the Game Boy
Game.com Game Boy
Virtual
Boy26
Game
Gear
Actual market shares 2.68% 89.03% 5.64% 4.84%
Predicted market shares base model 2.87% 74.54% 12.42% 10.60%
Direct effect of backward compatibility
Unit change prediction vs. counterfactual + 231,707 - 83,111 - 19,193 - 12,505
Market share change prediction vs.
counterfactual
+ 71.74% - 55.29% - 8.90% - 7.84%
Indirect effect of backward compatibility
Additional unit change - 23,576 + 6,086 + 1,153 + 892
Additional market share change - 4.71% + 3.70% +0. 51% +0. 52%
First off, we observe that backward compatibility leads to an increase in total demand:
the average additional demand of 231,707 Game.com units is twice as large as the aggregate
decrease in demand for the competing platforms of 114,809 units. This is intuitive as overall
network effects have increased. Without backward compatibility, the technologically superior
Game.com never takes off and the outdated Game Boy Pocket maintains a dominant position,
as can be seen from Game.com’s actual market share of 2.68%. Assigning the Game Boy’s
installed base to Game.com changes the dynamics of the market drastically, and Game.com’s
counterfactual market share is almost as high as Nintendo’s actual one.27
In the bottom part of Table 8, we add the indirect effect of backward compatibility,
which we found to decrease supply of new games. We proceed as follows. We first simulate
26
Nintendo‘s Virtual Boy has only been on the market for the first six months since the launch of the Game.com
console. 27
Note that we maintain Game Boy’s backward compatibility so that Game Boy and Game.com have equal
installed bases.
26
backward compatibility of the Game.com console by changing the installed bases analogous
to hardware demand. We then use the coefficients from our supply estimation (5-3) to predict
the number of available games . We finally substitute this (lower) number of available
games in the utility function of the demand-side equation and can again derive implied
changes in units sold and in market shares.
The indirect effect moderates the direct effect somewhat (as game providers for
Game.com would have been deterred by the installed base of backward compatible games
serving as imperfect substitutes). However, the direct effect dominates the indirect effect, so
that backward compatibility would still have helped the Game.com console capture a large
chunk of the market at the time.
7. Conclusion
In this paper we study the effects of backward compatibility in a market with indirect
network effects, the U.S. handheld game console industry. Backward compatibility helped
the market leader Nintendo maintain their market leadership over multiple generations
despite having an inferior technology in many instances. Backward compatibility in this
market works through the installed base of games for a compatible parent generation and its
strength is affected by the rate of technological improvement between successive generations.
On the demand side, our results lend support to the role of backward compatibility. If
a new generation is backward compatible with the old one, the installed base of games for the
prior generation increases sales for the new generation console. However, large technological
improvements across generations come at the cost of consumers valuing backward
compatibility less as their utility from using the old complementary products is comparatively
low. Therefore, benefits from large technological improvement are partially offset by the
reduced benefits from backward compatibility. On the supply side, we find that backward
compatibility lowers the supply of new software, and that this effect is less pronounced for
consoles with higher technological progress, which suggests that there is a (previously not
identified) “dark side” to backward compatibility.
By jointly analyzing hardware demand and software supply, we identify a tradeoff
between the demand-enhancing effect of backward compatibility directly affecting hardware
demand and the demand-reducing effect that works indirectly through reduced software
variety for a platform. We find that the demand-increasing effect clearly outweighs the
demand-decreasing effect.
27
Could backward compatibility have stabilized market structure in the U.S. handheld
console market by giving Nintendo a head start for every new generation? Sony’s PSP, the
most successful challenger, entered with a much superior technology at a time when
Nintendo had just made a significant technological leap from their previous generation,
which is in line with our results that backward compatibility matters less if the generations
are very different technologically, so that Nintendo was comparably more vulnerable at that
junction. To further substantiate the claim that backward compatibility helped Nintendo
maintain a dominant position over technologically superior challengers, we run a
counterfactual and assign Nintendo’s Game Boy installed base to a technologically superior,
but ultimately unsuccessful challenger, the Game.com console. We find that if Game.com had
been backward compatible, market leadership would have been reversed.
Our work relates to the literature on entry deterrence, as backward compatibility can
discourage firms from entering a market or at least prevent them from attaining large market
shares. While there are many theoretical models of strategic entry deterrence (Dixit 1980,
Klemperer 1987, Milgrom and Roberts 1982, Salop 1979, Haan 2003), empirical studies of
entry deterrence are rare in industrial organization (Schmalensee 1978, Smiley 1988).
Strategy and marketing scholars have focused on limit pricing (Srinivasan 1991), reputation
(Clark and Montgomery 1998) and excess capacity (Harrigan 1981), while Gruca and
Sudharshan (1995) integrate a wide variety of entry deterrence strategies in their conceptual
framework, in part referring to product portfolio choices (brand proliferation,
preannouncement, switching costs). However, technological parameters are not typically
considered potential strategic instruments for entry deterrence.28
This is surprising as in
technology-intensive industries entry is a salient phenomenon, often replacing current leaders
in the process of creative destruction (Schumpeter 1942). In this light, our results have both
managerial and policy implications. Managers in network industries must consider backward
compatibility an important parameter that helps stabilize market shares across generations
and establish persistent market leadership. Judiciously managing the tradeoff between
backward compatibility and technological progress is thus a key challenge for technology
strategists.
28
An exception is Church and Gandal (1996), who study compatibility as a means of entry deterrence in a
theoretical model.
28
References
Arthur, W. 1989. Competing Technologies, Increasing Returns and Lock-in by Historical
Events. Economic Journal, 99, 116-131.
Berry, S. 1994. Estimating Discrete-Choice Models of Product Differentiation. Rand Journal
of Economics, 25, 242-262.
Berry, S., Levinsohn, J. and Pakes, A. 1995. Automobile Prices in Market Equilibrium.
Econometrica, 63, 841-890.
Chen, P.-L., Williams, C. and Agarwal, R. 2012. Growing Pains: Pre-Entry Experience and
the Challenge of Transition to Incumbency. Strategic Management Journal, 33, 252-
276.
Choi, J. 1994. Network Externality, Compatibility Choice, and Planned Obsolescence.
Journal of industrial Economics, 42, 167-182.
Church, J. and Gandal, N. 1996. Strategic Entry Deterrence: Complementary Products as
installed Base. European Journal of Political Economy, 12, 331-354.
Clark, B. and Montgomery, D. 1998. Deterrence, Reputations, and Competitive Cognition.
Management Science, 44, 62-82.
Clements, M. and Ohashi, H. 2005. Indirect Network Effects and the Product Cycle: Video
Games in the U.S., 1994-2002. Journal of industrial Economics, 53, 515-542.
Corts, K. S. and Lederman, M. 2009. Software Exclusivity and the Scope of Indirect Network
Effects in the U.S. Home Video Game Market. international Journal of industrial
Organization, 27, 121-136.
Danneels, E. 2002. The Dynamics of Product Innovation and Firm Competences. Strategic
Management Journal, 23, 1095-1121.
De Figueiredo, J. M. and Silverman, B. S. 2007. Churn, Baby, Churn: Strategic Dynamics
Among Dominant and Fringe Firms in a Segmented Industry. Management Science,
53, 632-650.
Dixit, A. 1980. The Role of Investment in Entry-Deterrence. The Economic Journal, 90, 95-
106.
Eggers, J. P. 2012. All Experience is Not Created Equal: Learning, Adapting, and Focusing in
Product Portfolio Management. Strategic Management Journal, 33.
Ellison, G. and Fudenberg, D. 2000. The Neo-Luddite's Lament: Excessive Upgrades in the
Software Industry. Rand Journal of Economics, 31, 253-272.
Farrell, J. and Saloner, G. 1985. Standardization, Compatibility, and Innovation. Rand
Journal of Economics, 16, 70-83.
29
Forster, W. 2005. The Encyclopedia of Game-Machines: Consoles, Handhelds and Home
Computers 1972-2005, Utting, Germany, Gameplan.
Gandal, N., Kende, M. and Rob, R. 2000. The Dynamics of Technological Adoption in
Hardware/Software Systems: The Case of Compact Disc Players. Rand Journal of
Economics, 31, 43-61.
Genakos, C. 2001. Game Wars - The Home Video Game Industry. London Business School
Case Study.
Greenstein, S. 1993. Did Installed Base Give an incumbent Any (Measureable) Advantages
in Federal Computer Procurement? Rand Journal of Economics, 24, 19-39.
Gruca, T. and Sudharshan, D. 1995. A Framework for Entry Deterrence Strategy: The
Competitive Environment, Choices, and Consequences. Journal of Marketing, 59, 44-
55.
Gupta, S., Jain, D. C. and Sawhney, M. S. 1999. Modeling the Evolution of Markets With
Indirect Network Externalities: An Application to Digital Television. Marketing
Science, 18, 396-416.
Haan, M. 2003. Vaporware as a Means of Entry Deterrence. Journal of industrial Economics,
51, 345-358.
Harrigan, K. 1981. Barriers to Entry and Competitive Strategies. Strategic Management
Journal, 2, 395-412.
Hill, C. W. L. and Rothaermel, F. T. 2003. The Performance of Incumbent Firms in the Face
of Radical Technological Innovation. Academy of Management Review, 28, 257-274.
Jones, N. 2003. Competing after Radical Technological Change: The Significance of Product
Line Management Strategy. Strategic Management Journal, 24, 1265-1287.
Katz, M. and Shapiro, C. 1994. Systems Competition and Network Effects. Journal of
Economic Perspectives, 8, 93-115.
Kende, M. 1994. A Note on Backward Compatibility. Economic Letters, 45, 385-389.
Kent, S. L. 2002. The Ultimate History of Video Games: From Pong to Pokemon and
Beyond... Roseville, Ca, PrimA Publishing.
Klemperer, P. 1987. Entry Deterrence in Markets with Consumer Switching Costs. the
Economic Journal, 97, 99-117.
Koski, H. and Kretschmer, T. 2005. Entry, Standards and Competition: Firm Strategies and
the Diffusion of Mobile Telephony. Review of industrial Organization, 26, 89-113.
Kotha, R., Zheng, Y. and George, G. 2010. Entry into New Niches: The Effects of Firm Age
and the Expansion of Technological Capabilities on innovative Output and Impact.
Strategic Management Journal, 32.
30
Kretschmer, T. 2008. Splintering and Inertia in Network Industries. Journal of industrial
Economics, 56, 685-706.
Lee, C. H., Venkatraman, N., Tanriverdi, H. and Iyer, B. 2010. Complementarity-Based
Hypercompetition in the Software Industry: Theory and Empirical Test, 1990–2002.
Strategic Management Journal, 31, 1431-1456.
Lee, J., Lee, J. and Lee, H. 2003. Exploration and Exploitation in the Presence of Network
Externalities. Management Science, 49, 553-570.
Lieberman, M. B. 1989. The Learning Curve, Technology Barriers to Entry, and Competitive
Survival in the Chemical Processing Industries. Strategic Management Journal, 10,
431-447.
Liikanen, J., Stoneman, P. and Toivanen, O. 2004. Intergenerational Effects in the Diffusion
of New Technology: The Case of Mobile Phones. international Journal of industrial
Organization, 22, 1137-1154.
Mascarenhas, B. 1992. Order of Entry and Performance in International Markets. Strategic
Management Journal, 13, 499-510.
Milgrom, P. and Roberts, J. 1982. Limit Pricing and Entry Under incomplete Information: An
Equilibrium Analysis. Econometrica, 50, 443-459.
Mollick, E. 2012. People and Process, Suits and Innovators: Individuals and Firm
Performance. Strategic Management Journal.
Nahm, J. 2008. The Effects of One-Way Compatibility on Technology Adoption in Systems
Markets. information Economics and Policy, 20, 269-278.
Nair, H., Chintagunta, P. and Dube, J. 2004. Empirical Analysis of Indirect Network Effects
in the Market For Personal Digital Assistants. Quantitative Marketing and Economics,
2, 23-58.
Rothaermel, F. T. and Boeker, W. 2008. Old Technology Meets New Technology:
Complementarities, Similarities, and Alliance Formation. Strategic Management
Journal, 29, 47-77.
Salop, S. 1979. Strategic Entry Deterrence. American Economic Review, 69, 335-338.
Schilling, M. 2002. Technology Success and Failure in Winner-Take-All Markets: the Impact
of Learning Orientation, Timing, and Network Externalities. Academy of Management
Journal, 45, 387-398.
Schmalensee, R. 1978. Entry Deterrence in the Ready-to-Eat Breakfast Cereal Industry. Bell
Journal of Economics, 9, 305-327.
Schumpeter, J. 1942. Capitalism, Socialism, and Democracy, New York, Harper.
Shankar, V. and Bayus, B. 2003. Network Effects and Competition: An Empirical Analysis
of the Home Video Game Industry. Strategic Management Journal, 24, 375-384.
31
Shapiro, C. 1996. Antitrust in Network Industries, Address Before the American Law
Institute and American Bar Association, 25 January 1996 [online]. Available:
Http://Www.Justice.Gov/Atr/Public/Speeches/0593.Htm [Accessed 24 January 2012].
Shapiro, C. and Varian, H. 1999. information Rules: A Strategic Guide to the Network
Economy, Cambridge, Ma, Harvard Business School Press.
Shy, O. 1996. Technology Revolutions in the Presence of Network Externalities.
International Journal of Industrial Organization, 14, 785-800.
Smiley, R. 1988. Empirical Evidence on Strategic Entry Deterrence. International Journal of
Industrial Organization, 6, 167-180.
Srinivasan, K. 1991. Multiple Market Entry, Cost Signalling and Entry Deterrence.
Management Science, 37, 1539-1555.
Stremersch, S. and Binken, J. 2009. The Effect of Superstar Software on Hardware Sales in
System Markets. Journal of Marketing, 73, 88-104.
Suarez, F. F. and Utterback, J. M. 1995. Dominant Designs and the Survival of Firms.
Strategic Management Journal, 16, 415-430.
Sutton, J. 1998. Technology and Market Structure: Theory and History, Cambridge, Mit
Press.
Tripsas, M. 1997. Unraveling the Process of Creative Destruction: Complementary Assets
and Incumbent Survival in the Typesetter Industry. Strategic Management Journal,
18, 119-142.
Wade, J. 1995. Dynamics of Organizational Communities and Technological Bandwagons:
An Empirical Investigation of Community Evolution in the Microprocessor Market.
Strategic Management Journal, 16, 111-133.
Waldman, M. 1993. A New Perspective on Planned Obsolescence. Quarterly Journal of
Economics, 108, 273-283.

CENTRE FOR ECONOMIC PERFORMANCE
Recent Discussion Papers
1123 Bernardo Guimaraes
Kevin D. Sheedy
A Model of Equilibrium Institutions
1122 Francesco Caselli
Tom Cunningham
Massimo Morelli
Inés Moreno de Barreda
Signalling, Incumbency Advantage, and
Optimal Reelection Rules
1121 John Van Reenen
Linda Yueh
Why Has China Grown So Fast? The Role of
International Technology Transfer
1120 Francesco Giavazzi
Michael McMahon
The Household Effects of Government
Spending
1119 Francesco Giavazzi
Michael McMahon
The Household Effects of Government
Spending
1118 Luis Araujo
Giordano Mion
Emanuel Ornelas
Institutions and Export Dynamics
1117 Emanuel Ornelas Preferential Trade Agreements and the Labor
Market
1116 Ghazala Azmat
Nagore Iriberri
The Provision of Relative Performance
Feedback Information: An Experimental
Analysis of Performance and Happiness
1115 Pascal Michaillat Fiscal Multipliers over the Business Cycle
1114 Dennis Novy Gravity Redux: Measuring International
Trade Costs with Panel Data
1113 Chiara Criscuolo
Ralf Martin
Henry G. Overman
John Van Reenen
The Causal Effects of an Industrial Policy
1112 Alex Bryson
Richard Freeman
Claudio Lucifora
Michele Pellizzari
Virginie Perotin
Paying for Performance: Incentive Pay
Schemes and Employees’ Financial
Participation
1111 John Morrow
Michael Carter
Left, Right, Left: Income and Political
Dynamics in Transition Economies
1110 Javier Ortega
Gregory Verdugo
Assimilation in Multilingual Cities

1109 Nicholas Bloom
Christos Genakos
Rafaella Sadun
John Van Reenen
Management Practices Across Firms and
Countries
1108 Khristian Behrens
Giordano Mion
Yasusada Murata
Jens Südekum
Spatial Frictions
1107 Andrea Ariu
Giordano Mion
Service Trade and Occupational Tasks: An
Empirical Investigation
1106 Verónica Amarante
Marco Manacorda
Edward Miguel
Andrea Vigorito
Do Cash Transfers Improve Birth Outcomes?
Evidence from Matched Vital Statistics,
Social Security and Program Data
1105 Thomas Sampson Assignment Reversals: Trade, Skill
Allocation and Wage Inequality
1104 Brian Bell
Stephen Machin
Immigrant Enclaves and Crime
1103 Swati Dhingra Trading Away Wide Brands for Cheap
Brands
1102 Francesco Caselli
Antonio Ciccone
A Note on Schooling in Development
Accounting
1101 Alan Manning
Barbara Petrongolo
How Local Are Labour Markets? Evidence
from a Spatial Job Search Model
1100 Fabrice Defever
Benedikt Heid
Mario Larch
Spatial Exporters
1099 John T. Addison
Alex Bryson
André Pahnke
Paulino Teixeira
Change and Persistence in the German Model
of Collective Bargaining and Worker
Representation
1098 Joan Costa-Font
Mireia Jofre-Bonet
Anorexia, Body Image and Peer Effects:
Evidence from a Sample of European Women
1097 Michal White
Alex Bryson
HRM and Workplace Motivation:
Incremental and Threshold Effects
1096 Dominique Goux
Eric Maurin
Barbara Petrongolo
Worktime Regulations and Spousal Labor
Supply
The Centre for Economic Performance Publications Unit
Tel 020 7955 7673 Fax 020 7955 7595
Email [email protected] Web site http://cep.lse.ac.uk