cement - carbon majorscarbonmajors.org/pdfs/sums/cement sums/industrydata 6p.pdf · 1960 clinker...
TRANSCRIPT

Cement industry data
1
2345678
910
11
12
13141516171819202122232425262728293031323334353637383940414243444546474849505152535455565758596061626364656667686970717273747576777879808182838485
A B C D E F G H I J K L M N
Cement ProductionRichard Heede
Climate Mitigation ServicesFile started: 26 December 2005
Last modified: July 2012
Cement production, general data yellow column
indicates original reported units
Cement production & emissions dataYear Cement Prod Energy Use CO2 emissions
Clinker ratio Annual production
Million tons/yr Million tonnes/yr
1950 Table 1 WBCSD Cement Industry stats for 20061951 Number of installations Number 844 17%1952 Clinker production Mtonne of clinker 626 44%1953 Cementitious product production Mtonne cementitious product 801 53%1954 Gross CO2 Mtonne CO2 544 37%1955 Net CO2 Mtonne CO2 530 35%1956 Gross CO2 per tonne of clinker kg CO2/tonne of clinker 866 -5.30%1957 Net CO2 per tonne of clinker kg CO2/tonne of clinker 844 -6.90%1958 Gross CO2 per tonne cementitious kg CO2/tonne cementitious product 679 -10.60% World Production and Capacity: 1959 Net CO2 per tonne cementitious kg CO2/tonne cementitious product 661 -12.10% Cement production1960 Clinker substitution Clinker to cement ratio 78 -5.90% 2006 2007 1961 Thermal energy efficiency MJ/tonne clinker 3,690 -14% USGS United States (includes Puerto Rico) 99,700 96,4001962 Electric energy efficiency kWh/tonne cement 111 -3.50% Brazil 39,500 40,0001963 WBCSD, Cement Sustainability Initiative (2009) Cement Industry Energy and CO2 Performance “Getting the Numbers Right”, 44 pp., www.wbcsdcement.orgChina 1,200,000 1,300,0001964 Egypt 29,000 29,0001965 Process emissions (calcination): kg CO2/tonne of clinker 540 Percent process of gross, by year France 21,000 21,0001966 Gross emissions 1990 kg CO2/tonne of clinker 914 59.1% Germany 33,400 34,0001967 Gross emissions 2000 kg CO2/tonne of clinker 880 61.4% India 155,000 160,0001968 Gross emissions 2005 kg CO2/tonne of clinker 868 62.2% Indonesia 34,000 35,000 42,000 42,000 1969 Gross emissions 2006 kg CO2/tonne of clinker 866 62.4% Iran 33,000 34,0001970 Thermal & elec. emissions 2006 kg CO2/tonne of clinker 326 Gross CO2 emissions: All direct (excl on-site elec gen & biomass) Italy 43,200 44,0001971 Percent process of gross emissions 62.4% Net CO2 emissions: Gross minus alt fuel emissions Japan 69,900 70,0001972 Korea, Republic of 55,000 55,0001973 Mexico 40,600 41,0001974 Russia 54,700 59,0001975 Saudi Arabia 27,100 28,0001976 Spain e54,000 50,0001977 Thailand 39,400 40,000 1978 Turkey 47,500 48,000 1979 Vietnam 32,000 32,0001980 Other countries (rounded) 442,000 390,0001981 World total (rounded) 2,550,000 2,600,0001982 (Data in thousand metric tons unless otherwise noted)1983 Hendrik G. van Oss, 703-648-7712, [email protected] U.S. Geological Survey, Mineral Commodity Summaries1985198619871988 www.argos.com.cøwps/wcm/connect/resources/file/eb4e7c00a7d65c9/Argos_general_presentation_15_January_07.pdf?MOD=AJPERES1989 Cementos Argos (Colombia), Jan071990 11.6 million tonne capacity (Colombia, USA, Panama, Venezuela, Haiti, Dominican Rep); nat gas, coal, hydro199119921993199419951996199719981999 World2000 million tonnes/yr2001 1,750 2002 1,850 2003 2,020 2004 2,190 2005 2,350 2006 2,610 2007 2,810 2008 www.theoildrum.com/node/4162 Lafarge CSR 2008, page 64. 2,860 2009 3,060 2010 3,300
Total - - - - -
Cement.xls
Cement industry data
1
2345678
910
11
12
13141516171819202122232425262728293031323334353637383940414243444546474849505152535455565758596061626364656667686970717273747576777879808182838485
O P Q R S T U V W X Y Z AA AB AC
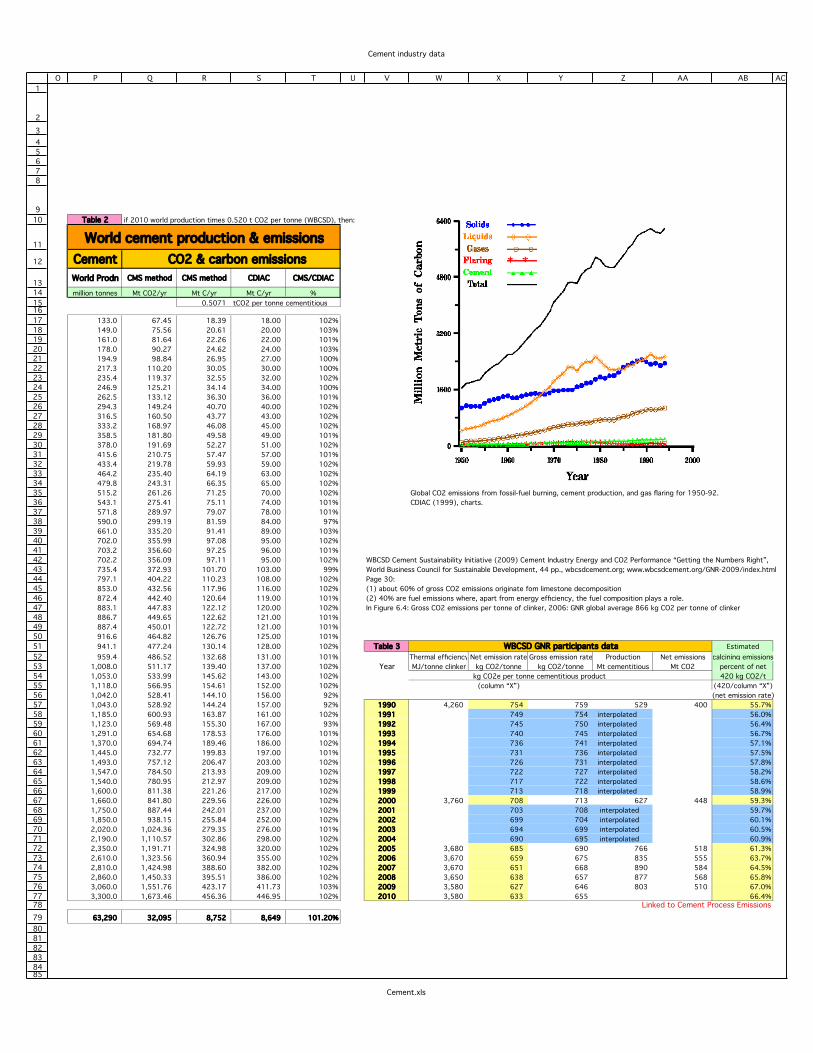
Table 2 if 2010 world production times 0.520 t CO2 per tonne (WBCSD), then:
World cement production & emissionsCement CO2 & carbon emissionsWorld Prodn CMS method CMS method CDIAC CMS/CDIAC
million tonnes Mt CO2/yr Mt C/yr Mt C/yr %0.5071 tCO2 per tonne cementitious
133.0 67.45 18.39 18.00 102%149.0 75.56 20.61 20.00 103%161.0 81.64 22.26 22.00 101%178.0 90.27 24.62 24.00 103%194.9 98.84 26.95 27.00 100%217.3 110.20 30.05 30.00 100%235.4 119.37 32.55 32.00 102%246.9 125.21 34.14 34.00 100%262.5 133.12 36.30 36.00 101%294.3 149.24 40.70 40.00 102%316.5 160.50 43.77 43.00 102%333.2 168.97 46.08 45.00 102%358.5 181.80 49.58 49.00 101%378.0 191.69 52.27 51.00 102%415.6 210.75 57.47 57.00 101%433.4 219.78 59.93 59.00 102%464.2 235.40 64.19 63.00 102%479.8 243.31 66.35 65.00 102%515.2 261.26 71.25 70.00 102% Global CO2 emissions from fossil-fuel burning, cement production, and gas flaring for 1950-92.543.1 275.41 75.11 74.00 101% CDIAC (1999), charts.571.8 289.97 79.07 78.00 101%590.0 299.19 81.59 84.00 97%661.0 335.20 91.41 89.00 103%702.0 355.99 97.08 95.00 102%703.2 356.60 97.25 96.00 101%702.2 356.09 97.11 95.00 102% WBCSD Cement Sustainability Initiative (2009) Cement Industry Energy and CO2 Performance “Getting the Numbers Right”, 735.4 372.93 101.70 103.00 99% World Business Council for Sustainable Development, 44 pp., wbcsdcement.org; www.wbcsdcement.org/GNR-2009/index.html797.1 404.22 110.23 108.00 102% Page 30:853.0 432.56 117.96 116.00 102% (1) about 60% of gross CO2 emissions originate fom limestone decomposition872.4 442.40 120.64 119.00 101% (2) 40% are fuel emissions where, apart from energy efficiency, the fuel composition plays a role.883.1 447.83 122.12 120.00 102% In Figure 6.4: Gross CO2 emissions per tonne of clinker, 2006: GNR global average 866 kg CO2 per tonne of clinker886.7 449.65 122.62 121.00 101%887.4 450.01 122.72 121.00 101%
Hendrik G. van Oss, 703-648-7712, [email protected] 916.6 464.82 126.76 125.00 101%941.1 477.24 130.14 128.00 102% Table 3 WBCSD GNR participants data Estimated959.4 486.52 132.68 131.00 101% Thermal efficiency Net emission rate Gross emission rate Production Net emissions calcining emissions
1,008.0 511.17 139.40 137.00 102% Year MJ/tonne clinker kg CO2/tonne kg CO2/tonne Mt cementitious Mt CO2 percent of net1,053.0 533.99 145.62 143.00 102% kg CO2e per tonne cementitious product 420 kg CO2/t1,118.0 566.95 154.61 152.00 102% (column “X”) (420/column “X”)1,042.0 528.41 144.10 156.00 92% (net emission rate)1,043.0 528.92 144.24 157.00 92% 1990 4,260 754 759 529 400 55.7%1,185.0 600.93 163.87 161.00 102% 1991 749 754 interpolated 56.0%1,123.0 569.48 155.30 167.00 93% 1992 745 750 interpolated 56.4%1,291.0 654.68 178.53 176.00 101% 1993 740 745 interpolated 56.7%1,370.0 694.74 189.46 186.00 102% 1994 736 741 interpolated 57.1%1,445.0 732.77 199.83 197.00 101% 1995 731 736 interpolated 57.5%1,493.0 757.12 206.47 203.00 102% 1996 726 731 interpolated 57.8%1,547.0 784.50 213.93 209.00 102% 1997 722 727 interpolated 58.2%1,540.0 780.95 212.97 209.00 102% 1998 717 722 interpolated 58.6%1,600.0 811.38 221.26 217.00 102% 1999 713 718 interpolated 58.9%1,660.0 841.80 229.56 226.00 102% 2000 3,760 708 713 627 448 59.3%1,750.0 887.44 242.01 237.00 102% 2001 703 708 interpolated 59.7%1,850.0 938.15 255.84 252.00 102% 2002 699 704 interpolated 60.1%2,020.0 1,024.36 279.35 276.00 101% 2003 694 699 interpolated 60.5%2,190.0 1,110.57 302.86 298.00 102% 2004 690 695 interpolated 60.9%2,350.0 1,191.71 324.98 320.00 102% 2005 3,680 685 690 766 518 61.3%2,610.0 1,323.56 360.94 355.00 102% 2006 3,670 659 675 835 555 63.7%2,810.0 1,424.98 388.60 382.00 102% 2007 3,670 651 668 890 584 64.5%2,860.0 1,450.33 395.51 386.00 102% 2008 3,650 638 657 877 568 65.8%3,060.0 1,551.76 423.17 411.73 103% 2009 3,580 627 646 803 510 67.0%3,300.0 1,673.46 456.36 446.95 102% 2010 3,580 633 655 66.4%
Linked to Cement Process Emissions63,290 32,095 8,752 8,649 101.20%
Cement.xls

Cement industry data
1
2345678
910
11
12
13141516171819202122232425262728293031323334353637383940414243444546474849505152535455565758596061626364656667686970717273747576777879808182838485
AD AE AF AG AH AI AJ AK AL AM AN AO AP AQ
WBCSD Sustainable Cement Initiative, GNR Indicator 329 WBCSD Sustainable Cement Initiative, GNR Indicator 323www.wbcsdcement.org/GNR-2009/index.html
WBCSD Sustainable Cement Initiative, GNR Indicator 326 WBCSD Sustainable Cement Initiative, GNR Indicator 3212Note: 2010 revised data shown (2009 data, used in our analysis, shown underneath)
CDIAC (1995) Estimates of Global, Regional, and National Annual CO2 Emissions from Fossil-Fuel Burning, Hydraulic Cement Production, and Gas Flaring: 1950-1992, by T. A.. Boden, G. Marland, & R. J. Andres. cdiac.ornl.gov/epubs/ndp/ndp030/ndp0301.htm#co2man
3.1 CO2 Emissions from Cement Manufacturing
Because cement manufacturing uses essentially 100% of the calcium oxide obtained from burning the calcium carbonate during calcination, the amount of calcium oxide content in the finished cement is a good measure of the amount of CO2 released during production (Griffin 1987). To determine the amount of CO2 released from cement manufacturing, one needs to know how much cement was manufactured, the average calcium oxide content per unit of cement, and a factor to convert the calcium oxide content into carbon dioxide equivalents. Cement production data published by the U.S. Bureau of Mines are currently reported in thousand short tons, but before 1970 the data were reported in barrels. To ensure consistent units throughout the 1950-92 record, two equations were used to convert cement production estimates to units of metric tons. Cement production before 1970 was calculated by using cement production (in metric tons) = 0.17055 * quantity of cement produced (in barrels), (3) where 0.17055 is the metric-ton equivalent for a barrel.
After 1969, net cement production was calculated by using cement production (in metric tons) = 0.90718474 * quantity of cement produced (in short tons), (4) where 0.90718474 is the metric-ton equivalent for a short ton. The amount of CO2 produced from cement production was calculated by using
Linked to Cement Process Emissions CO2 production (in metric tons of C) = 0.136 metric tons of C per metric ton cement ? quantity of cement produced (metric tons) (5)
This conversion factor was obtained by dividing the molar mass of carbon by the molar mass of calcium oxide and multiplying this quotient by the average fraction of calcium oxide contained in cement: (12.01 g C/mole CaCO3 ÷ 56.08 g CaO /mole CaCO3) * 0.635 g CaO /g cement = 0.136 g C /g cement (6)
The consensus that 63.5% of the typical cement in the world is composed of calcium oxide is based on the opinions of experts consulted in the field, as well as inspection of composition data by type and country (Griffin 1987).
Cement.xls

Cement industry data
1
2345678
910
11
12
13141516171819202122232425262728293031323334353637383940414243444546474849505152535455565758596061626364656667686970717273747576777879808182838485
AR AS AT AU AV AW AX AY AZ BA BB BC BD BE
WBCSD Sustainable Cement Initiative, GNR Indicator 3213
WBCSD Sustainable Cement Initiative, GNR Indicator 316
To ensure consistent units throughout the 1950-92 record, two equations were used to convert cement production estimates to units of metric tons. Cement production before 1970 was calculated by using WBCSD Sustainable Cement Initiative, GNR Indicator 3219
IPCC Second Assessment Report, Industry, chapter 20, quotes Griffin (1987): calcination releases ~0.5 t CO2 per tonne of cement (60% of 1.25 tCO2 total).
WBCSD cement industry CO2 protocol recommends a default factor of 525 tCO2 per tonne of clinkerNote: see Table 3 for calculation of net calcining emissions as a percentage of net emissions per tonne cementitious product
Cement.xls

Cement industry data
1
2345678
910
11
12
13141516171819202122232425262728293031323334353637383940414243444546474849505152535455565758596061626364656667686970717273747576777879808182838485
BF BG BH BI BJ BK BL BM BN BO BP BQ BR
IPCC (Revised 1996 IPCC Guidelines for National Greenhouse Gas Inventories, Reference Manual, Volume 3, Industrial Processes, Section 2.3: Cement Production, www.ipcc-nggip.iges.or.jp/public/głinvs6a.html
Hanle, Lisa, Kamala R. Jayaraman, & Joshua S. Smith (2004) “CO2 Emissions Profile of the U.S. Cement Industry,” 13th International Emission Inventory Conference Working for Clean Air, Clearwater, FL, 14 pp.
EPA (2012) Draft Inventory, page 4-4.
Cement.xls

Cement industry data
I9Cell:Rick Heede:Comment:Chiefly World Business Council for Sustainable Development data from WBCSD’s Cement Sustainability Initiative (2009) Cement Industry Energy and CO2 Performance: ‘Getting the Numbers Right’, wbcsdcement.org, 44 pp.Also CDIAC cement emissions estimation protocol (page 3).
K11Cell:Rick Heede:Comment:Emissions from cement fabrication are of two main types: Calcining process of calcium carbonate into clinker liberates carbon dioxide, and emissions from the energy used in the manufacturing process. Typically not included in the emissions estimates are transportation energy, the burning of wastes, or plant construction.
E12Cell:Rick Heede:Comment:The industry calcination factor ranges from 525 to 900 kg CO2 per tonne of clinker (net), but of course varies from company to company, and will tend to decrease over time as process efficiencies improve. WBCSD (2002) “Toward a Sustainable Cement Industry: Key Performance Indicators,” by Joseph Fiksel, Battelle, for WBCSD. “Each tonne of Ordinary Portland Cement generates ~900 kg of net CO2 emissions ... and consumes roughly 3,000 MJ of total electrical and thermal energy,” p. 8.
H12Cell:Rick Heede:Comment:Most cement companies will aggregate emissions from energy use with emissions from cement fabrication. This column is provided for companies that provide both data.
K12Cell:Rick Heede:Comment:Average CO2 emissions intensity have declined 16.5 percent from 1990 to 2009 -- from 758 net kg CO2 per tonne of cementitious product in 1990 to 633 kg CO2/t in 2009, according to WBCSD data.** This project estimates process emissions from calcining limestone and thus excludes emissions from fuel and electricity inputs inputs to cement manufacturing. The emission rates and net total company emissions both include process and energy-related emission; a subsequent worksheet (SumCement.xls) estimates process emions of CO2.** World Business Council for Sustainable Development Cement Sustainability Initiative (2009) Cement Industry Energy and CO2 Performance: ‘Getting the Numbers Right’, wbcsdcement.org, 44 pp. See GNR Indicator 326, reproduced at the “Cement industry data” worksheet in this portfolio.
P13Cell:Rick Heede:Comment:USGS Historical Statistics for Mineral and Material Commodities in the United States By Thomas D. Kelly and Grecia R. Matos http://minerals.usgs.gov/ds/2005/140/
R15Cell:Rick Heede:Comment:CMS adopts the IPCC Guideline factor of EF clinker = 0.646 * 0.785 = 0.5071 tCO2 per tonne of clinker produced. (Average clinker lime percentage of 64.6 percent; molecular weight ratio of CO2/CaO = 78.5 percent.)
AB51Cell:Rick Heede:Comment:This column calculates a time series of calcining emissions as a percent of gross emissions reported by WBCSD Cement Sustainability Initiative members, which are globally reported for 1990, 2000, and 2005 - 2009. This series is linked to the Cement.xls worksheet summarizing estimated calcining process emissions from data on cement production (fuel emissions + process emissions).
AB54Cell:Rick Heede:Comment:Based on WBCSD Cement Sustainability Initiative protocol (2011) default factor of 525 tCO2/tonne clinker (see details below) times an industry average of approximately 80 percent clinker in cementitious product (due to substitute and additional materials such as gypsum, fly ash, etc), CMS estimates 420 tCO2 per tonne of cementitious product is attributable to the calcining process (CaCO3 ---> CaO + CO2) (525 * 0.8 = 420). Cement Sustainability Initiative (2011) CO2 and Energy Accounting and Reporting Standard for the Cement Industry, 76 pp. www.wbcsdcement.org/pdf/tf1_co2%20protocol%20v3.pdf. Page 16: “In the absence of better data, a default of 525 kg CO2/t clinker shall be used (Simple output method B1). This value is comparable to the IPCC default (510 kg CO2/t) corrected for typical MgO contents in clinker.” Appendix 3: Details on Calcination CO 2 Reporting of CO2 emissions from raw material calcination based on clinker output: Summary of IPCC and CSI Recommendations and Default Emission Factor for Clinker IPCC (2006) recommends calculating calcination CO2 based on the CaO content of the clinker produced (0.785 t CO2/t CaO, multiplied with the CaO content in clinker). A default CaO content in clinker of 65% is recommended, corresponding to 510 kg CO2/t clinker.
M76Cell:Rick Heede:Comment:USGS Minerals Yearbook 2009, Table 22: Hydraulic Cement: World Production by Country 2005-2009, at: http://minerals.usgs.gov/minerals/pubs/commodity/cement/index.html#myb
M77Cell:Rick Heede:Comment:World cement production in 2010 (estimated): 3,300 thousand tonnes, Hendrik van Oss, USGS. http://minerals.usgs.gov/minerals/pubs/commodity/cement/mcs-2011-cemen.pdf
AT78Cell:Rick Heede:Comment:“CO2 is emitted during cement production in two ways. Approximately 0.75 t of CO2 is produced per ton of cement from combustion of fossil fuels to operate the rotary kiln. The second source is calcination, in which calcium carbonate (CaCO3) from limestone, chalk, or other calcium-rich materi- als is heated in kilns to form lime (CaO) by driving off CO2. This process produces about 0.5 t of CO2 per ton of cement. Thus, combining these two sources, for every ton of cement produced, 1.25 t of CO2 is released into the atmosphere—of which 60% comes from energy inputs and 40% from calcination (Griffin, 1987). Worldwide, cement production accounted for approximately 162 Mt of C emissions in 1991, or about 2.6% of total global carbon from oxidation of fossil fuels. The United States annually produces about 9.3 Mt C from cement production, or 6% of global cement-production carbon (CDIAC, 1993).” www.ipcc-wg2.gov/publications/SAR/SAR_Chapter%2020.pdfGriffin, R.C., 1987: CO2 release from cement production, 1950-1985. In: Estimates of CO2 Emissions from Fossil Fuel Burning and Cement Manufacturing, Based on the United Nations Energy Statistics and the U.S. Bureau of Mines Cement Manufacturing Data [Marland, G., T.A. Boden, R.C. Griffin, S.F. Huang, P. Karciruk, and T.R. Nelson (eds.)]. Report No. ORNŁCDIAC-25, Carbon Dioxide Information Analysis Center, Oak Ridge National Laboratory, Oak Ridge, TN, pp. 643-680.CDIAC elaborates: (12.01 g C/mole CaCO3 ÷ 56.08 g CaØmole CaCO3) * 0.635 g CaØg cement = 0.136 g C/g cement. CMS: 0.136 gC per g cement * 3.667 = 0.50 gCO2 per g.http://cdiac.esd.ornl.gov/
AT80Cell:Rick Heede:Comment:Cement Sustainability Initiative (2011) CO2 and Energy Accounting and Reporting Standard for the Cement Industry, 76 pp. www.wbcsdcement.org. Page 16: “In the absence of better data, a default of 525 kg CO2/t clinker shall be used. This value is comparable to the IPCC default (510 kg CO2/t) corrected for typical MgO contents in clinker.” In Appendix 3, Details on Calcination CO2: “Reporting of CO2 emissions from raw material calcination based on clinker output: Summary of IPCC & CSI Recommendations and Default Emission Factor for Clinker IPCC (2006) recommends calculating calcination CO2 based on the CaO content of the clinker produced (0.785 t CO2/t CaO, multiplied with the CaO content in clinker). A default CaO content in clinker of 65% is recommended, corresponding to 510 kg CO2/t clinker.”
Cement.xls