case study on fault analysis using pmu · 3. single phase to earth fault on transmission line with...
TRANSCRIPT
978-1-4799-5141-3/14/$31.00 @ 2014 IEEE
Case Study on Fault Analysis Using PMU
Prithwish Mukhopadhyay
General Manager, WRLDC
Mumbai, India
Rajkumar Anumasula
Senior Engineer, WRLDC
Mumbai, India
Abhimanyu Gartia
Deputy General Manager, WRLDC
Mumbai, India
Chandan Kumar
Engineer, WRLDC
Mumbai, India
Pushpa Seshadri
Chief Manager, WRLDC
Mumbai, India
Sunil Patil
Engineer, WRLDC
Mumbai, India
Abstract— Synchrophasors are used extensively in Indian Grid
to detect and analyze faults occurring in the system. This paper
majorly discusses the case studies of power system faults that
occurred in the Indian grid and its identification and
classification using data obtained from Synchrophasors. The
types of faults identified include symmetrical and
unsymmetrical faults in power system. Further in case of single
phase to ground faults, the successful, unsuccessful and non -
operation of autoreclosure has been verified. Data from Phasor
measurement units (PMUs) helped in identifying the fault
recovery time and operation of autoreclosure and provided a
strong tool for monitoring the status of the protection system in
the grid. A comparative analysis of the disturbance recorder
files and the synchrophasor data has also been discussed in this
paper. The comparative analysis is used for validation of the DR
and Synchrophasor data. This paper has led to the development
of disturbance analysis tool for fault analysis using both DR and
Synchrophasor data which will ease the system operator
decision making ability while taking decision during a
contingency in the system.
Index Terms—Synchrophasor, Faults, Autoreclosure, Indian
grid, Disturbance recorder.
I. INTRODUCTION
Power system operation in India is complex due to disparity in geographical distribution of resources and loads, network complexity with rapid changes in network configuration and increasing combination of UHV, EHV, HVDC lines and FACTS devices in the system. Synchrophasor measurement units also known as “Phasor measurement units (PMUs) have become a very effective tool for system monitoring and analysis.
The Indian Grid is a large synchronous grid which constitutes of Eastern, Northern, North-Eastern, Southern and Western grids. Synchrophasor measurement units have been deployed in each regional grid under the pilot projects for monitoring and development of analytics which will help in system operation [1-2]. This has proved to be a boon for understanding the behavior of Indian power system. The high
resolution data obtained from PMUs (25 samples/sec) with accurate time stamping provides a continuous snapshot of the system. Among the various applications explored from this technology, fault analysis is used extensively for understanding the sequence of events and also for strengthening protection schemes. It has helped in post facto analysis and real time detection of faults occurring in the grid.
In the Western regional grid, ,PMUs are placed strategically covering all types of buses like generator buses, intermediate pooling stations, load centers, HVDC substations etc. [2]. The potential transformer (PT) of the Bus and current transformer (CT) of the feeders have been used as analog inputs to the PMUs. Prior to Synchrophasor technology implementation in India, the identification, detection and classification of fault was confirmed from the Disturbance recorder (DR) files, Sequence of events (SOE) from the Relays and Sub-station SCADA. Obtaining these details from various substations resulted in delayed analysis and information about the power system phenomenon. With the PMU data available at control centers, the fault can be detected identified and classified in real time by observing the trends in various parameters of the system. This has saved a lot of time for analysis as the nature and type of fault can be confirmed at the control center itself although the DR and SOE are still used for its confirmation.
This paper is focused on the fault analysis of EHV transmission lines and bus bar, their characterization using synchrophasor and their validation using disturbance recorder data. Section II illustrates the single phase fault in the Indian power system followed by the Sections III and IV where phase to phase and three phase fault have been discussed. Section V discusses the validation of observations from Synchrophasor data with DR for power system. Section VI concludes the paper.
II. SINGLE PHASE TO GROUND FAULT
Single phase to ground fault is the most common type of fault in power system. Such faults are very common in
transmission lines and can be either temporary/transient or permanent in nature. The ground path provided by trees, fogs etc. are temporary in nature and these ground paths gets cleared immediately. The permanent nature fault appears in case the conductor breaks down (in case of transmission line), current or potential transformer bushing burst (in sub-station) or by some other permanent grounding path. To avoid permanent isolation of an element in case of a transient fault, auto-reclosure (A/R) for single phase faults is provided for 400 kV and higher level EHV transmission lines On the basis of that, four cases of phase to ground fault are discussed here which are:
1. Single phase to earth fault on transmission line with
successful A/R
2. Single phase to earth fault on transmission line with
unsuccessful A/R
3. Single phase to earth fault on transmission line with
no A/R.
4. Single phase to earth fault on Bus bar.
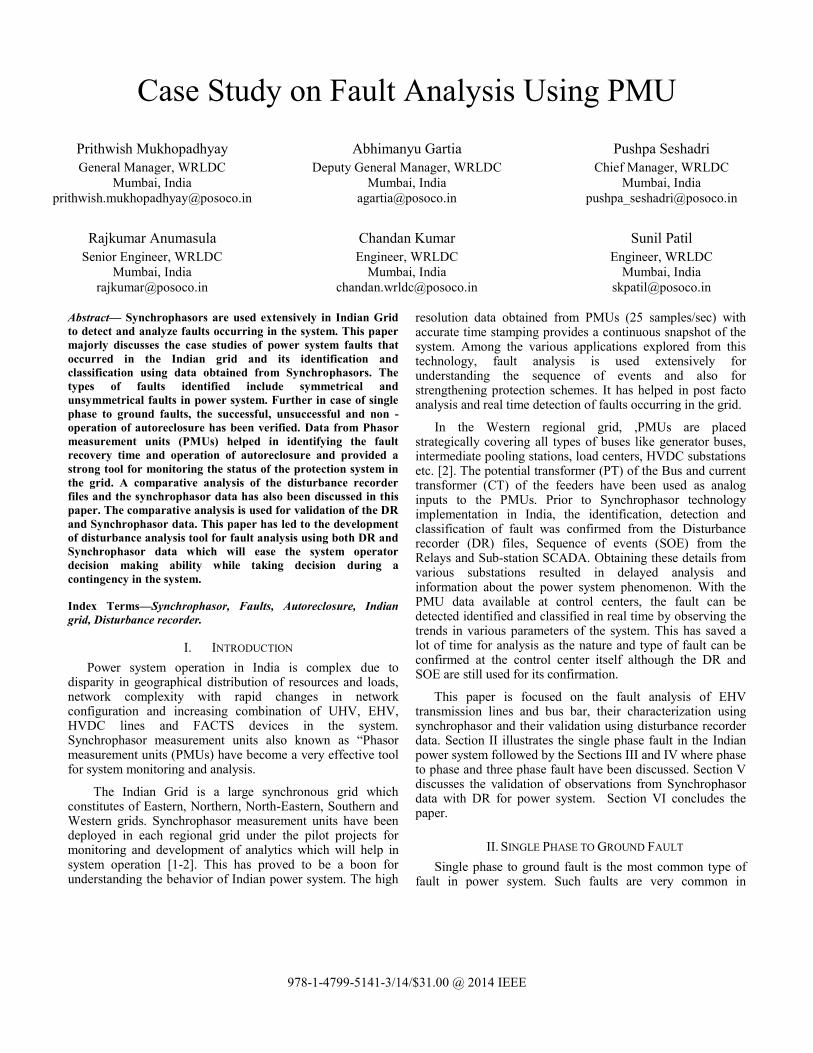
The first case of single phase to earth fault with successful autoreclosure is shown in figure 1 and figure 2 where a fault on B phase to earth occurred on 400 kV Jabalpur-Vindhyachal circuit 4. It can be observed that when a single phase fault occur on transmission line the voltage of faulty phase dips to a lower value while remaining phases will observe a smaller dip due to unbalance in the system as the fault is being fed by the bus whose voltage has been as shown in figure 1.
Figure 1. Voltage of 400 kv Jabalpur bus from Synchrophasor data during
single phase to ground fault on 400 kV Vindhyachal-Jabalpur circuit 4.
Figure 2. Current of Vindhyachal-Jabalpur circuit 4 observed from
Jabalpur end from Synchrophasor data
Figure 2 shows how the fault current is increased in the faulty phase of the circuit indicating fault feeding from the affected phase. The line protection operated in zone 1 from both end and the faulty phase got isolated from both end resulting in recovery of voltage in faulty phase while current in the phase became zero. This has resulted in A/R initiation for the faulty phase and after 1 second, that phase got reclosed and further no fault was sensed resulting in successful auto reclosure. The line came back in service and the system again came to a balanced state. The voltage channel in PMU is obtained from the Bus PT so it will not become zero but due to the fault, the voltage of bus will get unbalanced and will observe a large dip in faulty phase.
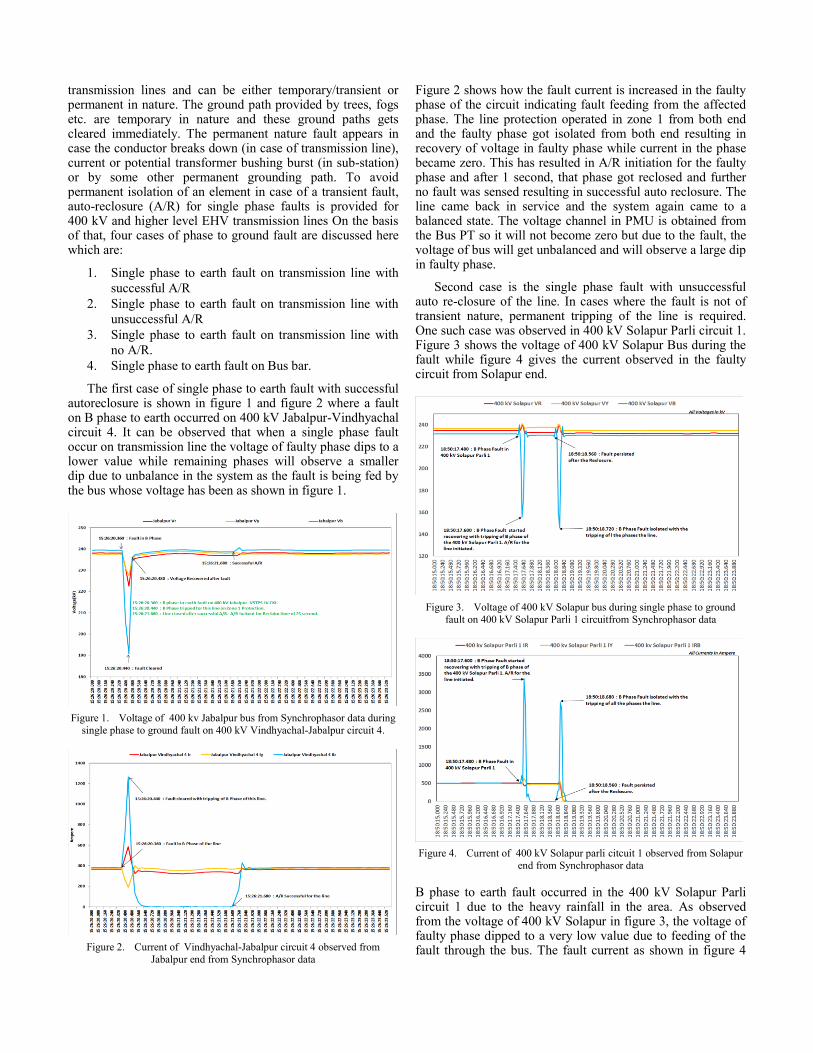
Second case is the single phase fault with unsuccessful auto re-closure of the line. In cases where the fault is not of transient nature, permanent tripping of the line is required. One such case was observed in 400 kV Solapur Parli circuit 1. Figure 3 shows the voltage of 400 kV Solapur Bus during the fault while figure 4 gives the current observed in the faulty circuit from Solapur end.
Figure 3. Voltage of 400 kV Solapur bus during single phase to ground
fault on 400 kV Solapur Parli 1 circuitfrom Synchrophasor data
Figure 4. Current of 400 kV Solapur parli citcuit 1 observed from Solapur
end from Synchrophasor data
B phase to earth fault occurred in the 400 kV Solapur Parli circuit 1 due to the heavy rainfall in the area. As observed from the voltage of 400 kV Solapur in figure 3, the voltage of faulty phase dipped to a very low value due to feeding of the fault through the bus. The fault current as shown in figure 4
increased and with carrier aided zone 1 protection, the line tripped in the faulty phase from both ends. A/R was initiated after one second. The faulty phase of the circuit got reclosed but due to permanent nature of fault, all the three phases tripped thus isolating the faulty line.
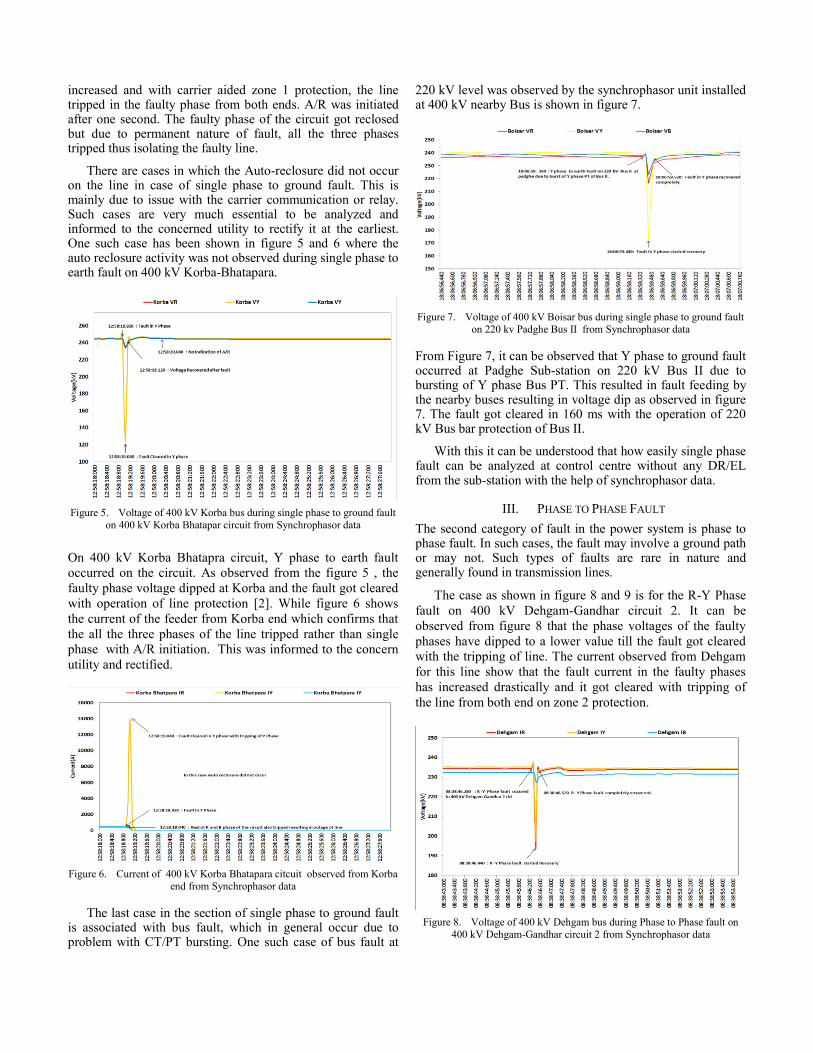
There are cases in which the Auto-reclosure did not occur on the line in case of single phase to ground fault. This is mainly due to issue with the carrier communication or relay. Such cases are very much essential to be analyzed and informed to the concerned utility to rectify it at the earliest. One such case has been shown in figure 5 and 6 where the auto reclosure activity was not observed during single phase to earth fault on 400 kV Korba-Bhatapara.
Figure 5. Voltage of 400 kV Korba bus during single phase to ground fault
on 400 kV Korba Bhatapar circuit from Synchrophasor data
On 400 kV Korba Bhatapra circuit, Y phase to earth fault
occurred on the circuit. As observed from the figure 5 , the
faulty phase voltage dipped at Korba and the fault got cleared
with operation of line protection [2]. While figure 6 shows
the current of the feeder from Korba end which confirms that
the all the three phases of the line tripped rather than single
phase with A/R initiation. This was informed to the concern
utility and rectified.
Figure 6. Current of 400 kV Korba Bhatapara citcuit observed from Korba
end from Synchrophasor data
The last case in the section of single phase to ground fault is associated with bus fault, which in general occur due to problem with CT/PT bursting. One such case of bus fault at
220 kV level was observed by the synchrophasor unit installed at 400 kV nearby Bus is shown in figure 7.
Figure 7. Voltage of 400 kV Boisar bus during single phase to ground fault
on 220 kv Padghe Bus II from Synchrophasor data
From Figure 7, it can be observed that Y phase to ground fault occurred at Padghe Sub-station on 220 kV Bus II due to bursting of Y phase Bus PT. This resulted in fault feeding by the nearby buses resulting in voltage dip as observed in figure 7. The fault got cleared in 160 ms with the operation of 220 kV Bus bar protection of Bus II.
With this it can be understood that how easily single phase fault can be analyzed at control centre without any DR/EL from the sub-station with the help of synchrophasor data.
III. PHASE TO PHASE FAULT
The second category of fault in the power system is phase to phase fault. In such cases, the fault may involve a ground path or may not. Such types of faults are rare in nature and generally found in transmission lines.
The case as shown in figure 8 and 9 is for the R-Y Phase
fault on 400 kV Dehgam-Gandhar circuit 2. It can be
observed from figure 8 that the phase voltages of the faulty
phases have dipped to a lower value till the fault got cleared
with the tripping of line. The current observed from Dehgam
for this line show that the fault current in the faulty phases
has increased drastically and it got cleared with tripping of
the line from both end on zone 2 protection.
Figure 8. Voltage of 400 kV Dehgam bus during Phase to Phase fault on
400 kV Dehgam-Gandhar circuit 2 from Synchrophasor data
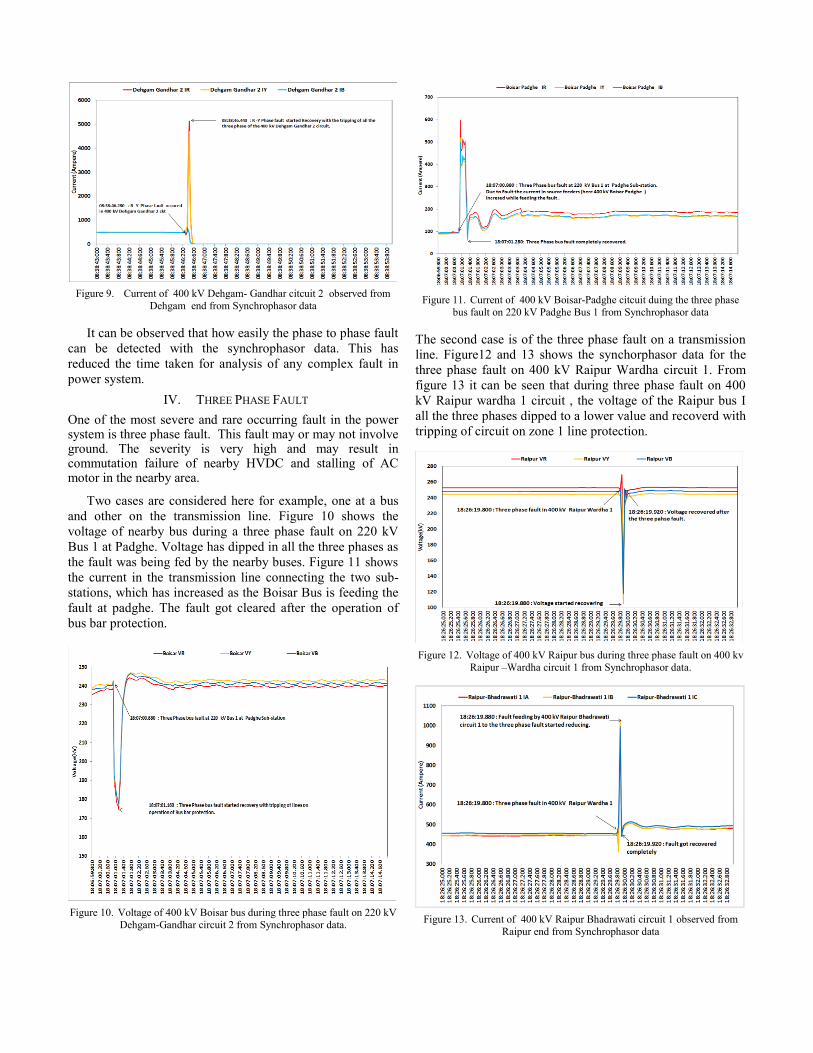
Figure 9. Current of 400 kV Dehgam- Gandhar citcuit 2 observed from
Dehgam end from Synchrophasor data
It can be observed that how easily the phase to phase fault
can be detected with the synchrophasor data. This has
reduced the time taken for analysis of any complex fault in
power system.
IV. THREE PHASE FAULT
One of the most severe and rare occurring fault in the power system is three phase fault. This fault may or may not involve ground. The severity is very high and may result in commutation failure of nearby HVDC and stalling of AC motor in the nearby area.
Two cases are considered here for example, one at a bus
and other on the transmission line. Figure 10 shows the
voltage of nearby bus during a three phase fault on 220 kV
Bus 1 at Padghe. Voltage has dipped in all the three phases as
the fault was being fed by the nearby buses. Figure 11 shows
the current in the transmission line connecting the two sub-
stations, which has increased as the Boisar Bus is feeding the
fault at padghe. The fault got cleared after the operation of
bus bar protection.
Figure 10. Voltage of 400 kV Boisar bus during three phase fault on 220 kV
Dehgam-Gandhar circuit 2 from Synchrophasor data.
Figure 11. Current of 400 kV Boisar-Padghe citcuit duing the three phase
bus fault on 220 kV Padghe Bus 1 from Synchrophasor data
The second case is of the three phase fault on a transmission
line. Figure12 and 13 shows the synchorphasor data for the
three phase fault on 400 kV Raipur Wardha circuit 1. From
figure 13 it can be seen that during three phase fault on 400
kV Raipur wardha 1 circuit , the voltage of the Raipur bus I
all the three phases dipped to a lower value and recoverd with
tripping of circuit on zone 1 line protection.
Figure 12. Voltage of 400 kV Raipur bus during three phase fault on 400 kv
Raipur –Wardha circuit 1 from Synchrophasor data.
Figure 13. Current of 400 kV Raipur Bhadrawati circuit 1 observed from
Raipur end from Synchrophasor data
With this all the three types of fault has been discussed with the help of synchrophasor data. This has shown the importance of synchrophasor measurement units in fault analysis and event detection at control centers. In the next section the validation of synchrophasor data with the disturbance recorder file is discussed for determining up to what extent it can be used and what are their limitations.
V. VALIDATION OF SYNCHROPHASOR DATA FOR FAULT
ANALYSIS AND ITS LIMITATION
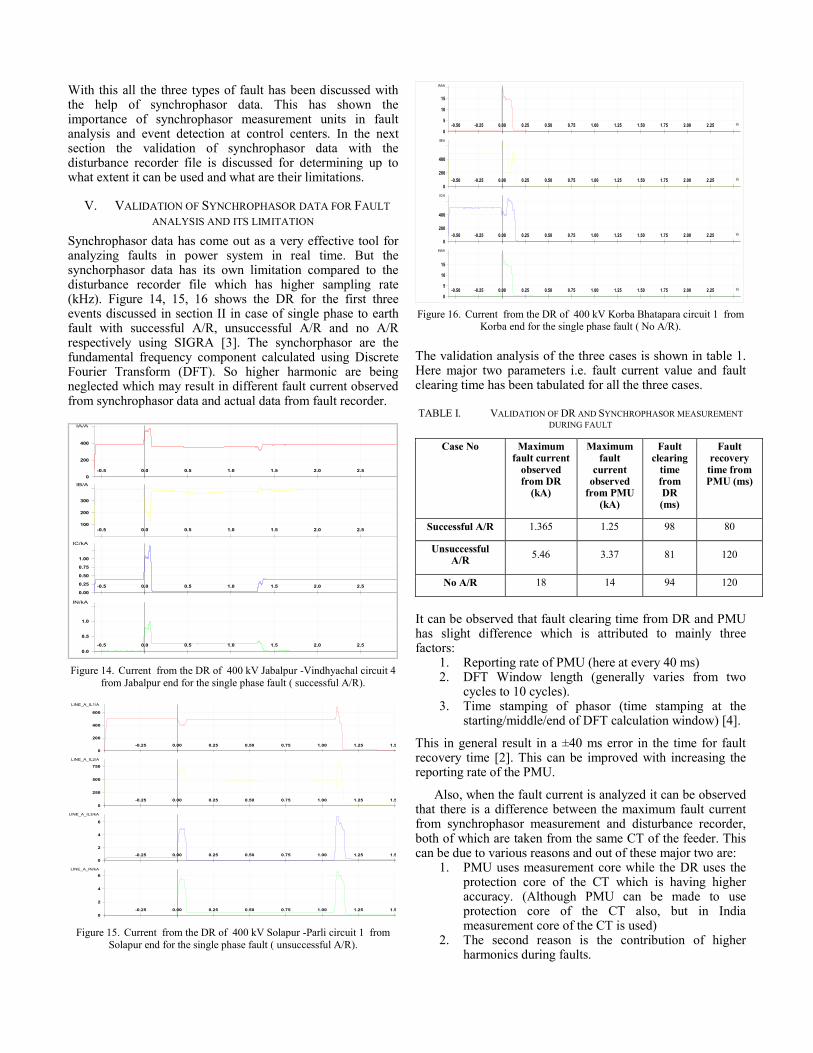
Synchrophasor data has come out as a very effective tool for analyzing faults in power system in real time. But the synchorphasor data has its own limitation compared to the disturbance recorder file which has higher sampling rate (kHz). Figure 14, 15, 16 shows the DR for the first three events discussed in section II in case of single phase to earth fault with successful A/R, unsuccessful A/R and no A/R respectively using SIGRA [3]. The synchorphasor are the fundamental frequency component calculated using Discrete Fourier Transform (DFT). So higher harmonic are being neglected which may result in different fault current observed from synchrophasor data and actual data from fault recorder.
t/s-0.5 0.0 0.5 1.0 1.5 2.0 2.5 3.0 3.5 4.0 4.5 5.0 5.5
IA/A
0
200
400
t/s-0.5 0.0 0.5 1.0 1.5 2.0 2.5 3.0 3.5 4.0 4.5 5.0 5.5
IB/A
100
200
300
t/s-0.5 0.0 0.5 1.0 1.5 2.0 2.5 3.0 3.5 4.0 4.5 5.0 5.5
IC/kA
0.00
0.25
0.50
0.75
1.00
t/s-0.5 0.0 0.5 1.0 1.5 2.0 2.5 3.0 3.5 4.0 4.5 5.0 5.5
IN/kA
0.0
0.5
1.0
Figure 14. Current from the DR of 400 kV Jabalpur -Vindhyachal circuit 4
from Jabalpur end for the single phase fault ( successful A/R).
t/s-0.25 0.00 0.25 0.50 0.75 1.00 1.25 1.50 1.75 2.00 2.25
LINE_A_IL1/A
0
200
400
600
t/s-0.25 0.00 0.25 0.50 0.75 1.00 1.25 1.50 1.75 2.00 2.25
LINE_A_IL2/A
0
250
500
750
t/s-0.25 0.00 0.25 0.50 0.75 1.00 1.25 1.50 1.75 2.00 2.25
LINE_A_IL3/kA
0
2
4
6
t/s-0.25 0.00 0.25 0.50 0.75 1.00 1.25 1.50 1.75 2.00 2.25
LINE_A_IN/kA
0
2
4
6
Figure 15. Current from the DR of 400 kV Solapur -Parli circuit 1 from
Solapur end for the single phase fault ( unsuccessful A/R).
t/s-0.50 -0.25 0.00 0.25 0.50 0.75 1.00 1.25 1.50 1.75 2.00 2.25
IA/kA
0
5
10
15
t/s-0.50 -0.25 0.00 0.25 0.50 0.75 1.00 1.25 1.50 1.75 2.00 2.25
IB/A
0
200
400
t/s-0.50 -0.25 0.00 0.25 0.50 0.75 1.00 1.25 1.50 1.75 2.00 2.25
IC/A
0
200
400
t/s-0.50 -0.25 0.00 0.25 0.50 0.75 1.00 1.25 1.50 1.75 2.00 2.25
IN/kA
0
5
10
15
Figure 16. Current from the DR of 400 kV Korba Bhatapara circuit 1 from
Korba end for the single phase fault ( No A/R).
The validation analysis of the three cases is shown in table 1. Here major two parameters i.e. fault current value and fault clearing time has been tabulated for all the three cases.
TABLE I. VALIDATION OF DR AND SYNCHROPHASOR MEASUREMENT
DURING FAULT
Case No Maximum fault current
observed from DR
(kA)
Maximum fault
current observed
from PMU (kA)
Fault clearing
time from DR (ms)
Fault recovery
time from PMU (ms)
Successful A/R 1.365 1.25 98 80
Unsuccessful A/R
5.46 3.37 81 120
No A/R 18 14 94 120
It can be observed that fault clearing time from DR and PMU has slight difference which is attributed to mainly three factors:
1. Reporting rate of PMU (here at every 40 ms) 2. DFT Window length (generally varies from two
cycles to 10 cycles). 3. Time stamping of phasor (time stamping at the
starting/middle/end of DFT calculation window) [4].
This in general result in a ±40 ms error in the time for fault recovery time [2]. This can be improved with increasing the reporting rate of the PMU.
Also, when the fault current is analyzed it can be observed that there is a difference between the maximum fault current from synchrophasor measurement and disturbance recorder, both of which are taken from the same CT of the feeder. This can be due to various reasons and out of these major two are:
1. PMU uses measurement core while the DR uses the protection core of the CT which is having higher accuracy. (Although PMU can be made to use protection core of the CT also, but in India measurement core of the CT is used)
2. The second reason is the contribution of higher harmonics during faults.
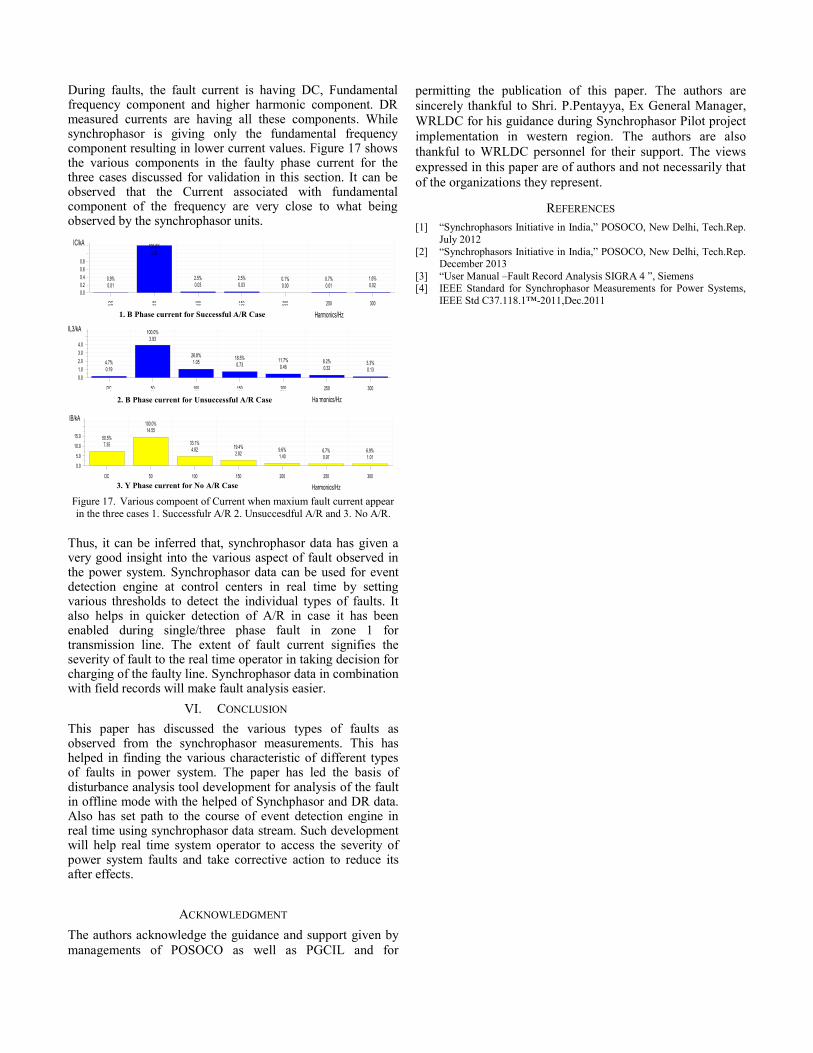
During faults, the fault current is having DC, Fundamental frequency component and higher harmonic component. DR measured currents are having all these components. While synchrophasor is giving only the fundamental frequency component resulting in lower current values. Figure 17 shows the various components in the faulty phase current for the three cases discussed for validation in this section. It can be observed that the Current associated with fundamental component of the frequency are very close to what being observed by the synchrophasor units.
4.8%13.37
100.0%275.84
16.3%45.04
19.1%52.68
17.7%48.73 8.4%
23.195.6%15.38
3.4%9.27
3.2%8.96
3.3%9.04
2.3%6.22
Harmonics/Hz
DC 50 100 150 200 250 300 350 400 450 500
IA/A
0
50
100
150
200
0.6%1.76
100.0%307.99
8.6%26.43
20.5%63.11 9.8%
30.032.7%8.35
4.2%13.01
2.1%6.39
1.4%4.25
1.8%5.46
1.6%5.07
Harmonics/Hz
DC 50 100 150 200 250 300 350 400 450 500
IB/A
0
50
100
150
200
250
0.9%0.01
100.0%1.21
2.5%0.03
2.5%0.03
0.1%0.00
0.7%0.01
1.6%0.02
1.5%0.02
2.0%0.02
0.4%0.01
0.4%0.00
Harmonics/Hz
DC 50 100 150 200 250 300 350 400 450 500
IC/kA
0.0
0.2
0.4
0.6
0.8
1.4%0.02
100.0%1.53
4.9%0.07
2.2%0.03
3.8%0.06
0.7%0.01
2.9%0.04
2.1%0.03
0.9%0.01
1.2%0.02
1.0%0.01
Harmonics/Hz
DC 50 100 150 200 250 300 350 400 450 500
IN/kA
0.00
0.50
1.00
1.50
2.00
4.7%0.19
100.0%3.93
26.8%1.05
18.5%0.73
11.7%0.46
8.2%0.32
3.3%0.13
4.7%0.19
3.4%0.13
1.8%0.07
1.1%0.04
Harmonics/Hz
DC 50 100 150 200 250 300 350 400 450 500
LINE_A_IL3/kA
0.0
1.0
2.0
3.0
4.0
13.9%52.87
100.0%379.90
5.7%21.65
3.8%14.58
2.5%9.63
1.3%4.92
1.4%5.44
0.4%1.48
1.1%4.01
1.0%3.81
0.5%2.09
Harmonics/Hz
DC 50 100 150 200 250 300 350 400 450 500
IA/A
0
100
200
300
50.5%7.35
100.0%14.55
33.1%4.82 19.4%
2.829.6%1.40
6.7%0.97
6.9%1.01
5.8%0.84
4.1%0.60
3.7%0.54
3.7%0.53
Harmonics/Hz
DC 50 100 150 200 250 300 350 400 450 500
IB/kA
0.0
5.0
10.0
15.0
10.6%61.31
100.0%580.01
8.2%47.64
5.0%28.95
3.5%20.49
1.0%5.64
2.6%14.95
2.1%12.33
1.3%7.55
1.4%8.02
2.1%12.17
Harmonics/Hz
DC 50 100 150 200 250 300 350 400 450 500
IC/A
0
100
200
300
400
50.5%7.46
100.0%14.77
33.1%4.88 19.4%
2.869.7%1.43
6.6%0.98
6.9%1.03
5.8%0.85
4.1%0.61
3.7%0.54
3.7%0.55
Harmonics/Hz
DC 50 100 150 200 250 300 350 400 450 500
IN/kA
0.0
5.0
10.0
15.0
Figure 17. Various compoent of Current when maxium fault current appear
in the three cases 1. Successfulr A/R 2. Unsuccesdful A/R and 3. No A/R.
Thus, it can be inferred that, synchrophasor data has given a very good insight into the various aspect of fault observed in the power system. Synchrophasor data can be used for event detection engine at control centers in real time by setting various thresholds to detect the individual types of faults. It also helps in quicker detection of A/R in case it has been enabled during single/three phase fault in zone 1 for transmission line. The extent of fault current signifies the severity of fault to the real time operator in taking decision for charging of the faulty line. Synchrophasor data in combination with field records will make fault analysis easier.
VI. CONCLUSION
This paper has discussed the various types of faults as observed from the synchrophasor measurements. This has helped in finding the various characteristic of different types of faults in power system. The paper has led the basis of disturbance analysis tool development for analysis of the fault in offline mode with the helped of Synchphasor and DR data. Also has set path to the course of event detection engine in real time using synchrophasor data stream. Such development will help real time system operator to access the severity of power system faults and take corrective action to reduce its after effects.
ACKNOWLEDGMENT
The authors acknowledge the guidance and support given by
managements of POSOCO as well as PGCIL and for
permitting the publication of this paper. The authors are
sincerely thankful to Shri. P.Pentayya, Ex General Manager,
WRLDC for his guidance during Synchrophasor Pilot project
implementation in western region. The authors are also
thankful to WRLDC personnel for their support. The views
expressed in this paper are of authors and not necessarily that
of the organizations they represent.
REFERENCES
[1] “Synchrophasors Initiative in India,” POSOCO, New Delhi, Tech.Rep.
July 2012
[2] “Synchrophasors Initiative in India,” POSOCO, New Delhi, Tech.Rep. December 2013
[3] “User Manual –Fault Record Analysis SIGRA 4 ”, Siemens [4] IEEE Standard for Synchrophasor Measurements for Power Systems,
IEEE Std C37.118.1™-2011,Dec.2011 1. B Phase current for Successful A/R Case
2. B Phase current for Unsuccessful A/R Case
3. Y Phase current for No A/R Case