carolan, christopher - spiral calendar -theory
DESCRIPTION
14TRANSCRIPT

From The Spiral Calendar, By Christopher Carolan
Published by New Classics Library, ©1992 Christopher Carolan
Chapter 1
A Detective Story
The Question
In what way did the 1987 stock market crash most closely resemble the 1929 crash? With the answer to this question I have formulated a method for forecasting periods of extreme emotional human behavior. These periods often occur at a time when markets, such as those for stocks or commodities will change direction. This method is also applicable to mass human behavior in other areas such as political movements and trends. There are additional implications of my research, namely, the cause and structure of the larger forces that create the patterns of life and growth in the affairs of men.
Before I examine the question that led to all of these ideas, I will explain why I asked that question at all. In 1987, I was a stock option trader on the Pacific Exchange in San Francisco. There I stood in a "pit," a conglomeration of humans who often behaved more like beasts, hungry for a dollar, competitive, greedy. People yelled and screamed for any advantage available. Survival of the fittest was the accepted rule. In this environment many decisions are instinctive, intuitive or emotional. The conventional wisdom explains the movements of the markets as logical reactions or progressions of the latest economic insight or data bit, but the view from the pit is different. The "crowd" divides into buyers and sellers and the pit is where they meet. Their energy is like electric potential with two polarities. The trades are the sparks that jump the gap. Traders react by "feel." Sometimes this is an advantage, and yet when emotions prevail, it is a handicap. With time spent in a pit comes the ability to sense the pulse of the crowd. The most dramatic event for a trader to witness is the sudden and complete conversion of the crowd from buyers into sellers or vice versa, an event that occurs at important market turns. I frequently witnessed prices moving quickly in one direction while the commentary of the crowd cheered on. Prices accelerate and the commentary becomes even more definitive. "They'll never go down!" traders shout. Then, prices reverse and move just as determinedly in the other direction. The mood of the crowd has changed. They are convinced they have seen an important juncture in the market. Their change of heart is not a reaction to the change in the market, but rather a simultaneous occurrence. These are traders who, individually, will tell you they are behaving with logic and reason, yet will have a consensus opinion and then all change that opinion together as if on cue. It is like watching a flock of birds flying in tight formation simultaneously reverse direction together. This is not how all markets behave at all times, but it is most evident in times of extreme emotion.
I was a six year veteran on the trading floor in late 1987 when the crash occurred. My own interest in observing the emotions of traders was sharpened by the single most extraordinary event in the lives of most current market participants. Here was emotion so great it was called a "panic," the first seen by my generation. It happened not just in one pit but in many pits, not just on one exchange but on many exchanges, not just in the U.S. but worldwide. Fear, panic and despair gripped millions simultaneously. Why?
This was not a unique event. It had happened before, most recently in 1929. In 1987, some had seen parallels to 1929 before the crash and had profited handsomely. After the crash, newspapers were full of charts comparing 1987 and 1929. Figure 1-1 compares the Dow Jones Industrial average for these two years. This chart shows all of 1929, January through December, compared to same period in 1987. The comparison is amazing. Many analysts were

captivated by the relationship between those two years until the markets stopped following the same path. The subsequent years, 1988, and 1930, were not similar. Yet the fact remains that the pattern traced by prices in 1987 followed step for step what had occurred fifty-eight years earlier. When you look at these two charts, consider that they reflect a pattern created by the behavior of a group of individuals and that each individual has the free will to buy or sell on any given day and that these groups of individuals are separated by more than a generation. Yet the patterns are similar. Why? How?
The Similarities
There are four marked similarities in the charts of the two years. These four points give the comparison of the two charts their striking resemblance.
1. Both markets had a small correction that ended in late spring; May 31 in 1929, and May 20 in 1987.
2. Sharp rallies in both markets peaked in late summer; September 3, in 1929 and August 25, in 1987.
3. Both markets attempted rallies in the early fall, which failed to exceed the summer peaks. In 1929 the lower peak was on October 11, in 1987, it was October 2.
4. The crashes occurred in October. The 1929 crash was October 29. The 1987 crash was October 19.
Each of these four points on the 1987 chart falls nine to eleven days earlier then the same point on the 1929 chart. While these analyses point out the similarities of the two charts, it is also evident that they are not strictly the same.

Now it is time for some detective work. What are the strengths and weaknesses of this analysis so far? Figure 1-1 is a chart of the two years we are comparing. The chart is interesting, but how is it made? There are three pieces of data that are critical to the appearance of Figure 1-1. Two of the pieces are obvious, the sets of stock price data for 1929 and 1987. The third is not readily apparent, but it is crucial to the appearance of Figure 1-1. It is the calendar that determines how the two other data sets align. The chart shows the first day of trading in 1929 aligned above the first day of trading in 1987, etc. By aligning both charts at the beginning of the year we are using the calendar as the yardstick of comparison. That the similarities in the charts occurred at the same time of year is what makes it most interesting. If one crash had occurred in March and the other in October, the shape of the charts may still be similar, but the comparison would no longer be as striking. The similarity in the two charts is greatly a function of the calendar. The examination of the exact dates of the similarities also uses the yardstick of the calendar as the absolute against which conclusions are drawn. The questions I wanted answered were, "Is this calendar the proper yardstick?" and "What would happen if the two years of trading data are compared with some other method of counting time?"
On Calendars
The calendar we use is the Gregorian calendar. It is an improved version of the Julian calendar named for Julius Caesar. Our calendar, with its Roman origin, does a very good job of keeping time. The time it keeps is solar time, the rotation of the earth around the sun once every 365.25 days. There are other units of time a calendar could use. Ancient calendars usually measured the time it takes for the moon to circle the earth relative to the sun. Most calendars measure one type of time accurately and then approximate the other type of time. Our solar calendar approximates lunar time with its month but it is an inaccurate measurement of lunar time. To distinguish between the modern month which is 1/12th of a solar year and the ancient month that was one moon, I will use the term "moon" for the ancient month and use month in its present context as a fraction of a solar year.
1929 1987
Solar Calendar Lunar Calendar Solar Calendar Lunar Calendar
Spring Low 31 May 2nd Moon - 23rd Day 20 May 2nd Moon - 24th Day
Summer High 3 September 6th Moon - 1st Day 25 August 6th Moon - 2nd Day
Autumn High 11 October 7th Moon - 10th Day 2 October 7th Moon - 11th Day
Crash 29 October 7th Moon 28th Day 19 October 7th Moon - 28th Day
Table 1-1
The Jewish calendar is a lunar calendar still in use to mark religious holy days. One of the holy days, Yom Kippur, in 1987 fell exactly on the third point of the four market similarities, the fall market top. There is an old stock market adage, "buy on Rosh Hashanah, (another holy day), sell on Yom Kippur." Selling stocks on Yom Kippur in 1987 was a very good thing to do. My desire to know when Yom Kippur fell in 1929 was the original impetus for my calendar investigations. The Jews borrowed their calendar from the Babylonians. A partial history of ancient calendars is explored in Chapter 8. In the Jewish calendar, the new moon is the first day of the moon cycle (month). The new moon near the spring equinox marks the first day of the first moon of the year. With this calendar I realigned the comparison of the 1929 and 1987 stock charts. The result is Figure 1-2. Shown also are the four points of similarity. Table 1-1 shows the lunar and solar dates for the same four points. The crash of 1987 occurred on the same lunar date as the crash of 1929! The other three points each fall one day later on the lunar calendar than their 1929 counterparts. Within one day, the 1929 autumnal market top occurred on the Jewish holy day of Yom Kippur.
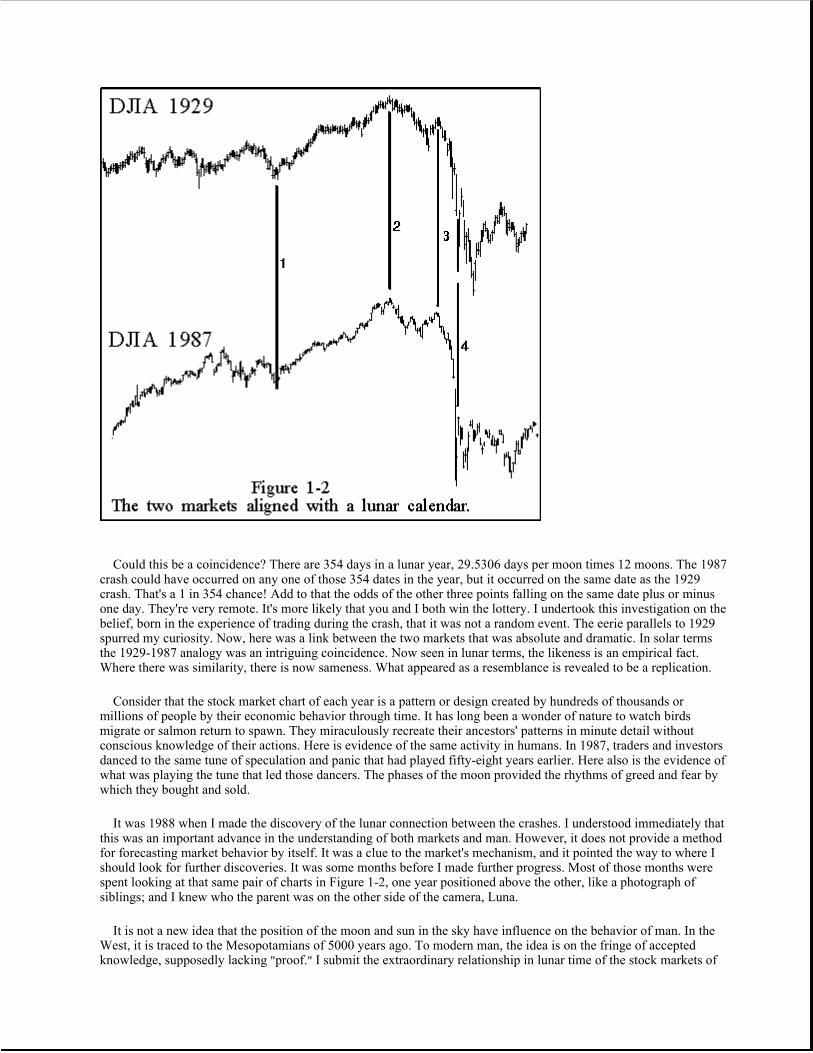
Could this be a coincidence? There are 354 days in a lunar year, 29.5306 days per moon times 12 moons. The 1987 crash could have occurred on any one of those 354 dates in the year, but it occurred on the same date as the 1929 crash. That's a 1 in 354 chance! Add to that the odds of the other three points falling on the same date plus or minus one day. They're very remote. It's more likely that you and I both win the lottery. I undertook this investigation on the belief, born in the experience of trading during the crash, that it was not a random event. The eerie parallels to 1929 spurred my curiosity. Now, here was a link between the two markets that was absolute and dramatic. In solar terms the 1929-1987 analogy was an intriguing coincidence. Now seen in lunar terms, the likeness is an empirical fact. Where there was similarity, there is now sameness. What appeared as a resemblance is revealed to be a replication.
Consider that the stock market chart of each year is a pattern or design created by hundreds of thousands or millions of people by their economic behavior through time. It has long been a wonder of nature to watch birds migrate or salmon return to spawn. They miraculously recreate their ancestors' patterns in minute detail without conscious knowledge of their actions. Here is evidence of the same activity in humans. In 1987, traders and investors danced to the same tune of speculation and panic that had played fifty-eight years earlier. Here also is the evidence of what was playing the tune that led those dancers. The phases of the moon provided the rhythms of greed and fear by which they bought and sold.
It was 1988 when I made the discovery of the lunar connection between the crashes. I understood immediately that this was an important advance in the understanding of both markets and man. However, it does not provide a method for forecasting market behavior by itself. It was a clue to the market's mechanism, and it pointed the way to where I should look for further discoveries. It was some months before I made further progress. Most of those months were spent looking at that same pair of charts in Figure 1-2, one year positioned above the other, like a photograph of siblings; and I knew who the parent was on the other side of the camera, Luna.
It is not a new idea that the position of the moon and sun in the sky have influence on the behavior of man. In the West, it is traced to the Mesopotamians of 5000 years ago. To modern man, the idea is on the fringe of accepted knowledge, supposedly lacking "proof." I submit the extraordinary relationship in lunar time of the stock markets of

1929 to 1987 as the first brick in a wall of proof I will construct. Notice also that it is when seen through the calendar of those same Mesopotamians that the evidence is made plain. The Mesopotamians will receive their full due in Chapter 8.
Why 1987?
The question I needed to answer was, "Why did the speculation and crash of 1987 happen then and not in some other year?" My knowledge of the lunar relationship gave me no clue to that answer. I slowly came to understand that the chart I was looking at was not pointing me towards the next piece of the puzzle. I was looking at 1929 and 1987 as isolated years. I needed to look at the entire time span of stock price movements. It was the interval of time in between that was the key. Before, I focused on each of the four points being at the exact same lunar calendar point. Now I saw the similarity in a different way.
The distance in time from the spring low of 1929 to the spring low of 1987 was the same as the distance in time from the 1929 top to the 1987 top. This was also the same as the distance from the 1929 fall peak to the 1987 fall peak and again the same as the distance from crash to crash. The two years had to be seen in a different way to be understood. This time span also needed a fresh perspective. It wasn't important that fifty-eight years separated these charts. It wasn't important how many days separated these charts. Weeks and months also weren't relevant. The question was. How many moons separated these events? See Figure 1-3 and Table 1-2.
Distances from market turns 1929 to market turns 1987 in moons.
Spring Low From 22nd moon - 23rd day to 2nd moon - 24th day = 716.99 moons
Summer High From 6th moon - 1st day to 6th moon - 2nd day = 717.05 moons
Autumn High From 7th moon - 10th day to 7th moon - 11th day = 717.05 moons
Crash From 7th moon - 28th day to 7th moon - 28th day = 717.02 moons
Table 1-2

Each event in 1987 occurred approximately 717 moons from the analogous point in 1929. The average of the four distances is 717.03. I felt that if there were a larger pattern to be found, this number should turn out to be significant. My first inclination was to check if it was a Fibonacci number. I first learned of Fibonacci numbers in high school. I next encountered them and the related golden section in my collegiate studies of ancient art and architecture. My third experience with Fibonacci numbers came through the work of R.N. Elliott and Robert Prechter and their analysis of the stock market. Yet 717 is not a Fibonacci number. I wondered if 717 might be some permutation of a Fibonacci number, maybe a multiple or a square root. With calculator and pencil in hand I proceeded through the sequence of Fibonacci numbers. When I entered the 29th Fibonacci number, 514,229, into the calculator and pressed the square root button -- there was 717.0976. My first thought then is still very clear in my memory: "The world is a very beautiful place."
This was the second discovery my detective work had produced. These discoveries are empirical facts linking the two great financial panics of this century with concrete external phenomena, moon phases and Fibonacci numbers.
The next two chapters will take us away from the main topic, forecasting emotional market behavior, in order to obtain a foundation of knowledge about the moon and Fibonacci numbers. This is necessary for the ideas that will follow.
This book is available direct from our website. http://www.calendarresearch.com/index.htm

The Solunar Model
What is the Solunar Model?
The model charts are composites of the price action from those years in the past when the lunar and solar calendars synchronize similarly with this year. The scale on the left of the charts runs from 0 to 100. The time frame is short term, focusing only on the most recent lunar cycle. A reading of zero would mean that in each component year, that market was at its lowest price over the previous 29-calendar day lunar cycle. A reading of one hundred indicates that all previous years were at 29-day highs at that point in time. The model is best utilized by looking for strength during periods of over-70 readings and weakness during readings under 30. Midrange readings do not imply a sideways trend; rather they indicate no consensus in the model. It’s important to realize that this model has no connection with our Spiral Calendar analysis. There are times when each approach yields markedly different analysis. The solunar calendar is an attempt to isolate those cyclical forces not explained by the Spiral Calendar model.
Solunar Example
Here bonds in early 1999 are compared to the Solunar model forecast for the same period. The model does not indicate the overall trend nor give any indication of relative price levels. It does do a good job of showing where the short-term

swings occur in this case.
Here's the slow (90-day) a version of the solunar model for the year 2000 on the bottom clip, and the actual readings from 2000. The model did a great job of pinpointing periods of strength and weakness in 2000.
The Solunar Model forecast for 2001 is included in Calendar Research's annual Long-Term Special Report. That report is included with all subscriptions or can be purchased individually http://www.calendarresearch.com/index.htm.

SPIRAL CALENDAR ANNIVERSARIES
One of the most important discoveries ever in the study of market behavior is being further proven at the current juncture (to the dismay of academia that maintains a deluded belief in "Rational Expectations", "Efficient Markets" and "Random Walks").
The stock market reversal occuring in late-July 1998 was accurately forecast years in advance by the Spiral Calendar developed by Christopher Carolan.
For more information on the Spiral Calendar, see-
http://www.calendarresearch.com/
You can read the first chapter of Chris Carolan's book, The Spiral Calendar, at the following location:
http://www.calendarresearch.com/chap1.htm
According to the Spiral Calendar, significant extremes of mass emotion in markets repeat on special lunar calendar "anniversaries" of previous extremes. To determine when such anniversaries occur, a lunar year is multiplied by exponential values of the Golden Ratio's (1.618) square root (this is a simpler approach than used by Carolan). In other words, the number of calendar days between Spiral Calendar anniversaries is determined by the following formula:
(Lunar Year) * 1.272019 to the N power
Where a "lunar year" equals 354.36 days, which is based upon 12 synodic periods (from new moon to new moon) of 29.5306 days.
1.272019 is the square root of 1.618034, the Fibonacci "Golden Ratio" that has been found to accurately predict Elliott Wave time and price movements in stock prices.
Using the above equation, you can produce a series of time intervals as below:
N 354.36 * (1.272 ^ N) -------------------------- 1 451 days 2 573 days 3 729 days 4 923 days 5 1180 days 6 1501 days 7 1909 days 8 2429 days 9 3089 days 10 3929 days 11 4998 days 12 6359 days 13 8088 days 14 10289 days
"It's over, finished, kaput. For nearly six years, Calendar Research has maintained that late July 1998 is the most important time of the decade for the U.S. stock market. For two years, we have argued that this time period may mark the end of the great bull market. Now we believe that the DJIA and S&P500 index tops of July 20 and the Nasdaq Composite top of July 21 are that important turn forecast so long ago."
-Christopher Carolan

15 13087 days 16 16647 days 17 21176 days 18 26936 days
The time spans above tend to be the periodicity between important emotional extremes and associated turning points in the stock market. The larger the time span is, the more significant the associated emotional extremes and turning points usually are.
- THE 1987 SPIRAL CALENDAR ANNIVERSARY OF 1929 -
While there are countless examples of how the Spiral Calendar works, probably the best example was the connection between the 1929 and 1987 stock market tops and subsequent crashes. From the September 3rd, 1929 stock market peak to the August 25th, 1987 peak (which involved a new moon planetary alignment), was one day more than:
354.36 days * 1.27202 to the 17th power = 21,176 days
For a comprehensive examination of the Spiral Calendar relationship between 1929 and 1987 in the U.S. stock market, you should read Chris Carolan's award-winning article, "Autumn Panics", which Mr. Carolan has conveniently and generously placed online for your reading:
http://www.calendarresearch.com/autmn_panics.htm
- THE SIGNIFICANCE OF JULY 1998 -
So what about July of 1998?
As it turns out, July of 1998 involves Spiral Calendar anniversaries of the 1987 stock market crash, a major stock market low in May of 1970 and a selling climax in mid-July of 1996.
To understand how July 1998 is a major Spiral Calendar anniversary, first note that:
354.36 days * 1.27202 to the 3rd power = 729 days 354.36 days * 1.27202 to the 10th power = 3,929 days 354.36 days * 1.27202 to the 14th power = 10,289 days
Given the periodicities above, three major Spiral Calendar anniversaries are clustered in July of 1998.
There was a significant selling climax low on July 17th, 1996. 729 days after this date (1 day less than two calendar years) is July 16th 1998 (this anniversary apparently coincided with the all-time closing high for the DJIA last Friday, July 17th).
A far more significant emotional extreme is the October 20th intraday low of the 1987 stock market crash. 3,929 days after this date is July 24th, 1998.
Finally, on May 26th, 1970, the U.S. stock market reached a major low-point in a 30%+ correction. 10,289 days after this date is July 29th, 1998.
All in all, Spiral Calendar anniversaries of emotional extremes in the U.S. stock market in 1996, 1987 and 1970 are on July 15th, 24th and 29th of 1998. Given such a cluster, an important emotional extreme should repeat in late-July of this year....something that now appears to be taking place.
The extreme already apparent is a significant stock market top represented by the DJIA topping 9000, the Nasdaq Composite topping 2000 and the NYSE topping 600. As explained in Part II, this top could very well be an Elliott Wave "Grand Supercycle" peak of the utmost historical importance.

Given the sharp rate at which stock prices have reversed from record heights thus far, a stock market crash during these Spiral Calendar anniversaries of extreme emotional events is an immediate danger. If not now, one should look for a selling climax a Fibonacci 55 days from the July 16th closing high in the DJIA, i.e., a crash into mid-September. Of course, bear in mind that September/October is the stock market crash "season". (http://www.123submit.com/forecast/special/part3.htm)

http://www.calendarresearch.com/index.htm - Recipient of the 1998 Charles H. Dow Award.
Autumn Panics:
A Calendar Phenomenon
Christopher Carolan
The crash of the Hong Kong stock market in October 1997, with its obvious parallels to similar events in the U.S. in 1987 and 1929, once again raises the specter of October as a dark and ominous month for stocks. Is it merely a coincidence that these three crashes all occurred in October? Is there a timing pattern among autumn panics useful to market participants? This article expands upon the observation, originally contained in Chapter 1 of the author’s book, The Spiral Calendar1, outlining the correlation between the lunar calendar and the stock market panics of 1929 and 1987. This paper examines how the 1997 Hong Kong panic conforms to that earlier model, as well as examines the great autumn panics of the 19th century. Finally, a look at the peculiar international character of panics, and its implications for the possible causes of these panics.
Definition of Terms.
Panic: The focus of this article is on short-term equity market panics. The crashes of 1929 and 1987 are the obvious examples. I define these panics as one-to-three day, free-fall drops of approximately 20% in the major averages. The term "panic" is preferred over "crash" as the definition of panic stresses the suddenness and irrationality of the event. Panics were originally ascribed to the god Pan simply because there were no obvious fundamental causes for their occurrence.
Collapse: Collapse is used to signify the larger macro market decline lasting weeks or months within which the panic occurs. An example would be the Hong Kong panic of October 1997, occurring within the larger Asian equity and currency collapse that ran from July 1997 to January 1998.
Annual Lunar Calendar: The annual lunar calendar used here is based on the Babylonian calendar, which was the model for the later Jewish calendar. This annual lunar calendar labels the date of the first new moon following the spring equinox as month one, day one; or 1-1. The following date is 1-2. The date of the second new moon after the spring equinox is 2-1, etc... The difficulty with annual lunar calendars, and one of the reasons for their abandonment, is that the solar year does not have an even number of months. Thus, some years in an annual lunar calendar have 12 months, others 13. For our purposes, which focus on the Autumn months, this issue is inconsequential. All calculations use Eastern Standard Time to determine the dates of the lunar phases.
In 1992, this author demonstrated how the panic dates

of "Black Tuesday," October 29, 1929, and "Black Monday," October 19, 1987 occurred on the same annual lunar calendar date, 7-28. Additionally, the other similar points in the comparisons of those two years, the spring lows, summer highs and autumn failure highs all occurred within one day on the lunar calendar. Figure 1 shows those years in a chart aligned with the lunar calendar, where similar lunar dates are juxtaposed above each other. The panics are marked with arrows. The other similar features are denoted with dashed lines. The chart also includes Hong Kong’s Hang Seng index for the panic year 1997.
These price moves are extraordinarily large over a very short period of time. Are these panics the largest such declines, or do we selectively remember the October panics and forget those of other months? A scan of daily data of the Dow Jones Industrial Average from 1915, the Hang Seng index from 1980, The Japanese Nikkei index from 1950, and the German DAX index from 1960 for the 10 largest, single-day percentage drops is shown in table 1. Seven of those ten declines were days associated with one of the three panics. Two of the others, the spring 1989 declines in the Hong Kong market, were tied to a fundamental news event, the Tiananmen crisis in China. The final entry is from the German market during the "mini-crash" of October 1989, an October event similar to the others, but smaller in magnitude. The point to stress here is that in their breadth and ferocity, these panics lie outside the boundaries of normal price action. There are no other comparable one-to-three day declines of this magnitude in the data. They represent the very largest percentage drops in the database. This is not normal market behavior. What else ties these events together? The panics occupy virtually identical positions on the annual lunar calendar.
Table 2 shows the percentage declines for each panic in the key four-day time span around the lows. The lunar dates

7-27 and 7-28 are the "dark days," encompassing the various Black Tuesdays of N.Y. in 1929 and Hong Kong in 1997, and the Black and Blue Mondays in N.Y. in 1987 and 1997 respectively. In each case, lunar date 7-28 marked the end of the panic and the next two days, 7-29 and 7-30 (or 8-1, some lunar months have 29 days, others 30) saw significant retracement rallies. Table 3 groups the data into two-day segments and includes the percentage of these retracement rallies. This table shows the striking similarity of these panics and how that similarity conforms to the annual lunar calendar.
Table 4 pinpoints the precise timing of the panic lows on the lunar calendar. The timing from 1929 is gathered from the news accounts that described stock prices as rallying sharply off their lows in the last fifteen minutes of trading on Black Tuesday, October 29. The 1987 and 1997 times are from available databases for the Dow Industrials and are corrected to Eastern Standard Time. The table also shows the date and time of the nearest lunar phase, the eighth new moon on the annual lunar calendar, as well as the difference in hours between the stock market’s low and the moon’s phase. The timing of these three great panic lows is within twenty-four hours of each other. In other words, all three lows fall within the same one-half of one percent of the calendar year.
A review of the Pre-1915 Autumn Panics:
The Panic of 1907.
The so-called panic of 1907 does not fit our short-term panic criteria. There was no market decline of approximately 20% in the span of one-to-three days. The largest, single-day declines were 3% in the Dow Jones Industrial Average during the collapse. There was a collapse and coincident banking panics, most of which occurred in October of that year. Sobel, in Panic on Wall Street2, describes the ending of the collapse. J.P Morgan put together his plan to save

the banking system on November 3-5, 1907, 7-28 through 7-30 on the annual lunar calendar. After being closed for Election Day on November 5 (7-30), stocks rallied strongly on lunar 8-1. The crisis was over. The timing of the end of the crisis is consistent with the lunar panic model. The day Morgan realized the banking system was not going to fail, he put into motion a plan to save the banks, which ultimately arrested the decline. That day was lunar 7-28, the same date as the lows of the later 20th century panics.
The Crash of 1873.
September 18 and 19, 1873 were labeled "Black Thursday" and "Black Friday" in the collapse of 1873. The Friday selling took prices of major stocks 5 to 25% percent below Thursday’s already collapsed levels. This panic was considered the greatest on Wall Street until 1929. The news accounts describe the same type of free fall and despair as the 20th century counterparts. The annual lunar calendar dates of "Black Thursday" and "Black Friday" were 6-27 and 6-28, one month earlier, but exactly the same lunar days as the 20th century examples. News accounts describe a temporary bottom late on Friday. Saturday, September 20 brought renewed selling and the closure of the exchange after a shortened two-hour trading day. The stock exchange remained closed for a week thereafter. Though on Monday September 22 prices rose sharply in trading in the streets. The timing of the 1873 Autumn panic is consistent with the 20th century results, though exactly one month earlier.
The Crash of 1857.
The collapse of 1857 was not a stock market free-fall in the sense of the 20th century panics outlined above. It was a very sharp drop in stocks over a period of nine weeks, accompanied by a number of runs on banks, persistent pressure on the banking system, and sharply rising interest rates. Also, it was international in scope, a facet we’ll address later. Though the selling in the equity markets did not climax in a free-fall panic, the pressure on the banking system did, as the N.Y. banking panic broke out on October 13 and mayhem continued for two days thereafter. Sobel, in the Panic on Wall Street3, quotes George Strong writing on October 15. "Wall Street blue with collapse. Everything flaccid like a defunct Actina." On the annual lunar calendar, October 13 and 14, 1857 are 7-27 and 7-28, the same "dark days" as the 20th century examples.
Causation:
The correlation between the annual lunar calendar and the timing of the three 20th century panics as well as the supportive data from the 19th century does not prove that an annual lunar calendar position is the cause of those panics. A few examples of anything cannot statistically prove a hypothesis. However, it should be realized that each occurrence is not a 50-50, or true/false proposition. If the Hong Kong panic had occurred on any of the 360 days of 1997 other than lunar 7-27, 7-28, 6-27, or 6-28; then this model would be effectively discredited. Yet the 1997 Hong Kong panic climaxed 5 hours after the timing of the 1987 panic and 20 hours after the 1929 panic on the lunar calendar.
Previous theories explaining panics have not fared well when the next panic came along. In the 19th century, it was widely believed that panics occurred in October specifically because banks’ cash positions were weakened as farmers were paid for the new crop. Yet today, agriculture makes up a much smaller fraction of the world economy than before, yet October panics are still with us. The Federal Reserve System was set up in the belief that if banking panics were prevented, stock market panics would cease to exist as well. That causal theory was disproved by the 1929 crash. The 1929 panic was blamed on low margin levels, yet 1987 happened anyway. In 1987, the finger was pointed at program trading. However, the 1997 panic occurred without any appreciable role by program traders.
The lunar calendar model of panics, alone among theories, not only survived the next panic intact, but its basic tenet was remarkably affirmed by the precise timing of the 1997 low.
The timings of financial collapses do not show a pattern. The 1997 Asian collapse began in July, while the crisis of 1987 and the collapse of 1857 began in August. The 1929 and 1873 examples began in September. Yet in each case, the start of the collapse did not result in immediate widespread panic. Those panics seem to wait for a particular time period on the calendar, the 27th and 28th days of the autumn lunar months, usually October, but in one instance

September.
The International Question:
The international character of financial crises has been a difficult problem for those who have sought to ascribe causes to collapses and panics. Kindleberger, in Manias, Panics and Crashes writes, "Time and again, observers like Juggler, Mitchell and Morgenstern have observed that financial crises tend to be international, either running parallel from country to country or spreading by one means or another from the country where they originate to other countries.4" And "What is remarkable is that securities prices do the same even when only a few securities can be said to be truly international, that is, are traded on several markets, their prices joined by arbitrage. In 1929 all stock markets crashed simultaneously; the same was largely true in October 1987…It is striking that share prices behaved in parallel almost sixty years apart, even though share prices were thought not to have been integrated in the 1920s as they were in the 1980s.5"
The panics of 1987 and 1997 highlighted the international quality of panics. Traders the world over saw these markets dive and then rally in unison. In this wired world, that interconnection is not so extraordinary, though Kindleberger is surprised by the international nature of the 1929 collapse.
An examination of the 1857 collapse is more revealing. Kindleberger notes, "What is striking is the concentrated nature of the crises…Clapham observes that it broke out almost at the same moment in the United States, England, and Central Europe, and was felt in South America, South Africa and the Far East.6" Aside from the international nature of the macro collapse, the 1857 collapse affords a unique, controlled database of market behavior in the "dark days" of lunar 7-27 and 7-28 on two continents. In 1857, the Atlantic cable linked America with England by telegraph. In the early days of the collapse, the telegraph cable failed and all communication was done by ship for the remainder of the crisis. The London Times and The New York Times from the period leading up to and through the N.Y. banking panic provide striking evidence of two markets in distress. Wall Street began its rally from the depths of the collapse on October 13, 1857 (lunar 7-27) at the same time the banking panic broke out in N.Y. Table 5 is reprinted from The N.Y. Times of October 14, illustrating the sharp rise in prices underway as contrasted with the lows of October 13. I’ve added the column on the right showing the month’s-end prices. Some issues had made their lows earlier in September, but others were at or near their lows on October 13. What’s clear is that prices began to rally from their depressed levels on lunar 7-27, coincident with the outbreak of the banking panic. This sequence parallels the 1987 experience, when U.S. bond prices began a sharp rally from their lows on lunar 7-27, coincident with the outbreak of the stock panic.

At this same time, Europe was aware of, and sharing in, the collapse in America. In the week leading up to October 13, the bank of England raised their discount rate twice, while Paris, Hamburg and Amsterdam each raised their rates once. Though debt and equity prices traded down sharply, there was no free-fall panic. London stocks and debt bottomed decisively on October 13 at the beginning of the trading day. The London Times of November 2, 1857 summarized the events of October and printed the table of prices labeled here as Table 6. To that table is added the date of the month’s low for each security. Here is the commentary accompanying the table. "The range of Consols (government debt) has been unusually extensive, showing a difference of 4 percent between the highest and lowest prices, although at the conclusion (of the month) the market has returned to the precise position in which it stood at the commencement…In railway shares the fluctuations have also been violent, and the rebound, except in a few cases has not been equal to that of the funds."
The London Times offered this account of the trading in debt on October 13 in its October 14 edition. "The fluctuations in the funds today (Oct. 13) have again been most rapid and extensive. The market opened with a great weakness at a fall of nearly one and a quarter percent from the heavy prices of last evening. But there was subsequently a considerable reaction and a more healthful tone became apparent in all departments of business." Now, here’s the account of stock trading on October 13 from The New York Times of October 14. "The stock market this afternoon advanced from 1 to 3 percent, the conviction being general that the basis of business would be changed tomorrow and that a large amount of money held in abeyance since the panic first paralyzed confidence will be set free now that the worst is known…"
The cause of the market low in New York on October 13 is ascribed to the banking panic, yet London bottomed on the same day. The selling, motivated by fear, was pervasive on both side of the Atlantic leading up to October 13. That selling ceased and a vigorous rally commenced on the same day, continents apart, with neither market having access to any timely information from the other. Word of the N. Y. banking panic did not reach London until October 26, and was then reported in The Times the following day.
The sudden, international cessation of distress selling that is a hallmark of 20th century panics also occurred in the crisis of 1857, at a time when no timely communication existed. The international character of panics has been a stumbling block to those who subscribe to local, "fundamental" causes for these panics. Contrarily, a lunar-based model for panics would seem to require an international manifestation of the phenomenon. If the moon is affecting market participants, it should affect them the world over. All the panic examples cited here, from 1857 through 1997, have been international, yet the dearth of communication technology in 1857 provides a datum that cannot be explained as a serial reaction. The international character of panics is distinctively supportive of the lunar model.

Uses:
Put simply, every market participant should have his calendar marked with the "dark days" of lunar 7-27 and 7-28. Even better, everyone should calculate the time of the eighth new moon and subtract 55 hours from that point. A time window of plus or minus twelve hours from that point is the lunar calendar model for an Autumn panic’s low point. There may not be another October stock panic for sixty years or longer. And the lunar model offers no clues as to which years will see a panic. Yet there can be no doubt, as the trillions of dollars lost during these panics makes plain, market intelligence that can pinpoint when an unfolding panic will climax is invaluable. In 1997, as worldwide markets became unglued in October, the lunar calendar model provided by 1987 and 1929 pointed to late Monday, October 27 as the ideal low point. The dramatic early Tuesday morning low of October 28 demonstrated the model’s effectiveness in real time.
Calendars are complex mechanisms. Calendar research must recognize the importance of both lunar and solar calendars. The annual lunar model for panics points to the 27th and 28th days of the lunar month as the dark days, yet that is only true in the autumn season, the 6th or 7th lunar month. Past studies that purport to find no lunar relationship in markets have treated all lunar phases alike, lumping spring and fall together as well as summer and winter. Likewise, specific seasonal analysis tends to ignore the concurrent lunar calendar. Those who dismiss that October may be a rough month for stocks cite that overall, it is not the worst month for stocks statistically, falling on average .5% since 1915. A proper approach to calendar research suggest that distinctions should be made among Octobers based on the lunar calendar. Here’s the lunar distinction. When there is no full moon between October 3 and 19 inclusive, the Dow has been up 1.5% in October since 1915. In those years with a full moon between those dates, the Dow’s average change is a loss of 1.9%. Seasonal analysis should recognize the lunar distinctions and vice versa. The annual lunar calendar makes those distinctions. When autumn panics are viewed though its prism, the results are remarkable.
1 Carolan. The Spiral Calendar. New Classics Library. 1992
2 Sobel. Panic On Wall Street. Dutton. 1988 pp 318-320
3 ibid. p 106.
4 Kindleberger. Manias Panics and Crashes. Basic Books. 1989. p 131.
5 ibid. p 131.
6 ibid. p. 143.
Autumn Panics: A Calendar Phenomenon
© 1998 Christopher Carolan
mailto:[email protected]

Return of the 58-Year Panic Cycle ���
�
�������������� �� �������������� �� �������������� �� �������������� �� ������������
����
Springtime is not considered high season for panics on Wall Street. That distinction belongs to autumn. But spring panics do bear enough of a resemblance to their autumn cousins to be forecastable, both in their consistent orientation to the lunar calendar, and in their link to a precise cycle running just short of fifty-eight years. In my paper, Autumn Panics: A Calendar Phenomenon I demonstrated the consistent link among major autumn panics with the lunar calendar.
First let’s examine three of Wall Street’s greatest October panics. The first great October panic, the crash of 1857, enveloped not only Wall Street but European markets as well. Stock markets on Wall Street and London both bottomed on October 13, 1857, four days before the new moon. This crash is the earliest evidence of the fifty-eight year panic cycle. Charles Kindleberger’s Manias, Panics and Crashes list an October panic in Hamburg in 1799. The London Times reports that Hamburg panic as being at its zenith on October 25, twelve days short of a precise 58 years prior to the 1857 low. October 25, 1799 was three days before the new moon as well.
The two great 20th century October panics are of course, 1929 and 1987. October 29, 1929 Black Tuesday and October 19, 1987, Black Monday are separated by fifty-eight years less ten days. Both crash days, Black Monday and Black Tuesday occurred three days before the new moon. Spring panics are in some respects the opposite of autumn panics. Where the autumn panics listed above fall three to seven weeks after the autumn equinox, the spring versions are on the opposite side of the calendar, three to seven weeks after the vernal equinox. The positioning on the lunar calendar is opposite as well, with the spring panics showing the same clustering as the autumn ones, but this time around the full moon instead of the new moon. Springtime panics are not as sharp as the autumn versions, with declines smaller than the approximate 20% over 1 or 2 days seen in Dow Industrial Average in 1987 and 1929, or 1997 in the Hong Kong market. �
Wall Street’s most memorable 19th century springtime panic was “Grant’s Panic” that broke out on May 12, 1884. The panic is named after the former president, who was co-owner in a failed bank that helped precipitate the panic. The date of the May 1884 panic was 2 days after the full moon. Fifty-eight years less fourteen days after the outbreak of Grant’s panic saw one of the great selling climaxes on Wall Street, the stock market low of April 28, 1942.

While history does not record this bottom as a panic per se, in some respects it is the most important market low of the 20th century. Though stock prices were lower in July 1932, the April 1942 low saw the century’s lows in both average share volume and NYSE seat prices. That 1942 low occurred two days before the full moon.
Fifty-eight years less fourteen days after that April 1942 low brings us to April 14, 2000, Wall Street’s most recent springtime panic. This panic occurred four days before the full moon. The original thesis of Autumn Panics: A Calendar Phenomenon was that panics are as much a phenomenon of calendars, both seasonal and lunar as anything else. This April’s panic drop, with its seasonal and lunar timing common to earlier panics, and it’s occurrence on a precise 58-year panic cycle adds further proof of that thesis. �
�������������� ����������
������������ ����� ������������ �����
�
