carbon sequestration in landscapes - fwr sequestration in landscapes - howard... · animals) living...
TRANSCRIPT

CARBON SEQUESTRATION IN LANDSCAPES
With reference to Carbon Auditing for the Landscape Industry.
Landscape & Environmental
Services Ltd.Howard Wood B.Sc.(Hons.)
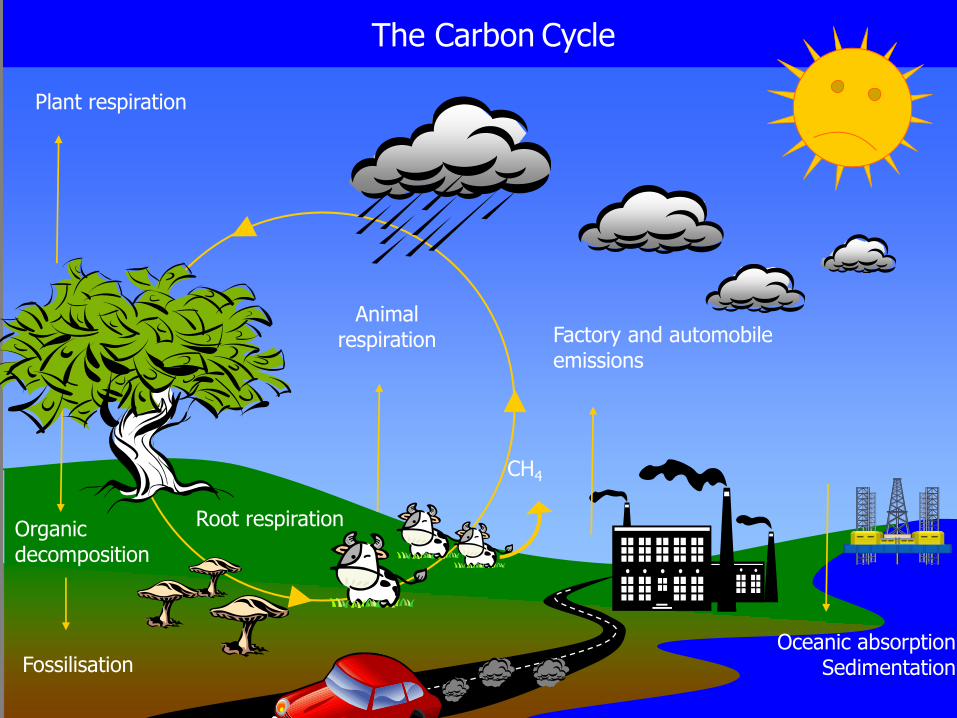
Factory and automobile emissions
Plant respiration
Organic decomposition
Animal respiration
CH4
Fossilisation
The Carbon Cycle
Oceanic absorptionSedimentation
Root respiration

• Conventionally Green House Gases are expressed as CO2
equivalent.
• Man’s activity contributes to an annual increase of 6 500 000000 tonnes of CO2 / yr. of which about half is reabsorbed byincreased photosynthesis and by dissolution in the oceans.
• A European citizen emits 16 t CO2 per year.
• Methane is CH4 is 21 times more effective as a greenhousegas than CO2.
• Nitrous oxide (N2O) produced in fertiliser manufacture is300 times more effective as a greenhouse gas than CO2.
UNDERSTANDING CARBON – A FEW FACTS
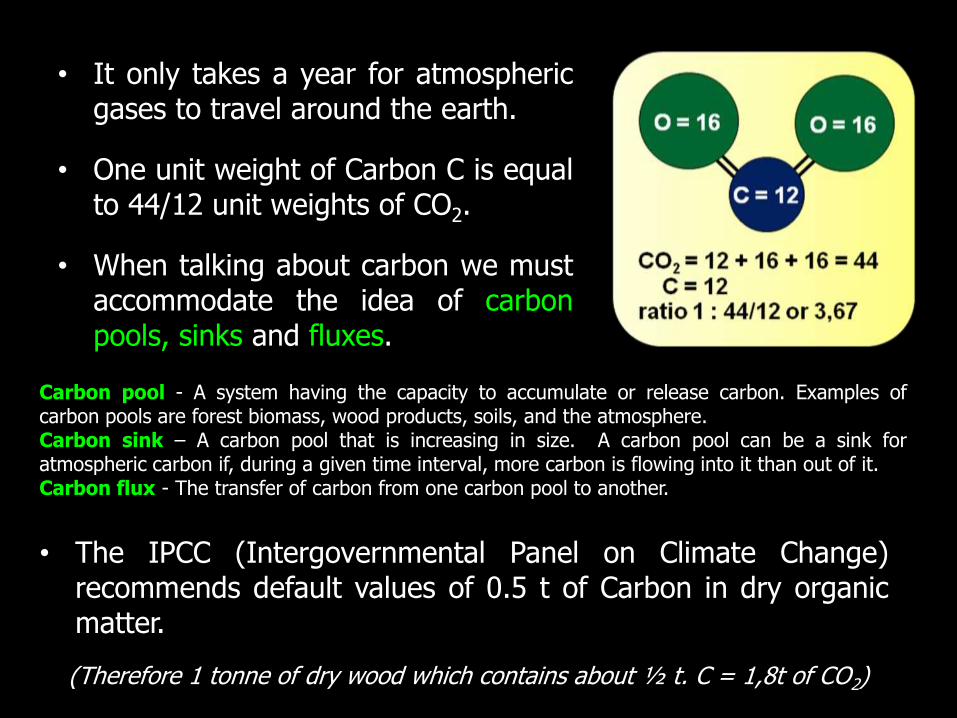
• It only takes a year for atmosphericgases to travel around the earth.
• One unit weight of Carbon C is equalto 44/12 unit weights of CO2.
• When talking about carbon we mustaccommodate the idea of carbonpools, sinks and fluxes.
• The IPCC (Intergovernmental Panel on Climate Change)recommends default values of 0.5 t of Carbon in dry organicmatter.
(Therefore 1 tonne of dry wood which contains about ½ t. C = 1,8t of CO2)
Carbon pool - A system having the capacity to accumulate or release carbon. Examples ofcarbon pools are forest biomass, wood products, soils, and the atmosphere.Carbon sink – A carbon pool that is increasing in size. A carbon pool can be a sink foratmospheric carbon if, during a given time interval, more carbon is flowing into it than out of it.Carbon flux - The transfer of carbon from one carbon pool to another.
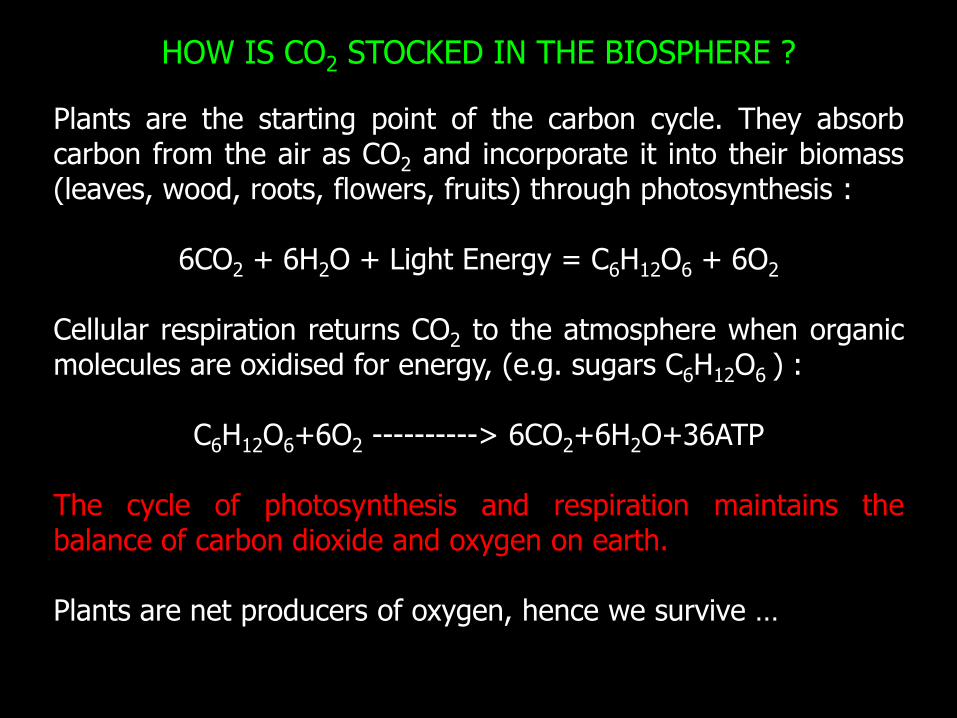
Plants are the starting point of the carbon cycle. They absorbcarbon from the air as CO2 and incorporate it into their biomass(leaves, wood, roots, flowers, fruits) through photosynthesis :
6CO2 + 6H2O + Light Energy = C6H12O6 + 6O2
Cellular respiration returns CO2 to the atmosphere when organicmolecules are oxidised for energy, (e.g. sugars C6H12O6 ) :
C6H12O6+6O2 ----------> 6CO2+6H2O+36ATP
The cycle of photosynthesis and respiration maintains thebalance of carbon dioxide and oxygen on earth.
Plants are net producers of oxygen, hence we survive …
HOW IS CO2 STOCKED IN THE BIOSPHERE ?
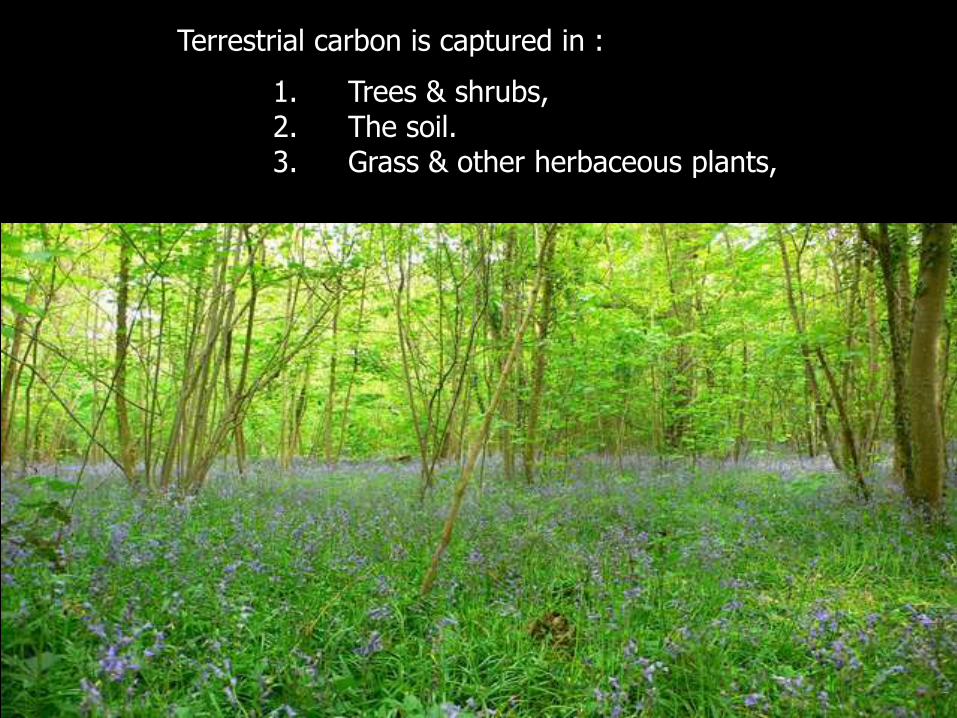
Terrestrial carbon is captured in :
1. Trees & shrubs,2. The soil.3. Grass & other herbaceous plants,
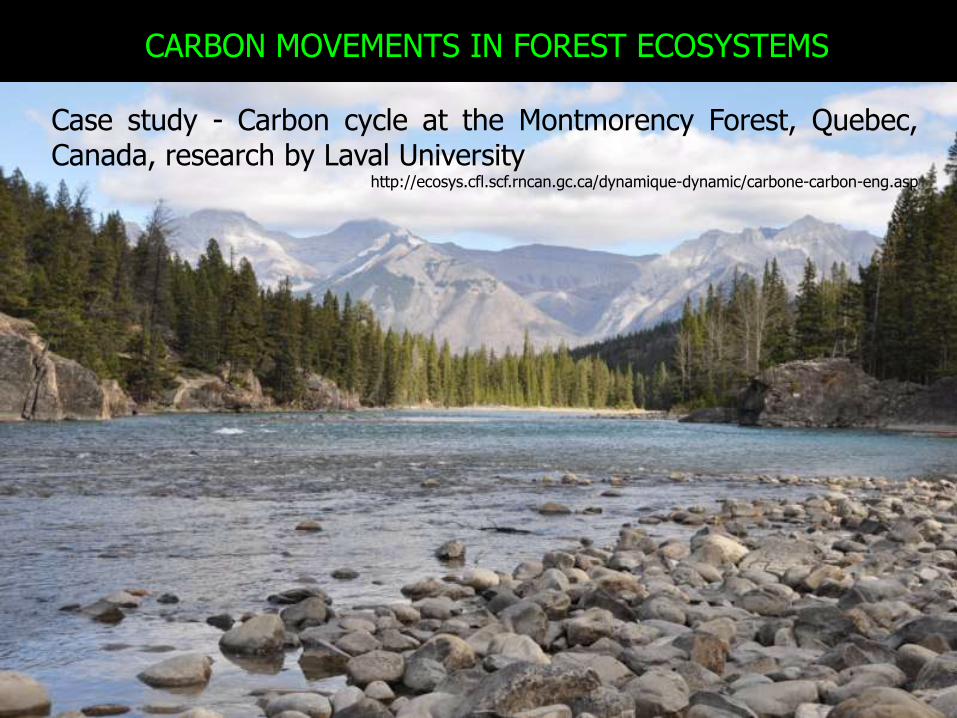
CARBON MOVEMENTS IN FOREST ECOSYSTEMS
Case study - Carbon cycle at the Montmorency Forest, Quebec,Canada, research by Laval University
http://ecosys.cfl.scf.rncan.gc.ca/dynamique-dynamic/carbone-carbon-eng.asp

The study site is a 1 ha. forest stand of Balsam Fir (Abiesbalsamea) and Black Spruce (Picea mariana).
Precipitation is abundant both in winter and summer.
The growing season lasts only three months.
The forest has been fixing carbon for 60 years, in wood, roots andplant litter. As long as it was growing, the forest was a carbonsink.

The quantity of carbon present in this ecosystem, (the carbonpool), is now stable.
Photosynthesis still fixes carbon, but an equal amount isreleased by the respiration of all the organisms (plants andanimals) living in the forest.
The carbon pool at the Montmorency Forest site contains 634 tCO2 /ha), distributed as follows:
kg C/m² t. CO2/ha. %
Wood 4.50 165.0 26 %
Leaves 1.50 55.0 9 %
Roots 1.30 47.7 8 %
Humus 3.00 110.0 17 %
Mineral soil 7.00 256.7 40 %
Total 17.3 634.4 100 %
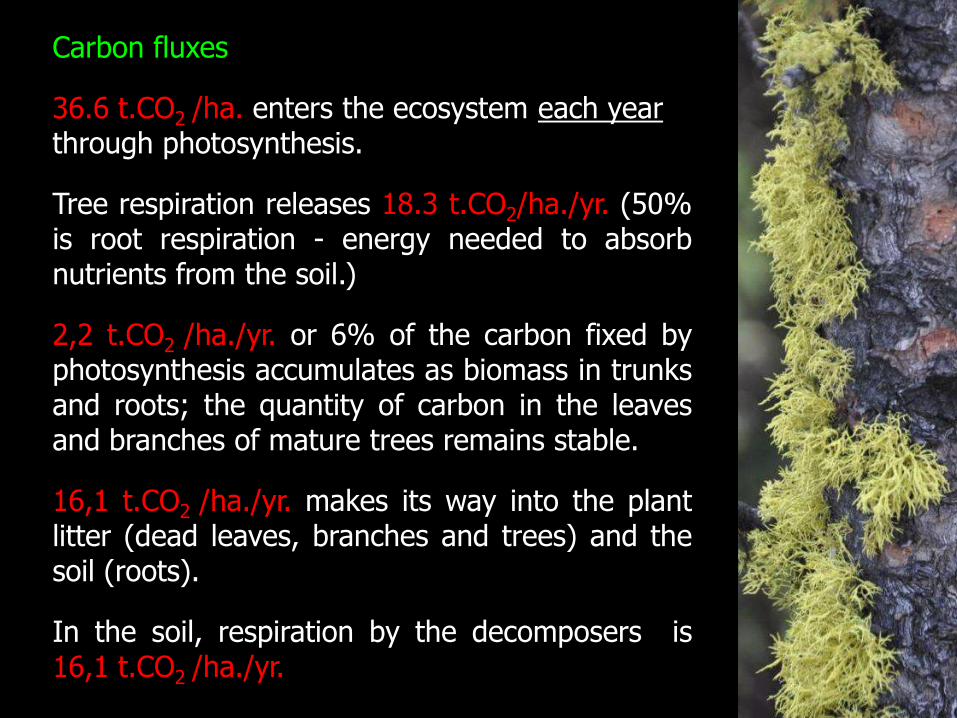
Carbon fluxes
36.6 t.CO2 /ha. enters the ecosystem each yearthrough photosynthesis.
Tree respiration releases 18.3 t.CO2/ha./yr. (50%is root respiration - energy needed to absorbnutrients from the soil.)
2,2 t.CO2 /ha./yr. or 6% of the carbon fixed byphotosynthesis accumulates as biomass in trunksand roots; the quantity of carbon in the leavesand branches of mature trees remains stable.
16,1 t.CO2 /ha./yr. makes its way into the plantlitter (dead leaves, branches and trees) and thesoil (roots).
In the soil, respiration by the decomposers is16,1 t.CO2 /ha./yr.
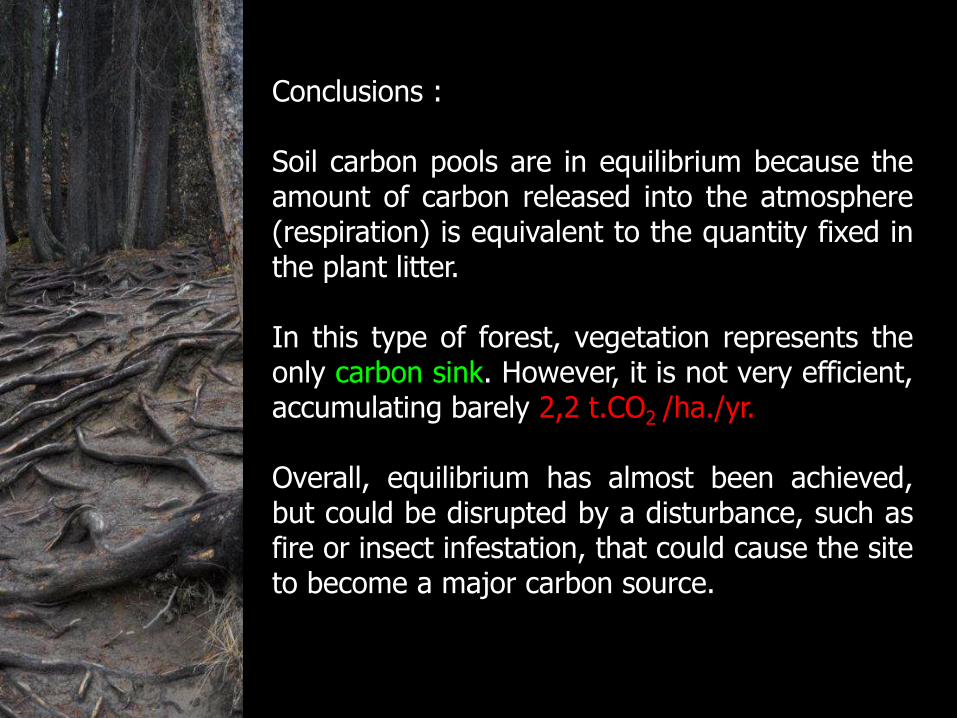
Conclusions :
Soil carbon pools are in equilibrium because theamount of carbon released into the atmosphere(respiration) is equivalent to the quantity fixed inthe plant litter.
In this type of forest, vegetation represents theonly carbon sink. However, it is not very efficient,accumulating barely 2,2 t.CO2 /ha./yr.
Overall, equilibrium has almost been achieved,but could be disrupted by a disturbance, such asfire or insect infestation, that could cause the siteto become a major carbon source.
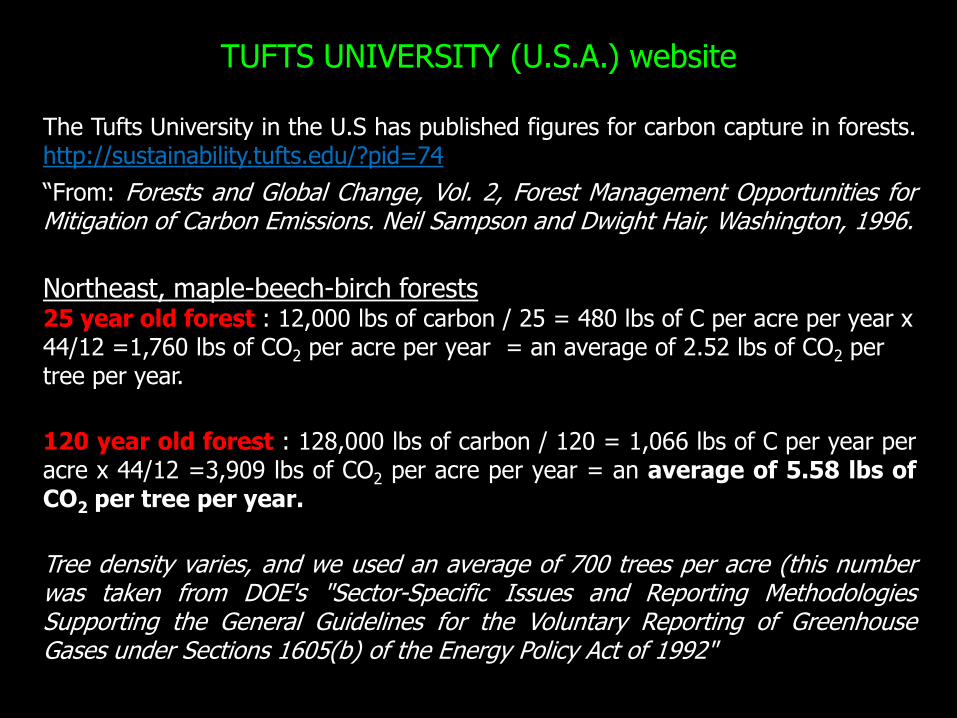
TUFTS UNIVERSITY (U.S.A.) website
The Tufts University in the U.S has published figures for carbon capture in forests.http://sustainability.tufts.edu/?pid=74
“From: Forests and Global Change, Vol. 2, Forest Management Opportunities forMitigation of Carbon Emissions. Neil Sampson and Dwight Hair, Washington, 1996.
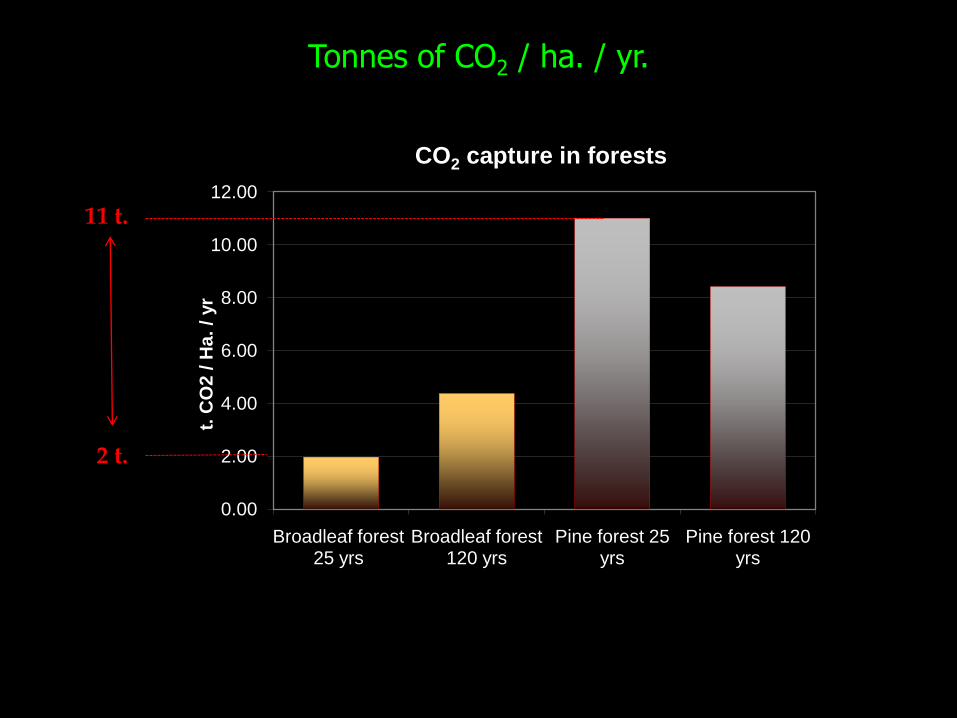
Northeast, maple-beech-birch forests25 year old forest : 12,000 lbs of carbon / 25 = 480 lbs of C per acre per year x 44/12 =1,760 lbs of CO2 per acre per year = an average of 2.52 lbs of CO2 per tree per year.
120 year old forest : 128,000 lbs of carbon / 120 = 1,066 lbs of C per year peracre x 44/12 =3,909 lbs of CO2 per acre per year = an average of 5.58 lbs ofCO2 per tree per year.
Tree density varies, and we used an average of 700 trees per acre (this numberwas taken from DOE's "Sector-Specific Issues and Reporting MethodologiesSupporting the General Guidelines for the Voluntary Reporting of GreenhouseGases under Sections 1605(b) of the Energy Policy Act of 1992"
0.00
2.00
4.00
6.00
8.00
10.00
12.00
Broadleaf forest 25 yrs
Broadleaf forest 120 yrs
Pine forest 25 yrs
Pine forest 120 yrs
t. C
O2
/ H
a.
/ yr
CO2 capture in forests
2 t.
11 t.
Tonnes of CO2 / ha. / yr.
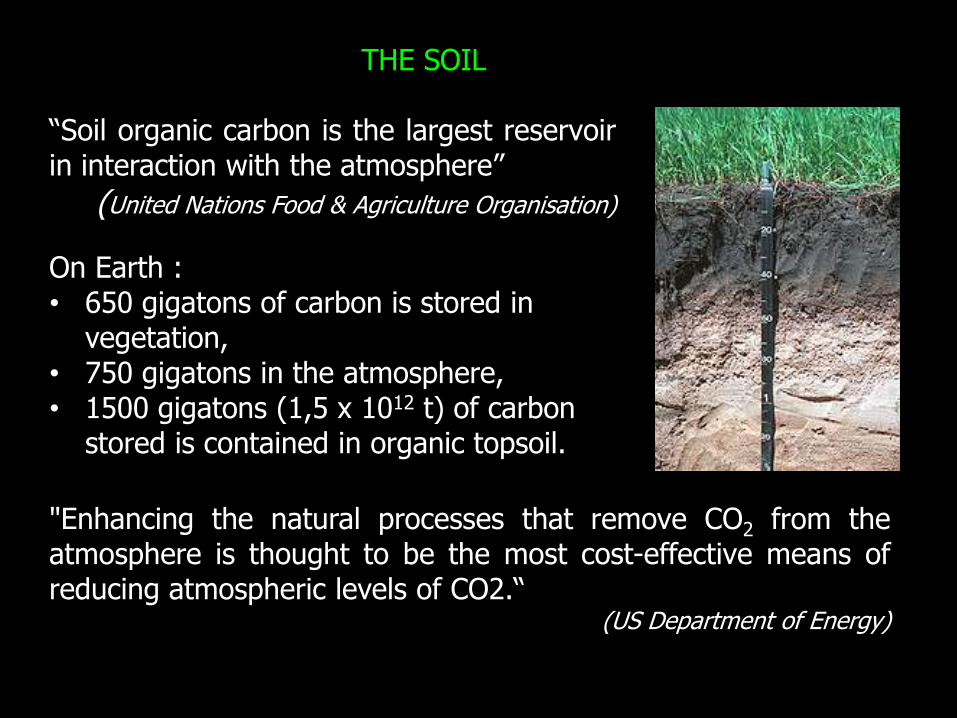
“Soil organic carbon is the largest reservoirin interaction with the atmosphere”
(United Nations Food & Agriculture Organisation)
On Earth :• 650 gigatons of carbon is stored in
vegetation,• 750 gigatons in the atmosphere,• 1500 gigatons (1,5 x 10¹² t) of carbon
stored is contained in organic topsoil.
THE SOIL
"Enhancing the natural processes that remove CO2 from theatmosphere is thought to be the most cost-effective means ofreducing atmospheric levels of CO2.“
(US Department of Energy)
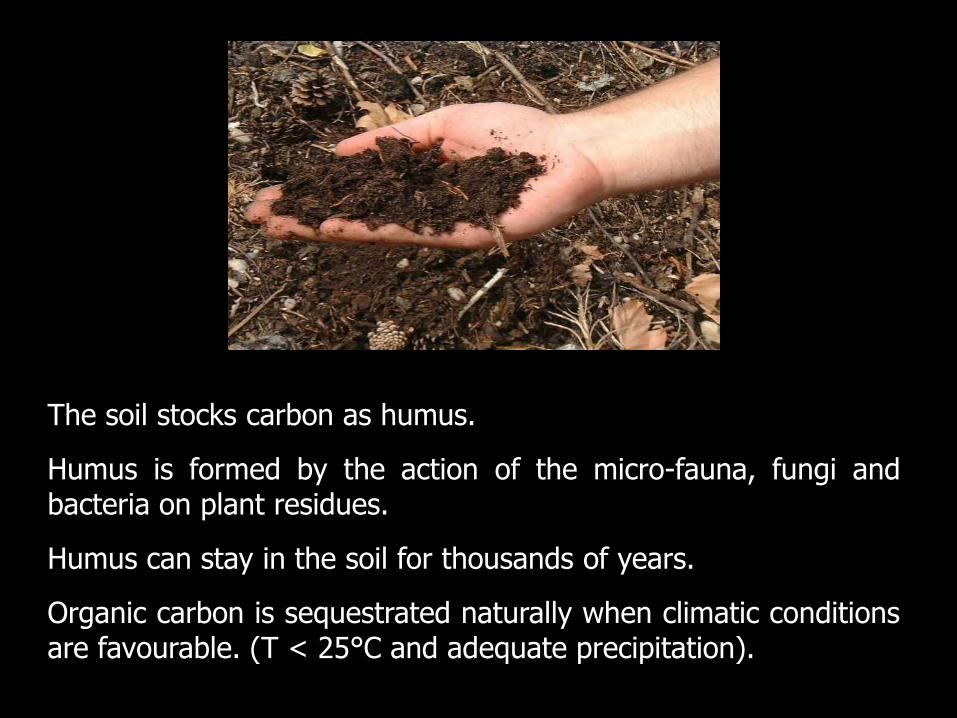
The soil stocks carbon as humus.
Humus is formed by the action of the micro-fauna, fungi andbacteria on plant residues.
Humus can stay in the soil for thousands of years.
Organic carbon is sequestrated naturally when climatic conditionsare favourable. (T < 25°C and adequate precipitation).

Peat = 40 – 45 % Carbon
Moorland peat

Organic matter originating fromleaves & roots of grassesindicates the important role thatsurface vegetation plays incarbon sequestration.
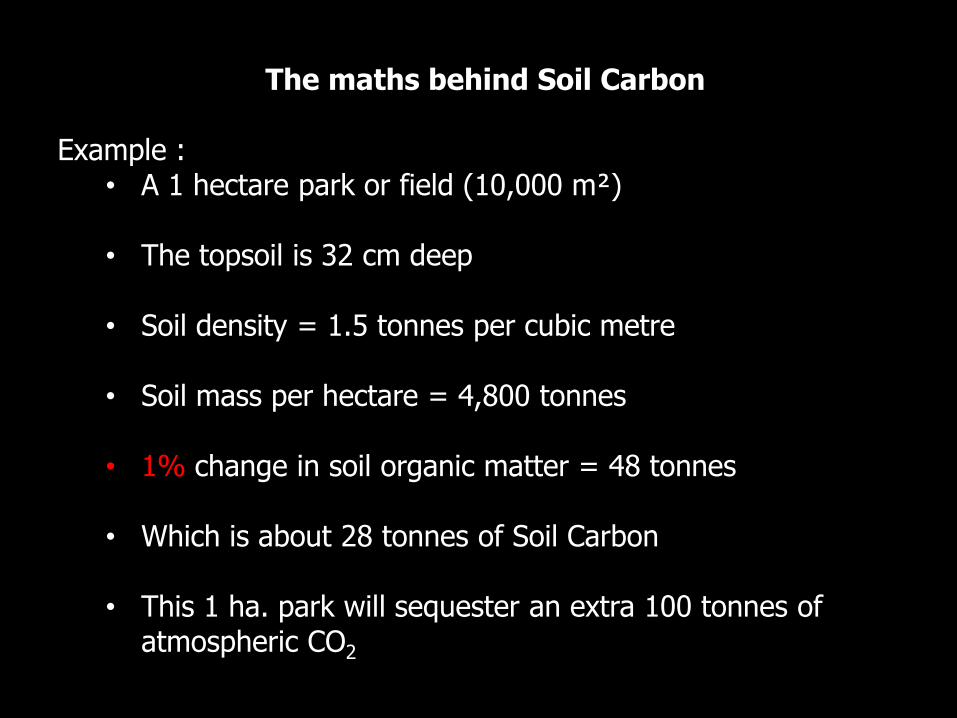
The maths behind Soil Carbon
Example : • A 1 hectare park or field (10,000 m²)
• The topsoil is 32 cm deep
• Soil density = 1.5 tonnes per cubic metre
• Soil mass per hectare = 4,800 tonnes
• 1% change in soil organic matter = 48 tonnes
• Which is about 28 tonnes of Soil Carbon
• This 1 ha. park will sequester an extra 100 tonnes of atmospheric CO2
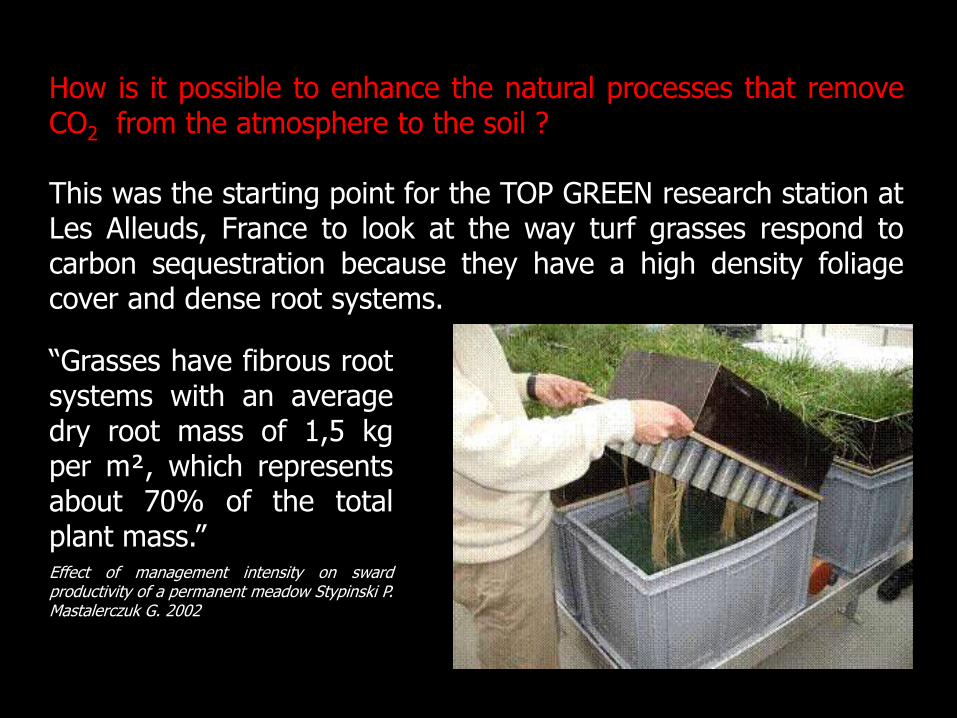
How is it possible to enhance the natural processes that removeCO2 from the atmosphere to the soil ?
This was the starting point for the TOP GREEN research station atLes Alleuds, France to look at the way turf grasses respond tocarbon sequestration because they have a high density foliagecover and dense root systems.
“Grasses have fibrous rootsystems with an averagedry root mass of 1,5 kgper m², which representsabout 70% of the totalplant mass.”Effect of management intensity on swardproductivity of a permanent meadow Stypinski P.Mastalerczuk G. 2002
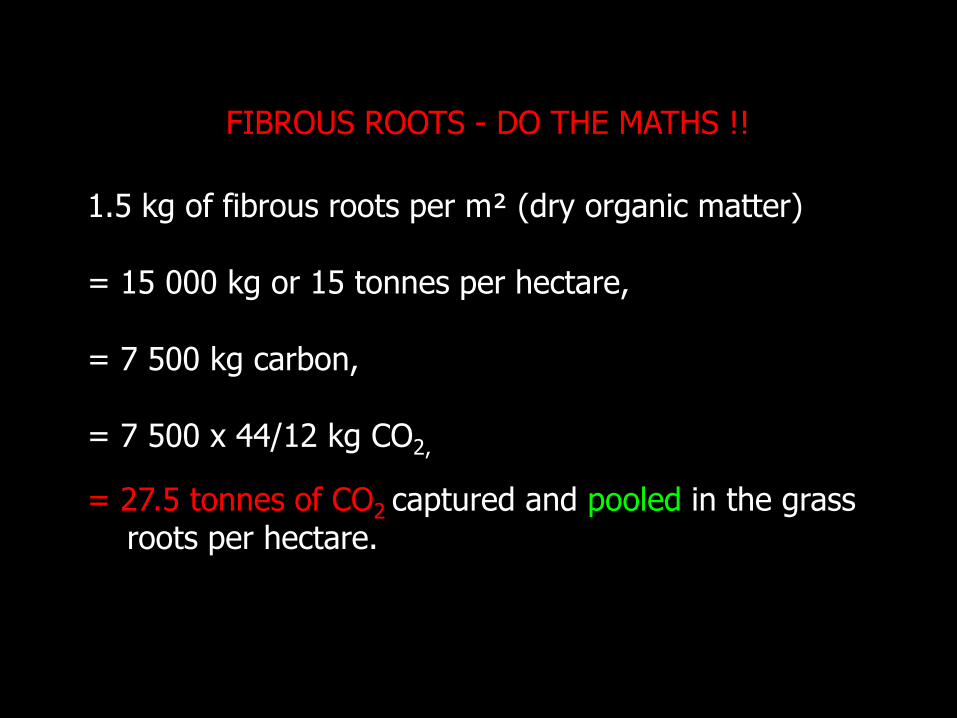
FIBROUS ROOTS - DO THE MATHS !!
1.5 kg of fibrous roots per m² (dry organic matter)
= 15 000 kg or 15 tonnes per hectare,
= 7 500 kg carbon,
= 7 500 x 44/12 kg CO2,
= 27.5 tonnes of CO2 captured and pooled in the grass roots per hectare.
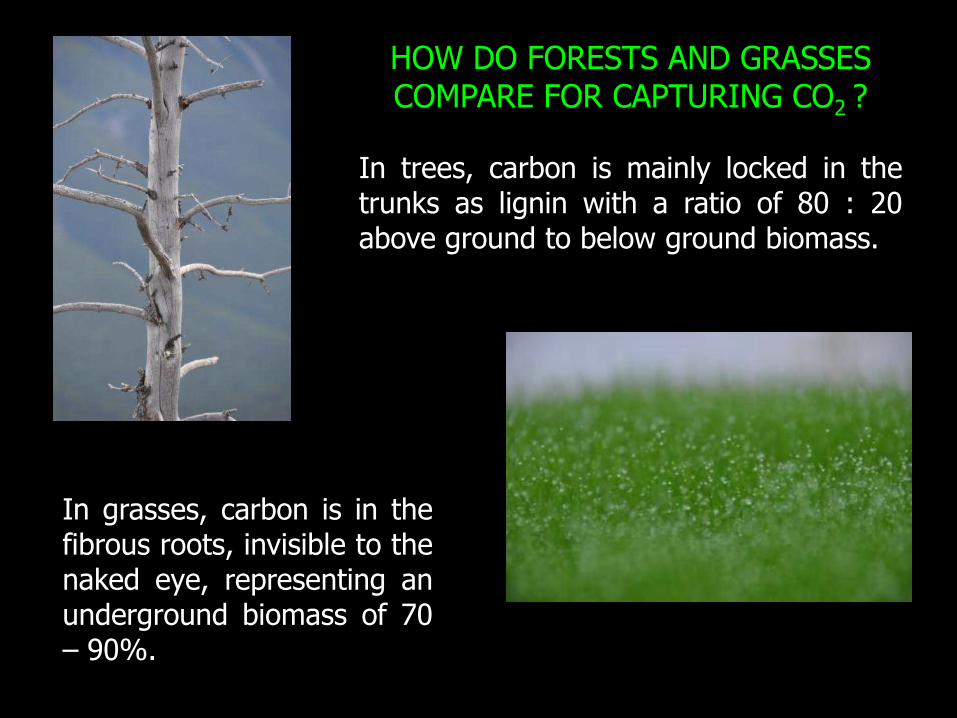
HOW DO FORESTS AND GRASSES COMPARE FOR CAPTURING CO2 ?
In trees, carbon is mainly locked in thetrunks as lignin with a ratio of 80 : 20above ground to below ground biomass.
In grasses, carbon is in thefibrous roots, invisible to thenaked eye, representing anunderground biomass of 70– 90%.
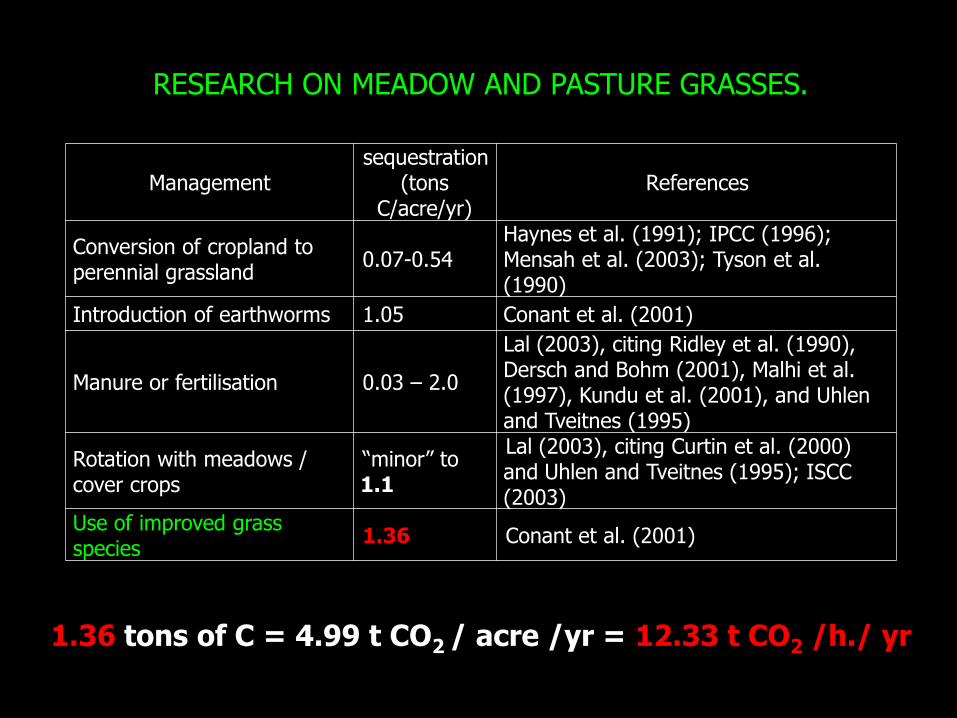
RESEARCH ON MEADOW AND PASTURE GRASSES.
Managementsequestration
(tons C/acre/yr)
References
Conversion of cropland to perennial grassland
0.07-0.54Haynes et al. (1991); IPCC (1996); Mensah et al. (2003); Tyson et al. (1990)
Introduction of earthworms 1.05 Conant et al. (2001)
Manure or fertilisation 0.03 – 2.0
Lal (2003), citing Ridley et al. (1990), Dersch and Bohm (2001), Malhi et al. (1997), Kundu et al. (2001), and Uhlenand Tveitnes (1995)
Rotation with meadows / cover crops
“minor” to 1.1
Lal (2003), citing Curtin et al. (2000) and Uhlen and Tveitnes (1995); ISCC (2003)
Use of improved grass species
1.36 Conant et al. (2001)
1.36 tons of C = 4.99 t CO2 / acre /yr = 12.33 t CO2 /h./ yr
Research on carbon capture & sequestration for grassspecies has been carried out in turf grasses byTOPGREEN for :
• Rye grass,• Hard Fescue,• Red Fescue,• Agrostis stolonifera,• Smooth Meadow-grass,• a mix with micro-clover

Turf grass carbon sequestration field trial conditions
• Autumn sowing 2005• Samples 12/03/2008 (30
months)• 5 species & 1 clover mix• 3 samples per species, total 18,• 10cm de diameter samples to
20cm depth (= 1570cm3) • Identical plot management • Each sample dived into 3 parts
to investigate soil, root and leaf carbon contents.
• Pre-trial soil organic matter measured at 1,62% = 77,6t of C0²/ha sequestered in the soil.
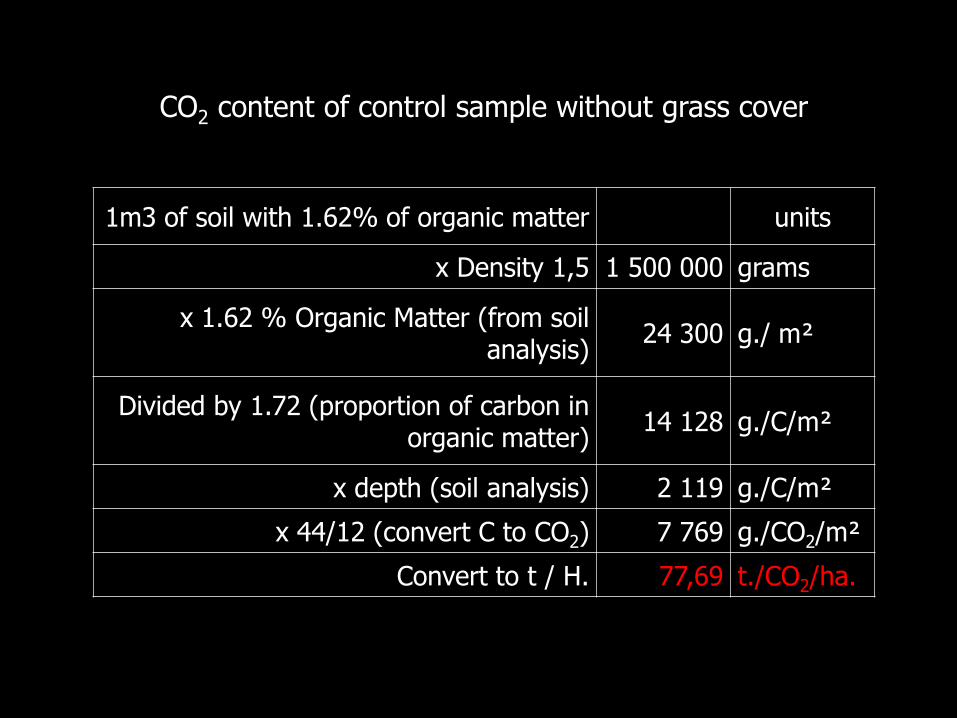
1m3 of soil with 1.62% of organic matter units
x Density 1,5 1 500 000 grams
x 1.62 % Organic Matter (from soil analysis)
24 300 g./ m²
Divided by 1.72 (proportion of carbon in organic matter)
14 128 g./C/m²
x depth (soil analysis) 2 119 g./C/m²
x 44/12 (convert C to CO2) 7 769 g./CO2/m²
Convert to t / H. 77,69 t./CO2/ha.
CO2 content of control sample without grass cover
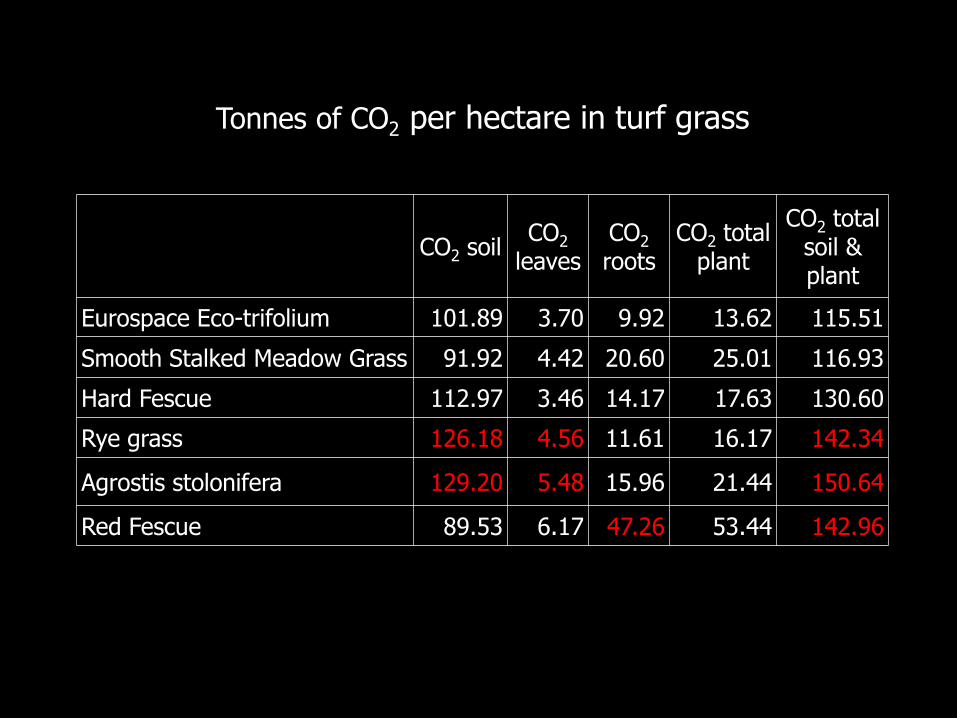
CO2 soilCO2
leavesCO2
rootsCO2 total
plant
CO2 total soil & plant
Eurospace Eco-trifolium 101.89 3.70 9.92 13.62 115.51
Smooth Stalked Meadow Grass 91.92 4.42 20.60 25.01 116.93
Hard Fescue 112.97 3.46 14.17 17.63 130.60
Rye grass 126.18 4.56 11.61 16.17 142.34
Agrostis stolonifera 129.20 5.48 15.96 21.44 150.64
Red Fescue 89.53 6.17 47.26 53.44 142.96
Tonnes of CO2 per hectare in turf grass
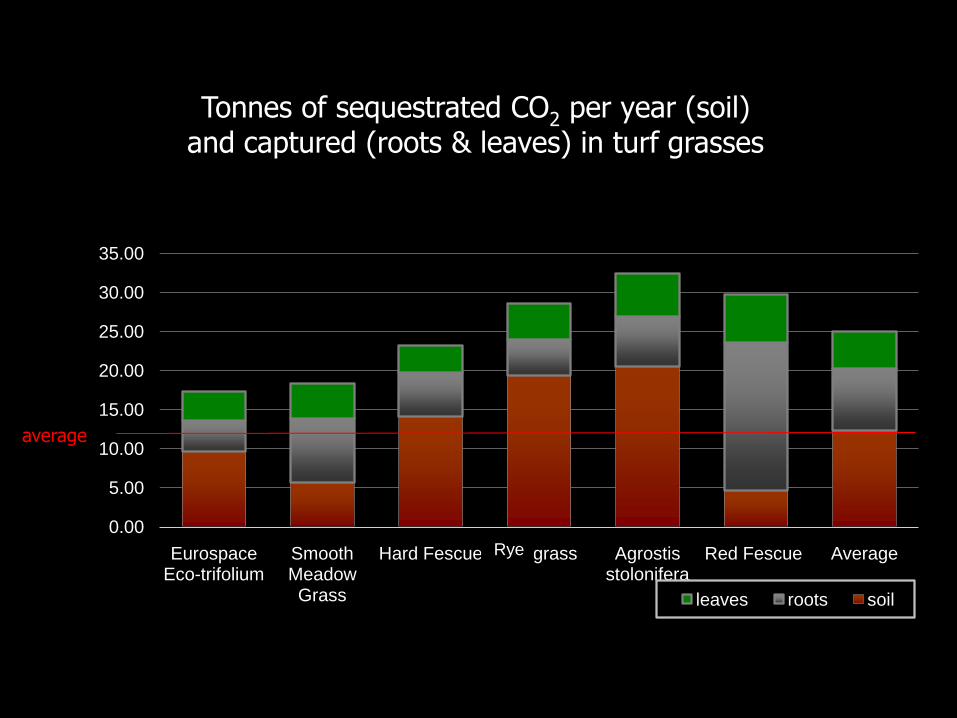
Tonnes of sequestrated CO2 per year (soil)and captured (roots & leaves) in turf grasses
0.00
5.00
10.00
15.00
20.00
25.00
30.00
35.00
Eurospace Eco-trifolium
Smooth Meadow Grass
Hard Fescue Ray grass Agrostis stolonifera
Red Fescue Average
leaves roots soil
average
Rye
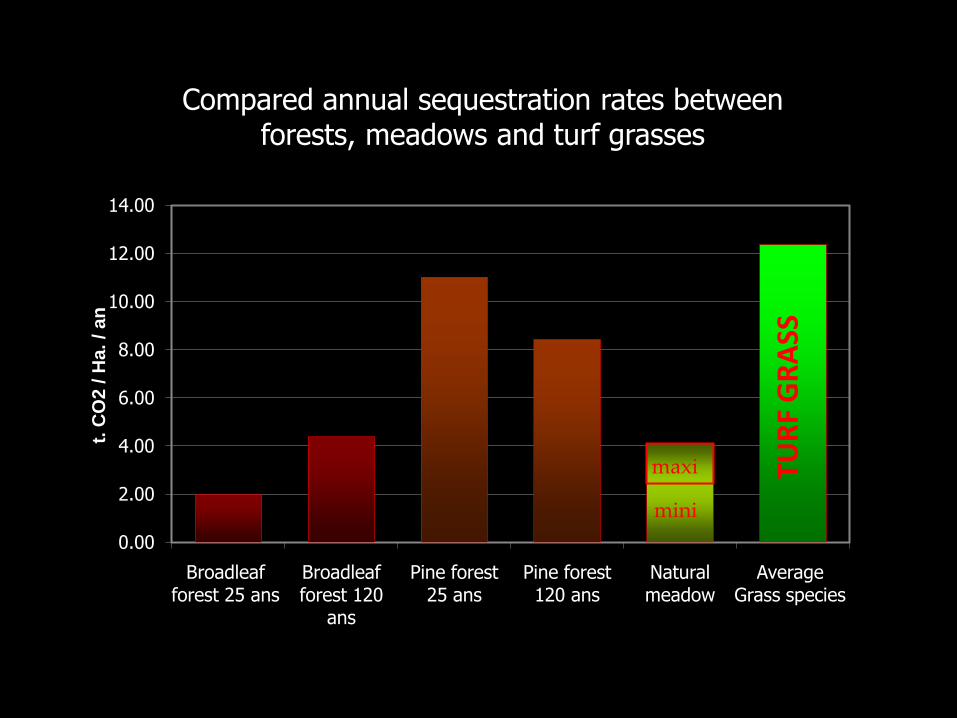
0.00
2.00
4.00
6.00
8.00
10.00
12.00
14.00
Broadleaf forest 25 ans
Broadleaf forest 120
ans
Pine forest 25 ans
Pine forest 120 ans
Natural meadow
Average Grass species
t. C
O2
/ H
a. / a
n
TUR
F G
RA
SS
mini
maxi
Compared annual sequestration rates between forests, meadows and turf grasses

CO2 SUMMARY OF TURF GRASSES
Leaves stock3.7 – 6.2 t. CO2 / ha
Roots stock 4 – 27,5 t. CO2 / ha.
together they transfer
in to the soil,5.6 – 20.6 t. CO2
per year
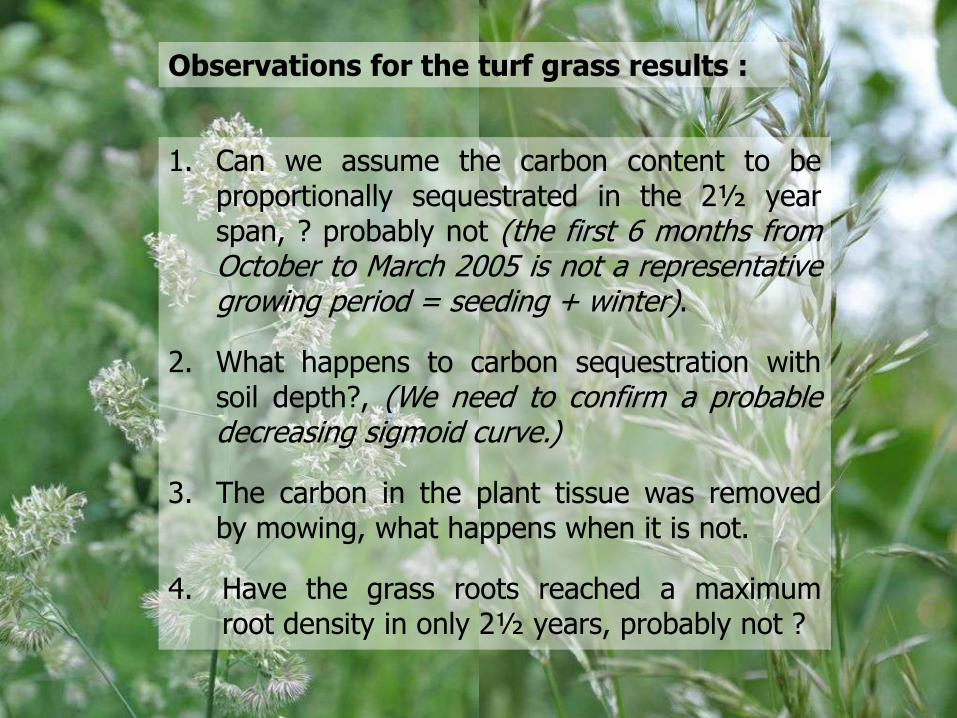
1. Can we assume the carbon content to beproportionally sequestrated in the 2½ yearspan, ? probably not (the first 6 months fromOctober to March 2005 is not a representativegrowing period = seeding + winter).
2. What happens to carbon sequestration withsoil depth?, (We need to confirm a probabledecreasing sigmoid curve.)
3. The carbon in the plant tissue was removedby mowing, what happens when it is not.
4. Have the grass roots reached a maximumroot density in only 2½ years, probably not ?
Observations for the turf grass results :
Grasses fulfil a more complex role in the urban ecosystem :
• Grasses help prevent soil erosion,• Grasses filter dust and particles from the air,• Lawns filter water into the water table thereby
avoiding excess runoff and flash flooding, this isaided by increased earthworm activity,
• Grass regulates, along with other plants, thetemperature gradients in towns and cities,
• Grass acts as a filter absorbing rather thanreflecting noise,
1 ha. of grass produces enough O2 for 150 people to breath, Société française des gazons.
THE ENVIRONEMENTAL BENIFITS OF GRASSES.
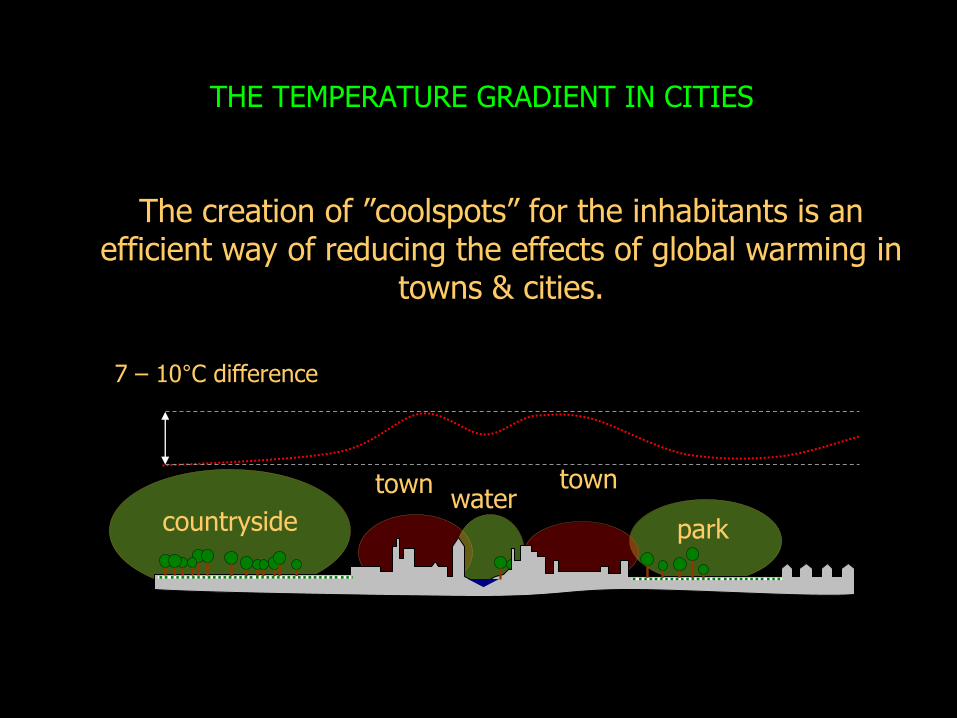
The creation of ”coolspots” for the inhabitants is an efficient way of reducing the effects of global warming in
towns & cities.
7 – 10°C difference
watertown
park
town
countryside
THE TEMPERATURE GRADIENT IN CITIES

WHAT ARE THE CO2 EMISSIONS OF LANDSCAPE MAINTENANCE OPERATIONS ?
This is a question currently being investigated by the Carboncommission of the Société Française des Gazons in France, withthe participation of Landscape & Environmental Services Ltd.
Green keepers and managers of golf courses, football pitches,highway authorities and public parks have been participating ina nationwide study to determine carbon footprints in thelandscape industry.
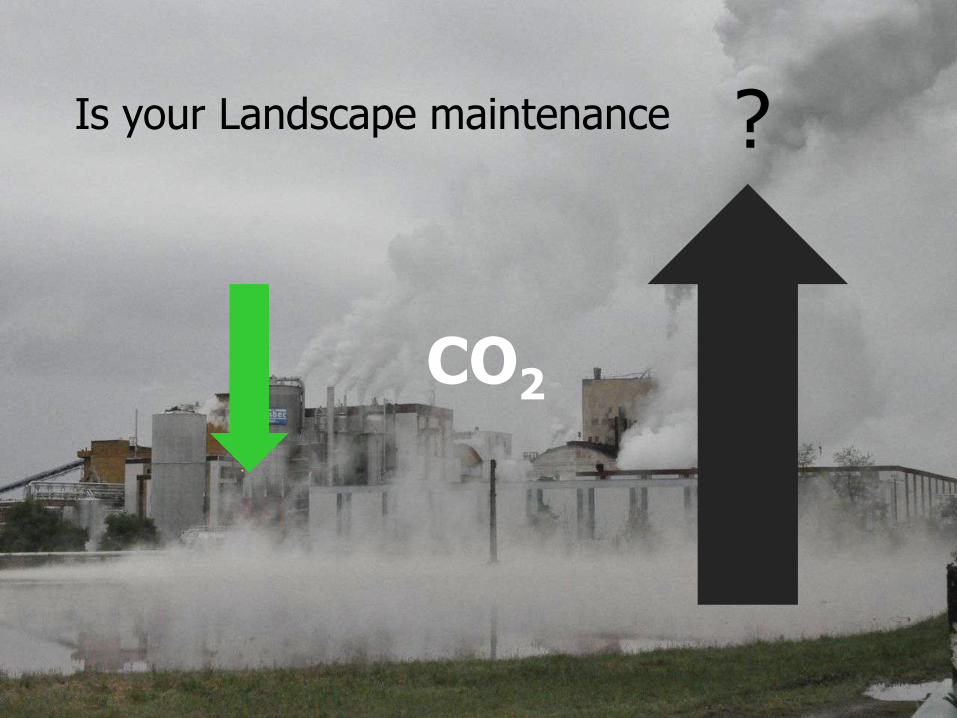
Is your Landscape maintenance ?
CO2
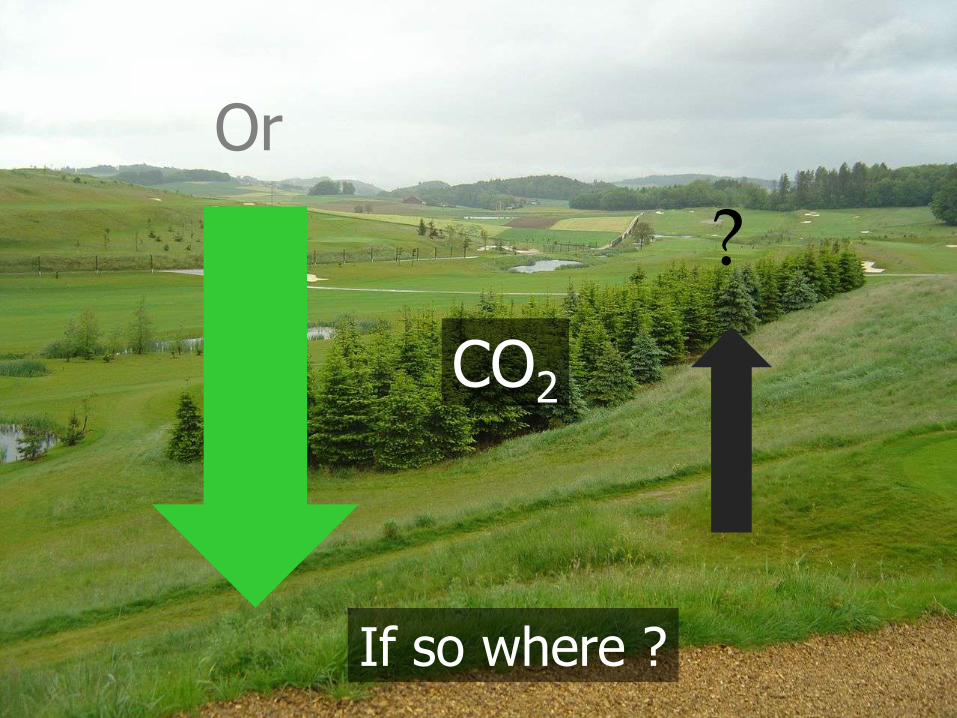
Or
CO2
?
If so where ?
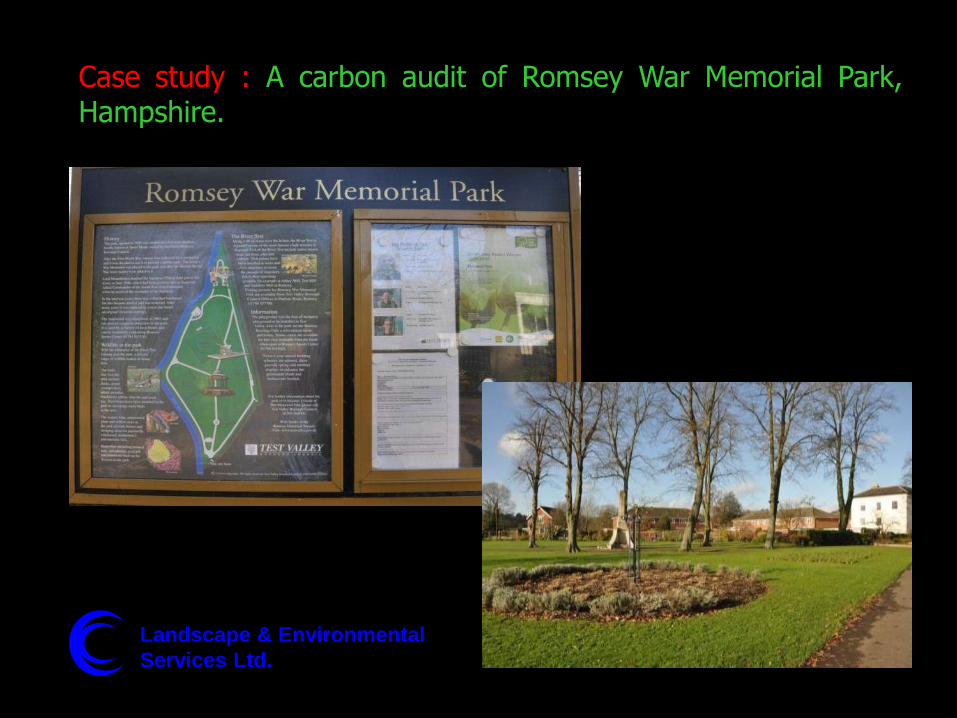
Case study : A carbon audit of Romsey War Memorial Park,Hampshire.
Landscape & Environmental
Services Ltd.
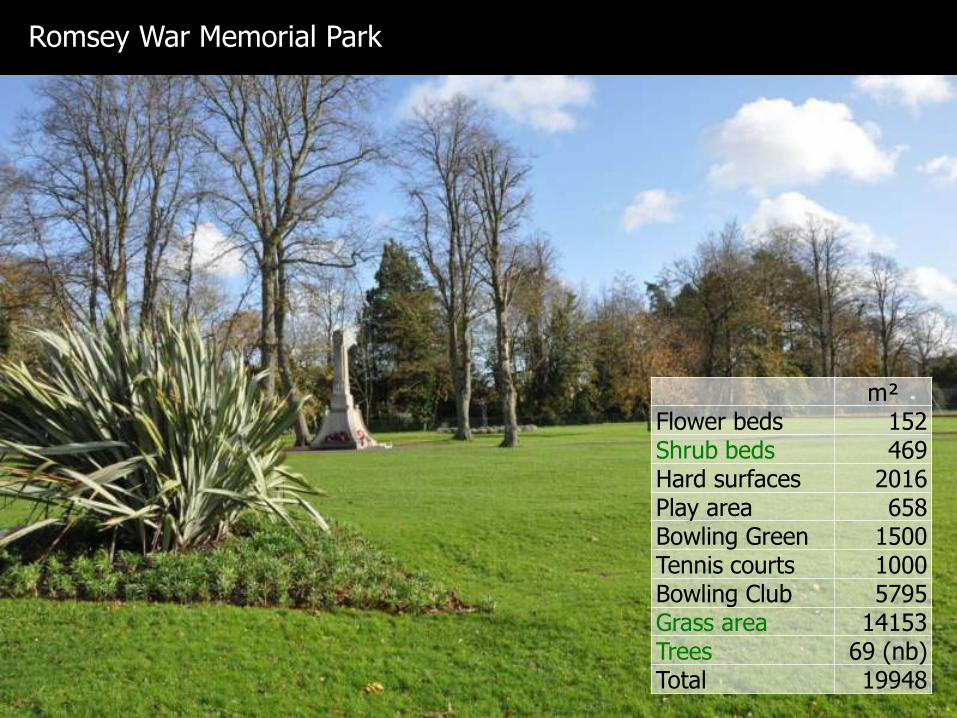
m²Flower beds 152Shrub beds 469Hard surfaces 2016Play area 658Bowling Green 1500Tennis courts 1000Bowling Club 5795Grass area 14153Trees 69 (nb)Total 19948
Romsey War Memorial Park
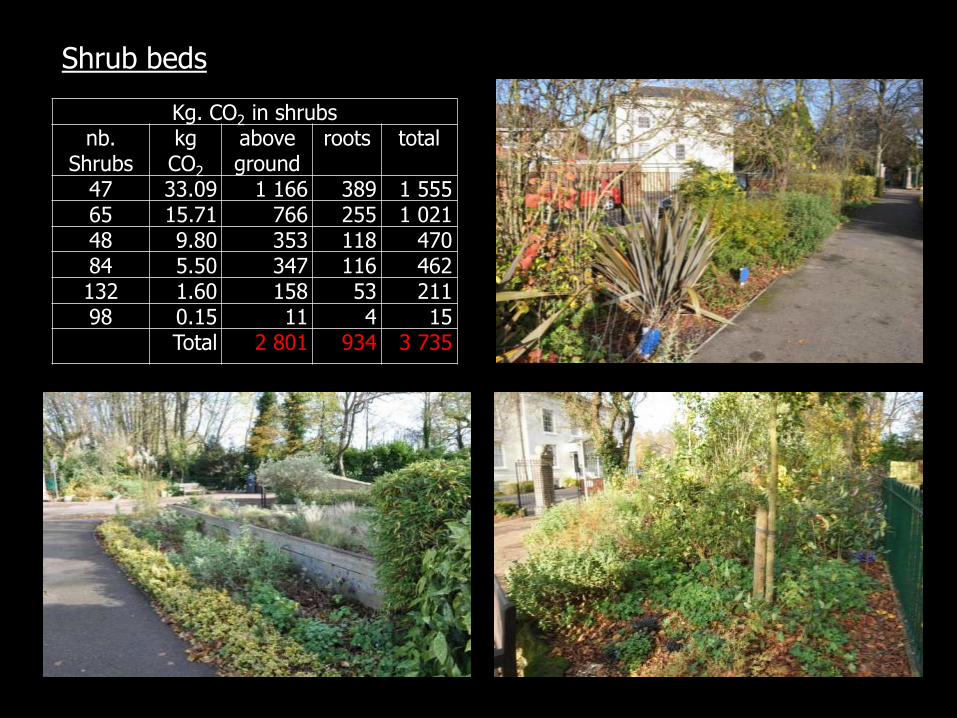
Kg. CO2 in shrubsnb.
Shrubskg CO2
above ground
roots total
47 33.09 1 166 389 1 55565 15.71 766 255 1 02148 9.80 353 118 47084 5.50 347 116 462132 1.60 158 53 21198 0.15 11 4 15
Total 2 801 934 3 735
Shrub beds
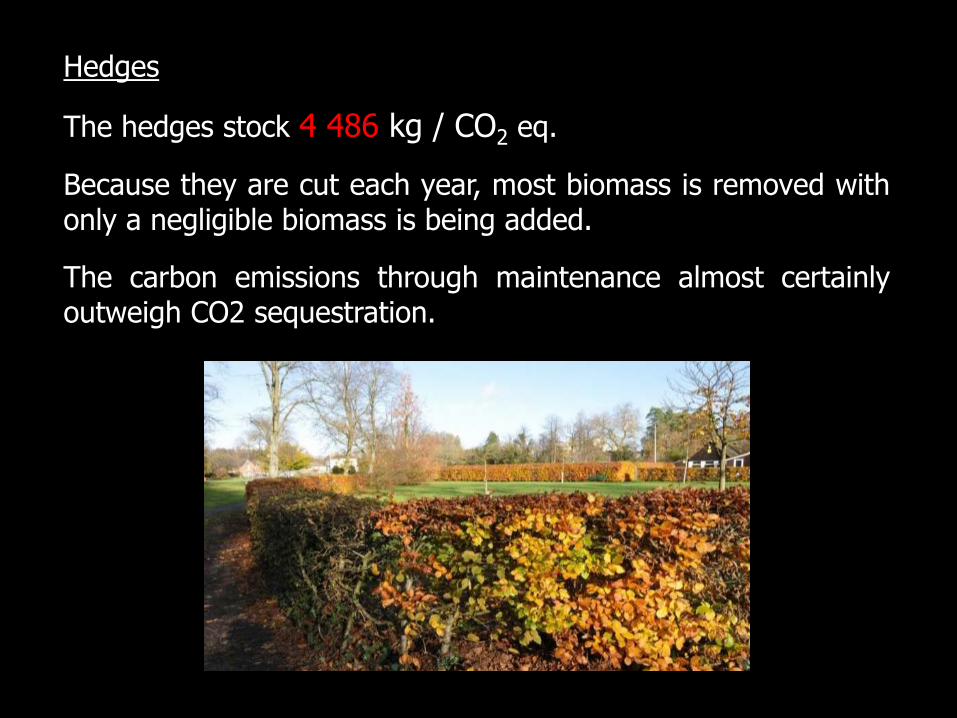
Hedges
The hedges stock 4 486 kg / CO2 eq.
Because they are cut each year, most biomass is removed withonly a negligible biomass is being added.
The carbon emissions through maintenance almost certainlyoutweigh CO2 sequestration.
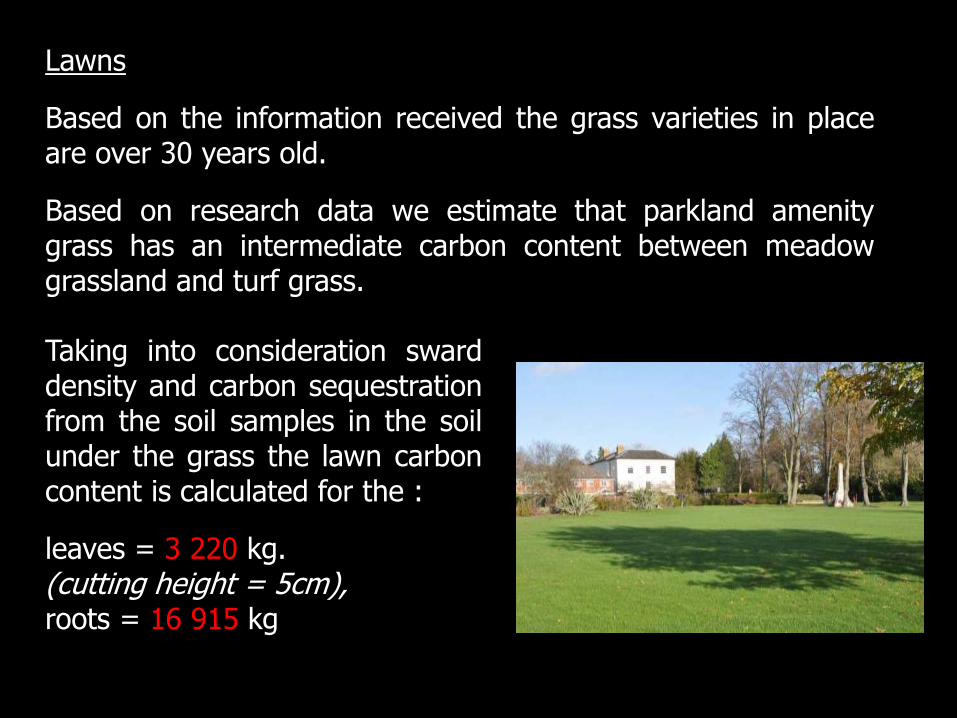
Lawns
Based on the information received the grass varieties in placeare over 30 years old.
Based on research data we estimate that parkland amenitygrass has an intermediate carbon content between meadowgrassland and turf grass.
Taking into consideration swarddensity and carbon sequestrationfrom the soil samples in the soilunder the grass the lawn carboncontent is calculated for the :
leaves = 3 220 kg.(cutting height = 5cm),roots = 16 915 kg
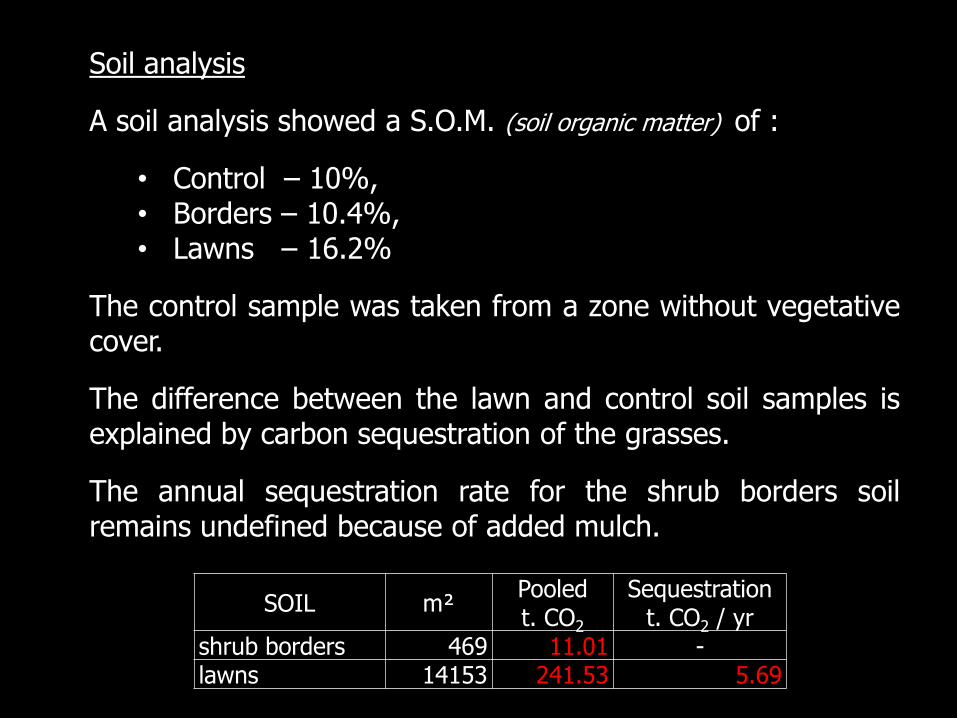
Soil analysis
A soil analysis showed a S.O.M. (soil organic matter) of :
• Control – 10%,• Borders – 10.4%,• Lawns – 16.2%
The control sample was taken from a zone without vegetativecover.
The difference between the lawn and control soil samples isexplained by carbon sequestration of the grasses.
The annual sequestration rate for the shrub borders soilremains undefined because of added mulch.
SOIL m²Pooledt. CO2
Sequestration t. CO2 / yr
shrub borders 469 11.01 -lawns 14153 241.53 5.69
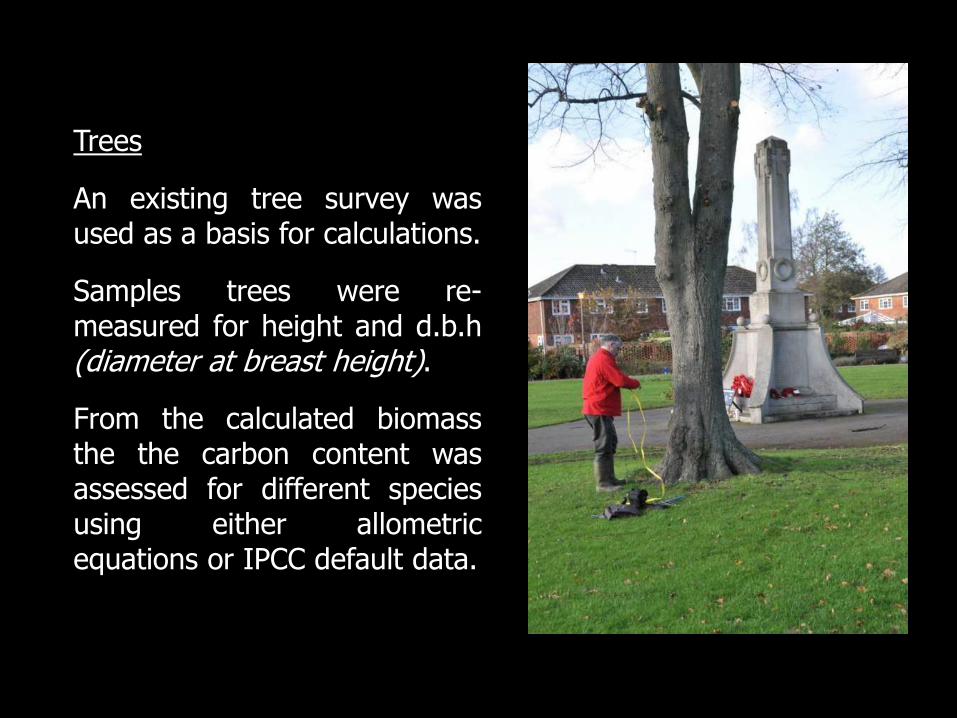
Trees
An existing tree survey wasused as a basis for calculations.
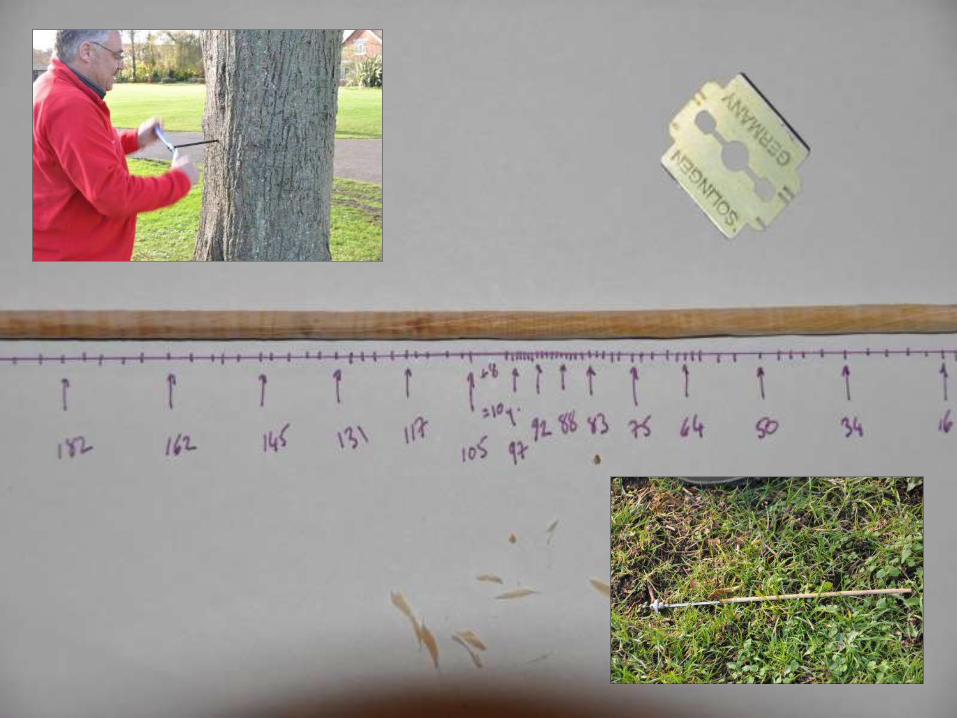
Samples trees were re-measured for height and d.b.h(diameter at breast height).
From the calculated biomassthe the carbon content wasassessed for different speciesusing either allometricequations or IPCC default data.
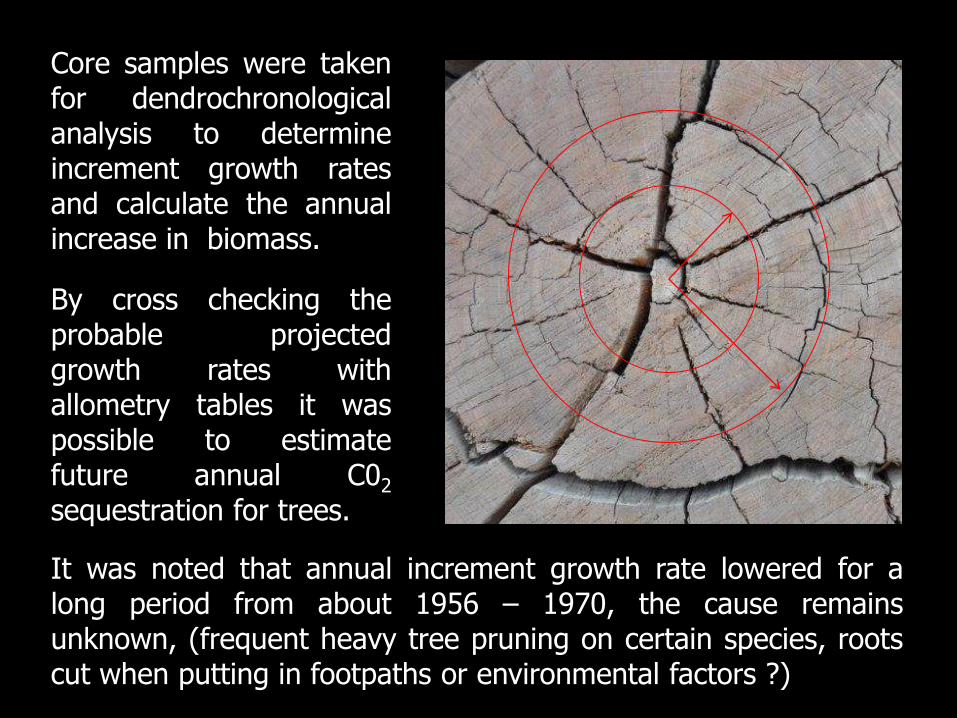
It was noted that annual increment growth rate lowered for along period from about 1956 – 1970, the cause remainsunknown, (frequent heavy tree pruning on certain species, rootscut when putting in footpaths or environmental factors ?)
Core samples were takenfor dendrochronologicalanalysis to determineincrement growth ratesand calculate the annualincrease in biomass.
By cross checking theprobable projectedgrowth rates withallometry tables it waspossible to estimatefuture annual C02
sequestration for trees.
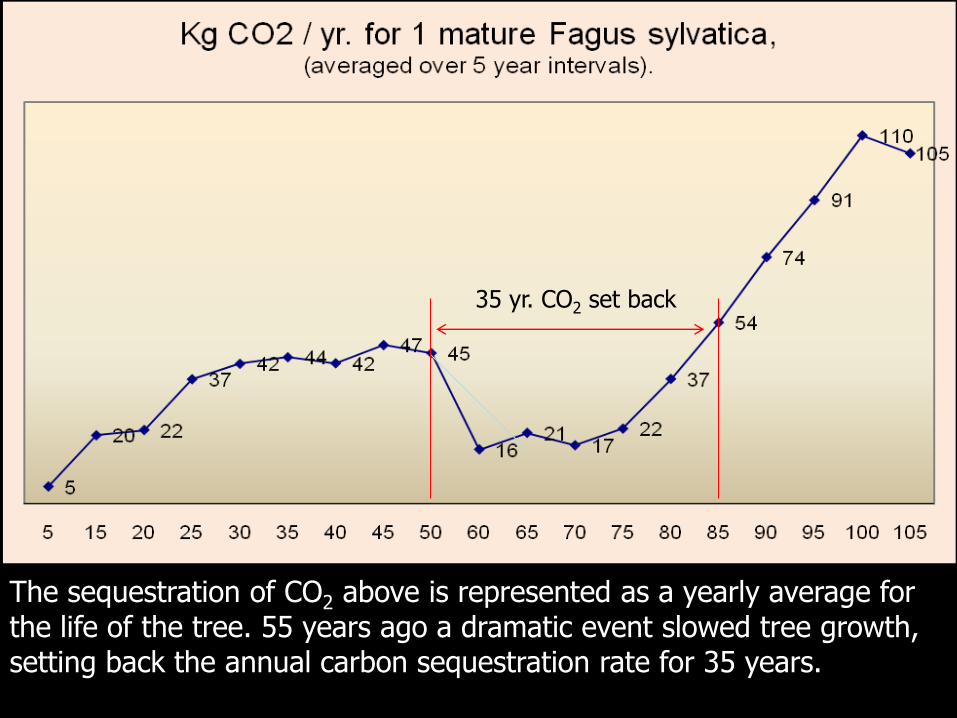
The sequestration of CO2 above is represented as a yearly average for the life of the tree. 55 years ago a dramatic event slowed tree growth, setting back the annual carbon sequestration rate for 35 years.
35 yr. CO2 set back
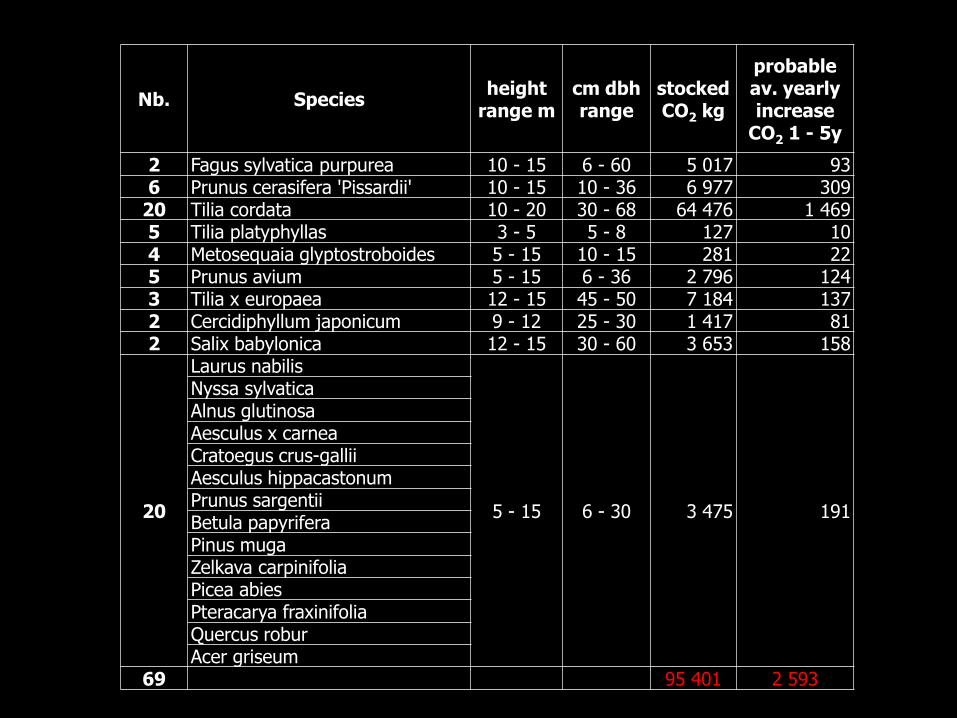
Nb. Speciesheight
range mcm dbh range
stocked CO2 kg
probable av. yearly increase
CO2 1 - 5y
2 Fagus sylvatica purpurea 10 - 15 6 - 60 5 017 936 Prunus cerasifera 'Pissardii' 10 - 15 10 - 36 6 977 309
20 Tilia cordata 10 - 20 30 - 68 64 476 1 4695 Tilia platyphyllas 3 - 5 5 - 8 127 104 Metosequaia glyptostroboides 5 - 15 10 - 15 281 225 Prunus avium 5 - 15 6 - 36 2 796 1243 Tilia x europaea 12 - 15 45 - 50 7 184 1372 Cercidiphyllum japonicum 9 - 12 25 - 30 1 417 812 Salix babylonica 12 - 15 30 - 60 3 653 158
20
Laurus nabilis
5 - 15 6 - 30 3 475 191
Nyssa sylvatica Alnus glutinosa Aesculus x carnea Cratoegus crus-gallii Aesculus hippacastonum Prunus sargentii Betula papyrifera Pinus muga Zelkava carpinifolia Picea abies Pteracarya fraxinifolia Quercus robur Acer griseum
69 95 401 2 593
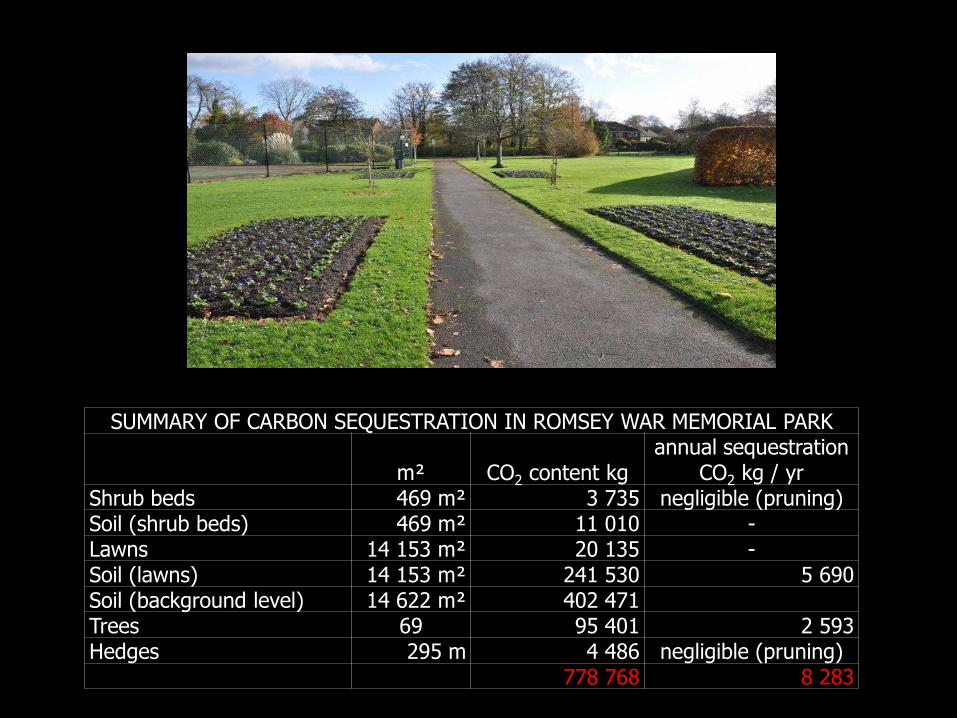
SUMMARY OF CARBON SEQUESTRATION IN ROMSEY WAR MEMORIAL PARK
m² CO2 content kgannual sequestration
CO2 kg / yrShrub beds 469 m² 3 735 negligible (pruning)Soil (shrub beds) 469 m² 11 010 -Lawns 14 153 m² 20 135 -Soil (lawns) 14 153 m² 241 530 5 690Soil (background level) 14 622 m² 402 471Trees 69 95 401 2 593Hedges 295 m 4 486 negligible (pruning)
778 768 8 283
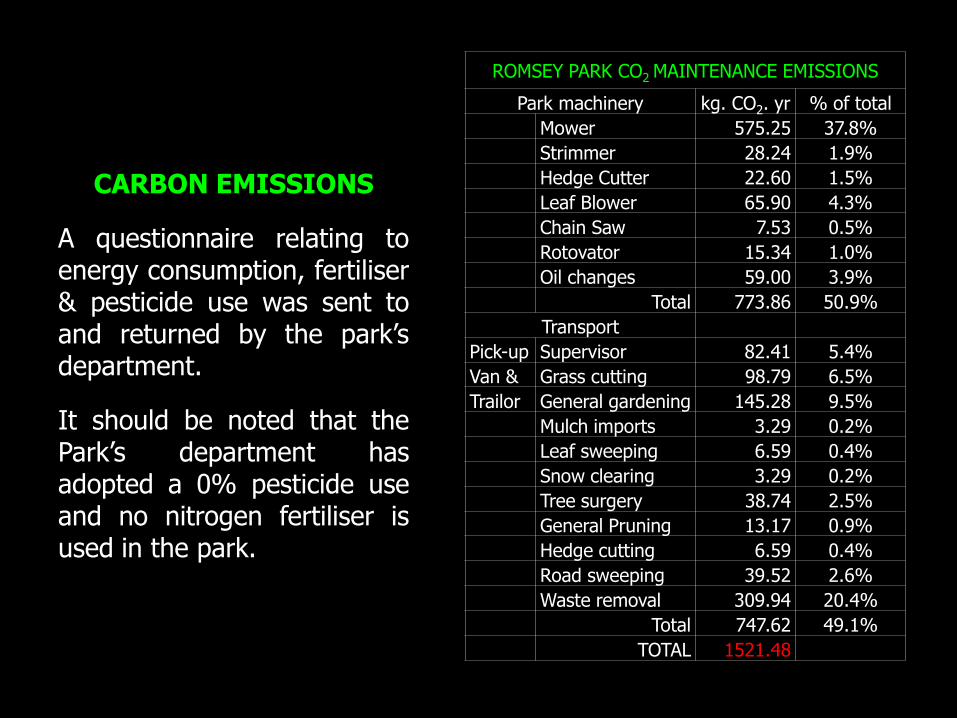
ROMSEY PARK CO2 MAINTENANCE EMISSIONS
Park machinery kg. CO2. yr % of total
Mower 575.25 37.8%
Strimmer 28.24 1.9%
Hedge Cutter 22.60 1.5%
Leaf Blower 65.90 4.3%
Chain Saw 7.53 0.5%
Rotovator 15.34 1.0%
Oil changes 59.00 3.9%
Total 773.86 50.9%
Transport
Pick-up Supervisor 82.41 5.4%
Van & Grass cutting 98.79 6.5%
Trailor General gardening 145.28 9.5%
Mulch imports 3.29 0.2%
Leaf sweeping 6.59 0.4%
Snow clearing 3.29 0.2%
Tree surgery 38.74 2.5%
General Pruning 13.17 0.9%
Hedge cutting 6.59 0.4%
Road sweeping 39.52 2.6%
Waste removal 309.94 20.4%
Total 747.62 49.1%
TOTAL 1521.48
CARBON EMISSIONS
A questionnaire relating toenergy consumption, fertiliser& pesticide use was sent toand returned by the park’sdepartment.
It should be noted that thePark’s department hasadopted a 0% pesticide useand no nitrogen fertiliser isused in the park.

CONCLUSIONS
Romsey War Memorial Park, has a carbon pool of 778 tons of C02 eq
Annual sequestration = 8.2 tonnes / yr.Carbon emissions = 1.5 tonnes / yr.
ExclusionOffice / administrative (carbon) overheads
Reducing carbon emissions is part of a more general sustainablelandscape management approach which would include manyother factors, reduced pesticide use and alternative weed killingtechniques, recycling biomass, the creation of urban meadows,ISO 14001 ….
… which was put into place for Lyon city park’s department.

A last thought about the consequences of global
warming …

1750 1800 1850
8
6
4
2
01900 20001950
Carbon emissions
Carbon absorption
Petagrammes per year
………. And in 2012 ?
THANK YOU
Howard Wood
Landscape & Environmental Services
Ltd
.