carbon neutrality project (pdf)
TRANSCRIPT

Carbon Neutrality Project Biology 354 and Engineering 333
Professors Warners and Heun
December 14, 2007

2
Objective: The students of Calvin College’s Engineering 333 and Biology 354 classes were given the task of
determining “What would it take to make Calvin College Carbon Neutral?” At first glance, it would not
appear that classes on Advanced Thermal System Design and Investigations in Plant Ecology would have
much in common. However, the biology and engineering students comprising these classes banded
together to tackle the problem. Coming to a satisfactory conclusion would require:
Creating an inventory of Green House Gas (GHG) emissions and sequestration potential
Coming up with detailed solutions to achieve Carbon Neutrality
Working out a practical schedule to implement those solutions, and
Developing a realistic plan to finance the process of achieving Carbon Neutrality
Approach: In order to tackle this semester-long project, the students subdivided into five groups, each targeting a
specific area to inventory GHG emissions and sequestration. The five groups, taking a cue from Calvin
College’s Statement of Sustainability1, investigated the following five areas:
Energy Use and Purchasing
Land Use and Waste Water Management
Recycling and Solid Waste Management
Construction and Renovation
Transportation
While creating the inventory, each group also researched potential solutions to the problem of GHG
emissions. For the sake of consistency, all groups reported results in Metric Tons Carbon Dioxide
Emitted per year, abbreviated MTCE.
During the course of the project, it became clear that some areas of study contributed far more to
Calvin’s carbon footprint than others. The two groups working on land use and waste water
management and recycling and solid waste management wrapped up their investigations and focused
on the financial aspect of the project. All groups had been encouraged to brainstorm solutions, both
frivolous and realistic. The students working on Finance filtered through these suggestions, selecting
projects and objectives that were both feasible and marketable. Once these had been selected, a
financial plan; which took into account inflation, the time-value of money, and the college’s total
budget, was drawn up.
Results: Achieving Carbon Neutrality is possible but quite a challenge. And it will remain that way as long as we
burn fossil fuel to produce heat and electricity and to power our vehicles. Figure 1 shows the results of
the Emissions and Sequestration inventory.
1 http://www.calvin.edu/admin/provost/environmental/

3
Figure 1: Results of the Inventory
Because Calvin’s sequestration potential is so much lower than it emissions, reducing Calvin’s Carbon
footprint to zero required creativity. Ultimately, it is not currently feasible to become Carbon Neutral
without looking off campus. Calvin can reduce its emissions by reducing consumption, increasing
efficiency, using renewable power and finally making up the difference by purchasing Carbon offsets
from a third party. Details on methods to reduce consumption and increase efficiency on campus can be
found in the following appendices.
The main thrust of the proposed plan to achieve Carbon Neutrality centers around the installation of
wind turbines on property owned by Calvin. These wind turbines would generate clean, renewable
energy and reduce Calvin’s dependence on electricity generated by burning fossil fuels. The rest of
Calvin’s footprint would be countered by purchasing Carbon Offsets from a third party such as
TerraPass.com. Other projects, such as Calvin-owned bikes, would play into the overall plan, doing a
small part to decrease emissions and playing a significant role in raising public awareness.
This plan outlined here and explained in greater detail in the appendices, could be achieved by
dedicating 1.16% of Calvin’s $86 million budget each year for 11 years toward a Green Energy Fund. Any
monetary savings resulting from campus improvements would be deposited back into this Green Energy
Fund to provide capital for future carbon reduction projects.

4
Table of Contents
CARBON NEUTRALITY PROJECT ___________________________________________________________________ 1
OBJECTIVE: ___________________________________________________________________________________ 2
APPROACH: __________________________________________________________________________________ 2
RESULTS: ____________________________________________________________________________________ 2
APPENDIX A: ENERGY USE AND PURCHASING _______________________________________________________ 6
APPENDIX A.1: BOILER SYSTEM MODEL EXPLANATION ____________________________________________________ 10
APPENDIX A.2: CARBON OFFSET CREDITS DISCUSSION ____________________________________________________ 11
APPENDIX A.3: ENERGY USE RAW DATA ______________________________________________________________ 12
APPENDIX A.4: BOILER SYSTEM MODEL EES WORKSHEET __________________________________________________ 18
APPENDIX A.5: CARBON NEUTRALITY EES MODEL _______________________________________________________ 21
APPENDIX B: LAND USE AND WATER AND WASTEWATER MANAGEMENT GROUP ________________________ 25
APPENDIX B.1: CAMPUS SEQUESTRATION DATA _________________________________________________________ 27
APPENDIX B.2: FERTILIZER DATA ___________________________________________________________________ 28
APPENDIX B.4: CALVIN UTILITY BILLS ________________________________________________________________ 33
APPENDIX B.5: WATER TO CARBON CALCULATIONS ______________________________________________________ 48
APPENDIX B.6: CARBON SEQUESTERING TREE ARTICLE ____________________________________________________ 49
APPENDIX C: SOLID WASTE AND RECYCLING _______________________________________________________ 51
APPENDIX C.1: GANNT CHART FOR SEMESTER _________________________________________________________ 53
APPENDIX C.2: ENVIRONMENTAL PROTECTION AGENCY DATA _______________________________________________ 54
APPENDIX C.3: WASTE MANAGEMENT SCENARIOS _______________________________________________________ 55
APPENDIX C.4: CARBON FOOTPRINT CALCULATIONS ______________________________________________________ 56
APPENDIX C.5: RECYCLING BIN AND LABOR COSTS _______________________________________________________ 57
APPENDIX D: CONSTRUCTION AND RENOVATION ___________________________________________________ 58
APPENDIX D.1: DATA ON COMMONS ADDITION _________________________________________________________ 61
APPENDIX D.2: PUBLISHED DATA ON UNIVERSITY OF MAINE’S STODDER HALL ____________________________________ 64
APPENDIX F: TRANSPORTATION GROUP __________________________________________________________ 68
APPENDIX F.1: COMMUTER FOOTPRINT ______________________________________________________________ 70
APPENDIX F.2: CARBON FOOTPRINT DUE TO AIR TRAVEL ___________________________________________________ 72
APPENDIX F.3: CARBON FOOTPRINT FROM SERVICE VEHICLE TRAFFIC __________________________________________ 73
APPENDIX F.4: COMMUTER FOOTPRINT CALCULATIONS ____________________________________________________ 74
APPENDIX F.5: EMISSION REDUCTIONS THROUGH PARKING ADJUSTMENTS _______________________________________ 75
APPENDIX F.6: EMISSION REDUCTIONS THROUGH ELECTRIC VEHICLES __________________________________________ 75
APPENDIX F.7: EMISSION REDUCTIONS THROUGH BIKE PATH ON LAKE DRIVE _____________________________________ 76
APPENDIX F.8: EMISSION REDUCTIONS THROUGH RENTAL BICYCLES ___________________________________________ 77
APPENDIX F.9: EMISSION REDUCTIONS THROUGH SUBSIDIZING THE RAPID _______________________________________ 78
APPENDIX F.10: EMISSIONS REDUCTIONS BY SUBSIDIZING THE RAPID - CALCULATIONS _______________________________ 80
APPENDIX F.11: STUDENT SENATE SURVEY RESULTS ______________________________________________________ 81
APPENDIX G: FINANCING _______________________________________________________________________ 82

5
APPENDIX G.1 - CALCULATIONS ____________________________________________________________________ 84
APPENDIX H: CALVIN COLLEGE CARBON NEUTRALITY DESIGN PROJECT _________________________________ 86
APPENDIX I: STUDENTS INVOLVED _______________________________________________________________ 89
APPENDIX J: STATEMENT ON SUSTAINABILITY _____________________________________________________ 90
APPENDIX K: PROFESSOR PIERS’S RESEARCH _______________________________________________________ 98

6
Appendix A: Energy Use and Purchasing
Introduction
As a part of the Calvin College Neutrality Project, the Energy Use and Purchasing group was responsible
for 4 tasks. First, determine Calvin's carbon footprint due to energy use on campus. Second, determine
and validate different energy conservation methods that would offset Calvin's carbon footprint. Third,
explore possible renewable energy options that would as well reduce the carbon footprint. Fourth,
develop a plan to bring carbon emissions due to energy use on campus to zero. How these four tasks
were accomplished is explained in the following report.
Carbon Footprint
The carbon foot print due to energy use on campus is a significant part of the overall carbon emitted by
Calvin. Carbon emission are incurred by Calvin College due to energy use through two ways, natural gas
combustion used for heating campus, and production methods used to create the electricity Calvin uses.
Table 1 presents the composition of energy production used to generate the electricity that Calvin
purchases, and its respective emission carbon emission.
Table 1: Energy Composition and Carbon Emission
Energy Composition Percent of Energy Carbon Emission [lbm/kWh]
Coal 0.57 2.117
Gas 0.18 1.314
Renewable 0.035 2.015
Nuclear 0.2 0
Wind 0.015 0
Current Carbon Footprint
Currently on average Calvin purchases 16000 mmBTU of natural gas, and 21,500,000 kW-hr annually. Do
to the warming climate in Michigan in recent years there has been a trend of decrease natural gas use,
and increasing electricity use. This energy purchasing and use results in 43,000 MTCE per year.
New Field House Complex and Boilers
This year Calvin began construction the new field house complex, and replaced two boilers in the
science division power plant for more efficient ones. GMB engineers have calculated that the new field
house complex will increase electricity use by 100%, and natural gas use by 50%. This has a serious
impact on increasing the carbon emission that Calvin is responsible for. It was believed that boiler
replacement would result in a "wash", but it was found that was not the case. A model was developed
to best imitate the complex use of Boilers on campus. The estimates calculated by this model for the
MTCE by the field house complex addition and more efficient boiler swap out are presented in Table 2
(see appendix 4 for calculations):

7
Table 2: Boiler System Model Results
Existing Infrastructure [kg] 482331
New Boilers Swap [kg] 470952
New Boilers + Additional Load [kg] 643211
Additional MTCE 1332
Future Carbon Emission Estimation
A mathematical model was developed to account for the new field house complex, and electricity and
gas use escalation. We assumed positive escalation rate for electricity and gas use because Calvin
continues to purchase properties, and there is an ever increasing use of technology needing electricity
(e.g. computers). See appendix 5 for this model.
Carbon Reduction Options
Several methods of reducing Calvin’s carbon emissions were considered. These included using wind
turbines as a non-fossil fuel source of energy, lowering heating levels in campus buildings to reduce
energy use, and purchasing carbon offset credits to mitigate the rest of the energy use which could not
be accounted for. Wind turbines, though not a perfect solution, would allow Calvin to produce much of
its own electrical energy (depending on the number of turbines installed), which is otherwise a major
source of carbon emissions. Reducing heat loads in campus buildings would allow the campus to save
both money and carbon emissions, just by a simple operational change. On the other hand, it might
require some behavioral changes on the part of the occupants of the buildings; for example, it may
become necessary for some occupants to wear a sweater indoors. Finally, many of the college’s carbon
emissions simply cannot be cut out without drastic impacts on the lives of those at the college, which
would be intolerable for many of them. As such, it becomes necessary to mitigate the remaining carbon
emissions. One of the easiest and best ways to accomplish this is with the use of carbon offset credits.
Purchasing these credits from a certified supplier essentially pays for them to make an investment which
will reduce carbon emissions relative to the status quo (See Appendix 2). By purchasing enough such
credits to offset its remaining emissions, the college could legitimately claim carbon neutrality. A
possible solution could incorporate any or all of these options, though a combination of several
strategies is typically found to be most effective.
Carbon Neutrality Plan
Our group has developed a plan which yields carbon neutrality from its start. The plan requires
significant upfront costs however pays extreme dividends in the long run. Our plan has three major
components, renewable energy in the form of wind turbines, conservation of energy in the form of an
indoor temperature drop, and carbon offsetting through www.terrapass.com
The first step to our plan of carbon neutrality is to install 4 wind turbines on Calvin’s behalf. The
research of previous ENGR 333 classes was adapted to our research in order to find what types of costs
and production we could expect to see from the wind turbines. A plan was developed to implement 4
wind turbines onto Calvin’s campus over a 20 year period. The 4 wind turbines would only cut about
10% off of Calvin’s carbon footprint however they would lead to significant profits that are later used for
the purchase of Carbon credits.

8
The next step in our plan is to adopt another suggestion from a previous ENGR 333 class in the adaption
of a temperature drop on campus. This temperature drop not only lowers the campus’ gas usage, and
thus shrinking our carbon footprint, but it also saves large amounts of money which again can be
applied toward carbon credits at the construction of the wind turbines.
The final step in our plan is offsetting the remaining portion of Calvin’s carbon footprint due to energy
purchasing and use with carbon credits from www.terrapass.com. The credits would be purchased in
early years of the plan at the schools expense however at later years the plan will pay for itself and even
surpass the funds required for complete carbon neutrality through offset credits.
Figure 1 shows the projected annual costs for our college to achieve carbon neutrality through our three
step plan.
Figure 1: Annual Payments for Carbon Neutrality
Conclusion
As a conclusion to the energy purchasing and use groups plan for carbon neutrality we would like to
point out that while carbon neutrality is not impossible, it is by no means easy. Complete carbon
neutrality will not only have a cost but will also require lifestyle changes by members of the community
at large. While acknowledging the difficulty in achieving carbon neutrality one must also acknowledge
the incredible opportunity for Calvin College to be a leader in our community here in west Michigan and
in the academic community at large. Complete carbon neutrality on Calvin’s campus would make a
2010 2015 2020 2025 2030 2035 2040
-2.250x10⁶
-1.800x10⁶
-1.350x10⁶
-900000
-450000
0
450000
900000
Year[i]
Co
st
of
Carb
on
Neu
trali
ty [
$]
1st Turbine Payments
2nd Turbine Payments
3rd Turbine Payments
4th Turbine Payments
1st Turbine Retired
2nd Turbine Retired
3rd Turbine Retired

9
statement about Calvin’s values and its desire to maintain good stewardship of all of God’s resources.
Carbon Neutrality may be difficult, but it’s certainly not impossible.
10
Appendix A.1: Boiler System Model Explanation Through conversation will Paul Pennock a model was developed to estimate the energy use of the
existing boiler infrastructure, and new boiler infrastructure with the increased heating load of the new
field house complex. To develop very accurate model of the boiler system would take a few heating
seasons of carful study on boiler operation on campus. This is due to the fact there is now record of how
boilers exactly operate throughout the year on campus. For example, the boiler in the library runs 100%
of the year, yet it automatically adjusts its flame intensity to match the load, but there is no record of
how and when it does this.
As a result, this model is based on how Paul Pennock described the existing boiler operate on campus.
This information was used to calculate the actual heating load of campus. The actual heat load was used
in a model with new boiler efficiencies to see how much the new boilers reduced the MTCE on campus.
Last, the existing load number was increased by 50% for the increase load presented by the new field
house complex (this percentage was provided by GMB engineers). The results are presented in the main
appendix text.
This model may not give an exact number or MTCE increase by the new field house and boilers swaps,
but it does confidently show that these things do not cancel each other out. There will increase in
Calvin’s carbon footprint. Find the discussed model in the rest of this appendix.
11
Appendix A.2: Carbon Offset Credits Discussion Carbon offset credits, often referred to as carbon offsets or carbon credits, are essentially a tradable
commodity which are used as part of a carbon trading system, whether it be mandatory or voluntary.
They are typically sold in units of dollars (or Euros, pounds, or other currencies) per metric ton of carbon
dioxide emitted. Carbon credits can come either from projects which remove carbon dioxide (CO2) from
the atmosphere or from projects which reduce the amount of CO2 which would otherwise have been
released to the atmosphere. An example of the former is reforestation projects, wherein people plant
young trees in areas which were previously cleared. This obviously can have significant environmental
benefits, including increase in wildlife habitat, watershed health, erosion control, and many more. An
example of the latter type of carbon credit-generating project is the construction of a wind turbine
“farm” to replace the construction of a coal-fired power plant. In contrast to the reforestation, this is
detrimental to the environment, although much less so than the coal-powered generating facility it
replaced. While this is a major difference, it is not always apparent to people who buy carbon offsets,
nor is the information always made available by vendors of the credits. Nevertheless, the two methods
share a common principle, which involves reducing the greenhouse gas emissions from current values.
Carbon offsets allow the people who can most easily reduce carbon emissions to be compensated for
their efforts, and thereby make sure that carbon emission reductions are made in the most cost-efficient
way possible. This is particularly useful in a system where carbon emissions are limited, and industries
must find ways to reduce their carbon emissions or to offset them with purchased credits. At that
point, it becomes very important to weigh the cost of equipment or operations upgrades versus the cost
of carbon offset purchasing. Whichever option is determined to be most cost-effective will most likely
be adopted.
At an educational institution, the use of purchased carbon offsets becomes more ambiguous,
particularly if there is no mandated cap on carbon emissions in the region. In that case, purchasing
carbon offsets becomes something very similar to paying taxes: a necessary evil which contributes very
little real value to the institution beyond possible advertising claims. In such a case, it may be regarded
as more worthwhile to pay slightly more for carbon offset costs in order to support a program which is
more visible to students, staff, and the community. In the unique environment of an educational
institution, the focus is indeed on education, and it might well be said that carbon credits would not be
the most advantageous way to pursue carbon emissions reductions.

12
Appendix A.3: Energy Use Raw Data
2003
Jan Feb Mar Apr May Jun
Gas (mmBTU) 21550 17653 15297 21908 13866 10457
Gas (kWh) 6.32E+06 5.17E+06 4.48E+06 6.42E+06 4.06E+06 3.07E+06
Cost* $139,644.00 $114,391.44 $99,124.56 $141,963.84 $89,851.68 $67,761.36
Jul Aug Sep Oct Nov Dec
11083 10546 13913 15297 15874 20115
3.25E+06 3.09E+06 4.08E+06 4.48E+06 4.65E+06 5.90E+06
$71,817.84 $68,338.08 $90,156.24 $99,124.56 $102,863.52 $130,345.20
Electicity (kWh)
Cost
Emission Break down (lbm/kWh)
coal 2.117
gas 1.314
energy Compostion Percent of Energy lbm CO2
Coal 0.57 0
Gas 0.18 0
Nuclear 0.2 0
Renewable 0.05 0
Yearly Analysis Total
Gas (mmBTU) 100731
Gas (kWh) 29523000
Cost* $652,736.88
Electicity (kWh) 0
Cost $86,828.00
$/kWh #DIV/0!
Total Cost* $739,564.88
Yearly Carbon Analysis
Gas (lbm) 38793222.00
Gas (metric tonnes) 17596.49
Electricty (lbm) 0.00
Electricity (metric tonnes) 0.00
Total (metric tonnes) 17596.49

13
2004
Jan Feb Mar Apr May Jun
Gas (mmBTU) 24504 23352 21554 16322 13053 13332
Gas (kWh) 7.18E+06 6.84E+06 6.32E+06 4.78E+06 3.83E+06 3.91E+06
Cost* $158,785.92 $151,320.96 $139,669.92 $105,766.56 $84,583.44 $86,391.36
Jul Aug Sep Oct Nov Dec
11596 12194 13097 14626 18208 20236
3.40E+06 3.57E+06 3.84E+06 4.29E+06 5.34E+06 5.93E+06
$75,142.08 $79,017.12 $84,868.56 $94,776.48 $117,987.84 $131,129.28
Electicity (kWh)
Cost
Emission Break down (lbm/kWh)
coal 2.117
gas 1.314
energy Compostion Percent of Energy lbm CO2
Coal 0.57 0
Gas 0.18 0
Nuclear 0.2 0
Renewable 0.05 0
Yearly Analysis Total
Gas (mmBTU) 112117
Gas (kWh) 32858000
Cost* $726,518.16
Electicity (kWh) 0
Cost $89,957.00
$/kWh #DIV/0!
Total Cost* $816,475.16
Yearly Carbon Analysis
Gas (lbm) 43175412.00
Gas (metric tonnes) 19584.24
Electricty (lbm) 0.00
Electricity (metric tonnes) 0.00
Total (metric tonnes) 19584.24

14
2005
Jan Feb Mar Apr May Jun
Gas (mmBTU) 23593 19945 21624 16781 15283 10883
Gas (kWh) 6.91E+06 5.85E+06 6.34E+06 4.92E+06 4.48E+06 3.19E+06
Cost* $152,882.64 $129,243.60 $140,123.52 $108,740.88 $99,033.84 $70,521.84
Jul Aug Sep Oct Nov Dec
11139 12327 7707 10391 15863 19766
3.27E+06 3.61E+06 2.26E+06 3.05E+06 4.65E+06 5.79E+06
$72,180.72 $79,878.96 $49,941.36 $67,333.68 $102,792.24 $128,083.68
Electicity (kWh)
Cost
Emission Break down (lbm/kWh)
coal 2.117
gas 1.314
energy Compostion Percent of Energy lbm CO2
Coal 0.57 0
Gas 0.18 0
Nuclear 0.2 0
Renewable 0.05 0
Yearly Analysis Total
Gas (mmBTU) 108109
Gas (kWh) 31682000
Cost* $700,546.32
Electicity (kWh) 0
Cost $77,193.00
$/kWh #DIV/0!
Total Cost $777,739.32
Yearly Carbon Analysis
Gas (lbm) 41630148.00
Gas (metric tonnes) 18883.31
Electricty (lbm) 0.00
Electricity (metric tonnes) 0.00
Total (metric tonnes) 18883.31

15
2006
Jan Feb Mar Apr May Jun
Gas (mmBTU) 19933 20106 17563 11203 10229 7537
Gas (kWh) 5.84E+06 5.89E+06 5.15E+06 3.28E+06 3.00E+06 2.21E+06
Cost* $129,165.84 $130,286.88 $113,808.24 $72,595.44 $66,283.92 $48,839.76
Electicity (kWh) 1733210 1693594 1737504 1891044 1977043 1712523
Cost $101,219.86 $105,069.15 $119,057.59 $131,215.35 $135,549.32 $119,042.68
Jul Aug Sep Oct Nov Dec
Gas (mmBTU) 7054 11920 10444 13847 14559 17663
Gas (kWh) 2.07E+06 3.49E+06 3.06E+06 4.06E+06 4.27E+06 5.18E+06
Cost* $45,709.92 $77,241.60 $67,677.12 $89,728.56 $94,342.32 $114,456.24
Electicity (kWh) 1992280 1691539 1952033 1994287 1742391 1336487
Cost $134,662.96 $122,475.97 $137,418.40 $131,268.28 $124,643.49 $108,356.15
Emission Break down (lbm/kWh)
coal 2.117
gas 1.314
energy Compostion Percent of Energy kWh
Coal 0.57 6124603
Gas 0.18 1934085
Nuclear 0.2 2148984
Renewable 0.05 537246
Yearly Analysis Total
Gas (mmBTU) 86571
Gas (kWh) 25371000
Cost* $560,980.08
Electicity (kWh) 10744918
Cost $711,153.95
$/kWh $0.07
Total Cost $1,272,134.03
Yearly Carbon Analysis
Gas (lbm) 33337494.00
Gas (metric tonnes) 15121.79
Electricty (lbm) 15507173.11
Electricity (metric tonnes)
Total (metric tonnes) 15121.79

16
2007
Jan Feb Mar Apr May Jun
Gas (mmBTU) 23303 24383 16502 14257 10987 6058
Gas (kWh) 6.83E+06 7.15E+06 4.84E+06 4.18E+06 3.22E+06 1.78E+06
Cost* $151,003.44 $158,001.84 $106,932.96 $92,385.36 $71,195.76 $39,255.84
Electicity (kWh) 1368371 1383898 1763767 1814449 2018586 1943657
Cost $106,137.92 $111,682.49 $138,158.43 $141,201.87 $143,902.00 $139,254.71
Jul Aug Sep Oct Nov
Gas (mmBTU) 7280
Gas (kWh) 2.13E+06
Cost* $47,174.40
Electicity (kWh)
Cost
Emission Break down (lbm/kWh)
coal 2.117
gas 1.314
energy Compostion Percent of Energy lbm CO2
Coal 0.57 444792.329
Gas 0.18 140460.736
Nuclear 0.2 156067.484
Renewable 0.05 39016.871
Yearly Analysis Total
Gas (mmBTU) 95490
Gas (kWh) 27984000
Cost $618,775.20
Electicity (kWh) 780337.42
Cost $0.00
$/kWh $0.00
Total Cost $618,775.20
Yearly Carbon Analysis
Gas* (lbm) 36770976.00
Gas* (metric tonnes) 16679.21
Electricty (lbm) 1126190.77
Electricity (metric tonnes) 510.84
Total (metric tonnes) 17190.04
17
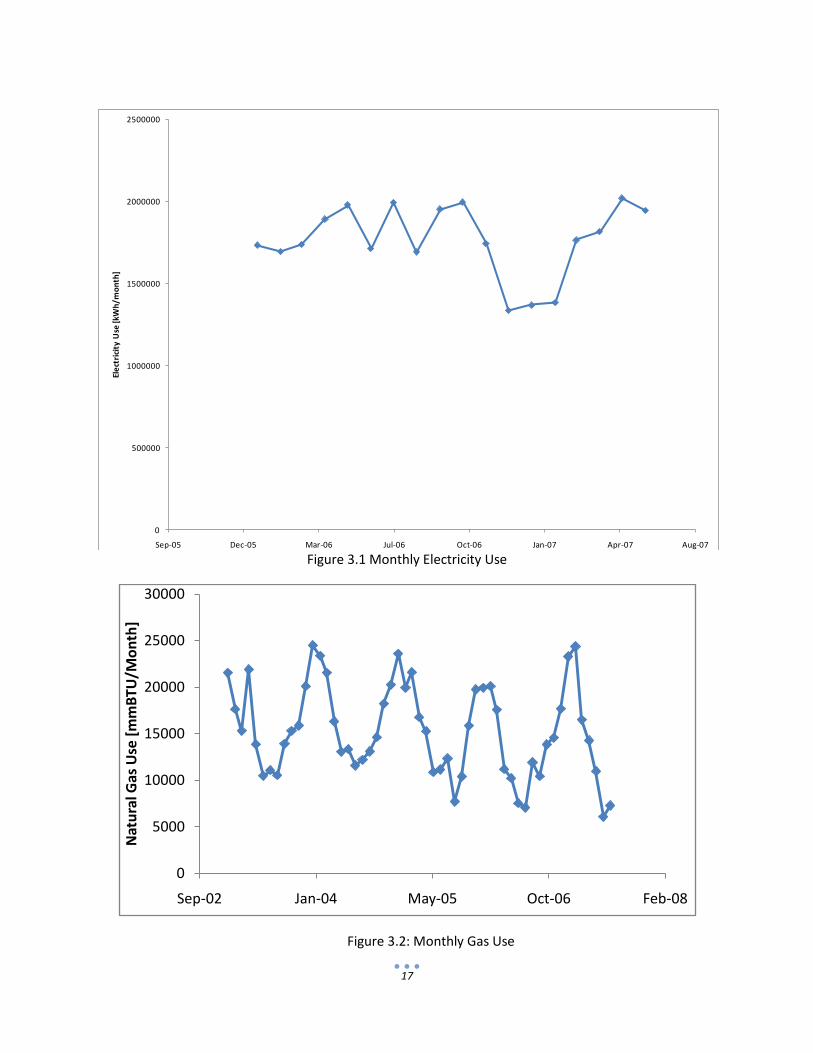
Figure 3.1 Monthly Electricity Use
Figure 3.2: Monthly Gas Use
0
500000
1000000
1500000
2000000
2500000
Sep-05 Dec-05 Mar-06 Jul-06 Oct-06 Jan-07 Apr-07 Aug-07
Ele
ctri
city
Use
[kW
h/m
on
th]
0
5000
10000
15000
20000
25000
30000
Sep-02 Jan-04 May-05 Oct-06 Feb-08
Nat
ura
l Gas
Use
[m
mB
TU/M
on
th]

18
Appendix A.4: Boiler System Model EES Worksheet
"!Knowns" "Fuel Information" LHV_CH4=50010[kJ/kg] Heating_season=.58[year]*convert(year,s) "Boiler Efficiency" "Existing Setup" Eta[0]=.65 "Apartments" Eta[1]=0.67 "Commons" Eta[2]=0.67 "Commons" Eta[3]=0.67 "Commons" Eta[4]=0.92 "Library" Eta[5]=0.67 "KDH" Eta[6]=0.67 "KDH" Eta[7]=0.65 "SDPP" Eta[8]=0.65 "SDPP" Eta[9]=.62 "PE" Eta[10]=.62 "PE" "New Setup" Eta[11]=.65 "Apartments" Eta[12]=0.67 "Commons" Eta[13]=0.67 "Commons" Eta[14]=0.67 "Commons" Eta[15]=0.92 "Library" Eta[16]=0.67 "KDH" Eta[17]=0.67 "KDH" Eta[18]=0.97 "SDPP" Eta[19]=0.97 "SDPP" Eta[20]=.62 "PE" Eta[21]=.62 "PE" "Boiler Power Rating" P[0]=300[hp]*convert(hp,kW) "Combined Apartments" P[1]=338[hp]*convert(hp,kW) "Commons" P[2]=338[hp]*convert(hp,kW) "Commons" P[3]=338[hp]*convert(hp,kW) "Commons" P[4]=300[hp]*convert(hp,kW) "Library" P[5]=150[hp]*convert(hp,kW) "KDH" P[6]=150[hp]*convert(hp,kW) "KDH" P[7]=300[hp]*convert(hp,kW) "SDPP" P[8]=300[hp]*convert(hp,kW) "SDPP" P[9]=125[hp]*convert(hp,kW) "PE" P[10]=125[hp]*convert(hp,kW) "PE" "New" P[11]=300[hp]*convert(hp,kW) "Combined Apartments" P[12]=338[hp]*convert(hp,kW) "Commons" P[13]=338[hp]*convert(hp,kW) "Commons"

19
P[14]=338[hp]*convert(hp,kW) "Commons" P[15]=300[hp]*convert(hp,kW) "Library" P[16]=150[hp]*convert(hp,kW) "KDH" P[17]=150[hp]*convert(hp,kW) "KDH" P[18]=400[hp]*convert(hp,kW) "SDPP" P[19]=400[hp]*convert(hp,kW) "SDPP" P[20]=125[hp]*convert(hp,kW) "PE" P[21]=125[hp]*convert(hp,kW) "PE" "Operation Variable - This method assumes that the most effcient boiler is being used flat out, and then next most efficient boiler is brought online and the process repeats" f[0]=.7 "Apartments" f[1]=.4 "Commons" f[2]=.2 "Commons" f[3]=0 "Commons" f[4]=.75 "Library" f[5]=.75 "KDH - Dorm loop" f[6]=.75 "KDH - Dorm loop" f[7]=.5 "SDPP" f[8]=.5 "SDPP" f[9]=.5 "PE" f[10]=0 "PE" "New" f[11]=1 "apartments" f[12]=1 "Commons" f[13]=0 "Commons" f[14]=0 "Commons" f[15]=1 "Library" f[16]=1 "KDH - Dorm loop" f[17]=1 "KDH - Dorm loop" f[18]=1 "New SDPP" //f[19]=0.2812 "New SDPP" f[20]=0 "PE" f[21]=0 "PE" "kg Nat Gas Used By Existing Campus" duplicate i=0,10 m_used[i]=(P[i]/(LHV_CH4*eta[i])*f[i])*heating_season end m_GasUse[1]=SUM(m_used[i],i=0,10) "Useful Kg of Nat Gas" Duplicate i=0, 10 m[i]=(P[i]/(LHV_CH4)*f[i])*heating_season end "Load Calculations" "Switch Out Load and New_load" Load=SUM(m[i],i=0,10)*LHV_CH4*convert(kJ,mmBTU) //Load=SUM(m[i],i=11,21)*LHV_CH4*convert(kJ,mmBTU) New_load=Load*1.5 New_Load=SUM(m[i],i=11,21)*LHV_CH4*convert(kJ,mmBTU)

20
"Useful Kg of Nat Gas - Finds f for new boiler in SDPP" Duplicate i=11, 21 m[i]=(P[i]/(LHV_CH4)*f[i])*heating_season end "kg Nat Gas Used By New Boiler Setup" duplicate i=11,21 m_used[i]=(P[i]/(LHV_CH4*eta[i])*f[i])*heating_season end m_GasUse[2]=SUM(m_used[i],i=11,21) "Carbon Calculation" MTCE=((m_GasUse[2]*LHV_CH4)*1.314[lbm/kW-hr]*convert(kJ,kW-hr)-(m_GasUse[1]*LHV_CH4)*1.314[lbm/kW-hr]*convert(kJ,kW-hr))*convert(lbm,mton) Increase = New_Load-Load
21
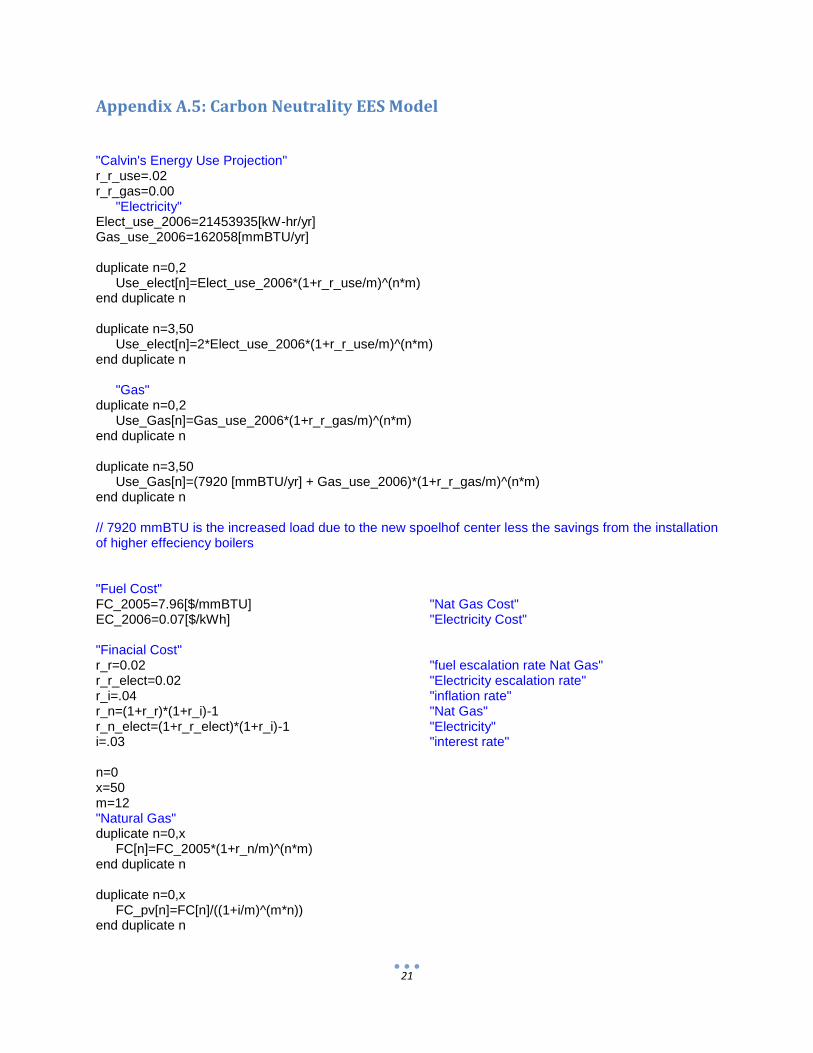
Appendix A.5: Carbon Neutrality EES Model
"Calvin's Energy Use Projection" r_r_use=.02 r_r_gas=0.00 "Electricity" Elect_use_2006=21453935[kW-hr/yr] Gas_use_2006=162058[mmBTU/yr] duplicate n=0,2 Use_elect[n]=Elect_use_2006*(1+r_r_use/m)^(n*m) end duplicate n duplicate n=3,50 Use_elect[n]=2*Elect_use_2006*(1+r_r_use/m)^(n*m) end duplicate n "Gas" duplicate n=0,2 Use_Gas[n]=Gas_use_2006*(1+r_r_gas/m)^(n*m) end duplicate n duplicate n=3,50 Use_Gas[n]=(7920 [mmBTU/yr] + Gas_use_2006)*(1+r_r_gas/m)^(n*m) end duplicate n // 7920 mmBTU is the increased load due to the new spoelhof center less the savings from the installation of higher effeciency boilers "Fuel Cost" FC_2005=7.96[$/mmBTU] "Nat Gas Cost" EC_2006=0.07[$/kWh] "Electricity Cost" "Finacial Cost" r_r=0.02 "fuel escalation rate Nat Gas" r_r_elect=0.02 "Electricity escalation rate" r_i=.04 "inflation rate" r_n=(1+r_r)*(1+r_i)-1 "Nat Gas" r_n_elect=(1+r_r_elect)*(1+r_i)-1 "Electricity" i=.03 "interest rate" n=0 x=50 m=12 "Natural Gas" duplicate n=0,x FC[n]=FC_2005*(1+r_n/m)^(n*m) end duplicate n duplicate n=0,x FC_pv[n]=FC[n]/((1+i/m)^(m*n)) end duplicate n

22
"Electricity" duplicate n=0,x EC_elect[n]=EC_2006*(1+r_n_elect/m)^(n*m) end duplicate n duplicate n=0,x EC_pv[n]=EC_elect[n]/((1+i/m)^(m*n)) end duplicate n "Energy Savings" Heat_savings=162000 [$/yr] Energy_saved=Heat_savings/FC_2005 duplicate n=0,x Cost_savings[n]=Energy_saved*FC_PV[n] end duplicate n "Carbon Savings" Carbon_emission=1.314[lbm/kWh] Carbon_emission_elect=1.44[lbm/kWh] Carbon_saved=energy_saved*convert(mmBTU,kWh)*Carbon_emission*convert(lbm,mton) duplicate n=0,x Carbon_cost[n]=Cost_savings[n]/Carbon_saved end duplicate n "2007 price" PV_WindTurbine[1] = 820000[$/yr] duplicate i=2,17 PV_WindTurbine[i] = PV_WindTurbine[1]*(1+r_i)^i end EnergyProductionPerTurbine = 2053 [MW-hr/yr] // We will implement a plan to phase in 4 Wind turbines each being paid off in 5 year periods duplicate i=2,6 WindTurbinePayment[i] = PV_WindTurbine[2]* (r_i*(1+r_i)^(5))/((1+r_i)^5 - 1) end duplicate i=7,11 WindTurbinePayment[i] = PV_WindTurbine[7]* (r_i*(1+r_i)^(5))/((1+r_i)^5 - 1) end duplicate i=12,16 WindTurbinePayment[i] = PV_WindTurbine[12]* (r_i*(1+r_i)^(5))/((1+r_i)^5 - 1) end duplicate i=17,21 WindTurbinePayment[i] = PV_WindTurbine[17]* (r_i*(1+r_i)^(5))/((1+r_i)^5 - 1) end duplicate i=22,36 WindTurbinePayment[i] = 0

23
end duplicate i=2,6 ElectricitySavings[i] = EnergyProductionPerTurbine*EC_elect[i]*convert(mW,kW) end duplicate i=7,11 ElectricitySavings[i] = EnergyProductionPerTurbine*2*EC_elect[i]*convert(mW,kW) end duplicate i=12,16 ElectricitySavings[i] = EnergyProductionPerTurbine*3*EC_elect[i]*convert(mW,kW) end duplicate i=17,21 ElectricitySavings[i] = EnergyProductionPerTurbine*4*EC_elect[i]*convert(mW,kW) end duplicate i=22,26 ElectricitySavings[i] = EnergyProductionPerTurbine*4*EC_elect[i]*convert(mW,kW) end duplicate i=27,31 ElectricitySavings[i] = EnergyProductionPerTurbine*3*EC_elect[i]*convert(mW,kW) end duplicate i=32,36 ElectricitySavings[i] = EnergyProductionPerTurbine*2*EC_elect[i]*convert(mW,kW) end duplicate i=37,40 ElectricitySavings[i] = EnergyProductionPerTurbine*1*EC_elect[i]*convert(mW,kW) end "Wind Turbine Analysis" duplicate i=2,36 Net_Turbine_Value[i] = - WindTurbinePayment[i] + ElectricitySavings[i] end "Carbon Footprint" "Nothing" duplicate n=2,36 Carbon_Footprint[n]=(Use_elect[n]*Carbon_emission_elect+Use_gas[n]*convert(mmBTU,kWh)*Carbon_emission)*convert(lbm,mton) end duplicate n "Less Heat Laod" duplicate n=2,36 Carbon_Footprint_heat[n]=Carbon_Footprint[n]-Carbon_saved end duplicate n "Less Turbines" duplicate n=2,36 Carbon_Footprint_turbine[n]=Carbon_Footprint[n]-Carbon_saved-(electricitysavings[n]/(EC_elect[n]))*carbon_emission_elect*convert(lbm,mton)

24
end duplicate n duplicate n=2,36 CarbonOffsetCost[n]=Carbon_Footprint_turbine[n]*11 [$/mton] end duplicate n=2,36 CostOfCarbonNeutrality[n] = -(Net_Turbine_Value[n] - CarbonOffsetCost[n]) end duplicate n=2,36 Year[n] = 2005+n end CarboneNeutralityNetValue = SUM(CostofCarbonNeutrality[n],n=2,36) duplicate n=2,36 zero[n] = 0 end
25
Appendix B: Land Use and Water and Wastewater Management Group
Purpose
The purpose of the Land Use and Water and Wastewater Management group was to analyze the impact
of land and water use on the net carbon footprint of Calvin College. Our group quantified the emissions
attributed to consumption of potable water and emission of wastewater in addition to sequestrations
on campus. After the carbon footprint was quantified, our tasks changed to minimizing this impact by
proposing methods to reduce emissions and increase sequestrations.
Procedure
Land Use
The impact of land use was measured primarily on the basis of the sequestration potential of the various
plant communities on campus. Much of this data was acquired from a previous study conducted by
Professor Dornbos. Professor Dornbos broke the campus up into general plant communities and
provided area, sequestration potential, and total carbon sequestered per year of each community. The
data from this study can be found in Appendix A.1. In order to determine the best method of improving
the sequestration on campus, the plant community with the highest sequestration potential was
determined. Buckthorn was considered, but due to the plants’ intrusive nature and tendency to spread
uncontrollably buckthorn was found to be an unattractive option. White oak was selected as the plant
community for optimal sequestration. In order to apply our theory, our group determined what
portions of the campus are able to be converted to white oak. The replanting of forested areas would
require too much work and provide minimal results. Our group also decided that most of the areas
planted with manicured grass are necessary for campus appearance. It was determined that the best
area for this improvement was the prairie. Another method for improvement that was suggested
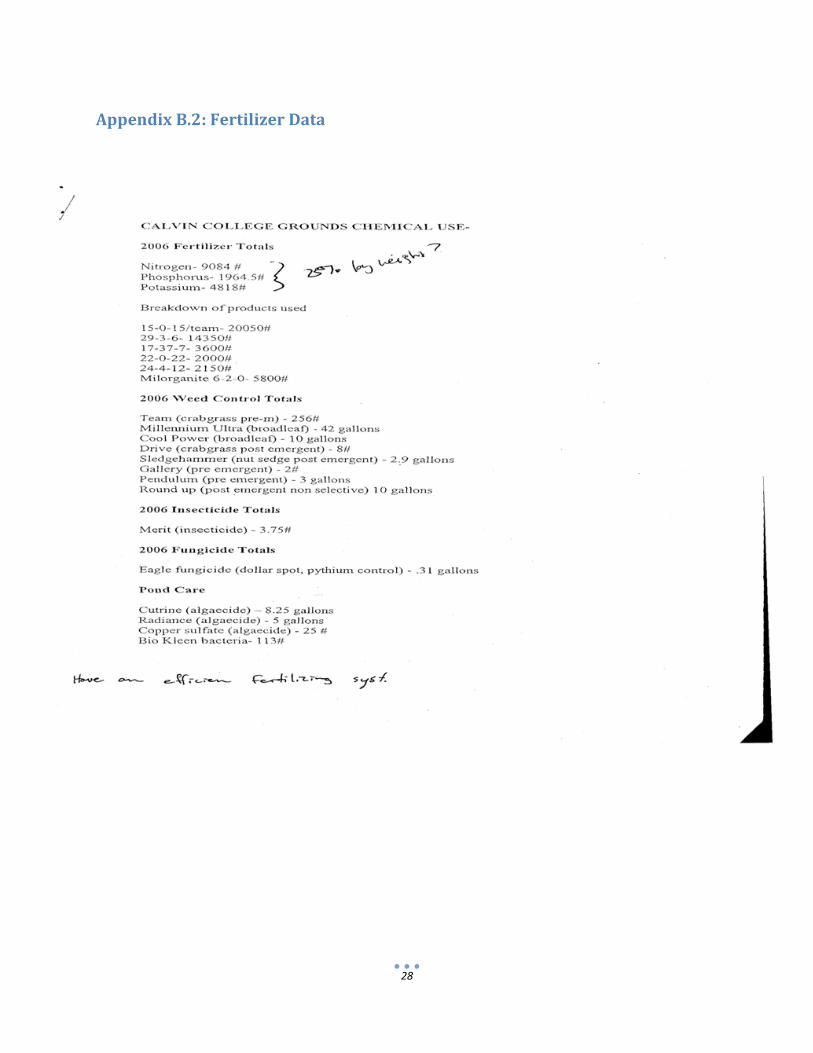
utilized a newly developed fertilizer than sequesters one-quarter of its weight in carbon. The fertilizer,
however, is still in the design phases and not available for commercial purchase. The data for Calvin’s
fertilizer use can be seen in Appendix B.2. The article about the carbon sequestering fertilizer can be
seen in Appendix B.3.
Water Use
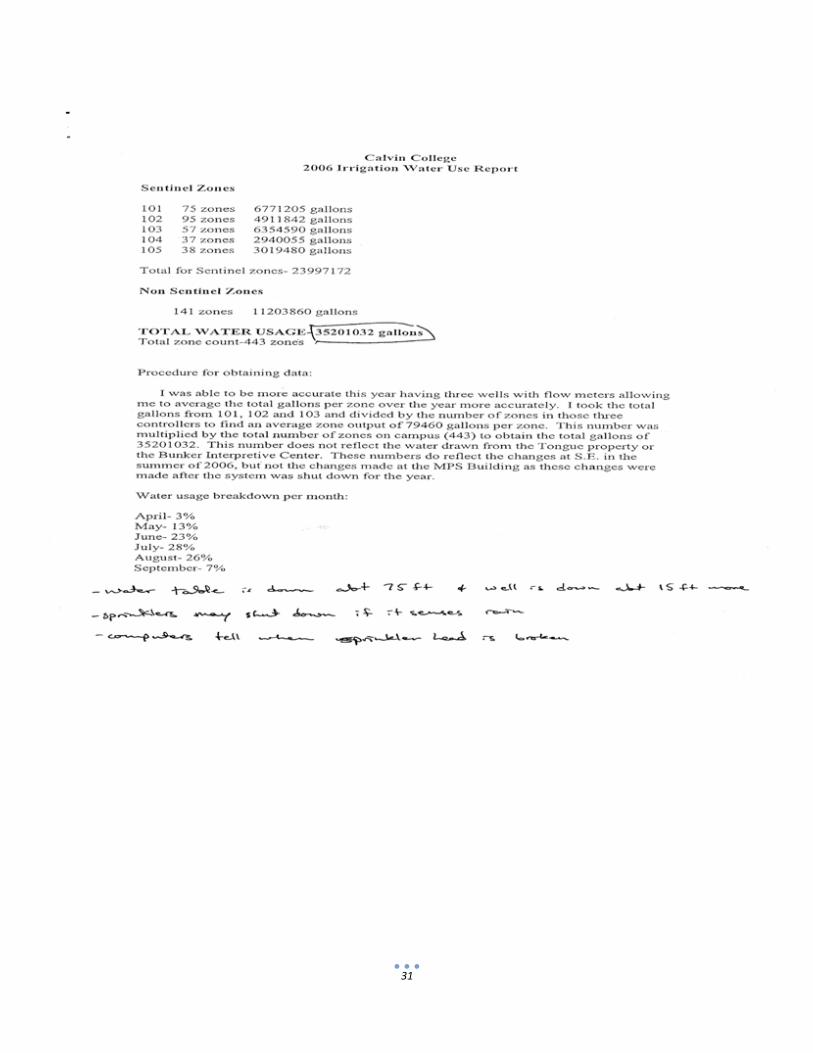
In regard to water use, our group based the analysis on data taken from the college’s utility bills, which
were ascertained from Dan Slager in the Physical Plant. Our group found values for the amount of water
consumed on campus and the water and sewer costs (see Appendix B.4). In order to determine the
carbon footprint of water and sewer use, our group made the assumption that half the costs for water
and sewer charged by the utility company were a result of the energy costs to the utility company for
treatment and pumping. This value was converted to metric tons of carbon emitted using a conversion
factor from the energy company’s website (see Appendix B.5). Methods of water use reduction were
then considered, as reducing the amount of water used would reduce the energy requirements on the
utility company induced by the college. The options included installing low-flow showerheads, low-flow
toilets, improved irrigation systems, frontloading washers, and waterless urinals. Low-flow
26
showerheads, low-flow toilets, and frontloading washers have already been implemented on campus
and the irrigation system is already fairly efficient. The one option that our group considered for water
reduction was the waterless urinal. There is currently only one waterless urinal on campus (in the
Bunker Interpretive Center). This option was explored by assuming that 50 of the existing urinals on
campus were replaced with waterless urinals; at a cost of $350 per urinal. A previously conducted study
provided the data on how much water would be saved per urinal. Our group conducted an analysis on
data from the water reduction study to determine how much carbon would be reduced by the resulting
reduction in water use.
Our group also discovered some research for a carbon sequestering “tree” that uses a chemical reaction
of carbon dioxide and calcium hydroxide to sequester carbon. The artificial tree is a purely theoretical
option for Calvin at this time because the design seeing only conceptual. However, the sequestering
potential is great enough (estimates say 90,000 metric tons per year) that our group considered it. The
best option would be to construct the “tree” on land purchased away from campus due to the unsightly
appearance of the “trees”. The article regarding the tree can be found in Appendix B.6.
Conclusion
Land Use
Based on research by Professor Dornbos, the group determined that current land use sequesters 51
metric tons of carbon per year. The breakdown between plant community sequestrations can be seen
in Appendix A.1. The land use research returned three viable options for increased sequestration. The
first, planting white oak trees, a technology that is currently available. The other two options, the green
fertilizer and the carbon sequestering “tree” are theoretically feasible but not yet in production.
Implementation of white oak trees on Calvin’s prairie areas came to a cost of about $9709 per metric
ton sequestered and would sequester a maximum of about 1.02 additional metric tons per year. The
experimental green fertilizer would cost about$6578 per metric ton sequestered and would sequester a
maximum of about 1.03 additional metric tons per year. The artificial tree is still very much a
conceptual idea even in terms of cost, but a rough estimate said that when fully operational it would
cost approximately $80-$100 per metric ton of carbon sequestered and would sequester a maximum of
about 90,000 metric tons per year. This idea seems a bit miraculous but if functional could secure
Calvin’s carbon neutrality.
Water Use
The group determined that based on current water use and sewer production, Calvin creates about
1756.5 metric tons of carbon per year in emissions from energy companies. The calculations for this
value can be found in Appendix B.5. The only viable option researched by the group was the installation
of waterless urinals on campus. The waterless urinals would reduce emissions by about 53 metric tons
of carbon per year, at a cost of about $330 per metric ton reduced (not including the variable cost of
filters and maintenance).

27
Appendix B.1: Campus Sequestration Data
Sum of CO2 Sequestered
Species: CO2 (µg/m2/sec) CO2 *3600Sec: CO2 fixed µg/m
2SPECIES
1 12265.61188 44156202.75 GRASS
2 33857.75691 121887924.9 GR = goldenrod
3 -9505.690852 -34220487.07 SB = wild strawberries
4 19351.09289 69663934.42 DOG = red-osier dogwood
5 29260.78629 105338830.7 HAW = downy hawthorn
6 32227.487 116018953.2 BT = common buckthorn
7 20218.28762 72785835.44 DW = gray dogwood
8 -7651.305078 -27544698.28 MAP = sugar maple
9 -1618.388002 -5826196.806 ASH = white ash
10 10774.4493 38788017.47 BEE = american beech
11 60859.75422 219095115.2 OAK = white oak
Areas of Communities
Community Areas in Square Feet Area in Square Meters
Maintained Lawn 5299944.498 492364.8439
Prairie 1415833.458 131530.9282
Shrub 1242236.178 115403.7409
Edge 939852.4385 87312.29154
Early Successional 2546533.92 236573.0012
Mature Forest 788744.5164 73274.36557
Community Mton/m^2/yr Total CO2 (Mton/yr)
Maintained Lawn 4.416E-5 2.17E+13
Prairie Grassland 4.383E-5 5.77E+12
Shrub 8.75E-5 1.01E+13
Edge 9.44E-5 8.24E+12
Early Succesional 1.669E-5 -3.95E+12
Mature Forest 12.894E-5 9.45E+12
28
Appendix B.2: Fertilizer Data

29

30
31

32
Appendix B.3: Carbon Sequestering Fertilizer Article
Renewable Hydrogen, High Volume Carbon Sequestration and a Nitrogen Fertilizer Offer a
Sustainable Future BLAKELY, Ga., Aug. 27 /PRNewswire/ -- The hydrogen research team from
Clark Atlanta University, Georgia Institute of Technology, DOE National
Renewable Energy Laboratory (NREL), Scientific Carbons, Inc. and Envirotech,
Inc., at 11:46 PM on August 25, began producing hydrogen from biomass while
permanently sequestering 25% by weight of the material. The resulting carbon,
in its activated state as produced with USDA AARC funding, is highly
adsorbent and can be combined with co-products of the process to form a slow-
release nitrogen fertilizer. The fertilizer and farm industry can use this
process to offer a verifiable carbon sequestration service while increasing
farm income and crop yields. The use of the sequestered carbon as a carrier
for nitrogen and as a soil amendment, preventing harmful runoff of farm
chemicals is a win-win for farmers. Fertilizer manufacturers and farmers can
become a major force in the battle against global warming while facilitating
the production of hydrogen from renewable resources.
This work in hydrogen production is the culmination of a two-year field
research project. The first hour of the 100-hour demonstration showed the
clear difference system's two flares. The yellow hydrocarbon rich flame
contrasted against the almost clear flame, slightly blue from a small amount
of methane. The project has focused on expanding the demonstration of
hydrogen production while producing valuable co-products from farm and
forestry sources of biomass. Co-products are essential to the economics of
sustainable hydrogen production.
Scientific Carbons, Inc. (SCI) is a technology development company
focused on bio-refining. On August 22, 2002, SCI and NREL filed for patent
protection on a slow-release fertilizer made while producing biomass based
hydrogen and a sequestered carbon co-product. Danny Day, President of
Scientific Carbons said, "The preliminary numbers look promising. A small
percentage of the global unused agriculture and forestry waste could
sequester the amount of carbon building up in our atmosphere and deliver
nitrogen to plants that can sequester even more. Using this technique,
farming could be the most successful and economically profitable method of
sequestering the excess atmospheric carbon generated by fossil fuels.
Economic development can lead to
innovative sequestration techniques and we want to help demonstrate
sustainable ways to serve mankind."
The announcement by U.S. government of commitments of over $20 billion to
global warming research has demonstrated the seriousness of the issue of
carbon build up in our atmosphere. Carbon sequestration without economic
benefits would strain the global economy and hurt the poorest nations first
by reducing investment dollars available for economic development. SCI is
currently seeking international partners and facilities to continue this
important research. Mr. Day said, "This work benefits the farm economy and
ultimately, all life on earth."
http://www.prnewswire.com/cgi-bin/stories.pl?ACCT=104&STORY=/www/story/08-27-
2002/0001790040&EDATE=

33
Appendix B.4: Calvin Utility Bills

34
35

36

37

38

39

40
41

42

43

44

45

46

47

48
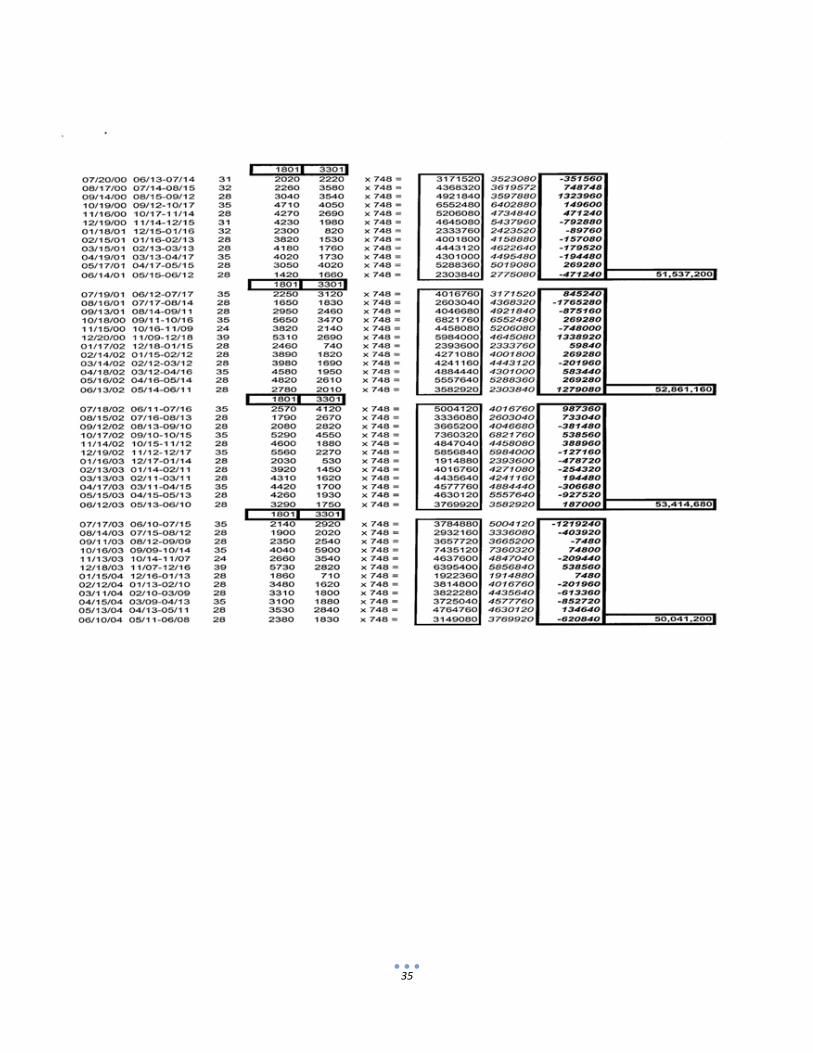
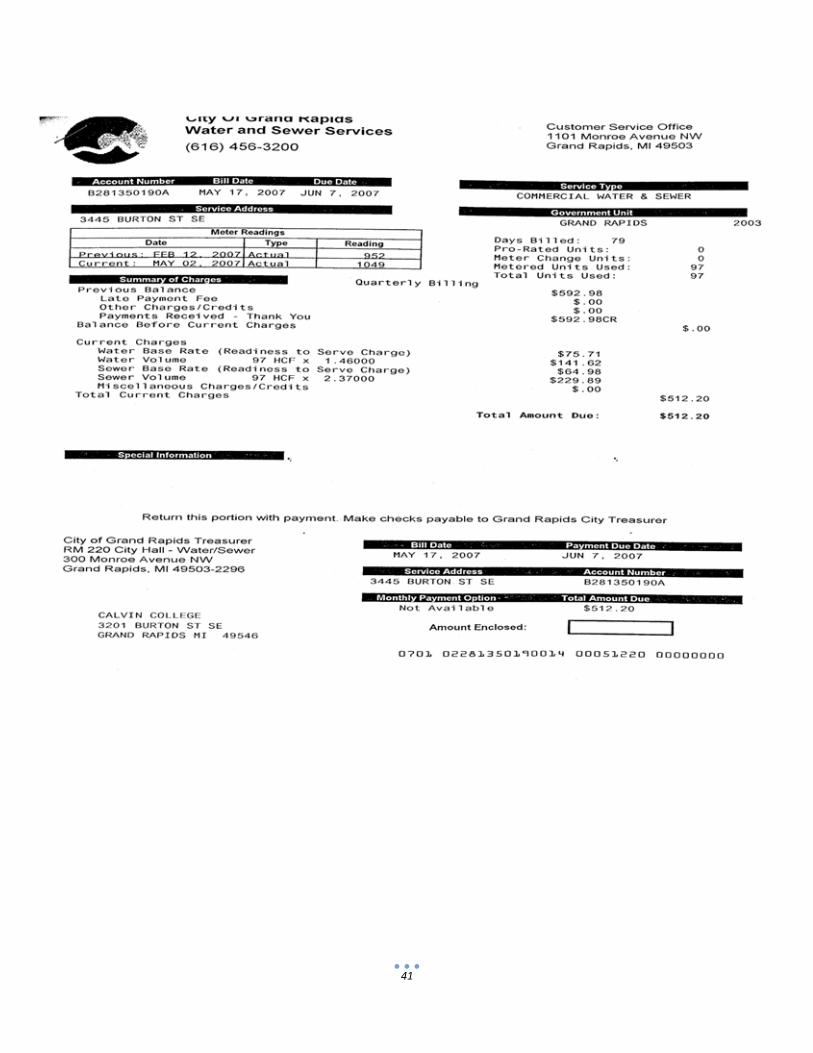
Appendix B.5: Water to Carbon Calculations
Per Quarter Per Quarter Annual Water
Address Water Volume [HCF] Sewer Volume [HCF] [HCF]
1800 93 93 372
1802 663 663 2652
3425 192 192 768
3435 193 193 772
3445 97 97 388
3455 175 175 700
3465 195 195 780
3475 606 588 2424
3485 341 341 1364
3495 409 409 1636
1801 and 3201Tap Water Sewer
Annual Water Annual Sewer Total Gallons/Year Total Gallons/Year Water Sewer
[HCF] [HCF] [Gallons / Year] [Gallons / Year] [$] [$]
372 372 278256 278256 675.36 577.92
2652 2652 1983696 1983696 675.36 577.92
768 768 574464 574464 302.84 259.92
772 772 577456 577456 302.84 259.92
388 388 290224 290224 302.84 259.92
700 700 523600 523600 302.84 259.92
780 780 583440 583440 508.12 434.8
2424 2352 1813152 1759296 508.12 434.8
1364 1364 1020272 1020272 310.52 266.52
1636 1636 1223728 1223728 310.52 266.52
50804160 50804160
Total Campus Use: 59672448 59618592 [gallons]
$116,473 $188,898 4199.36 3598.16
Total Costs $305,371
Energy Cost (est.) $152,685.72
Energy 1696.508 MW-hr
CO_2 Emissions 1756.520528 met. Tons
Cost without Service Charge
Readiness to Service Charge
Cost of Service Charge

49
Appendix B.6: Carbon Sequestering Tree Article
Synthetic trees could purify air
By Molly Bentley
A scientist has invented an artificial tree designed to do the job of plants.
But the synthetic tree proposed by Dr Klaus Lackner does not much resemble the leafy variety.
"It looks like a goal post with Venetian blinds," said the Columbia University physicist, referring to his sketch at the annual meeting of the American Association for the Advancement of Science in Denver, Colorado.
But the synthetic tree would do the job of a real tree, he said. It would draw carbon dioxide out of the air, as plants do during photosynthesis, but retain the carbon and not release oxygen.
If built to scale, according to Dr Lackner, synthetic trees could help clean up an atmosphere grown heavy with carbon dioxide, the most abundant gas produced by humans and implicated in climate warming.
He predicts that one synthetic tree could remove 90,000 tonnes of CO2 in a year - the emissions equivalent of 15,000 cars.
"You can be a thousand times better than a living tree," he said.
Carbon sinks
For now, the synthetic tree is still a paper idea. But Dr Lackner is serious about developing a working
model. His efforts suggest the wide net of ideas cast by scientists as they face the challenge of mitigating climate change.
Dr Lackner believes that carbon sequestration technology must be part of the long-term solution. Global reliance on fossil fuels would not decrease any time soon, he said, and developing countries cannot be expected to wait until alternatives are available.
The technology calls for two things: seizing carbon and then storing it. Direct capture of CO2, from power plants for example, is the simplest, according to Dr Lackner. But this doesn't work for all polluters. A car can't capture and store its carbon dioxide on-board; the storage tank would be too large.
"It's simply a question of weight," he said. "For every 14 grams of gasoline you use, you are going to have 44 grams of CO2."
The alternative is to capture emissions from the wind. In this case, a synthetic tree would act like a filter. An absorbent coating, such as limewater, on its slats or "leaves" would seize carbon dioxide and retain the carbon.
Dr Lackner predicts that the biggest expense would be in recycling the absorber material.
"We have to keep the absorbent surfaces refreshed because they will very rapidly fill up with carbon dioxide," he said. If an alkaline solution such as limewater were used, the resulting coat of limestone would need to be removed.
50
Dr Lackner is considering other less-alkaline solutions to prevent carbonate precipitation.
"There are a number of engineering issues which need to be worked out," he said.
Home use
A synthetic tree could be planted anywhere. A small one could sit like a TV on the lawn to balance out the CO2 emitted by one person or family.
But more practically, said Dr Lackner, a device the size of a barn would sit in the open air, near repositories for easy transportation and storage of carbon.
He estimated that 250,000 synthetic trees worldwide would be needed to soak up the 22 billion tonnes of CO2 produced annually.
But not everyone is rooted to the idea. Massachusetts Institute of Technology engineer Howard Herzog thinks Dr Lackner's design will not hold together on the scale he proposes.
He said you would expend more energy in capturing the CO2 - in keeping the slats coated in absorbent and disposing of it - than you would save.
"Once the solvent captures the CO2, it holds it on tight," said Dr Herzog, "and it's going to take a lot of energy to break those bonds."
He said that much more research was needed on the technology.
"The idea of air capture is seductive and would really be great to have," said Dr Herzog, "but it's important to separate out the concept from the technical details."
'Early days'
Meanwhile, Dr Lackner is pursuing his idea for carbon storage. While he was at the US Department of Energy's Los Alamos National Laboratory, his team worked on a storage method based on a natural chemical process known as rock weathering.
When CO2 binds with magnesium, it creates carbonate rocks which, according to Dr Lackner, retain carbon permanently and safely.
Currently, he said, the process is still too expensive to develop on a large scale.
But Dr Lackner is optimistic that the costs for carbon capture and storage will come down.
"This is still the early days of climate solutions," he said.
http://newsvote.bbc.co.uk/mpapps/pagetools/print/news.bbc.co.uk/2/hi/science/nature/2784227.stm
51
Appendix C: Solid Waste and Recycling
Objective
To minimize Calvin’s carbon footprint through better waste management and increased student
awareness.
Method
The group first researched Calvin’s current solid waste and recycling practices and set boundaries for
what would be included in the team’s analysis. The team received help and information from various
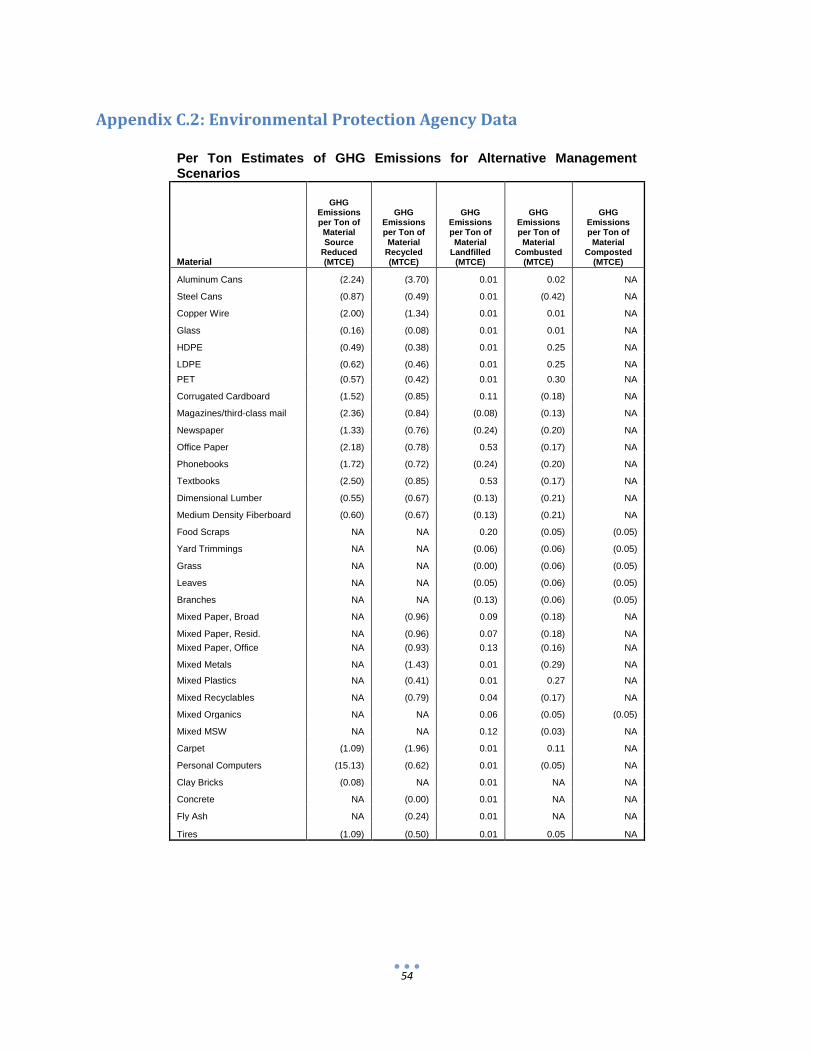
resources at Calvin on statistics for food waste and recycled materials. These statistics, along with data
from the Environmental Protection Agency (See Appendix C.2), were used to calculate the carbon
output generated from solid waste disposal and recycling. Once the team had determined the carbon
footprint from Calvin’s current waste management situation, the team was able to decide on solutions
that could be implemented to alleviate carbon output. The carbon footprint from implementing better
waste management was then subtracted from the current waste management carbon footprint in order
to find the potential carbon reduction. Finally, the group determined the cost of this carbon reduction.
A schedule of the group’s work throughout the semester can be seen in Appendix C.1.
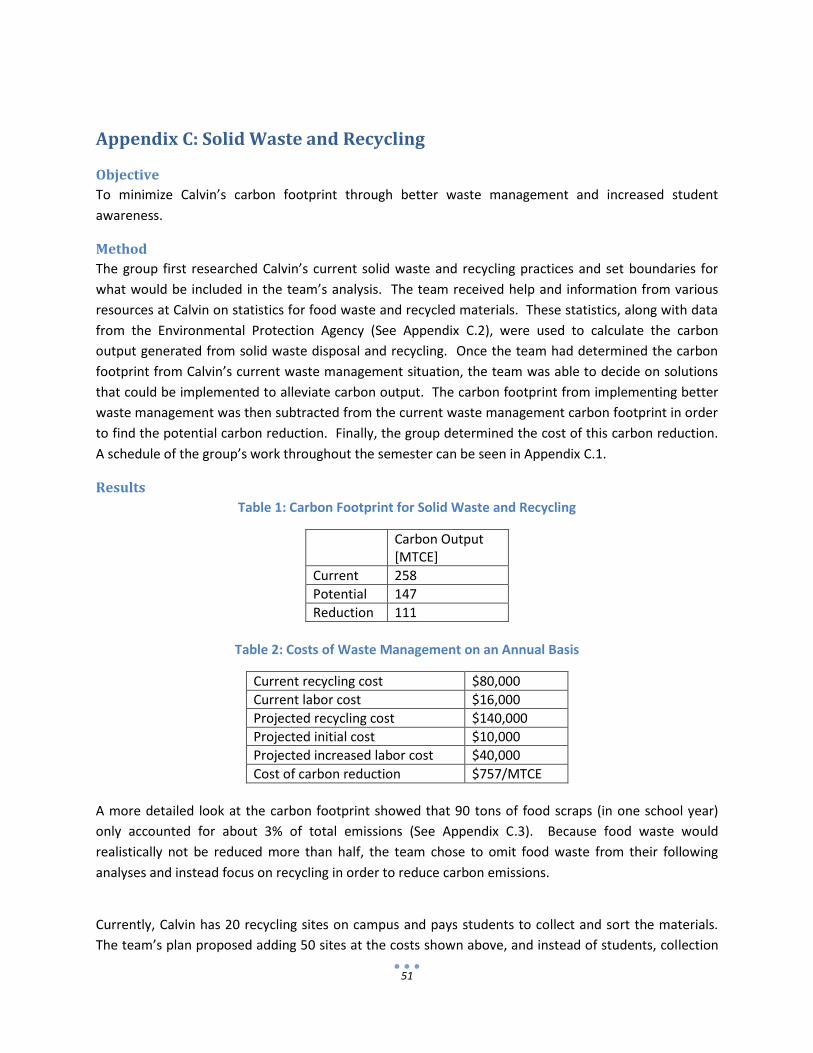
Results
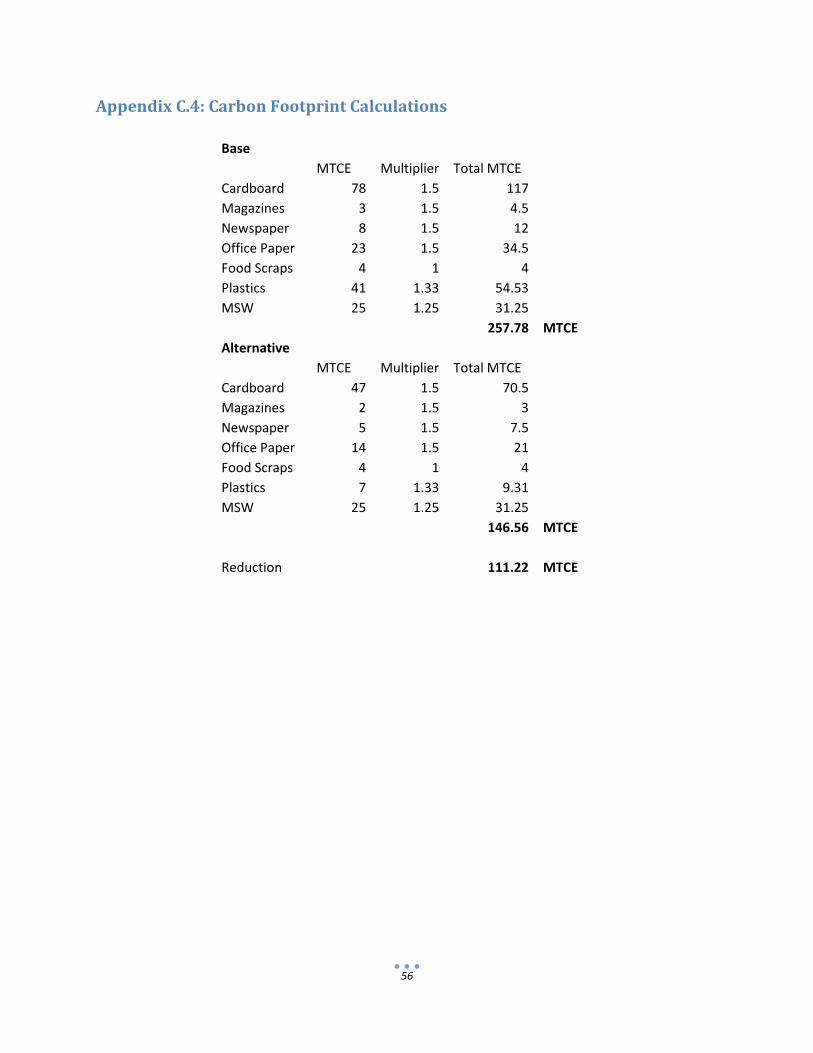
Table 1: Carbon Footprint for Solid Waste and Recycling
Carbon Output [MTCE]
Current 258
Potential 147
Reduction 111
Table 2: Costs of Waste Management on an Annual Basis
Current recycling cost $80,000
Current labor cost $16,000
Projected recycling cost $140,000
Projected initial cost $10,000
Projected increased labor cost $40,000
Cost of carbon reduction $757/MTCE
A more detailed look at the carbon footprint showed that 90 tons of food scraps (in one school year)
only accounted for about 3% of total emissions (See Appendix C.3). Because food waste would
realistically not be reduced more than half, the team chose to omit food waste from their following
analyses and instead focus on recycling in order to reduce carbon emissions.
Currently, Calvin has 20 recycling sites on campus and pays students to collect and sort the materials.
The team’s plan proposed adding 50 sites at the costs shown above, and instead of students, collection

52
would become a custodial job. However, after contacting some people at Calvin, the team learned that
Calvin was going to add 100 more sites. Therefore, the team’s work was finished.
Conclusions
To achieve maximum possible reductions for this group would mean every student recycles all materials
and does not waste any food. Primarily, this would be done through campaigns and flyers to increase
student awareness about the effects their waste has on the environment. However, this is an ideal
situation and inevitably would not occur. For example, Calvin will always serve food, which leads to
waste, and ultimately carbon emissions from the food thrown into a landfill. The same goes for
recyclables; inevitably not everything will be recycled so there can never be a complete reduction of
carbon. The team came to the conclusion that carbon neutrality was impossible to achieve solely
through better waste management. However, it is possible to drastically reduce emissions from the
waste and recycling sector (45%) if effective campaigns were led to improve student’s recycling habits.

53
Appendix C.1: GANNT Chart for Semester
18-Sep 25-Sep 2-Oct 9-Oct 16-Oct 23-Oct 30-Oct 6-Nov 13-Nov 20-Nov 27-Nov 3-Dec
Research Calvin's Waste Situation
Research Calvin's Recycling Situation
Visit Physical Plant and Co-Gen Plant
Calculate Carbon Footprint
Calculate Maximum Potential Reduction
Find more detailed costs of recycling
Assess Feasibility of Reduction Ideas
Write Final Carbon Reduction Proposal
Present Findings and Proposals
Write Tech Memo
54
Appendix C.2: Environmental Protection Agency Data
Per Ton Estimates of GHG Emissions for Alternative Management Scenarios
Material
GHG Emissions per Ton of Material Source
Reduced (MTCE)
GHG Emissions per Ton of Material
Recycled (MTCE)
GHG Emissions per Ton of Material
Landfilled (MTCE)
GHG Emissions per Ton of Material
Combusted (MTCE)
GHG Emissions per Ton of Material
Composted (MTCE)
Aluminum Cans (2.24) (3.70) 0.01 0.02 NA
Steel Cans (0.87) (0.49) 0.01 (0.42) NA
Copper Wire (2.00) (1.34) 0.01 0.01 NA
Glass (0.16) (0.08) 0.01 0.01 NA
HDPE (0.49) (0.38) 0.01 0.25 NA
LDPE (0.62) (0.46) 0.01 0.25 NA
PET (0.57) (0.42) 0.01 0.30 NA
Corrugated Cardboard (1.52) (0.85) 0.11 (0.18) NA
Magazines/third-class mail (2.36) (0.84) (0.08) (0.13) NA
Newspaper (1.33) (0.76) (0.24) (0.20) NA
Office Paper (2.18) (0.78) 0.53 (0.17) NA
Phonebooks (1.72) (0.72) (0.24) (0.20) NA
Textbooks (2.50) (0.85) 0.53 (0.17) NA
Dimensional Lumber (0.55) (0.67) (0.13) (0.21) NA
Medium Density Fiberboard (0.60) (0.67) (0.13) (0.21) NA
Food Scraps NA NA 0.20 (0.05) (0.05)
Yard Trimmings NA NA (0.06) (0.06) (0.05)
Grass NA NA (0.00) (0.06) (0.05)
Leaves NA NA (0.05) (0.06) (0.05)
Branches NA NA (0.13) (0.06) (0.05)
Mixed Paper, Broad NA (0.96) 0.09 (0.18) NA
Mixed Paper, Resid. NA (0.96) 0.07 (0.18) NA
Mixed Paper, Office NA (0.93) 0.13 (0.16) NA
Mixed Metals NA (1.43) 0.01 (0.29) NA
Mixed Plastics NA (0.41) 0.01 0.27 NA
Mixed Recyclables NA (0.79) 0.04 (0.17) NA
Mixed Organics NA NA 0.06 (0.05) (0.05)
Mixed MSW NA NA 0.12 (0.03) NA
Carpet (1.09) (1.96) 0.01 0.11 NA
Personal Computers (15.13) (0.62) 0.01 (0.05) NA
Clay Bricks (0.08) NA 0.01 NA NA
Concrete NA (0.00) 0.01 NA NA
Fly Ash NA (0.24) 0.01 NA NA
Tires (1.09) (0.50) 0.01 0.05 NA

55
Appendix C.3: Waste Management Scenarios
GHG Emissions from Baseline Waste Management (MTCE): (105)
Commodity Tons
Recycled Tons
Landfilled Tons
Combusted Tons
Composted Total MTCE
Corrugated Cardboard
46
-
46 NA
(47)
Magazines/third-class mail
2
-
2 NA
(2)
Newspaper
5
-
5 NA
(5)
Office Paper
15
-
15 NA
(14)
Food Scraps NA
-
90
-
(4)
Mixed Plastics
50
-
50 NA
(7)
Mixed MSW NA
-
764 NA
(25)
GHG Emissions from Alternative Waste Management Scenario (MTCE): (183)
Commodity
Tons Source
Reduced Tons
Recycled Tons
Landfilled Tons
Combusted Tons
Composted Total MTCE
Corrugated Cardboard
-
92
- - NA
(78)
Magazines/third-class mail
-
4
- - NA
(3)
Newspaper
-
10
- - NA
(8)
Office Paper
-
30
- - NA
(23)
Food Scraps NA NA
-
90
-
(4)
Mixed Plastics NA
100
- - NA
(41)
Mixed MSW NA NA
-
764 NA
(25)
56
Appendix C.4: Carbon Footprint Calculations
Base
MTCE Multiplier Total MTCE
Cardboard 78 1.5 117 Magazines 3 1.5 4.5 Newspaper 8 1.5 12 Office Paper 23 1.5 34.5 Food Scraps 4 1 4 Plastics 41 1.33 54.53 MSW 25 1.25 31.25
257.78 MTCE
Alternative
MTCE Multiplier Total MTCE
Cardboard 47 1.5 70.5 Magazines 2 1.5 3 Newspaper 5 1.5 7.5 Office Paper 14 1.5 21 Food Scraps 4 1 4 Plastics 7 1.33 9.31 MSW 25 1.25 31.25
146.56 MTCE
Reduction
111.22 MTCE

57
Appendix C.5: Recycling Bin and Labor Costs
Current Our plan Calvin plan
Total bins 20 70 120
Bin cost (per site) [$] 0 200 200
Total bin cost [$] 0 10000 20000
Student wage [$/day] 64 168 208
Bin collection cost [$/week] 384 1008 1248
Total initial cost [$] 0 10000 20000
Annual site cost [$/year] 16128 42336 52416
58
Appendix D: Construction and Renovation
Objective:
The original objectives for the entire class consisted of creating an inventory of Calvin College’s present
rate of Green House Gas (GHG) emissions and sequestration potential; creating a detailed list of steps to
be taken to achieve Carbon Neutrality; document a plan towards Carbon Neutrality; and perform an
economic analysis of that plan. The Construction and Renovation group was tasked with applying those
goals within the spheres of constructing new buildings and improving existing buildings.
Procedure:
Before we could start our analysis, we had to define what we would analyze. We decided that we would
examine how much carbon dioxide is emitted during a construction project, and how much we could
reduce our carbon emissions by renovating the dorms. Carbon emissions resulting from day-to-day
operation of buildings fell under the purview of the Energy group. In terms of Carbon emissions, we
would only consider buildings that were currently under construction or were planned for the near
future. Existing buildings are regarded as beyond our scope, as the construction has been completed
and any carbon dioxide already emitted into the atmosphere. This left us with three buildings that fell
within our construction scope: The Spoelhof Fieldhouse Complex, a new wing to be added the Kalsbeek-
Huizinga dorm, and the new addition to the Commons. For reductions of carbon dioxide due to building
renovation, we would look primarily at the seven dorm buildings and how we might save energy there.
Construction:
Actually determining the amount of carbon dioxide emitted during a construction process is extremely
difficult due to the large variety of construction conditions and locations. And unfortunately, there is
currently no standard metric to measure the amount of carbon dioxide emitted during a construction
project. So to determine how much carbon dioxide is emitted during construction, we would have to
account for everything from whether building materials were local or shipped a long distance, what type
of materials are used, how much waste was produced during construction, and even what types of
vehicles the construction workers used. Quite frankly, this was beyond our skills and resources, certainly
impossible for projects which are still in the planning stages.
Fortunately, we found a website (www.buildcarbonneutral.org) which claimed to predict how much
carbon dioxide would be produced during construction with an accuracy of ±25%. We entered as much
data on each of the three projects as we could find (see Appendices D.1, D.2 and D.2) into the website
and obtained the data on Table 1. Because construction projects emit a large amount of carbon dioxide
in a short period, we annualized the emitted carbon over a 20 year period in an effort to smooth out
year-to-year variations in total carbon dioxide emitted each year. Carbon emissions are measured in
Metric Tons Carbon dioxide Emitted, abbreviated MTCE.
Renovations
To determine how much carbon dioxide emissions could be reduced by renovating the dorms, we
needed to find how we could reduce energy usage, and convert those energy savings into reductions of

59
carbon dioxide emissions. Thanks to Professor Piers’ Sustainability study (Appendix K) it was easy to
convert energy savings into carbon dioxide reductions, but actually determining how we might save
energy was highly frustrating.
Unfortunately, when the campus heating system was installed, very little instrumentation was included
to determine how much energy each part of campus required. All we knew was how much energy the
entire campus used. Since we had no direct instrumentation, we decided to model a dorm
mathematically and determine the heating load on the building based on inside and outside
temperatures, and a calculated insulation value for the walls, windows and roof. However, while this
process would work well for a single temperature difference, it was very poor for weather changes and
accounting for whether it was sunny, overcast, rainy or snowing, in addition to the fluctuating
temperatures that are part of the normal seasons in Michigan. To account for these differences, we
attempted to use HVAC design software borrowed from the Geothermal Senior design team. But this
effort was stymied by a lack of training with a complicated program, and again we were back at square
one. Finally we found a comparable dorm at the University of Maine that had undergone a renovation
quite similar to the one we wished to perform on Calvin’s dorms. Using the University of Maine’s
published data (Appendix D.2) and a cost estimate provided by Bernie Tolsma of Rainier Group, Inc.
(Appendix D.3) we arrived at the data provided in Table 2.
The Future
There are several improvements that can be made on our work in the future. When a standard metric
for measuring the amount of carbon dioxide emitted during a construction process is produced, that
metric should be applied to any new construction projects that Calvin undertakes. And there are many
renovations that will improve campus energy efficiency that we cannot quantify until instrumentation to
measure energy use on a building by building basis is installed. Among these renovations is motion
sensitive lighting. Most classrooms already have this, but bathrooms and dorm hallways do not. The
dorm hallways and basements are lit twenty-four hours a day. Obviously energy savings are possible
here.
Final Results
As seen in Table 1, the carbon dioxide emissions that fell within our group’s sphere of responsibility
totaled 1134 MTCE per year when annualized over a 20 year period. As seen in Table 2, through
renovations we can reduce emissions by 36.4 MTCE per year. Other reductions are possible, though not
measureable at this point. Within the realms of Construction and Renovation, we did not find any
methods of sequestration.
Table 1: Carbon dioxide emitted during construction
Total MTCE during construction
Annualized over 20 years
New KH dorm Wing 1926 96.3
Commons Addition 2694 134.7
Spoelhof Fieldhouse Complex 18060 903
Total 22680 1134

60
Table 2: Data from University of Maine's renovation
Stodder Hall Applied to Calvin
Carbon Saved each year 5.2 MTCE 36.4 MTCE
Money Saved each year $4,800 $33,600
Capital investment $85,750 $600,000
Break even point (4% inflation) 32 years 32 years

61
Appendix D.1: Data on Commons Addition
From: http://www.calvin.edu/publications/spark/2007/summer/commons.htm
The Changing Commons Plans for new gathering space recognize shift in student expectations By Lynn Bolt Rosendale '85
To provide a communal gathering spot has always been the purpose of the Calvin College Commons, a
building that was completed on the Knollcrest campus in 1967.
The "Commons" name was retained from the Franklin campus very intentionally, according to Phil
Lucasse, dean of students at Calvin from 1956-1969.
"A more common name for buildings like this one was 'student union,'" he said, "but we wanted this
to be thought of as a common space where people-students, but also professors and administrators-
would come to meet."
In fact, in one of the first meetings of the student union committee, which was appointed to "mold
the functions of the student union building constructed on the Knollcrest campus according to the
purpose of the college," it was decided that the building would keep the name "Commons" to
emphasize the community aspect of the college.
Forty years ago the building housed a large dining hall, the bookstore (now the Campus Store), the
snack shop (now Johnny's), as well as some additional meeting space, just as it does today.
Forty Years Ago
Four decades ago though, student interests, student tastes and student experiences were very
different, said Henry DeVries, Calvin vice president for administration and finance. "The Commons
was built for its time," he said. "Food was served family style around six-foot-round tables. When I
was a student, we compared the dining experience to home; students now compare it to a restaurant.
Their expectations are completely different."
With changing expectations, options and facilities have to change. "Our students come to us with a
wide range of culinary experiences," he said. "That's why our offerings-things like sushi night, Indian
food, vegan chocolate cake-have expanded. We're serving very sophisticated consumers, and we
need to be able to meet the needs of contemporary students."
Commons: A tract of land belonging to or used by a community as a whole.
In researching other institutions, Calvin administrators discovered that the dining experience is third
on students' lists of college comparisons. Only their academic department and the residence halls
outrank dining in terms of what prospective students consider important on a college campus.
With that in mind, an extensive remodeling and expansion of the Commons are in the planning stages.
A New Living Place
In addition to expanded dining options, the new Commons would provide space for student
organizations, group study and commuter students.
"One of the things we have really come to understand is how much place matters," said Shirley
Hoogstra, Calvin vice president for student life. "That was demonstrated so clearly in the renovation
of Johnny's. Previously, it wasn't a very inviting place. Now it's intimate, warm, friendly and wireless,
and it's busy. It gets used for meals and as a conversation and study place. The problem is there are
very few places like that on campus."

62
An expanded Commons would incorporate a lot of "sticky spaces," Hoogstra said. Conversation,
meeting and resting alcoves along the "main street" of campus, where students and visitors would
feel comfortable, is one of the key components of the new space.
"We would like to provide places for continued conversation about concepts from the classroom,"
Hoogstra said. "By providing space, we extend the life of that conversation."
Another key element is space for student organizations. In the 1960s, there were seven student
organizations. Today, there are 61 student groups, among them the Environmental Stewardship
Coalition, Students for Compassionate Living, the American Institute of Architecture Students, the
Calvin Climbing Club, the Rowing Club and, of course, media organizations such as Chimes, Prism and
Calvin Video Network (CVN).
"Students like to affiliate around common goals and projects, and we encourage students to do that,"
Hoogstra said. "It's like a laboratory for the ideas and concepts they're learning in the classroom. But
our space is outdated to accommodate these groups."
The new Commons would include flexible space that the various student organizations could share.
The Plans
Going from the current 91,000 square feet (58,000 in the Commons and 23,000 in the Commons
Annex), to the planned 134,000 square feet should provide plenty of options, according to architect
Larry Payne of WTW Architects, the Pittsburgh, Pa., firm contracted to design the new structure.
"We are planning for many lounges and other spaces that are conducive to interaction between
students, faculty and the administration," he said. "One of the new 'social anchors' of the proposed
Commons will be a large, multistory fireplace that we foresee becoming very popular as a gathering
spot for many activities, including acoustic performances and listening to spoken word."
The building's design will strive to enhance the existing Prairie-style architecture.
"Student unions built during the '60s and '70s have generally been considered to be 'inflexible' and
'dark' by the individuals who now use them," Payne said. "Today's structures not only need to align
with the culture of the institution, but also the values of the current and future generations of
students who will be attending higher-education institutions."
"I think it's important that the building reflect Calvin values," Hoogstra added. "Creation, friendships,
integration of student life and the academic division-these are all values that should have a place in
this building."
Construction for the new facility is expected to begin in 2009.
"What I hope for this space," said Hoogstra, "is that students can find it to be a place where they can
attach, where they find friends, where they feel like they belong."
— Lynn Rosendale is the managing editor of Spark .
* * * * *
The Commons Annex
The preservation of green space has become an important element in urban design, particularly in the
last decade or so. But some Calvin students in the late 1970s were ahead of their time in considering
this very issue during the development of Calvin's campus.
A group of students, many of them affiliated with the Calvin Ecology Club, spoke out against the
proposed addition, now called the Commons Annex. In fact, more than 500 students signed a petition

63
urging the administration to seek an alternative solution.
"We came along at the tail end of students who took a kind of adversarial stance about things," said
Steve Timmermans '79. "It was at a time when adopting a protest mentality was more accepted."
The students were opposed to the building plan that was originally supposed to span from the
Commons to the Hekman Library. Their opposition drew attention from several media sources.
"I think we thought of it like the Berlin Wall," Timmermans said of the annex. "To have all that
building blocking off the middle of campus didn't seem like a great plan."
There was also the space usage issue, which Timmermans studied independently during interim of
1979. He presented his findings in a report: "Is the Proposed 'Commons Expansion' Really Needed?"
His conclusion was that "the proposed building would indeed be extravagant and unnecessary, and
that present facilities are satisfactory for students and for conferences."
The administration was willing to listen to the opinion of Timmermans and other student protesters.
"The administration was very responsive," recalled Timmermans, now president of Trinity Christian
College in Palos Heights , Ill. "At the time I know that we were impressed with the fact that the
administration listened to us as students who had valid opinions and needed to be heard. Our
conversations helped recast the building."
In fact, the building was scaled down from its original 30,000 square feet to 22,000 square feet by
eliminating the lounge for commuters. This allowed for the open space between the Commons Annex
and the Hekman Library, which still exists today and will be maintained in the new plan.

64
Appendix D.2: Published Data on University of Maine’s Stodder Hall
From: http://www.ifma.org/daily_articles/2006/mar/03_06.cfm
Dressing Up The Dorms: University of Maine Caters To Students' Individual Needs
While Saving Money
It’s a pretty common site around college campuses in cold-weather states: The snow and temperature
are falling. The icicles are forming. Students shiver and shuffle to class in layers of clothing.
And the dormitory windows are wide open.
That’s right. Despite the chilly temperatures and biting winds, many students open their dorm windows
to let in cool air. Why? Because it’s the only option once a room overheats. For a university, it’s also a
pretty expensive option.
“That’s wasting a lot of energy and money,” said Joe Caron, the associate director of property
management for Student Auxiliary Services (SAS) at the University of Maine.
Like many campus administrators who manage older dormitories, Caron struggled to find cost-efficient
ways to maintain a comfortable living environment for students while conserving energy. It’s a challenge
that has perplexed many a facility manager.
At the University of Maine, located in Orono, overheating occurs because campus dormitories are
divided into zones. Each zone consists of as many as 25 rooms—and a single sensor in a designated
room dictates the temperature for the entire zone. But not every room is the same temperature and
many end up too stifling. This is especially true on the upper floors, which gain heat from below and
never adjust. The result: open windows, wasted energy and high utility bills for the university.
An uncomfortable living environment also is a contributing factor to the trend of students bypassing
dorms for other options. Off-campus housing has fewer restrictions and offers more personal control.
“We live in an individualistic society and that’s reflected in students’ housing choices,” said Gordon
Nelson, the university’s director of Property Management.
And administrators at the University of Maine took careful note of that as they studied ways to make
their dorms more appealing.
“We wanted to have it more like a hotel, where people are in control of their environment instead of
having it dictated,” Nelson said. “The main goal was to allow students to maintain their own comfort.”
In 2004, the university contracted with Honeywell to upgrade the existing heating system in Stodder
Hall, a nearly 40-year-old building with about 140 rooms located on the southwest side of campus. The
primary objective was to give each student individual control over their room temperature. And the
results have been very favorable—school officials are planning to upgrade the rest of the dormitories.

65
As part of the contract, the university changed out all of the steam traps in Stodder Hall and replaced
the radiator valves in each room. Honeywell technicians then installed individual heating controls in all
of the rooms, which allow the students to control their own temperatures instead of relying on the zone
system.
The most impressive part of the project was that Honeywell tied the controls together through its
Enterprise Buildings Integrator (EBI) building management system. With EBI, Caron, Nelson and other
facility managers can monitor the temperatures and controls of each room from their computer screens.
EBI also allows staff to control the temperatures themselves, which is essential during holiday breaks
when students are gone for weeks at a time.
In addition, Caron has used EBI to track temperature trends over long periods of time for rooms that
have a history of service calls.
“It’s very user friendly,” he said. “We have a floor plan of the building with each room numbered. You
can click on a room to get more detail and see the temperatures in the room.”
By tracking trends, administrators can better identify problems which makes for more effective
troubleshooting.
Besides the HVAC system, Honeywell also tied the building’s electric, steam and water meters into EBI.
This allows university personnel to monitor spikes in energy consumption. Consequently, they can
detect and pinpoint problems quicker, cutting down on wasted energy even more.
In the past, when students would call to complain about their room temperatures, SAS would contact—
and pay—an outside technician to go to the room and investigate. With EBI, Caron can diagnose most
problems from his office. The solution sometimes is as simple as telling a student over the phone how to
operate his or her controls. As a result, the university spends less on maintenance and students are
pleased with the quick response.
During the spring of 2005—shortly after the upgrade—Stodder Hall residents made only two service
calls total. In comparison, other dorms make about 10 to 20 calls per semester, Nelson said.
Another benefit: the results of the project have led university officials to work on getting Stodder Hall
recognized as a green building to show its commitment to energy conservation. Along with the HVAC
improvements, Stodder Hall has adopted an aggressive recycling program and added an organic food
court. The university also is looking to address water conservation issues at the dormitory.
But the biggest impact has been having temperature controls in each room. Because students no longer
leave windows ajar to cool their rooms, less energy is wasted and utility bills have gone down. In fact,
the school is forecast to save at least 1,600 gallons of oil per year. And it will reduce nitrogen oxide
emissions by 87 pounds annually and sulfur oxide emissions by almost 420 pounds.
“The students are conscious about the green effort. Recycling numbers are way up. We try to preach
environmental impact to our people in the classroom, the campus and the community,” Nelson said.
66
Of course, the fact that students are more comfortable makes it easier for them to think about the
environment.
“People’s first concerns are their individual work stations or residence,” Nelson said. “That was our
ultimate goal here, to make sure on-campus students have a comfortable living environment. Once
we’re able to improve their immediate surroundings, it’s easier to get them to pay attention to
conservation issues.”
Nelson hopes similar HVAC upgrades to the other dorms will yield the same results. The University of
Maine is moving ahead with plans to upgrade six dormitories in the next two years. And the long-term
goal is to have all 19 campus dorms retrofitted with individual thermostats.
Soon, the only time students will open a window during the winter will be to bring in some frigid air to
stop the sweating during finals week.

67
Appendix D.3: Cost Estimate on Stodder Hall Renovation
Courtesy of Bernie Tolsma Jr. of Reiner Group Inc.
Hey Brian,
I just got off the phone with my dad and here is what he estimated. It probably isn’t a
perfect number but it is pretty close.
Material : $200/room (includes valve and steam trap)
Labor: 2.5 hrs/room @ $85/hr so $212.50/room
Would double material costs- typical amount to cover overhead/profit
Total: $612.5/room or $85,750.
This estimate only includes what is done in the rooms themselves. In addition to this
they probably changed the main boiler. But this will give you a good idea. If you want
more information about these modifications, my dad said they probably used a valve
similiar to the 'danfoss' valve. (http://na.heating.danfoss.com/Content/268e8ab9-69b6-4e83-9fa5-
dc8d56afcfa2_MNU17392440.html)
If you need to cite any of this information it can be cited as an interview with Bernie
Tolsma Jr. with Reiner Group Inc..
Hope this helped,
Bill Tolsma

68
Appendix F: Transportation Group
Objectives
The goal of the transportation group was to determine the carbon footprint of Calvin College related to
transportation. This group also sought to find transportation related methods of reducing this footprint.
Procedure
To determine the carbon footprint, daily automobile commutes, service vehicle activity, and airplane
flights were examined. The group decided that flights and commutes to and from campus at the
beginning of each semester were beyond Calvin’s control and should therefore not be counted toward
their Carbon footprint. However, Calvin does have influence over emissions from daily commutes (by
means of parking costs and availability) as well as business flights of faculty-staff, interim flights of
students and faculty, and any other flight resulting from Calvin associated business. Details of
calculations used to find the carbon footprint from transportation are located in Appendix F.1 - F.4.
Air traffic was not targeted in developing solutions for reducing the carbon footprint due to a lack of
viable reduction options. For service vehicles, replacing campus safety vehicles with Electric Vehicles
was considered. To reduce commuter emissions, this group considered a combination of solutions which
would promote the use of bikes (bike lanes and rental bikes) and public transportation (full subsidy of
the Rapid for Calvin faculty and staff) and would discourage driving (higher parking costs). The goal was
also to make students more mindful of the costs of daily commutes (daily instead of yearly parking fees).
More in depth analysis of these solutions is located in Appendix F.5 - F.10.
Results/Conclusions
The total carbon footprint for Calvin College due to transportation is shown in Figure F-1 below.
Commuter traffic was by far the biggest source of emissions.
Figure F-1: Carbon Footprint

69
A summary of the various reduction options is listed below in Table F-1. Note that increasing parking
costs both reduce carbon emission and provide money which can be used for other reduction options.
Table F-1: Carbon Reduction Options
Carbon Reduction Annual Cost Annualized Ratio
MTCE $ $/MTCE
EV gift to a student each month 1.25 240,000.00 192,000.00
Campus Safety in Evs 0.96 80,000.00 83,333.33
Full Rapid Subsidation 207 77,500.00 374.65
Adding Lake Dr. Bike lane and path 14.93 2,138.90 143.31
Calvin owned bikes 3.14 305.56 97.18
Daily Parking Tolls 677.84 (83,089.44) (122.58)
Increase permit fees 1355.67 (885,365.00) (653.08)
The Student Senate Survey also showed positive student response to several of these carbon emissions
reduction options. When asked which option would reduce incentive to drive, 37% of students surveyed
chose free use of the Rapid and 25% chose bike lanes on Grand Rapids roads. Full details of the survey
are located in Appendix F.11. However, to maximize reduction of carbon emissions, a combination of
these options would be even better. Promotion of busing and biking joined with discouragement of
driving offers two reasons instead of one for choosing the more environmentally friendly option. Lastly,
educating students and faculty about how to use the Rapid and about environmental issues will further
increase the success of these measures (25% of students surveyed said they did not use the Rapid
because they were unsure of how to use it).
There are also non monetary benefits to these reduction options. Decreased commuter traffic means
less maintenance on parking lots and provides more visitors’ parking on campus which will be useful
once the new Fieldhouse is completed. These measures will also make students more knowledgeable of
public transportation, making them more likely to use it after they graduate, and environmental issues.
The benefits far outweigh the costs.

70
Appendix F.1: Commuter Footprint
Introduction
These calculations were performed by the CCCN: Transportation group. The purpose of these
calculations is to determine the amount of carbon emitted annually as a result of commutes to and from
Calvin’s campus annually.
Procedure – Data Collection
Number of Commutes
Data was collected near the end of September 2007. Five traffic hoses were used with permission from
the Kent County Road Commission. These five hoses were first placed on the entrances and exits on the
east side of campus during a week day and a weekend day. Data was collected for a 24 hour cycle
during the week day and weekend day. This was repeated on the five entrances and exits on the west
side of campus.
The traffic hoses are rubber hoses that are triggered by increases in air pressure sent to a data collection
box. Whenever the traffic hose (which is stretched across the road) is ridden over, the air pressure
increases and is processed as one vehicle by the data collection box. One hose is designated incoming
traffic and a second is designated outgoing traffic. The pressure increase can also result from jumping
on or biking over the hoses.
Distance of Commutes
Matt Jeltema compiled a list of distances from campus to the off campus addresses of every faculty-staff
and off-campus student parking permit. Addresses were used to calculate lat-long coordinates for
Calvin and home addresses on file. Straight-line distance was calculated between the coordinates.
Batch coordinate and distance calculations were done using online tools at www.batchgeocode.com.
Matt commented on the lack of reliability in the addresses provided for the parking permits as many of
them are home addresses rather than local addresses.
Automobile emissions
Since every vehicle emits different amounts of carbon, a method for calculating the average carbon
emitted is needed. For these calculations, the percentages of each type of vehicle driven for daily
commutes are needed. To obtain this information, the vehicles parked on campus on October 9 were
tallied. The numbers of hybrids, small cars, midsize cars, minivans, SUVs, trucks, and diesel vehicles
were tabulated.
Procedure – Data Analysis
Number of Commutes
The data was downloaded by the Kent County Road Commission and simplified in an Excel document.
The number of pressure increases is tabulated by time of day. There is a weekday and weekend table
for every entrance/exit. A master table was created for both weekend and weekday data by adding the
data from each entrance/exit together. Graphs of this data can be found in Figures 1 and 2 below. From
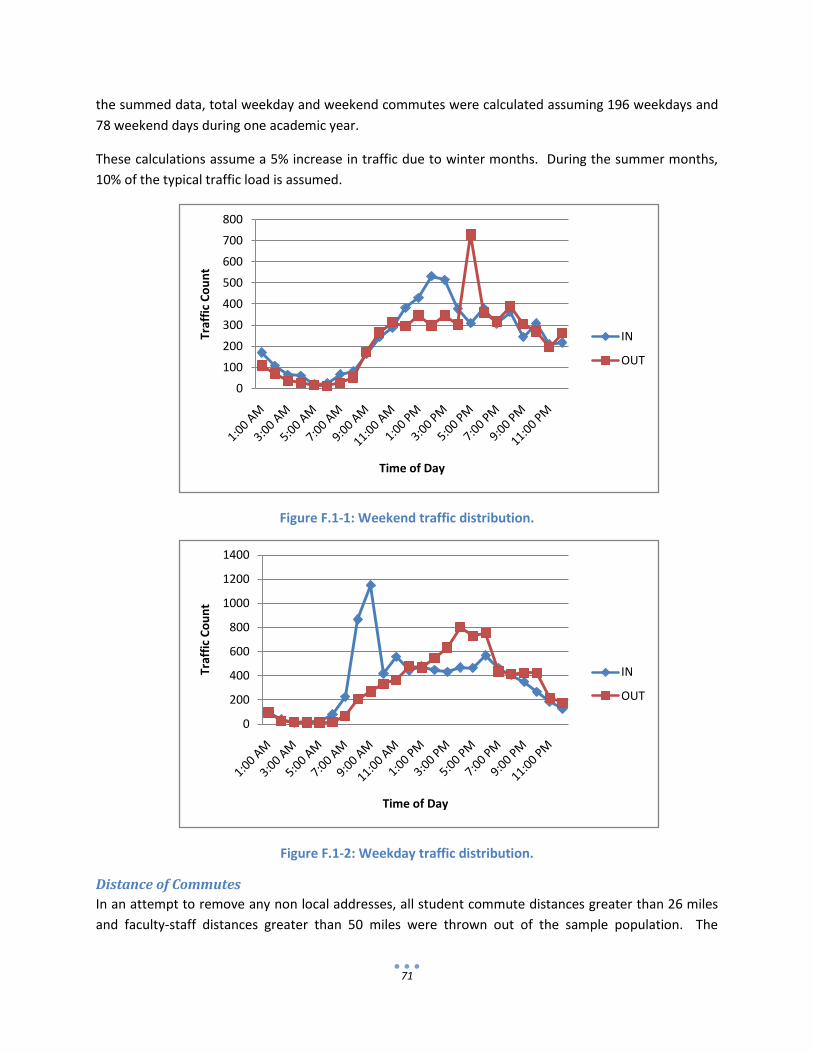
71
the summed data, total weekday and weekend commutes were calculated assuming 196 weekdays and
78 weekend days during one academic year.
These calculations assume a 5% increase in traffic due to winter months. During the summer months,
10% of the typical traffic load is assumed.
Figure F.1-1: Weekend traffic distribution.
Figure F.1-2: Weekday traffic distribution.
Distance of Commutes
In an attempt to remove any non local addresses, all student commute distances greater than 26 miles
and faculty-staff distances greater than 50 miles were thrown out of the sample population. The
0
100
200
300
400
500
600
700
800Tr
affi
c C
ou
nt
Time of Day
IN
OUT
0
200
400
600
800
1000
1200
1400
Traf
fic
Co
un
t
Time of Day
IN
OUT

72
remaining distances were averaged and termed the average commute distance. Since routes to and
from campus vary, a straight line distance was used as a conservative estimation.
Automobile emissions
The percents and average MPG of each vehicle were used to calculate the average gas consumption or
diesel consumption per commute. This was used with the CO2 emitted per gallon of gas or diesel to
determine the CO2 emissions per commute.
Annual CO2 emitted
The CO2 emitted per commute was multiplied by the annual number of commutes to determine the
annual CO2 emitted by commuting traffic.
Conclusions
During the course of one academic year, Calvin is responsible for 4.4 million commutes. These
commutes result in 14,774 metric tons of CO2 per year. These numbers have significant error resulting
primarily from inaccurate commute distances and a conservative number of annual commutes.
It was also found that the average Calvin automobile operates at 22.39 miles per gallon.
Appendix F.2: Carbon Footprint due to Air Travel
Introduction
These calculations were performed by the CCCN: Transportation group. The purpose of these
calculations is to determine the amount of carbon emitted annually as a result of airline traffic of Calvin
related travels. These travels include business flights of faculty-staff, interim flights of students and
faculty, and any other flight resulting from Calvin associated business.
Procedure – Data Collection
Carlson Wagonlit Travel provided us with the market flight miles purchased by Calvin from and to each
combination of destinations during the 2006-2007 academic year. Terrapass.com provided us with the
distance between airports and the pounds of CO2 emitted for a single person on a one way flight
between any combination of departure and arrival locations. The exact website was:
http://www.terrapass.com/flight/flightcalc.html?submit.x=32&submit.y=2
Procedure – Data Analysis
The number of miles between locations purchased by the Calvin Market was tabulated and divided by
the distance between airports. The resulting number was the number of flights purchased in the Calvin
Market. This number was then multiplied by the CO2 emissions of a single person flying to and from
each destination. This provided the total pounds of CO2 emitted on all flights to and from specific
destinations. The sum of these numbers gives Calvin’s total pounds of CO2 emissions during the year.
This number was then converted to metric tons of CO2 emitted.

73
Not all divisions in the first step came out to whole numbers of flights, so there is a difference in the
total miles flown between destinations in the Calvin Market and the flight distance according to
terrapass.com. This will result in a small amount of error.
Conclusions
During the course of one academic year, Calvin is responsible for 5,800 metric tons of CO2 emissions per
year from airline travel.
Appendix F.3: Carbon Footprint from Service Vehicle Traffic
Introduction
These calculations were performed by the CCCN: Transportation group. The purpose of these
calculations is to determine the amount of carbon emitted annually as a result of service vehicle traffic
on Calvin’s campus annually.
Procedure – Data Collection
According to Doug Kok of the Physical plant, all service vehicles are fueled by two on campus fuel tanks.
It is estimated that 800 gallons of gas are used weekly and 250 gallons of diesel are used monthly.
Procedure – Data Analysis
The amount of fuels consumed was converted to a yearly basis. This was then multiplied by the CO2
emitted per gallon of fuel to find the total annual carbon emissions by service vehicles. The fuel CO2
emission rates are 19.4 lb/gal of gas and 22.2 lb/gal of diesel according to
http://www.epa.gov/otaq/climate/420f05001.htm. The total emissions were then converted to metric
tons.
Conclusions
During the course of one academic year, Calvin is responsible for 300 metric tons of CO2 emissions per
year from service vehicles.
Since the original numbers are weekly and monthly estimates, errors are multiplied when converted to
annual figures. Since this is the only information the Physical Plant and Campus Safety record, this is the
best estimate available.

74
Appendix F.4: Commuter Footprint Calculations Commutes
academic weekdays per year: 195.75 days
academic weekend days per year: 78 days
weekday incoming: 8566 \16486
commute
sper day
weekday outgoing: 7920 /
weekend incoming: 5856 \11375
commute
sper day
weekend outgoing: 5519 /
total annual weekday commutes: 3227134.5 commutes
total annual weekend commutes: 887250 commutes
Total annual commutes: 4,428,106.32 commutes
assumes:
5% greater to account for the increase in traffic from October through April
10% of the total traffic continues through the summer months
Emissions
Total annual commutes: 4,428,106 commutes
average commute distance: 7.79 miles
CO2 emissions from Gas: 19.4 lb/gal
CO2 emissions from Diesel: 22.2 lb/gal
avg gas consumption per commute: 0.38 gal/commute
avg diesel consumption per commute: 0.24 gal/commute
CO2 emissions from Gas per commute: 7.36 lb/commute
CO2 emissions from Diesel per commute: 5.40 lb/commute
CO2 emissions per commute: 7.36 lb/commute
Total annual CO2 emissions: 14,774 metric tons
Hybrids 55 8 0% 0.141631977
Small Cars 32.5 335 17% 0.239684885
Midsize Cars 23 1069 55% 0.338685164
Minivans 16 146 8% 0.486859923
SUVs 14 284 15% 0.55641134
Trucks 12 96 5% 0.649146563
Diesel Cars 32 1 0% 0.243429961
1939 100%
MPG# of
vehicles
% of
vehicles
gal per avg
commute

75
Appendix F.5: Emission Reductions through Parking Adjustments
Introduction
This memo summarizes the calculations performed to estimate the carbon emission reduction and
associated costs of increasing parking permit fees and installing daily parking tolls to replace off-campus
commuter student parking fees.
Calculations
From previous calculations, it is known that the ‘average Calvin car’ operates at 22.39 MPG and emits
19.4 lb of CO2 per gallon. It is also known that Calvin is responsible for 5,812,065 commutes averaging
7.8 miles to or from campus annually. This information was used to calculate the carbon emission
reductions for deterrents to commuting. These deterrents were increasing parking permit fees and
using daily tolls for off-campus students. Increasing parking permit fees was estimated to reduce
commutes by 10% while daily tolls reduced commutes by 15%. Addition information used was the
quantities of parking permits (916 dorm, 1362 off-campus, 780 staff, 283 apartments) and the current
cost of a parking permit ($35).
Results
Increasing parking permits to $300 per year will reduce emissions by 1356 metric tons per year and earn
Calvin an additional $885,365. Arguments ought to be made for this additional revenue to be used for
further emission reductions.
Using daily tolls for off-campus students on weekdays (with free parking on weekends) results in 2,050
metric tons of emission reductions at a cost of $4,400. A toll of 20 cents per day for each academic
weekday would result in $39 worth of parking fees, roughly equivalent to the current parking permit fee.
Appendix F.6: Emission Reductions through Electric Vehicles
Objective
The goal of this analysis is to determine the how much CO2 will not be emitted if campus safety switch
from using petrol operated vehicles to Electric Vehicles (EV) and how long it will take for the electric
vehicles to pay themselves. Also to be determined is the amount of CO2 that will be reduced if Calvin
College gives a student an EV every month.
Calculations
For this analysis, the purchase price of $20,000 for an EV is used and the number of campus safety
vehicles is 4. The money saved by using an EV instead of a petrol operated vehicle is about $2190. The
amount of CO2 emitted per kWh is 0.966 kg/kWh, the cost of electricity per kWh is $0.07/kWh, and the
amount of electricity an EV uses every year in dollars is $52.50 approximately. The monthly distance
covered by all the campus safety vehicles combined is 1250 miles. One gallon of fuel is used to travel 35
miles and 19.4 pounds of CO2 released to the atmosphere from every gallon of fuel.
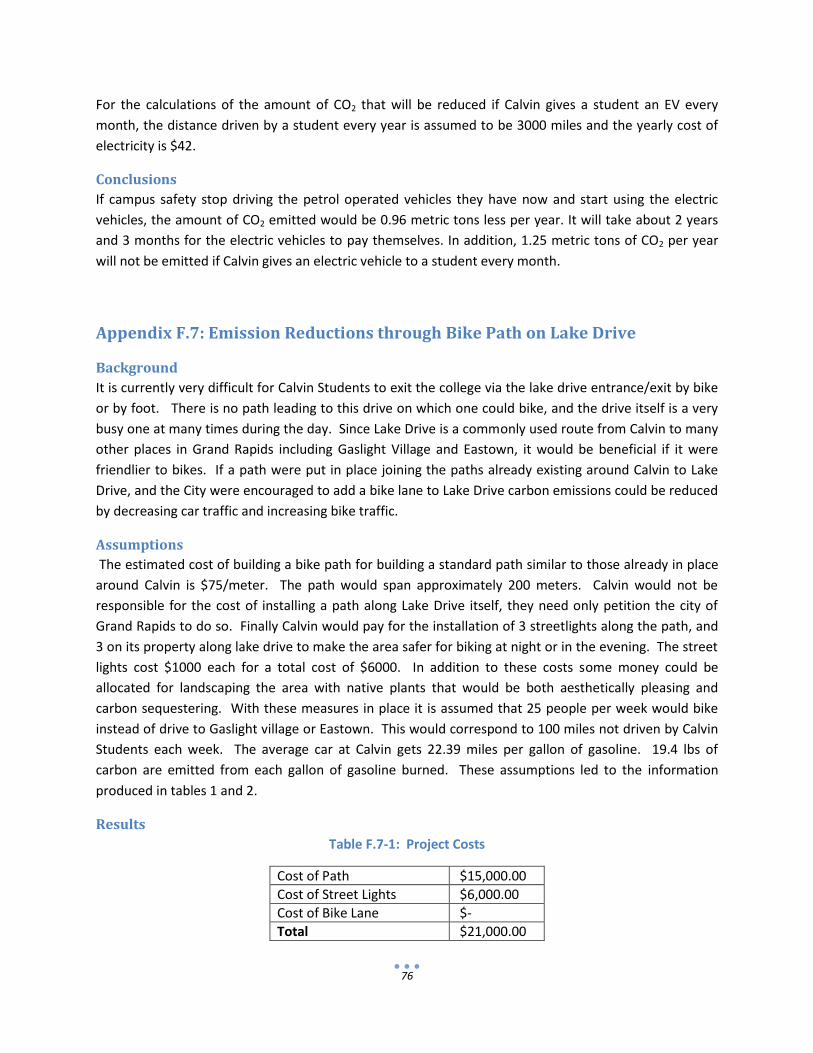
76
For the calculations of the amount of CO2 that will be reduced if Calvin gives a student an EV every
month, the distance driven by a student every year is assumed to be 3000 miles and the yearly cost of
electricity is $42.
Conclusions
If campus safety stop driving the petrol operated vehicles they have now and start using the electric
vehicles, the amount of CO2 emitted would be 0.96 metric tons less per year. It will take about 2 years
and 3 months for the electric vehicles to pay themselves. In addition, 1.25 metric tons of CO2 per year
will not be emitted if Calvin gives an electric vehicle to a student every month.
Appendix F.7: Emission Reductions through Bike Path on Lake Drive
Background
It is currently very difficult for Calvin Students to exit the college via the lake drive entrance/exit by bike
or by foot. There is no path leading to this drive on which one could bike, and the drive itself is a very
busy one at many times during the day. Since Lake Drive is a commonly used route from Calvin to many
other places in Grand Rapids including Gaslight Village and Eastown, it would be beneficial if it were
friendlier to bikes. If a path were put in place joining the paths already existing around Calvin to Lake
Drive, and the City were encouraged to add a bike lane to Lake Drive carbon emissions could be reduced
by decreasing car traffic and increasing bike traffic.
Assumptions
The estimated cost of building a bike path for building a standard path similar to those already in place
around Calvin is $75/meter. The path would span approximately 200 meters. Calvin would not be
responsible for the cost of installing a path along Lake Drive itself, they need only petition the city of
Grand Rapids to do so. Finally Calvin would pay for the installation of 3 streetlights along the path, and
3 on its property along lake drive to make the area safer for biking at night or in the evening. The street
lights cost $1000 each for a total cost of $6000. In addition to these costs some money could be
allocated for landscaping the area with native plants that would be both aesthetically pleasing and
carbon sequestering. With these measures in place it is assumed that 25 people per week would bike
instead of drive to Gaslight village or Eastown. This would correspond to 100 miles not driven by Calvin
Students each week. The average car at Calvin gets 22.39 miles per gallon of gasoline. 19.4 lbs of
carbon are emitted from each gallon of gasoline burned. These assumptions led to the information
produced in tables 1 and 2.
Results
Table F.7-1: Project Costs
Cost of Path $15,000.00
Cost of Street Lights $6,000.00
Cost of Bike Lane $-
Total $21,000.00
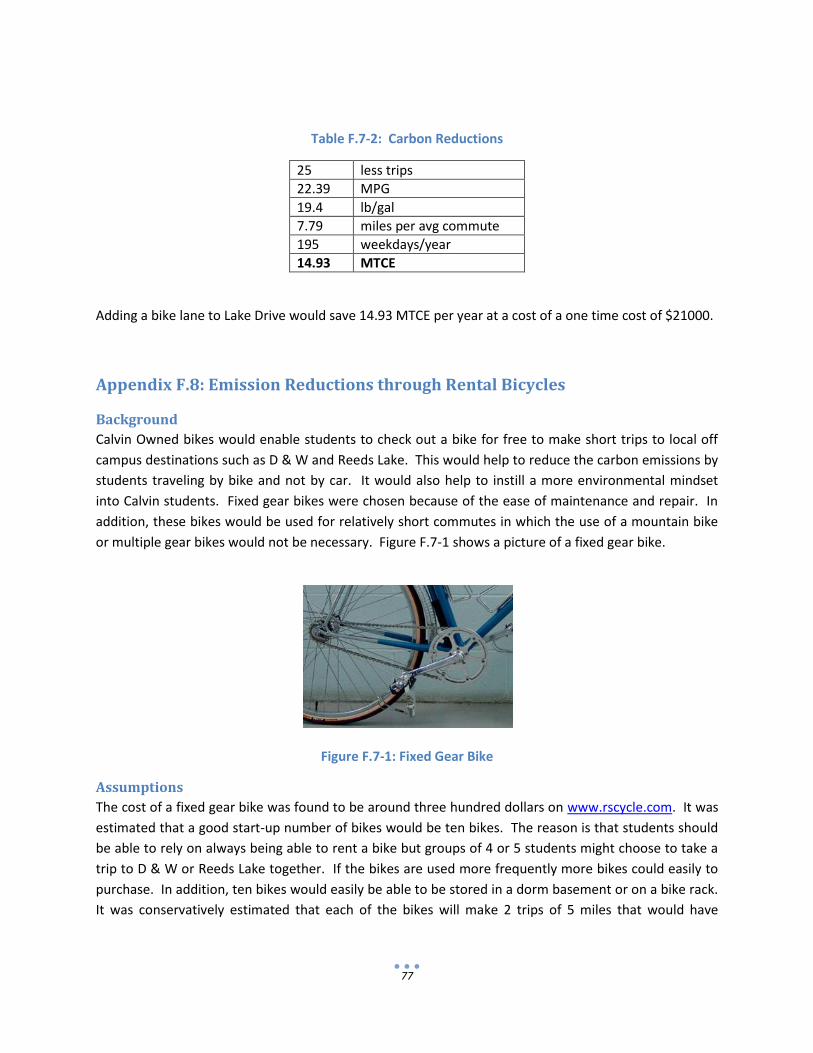
77
Table F.7-2: Carbon Reductions
25 less trips
22.39 MPG
19.4 lb/gal
7.79 miles per avg commute
195 weekdays/year
14.93 MTCE
Adding a bike lane to Lake Drive would save 14.93 MTCE per year at a cost of a one time cost of $21000.
Appendix F.8: Emission Reductions through Rental Bicycles
Background
Calvin Owned bikes would enable students to check out a bike for free to make short trips to local off
campus destinations such as D & W and Reeds Lake. This would help to reduce the carbon emissions by
students traveling by bike and not by car. It would also help to instill a more environmental mindset
into Calvin students. Fixed gear bikes were chosen because of the ease of maintenance and repair. In
addition, these bikes would be used for relatively short commutes in which the use of a mountain bike
or multiple gear bikes would not be necessary. Figure F.7-1 shows a picture of a fixed gear bike.
Figure F.7-1: Fixed Gear Bike
Assumptions
The cost of a fixed gear bike was found to be around three hundred dollars on www.rscycle.com. It was
estimated that a good start-up number of bikes would be ten bikes. The reason is that students should
be able to rely on always being able to rent a bike but groups of 4 or 5 students might choose to take a
trip to D & W or Reeds Lake together. If the bikes are used more frequently more bikes could easily to
purchase. In addition, ten bikes would easily be able to be stored in a dorm basement or on a bike rack.
It was conservatively estimated that each of the bikes will make 2 trips of 5 miles that would have

78
otherwise been traveled with a car over the course of the week. This leads to a total of 100 miles a
week. With these assumptions the information in Table F.7-1 was computed.
Conclusions
The bikes would initially be either rented from Campus Safety or Student Development (located in the
library). If the bikes get a lot of use the future plan would be to expand to have bike rentals in more
locations around campus. The bikes would be checked out using student ID cards. Total emissions
reduced are shown in Table F.7-1 below.
Table F.7-1: Total Emissions Reduced
cost of bike 300 dollars/bike
number of bikes 10 bikes
number of miles 100 miles/week
CO2 emissions 19.4 lbs/gallon
"average Calvin car" 22.39 miles/gallon
total emissions reduced 1.25766 metric tons/year
Appendix F.9: Emission Reductions through Subsidizing the Rapid
Objective
The objective is to determine costs and emission savings for fully subsidizing the Rapid.
Procedure
The first thing was to determine current ridership by Calvin students of the Rapid. The Rapid provided
data showing monthly Calvin ridership during the past year. The current ridership of the Rapid is
approximately 31000 rides per year (as provided by Nicholas Monoyios at the Rapid). For each of those
rides Calvin currently pays $0.50 (information provided by William Corner, the Director of Campus
Safety) and if multiplied by total rides the current amount Calvin pays was found to be $15,500. If Calvin
was to fully subsidize the Rapid, $1.00 per ride would be paid by Calvin. Using an estimated percentage
increase, total costs for subsidy are calculated. The difference between what Calvin pays now and what
they would pay for full subsidy is the additional money that would be needed to cover full subsidy of the
Rapid. To calculate the carbon offsets by subsidizing the Rapid, the average commute distance and
emissions per commute were used. For details of the calculation of these numbers refer to (to be
decided later). It is assumed that each new ride on the Rapid after subsidy is one less commute and
thus less carbon emitted. Full calculations can be found in Appendix F.10
Results and Conclusions
Results from the Student Survey suggest a conservative estimate of a 355% increase. This increase
would cost Calvin an additional $94,492 and reduce emissions by 264 MTCE. The cost per carbon
reduction is $360/MTCE. This cost would decrease to a minimum of $300 as ridership further increased
as shown in Figure F.9-1 below.

79
Figure F.9-1: Cost of Carbon Reduction as Ridership Increases
The costs and emission savings are shown in Table F.9-1 below.
Table F.9-1: Cost and Carbon Emissions Savings for Full Subsidy as Ridership Increases
Ridership Increase Total Rides Cost Increase Carbon Saved Cost/MTCE
% - $ MTCE $/MTCE
100 31000 0 0 -
200 62000 46500 103 450
300 93000 77500 207 375
400 124000 108500 310 350
500 155000 139500 414 337
600 186000 170500 517 330
700 217000 201500 621 325
800 248000 232500 724 321
Fully subsidizing the Rapid is a low cost way to reduce carbon emissions at Calvin. Besides reducing
emissions, it will make students more knowledgeable of public transportation and making them more
likely to use it after they graduate. Also, with more people utilizing the Rapid, there will be fewer
constraints on parking around Calvin. Finally, if ridership increases enough Calvin will be a major user of
the Rapid and will be to influence routes and schedules. The benefits are well worth the cost.

80
Appendix F.10: Emissions Reductions by Subsidizing the Rapid - Calculations Rapid Use
Ridership Increase 355%
Rapid Costs
Cost/Ride Rides/yr Cost/yr
Present 0.50$ 31000 15,500$
Future 1.00$ 109992 109,992$
Difference 0.50$ 78992 94,492$
Total annual commutes saved: 78,992 commutes
average commute distance: 7.79 miles
CO2 emissions per commute: 7.36 lb/commute
Total annual CO2 emissions: 264 metric tons
Cost of CO2 emisssion reduction 358.53 $/metric ton
Student Senate Survey Results
Frequency of Use Never Seldom Sometimes Usually Always Totals
Rating (rides/month) 0 1 4 10 15
Present 740 263 140 52 22 1673
Future 203 314 358 194 150 5936
Car Ridership 438 79 149 219 334
Ridership Data - Provided by the Rapid
Month Rides
Oct-06 3502
Nov-06 2871
Dec-06 1898
Jan-07 2957
Feb-07 2932
Mar-07 2958
Apr-07 2958
May-07 2601
Jun-07 2117
Jul-07 1730
Aug-07 1530
Sep-07 2820
Total 30874

81
Appendix F.11: Student Senate Survey Results Sample size: 1219 Students (28% of student body)
How often do you use your car?
(Not Answered) 2 0.16 %
Never 100 8.20 %
Seldom 79 6.48 %
Sometimes 149 12.22 %
Usually 219 17.97 %
Always 334 27.40 %
N/A 336 27.56 %
How often do you ride the Rapid?
(Not Answered) 2 0.16 %
Never 712 58.41 %
Seldom 263 21.58 %
Sometimes 140 11.48 %
Usually 54 4.43 %
Always 22 1.80 %
N/A 26 2.13 %
How often would you ride the Rapid if it were free?
(Not Answered) 1 0.08 %
Never 186 15.26 %
Seldom 314 25.76 %
Sometimes 358 29.37 %
Usually 194 15.91 %
Always 150 12.31 %
N/A 16 1.31 %
What inhibits your use of the Rapid? Select all that apply.
(Not Answered) 133 5.94 %
It is too expensive ($.50) 165 7.37 %
The bus does not go where I need to go 414 18.50 %
The bus doesn't run at a convenient time for me 505 22.56 %
The bus takes too long 484 21.63 %
I don't understand how the bus system works 537 23.99 %
Which of the following would reduce your incentive to drive? Select all that apply.
(Not Answered) 236 12.03 %
Free bus passes 721 36.77 %
More bike racks on campus 310 15.81 %
Bike lanes on Grand Rapids roads 487 24.83 %
Higher parking fees 207 10.56 %

82
Appendix G: Financing
Objective:
The Carbon Neutrality Project resulted in various plans to make Calvin College carbon neutral. The
Finance group was responsible for selecting the most cost effective way of becoming carbon neutral,
and determining how the funding to implement this plan would be obtained.
Method:
First, all of the data calculated by the various teams involved with the project was collected, and the
most cost effective plans were examined. From the beginning the Finance team noticed that the Waste
Management, Land Use, and Construction groups encompassed only a small portion of the total carbon
emissions at Calvin College. Even though all of these areas were important, it was decided to focus on
the two biggest carbon producers; Transportation and Energy Use. The best plans from each of these
groups were examined and a cost effective method for becoming carbon neutral was chosen. Next, the
amount of money needed for the college to be carbon neutral for a certain period of time was
calculated. Finally, a plan was created for how the college would obtain the required funding.
Results:
The Energy Use group had formulated a plan to make their carbon emissions net zero through the
installation of wind turbines and carbon offset purchasing for thirty five years. Because of this, the
lifespan of this project was set at thirty five years. This plan required a large amount of upfront funding,
but also generated a large amount of funding later on because Calvin would not have to purchase as
much electricity. The next big concern was getting the Transportation group’s carbon emissions to be
net zero, however this was much more difficult. The one plan that the Transportation group suggested
that was selected to be implemented was to raise the parking fees at Calvin. The Transportation group
determined that this would discourage people from driving, thus emitting less carbon, while at the same
time generating money that could be used to fund carbon neutrality projects. The Transportation group
also proposed other plans to work towards carbon neutrality, however none were as cost effective as
carbon offset purchasing. Even so, it was decided that these other projects would help to show the
community that Calvin was taking action to move towards neutrality, and they should be implemented.
Next the total costs of this project over its lifespan were calculated. The results of all of these
calculations can be seen in Table 1.
Table 1. Project Costs
Total Cost of Energy Use Neutrality $4,223,857
Total Cost of Transportation Offsets $3,582,497
Total Present Value of Funding Required $7,806,353
Minimum Annual Funding Required $857,000
Annual Funding Requested $1,050,000
Available Funding for “Community Image” Projects $193,000
Total Saved Over Project Lifespan $15,800,000

83
The annual funding required is the total amount of money that Calvin would need to save every year, if
the parking tolls were increased to be carbon neutral in eleven years solely through wind turbines and
large quantities of offsets. The annual funding requested is the amount of money the Finance group
believes should be saved every year to fund projects that are not as cost effective, but show the
community that Calvin cares. Examples of these would be fully subsidizing the Rapid, or buying Calvin
owned bikes that the students could borrow. The funds required to implement this plan could be
generated through a 1.16% ($250) tuition increase, government grants, or donations.

84
Appendix G.1 - Calculations
Energy Group
Year Funding Required
2008 $611,703.36
2009 $607,532.29
2010 $602,820.69
2011 $597,529.12
2012 $400,314.38
2013 $379,996.90
2014 $358,106.08
2015 $334,537.45
2016 $309,179.87
2017 $22,136.40
Total $4,223,856.53
Total Carbon Cost
66400 MTCE/yr $0.00
-Energy 42352 MTCE/yr $4,225,000.00
Remainder 24048 MTCE/yr $0.00
-Transport 271 MTCE/yr ($83,000.00) /yr
Remainder 23777 MTCE/yr $0.00
Need to buy 24000 MTCE/yr in Credits
Cost Offset $264,000.00 730400
Total $181,000.00 $466,400.00
$3,582,497 PV of carbon offsets 35yrs 4%
Total PV $7,806,353.33 Energy PV + Offset PV
Future Value $11,554,964.21 Future Values, 11yrs, 4%
Annualized $856,222.85 Annualized 11yrs 4%
Total $857,000.00 need to save this much per year for 11 years for
Calvin Students 4200 Calvin to be carbon neutral for the following 35 years
Tuition Increase $250.00 So if Tuition goes up $250 per year, we are definitely good
Current Tuition $21,460.00
Percent increase 1.16% Percent Tuition went up
Annual Funds Requested $1,050,000.00
Excess money $193,000.00 This is how much extra is generated
Total annual excess $193,000.00 <--- Start math
Annual Savings Required $857,000.00
Rapid subsidation $94,492.00
Remainder $98,508.00

85
02468
10
12
14
16
18 2
008
2013
2018
2023
2028
2033
2038
2043
2048
Tim
e (
Years
)
Account Balance (Millions of $)
010000
20000
30000
40000
50000
60000
70000
Net Carbon Emissions (MTCE)
Account B
ala
nce
Carb
on E
mis
sio
ns

86
Appendix H: Calvin College Carbon Neutrality Design Project Fall 2007
BIOL354b and ENGR333a
Professors Warners and Heun
The May 2007 report by the UN’s Intergovernmental Panel on Climate Change (IPCC,
http://www.ipcc.ch/) noted that there was a 70% increase in Greenhouse Gas (GHG) emissions
between 1970 and 2004. With projected increases in global economic activity, especially in
China and India, curbing GHG emissions will become increasingly difficult over the coming
decades.
The most common greenhouse gas is carbon dioxide (CO2). Net CO2 emissions (or CO2
equivalent emissions) are becoming a proxy for the overall environmental impact of an
individual or an organization. Net GHG emissions are calculated as GHGs generated less GHGs
sequestered. (It is possible to sequester CO2 by, for example, planting additional trees.)
Sequestration may be accomplished by an organization itself or by purchasing emission credits
associated with GHG emission reduction or sequestration projects external to the organization.
Resources exist to calculate the “carbon footprint” of an organization, i.e., the net CO2 equivalent
emissions (emissions less sequestration) during a year by that organization. (For example, see
http://www.carbonfootprint.com/USA/calculator.html for a personal CO2 emissions calculator.)
An organization is said to be “carbon neutral” when its net CO2 equivalent emissions are zero.
Recently, over 70 presidents of US colleges and universities made a commitment to reduce
greenhouse gas emissions (http://www.presidentsclimatecommitment.org/) by their institutions
and approach “climate neutrality.” Several colleges, including Middlebury College in Vermont,
have studied options for achieving carbon neutrality on their campus. And, the National Wildlife
Federation (NWF) has initiated a program to support campuses that commit to carbon neutrality
goals. NWF “Campus Climate Champions” commit to reducing carbon emissions by 2%
annually.
The question for you this semester is “What would it take to make Calvin College carbon
neutral?” Your answer to this question should take the form of a comprehensive plan for Calvin
College to achieve carbon neutrality. The plan must be appropriate for the mission of Calvin
College (http://www.calvin.edu/about/mission.htm), its history, and its present context. Elements
of your proposed plan should include:
• An inventory of Calvin’s present rate of GHG emissions and sequestration potential
• A detailed list of steps to be taken by Calvin to achieve carbon neutrality
• A schedule showing a timeline for implementing the plan
• Detailed documentation showing that the proposed plan will provide carbon neutrality
• A realistic plan to finance any capital projects that appear in the plan
• A financial evaluation of the economic costs of implementing the plan
Your deliverables are:
(a) a final report that proposes a feasible plan for making Calvin College carbon neutral

87
(b) two posters to be presented at the Calvin Environmental Assessment Program (CEAP)
conference on Thursday 29 November 2007, and
(c) a joint Biology/Engineering seminar on Wednesday 5 December 2007 in SB010 at 3:30
PM.
The customer for your report is Calvin’s Vice-President for Finance, Henry DeVries.
The final written report should follow the technical memo format, including a two-page
summary with conclusions. The Executive Council is responsible for the introductory two pages
and planning for the final report. Each team must provide a detailed appendix (in technical memo
format, of course) to the overall technical memo that describes the analyses performed and the
contributions of the team.
Your final report will consist of:
(a) a paper copy of your final technical memo with extensive appendices,
(b) an electronic copy of your final report (.pdf format, one single file), and
(c) electronic copies of any programs or analysis tools that you developed during the project.
You must distribute copies of your final report to the VP for Finance, your supporting resources
(see below), and the professors. You must also send a note of appreciation to your resources for
their assistance during the semester.
To develop the required plan, you must first identify which areas you want to study this
semester. These areas will be studied by 5 groups of 4–5 students each. Submit the list of study
areas to Professor Heun by Wednesday 5 September 2007. The professors highly recommend
that you organize the study areas following the outline of the Sustainability Statement recently
adopted by Calvin College. So, for example, one group may be dedicated to researching CO2
effects of Energy Purchasing and Use (item 4 in the Statement); another group may consider
Transportation (item 7 in the Statement); etc. Note that item 9 (Campus Grounds and Land Use)
is an area of opportunity for evaluating sequestration options.
After the study areas are defined, professors will select students to fill the groups for each study
area. To apply for one of the available groups, prepare a cover letter and resume and deliver it to
your professor by Friday 7 September 2007. Your cover letter should indicate the group in which
you are interested and why you are qualified for that position. Groups will be announced in class
on Tuesday 11 September 2007.
You may find it necessary to adjust the management structure as the semester progresses. Each
group should select one individual to represent it on an Executive Council that provides
coordination among the groups. All groups must arrange a tour of Calvin’s existing physical
plant facilities (including our co-gen plant) with Paul Pennock (see Supporting Resources
below).
The first tasks for each group will be to (a) develop a schedule of your activities for the semester
and (b) assess the contribution of your area to Calvin’s current carbon footprint.

88
There will be three short, in-class progress reports in the form of oral presentations. There will be
a longer in-class final presentation that summarizes the results of the Calvin College Carbon
Neutrality project. Each student must give either (a) one of the progress report presentations or
(b) part of the final presentation. The presentations must be professional quality, must concisely
report your progress, and must provide sufficient technical detail for customer, professor, and
peer review of your progress.
The in-class progress reports must include the following elements:
• Status relative to your schedule (and any re-planning that has occurred since your last
report)
• Work accomplished since your last report (including technical details)
• Issues or concerns (and plan for addressing them)
• Work planned for upcoming reporting period
The final in-class oral report should provide the final technical details of your work, how your
work was used in the final plan for your group, and the final conclusions for your group.
Bring printed copies of your in-class presentations for guests and the professors.
Although the customer for this report is the VP for Finance, your final grade will be assigned by
the professors. Students will be graded on (a) the quality of their team’s contribution to the
overall effort of the classes and (b) peer evaluation. The professors, in conjunction with our
external resource persons, will select an exemplary student for a teamwork award at the end of
the semester.
Supporting Resources:
• Paul Pennock, Calvin Physical Plant: contact for physical plant tours and general
physical plant information
(616) 262-9230 (mobile)
[email protected] (email)
• Henry DeVries, VP for Finance, [email protected], 6-6148
• Chuck Holwerda, Electronics Shop, 6-6438
• Classroom learning on biology, exergy, economics, and thermal analysis
• Prior laboratory and lecture classes

89
Appendix I: Students Involved
Energy Use and Purchasing
Fred Thielke
Aaron Maat
Jordan Wanner
Robert Strodtman
Ben LoCascio
Land Use and Water and Wastewater Management
Eric Bratt
Dan Engel
Emilie Deschamps
Alysha Kett
Bill Tolsma
Solid Waste and Recycling
Joe Englin
Chris Lowell
Amanda Messer
Dan Michalowski
Construction and Renovation
Eu Sung Chung
Philip Baah-Sackey
Jessica Driesenga
Brian Medema
Matt Snyder
Transportation
Adebo Alao
Joshua Harbert
Peter Hiskes
Christina Overbeck
Dan VandenAkker
90
Appendix J: Statement on Sustainability Environmental Stewardship Committee
Calvin College
DRAFT - WORKING DOCUMENT ONLY
Vision
As a confessional community in the Reformed tradition, Calvin College seeks to be caretakers of creation
and agents of renewal for creation in our daily lives and as a collective community. The guiding
principles in this document are evidence of our desire to live out our pledge of love and fidelity to Jesus
Christ, who gave his life so the whole of creation could be reconciled to God. This document is offered in
the spirit of encouragement and shalom, rather than legalism, in our desire to do God’s work in God’s
world. In hope and expectation during this present time we avail our lives to God’s faithful working out
of the coming shalom.
Purpose
Our purpose is to infuse Calvin’s vigorous liberal arts education with thoughtful, Biblically based practical
guidelines that lay a foundation for living in a way that honors the Creator and his beloved creation. The
Reformed tradition recognizes the important role of creation as God’s general revelation of goodness
and grace. We also recognize our responsibility to interpret, wisely use, and compassionately care for
God's creation. In doing so, we take seriously the Biblical mandate to be stewards of God’s good earth.
Sustainable living is the daily working out of the stewardship mandate. We seek to live as part of the
natural world in ways that mirror the care and love God has for the creation. To live in a sustainable
fashion means our daily activities will be conducted in such a manner that they do not seriously
jeopardize, but instead promote, the well being of other people, other species, and the ability of future
generations of all creatures to flourish. This policy is intended to challenge ourselves to lead lives of
increased meaning and purpose, lives that promote healing and reconciliation within creation. We
consider this response to be a divine calling, the working out of which will bear fruits of love and hope in
our groaning world.
Commitment
To advance sustainability principles in all aspects of our daily operations, an honest assessment of our
current practices is necessary. Calvin College already exhibits a genuine commitment of stewardship in
many areas of our community life. Yet, we also admit that progress can be made in many other areas. It
is the objective of the Environmental Stewardship Committee that this statement will enhance our
efforts, in all we say and do, wherever we may be, to further the Kingdom of God on earth.
Intent
This statement is intended to challenge all of us to lead lives of meaning and purpose, lives that promote
healing and reconciliation among all elements of the creation. This statement challenges us to move
forward and presents many examples and starting points for education and action. We recognize not

91
everything can be done at once, and some of these guidelines will be altered and additional suggestions
will be added. We also recognize that tensions may exist between some listed goals, yet we offer this
document to assist us all to move closer to the coming shalom.
1. Teaching and Research
Calvin College rightly prides itself on the integration of its Reformed faith with the teaching and research
that is conducted here. This integration as it pertains to stewardship is a hallmark of many classes. Yet
we encourage principles of stewardship and sustainability to find expression across all disciplines at
Calvin. We also encourage more research and scholarship to engage the theological and ethical framing
of sustainability principles, as well as the practical working out of this commitment. Our vision is that all
of our students, upon graduation, will be steeped in stewardship ethics and thereby motivated to lead
lives that honor these principles.
• Develop a Biblical understanding of stewardship as it relates to sustainability activities both in our
personal and institutional lives.
• Strengthen and prioritize environmental studies and research.
• Teach energy and environmental literacy to all students.
• Develop a connection to the environment, when people feel connected to and have knowledge about
their environment, they will take better care of it.
• Expand opportunities for using the campus physical plant and business operations as a “learning lab”
for students.
• Develop community and neighborhood energy and environmental education programs and participate
in public dialogue on energy and environmental issues in the wider community.
• Increase opportunities for informal learning about environmental/sustainability issues for students,
faculty, staff and public.
2. Purchasing and Administrative Services
Calvin College purchases building material products (such as lumbers, carpet, paint, plumbing, lighting
and electrical products, etc), furniture, fixtures and equipment, cleaning and maintenance supplies (such
as cleaning solutions, toilet paper, etc), and lawn and landscape products for approximate 400 acres of
property and about 2 million square feet of interior space. We recognize that one of our primary
methods for exercising our commitment to the environment and sustainability is through our purchasing
choices. Through research and policy implementation it is our goal to make environmentally and fiscally
responsible purchasing decisions that consider life cycle costs, long term implications and the potential
harm to the environment.
• Promote environmentally – friendly product purchasing, i.e., make every effort to buy only products
which are durable, reusable, recyclable, made of recycled materials, non-hazardous, energy efficient,
sustainably harvested, produced in an environmentally sound manner, etc.
• Develop a practice of repairing/refurbishing durable products.
• Find effective ways to educate the College community about purchasing issues.

92
• Use the LEED - EB (Leadership in Energy and Environmental Design – Existing Buildings) rating tool to
evaluate the sustainability of the operations and maintenance of existing facilities.
3. Solid Waste Reduction and Recycling
Calvin College has a wide ranging recycling program. Currently we recycle office paper, paperboard,
corrugated cardboard, books, glass, metal and plastic food and beverage containers, electronic devices,
lamps and ballasts, batteries, polystyrene, scrap metal, concrete, used oil and antifreeze. 2005 saw the
beginning of efforts to compost organic waste generated from Grounds department activity.
Additionally, the college handles and ships hazardous waste in a manner that meets State and Federal
guidelines. A recent visit to several comparable institutions by our Grounds Department supervisor
shows that we recycle a higher volume and wider variety of items than the other peer institutions.
Calvin believes the effort to reduce waste and recycle is biblically based, yet many at Calvin choose not
to recycle. With that in mind, we offer the following points to promote discussion and continue to
improve the effectiveness of our recycling program.
• Establish a waste reduction ethic in all areas.
• Perform waste stream analysis to determine additional recycling potential.
• Examine ways to make recycling more convenient across campus.
• Enhance our recycling program for paper, cardboard, metal, glass, and plastic.
• Compost organic waste whenever possible.
• Enhance and increase the educational programs on recycling and re-using. Actively promote
participation in recycling programs.
• Recycle hazardous waste-containing products, such as fluorescent lamps and ballasts, anti-freeze,
solvents, batteries, computer monitors, and TV’s.
• Examine ways to minimize the waste that results from the distribution of College publications and
mailings.
• Seek to recycle at least 50% of campus waste stream.
• Create energy databases that document energy use and promote energy conservation projects.
4. Energy Purchasing
Calvin College’s electrical and natural gas cost exceeds 3 million dollars annually. We recognize the
importance of exploring and implementing well thought out and fiscally responsible measures to
conserve energy in existing buildings, renovations, and new construction. We continually investigate
new technologies for improved energy systems and more efficient use of energy resources. We have
used renewable energy resources in the past and will continue to consider their use.
• Use energy efficiency measures to flatten campus load profile to lower electrical rates.
• Utilize Calvin's co-generation system to reduce energy use when fiscally possible.
• Buy green power – renewable energy as feasible.
• Monitor developments relative to alternative energy sources for the future.
• Create residential energy conservation programs with student leader.
• Promote linkage between energy conservation effort with programs to reduce carbon dioxide
emissions and contributions to global warming.
93
5. Water and Wastewater
The college uses over 60 million gallons of potable water annually. We are committed to minimizing the
consumption of water through new technology in water use fixtures, such as auto shut off faucets and
waterless toilet systems. As with natural gas and electricity, we will continue to explore ways to
conserve water in existing building, renovations, and new construction. We will maintain efforts to
minimize and control water pollution, striving to protect the bodies of water that receive the
wastewater and storm water generated by our facilities.
• Implement water conservation program to repair leaks and retrofit inefficient plumbing fixtures –
investigate/install waterless urinals and auto shut off faucets.
• Create residential water conservation plans with Student Leaders.
• Distribute the cost of water usage annually and pursue the latest water conservation technologies.
• Protect ground water and storm run-off by minimizing use of salt for ice-melting.
• Use drought-resistant plantings and minimize irrigation.
6. Hazardous Materials
The college acknowledges the important of the safe management of ignitable, corrosive, reactive and
toxic materials. We are committed to the protection of human health and the environment from the
potential hazards of waste. We will explore ways to reduce the amount of hazardous materials
generated and ensure that waste management is environmentally sound.
• Meet or exceed legal “haz mat” handling, collection, disposal, and tracking requirements
• Educate campus hazardous waste generators about minimization and proper disposal techniques.
• Investigate new concepts for reducing and reusing hazardous materials.
• Undertake toxic use reduction and pollution prevention planning.
• Develop a chemical tracking or inventory database.
• Implement a “chemical swapping” program.
• Switch to non/least toxic paint, solvents and cleaning agents.
• Switch print shop to environmentally friendly inks.
• Develop integrated pest management techniques to minimize or eliminate use of pesticides.
• Recycle and recover ozone-depleted CFCs.
7. Transportation
Calvin College is challenged to find ways to demonstrate our commitment to creation care in
transportation choices while existing within a culture that so highly values personal automobile usage.
With strong leadership from the student Environmental Stewardship Coalition, Calvin has generously
subsidized public transportation for our students, faculty and staff. Modifications to our campus
environment have been made to promote bicycle usage, and recent consideration of adjusting parking
fees has also emerged from a commitment to exhibit more sustainable transportation practices. While

94
these expressions provide a solid foundation, we look forward to additional creative solutions that will
provide alternatives to the one-car, one-rider model.
• Encourage travel by carpooling, public transportation, bicycling, and walking.
i. Provide incentives for walking, biking, busing, and ride sharing
ii. Raise parking permit fees.
iii. Increase carpooling parking spots.
iv. Build bike shelters to encourage bike-riding
• Convert the on-campus services vehicle fleet to hybrid or alternative fuels, e.g., natural gas, electric,
and biodiesel. Develop a green fleet goal. Maximize housing options on campus to encourage students
living on campus and not driving to classes.
8. Food and Food Services
Calvin Food Service (CFS) strives to help its customers (students, faculty and staff) to understand,
practice and promote sound environmental policies concerning the reduction of food waste and the
promotion of recycling. As a result, CFS works to stay abreast of environmental issues and to implement
environmentally responsible policies whenever fiscally and practically possible. To date, CFS has
implemented intensive recycling programs for packaging materials to reduce waste. In partnership with
the student Environmental Stewardship Coalition, CFS has supported the “CUPPS” mug program to
reduce consumption of disposable beverage cups.
• Buy regional produce in season.
• Support local organic farms.
• Promote less meat consumption and eating “low on the food chain” for health and environmental
reasons.
• Minimize the use of disposable dinnerware.
• Work more closely with food suppliers to reduce packaging waste.
• Implement a reusable mug program with discounted drinks at dining halls.
• Participate more actively in programs to contribute excess food to the homeless and needy.
• Investigate composting projects
9. Campus Grounds and Land Use
Calvin College has a beautiful campus. Our 400 acre campus boasts a wide variety of mature and healthy
trees. Open spaces and athletic fields are well maintained and are an inviting place for recreation or
leisure. The 90+ acre nature preserve provides the community with a striking display of natural beauty
as well as a valuable tool for student learning. Other natural areas provide additional wildlife habitat.
Landscaped areas provide variety and color, and soften the edges of buildings and parking lots. These
elements combined give the campus a stable and welcoming atmosphere. The following points are
intended to examine common trends in land use and promote discussion within the community about
stewardly management of our outdoor environment.
• Promote discussion of campus beauty.
95
• Reduce lawn areas and grass cutting.
• Promote “natural succession” for unneeded lawn areas.
• Protect woodlands, wetlands, watershed, and wildlife.
• Implement a tree protection policy.
• Plant native species where possible.
10. Building Construction: New and Renovation
"The built environment has a profound impact on our natural environment, economy, health and
productivity. In the United States, (construction of) buildings account for 36% of total energy use, 30% of
greenhouse gas emissions, 30% of raw materials use, 30% of waste output (136 million tons annually),
and 12% of potable water consumption" (U.S. Green Building Council, 2006). Both initial
design/construction and life-cycle planning are important factors to develop sustainable solutions. At
Calvin, the amount of construction suggests significant opportunities for improvement, as well as
teaching opportunities for students and staff.
• Utilize sustainable or “green” design principles for all new construction and rehabs. Obtain at least a
LEED (Leadership in Energy and Environmental Design) “Certified” status relative to Sustainable Site,
Water Efficiency, Energy and Atmosphere, Materials and Resources, Indoor Environmental Quality, and
Innovation and Design.
• Maximize longevity, remodel or retrofit wherever possible. Restoration, renovation, and adaptive re-
use of buildings offer the greatest opportunity for conservation of energy – save the energy to produce,
transport, construct, install, and dispose of materials. • Design state-of-the-art energy efficiency and
exceed energy codes.
• Incorporate renewable energy technologies, including day-light and passive solar.
• Include suitable recycling collection space in building design programs.
• Specify environmentally-friendly building materials, products and practices (such as loosening
compacted soil around construction sites for drainage).
• Evaluate options based on life cycle analysis.
11. Campus Site Planning
Calvin’s campus is a beautiful blend of park-like landscaping, wetlands, woodlands, and meadowlands.
The placement of buildings, parking and pathways, and management of green areas contribute to
individual enjoyment, as well as responsible environmental stewardship. The initial Knollcrest Campus
design concepts spoke of an “Organic Architecture” approach to fit the “built environment” into the
landscape; these sustainable principles add a new chapter to those guidelines.
• Develop campus master plans that minimize negative impacts and disruption of natural ecosystems
and surroundings.
• Preserve and enhance green space.
• Protect natural areas from development.
• Concentrate buildings and arrange campus walkways and roads to minimize on campus driving and
create a convenient pedestrian and bicycle campus, i.e., provide bicycle shelters.

96
• Use water-efficient indigenous plantings, where possible.
• Landscape for energy efficiency as well as aesthetics.
• Make underground systems easily accessible to avoid tearing up landscape
12. Investment Policies
The goal of socially conscious investing by individual shareholders is investment in companies that
operate ethically, provide social benefits, and are sensitive to the environment. Because Calvin College
currently invests in “funds of funds” rather than picking individual stocks, we have limited opportunities
to exert shareholder influence on corporations. That notwithstanding, the college should not neglect
opportunities to serve as an “agent of shalom” in evaluating investment options.
• Establish environmental criteria for financial investments.
• Use stockholder influence to encourage environmentally responsible business practices.
13. Outreach.
In many ways Calvin College is uniquely situated to bear evidence of Biblically-based stewardship values
to the broader community. Our Ecosystem Preserve stands as a constant visible testimony of our
commitment to care for the non-human members of the creation. Many environmentally focused
service-learning activities occur outside the campus grounds, bearing further evidence of Calvin’s
dedication to creation care. Several scholarly and research efforts provide additional means of
expression to a broader population that stewardship is a core value of our faith. We encourage
additional outreach activities that expand upon these efforts so that Calvin College becomes increasingly
recognized for its love of God and of his beloved creation.
• Expand community service learning efforts to increasingly engage in creation careactivities.
• Forge new partnerships with local environmental groups.
• Work to connect environmental justice principles with social justice emphases.
• Promote off-campus programs to our students that focus on creation care.
Appendix
For something to be sustainable it must be able to continue on indefinitely.
“Sustainability could be defined as a process that reduces the long term impact on natural resources and
the environment in a cost effective and socially acceptable manner” “Facility Asset Management ,
Sustainability and Higher Education”, by Jim Sebesta, APPA’s Facilities Manager, Vol. 21, No. 1 Jan/Feb
2005.
“Try to imagine a campus that consumes few natural resources, recycles all waste and abandons
climatechanging fossil fuels and instead runs entirely on clean, renewable energy sources.” ‘What is
Sustainability?” A reflection on Seven Generations and Beyond,” By Walter Sampson, CEM, LEED, AP,
APPA’s Facilities Manager, Vol. 21, No.1, Jan/Feb 2005
“What if higher education were to take a leadership role, …would operate as a fully integrated
community that models social and biological sustainability itself and in interdependence with local,

97
regional, and global community. In many cases, we think of teaching, research, operations, and relations
with local communities as separate activities: they are not. The process of education will emphasize
active, experimental, inquiry-based learning and real-world problem solving on the campus and in the
larger community, including government and industry. … A campus would “Practice what it preaches”
and make sustainability an integral part of operations, planning, facility design, purchasing and
investments, and tie these efforts to a formal curriculum.”
“Because the University is a microcosm of the larger community, the manner in which it carries out its
daily activities is an important demonstration of ways to achieve environmentally responsible living and
to reinforce desired values and behaviors in the whole community. This would include an analysis of the
full impact of the throughput of resources and energy at the university, the life cycle impact of all the
operations and would embrace a strategy for developing indicators to measure the impact and process
in making changes to move to the positive. This will necessarily lead to discussions of issues like energy
and water consumptions, recycling, green buildings, transportation of people and goods to and from the
campus sustainably preferable purchasing, etc. Transparency is important here. We need new indicators
of movement towards sustainability and institutional success because we measure what we value and
manage what we measure. As always, the role of faculty and students and connecting these efforts back
to student learning, research, and action are critical” ‘Integrating Sustainability in the Learning
Community”, by Anthony D.Cortese, Sc.D., APPA’s Facility Manager, Vol. 21, No. 1, Jan/Feb 2005.
Resources used:
‘Integrating Sustainability in the Learning Community”, by Anthony D.Cortese, Sc.D., APPA’sFacility
Manager, Vol. 21, No. 1, Jan/Feb 2005
‘What is Sustainability?” A reflection on Seven Generations and Beyond,” By Walter Sampson,CEM,
LEED, AP, APPA’s Facilities Manager, Vol. 21, No.1, Jan/Feb 2005 Sustainability and
Higher Education,” by James Sebesta, APPA’s Facilities Manager, Vol. 21, No. 1, Jan/Feb 2005
The Environmental Stewardship Committee welcomes input and suggestions for this Statement on
Sustainability. Please contact any ESC member listed below with comments and email.
Phil Beezhold [email protected] Director, Physical Plant
Henry De Vries [email protected] VP Administration
Frank Gorman [email protected] College Architect
Kathi Groenendyk [email protected] CAS
Gail Heffner [email protected] Provost Office
Henry Kingma [email protected] Physical Plant
Rachel Reed [email protected] student (2005-6)
Dave Vanette [email protected] student (2005-6)
Gerry Van Kooten [email protected] Chair, GGES
Dave Warners [email protected] Biology

98
Appendix K: Professor Piers’s Research