carbon capture and storage projects
TRANSCRIPT
METHODOLOGY FOR THE QUANTIFICATION,
MONITORING, REPORTING AND VERIFICATION
OF GREENHOUSE GAS EMISSIONS
REDUCTIONS AND REMOVALS FROM
CARBON CAPTURE AND
STORAGE PROJECTS
VERSION 1.1
September 2021
METHODOLOGY FOR THE QUANTIFICATION, MONITORING,
REPORTING AND VERIFICATION OF GREENHOUSE GAS
EMISSIONS REDUCTIONS AND REMOVALS FROM
CARBON CAPTURE AND STORAGE PROJECTS
VERSION 1.1
September 2021
American Carbon Registry®
WASHINGTON DC OFFICE
c/o Winrock International
2451 Crystal Drive, Suite 700
Arlington, Virginia 22202 USA
ph +1 703 302 6500
americancarbonregistry.org
ABOUT AMERICAN CARBON REGISTRY® (ACR)
A leading carbon offset program founded in 1996 as the first private voluntary GHG registry in
the world, ACR operates in the voluntary and regulated carbon markets. ACR has unparalleled
experience in the development of environmentally rigorous, science-based offset methodologies
as well as operational experience in the oversight of offset project verification, registration, offset
issuance and retirement reporting through its online registry system.
© 2021 American Carbon Registry at Winrock International. All rights reserved. No part of this publication may be
reproduced, displayed, modified or distributed without express written permission of the American Carbon Registry. The sole
permitted use of the publication is for the registration of projects on the American Carbon Registry. For requests to license
the publication or any part thereof for a different use, write to the Washington DC address listed above.

METHODOLOGY FOR THE QUANTIFICATION, MONITORING, REPORTING AND VERIFICATION OF GREENHOUSE GAS EMISSIONS REDUCTIONS AND REMOVALS FROM
CARBON CAPTURE AND STORAGE PROJECTS Version 1.1
September 2021 americancarbonregistry.org 3
ACKNOWLEDGEMENTS
Developed in partnership with

METHODOLOGY FOR THE QUANTIFICATION, MONITORING, REPORTING AND VERIFICATION OF GREENHOUSE GAS EMISSIONS REDUCTIONS AND REMOVALS FROM
CARBON CAPTURE AND STORAGE PROJECTS Version 1.1
September 2021 americancarbonregistry.org 4
ACRONYMS
CCS Carbon Capture and Storage
CH4 Methane
CO2 Carbon dioxide
DAC Direct Air Capture
EOR Enhanced Oil Recovery
GHG Greenhouse Gas
MRV Monitoring, Reporting, and Verification
N2O Nitrous oxide
METHODOLOGY FOR THE QUANTIFICATION, MONITORING, REPORTING AND VERIFICATION OF GREENHOUSE GAS EMISSIONS REDUCTIONS AND REMOVALS FROM
CARBON CAPTURE AND STORAGE PROJECTS Version 1.1
September 2021 americancarbonregistry.org 5
CONTENTS
ACKNOWLEDGEMENTS .......................................................................................................... 3
ACRONYMS .............................................................................................................................. 4
CONTENTS ............................................................................................................................... 5
1 BACKGROUND AND APPLICABILITY ................................................................................ 9
1.1 BACKGROUND ON CCS PROJECTS ........................................................................... 9
1.2 ELIGIBILITY ..................................................................................................................10
1.3 PERIODIC REVIEWS AND REVISIONS .......................................................................11
2 PROJECT BOUNDARIES ....................................................................................................12
2.1 PHYSICAL BOUNDARY................................................................................................12
2.2 TEMPORAL BOUNDARY ..............................................................................................13
2.3 GREENHOUSE GAS ASSESSMENT BOUNDARY ......................................................14
BASELINE ................................................................................................................................16
PROJECT .................................................................................................................................16
3 BASELINE DETERMINATION .............................................................................................19
3.1 BASELINE DESCRIPTION ............................................................................................19
3.1.1 BASELINE OPTIONS FOR CCS PROJECTS .....................................................19
3.1.2 BASELINE CONSIDERATIONS FOR RETROFIT AND NEW-BUILD CCS
PROJECTS .........................................................................................................20
3.2 ADDITIONALITY ASSESSMENT ..................................................................................21
3.2.1 REGULATORY SURPLUS TEST ........................................................................22
3.2.2 PERFORMANCE STANDARD ............................................................................22
4 QUANTIFICATION METHODOLOGY ..................................................................................27
4.1 BASELINE EMISSIONS ................................................................................................27
4.1.1 FUNCTIONAL EQUIVALENCE ...........................................................................27
4.1.2 CALCULATION PROCEDURE FOR PROJECTION-BASED BASELINE ............28
4.1.3 CALCULATION PROCEDURE FOR STANDARDS-BASED BASELINE .............30
4.2 PROJECT EMISSIONS .................................................................................................31
4.2.1 CALCULATION PROCEDURES FOR CO2 CAPTURE .......................................31
4.2.2 CALCULATION PROCEDURES FOR CO2 TRANSPORT ...................................41
METHODOLOGY FOR THE QUANTIFICATION, MONITORING, REPORTING AND VERIFICATION OF GREENHOUSE GAS EMISSIONS REDUCTIONS AND REMOVALS FROM
CARBON CAPTURE AND STORAGE PROJECTS Version 1.1
September 2021 americancarbonregistry.org 6
4.2.3 CALCULATING CO2 TRANSPORT EMISSIONS ACCORDING TO SYSTEM-
WIDE EMISSION FACTORS...............................................................................47
4.2.4 CALCULATION PROCEDURES FOR CO2 STORAGE .......................................47
4.2.5 ACCOUNTING FOR ATMOSPHERIC LEAKAGE OF CO2 FROM THE STORAGE
VOLUME .............................................................................................................57
4.3 EMISSION REDUCTIONS ............................................................................................58
5 DATA COLLECTION AND MONITORING ...........................................................................59
5.1 REPORTING PERIOD ..................................................................................................59
5.2 BASELINE EMISSIONS MEASUREMENT ....................................................................59
5.3 PROJECT EMISSIONS MEASUREMENTS ..................................................................61
5.4 MONITORING, REPORTING, AND VERIFICATION (MRV) PLAN ................................67
5.4.1 MRV PLAN FRAMEWORK .................................................................................67
5.4.2 MRV PLAN REPORTING REQUIREMENTS ......................................................72
5.4.3 MRV PLAN VALIDATION AND VERIFICATION REQUIREMENTS ....................73
5.5 MEASUREMENT TECHNIQUES ..................................................................................74
5.6 DATA AND ANALYSIS FOR VERIFICATION ................................................................75
6 EMISSIONS OWNERSHIP AND QUALITY ..........................................................................88
6.1 STATEMENT OF DIRECT EMISSIONS ........................................................................88
6.2 OFFSET TITLE .............................................................................................................88
6.3 PERMANENCE, LIABILITY, AND MITIGATION ............................................................88
6.4 PORE SPACE OWNERSHIP ........................................................................................91
6.5 COMMUNITY AND ENVIRONMENTAL IMPACTS ........................................................93
7 QA/QC ..................................................................................................................................94
8 UNCERTAINTIES ................................................................................................................96
DEFINITIONS ......................................................................................................................... 100
APPENDIX A: ENHANCED OIL RECOVERY OVERVIEW .................................................... 104
APPENDIX B: SUPPLEMENTAL QUANTIFICATION METHODS ......................................... 107
APPENDIX C: STANDARDS AND PROCEDURES FOR CLASS II WELLS IN TEXAS ........ 114
APPENDIX D: STATE LEGISLATIVE ACTIONS ................................................................... 119
METHODOLOGY FOR THE QUANTIFICATION, MONITORING, REPORTING AND VERIFICATION OF GREENHOUSE GAS EMISSIONS REDUCTIONS AND REMOVALS FROM
CARBON CAPTURE AND STORAGE PROJECTS Version 1.1
September 2021 americancarbonregistry.org 7
FIGURES
Figure 1: Basic CCS Project Schematic ....................................................................................10
Figure 2: CCS Project Boundary ...............................................................................................13
Figure 3: Major US CO2 Pipelines .............................................................................................25
Figure 4: Typical EOR Process Using CO2 and Water in a Water-alternating-gas (WAG)
Process ................................................................................................................................... 105
TABLES
Table 1: Greenhouse Gases Considered in the Assessment Boundary ....................................16
Table 2: Industrial Plants in the US with CCS ...........................................................................24
Table 3: Overview of Baseline Emissions Calculation Procedures ............................................59
Table 4: Overview of Project Emissions Calculation Procedures ...............................................61
Table 5: Monitoring Parameters ................................................................................................76
Table 6: Atmospheric Leakage Mitigation Procedures...............................................................90
Table 7: Potential Sources of Uncertainty .................................................................................97
Table 8: Surface Components as Potential Emissions Sources at Injection Facilities ............. 113
EQUATIONS
Equation 1: Total Annual Projection-based Baseline GHG Emissions .......................................29
Equation 2: Total Annual Standards-based Baseline Emissions ...............................................30
Equation 3: Total Project Emissions ..........................................................................................31
Equation 4: Total Annual Project Emissions from the Capture Segment ...................................31
Equation 5: Non-Captured CO2e Emissions from the Primary Process at the Capture Site .......33
Equation 6: Primary Process CO2 Emissions ............................................................................33
Equation 7: Primary Process CH4 and N2O Emissions, .............................................................34
Equation 8: CO2 Captured and Input into CO2 Transport Pipeline .............................................35
Equation 9: Capture Site Emissions of CO2, CH4, and N2O from Stationary Combustion
Associated with Auxiliary Equipment .........................................................................................36
Equation 10: CO2 Emissions from Purchased and Consumed Electricity, Steam, and Heat ......38
Equation 11: CO2 Emissions from Purchased and Consumed Electricity ..................................38
METHODOLOGY FOR THE QUANTIFICATION, MONITORING, REPORTING AND VERIFICATION OF GREENHOUSE GAS EMISSIONS REDUCTIONS AND REMOVALS FROM
CARBON CAPTURE AND STORAGE PROJECTS Version 1.1
September 2021 americancarbonregistry.org 8
Equation 12: CO2, CH4, N2O Emissions from Purchased and Consumed Steam and/or Heat ...39
Equation 13: Apportionment of Cogeneration Emissions by Product .........................................41
Equation 14: Total Project Emissions from the Transport Segment ...........................................42
Equation 15: CO2, CH4, N2O Emissions from Stationary Combustion for CO2 Transport ...........43
Equation 16: Vented and Fugitive CO2 Emissions from CO2 Transport .....................................44
Equation 17: CO2 Captured and Input into CO2 Pipeline ...........................................................44
Equation 18: CO2 Transferred from CO2 Pipeline to CO2 Storage Site ......................................45
Equation 19: CO2e Emissions from Electricity Consumption for CO2 Transport .........................46
Equation 20: CO2e Emissions from Mobile Transport of CO2 Containers ..................................46
Equation 21: Total Project Emissions from CO2 Storage ...........................................................49
Equation 22: CO2, CH4, N2O Emissions from Stationary Combustion and Flaring for CO2
Storage .....................................................................................................................................50
Equation 23: Vented CO2e Emissions from CO2 Storage ..........................................................51
Equation 24: Fugitive CO2e Emissions from Wells and Surface Equipment ..............................52
Equation 25: CO2 and CH4 Fugitive Emissions from Equipment Leaks .....................................53
Equation 26: CO2 Fugitive Emissions Entrained in Produced Hydrocarbons .............................54
Equation 27: CO2e Emissions from Purchased Electricity Consumption for CO2 Storage .........55
Equation 28: CO2 Transferred Outside Project Boundaries .......................................................56
Equation 29: Atmospheric Leakage of CO2 Emissions from CO2 Storage Volume During the
Injection Period .........................................................................................................................57
Equation 30: Atmospheric Leakage of CO2 Emissions from CO2 Storage Volume After the
Injection Period .........................................................................................................................58
Equation 31: Total Annual GHG Reductions .............................................................................58
Equation 33: Calibration Error Calculation for Flow Meters .......................................................94
Equation 34: Calibration Error Calculation for Flow Meter Transmitters ....................................95
Equation 35: Net annual mass of CO2 (mass flow meter) ........................................................ 107
Equation 36: Net annual mass of CO2 (volumetric flow meter)................................................. 108
Equation 37: Total mass of CO2 .............................................................................................. 109
Equation 38: Project emissions from electricity used to operate equipment at the CO2 storage
site .......................................................................................................................................... 109
Equation 39: Gross amount of CO2 produced from the primary process ................................. 110
Equation 40: Project emissions from flaring of gases at hydrocarbon production facilities ....... 111

METHODOLOGY FOR THE QUANTIFICATION, MONITORING, REPORTING AND VERIFICATION OF GREENHOUSE GAS EMISSIONS REDUCTIONS AND REMOVALS FROM
CARBON CAPTURE AND STORAGE PROJECTS Version 1.1
September 2021 americancarbonregistry.org 9
1 BACKGROUND AND
APPLICABILITY
1.1 BACKGROUND ON CCS PROJECTS
Carbon capture and storage (CCS) is the separation and capture of carbon dioxide (CO2) from
the atmospheric emissions of industrial processes or the direct air capture (DAC) of atmospheric
CO2 and the transport and safe, permanent storage of the CO2 in deep underground geologic
formations.1, 2
In CCS, CO2 that would otherwise have been emitted into the atmosphere or that currently
resides in the atmosphere is captured and disposed of underground. By preventing CO2 from
large-scale industrial facilities from entering the atmosphere or by removing the CO2 that
currently resides in the atmosphere, CCS is a powerful tool for addressing potential climate
change. Geologic storage is defined as the placement of CO2 into a subsurface formation so
that it will remain safely and permanently stored. Examples of subsurface formations include
deep saline aquifers and oil and gas producing reservoirs.
The CO2 for geologic storage comes either from industrial facilities that emit large amounts of
CO2, particularly those that burn coal, oil, or natural gas; or potentially directly from the
atmosphere via large-scale chemical DAC facilities. Industrial facilities include power plants,
petroleum refineries, oil and gas production facilities, iron and steel mills, cement plants, and
various chemical plants.
This methodology outlines the requirements and process for CCS Project Proponents that store
CO2 in oil and gas reservoirs to qualify their projects for carbon credits under the American
Carbon Registry® (ACR) program. The methodology is based on the accounting framework
developed by the Center for Climate and Energy Solutions (formerly the Pew Center on Global
Climate Change).3
1 What is carbon sequestration (or carbon capture and storage)?,
http://www.netl.doe.gov/technologies/carbon_seq/FAQs/carbonseq.html 2 The Business of Cooling the Planet, Fortune, October 7, 2011,
http://tech.fortune.cnn.com/2011/10/07/the-business-of-cooling-the-planet/ 3 A Greenhouse Gas Accounting Framework for Carbon Capture and Storage Projects, Center for
Climate and Energy Solutions, February, 2012

METHODOLOGY FOR THE QUANTIFICATION, MONITORING, REPORTING AND VERIFICATION OF GREENHOUSE GAS EMISSIONS REDUCTIONS AND REMOVALS FROM
CARBON CAPTURE AND STORAGE PROJECTS Version 1.1
September 2021 americancarbonregistry.org 10
1.2 ELIGIBILITY
Eligible projects under the methodology are those that capture, transport and inject
anthropogenic CO2 during enhanced oil recovery (EOR) operations into an oil and gas reservoir
located in the US or Canada where it is sequestered. Figure 1 provides a basic schematic of a
CCS project illustrating the scope of the methodology. A description of EOR is included in
Appendix A.
Figure 1: Basic CCS Project Schematic4
Projects are only eligible if there is clear and uncontested ownership of the pore space and,
unless the Project Proponent has filed a Risk Mitigation Covenant and secured the consent of
surface owners to the filing of a Risk Mitigation Covenant or provided an alternative risk
mitigation assurance acceptable to ACR as described in 5.4.1, ERTs issued for a project shall
be subject to Invalidation. Additionally, as described in Section 6.3, Project Proponent and EOR
operators shall obtain needed surface use agreements for the duration of the Project Term to
conduct post-injection monitoring activities and, if necessary, remediation.
With respect to the capture of CO2, eligible CO2 source types include, but are not limited to:
electric power plants equipped with pre-combustion, post-combustion, or oxy-fired technologies;
industrial facilities (for example, natural gas production, fertilizer manufacturing, and ethanol
production); polygeneration facilities (facilities producing electricity and one or more of other
commercial grade byproducts); and DAC facilities.
Eligible CO2 transport options include moving CO2 by barge, rail, or truck from the source to the
storage field, or moving the CO2 in a pipeline.
4 Adapted from A Greenhouse Gas Accounting Framework for Carbon Capture and Storage Projects,
Center for Climate and Energy Solutions, February, 2012
TRANSPORTCAPTURE INJECTION & STORAGE
CO2 Source
CO2 Capture
CO2 Compression/
Dehydration &
Refrigeration
CO2 Transport/
Supplemental
Compression
CO2 Injection
CO2 Storage During
and After EOR
Operations
METHODOLOGY FOR THE QUANTIFICATION, MONITORING, REPORTING AND VERIFICATION OF GREENHOUSE GAS EMISSIONS REDUCTIONS AND REMOVALS FROM
CARBON CAPTURE AND STORAGE PROJECTS Version 1.1
September 2021 americancarbonregistry.org 11
Eligible geological storage of CO2 for an EOR project must, at minimum, utilize Class II wells in
the US and similar well requirements in Canada. Eligible projects include those where CO2 is
injected:
to enhance production from hydrocarbon producing reservoirs that have previously produced
or are currently producing through the use of primary and secondary recovery processes; or
to produce from reservoirs that have not produced hydrocarbons through the use of primary
or secondary recovery processes but have a potential for hydrocarbon recovery through CO2
injection in the reservoir.
If projects are required to transition from Class II to Class VI wells after project registration, then
those projects will remain eligible through the end of the current Crediting Period. In other
words, if regulations requiring the transition from Class II to Class VI wells are enacted after the
project has been registered with the ACR, then that project will continue to be eligible with Class
II wells through the end of the project’s current Crediting Period. The eligibility of the project
during future Crediting Periods will include an assessment of whether the transition rules require
conversion of the project’s Class II wells to remain eligible.
1.3 PERIODIC REVIEWS AND REVISIONS
ACR may require revisions to this methodology to ensure that monitoring, reporting, and
verification systems adequately reflect changes in the project’s activities. This methodology may
also be periodically updated to reflect regulatory changes, emission factor revisions, or expanded
applicability criteria. Before beginning a project, the Project Proponent shall ensure that they are
using the latest version of the methodology.

METHODOLOGY FOR THE QUANTIFICATION, MONITORING, REPORTING AND VERIFICATION OF GREENHOUSE GAS EMISSIONS REDUCTIONS AND REMOVALS FROM
CARBON CAPTURE AND STORAGE PROJECTS Version 1.1
September 2021 americancarbonregistry.org 12
2 PROJECT BOUNDARIES
Consistent with ACR Standard requirements, the project boundary includes a physical
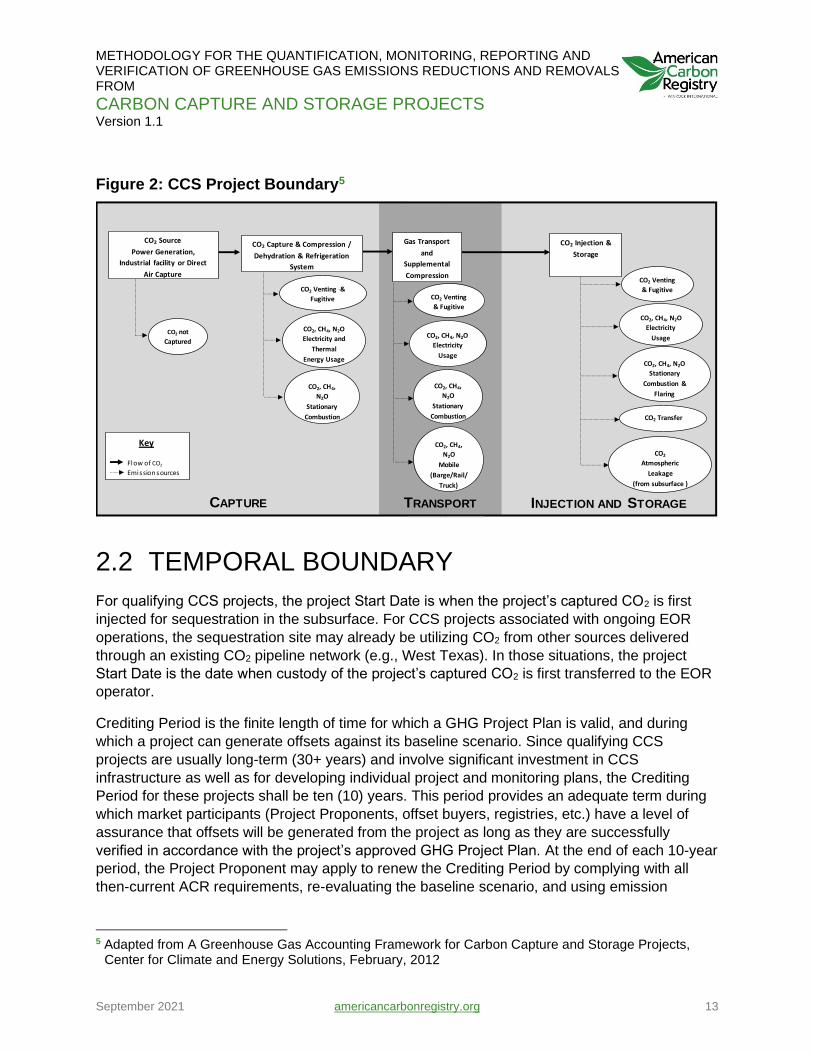
boundary, a temporal boundary, and a greenhouse gas (GHG) assessment boundary. Figure 2
provides a general illustration of project boundaries, which includes the physical boundary (i.e.
emission sources) and assessment boundary (i.e., the GHGs emissions from each source). In
addition, project boundaries include the temporal boundary, which include the temporal
parameters affecting project validity and the duration of required project activities. Physical,
temporal, and assessment boundaries are discussed in the following sections.
2.1 PHYSICAL BOUNDARY
The physical boundary demarcates the GHG emission sources included in the project and
baseline emissions calculation (as presented in Section 4). In this methodology, the project
boundary is intentionally drawn broadly to avoid unaccounted emissions associated with
capturing and storing CO2. Specifically, it covers the full CCS process, including emissions from
CO2 capture, transport, and storage in oil and gas reservoirs, as well as CO2 recovery and re-
injection operations at EOR sites. If CO2 is captured from more than one process, then the
Project Proponent shall combine them within the boundary that encompasses the capture site.
The installation of CO2 capture may impact one or more emissions sources at a facility, but may
also leave unaffected other sources. Therefore, to ensure the emissions reduction calculation
approach reflects the relevant change in emissions due to the project, the physical boundary
shall incorporate all GHG sources affected by the project in the baseline and project scenarios –
i.e., the change in emissions due to capturing CO2. This may require the inclusion of one or
more emission sources from the Primary Process creating the captured CO2. For example, a
boundary for CO2 capture at a hydrogen production unit within a refinery unit would encompass
systems associated with the hydrogen production process but might exclude downstream units
that use the hydrogen (e.g., the hydro-treating units) or other upstream systems unaffected by
the CO2 capture system.
METHODOLOGY FOR THE QUANTIFICATION, MONITORING, REPORTING AND VERIFICATION OF GREENHOUSE GAS EMISSIONS REDUCTIONS AND REMOVALS FROM
CARBON CAPTURE AND STORAGE PROJECTS Version 1.1
September 2021 americancarbonregistry.org 13
Figure 2: CCS Project Boundary5
2.2 TEMPORAL BOUNDARY
For qualifying CCS projects, the project Start Date is when the project’s captured CO2 is first
injected for sequestration in the subsurface. For CCS projects associated with ongoing EOR
operations, the sequestration site may already be utilizing CO2 from other sources delivered
through an existing CO2 pipeline network (e.g., West Texas). In those situations, the project
Start Date is the date when custody of the project’s captured CO2 is first transferred to the EOR
operator.
Crediting Period is the finite length of time for which a GHG Project Plan is valid, and during
which a project can generate offsets against its baseline scenario. Since qualifying CCS
projects are usually long-term (30+ years) and involve significant investment in CCS
infrastructure as well as for developing individual project and monitoring plans, the Crediting
Period for these projects shall be ten (10) years. This period provides an adequate term during
which market participants (Project Proponents, offset buyers, registries, etc.) have a level of
assurance that offsets will be generated from the project as long as they are successfully
verified in accordance with the project’s approved GHG Project Plan. At the end of each 10-year
period, the Project Proponent may apply to renew the Crediting Period by complying with all
then-current ACR requirements, re-evaluating the baseline scenario, and using emission
5 Adapted from A Greenhouse Gas Accounting Framework for Carbon Capture and Storage Projects,
Center for Climate and Energy Solutions, February, 2012
CO2 Source
Power Generation,
Industrial facility or Direct
Air Capture
CAPTURE TRANSPORT INJECTION AND STORAGE
Key
Flow of CO2
Emission sources
CO2 not
Captured
CO2 Capture & Compression /
Dehydration & Refrigeration
System
CO2 Venting &
Fugitive
CO2, CH4, N2O
Electricity and
Thermal
Energy Usage
CO2, CH4,
N2O
Stationary
Combustion
Gas Transport
and
Supplemental
Compression
CO2 Venting
& Fugitive
CO2, CH4, N2O
Electricity
Usage
CO2, CH4,
N2O
Stationary
Combustion
CO2, CH4,
N2O
Mobile
(Barge/Rail/
Truck)
CO2 Transfer
CO2
Atmospheric
Leakage
(from subsurface )
CO2 Injection &
Storage
CO2, CH4, N2O
Electricity
Usage
CO2 Venting
& Fugitive
CO2, CH4, N2O
Stationary
Combustion &
Flaring

METHODOLOGY FOR THE QUANTIFICATION, MONITORING, REPORTING AND VERIFICATION OF GREENHOUSE GAS EMISSIONS REDUCTIONS AND REMOVALS FROM
CARBON CAPTURE AND STORAGE PROJECTS Version 1.1
September 2021 americancarbonregistry.org 14
factors, tools and methodologies in effect at the time of Crediting Period renewal. ACR does not
limit the allowed number of Crediting Period renewals.
The Project Term is the minimum length of time for which a Project Proponent commits to
project continuance, monitoring and verification. For CCS projects the Project Term includes the
period of CO2 injection plus a time period following the end of injection during which the
reservoir is monitored for atmospheric leakage. The minimum post-injection period for CCS
projects is five (5) years. The duration of post-injection monitoring shall be extended beyond 5
years based on the monitoring results obtained during this 5-year period and whether no
leakage of CO2 (discussed in Section 5.4) can be assured. If no leakage of CO2 cannot be
assured based on the monitoring during this period, the Project Term will be extended in two-
year increments until no leakage of CO2 is assured.
2.3 GREENHOUSE GAS
ASSESSMENT BOUNDARY
The greenhouse gases included in calculations of baseline emissions and project emissions are
shown in

METHODOLOGY FOR THE QUANTIFICATION, MONITORING, REPORTING AND VERIFICATION OF GREENHOUSE GAS EMISSIONS REDUCTIONS AND REMOVALS FROM
CARBON CAPTURE AND STORAGE PROJECTS Version 1.1
September 2021 americancarbonregistry.org 15
Table 1. The emissions associated with the combustion of hydrocarbons produced by EOR
products (i.e., produced oil or gas), which occurs outside the project boundary at the point of
use, are excluded. This approach is consistent with other GHG emission reduction
methodologies, where emissions related to the use of the products are not included. Moreover,
oil production through EOR would most likely displace an equivalent quantity of imported oil or
in some cases domestic primary (i.e., non-EOR) production.6, 7, 8 The methodology encourages
the domestic production of oil with a lower carbon footprint due to the simultaneous injection
and storage of anthropogenic CO2 that would otherwise be emitted to the atmosphere.
6 The most recent Energy Information Agency (EIA) data indicates that in 2020 (Oil imports and exports -
U.S. Energy Information Administration (EIA)), the US produced 18.40 million barrels per day (MMbbl/d) of crude oil while importing 5.88 MMbbl/d during the same period. So, any incremental increase in domestic oil production through EOR would offset an equivalent quantity of imported oil that is produced by primary production processes which do not involve CO2 sequestration. Therefore, there are no incremental emissions associated with the combustion of the produced oil.
7 Storing CO2 with Enhanced Oil Recovery, DOE/NETL-402/1312/02-07-08, National Energy Technology Laboratory, February 2008.
8 Reducing Imported Oil with Comprehensive Climate and Energy Legislation, Natural Resources Defense Council, March 2010.
METHODOLOGY FOR THE QUANTIFICATION, MONITORING, REPORTING AND VERIFICATION OF GREENHOUSE GAS EMISSIONS REDUCTIONS AND REMOVALS FROM
CARBON CAPTURE AND STORAGE PROJECTS Version 1.1
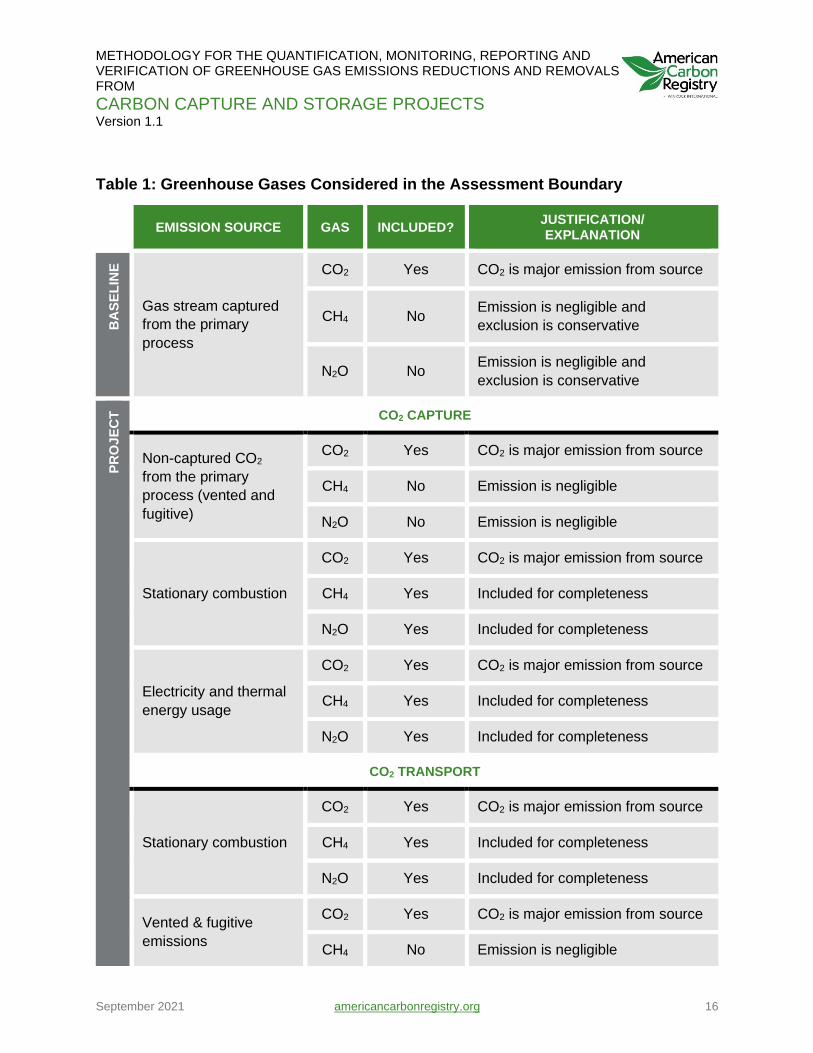
September 2021 americancarbonregistry.org 16
Table 1: Greenhouse Gases Considered in the Assessment Boundary
EMISSION SOURCE GAS INCLUDED? JUSTIFICATION/ EXPLANATION
BA
SE
LIN
E
Gas stream captured
from the primary
process
CO2 Yes CO2 is major emission from source
CH4 No Emission is negligible and
exclusion is conservative
N2O No Emission is negligible and
exclusion is conservative
PR
OJ
EC
T
CO2 CAPTURE
Non-captured CO2
from the primary
process (vented and
fugitive)
CO2 Yes CO2 is major emission from source
CH4 No Emission is negligible
N2O No Emission is negligible
Stationary combustion
CO2 Yes CO2 is major emission from source
CH4 Yes Included for completeness
N2O Yes Included for completeness
Electricity and thermal
energy usage
CO2 Yes CO2 is major emission from source
CH4 Yes Included for completeness
N2O Yes Included for completeness
CO2 TRANSPORT
Stationary combustion
CO2 Yes CO2 is major emission from source
CH4 Yes Included for completeness
N2O Yes Included for completeness
Vented & fugitive
emissions
CO2 Yes CO2 is major emission from source
CH4 No Emission is negligible
METHODOLOGY FOR THE QUANTIFICATION, MONITORING, REPORTING AND VERIFICATION OF GREENHOUSE GAS EMISSIONS REDUCTIONS AND REMOVALS FROM
CARBON CAPTURE AND STORAGE PROJECTS Version 1.1
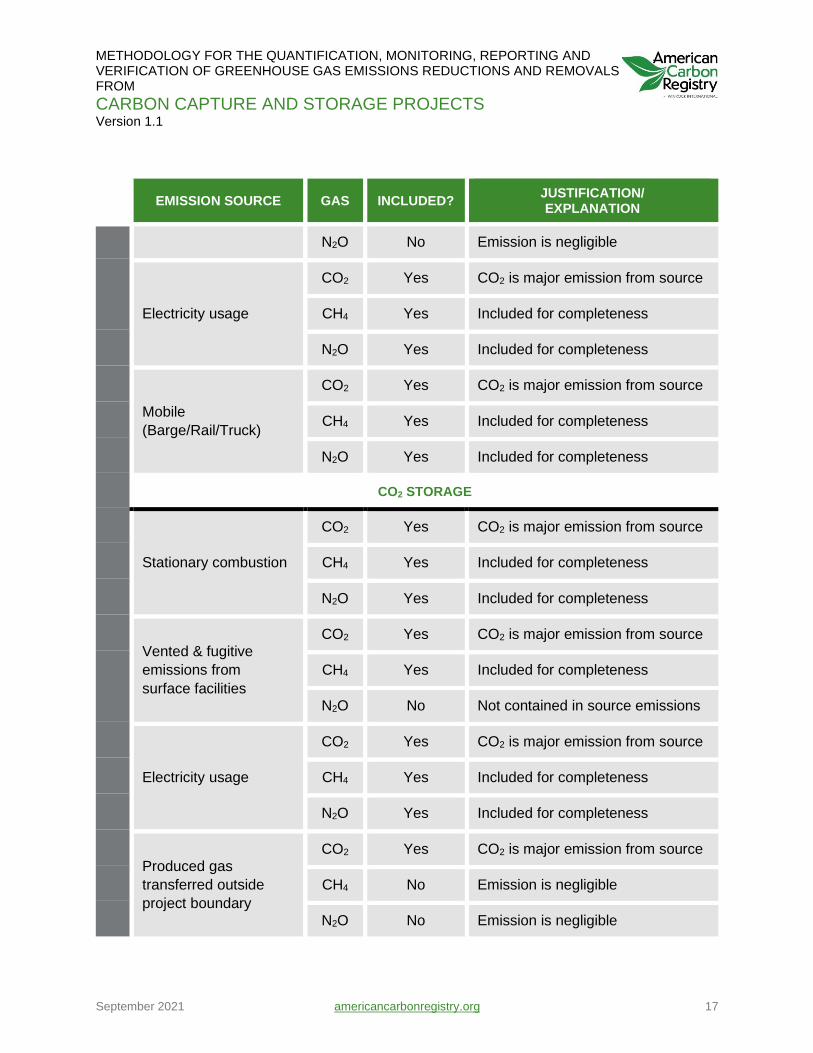
September 2021 americancarbonregistry.org 17
EMISSION SOURCE GAS INCLUDED? JUSTIFICATION/ EXPLANATION
N2O No Emission is negligible
Electricity usage
CO2 Yes CO2 is major emission from source
CH4 Yes Included for completeness
N2O Yes Included for completeness
Mobile
(Barge/Rail/Truck)
CO2 Yes CO2 is major emission from source
CH4 Yes Included for completeness
N2O Yes Included for completeness
CO2 STORAGE
Stationary combustion
CO2 Yes CO2 is major emission from source
CH4 Yes Included for completeness
N2O Yes Included for completeness
Vented & fugitive
emissions from
surface facilities
CO2 Yes CO2 is major emission from source
CH4 Yes Included for completeness
N2O No Not contained in source emissions
Electricity usage
CO2 Yes CO2 is major emission from source
CH4 Yes Included for completeness
N2O Yes Included for completeness
Produced gas
transferred outside
project boundary
CO2 Yes CO2 is major emission from source
CH4 No Emission is negligible
N2O No Emission is negligible
METHODOLOGY FOR THE QUANTIFICATION, MONITORING, REPORTING AND VERIFICATION OF GREENHOUSE GAS EMISSIONS REDUCTIONS AND REMOVALS FROM
CARBON CAPTURE AND STORAGE PROJECTS Version 1.1
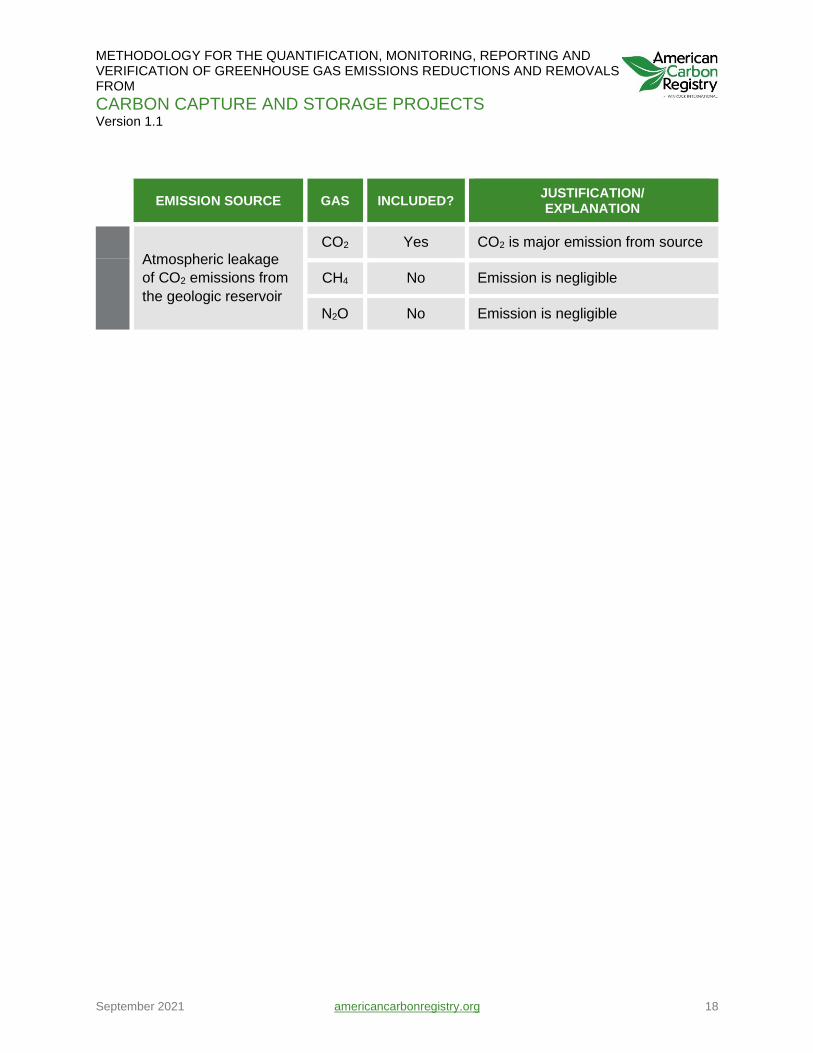
September 2021 americancarbonregistry.org 18
EMISSION SOURCE GAS INCLUDED? JUSTIFICATION/ EXPLANATION
Atmospheric leakage
of CO2 emissions from
the geologic reservoir
CO2 Yes CO2 is major emission from source
CH4 No Emission is negligible
N2O No Emission is negligible

METHODOLOGY FOR THE QUANTIFICATION, MONITORING, REPORTING AND VERIFICATION OF GREENHOUSE GAS EMISSIONS REDUCTIONS AND REMOVALS FROM
CARBON CAPTURE AND STORAGE PROJECTS Version 1.1
September 2021 americancarbonregistry.org 19
3 BASELINE DETERMINATION
3.1 BASELINE DESCRIPTION
The project baseline is a counterfactual scenario that forecasts the likely stream of emissions or
removals that would occur if the Project Proponent does not implement the project, i.e., the
"business as usual" case. It serves as a reference case against which to quantitatively compare
the GHG emissions associated with the project and derive net emission reductions. In this and
other sections of this document the discussions are focused on power plants as an example.
CO2 sourced from other industrial sources and used for EOR equally qualify. Further, there
could be more than one source of CO2 used for EOR by the project.
The methodology presents two baseline options, referred to as Projection-based and
Standards-based.
3.1.1 Baseline Options for CCS Projects
A Project Proponent would select the baseline that applies to its project, and then follow the
matching calculation procedure. The choice of baseline dictates the equations applied, as
provided in Section 4.1.2 and 4.1.3:
Projection-based baseline Baseline Equation 1
Standards-based baseline Baseline Equation 2
PROJECTION-BASED. This option represents a baseline that would correspond with the project’s
actual CO2 capture site, absent the capture and compression system located at the CO2 source.
For example, if the CCS project includes a coal electricity generator with post-combustion
capture, a Projection-based baseline would be the coal plant without CO2 capture; similarly, if
the CCS project captures CO2 from acid-gas removal associated with natural gas production, a
Projection-based baseline would be the natural gas production facility with acid gas removal but
with CO2 vented to the atmosphere.
For most CCS projects, the Projection-based baseline scenario will apply. According to the
calculation approach, the Project Proponent will determine Projection-based baseline emissions
according to actual measured quantities of CO2 captured from the project, which would have
been vented to the atmosphere had the CCS project not been implemented, minus the
incremental CO2 generated at the capture site due to CO2 capture equipment. The calculation
uses data collected in the project condition to represent the quantity of emissions prevented
from entering the atmosphere.
METHODOLOGY FOR THE QUANTIFICATION, MONITORING, REPORTING AND VERIFICATION OF GREENHOUSE GAS EMISSIONS REDUCTIONS AND REMOVALS FROM
CARBON CAPTURE AND STORAGE PROJECTS Version 1.1
September 2021 americancarbonregistry.org 20
STANDARDS-BASED. The Standards-based baseline can be based on a technology or specified
as an intensity metric or performance standard (e.g., tonnes of carbon dioxide equivalent
[tCO2e] per unit of output). It could correspond with a similar or different technology than the
CCS project’s actual CO2 capture site, but which fulfills the same purpose and function. For
instance, if the CCS project includes a coal-fired electricity generator with post-combustion
capture, a Standards-based baseline could be represented by a coal-fired or natural gas-fired
power plant’s emissions rate, expressed as tonnes CO2/megawatt hour [MWh]. In this case,
baseline emissions would be calculated by multiplying the actual MWhs delivered to the grid in
the project condition (net MWh) times the approved emissions rate. In the case of hydrogen
production required for refining operations, a steam methane reformer (SMR) hydrogen
production facility could be represented in the standards baseline by a catalytic reformer which
produces less CO2 compared to SMR hydrogen production.
A Standards-based baseline is sector specific, at minimum, to ensure reasonable accuracy, and
it could have a different emissions profile than the technology used at the CO2 capture site.
A performance standard could be set by regulation for a particular sector. If the quantity of CO2
captured and stored exceeds this standard then those excess reductions would qualify under
the methodology (assuming other requirements are met). For example, if CCS enabled a new or
modified facility to reduce its emissions to 800 lbs/MWh, which exceeds a regulatory
performance standard requirement of 1,000 lbs/MWh, then under a performance standard
approach, the baseline would be set at 1,000 lbs/MWh (mandated by regulation) and the
difference of 200 lbs/MWh would be eligible for credits under the methodology.
If both baseline options are feasible for a given project, the more conservative option (i.e. the
option likely to result in a lower estimate of baseline emissions and therefore a lower estimate of
net emission reductions) shall be selected unless justification can be presented, acceptable to
ACR and the validator, why the less conservative option represents a more credible and likely
baseline scenario.
3.1.2 Baseline Considerations for Retrofit and New-Build
CCS Projects
Depending on the situation, either the Projection-based or Standards-based baseline could
apply to projects that capture CO2 at power generation or other industrial facilities, and inject
CO2 at various types of storage sites.
RETROFIT CCS PROJECTS. Given the limited number of regulations that require GHG emissions
reductions from facilities in the U.S., the baseline for most retrofit projects would involve the
continued operation of the existing CO2 source facility, but without carbon capture and storage –
such that produced CO2 is vented to the atmosphere. This corresponds with the Projection-
based baseline.

METHODOLOGY FOR THE QUANTIFICATION, MONITORING, REPORTING AND VERIFICATION OF GREENHOUSE GAS EMISSIONS REDUCTIONS AND REMOVALS FROM
CARBON CAPTURE AND STORAGE PROJECTS Version 1.1
September 2021 americancarbonregistry.org 21
However, if the retrofit involves a major overhaul of technologies, then applying a Projection-
based baseline might not be the most reasonable approach. Instead, it may be more
appropriate to characterize the baseline in terms of the emissions rate associated with a specific
technology, often called a performance standard.
A Standards-based baseline could also apply to retrofit projects if a law or regulation affects
CO2 emissions production at the capture site, such as a mandate to meet a minimum GHG
emission performance standard.
NEW BUILD CCS PROJECTS. The baseline for new facilities will often correspond with the
common practice in the region and the most economic option available to the Project
Proponent. As with retrofit projects, provided that there are no regulations in place that require
the use of certain technologies, mandate the installation of CCS, or prevent the implementation
of the most common technology option, the baseline for a new build facility would likely be the
operation of the project configuration without the CCS capture component that vents all of the
produced CO2 to the atmosphere – a Projection-based baseline.
However, multiple economic and market, social, environmental, and political considerations
exist that impact technology choices and configurations. Thus, Project Proponents could decide
that an emissions performance standard best represents its project circumstances and adopt a
Standards-based baseline.
Current regulations shall be considered in determining whether to use a Projection-based or
Standards-based baseline for new and existing sources. For example, for new sources, if a
GHG regulation requires new sources to meet an emissions performance benchmark, the
Standards-based baseline is appropriate and baseline emissions rate shall be set to this
benchmark. For existing sources, a Projection-based baseline is appropriate unless there is
some regulation that makes it unlikely that existing source can continue operating as in the past,
and is likely to be replaced by a new source having to meet the benchmark.
3.2 ADDITIONALITY ASSESSMENT
Emission reductions from the project must be additional, or deemed not to occur in the
business-as-usual scenario. The assessment of additionality shall be made based on evaluating
the project using the performance standard approach as described below. Project Proponents
utilizing this methodology shall consult the latest version of the ACR Standard, which may be
updated from time to time.
To qualify as additional, the project must
Pass a regulatory additionality test; and
Exceed a performance standard
METHODOLOGY FOR THE QUANTIFICATION, MONITORING, REPORTING AND VERIFICATION OF GREENHOUSE GAS EMISSIONS REDUCTIONS AND REMOVALS FROM
CARBON CAPTURE AND STORAGE PROJECTS Version 1.1
September 2021 americancarbonregistry.org 22
3.2.1 Regulatory Surplus Test
In order to pass the regulatory surplus test, a project must not be mandated by existing laws,
regulations, statutes, legal rulings, or other regulatory frameworks in effect now, or as of the
project Start Date, that directly or indirectly affect the credited GHG emissions associated with a
project.
The Project Proponent must demonstrate that there is no existing regulation that mandates the
project or effectively requires the GHG emission reductions associated with the capture and/or
sequestration of CO2. Voluntary agreements without an enforcement mechanism, proposed
laws or regulations, optional guidelines, or general government policies are not considered in
determining whether a project is surplus to regulations.
As noted in Section 3.1.1, if the quantity of CO2 captured and stored exceeds the requirements
imposed by regulation, then those excess reductions are considered surplus and thereby qualify
under the methodology (assuming other requirements are met). For example, if CCS enables a
new or modified facility to exceed a regulatory performance standard requirement of 1,000
lbs/MWh, then the reductions down to 1,000 lbs/MWh would not be creditable (since mandated
by regulation) but those reductions in excess of the requirement are considered surplus and are
creditable.
Projects that are deemed to be regulatory surplus are considered surplus for the duration of
their Crediting Period. If regulations change during the Crediting Period, this may make the
project non-additional and thus ineligible for renewal, but does not affect its additionality during
the current Crediting Period.
EOR sites must remain in compliance with State and Federal regulations that are in place at the
time of project registration and remain in compliance with those regulations through the injection
period. The injection site shall continue to remain in compliance with those regulations during
the post injection period until the end of the Project Term.9
3.2.2 Performance Standard
Projects are required to achieve a level of performance that, with respect to emission reductions
or removals, or technologies or practices, is significantly better than average compared with
similar recently undertaken practices or activities in a relevant geographic area. The
performance threshold may be:
PRACTICE-BASED. developed by evaluating the adoption rates or penetration levels of a
particular practice within a relevant industry, sector or subsector. If these levels are
9 While Project Proponents may choose to not renew the project’s Crediting Period under new
regulations, to maintain qualification of ERTs that have already been credited, the EOR site must continue to comply with regulations that were in effect at project registration through the Project Term.

METHODOLOGY FOR THE QUANTIFICATION, MONITORING, REPORTING AND VERIFICATION OF GREENHOUSE GAS EMISSIONS REDUCTIONS AND REMOVALS FROM
CARBON CAPTURE AND STORAGE PROJECTS Version 1.1
September 2021 americancarbonregistry.org 23
sufficiently low that it is determined the project activity is not common practice, then the
project activity is considered additional.
TECHNOLOGY STANDARD. installation of a particular GHG-reducing technology may be
determined to be sufficiently uncommon that simply installing the technology is considered
additional.
EMISSIONS RATE OR BENCHMARK (e.g., tonnes of CO2e emission per unit of output). with
examination of sufficient data to assign an emission rate that characterizes the industry,
sector or subsector, the net GHG emissions/removals associated with the project activity, in
excess of this benchmark, may be considered additional and credited.
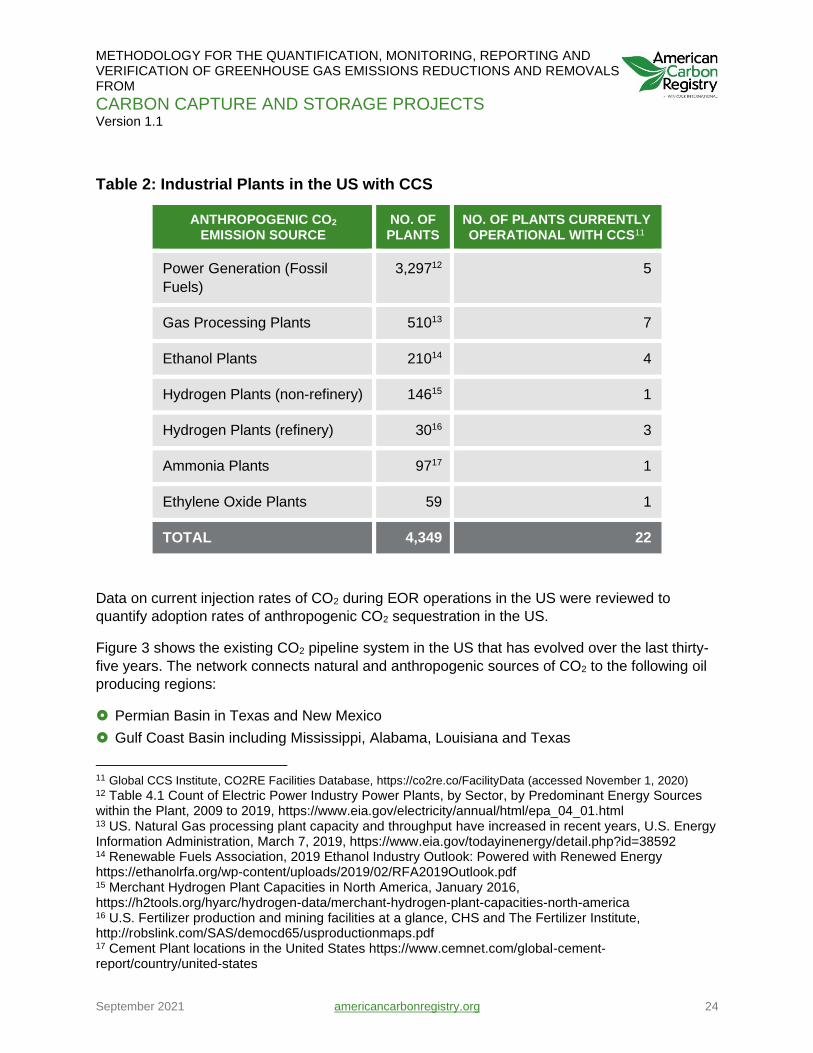
Qualifying CCS projects are those that include the capture, transport and storage of
anthropogenic CO2 in oil and gas reservoirs. In 2018, fossil fuel fired power generation, natural
gas processing, ethanol production, hydrogen production, cement production and fertilizer
production in the USA emitted an estimated 2000 MMT of CO2 into the atmosphere10. There are
currently 14 operational CCS projects spread across large scale commercial and utilization
facilities in the USA. An additional 9 CCS projects are operational as pilot and demonstration
CCS facilities. Table 2 below outlines the number of operational CCS projects in the USA from
anthropogenic CO2 emission sources. The volumes of anthropogenic CO2 sourced from gas
plants and used for EOR are greater than from other sources because of the proximity of gas
plants to oil and gas fields. Yet there are only 7 natural gas processing plants that are currently
supplying EOR, which is indicative of the low penetration rates in this industrial sector.
10 US EPA, Inventory of Greenhouse Gas Emissions and Sinks: 1990-2018
https://www.epa.gov/sites/production/files/2020-04/documents/us-ghg-inventory-2020-chapter-executive-summary.pdf
METHODOLOGY FOR THE QUANTIFICATION, MONITORING, REPORTING AND VERIFICATION OF GREENHOUSE GAS EMISSIONS REDUCTIONS AND REMOVALS FROM
CARBON CAPTURE AND STORAGE PROJECTS Version 1.1
September 2021 americancarbonregistry.org 24
Table 2: Industrial Plants in the US with CCS
ANTHROPOGENIC CO2
EMISSION SOURCE NO. OF PLANTS
NO. OF PLANTS CURRENTLY OPERATIONAL WITH CCS11
Power Generation (Fossil
Fuels)
3,29712 5
Gas Processing Plants 51013 7
Ethanol Plants 21014 4
Hydrogen Plants (non-refinery) 14615 1
Hydrogen Plants (refinery) 3016 3
Ammonia Plants 9717 1
Ethylene Oxide Plants 59 1
TOTAL 4,349 22
Data on current injection rates of CO2 during EOR operations in the US were reviewed to
quantify adoption rates of anthropogenic CO2 sequestration in the US.
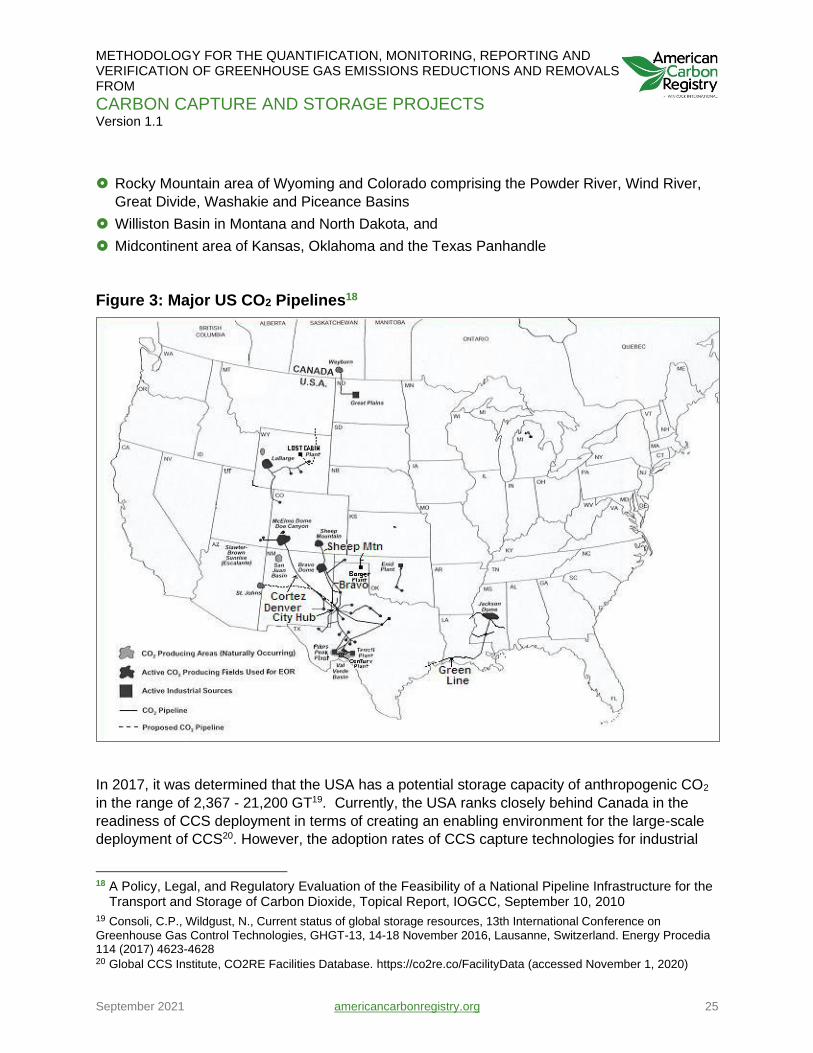
Figure 3 shows the existing CO2 pipeline system in the US that has evolved over the last thirty-
five years. The network connects natural and anthropogenic sources of CO2 to the following oil
producing regions:
Permian Basin in Texas and New Mexico
Gulf Coast Basin including Mississippi, Alabama, Louisiana and Texas
11 Global CCS Institute, CO2RE Facilities Database, https://co2re.co/FacilityData (accessed November 1, 2020) 12 Table 4.1 Count of Electric Power Industry Power Plants, by Sector, by Predominant Energy Sources within the Plant, 2009 to 2019, https://www.eia.gov/electricity/annual/html/epa_04_01.html 13 US. Natural Gas processing plant capacity and throughput have increased in recent years, U.S. Energy Information Administration, March 7, 2019, https://www.eia.gov/todayinenergy/detail.php?id=38592 14 Renewable Fuels Association, 2019 Ethanol Industry Outlook: Powered with Renewed Energy https://ethanolrfa.org/wp-content/uploads/2019/02/RFA2019Outlook.pdf 15 Merchant Hydrogen Plant Capacities in North America, January 2016, https://h2tools.org/hyarc/hydrogen-data/merchant-hydrogen-plant-capacities-north-america 16 U.S. Fertilizer production and mining facilities at a glance, CHS and The Fertilizer Institute, http://robslink.com/SAS/democd65/usproductionmaps.pdf 17 Cement Plant locations in the United States https://www.cemnet.com/global-cement-report/country/united-states
METHODOLOGY FOR THE QUANTIFICATION, MONITORING, REPORTING AND VERIFICATION OF GREENHOUSE GAS EMISSIONS REDUCTIONS AND REMOVALS FROM
CARBON CAPTURE AND STORAGE PROJECTS Version 1.1
September 2021 americancarbonregistry.org 25
Rocky Mountain area of Wyoming and Colorado comprising the Powder River, Wind River,
Great Divide, Washakie and Piceance Basins
Williston Basin in Montana and North Dakota, and
Midcontinent area of Kansas, Oklahoma and the Texas Panhandle
Figure 3: Major US CO2 Pipelines18
In 2017, it was determined that the USA has a potential storage capacity of anthropogenic CO2
in the range of 2,367 - 21,200 GT19. Currently, the USA ranks closely behind Canada in the
readiness of CCS deployment in terms of creating an enabling environment for the large-scale
deployment of CCS20. However, the adoption rates of CCS capture technologies for industrial
18 A Policy, Legal, and Regulatory Evaluation of the Feasibility of a National Pipeline Infrastructure for the
Transport and Storage of Carbon Dioxide, Topical Report, IOGCC, September 10, 2010
19 Consoli, C.P., Wildgust, N., Current status of global storage resources, 13th International Conference on
Greenhouse Gas Control Technologies, GHGT-13, 14-18 November 2016, Lausanne, Switzerland. Energy Procedia 114 (2017) 4623-4628 20 Global CCS Institute, CO2RE Facilities Database. https://co2re.co/FacilityData (accessed November 1, 2020)

METHODOLOGY FOR THE QUANTIFICATION, MONITORING, REPORTING AND VERIFICATION OF GREENHOUSE GAS EMISSIONS REDUCTIONS AND REMOVALS FROM
CARBON CAPTURE AND STORAGE PROJECTS Version 1.1
September 2021 americancarbonregistry.org 26
CO2 emission sources are extremely low, and the injection of anthropogenic CO2 in
hydrocarbon reservoirs during EOR is not common practice.
Based on these low penetration rates, it can be concluded that CCS projects meet a practice-
based performance standard and can be considered additional as long as they are not required
by regulation.

METHODOLOGY FOR THE QUANTIFICATION, MONITORING, REPORTING AND VERIFICATION OF GREENHOUSE GAS EMISSIONS REDUCTIONS AND REMOVALS FROM
CARBON CAPTURE AND STORAGE PROJECTS Version 1.1
September 2021 americancarbonregistry.org 27
4 QUANTIFICATION
METHODOLOGY
This section details the methods and equations to quantify baseline emissions, project
emissions, and emission reductions. These procedures and equations have been adapted from
the accounting framework developed by the Center for Climate and Energy Solutions.21 Project
Proponents shall determine which equations apply to their project based on an evaluation of
project and baseline configurations and on project-specific conditions. Figure 2 and Table 4 can
be used as an aid in this determination. Supplemental quantification methods are included in
Appendix B.
4.1 BASELINE EMISSIONS
Two approaches can be used to calculate baseline CO2 emissions – Projection-based and
Standards-based. To be conservative, the procedures do not calculate methane (CH4) or nitrous
oxide (N2O) emissions.
4.1.1 Functional Equivalence
The principle of functional equivalence dictates that the project and baseline shall provide the
same function while delivering comparable products in quality and quantity. In the case of CCS
projects, the implementation of CO2 capture infrastructure may result in changes to energy
consumption and/or product output, and impact the quantity of GHG emissions produced at the
capture site. Since the calculation of baseline emissions involves collecting and using actual
project data from the capture site, a Project Proponent could inaccurately quantify emissions
reductions from the CCS project if it does not appropriately maintain functional equivalence
between the baseline and project, and adjust applied data as necessary.
For example, in some project configurations, incremental emissions associated with operating
the capture system could yield an overall increase in CO2 production and result in a larger
volume of CO2 captured and processed, relative to what the primary process would have
emitted in the baseline. A power plant retrofitted with post-combustion CO2 capture, for
instance, that maintains (net) electricity production levels by burning additional coal to produce
steam and electricity to power the capture system would increase overall CO2 production. In this
21 A Greenhouse Gas Accounting Framework for Carbon Capture and Storage Projects, Center for
Climate and Energy Solutions, February, 2012
METHODOLOGY FOR THE QUANTIFICATION, MONITORING, REPORTING AND VERIFICATION OF GREENHOUSE GAS EMISSIONS REDUCTIONS AND REMOVALS FROM
CARBON CAPTURE AND STORAGE PROJECTS Version 1.1
September 2021 americancarbonregistry.org 28
case, using actual measured CO2 production values from the project to derive baseline
emissions could overestimate baseline emissions.
Alternatively, a similar power plant could burn an equivalent amount of coal as the pre-retrofit
plant and correspondingly produce the same amount of CO2 as the baseline. This might occur if
steam from the coal-fired boiler is directed toward the capture system to regenerate the CO2
absorber rather than the power cycle. Therefore, while the capture system would not cause an
increase in total CO2 production, it could lead to the generation of less electricity. In this case, if
a Project Proponent uses actual electricity production data to derive baseline emissions, it could
underestimate baseline emissions.
In other project configurations, some or all of the incremental energy needed to meet the
demands of the CO2 capture system could be provided through separately powered systems,
including process heaters, boilers, engines, turbines or other fossil fuel-fired equipment. In this
case, the corresponding CO2 emissions streams would likely be separate from the captured
CO2 from the primary process.
Project Proponents shall adjust actual project data relied upon to quantify baseline emissions, if
necessary. This is done to ensure that the quantified emissions reductions appropriately
represent the impact of the CCS project and that the comparison between project and baseline
emissions maintains functional equivalence.
In some cases, baseline emissions may have to be modified to ensure that projects are not
being credited for capture and storage of excess CO2 emissions, i.e., additional CO2 emissions
that could result from poor or negligent operation of the primary process, or from not meeting
existing regulations mandating the use of certain technologies, or regulations directly controlling
CO2 emissions or directly controlling other pollutant emissions which indirectly affect CO2
emissions. The Project Proponent shall provide evidence that the primary process facility was
built and is being operated in accordance with its permit requirements and that there were no
violations of process conditions or exceedances in emissions of CO2 and other pollutants. If a
violation occurred then the effect on CO2 emissions shall be evaluated and any increases in
CO2 over normal operations for that time period will be deducted from baseline emissions.
4.1.2 Calculation Procedure for
Projection-based Baseline
The Projection-based baseline uses actual GHG emissions from the project to represent what
would have occurred in the absence of CCS. The procedure involves multiplying the amount of
actual CO2 produced by the primary process, measured immediately downstream of the primary
process, by an adjustment factor that accounts for incremental changes in CO2 produced by the
capture equipment and included in the measured CO2 stream. As discussed above, the
adjustment factor is a part of the equation to maintain functional equivalence between the
baseline and project. Project Proponents would determine the appropriate way to correct
METHODOLOGY FOR THE QUANTIFICATION, MONITORING, REPORTING AND VERIFICATION OF GREENHOUSE GAS EMISSIONS REDUCTIONS AND REMOVALS FROM
CARBON CAPTURE AND STORAGE PROJECTS Version 1.1
September 2021 americancarbonregistry.org 29
measured CO2 emissions on a project-by-project basis and justify to the validation/verification
body (VVB) how the adjustment factors applied have maintained functional equivalence
between the baseline and project scenarios.
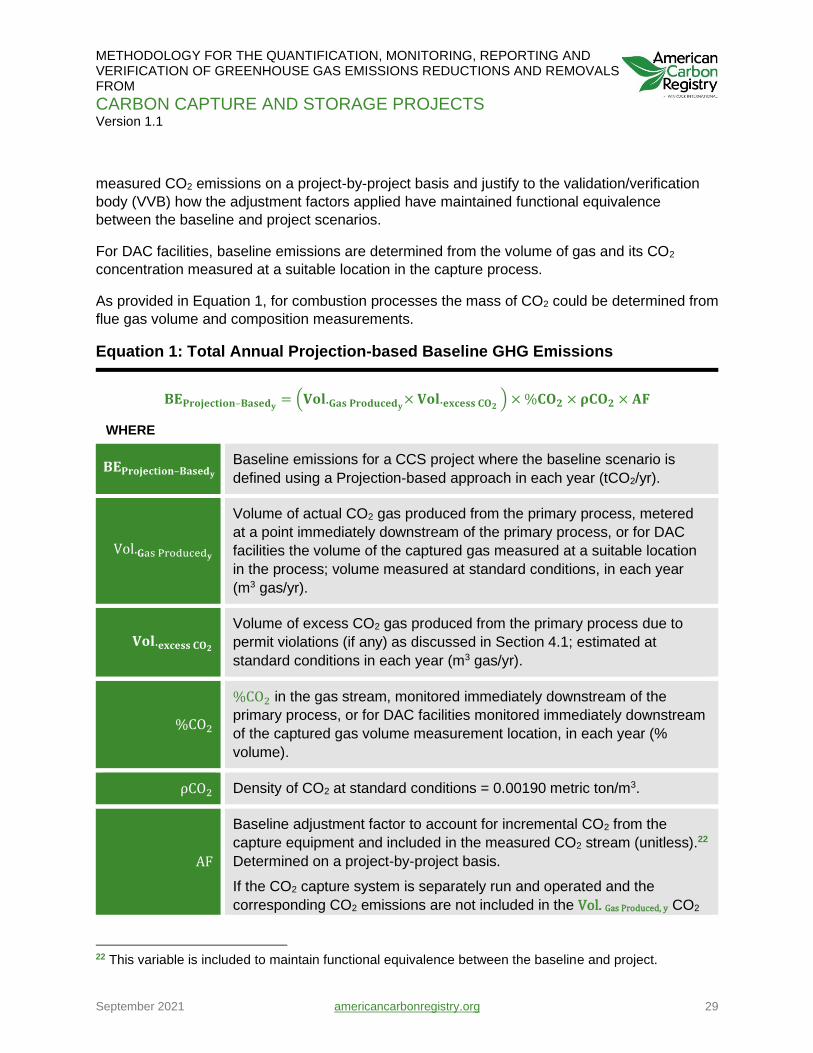
For DAC facilities, baseline emissions are determined from the volume of gas and its CO2
concentration measured at a suitable location in the capture process.
As provided in Equation 1, for combustion processes the mass of CO2 could be determined from
flue gas volume and composition measurements.
Equation 1: Total Annual Projection-based Baseline GHG Emissions
𝐁𝐄𝐏𝐫𝐨𝐣𝐞𝐜𝐭𝐢𝐨𝐧–𝐁𝐚𝐬𝐞𝐝𝐲= (𝐕𝐨𝐥.𝐆𝐚𝐬 𝐏𝐫𝐨𝐝𝐮𝐜𝐞𝐝𝐲
× 𝐕𝐨𝐥.𝐞𝐱𝐜𝐞𝐬𝐬 𝐂𝐎𝟐) × %𝐂𝐎𝟐 × 𝛒𝐂𝐎𝟐 × 𝐀𝐅
WHERE
𝐁𝐄𝐏𝐫𝐨𝐣𝐞𝐜𝐭𝐢𝐨𝐧–𝐁𝐚𝐬𝐞𝐝𝐲 Baseline emissions for a CCS project where the baseline scenario is
defined using a Projection-based approach in each year (tCO2/yr).
Vol.𝐆as Produced𝐲
Volume of actual CO2 gas produced from the primary process, metered
at a point immediately downstream of the primary process, or for DAC
facilities the volume of the captured gas measured at a suitable location
in the process; volume measured at standard conditions, in each year
(m3 gas/yr).
𝐕𝐨𝐥.𝐞𝐱𝐜𝐞𝐬𝐬 𝐂𝐎𝟐
Volume of excess CO2 gas produced from the primary process due to
permit violations (if any) as discussed in Section 4.1; estimated at
standard conditions in each year (m3 gas/yr).
%CO2
%CO2 in the gas stream, monitored immediately downstream of the
primary process, or for DAC facilities monitored immediately downstream
of the captured gas volume measurement location, in each year (%
volume).
ρCO2 Density of CO2 at standard conditions = 0.00190 metric ton/m3.
AF
Baseline adjustment factor to account for incremental CO2 from the
capture equipment and included in the measured CO2 stream (unitless).22
Determined on a project-by-project basis.
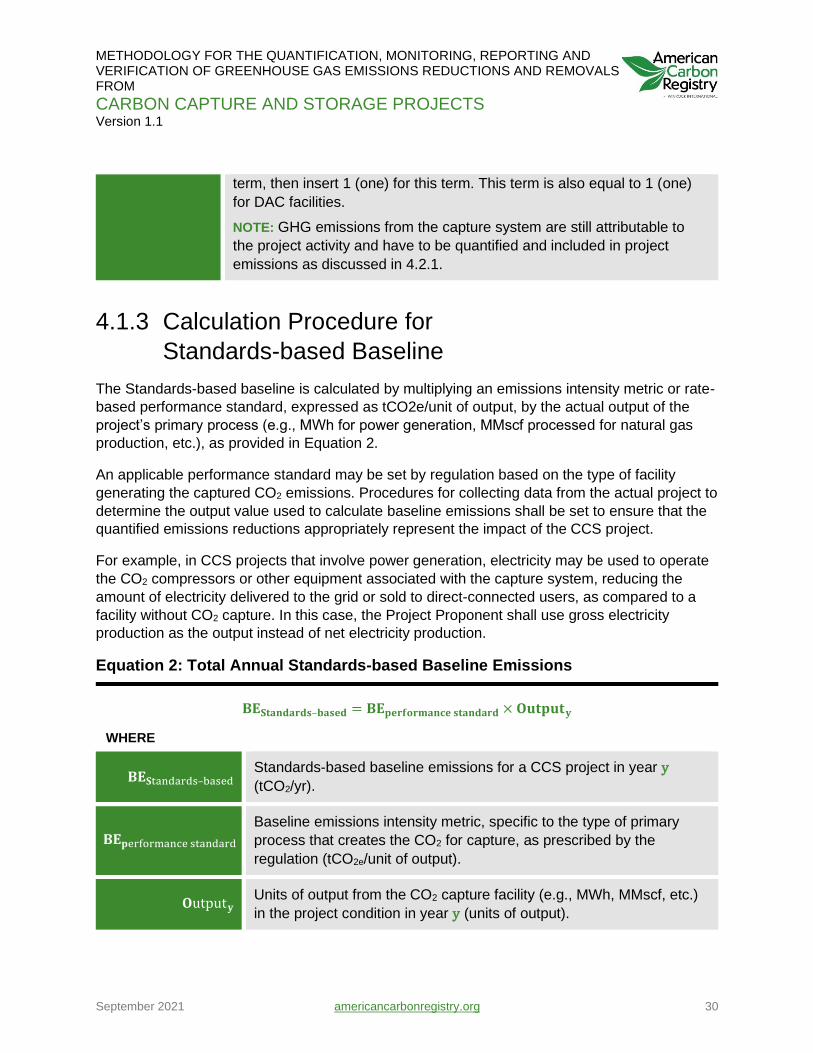
If the CO2 capture system is separately run and operated and the
corresponding CO2 emissions are not included in the Vol. Gas Produced, y CO2
22 This variable is included to maintain functional equivalence between the baseline and project.
METHODOLOGY FOR THE QUANTIFICATION, MONITORING, REPORTING AND VERIFICATION OF GREENHOUSE GAS EMISSIONS REDUCTIONS AND REMOVALS FROM
CARBON CAPTURE AND STORAGE PROJECTS Version 1.1
September 2021 americancarbonregistry.org 30
term, then insert 1 (one) for this term. This term is also equal to 1 (one)
for DAC facilities.
NOTE: GHG emissions from the capture system are still attributable to
the project activity and have to be quantified and included in project
emissions as discussed in 4.2.1.
4.1.3 Calculation Procedure for
Standards-based Baseline
The Standards-based baseline is calculated by multiplying an emissions intensity metric or rate-
based performance standard, expressed as tCO2e/unit of output, by the actual output of the
project’s primary process (e.g., MWh for power generation, MMscf processed for natural gas
production, etc.), as provided in Equation 2.
An applicable performance standard may be set by regulation based on the type of facility
generating the captured CO2 emissions. Procedures for collecting data from the actual project to
determine the output value used to calculate baseline emissions shall be set to ensure that the
quantified emissions reductions appropriately represent the impact of the CCS project.
For example, in CCS projects that involve power generation, electricity may be used to operate
the CO2 compressors or other equipment associated with the capture system, reducing the
amount of electricity delivered to the grid or sold to direct-connected users, as compared to a
facility without CO2 capture. In this case, the Project Proponent shall use gross electricity
production as the output instead of net electricity production.
Equation 2: Total Annual Standards-based Baseline Emissions
𝐁𝐄𝐒𝐭𝐚𝐧𝐝𝐚𝐫𝐝𝐬–𝐛𝐚𝐬𝐞𝐝 = 𝐁𝐄𝐩𝐞𝐫𝐟𝐨𝐫𝐦𝐚𝐧𝐜𝐞 𝐬𝐭𝐚𝐧𝐝𝐚𝐫𝐝 × 𝐎𝐮𝐭𝐩𝐮𝐭𝐲
WHERE
𝐁𝐄𝐒tandards–based Standards-based baseline emissions for a CCS project in year y
(tCO2/yr).
𝐁𝐄𝐩erformance standard Baseline emissions intensity metric, specific to the type of primary
process that creates the CO2 for capture, as prescribed by the
regulation (tCO2e/unit of output).
𝐎utput𝐲 Units of output from the CO2 capture facility (e.g., MWh, MMscf, etc.)
in the project condition in year y (units of output).
METHODOLOGY FOR THE QUANTIFICATION, MONITORING, REPORTING AND VERIFICATION OF GREENHOUSE GAS EMISSIONS REDUCTIONS AND REMOVALS FROM
CARBON CAPTURE AND STORAGE PROJECTS Version 1.1
September 2021 americancarbonregistry.org 31
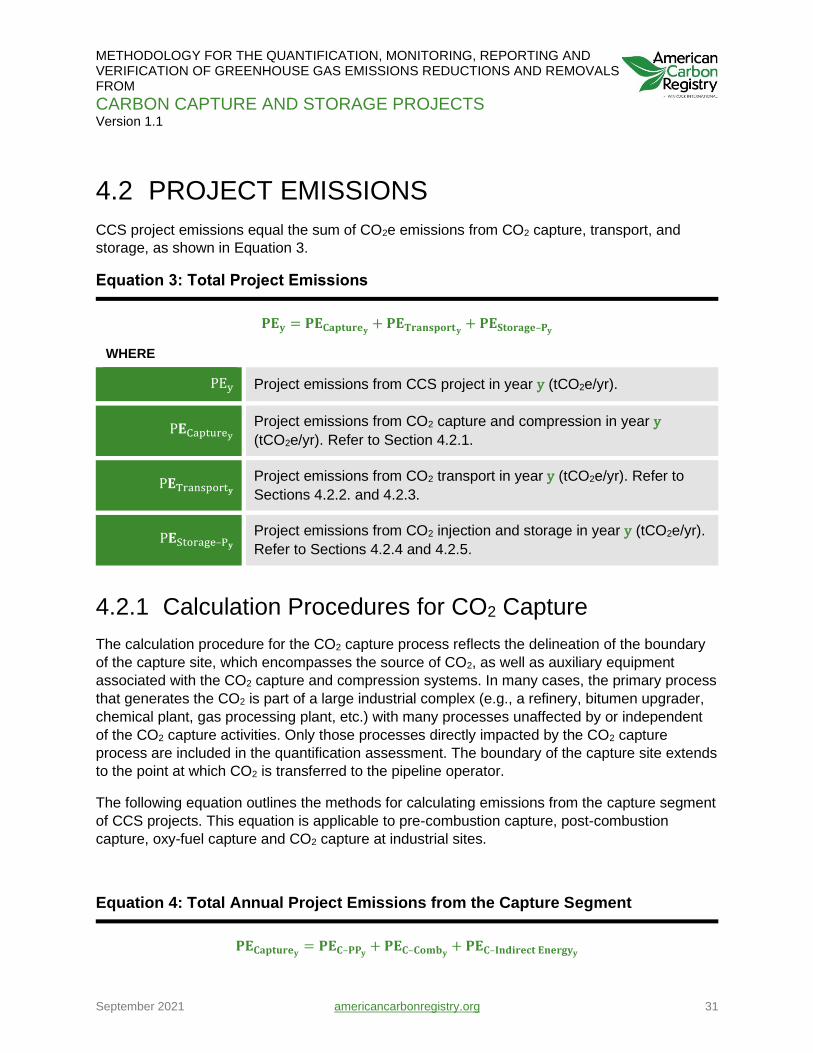
4.2 PROJECT EMISSIONS
CCS project emissions equal the sum of CO2e emissions from CO2 capture, transport, and
storage, as shown in Equation 3.
Equation 3: Total Project Emissions
𝐏𝐄𝐲 = 𝐏𝐄𝐂𝐚𝐩𝐭𝐮𝐫𝐞𝐲+ 𝐏𝐄𝐓𝐫𝐚𝐧𝐬𝐩𝐨𝐫𝐭𝐲
+ 𝐏𝐄𝐒𝐭𝐨𝐫𝐚𝐠𝐞–𝐏𝐲
WHERE
PEy Project emissions from CCS project in year y (tCO2e/yr).
P𝐄Capturey Project emissions from CO2 capture and compression in year y
(tCO2e/yr). Refer to Section 4.2.1.
P𝐄Transport𝐲 Project emissions from CO2 transport in year y (tCO2e/yr). Refer to
Sections 4.2.2. and 4.2.3.
P𝐄Storage–P𝐲
Project emissions from CO2 injection and storage in year y (tCO2e/yr).
Refer to Sections 4.2.4 and 4.2.5.
4.2.1 Calculation Procedures for CO2 Capture
The calculation procedure for the CO2 capture process reflects the delineation of the boundary
of the capture site, which encompasses the source of CO2, as well as auxiliary equipment
associated with the CO2 capture and compression systems. In many cases, the primary process
that generates the CO2 is part of a large industrial complex (e.g., a refinery, bitumen upgrader,
chemical plant, gas processing plant, etc.) with many processes unaffected by or independent
of the CO2 capture activities. Only those processes directly impacted by the CO2 capture
process are included in the quantification assessment. The boundary of the capture site extends
to the point at which CO2 is transferred to the pipeline operator.
The following equation outlines the methods for calculating emissions from the capture segment
of CCS projects. This equation is applicable to pre-combustion capture, post-combustion
capture, oxy-fuel capture and CO2 capture at industrial sites.
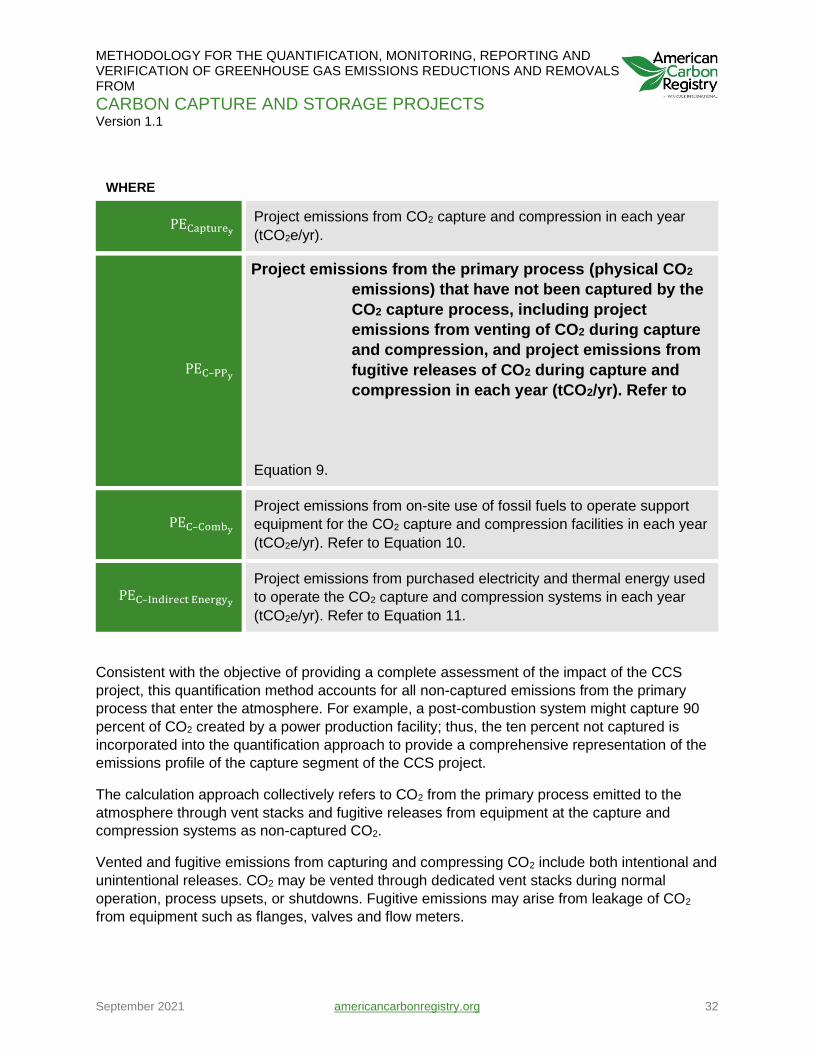
Equation 4: Total Annual Project Emissions from the Capture Segment
𝐏𝐄𝐂𝐚𝐩𝐭𝐮𝐫𝐞𝐲= 𝐏𝐄𝐂–𝐏𝐏𝐲
+ 𝐏𝐄𝐂–𝐂𝐨𝐦𝐛𝐲+ 𝐏𝐄𝐂–𝐈𝐧𝐝𝐢𝐫𝐞𝐜𝐭 𝐄𝐧𝐞𝐫𝐠𝐲𝐲
METHODOLOGY FOR THE QUANTIFICATION, MONITORING, REPORTING AND VERIFICATION OF GREENHOUSE GAS EMISSIONS REDUCTIONS AND REMOVALS FROM
CARBON CAPTURE AND STORAGE PROJECTS Version 1.1
September 2021 americancarbonregistry.org 32
WHERE
PECapture𝐲 Project emissions from CO2 capture and compression in each year
(tCO2e/yr).
PEC–PPy
Project emissions from the primary process (physical CO2
emissions) that have not been captured by the
CO2 capture process, including project
emissions from venting of CO2 during capture
and compression, and project emissions from
fugitive releases of CO2 during capture and
compression in each year (tCO2/yr). Refer to
Equation 9.
PEC–Comby
Project emissions from on-site use of fossil fuels to operate support
equipment for the CO2 capture and compression facilities in each year
(tCO2e/yr). Refer to Equation 10.
PEC–Indirect Energyy
Project emissions from purchased electricity and thermal energy used
to operate the CO2 capture and compression systems in each year
(tCO2e/yr). Refer to Equation 11.
Consistent with the objective of providing a complete assessment of the impact of the CCS
project, this quantification method accounts for all non-captured emissions from the primary
process that enter the atmosphere. For example, a post-combustion system might capture 90
percent of CO2 created by a power production facility; thus, the ten percent not captured is
incorporated into the quantification approach to provide a comprehensive representation of the
emissions profile of the capture segment of the CCS project.
The calculation approach collectively refers to CO2 from the primary process emitted to the
atmosphere through vent stacks and fugitive releases from equipment at the capture and
compression systems as non-captured CO2.
Vented and fugitive emissions from capturing and compressing CO2 include both intentional and
unintentional releases. CO2 may be vented through dedicated vent stacks during normal
operation, process upsets, or shutdowns. Fugitive emissions may arise from leakage of CO2
from equipment such as flanges, valves and flow meters.
METHODOLOGY FOR THE QUANTIFICATION, MONITORING, REPORTING AND VERIFICATION OF GREENHOUSE GAS EMISSIONS REDUCTIONS AND REMOVALS FROM
CARBON CAPTURE AND STORAGE PROJECTS Version 1.1
September 2021 americancarbonregistry.org 33
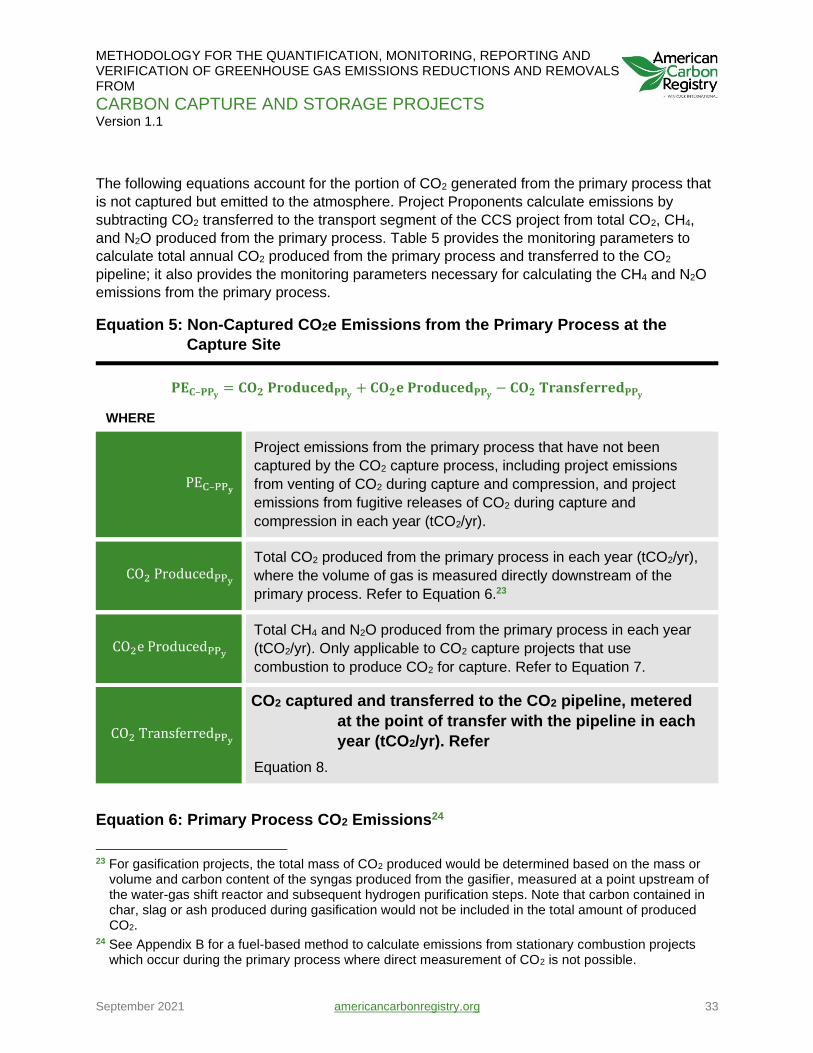
The following equations account for the portion of CO2 generated from the primary process that
is not captured but emitted to the atmosphere. Project Proponents calculate emissions by
subtracting CO2 transferred to the transport segment of the CCS project from total CO2, CH4,
and N2O produced from the primary process. Table 5 provides the monitoring parameters to
calculate total annual CO2 produced from the primary process and transferred to the CO2
pipeline; it also provides the monitoring parameters necessary for calculating the CH4 and N2O
emissions from the primary process.
Equation 5: Non-Captured CO2e Emissions from the Primary Process at the
Capture Site
𝐏𝐄𝐂–𝐏𝐏𝐲= 𝐂𝐎𝟐 𝐏𝐫𝐨𝐝𝐮𝐜𝐞𝐝𝐏𝐏𝐲
+ 𝐂𝐎𝟐𝐞 𝐏𝐫𝐨𝐝𝐮𝐜𝐞𝐝𝐏𝐏𝐲− 𝐂𝐎𝟐 𝐓𝐫𝐚𝐧𝐬𝐟𝐞𝐫𝐫𝐞𝐝𝐏𝐏𝐲
WHERE
PEC–PP𝐲
Project emissions from the primary process that have not been
captured by the CO2 capture process, including project emissions
from venting of CO2 during capture and compression, and project
emissions from fugitive releases of CO2 during capture and
compression in each year (tCO2/yr).
CO2 ProducedPPy
Total CO2 produced from the primary process in each year (tCO2/yr),
where the volume of gas is measured directly downstream of the
primary process. Refer to Equation 6.23
CO2e ProducedPPy
Total CH4 and N2O produced from the primary process in each year
(tCO2/yr). Only applicable to CO2 capture projects that use
combustion to produce CO2 for capture. Refer to Equation 7.
CO2 TransferredPPy
CO2 captured and transferred to the CO2 pipeline, metered
at the point of transfer with the pipeline in each
year (tCO2/yr). Refer
Equation 8.
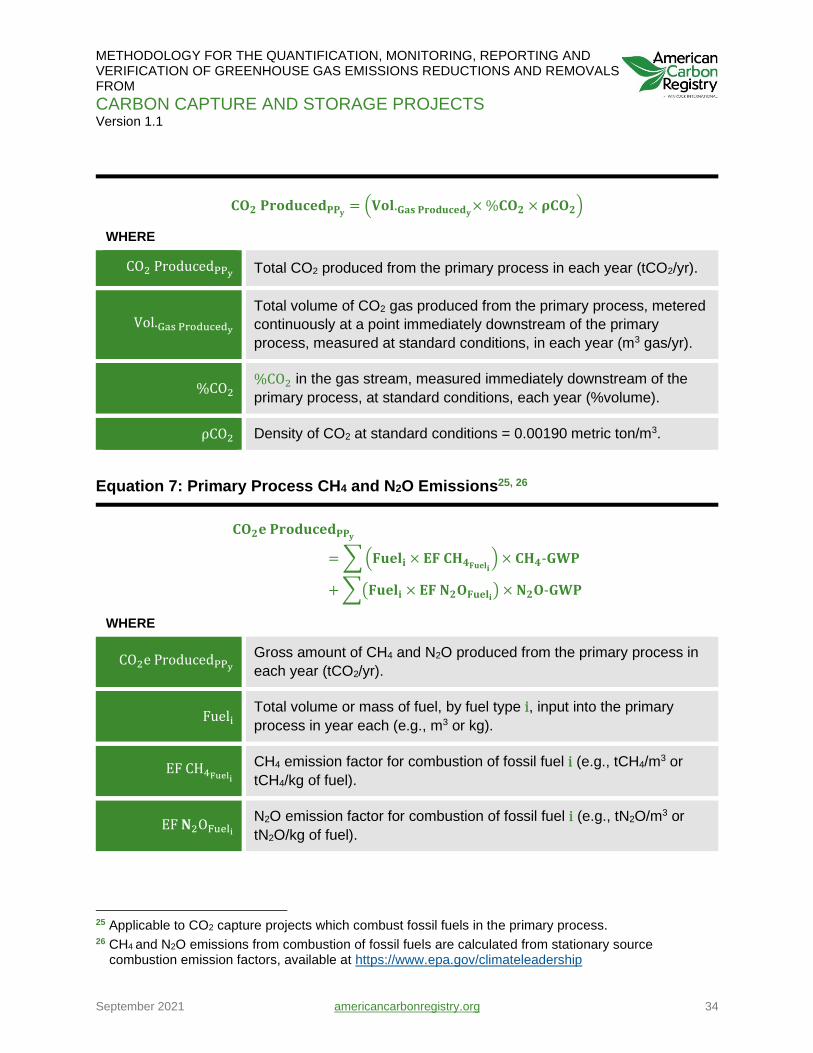
Equation 6: Primary Process CO2 Emissions24
23 For gasification projects, the total mass of CO2 produced would be determined based on the mass or
volume and carbon content of the syngas produced from the gasifier, measured at a point upstream of the water-gas shift reactor and subsequent hydrogen purification steps. Note that carbon contained in char, slag or ash produced during gasification would not be included in the total amount of produced CO2.
24 See Appendix B for a fuel-based method to calculate emissions from stationary combustion projects which occur during the primary process where direct measurement of CO2 is not possible.
METHODOLOGY FOR THE QUANTIFICATION, MONITORING, REPORTING AND VERIFICATION OF GREENHOUSE GAS EMISSIONS REDUCTIONS AND REMOVALS FROM
CARBON CAPTURE AND STORAGE PROJECTS Version 1.1
September 2021 americancarbonregistry.org 34
𝐂𝐎𝟐 𝐏𝐫𝐨𝐝𝐮𝐜𝐞𝐝𝐏𝐏𝐲= (𝐕𝐨𝐥.𝐆𝐚𝐬 𝐏𝐫𝐨𝐝𝐮𝐜𝐞𝐝𝐲
× %𝐂𝐎𝟐 × 𝛒𝐂𝐎𝟐)
WHERE
CO2 ProducedPPy Total CO2 produced from the primary process in each year (tCO2/yr).
Vol.Gas Producedy
Total volume of CO2 gas produced from the primary process, metered
continuously at a point immediately downstream of the primary
process, measured at standard conditions, in each year (m3 gas/yr).
%CO2 %CO2 in the gas stream, measured immediately downstream of the
primary process, at standard conditions, each year (%volume).
ρCO2 Density of CO2 at standard conditions = 0.00190 metric ton/m3.
Equation 7: Primary Process CH4 and N2O Emissions25, 26
𝐂𝐎𝟐𝐞 𝐏𝐫𝐨𝐝𝐮𝐜𝐞𝐝𝐏𝐏𝐲
= ∑ (𝐅𝐮𝐞𝐥𝐢 × 𝐄𝐅 𝐂𝐇𝟒𝐅𝐮𝐞𝐥𝐢) × 𝐂𝐇𝟒-𝐆𝐖𝐏
+ ∑(𝐅𝐮𝐞𝐥𝐢 × 𝐄𝐅 𝐍𝟐𝐎𝐅𝐮𝐞𝐥𝐢) × 𝐍𝟐𝐎-𝐆𝐖𝐏
WHERE
CO2e ProducedPPy Gross amount of CH4 and N2O produced from the primary process in
each year (tCO2/yr).
Fueli Total volume or mass of fuel, by fuel type i, input into the primary
process in year each (e.g., m3 or kg).
EF CH4Fueli CH4 emission factor for combustion of fossil fuel i (e.g., tCH4/m3 or
tCH4/kg of fuel).
EF 𝐍2OFueli
N2O emission factor for combustion of fossil fuel i (e.g., tN2O/m3 or
tN2O/kg of fuel).
25 Applicable to CO2 capture projects which combust fossil fuels in the primary process. 26 CH4 and N2O emissions from combustion of fossil fuels are calculated from stationary source
combustion emission factors, available at https://www.epa.gov/climateleadership
METHODOLOGY FOR THE QUANTIFICATION, MONITORING, REPORTING AND VERIFICATION OF GREENHOUSE GAS EMISSIONS REDUCTIONS AND REMOVALS FROM
CARBON CAPTURE AND STORAGE PROJECTS Version 1.1
September 2021 americancarbonregistry.org 35
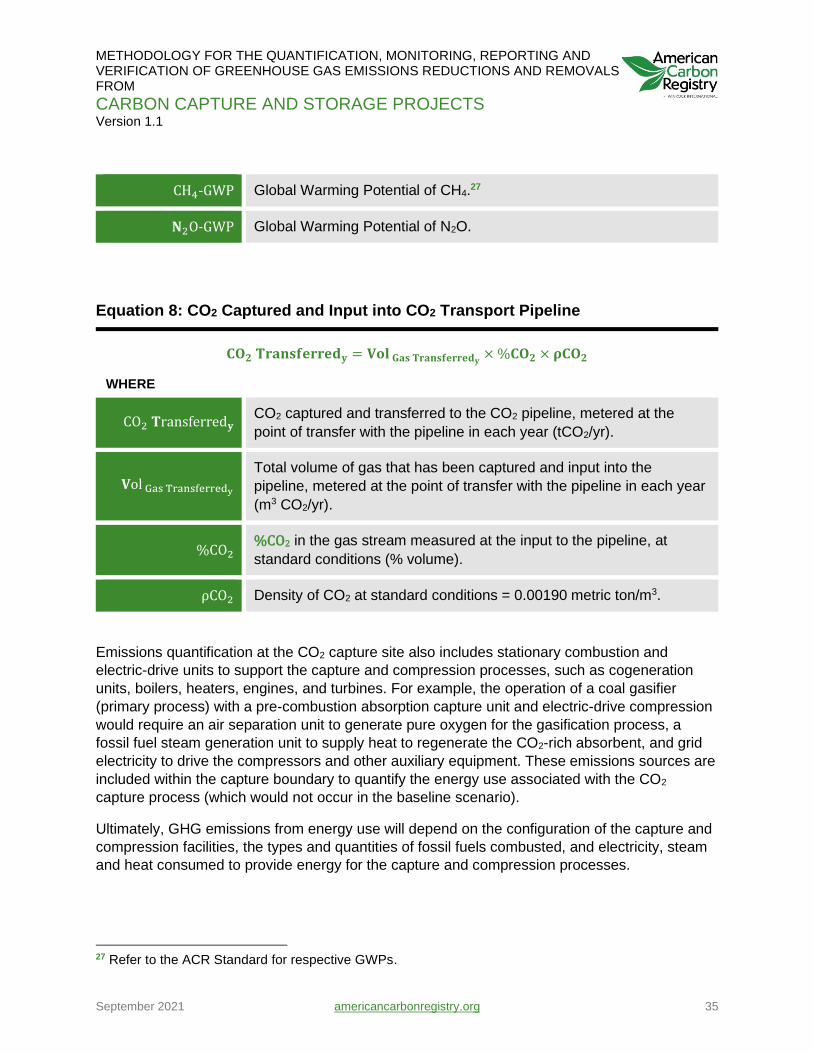
CH4-GWP Global Warming Potential of CH4.27
𝐍2O-GWP Global Warming Potential of N2O.
Equation 8: CO2 Captured and Input into CO2 Transport Pipeline
𝐂𝐎𝟐 𝐓𝐫𝐚𝐧𝐬𝐟𝐞𝐫𝐫𝐞𝐝𝐲 = 𝐕𝐨𝐥 𝐆𝐚𝐬 𝐓𝐫𝐚𝐧𝐬𝐟𝐞𝐫𝐫𝐞𝐝𝐲× %𝐂𝐎𝟐 × 𝛒𝐂𝐎𝟐
WHERE
CO2 𝐓ransferred𝐲 CO2 captured and transferred to the CO2 pipeline, metered at the
point of transfer with the pipeline in each year (tCO2/yr).
𝐕ol Gas Transferredy
Total volume of gas that has been captured and input into the
pipeline, metered at the point of transfer with the pipeline in each year
(m3 CO2/yr).
%CO2 %CO2 in the gas stream measured at the input to the pipeline, at
standard conditions (% volume).
ρCO2 Density of CO2 at standard conditions = 0.00190 metric ton/m3.
Emissions quantification at the CO2 capture site also includes stationary combustion and
electric-drive units to support the capture and compression processes, such as cogeneration
units, boilers, heaters, engines, and turbines. For example, the operation of a coal gasifier
(primary process) with a pre-combustion absorption capture unit and electric-drive compression
would require an air separation unit to generate pure oxygen for the gasification process, a
fossil fuel steam generation unit to supply heat to regenerate the CO2-rich absorbent, and grid
electricity to drive the compressors and other auxiliary equipment. These emissions sources are
included within the capture boundary to quantify the energy use associated with the CO2
capture process (which would not occur in the baseline scenario).
Ultimately, GHG emissions from energy use will depend on the configuration of the capture and
compression facilities, the types and quantities of fossil fuels combusted, and electricity, steam
and heat consumed to provide energy for the capture and compression processes.
27 Refer to the ACR Standard for respective GWPs.
METHODOLOGY FOR THE QUANTIFICATION, MONITORING, REPORTING AND VERIFICATION OF GREENHOUSE GAS EMISSIONS REDUCTIONS AND REMOVALS FROM
CARBON CAPTURE AND STORAGE PROJECTS Version 1.1
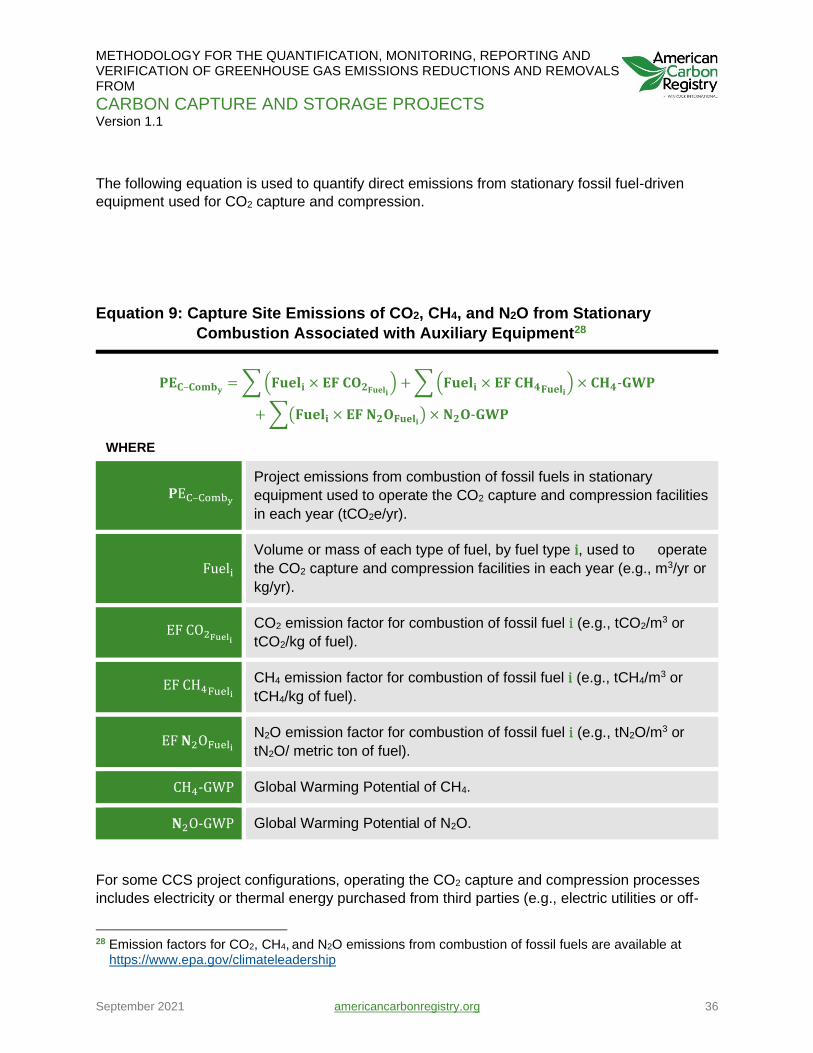
September 2021 americancarbonregistry.org 36
The following equation is used to quantify direct emissions from stationary fossil fuel-driven
equipment used for CO2 capture and compression.
Equation 9: Capture Site Emissions of CO2, CH4, and N2O from Stationary
Combustion Associated with Auxiliary Equipment28
𝐏𝐄𝐂–𝐂𝐨𝐦𝐛𝐲= ∑ (𝐅𝐮𝐞𝐥𝐢 × 𝐄𝐅 𝐂𝐎𝟐𝐅𝐮𝐞𝐥𝐢
) + ∑ (𝐅𝐮𝐞𝐥𝐢 × 𝐄𝐅 𝐂𝐇𝟒𝐅𝐮𝐞𝐥𝐢) × 𝐂𝐇𝟒-𝐆𝐖𝐏
+ ∑(𝐅𝐮𝐞𝐥𝐢 × 𝐄𝐅 𝐍𝟐𝐎𝐅𝐮𝐞𝐥𝐢) × 𝐍𝟐𝐎-𝐆𝐖𝐏
WHERE
𝐏EC–Comby
Project emissions from combustion of fossil fuels in stationary
equipment used to operate the CO2 capture and compression facilities
in each year (tCO2e/yr).
Fueli
Volume or mass of each type of fuel, by fuel type i, used to operate
the CO2 capture and compression facilities in each year (e.g., m3/yr or
kg/yr).
EF CO2Fueli CO2 emission factor for combustion of fossil fuel i (e.g., tCO2/m3 or
tCO2/kg of fuel).
EF CH4Fueli
CH4 emission factor for combustion of fossil fuel i (e.g., tCH4/m3 or
tCH4/kg of fuel).
EF 𝐍2OFueli
N2O emission factor for combustion of fossil fuel i (e.g., tN2O/m3 or
tN2O/ metric ton of fuel).
CH4-GWP Global Warming Potential of CH4.
𝐍2O-GWP Global Warming Potential of N2O.
For some CCS project configurations, operating the CO2 capture and compression processes
includes electricity or thermal energy purchased from third parties (e.g., electric utilities or off-
28 Emission factors for CO2, CH4, and N2O emissions from combustion of fossil fuels are available at
https://www.epa.gov/climateleadership

METHODOLOGY FOR THE QUANTIFICATION, MONITORING, REPORTING AND VERIFICATION OF GREENHOUSE GAS EMISSIONS REDUCTIONS AND REMOVALS FROM
CARBON CAPTURE AND STORAGE PROJECTS Version 1.1
September 2021 americancarbonregistry.org 37
site co-generation facilities). Specifically, electricity may be used to operate the compressors,
dehydration units, refrigeration units, circulation pumps, fans, air separation units and a variety
of other equipment. Purchased steam may be used for various purposes, including regeneration
of the CO2-rich absorbent used for a post-combustion capture configuration. Electricity may be
sourced from direct-connected generating facilities or from the regional electricity grid, while
thermal energy may be sourced from nearby steam generators or cogeneration facilities.
Thermal energy and electricity may be sourced from separate facilities or sourced from the
same combined heat and power generation (cogeneration) facility.
Indirect emissions associated with purchased energy inputs used to operate the CO2 capture
and compression processes may need to be quantified according to Equation 10, Equation 11,
Equation 12, and Equation 13. Table 5 provides the monitoring parameters to calculate CO2
emissions from purchased and consumed electricity, steam and heat.
EMISSION FACTOR FOR ELECTRICITY GENERATION (EFELECTRICITY)
In Equation 11, the emission factor for electricity generation is determined using data from the
USEPA’s Emissions & Generation Resource Integrated Database (eGRID). eGRID is a
comprehensive source of data on the environmental characteristics of electric power generated
in the United States, including emissions of nitrogen oxides, sulfur dioxide, carbon dioxide,
methane, and nitrous oxide, net generation, resource mix, and other attributes.29 As of adoption
of this methodology, the latest release is the eGRID2019, containing data through 2019. The
latest published version of eGRID shall always be used.
eGRID2019 provides data organized by balancing authority area (BAA), North American Electric
Reliability Corporation (NERC) region, eGRID subregion, U.S. state, and other levels of
aggregation. The BAA, eGRID subregion, and NERC region data are based on electricity
generation, transmission and distribution areas, so effectively represent the emissions associated
with the mix of GHG-emitting and non-emitting resources used to serve electricity loads in those
areas.
The Project Proponent shall use emission factors from the latest version of eGRID available. The
Proponent shall download, from the eGRID website39, the data files spreadsheet.
The emission factor is selected in the order of preference below; i.e., if the BBA can be identified
the emission factor from this tab must be used. Only if it is not possible to use the preferred level
of aggregation is it permitted to move to the next level.
1. In eGRID2019, the BA19 tab has data for 76 Balancing Authority Areas across the
United States. This methodology considers those BAA emission factors to be the most
precise representation of emissions and thus requires the BAA emission rate to be
used as long as the BAA can be identified. In the BA19 tab, look up the appropriate
BAA in the left-hand column and scroll across to the column entitled “BAA annual CO2
29 See http://www.epa.gov/cleanenergy/energy-resources/egrid/index.html.
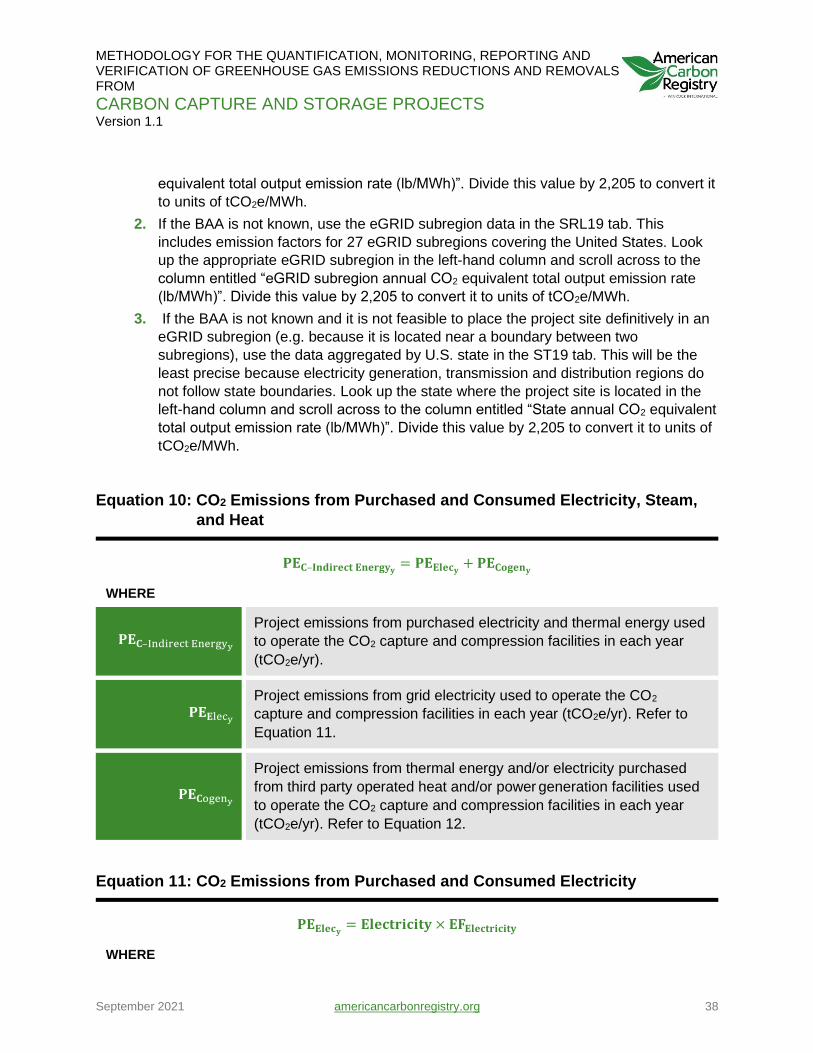
METHODOLOGY FOR THE QUANTIFICATION, MONITORING, REPORTING AND VERIFICATION OF GREENHOUSE GAS EMISSIONS REDUCTIONS AND REMOVALS FROM
CARBON CAPTURE AND STORAGE PROJECTS Version 1.1
September 2021 americancarbonregistry.org 38
equivalent total output emission rate (lb/MWh)”. Divide this value by 2,205 to convert it
to units of tCO2e/MWh.
2. If the BAA is not known, use the eGRID subregion data in the SRL19 tab. This
includes emission factors for 27 eGRID subregions covering the United States. Look
up the appropriate eGRID subregion in the left-hand column and scroll across to the
column entitled “eGRID subregion annual CO2 equivalent total output emission rate
(lb/MWh)”. Divide this value by 2,205 to convert it to units of tCO2e/MWh.
3. If the BAA is not known and it is not feasible to place the project site definitively in an
eGRID subregion (e.g. because it is located near a boundary between two
subregions), use the data aggregated by U.S. state in the ST19 tab. This will be the
least precise because electricity generation, transmission and distribution regions do
not follow state boundaries. Look up the state where the project site is located in the
left-hand column and scroll across to the column entitled “State annual CO2 equivalent
total output emission rate (lb/MWh)”. Divide this value by 2,205 to convert it to units of
tCO2e/MWh.
Equation 10: CO2 Emissions from Purchased and Consumed Electricity, Steam,
and Heat
𝐏𝐄𝐂–𝐈𝐧𝐝𝐢𝐫𝐞𝐜𝐭 𝐄𝐧𝐞𝐫𝐠𝐲𝐲= 𝐏𝐄𝐄𝐥𝐞𝐜𝐲
+ 𝐏𝐄𝐂𝐨𝐠𝐞𝐧𝐲
WHERE
𝐏𝐄𝐂–Indirect Energyy
Project emissions from purchased electricity and thermal energy used
to operate the CO2 capture and compression facilities in each year
(tCO2e/yr).
𝐏𝐄𝐄lecy
Project emissions from grid electricity used to operate the CO2
capture and compression facilities in each year (tCO2e/yr). Refer to
Equation 11.
𝐏𝐄𝐂ogeny
Project emissions from thermal energy and/or electricity purchased
from third party operated heat and/or power generation facilities used
to operate the CO2 capture and compression facilities in each year
(tCO2e/yr). Refer to Equation 12.
Equation 11: CO2 Emissions from Purchased and Consumed Electricity
𝐏𝐄𝐄𝐥𝐞𝐜𝐲= 𝐄𝐥𝐞𝐜𝐭𝐫𝐢𝐜𝐢𝐭𝐲 × 𝐄𝐅𝐄𝐥𝐞𝐜𝐭𝐫𝐢𝐜𝐢𝐭𝐲
WHERE
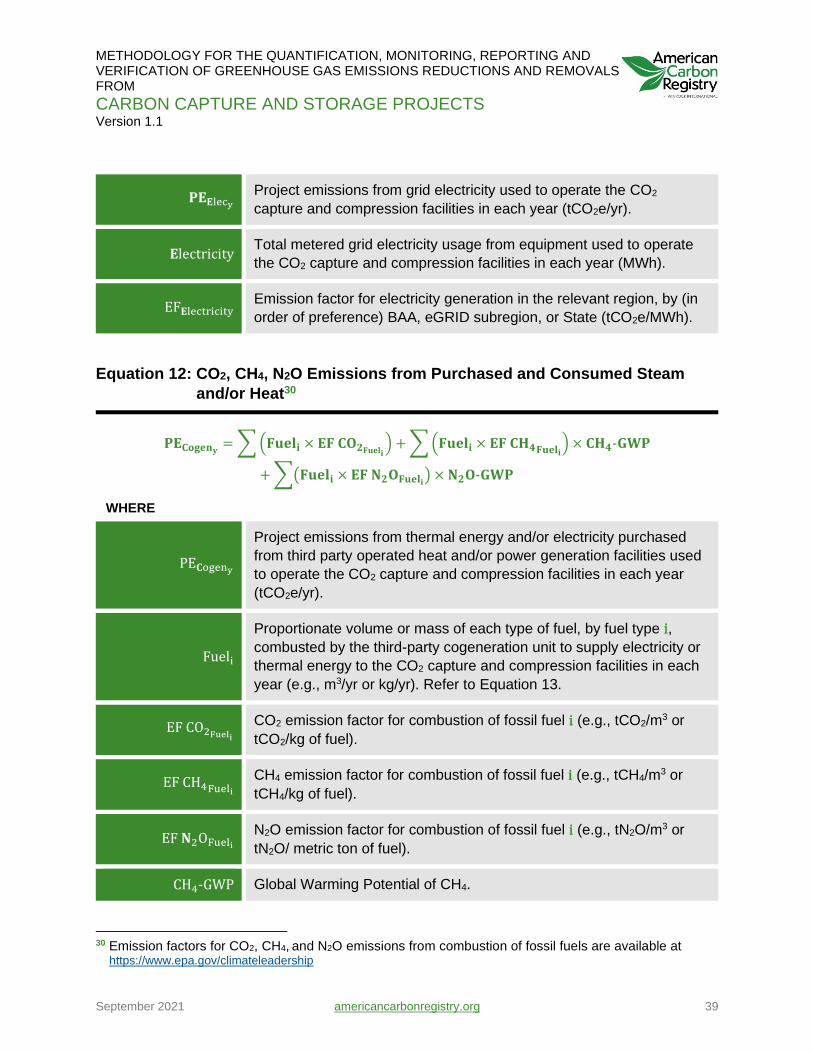
METHODOLOGY FOR THE QUANTIFICATION, MONITORING, REPORTING AND VERIFICATION OF GREENHOUSE GAS EMISSIONS REDUCTIONS AND REMOVALS FROM
CARBON CAPTURE AND STORAGE PROJECTS Version 1.1
September 2021 americancarbonregistry.org 39
𝐏𝐄𝐄lecy Project emissions from grid electricity used to operate the CO2
capture and compression facilities in each year (tCO2e/yr).
𝐄lectricity Total metered grid electricity usage from equipment used to operate
the CO2 capture and compression facilities in each year (MWh).
EF𝐄lectricity Emission factor for electricity generation in the relevant region, by (in
order of preference) BAA, eGRID subregion, or State (tCO2e/MWh).
Equation 12: CO2, CH4, N2O Emissions from Purchased and Consumed Steam
and/or Heat30
𝐏𝐄𝐂𝐨𝐠𝐞𝐧𝐲= ∑ (𝐅𝐮𝐞𝐥𝐢 × 𝐄𝐅 𝐂𝐎𝟐𝐅𝐮𝐞𝐥𝐢
) + ∑ (𝐅𝐮𝐞𝐥𝐢 × 𝐄𝐅 𝐂𝐇𝟒𝐅𝐮𝐞𝐥𝐢) × 𝐂𝐇𝟒-𝐆𝐖𝐏
+ ∑(𝐅𝐮𝐞𝐥𝐢 × 𝐄𝐅 𝐍𝟐𝐎𝐅𝐮𝐞𝐥𝐢) × 𝐍𝟐𝐎-𝐆𝐖𝐏
WHERE
PE𝐂ogeny
Project emissions from thermal energy and/or electricity purchased
from third party operated heat and/or power generation facilities used
to operate the CO2 capture and compression facilities in each year
(tCO2e/yr).
Fueli
Proportionate volume or mass of each type of fuel, by fuel type i,
combusted by the third-party cogeneration unit to supply electricity or
thermal energy to the CO2 capture and compression facilities in each
year (e.g., m3/yr or kg/yr). Refer to Equation 13.
EF CO2Fueli CO2 emission factor for combustion of fossil fuel i (e.g., tCO2/m3 or
tCO2/kg of fuel).
EF CH4Fueli
CH4 emission factor for combustion of fossil fuel i (e.g., tCH4/m3 or
tCH4/kg of fuel).
EF 𝐍2OFueli
N2O emission factor for combustion of fossil fuel i (e.g., tN2O/m3 or
tN2O/ metric ton of fuel).
CH4-GWP Global Warming Potential of CH4.
30 Emission factors for CO2, CH4, and N2O emissions from combustion of fossil fuels are available at
https://www.epa.gov/climateleadership

METHODOLOGY FOR THE QUANTIFICATION, MONITORING, REPORTING AND VERIFICATION OF GREENHOUSE GAS EMISSIONS REDUCTIONS AND REMOVALS FROM
CARBON CAPTURE AND STORAGE PROJECTS Version 1.1
September 2021 americancarbonregistry.org 40
𝐍2O-GWP Global Warming Potential of N2O.
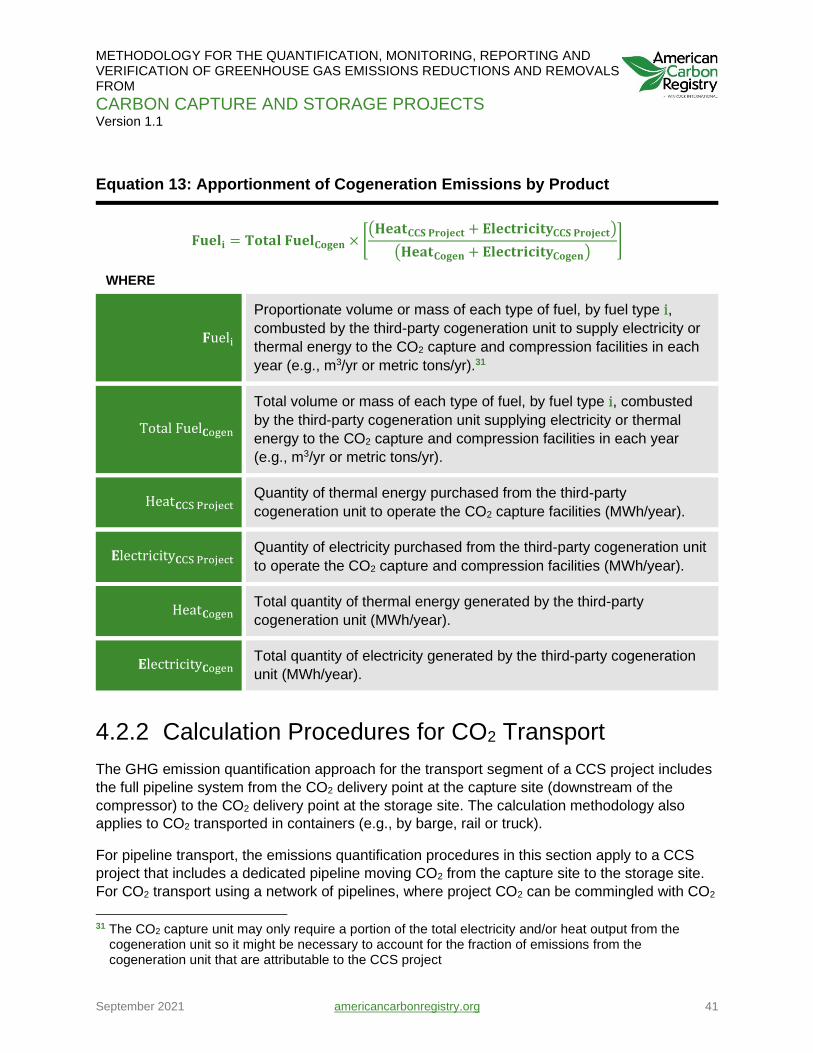
METHODOLOGY FOR THE QUANTIFICATION, MONITORING, REPORTING AND VERIFICATION OF GREENHOUSE GAS EMISSIONS REDUCTIONS AND REMOVALS FROM
CARBON CAPTURE AND STORAGE PROJECTS Version 1.1
September 2021 americancarbonregistry.org 41
Equation 13: Apportionment of Cogeneration Emissions by Product
𝐅𝐮𝐞𝐥𝐢 = 𝐓𝐨𝐭𝐚𝐥 𝐅𝐮𝐞𝐥𝐂𝐨𝐠𝐞𝐧 × [(𝐇𝐞𝐚𝐭𝐂𝐂𝐒 𝐏𝐫𝐨𝐣𝐞𝐜𝐭 + 𝐄𝐥𝐞𝐜𝐭𝐫𝐢𝐜𝐢𝐭𝐲𝐂𝐂𝐒 𝐏𝐫𝐨𝐣𝐞𝐜𝐭)
(𝐇𝐞𝐚𝐭𝐂𝐨𝐠𝐞𝐧 + 𝐄𝐥𝐞𝐜𝐭𝐫𝐢𝐜𝐢𝐭𝐲𝐂𝐨𝐠𝐞𝐧)]
WHERE
𝐅ueli
Proportionate volume or mass of each type of fuel, by fuel type i,
combusted by the third-party cogeneration unit to supply electricity or
thermal energy to the CO2 capture and compression facilities in each
year (e.g., m3/yr or metric tons/yr).31
Total Fuel𝐂ogen
Total volume or mass of each type of fuel, by fuel type i, combusted
by the third-party cogeneration unit supplying electricity or thermal
energy to the CO2 capture and compression facilities in each year
(e.g., m3/yr or metric tons/yr).
Heat𝐂CS Project Quantity of thermal energy purchased from the third-party
cogeneration unit to operate the CO2 capture facilities (MWh/year).
𝐄lectricity𝐂CS Project Quantity of electricity purchased from the third-party cogeneration unit
to operate the CO2 capture and compression facilities (MWh/year).
Heat𝐂ogen Total quantity of thermal energy generated by the third-party
cogeneration unit (MWh/year).
𝐄lectricity𝐂ogen Total quantity of electricity generated by the third-party cogeneration
unit (MWh/year).
4.2.2 Calculation Procedures for CO2 Transport
The GHG emission quantification approach for the transport segment of a CCS project includes
the full pipeline system from the CO2 delivery point at the capture site (downstream of the
compressor) to the CO2 delivery point at the storage site. The calculation methodology also
applies to CO2 transported in containers (e.g., by barge, rail or truck).
For pipeline transport, the emissions quantification procedures in this section apply to a CCS
project that includes a dedicated pipeline moving CO2 from the capture site to the storage site.
For CO2 transport using a network of pipelines, where project CO2 can be commingled with CO2
31 The CO2 capture unit may only require a portion of the total electricity and/or heat output from the
cogeneration unit so it might be necessary to account for the fraction of emissions from the cogeneration unit that are attributable to the CCS project
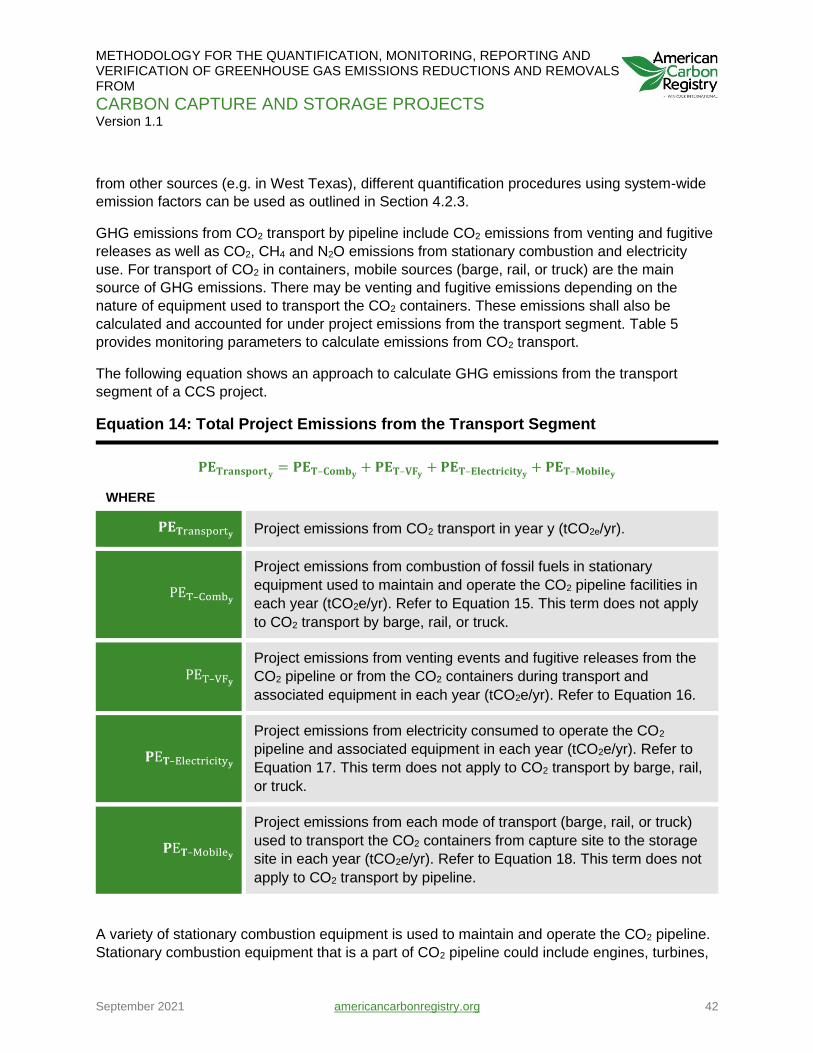
METHODOLOGY FOR THE QUANTIFICATION, MONITORING, REPORTING AND VERIFICATION OF GREENHOUSE GAS EMISSIONS REDUCTIONS AND REMOVALS FROM
CARBON CAPTURE AND STORAGE PROJECTS Version 1.1
September 2021 americancarbonregistry.org 42
from other sources (e.g. in West Texas), different quantification procedures using system-wide
emission factors can be used as outlined in Section 4.2.3.
GHG emissions from CO2 transport by pipeline include CO2 emissions from venting and fugitive
releases as well as CO2, CH4 and N2O emissions from stationary combustion and electricity
use. For transport of CO2 in containers, mobile sources (barge, rail, or truck) are the main
source of GHG emissions. There may be venting and fugitive emissions depending on the
nature of equipment used to transport the CO2 containers. These emissions shall also be
calculated and accounted for under project emissions from the transport segment. Table 5
provides monitoring parameters to calculate emissions from CO2 transport.
The following equation shows an approach to calculate GHG emissions from the transport
segment of a CCS project.
Equation 14: Total Project Emissions from the Transport Segment
𝐏𝐄𝐓𝐫𝐚𝐧𝐬𝐩𝐨𝐫𝐭𝐲= 𝐏𝐄𝐓–𝐂𝐨𝐦𝐛𝐲
+ 𝐏𝐄𝐓–𝐕𝐅𝐲+ 𝐏𝐄𝐓–𝐄𝐥𝐞𝐜𝐭𝐫𝐢𝐜𝐢𝐭𝐲𝐲
+ 𝐏𝐄𝐓–𝐌𝐨𝐛𝐢𝐥𝐞𝐲
WHERE
𝐏𝐄𝐓ransport𝐲 Project emissions from CO2 transport in year y (tCO2e/yr).
PET–Comb𝐲
Project emissions from combustion of fossil fuels in stationary
equipment used to maintain and operate the CO2 pipeline facilities in
each year (tCO2e/yr). Refer to Equation 15. This term does not apply
to CO2 transport by barge, rail, or truck.
PET–VF𝐲
Project emissions from venting events and fugitive releases from the
CO2 pipeline or from the CO2 containers during transport and
associated equipment in each year (tCO2e/yr). Refer to Equation 16.
𝐏E𝐓–Electricity𝐲
Project emissions from electricity consumed to operate the CO2
pipeline and associated equipment in each year (tCO2e/yr). Refer to
Equation 17. This term does not apply to CO2 transport by barge, rail,
or truck.
𝐏E𝐓–Mobile𝐲
Project emissions from each mode of transport (barge, rail, or truck)
used to transport the CO2 containers from capture site to the storage
site in each year (tCO2e/yr). Refer to Equation 18. This term does not
apply to CO2 transport by pipeline.
A variety of stationary combustion equipment is used to maintain and operate the CO2 pipeline.
Stationary combustion equipment that is a part of CO2 pipeline could include engines, turbines,
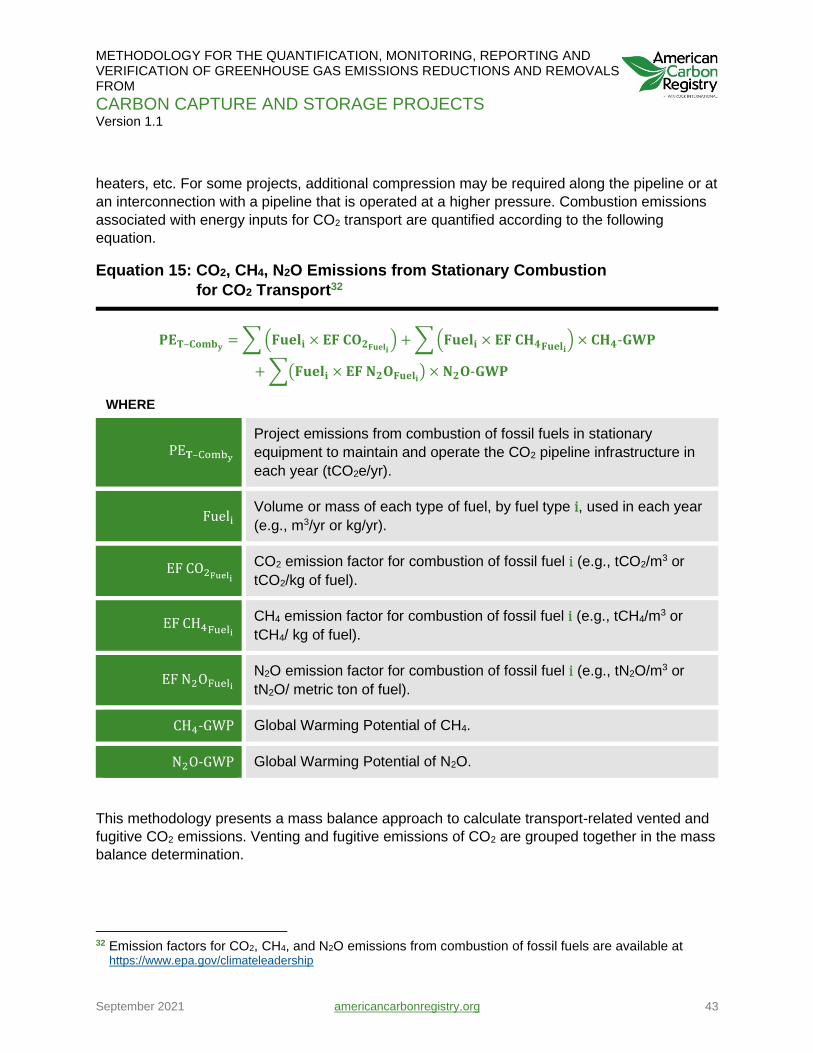
METHODOLOGY FOR THE QUANTIFICATION, MONITORING, REPORTING AND VERIFICATION OF GREENHOUSE GAS EMISSIONS REDUCTIONS AND REMOVALS FROM
CARBON CAPTURE AND STORAGE PROJECTS Version 1.1
September 2021 americancarbonregistry.org 43
heaters, etc. For some projects, additional compression may be required along the pipeline or at
an interconnection with a pipeline that is operated at a higher pressure. Combustion emissions
associated with energy inputs for CO2 transport are quantified according to the following
equation.
Equation 15: CO2, CH4, N2O Emissions from Stationary Combustion
for CO2 Transport32
𝐏𝐄𝐓–𝐂𝐨𝐦𝐛𝐲= ∑ (𝐅𝐮𝐞𝐥𝐢 × 𝐄𝐅 𝐂𝐎𝟐𝐅𝐮𝐞𝐥𝐢
) + ∑ (𝐅𝐮𝐞𝐥𝐢 × 𝐄𝐅 𝐂𝐇𝟒𝐅𝐮𝐞𝐥𝐢) × 𝐂𝐇𝟒-𝐆𝐖𝐏
+ ∑(𝐅𝐮𝐞𝐥𝐢 × 𝐄𝐅 𝐍𝟐𝐎𝐅𝐮𝐞𝐥𝐢) × 𝐍𝟐𝐎-𝐆𝐖𝐏
WHERE
PE𝐓–Comby
Project emissions from combustion of fossil fuels in stationary
equipment to maintain and operate the CO2 pipeline infrastructure in
each year (tCO2e/yr).
Fueli Volume or mass of each type of fuel, by fuel type i, used in each year
(e.g., m3/yr or kg/yr).
EF CO2Fueli
CO2 emission factor for combustion of fossil fuel i (e.g., tCO2/m3 or
tCO2/kg of fuel).
EF CH4Fueli
CH4 emission factor for combustion of fossil fuel i (e.g., tCH4/m3 or
tCH4/ kg of fuel).
EF N2OFueli
N2O emission factor for combustion of fossil fuel i (e.g., tN2O/m3 or
tN2O/ metric ton of fuel).
CH4-GWP Global Warming Potential of CH4.
N2O-GWP Global Warming Potential of N2O.
This methodology presents a mass balance approach to calculate transport-related vented and
fugitive CO2 emissions. Venting and fugitive emissions of CO2 are grouped together in the mass
balance determination.
32 Emission factors for CO2, CH4, and N2O emissions from combustion of fossil fuels are available at
https://www.epa.gov/climateleadership
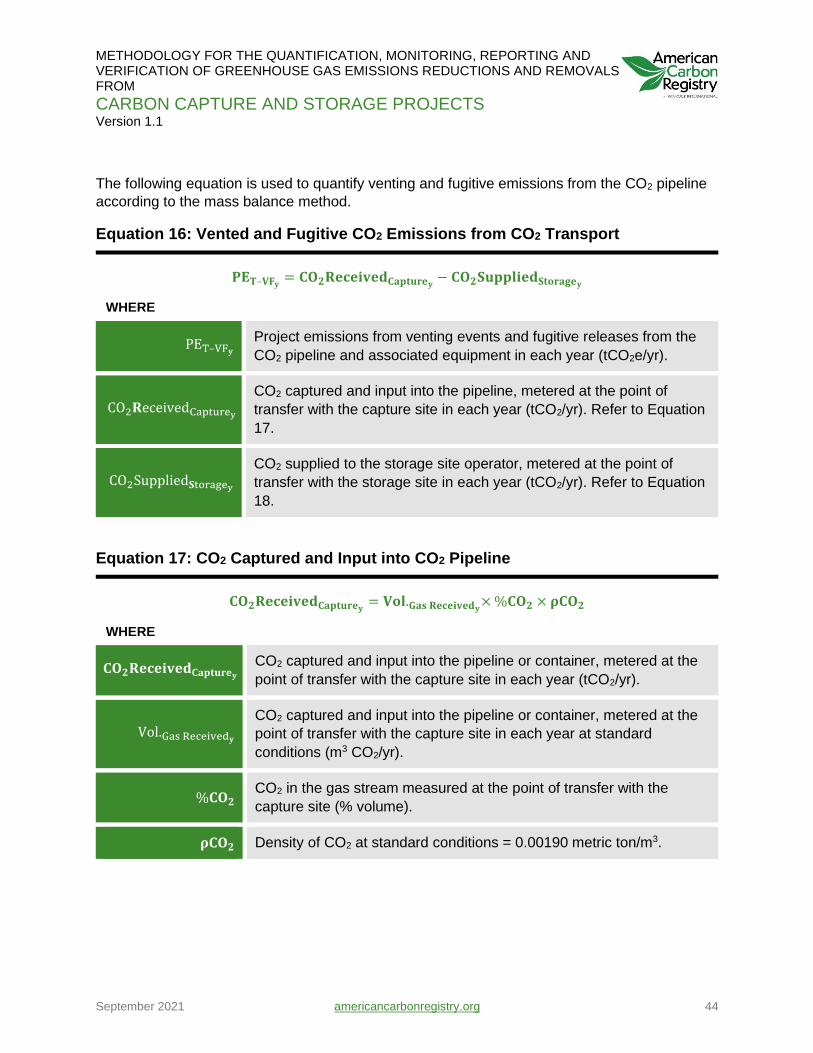
METHODOLOGY FOR THE QUANTIFICATION, MONITORING, REPORTING AND VERIFICATION OF GREENHOUSE GAS EMISSIONS REDUCTIONS AND REMOVALS FROM
CARBON CAPTURE AND STORAGE PROJECTS Version 1.1
September 2021 americancarbonregistry.org 44
The following equation is used to quantify venting and fugitive emissions from the CO2 pipeline
according to the mass balance method.
Equation 16: Vented and Fugitive CO2 Emissions from CO2 Transport
𝐏𝐄𝐓–𝐕𝐅𝐲= 𝐂𝐎𝟐𝐑𝐞𝐜𝐞𝐢𝐯𝐞𝐝𝐂𝐚𝐩𝐭𝐮𝐫𝐞𝐲
− 𝐂𝐎𝟐𝐒𝐮𝐩𝐩𝐥𝐢𝐞𝐝𝐒𝐭𝐨𝐫𝐚𝐠𝐞𝐲
WHERE
PET–VF𝐲
Project emissions from venting events and fugitive releases from the
CO2 pipeline and associated equipment in each year (tCO2e/yr).
CO2𝐑eceivedCapturey
CO2 captured and input into the pipeline, metered at the point of
transfer with the capture site in each year (tCO2/yr). Refer to Equation
17.
CO2Supplied𝐒toragey
CO2 supplied to the storage site operator, metered at the point of
transfer with the storage site in each year (tCO2/yr). Refer to Equation
18.
Equation 17: CO2 Captured and Input into CO2 Pipeline
𝐂𝐎𝟐𝐑𝐞𝐜𝐞𝐢𝐯𝐞𝐝𝐂𝐚𝐩𝐭𝐮𝐫𝐞𝐲= 𝐕𝐨𝐥.𝐆𝐚𝐬 𝐑𝐞𝐜𝐞𝐢𝐯𝐞𝐝𝐲
× %𝐂𝐎𝟐 × 𝛒𝐂𝐎𝟐
WHERE
𝐂𝐎𝟐𝐑𝐞𝐜𝐞𝐢𝐯𝐞𝐝𝐂𝐚𝐩𝐭𝐮𝐫𝐞𝐲
CO2 captured and input into the pipeline or container, metered at the
point of transfer with the capture site in each year (tCO2/yr).
Vol.Gas Received𝐲
CO2 captured and input into the pipeline or container, metered at the
point of transfer with the capture site in each year at standard
conditions (m3 CO2/yr).
%𝐂𝐎𝟐 CO2 in the gas stream measured at the point of transfer with the
capture site (% volume).
𝛒𝐂𝐎𝟐 Density of CO2 at standard conditions = 0.00190 metric ton/m3.
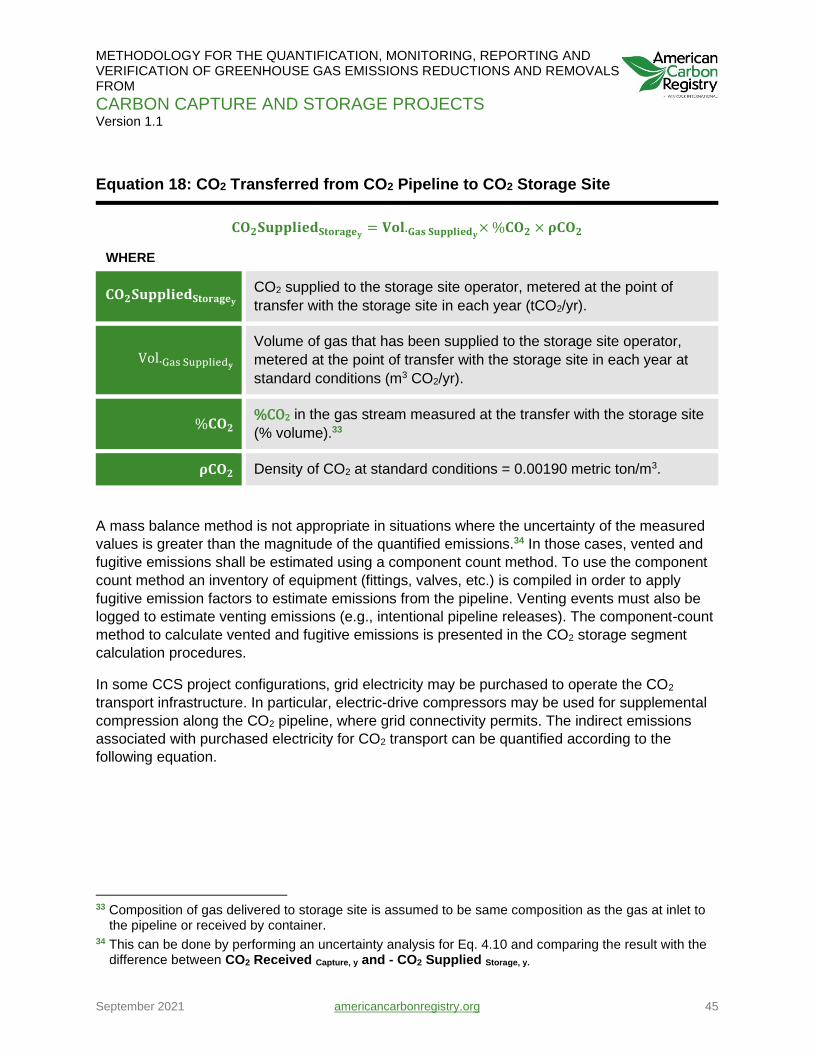
METHODOLOGY FOR THE QUANTIFICATION, MONITORING, REPORTING AND VERIFICATION OF GREENHOUSE GAS EMISSIONS REDUCTIONS AND REMOVALS FROM
CARBON CAPTURE AND STORAGE PROJECTS Version 1.1
September 2021 americancarbonregistry.org 45
Equation 18: CO2 Transferred from CO2 Pipeline to CO2 Storage Site
𝐂𝐎𝟐𝐒𝐮𝐩𝐩𝐥𝐢𝐞𝐝𝐒𝐭𝐨𝐫𝐚𝐠𝐞𝐲= 𝐕𝐨𝐥.𝐆𝐚𝐬 𝐒𝐮𝐩𝐩𝐥𝐢𝐞𝐝𝐲
× %𝐂𝐎𝟐 × 𝛒𝐂𝐎𝟐
WHERE
𝐂𝐎𝟐𝐒𝐮𝐩𝐩𝐥𝐢𝐞𝐝𝐒𝐭𝐨𝐫𝐚𝐠𝐞𝐲
CO2 supplied to the storage site operator, metered at the point of
transfer with the storage site in each year (tCO2/yr).
Vol.Gas Supplied𝐲
Volume of gas that has been supplied to the storage site operator,
metered at the point of transfer with the storage site in each year at
standard conditions (m3 CO2/yr).
%𝐂𝐎𝟐 %CO2 in the gas stream measured at the transfer with the storage site
(% volume).33
𝛒𝐂𝐎𝟐 Density of CO2 at standard conditions = 0.00190 metric ton/m3.
A mass balance method is not appropriate in situations where the uncertainty of the measured
values is greater than the magnitude of the quantified emissions.34 In those cases, vented and
fugitive emissions shall be estimated using a component count method. To use the component
count method an inventory of equipment (fittings, valves, etc.) is compiled in order to apply
fugitive emission factors to estimate emissions from the pipeline. Venting events must also be
logged to estimate venting emissions (e.g., intentional pipeline releases). The component-count
method to calculate vented and fugitive emissions is presented in the CO2 storage segment
calculation procedures.
In some CCS project configurations, grid electricity may be purchased to operate the CO2
transport infrastructure. In particular, electric-drive compressors may be used for supplemental
compression along the CO2 pipeline, where grid connectivity permits. The indirect emissions
associated with purchased electricity for CO2 transport can be quantified according to the
following equation.
33 Composition of gas delivered to storage site is assumed to be same composition as the gas at inlet to
the pipeline or received by container. 34 This can be done by performing an uncertainty analysis for Eq. 4.10 and comparing the result with the
difference between CO2 Received Capture, y and - CO2 Supplied Storage, y.
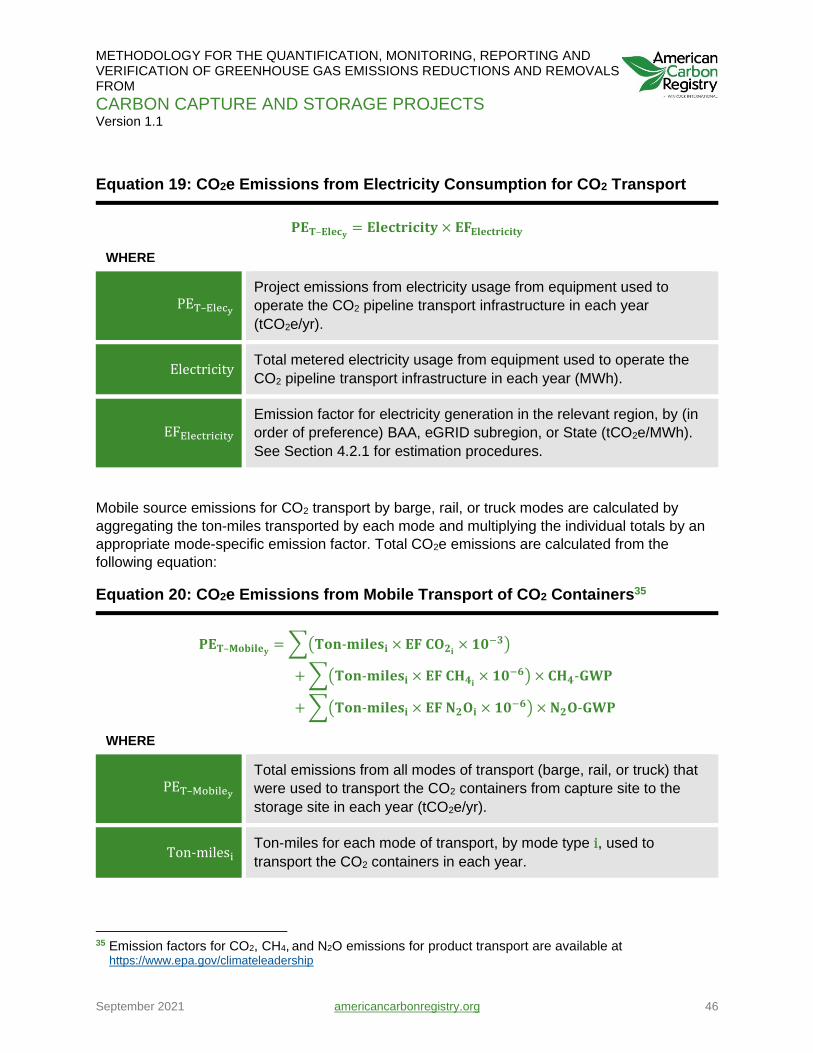
METHODOLOGY FOR THE QUANTIFICATION, MONITORING, REPORTING AND VERIFICATION OF GREENHOUSE GAS EMISSIONS REDUCTIONS AND REMOVALS FROM
CARBON CAPTURE AND STORAGE PROJECTS Version 1.1
September 2021 americancarbonregistry.org 46
Equation 19: CO2e Emissions from Electricity Consumption for CO2 Transport
𝐏𝐄𝐓–𝐄𝐥𝐞𝐜𝐲= 𝐄𝐥𝐞𝐜𝐭𝐫𝐢𝐜𝐢𝐭𝐲 × 𝐄𝐅𝐄𝐥𝐞𝐜𝐭𝐫𝐢𝐜𝐢𝐭𝐲
WHERE
PET–Elecy
Project emissions from electricity usage from equipment used to
operate the CO2 pipeline transport infrastructure in each year
(tCO2e/yr).
Electricity Total metered electricity usage from equipment used to operate the
CO2 pipeline transport infrastructure in each year (MWh).
EFElectricity
Emission factor for electricity generation in the relevant region, by (in
order of preference) BAA, eGRID subregion, or State (tCO2e/MWh).
See Section 4.2.1 for estimation procedures.
Mobile source emissions for CO2 transport by barge, rail, or truck modes are calculated by
aggregating the ton-miles transported by each mode and multiplying the individual totals by an
appropriate mode-specific emission factor. Total CO2e emissions are calculated from the
following equation:
Equation 20: CO2e Emissions from Mobile Transport of CO2 Containers35
𝐏𝐄𝐓–𝐌𝐨𝐛𝐢𝐥𝐞𝐲= ∑(𝐓𝐨𝐧-𝐦𝐢𝐥𝐞𝐬𝐢 × 𝐄𝐅 𝐂𝐎𝟐𝐢
× 𝟏𝟎−𝟑)
+ ∑(𝐓𝐨𝐧-𝐦𝐢𝐥𝐞𝐬𝐢 × 𝐄𝐅 𝐂𝐇𝟒𝐢× 𝟏𝟎−𝟔) × 𝐂𝐇𝟒-𝐆𝐖𝐏
+ ∑(𝐓𝐨𝐧-𝐦𝐢𝐥𝐞𝐬𝐢 × 𝐄𝐅 𝐍𝟐𝐎𝐢 × 𝟏𝟎−𝟔) × 𝐍𝟐𝐎-𝐆𝐖𝐏
WHERE
PET–Mobiley
Total emissions from all modes of transport (barge, rail, or truck) that
were used to transport the CO2 containers from capture site to the
storage site in each year (tCO2e/yr).
Ton-milesi Ton-miles for each mode of transport, by mode type i, used to
transport the CO2 containers in each year.
35 Emission factors for CO2, CH4, and N2O emissions for product transport are available at
https://www.epa.gov/climateleadership
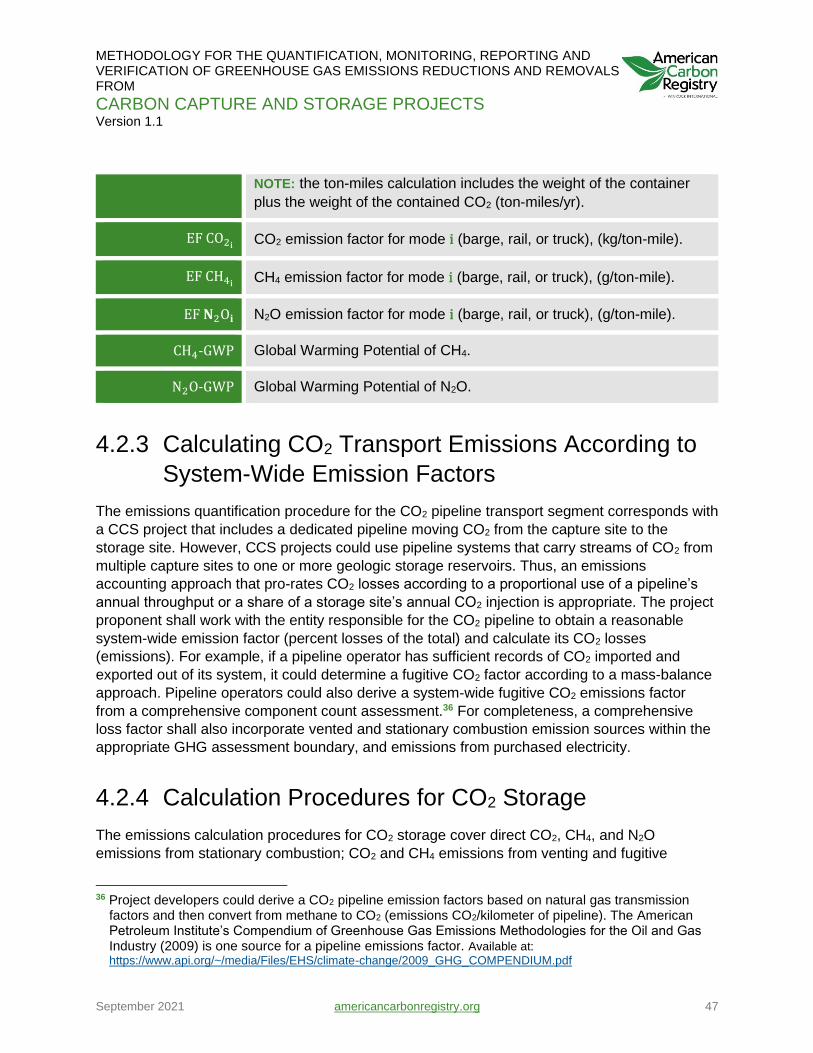
METHODOLOGY FOR THE QUANTIFICATION, MONITORING, REPORTING AND VERIFICATION OF GREENHOUSE GAS EMISSIONS REDUCTIONS AND REMOVALS FROM
CARBON CAPTURE AND STORAGE PROJECTS Version 1.1
September 2021 americancarbonregistry.org 47
NOTE: the ton-miles calculation includes the weight of the container
plus the weight of the contained CO2 (ton-miles/yr).
EF CO2i CO2 emission factor for mode i (barge, rail, or truck), (kg/ton-mile).
EF CH4i CH4 emission factor for mode i (barge, rail, or truck), (g/ton-mile).
EF 𝐍2O𝐢 N2O emission factor for mode i (barge, rail, or truck), (g/ton-mile).
CH4-GWP Global Warming Potential of CH4.
N2O-GWP Global Warming Potential of N2O.
4.2.3 Calculating CO2 Transport Emissions According to
System-Wide Emission Factors
The emissions quantification procedure for the CO2 pipeline transport segment corresponds with
a CCS project that includes a dedicated pipeline moving CO2 from the capture site to the
storage site. However, CCS projects could use pipeline systems that carry streams of CO2 from
multiple capture sites to one or more geologic storage reservoirs. Thus, an emissions
accounting approach that pro-rates CO2 losses according to a proportional use of a pipeline’s
annual throughput or a share of a storage site’s annual CO2 injection is appropriate. The project
proponent shall work with the entity responsible for the CO2 pipeline to obtain a reasonable
system-wide emission factor (percent losses of the total) and calculate its CO2 losses
(emissions). For example, if a pipeline operator has sufficient records of CO2 imported and
exported out of its system, it could determine a fugitive CO2 factor according to a mass-balance
approach. Pipeline operators could also derive a system-wide fugitive CO2 emissions factor
from a comprehensive component count assessment.36 For completeness, a comprehensive
loss factor shall also incorporate vented and stationary combustion emission sources within the
appropriate GHG assessment boundary, and emissions from purchased electricity.
4.2.4 Calculation Procedures for CO2 Storage
The emissions calculation procedures for CO2 storage cover direct CO2, CH4, and N2O
emissions from stationary combustion; CO2 and CH4 emissions from venting and fugitive
36 Project developers could derive a CO2 pipeline emission factors based on natural gas transmission
factors and then convert from methane to CO2 (emissions CO2/kilometer of pipeline). The American Petroleum Institute’s Compendium of Greenhouse Gas Emissions Methodologies for the Oil and Gas Industry (2009) is one source for a pipeline emissions factor. Available at:
https://www.api.org/~/media/Files/EHS/climate-change/2009_GHG_COMPENDIUM.pdf
METHODOLOGY FOR THE QUANTIFICATION, MONITORING, REPORTING AND VERIFICATION OF GREENHOUSE GAS EMISSIONS REDUCTIONS AND REMOVALS FROM
CARBON CAPTURE AND STORAGE PROJECTS Version 1.1
September 2021 americancarbonregistry.org 48
releases to the atmosphere; and indirect CO2e emissions from purchased electricity use. The
procedures also account for any CO2 that is produced with the hydrocarbons and transferred
offsite (i.e., the CO2 is not re-injected into a reservoir that is within the project boundary) and
leakage of injected CO2 from the reservoir to the atmosphere. GHG sources include CO2
receiving, injecting, recycling and re-injection equipment; CO2 injection and production wells,
hydrocarbon processing and storage facilities; and the CO2 storage reservoir.
The emissions quantification methodology for CO2 storage includes all emissions sources
located between the point of transfer from the CO2 pipeline up to and including the injection
wells. It also incorporates producing wells and surface facilities related to the hydrocarbon
gathering, storage and separation facilities and the infrastructure used to process, purify and
compress CO2 and other gases produced from the formation, and re-inject it back into the
formation. Additionally, CO2 entrained in or dissolved in hydrocarbons (crude oil or natural gas)
or wastewater that is removed or distributed off-site (e.g., sold, disposed of and/or not re-
injected) is accounted for as a source of fugitive emissions.
Emissions from energy inputs to operate the facilities at EOR formations are accounted for by
using common quantification methods based on the quantities and types of energy inputs.
Vented CO2 emissions from surface facilities are quantified on an event basis. Fugitive CO2
emissions from injection wells and surface facilities are calculated according to a component
count approach. The method to calculate leaked CO2 from the geologic storage reservoir to the
atmosphere, should it occur, would be reservoir-specific and is addressed in Section 4.2.5.
The methodology does not treat CO2 produced from wells at EOR sites that is recycled and re-
injected into the storage formation as an emission, provided the CO2 remains within the closed
loop system and is thus prevented from entering the atmosphere. Unintentional CO2 releases
from the recycle system (including from production wells, gas separation and cleaning
equipment) are treated as fugitive emissions and accounted for in Equation 24. Intentionally
vented CO2 in the recycle system (for operational purposes) is treated as a vented emission and
accounted for in Equation 23.
The following equation outlines the methods for calculating emissions from CO2 storage. Table
5 provides monitoring parameters for calculating emissions from CO2 storage.
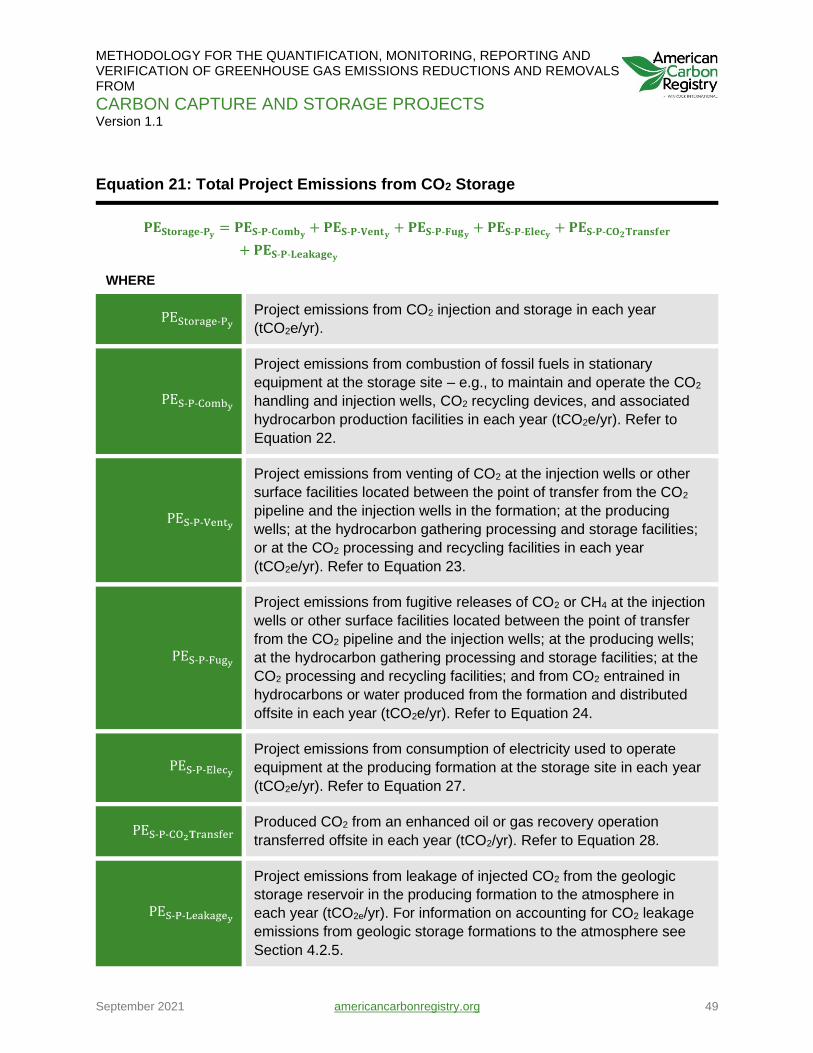
METHODOLOGY FOR THE QUANTIFICATION, MONITORING, REPORTING AND VERIFICATION OF GREENHOUSE GAS EMISSIONS REDUCTIONS AND REMOVALS FROM
CARBON CAPTURE AND STORAGE PROJECTS Version 1.1
September 2021 americancarbonregistry.org 49
Equation 21: Total Project Emissions from CO2 Storage
𝐏𝐄𝐒𝐭𝐨𝐫𝐚𝐠𝐞-𝐏𝐲= 𝐏𝐄𝐒-𝐏-𝐂𝐨𝐦𝐛𝐲
+ 𝐏𝐄𝐒-𝐏-𝐕𝐞𝐧𝐭𝐲+ 𝐏𝐄𝐒-𝐏-𝐅𝐮𝐠𝐲
+ 𝐏𝐄𝐒-𝐏-𝐄𝐥𝐞𝐜𝐲+ 𝐏𝐄𝐒-𝐏-𝐂𝐎𝟐𝐓𝐫𝐚𝐧𝐬𝐟𝐞𝐫
+ 𝐏𝐄𝐒-𝐏-𝐋𝐞𝐚𝐤𝐚𝐠𝐞𝐲
WHERE
PEStorage-Py
Project emissions from CO2 injection and storage in each year
(tCO2e/yr).
PES-P-Comby
Project emissions from combustion of fossil fuels in stationary
equipment at the storage site – e.g., to maintain and operate the CO2
handling and injection wells, CO2 recycling devices, and associated
hydrocarbon production facilities in each year (tCO2e/yr). Refer to
Equation 22.
PES-P-Venty
Project emissions from venting of CO2 at the injection wells or other
surface facilities located between the point of transfer from the CO2
pipeline and the injection wells in the formation; at the producing
wells; at the hydrocarbon gathering processing and storage facilities;
or at the CO2 processing and recycling facilities in each year
(tCO2e/yr). Refer to Equation 23.
PES-P-Fugy
Project emissions from fugitive releases of CO2 or CH4 at the injection
wells or other surface facilities located between the point of transfer
from the CO2 pipeline and the injection wells; at the producing wells;
at the hydrocarbon gathering processing and storage facilities; at the
CO2 processing and recycling facilities; and from CO2 entrained in
hydrocarbons or water produced from the formation and distributed
offsite in each year (tCO2e/yr). Refer to Equation 24.
PES-P-Elecy
Project emissions from consumption of electricity used to operate
equipment at the producing formation at the storage site in each year
(tCO2e/yr). Refer to Equation 27.
PES-P-CO2𝐓ransfer Produced CO2 from an enhanced oil or gas recovery operation
transferred offsite in each year (tCO2/yr). Refer to Equation 28.
PES-P-Leakagey
Project emissions from leakage of injected CO2 from the geologic
storage reservoir in the producing formation to the atmosphere in
each year (tCO2e/yr). For information on accounting for CO2 leakage
emissions from geologic storage formations to the atmosphere see
Section 4.2.5.
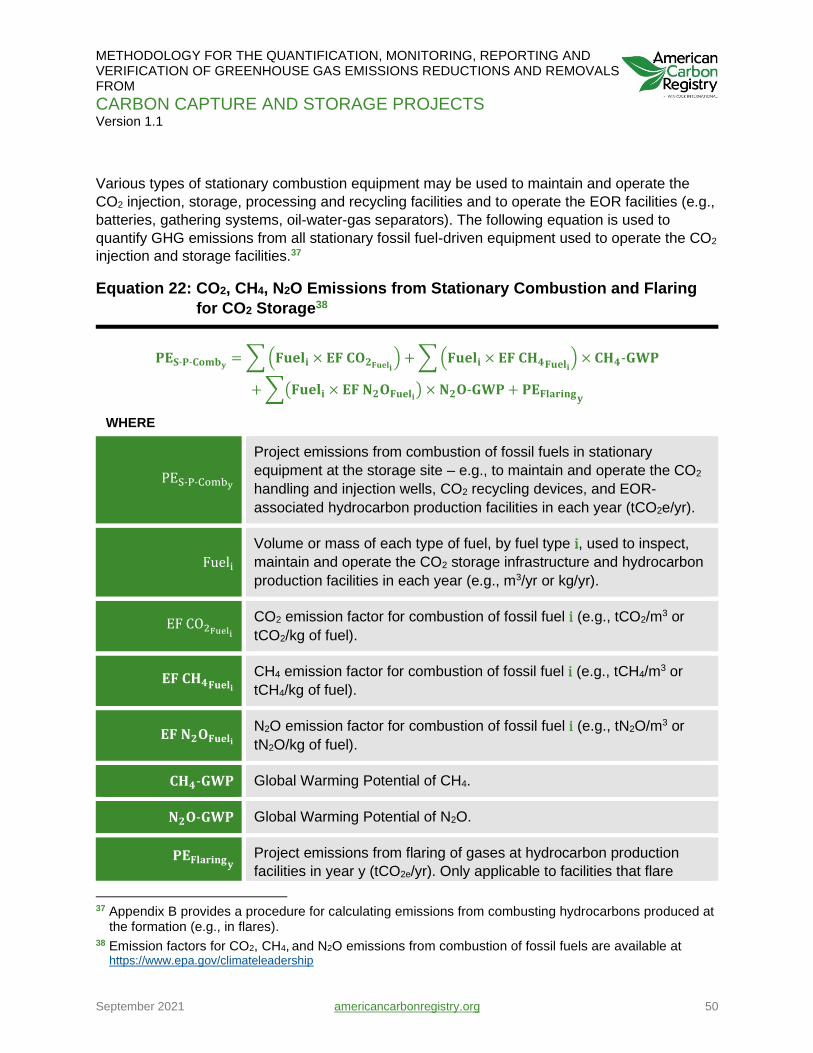
METHODOLOGY FOR THE QUANTIFICATION, MONITORING, REPORTING AND VERIFICATION OF GREENHOUSE GAS EMISSIONS REDUCTIONS AND REMOVALS FROM
CARBON CAPTURE AND STORAGE PROJECTS Version 1.1
September 2021 americancarbonregistry.org 50
Various types of stationary combustion equipment may be used to maintain and operate the
CO2 injection, storage, processing and recycling facilities and to operate the EOR facilities (e.g.,
batteries, gathering systems, oil-water-gas separators). The following equation is used to
quantify GHG emissions from all stationary fossil fuel-driven equipment used to operate the CO2
injection and storage facilities.37
Equation 22: CO2, CH4, N2O Emissions from Stationary Combustion and Flaring
for CO2 Storage38
𝐏𝐄𝐒-𝐏-𝐂𝐨𝐦𝐛𝐲= ∑ (𝐅𝐮𝐞𝐥𝐢 × 𝐄𝐅 𝐂𝐎𝟐𝐅𝐮𝐞𝐥𝐢
) + ∑ (𝐅𝐮𝐞𝐥𝐢 × 𝐄𝐅 𝐂𝐇𝟒𝐅𝐮𝐞𝐥𝐢) × 𝐂𝐇𝟒-𝐆𝐖𝐏
+ ∑(𝐅𝐮𝐞𝐥𝐢 × 𝐄𝐅 𝐍𝟐𝐎𝐅𝐮𝐞𝐥𝐢) × 𝐍𝟐𝐎-𝐆𝐖𝐏 + 𝐏𝐄𝐅𝐥𝐚𝐫𝐢𝐧𝐠𝐲
WHERE
PES-P-Comby
Project emissions from combustion of fossil fuels in stationary
equipment at the storage site – e.g., to maintain and operate the CO2
handling and injection wells, CO2 recycling devices, and EOR-
associated hydrocarbon production facilities in each year (tCO2e/yr).
Fueli
Volume or mass of each type of fuel, by fuel type i, used to inspect,
maintain and operate the CO2 storage infrastructure and hydrocarbon
production facilities in each year (e.g., m3/yr or kg/yr).
EF CO2Fueli CO2 emission factor for combustion of fossil fuel i (e.g., tCO2/m3 or
tCO2/kg of fuel).
𝐄𝐅 𝐂𝐇𝟒𝐅𝐮𝐞𝐥𝐢 CH4 emission factor for combustion of fossil fuel i (e.g., tCH4/m3 or
tCH4/kg of fuel).
𝐄𝐅 𝐍𝟐𝐎𝐅𝐮𝐞𝐥𝐢
N2O emission factor for combustion of fossil fuel i (e.g., tN2O/m3 or
tN2O/kg of fuel).
𝐂𝐇𝟒-𝐆𝐖𝐏 Global Warming Potential of CH4.
𝐍𝟐𝐎-𝐆𝐖𝐏 Global Warming Potential of N2O.
𝐏𝐄𝐅𝐥𝐚𝐫𝐢𝐧𝐠𝐲 Project emissions from flaring of gases at hydrocarbon production
facilities in year y (tCO2e/yr). Only applicable to facilities that flare
37 Appendix B provides a procedure for calculating emissions from combusting hydrocarbons produced at
the formation (e.g., in flares). 38 Emission factors for CO2, CH4, and N2O emissions from combustion of fossil fuels are available at
https://www.epa.gov/climateleadership
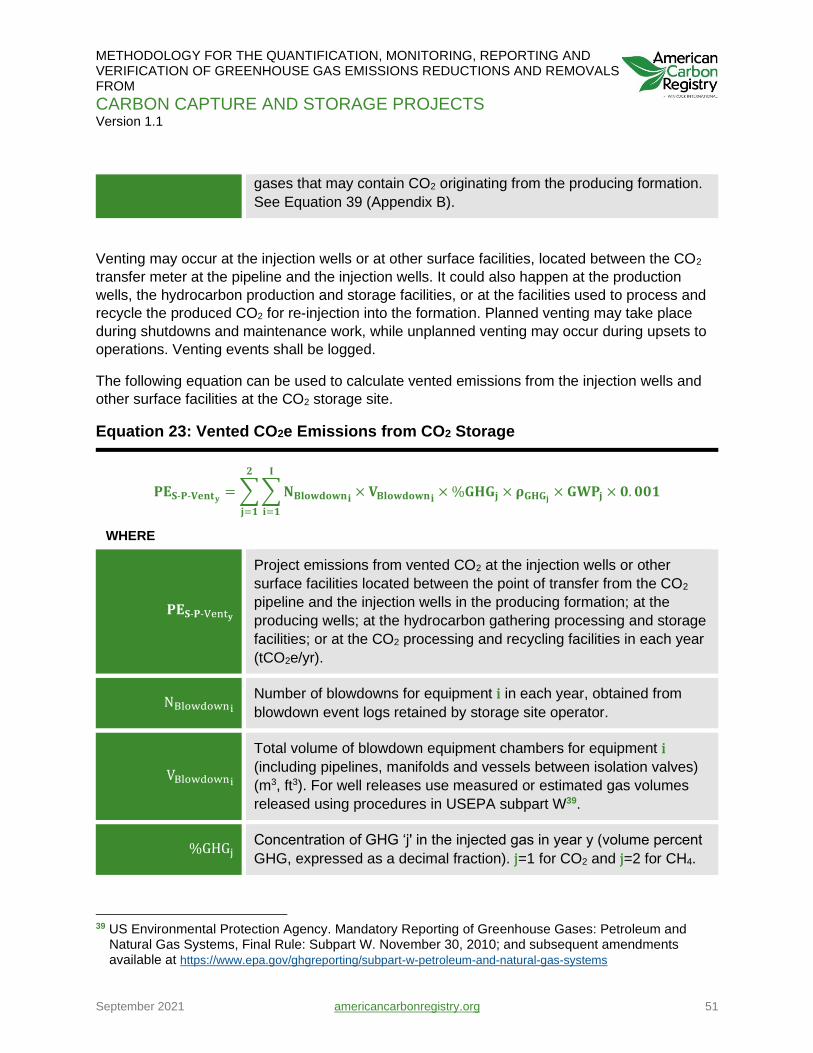
METHODOLOGY FOR THE QUANTIFICATION, MONITORING, REPORTING AND VERIFICATION OF GREENHOUSE GAS EMISSIONS REDUCTIONS AND REMOVALS FROM
CARBON CAPTURE AND STORAGE PROJECTS Version 1.1
September 2021 americancarbonregistry.org 51
gases that may contain CO2 originating from the producing formation.
See Equation 39 (Appendix B).
Venting may occur at the injection wells or at other surface facilities, located between the CO2
transfer meter at the pipeline and the injection wells. It could also happen at the production
wells, the hydrocarbon production and storage facilities, or at the facilities used to process and
recycle the produced CO2 for re-injection into the formation. Planned venting may take place
during shutdowns and maintenance work, while unplanned venting may occur during upsets to
operations. Venting events shall be logged.
The following equation can be used to calculate vented emissions from the injection wells and
other surface facilities at the CO2 storage site.
Equation 23: Vented CO2e Emissions from CO2 Storage
𝐏𝐄𝐒-𝐏-𝐕𝐞𝐧𝐭𝐲= ∑ ∑ 𝐍𝐁𝐥𝐨𝐰𝐝𝐨𝐰𝐧𝐢
× 𝐕𝐁𝐥𝐨𝐰𝐝𝐨𝐰𝐧𝐢
𝐈
𝐢=𝟏
𝟐
𝐣=𝟏
× %𝐆𝐇𝐆𝐣 × 𝛒𝐆𝐇𝐆𝐣× 𝐆𝐖𝐏𝐣 × 𝟎. 𝟎𝟎𝟏
WHERE
𝐏𝐄𝐒-𝐏-Vent𝐲
Project emissions from vented CO2 at the injection wells or other
surface facilities located between the point of transfer from the CO2
pipeline and the injection wells in the producing formation; at the
producing wells; at the hydrocarbon gathering processing and storage
facilities; or at the CO2 processing and recycling facilities in each year
(tCO2e/yr).
NBlowdowni
Number of blowdowns for equipment i in each year, obtained from
blowdown event logs retained by storage site operator.
VBlowdowni
Total volume of blowdown equipment chambers for equipment i
(including pipelines, manifolds and vessels between isolation valves)
(m3, ft3). For well releases use measured or estimated gas volumes
released using procedures in USEPA subpart W39.
%GHGj Concentration of GHG ‘j' in the injected gas in year y (volume percent
GHG, expressed as a decimal fraction). j=1 for CO2 and j=2 for CH4.
39 US Environmental Protection Agency. Mandatory Reporting of Greenhouse Gases: Petroleum and
Natural Gas Systems, Final Rule: Subpart W. November 30, 2010; and subsequent amendments available at https://www.epa.gov/ghgreporting/subpart-w-petroleum-and-natural-gas-systems
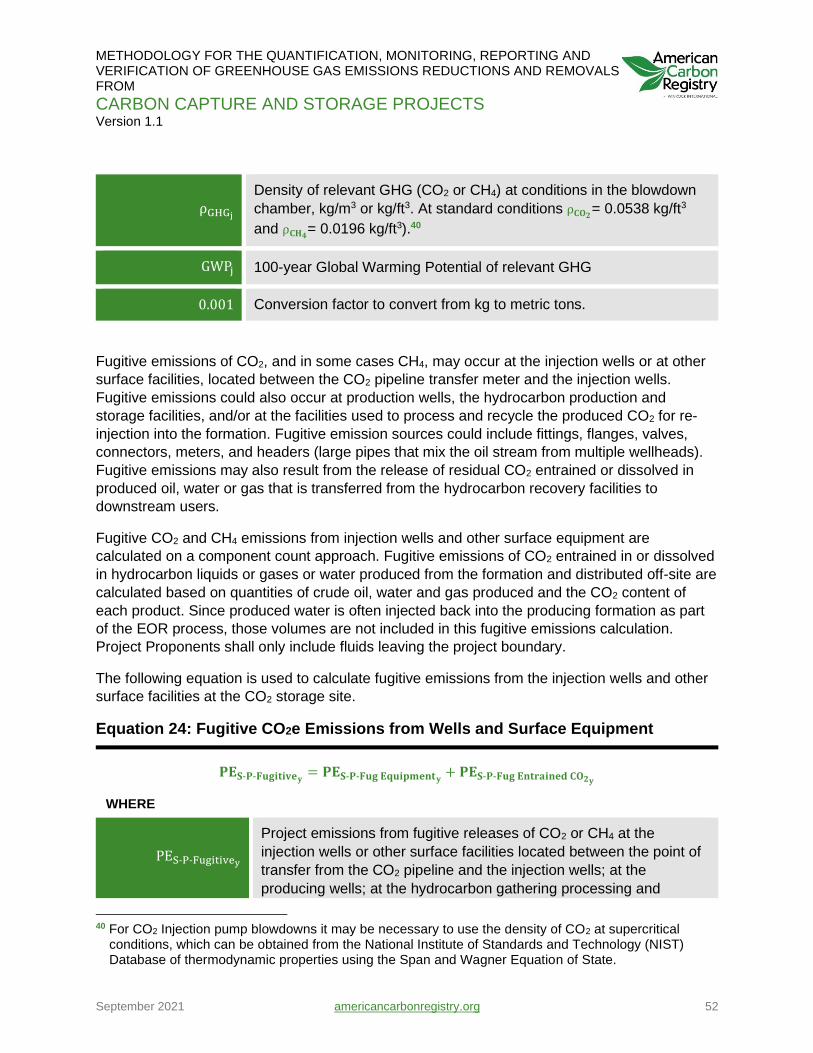
METHODOLOGY FOR THE QUANTIFICATION, MONITORING, REPORTING AND VERIFICATION OF GREENHOUSE GAS EMISSIONS REDUCTIONS AND REMOVALS FROM
CARBON CAPTURE AND STORAGE PROJECTS Version 1.1
September 2021 americancarbonregistry.org 52
ρGHGj
Density of relevant GHG (CO2 or CH4) at conditions in the blowdown
chamber, kg/m3 or kg/ft3. At standard conditions ρ𝐂𝐎𝟐= 0.0538 kg/ft3
and ρ𝐂𝐇𝟒= 0.0196 kg/ft3).40
GWPj 100-year Global Warming Potential of relevant GHG
0.001 Conversion factor to convert from kg to metric tons.
Fugitive emissions of CO2, and in some cases CH4, may occur at the injection wells or at other
surface facilities, located between the CO2 pipeline transfer meter and the injection wells.
Fugitive emissions could also occur at production wells, the hydrocarbon production and
storage facilities, and/or at the facilities used to process and recycle the produced CO2 for re-
injection into the formation. Fugitive emission sources could include fittings, flanges, valves,
connectors, meters, and headers (large pipes that mix the oil stream from multiple wellheads).
Fugitive emissions may also result from the release of residual CO2 entrained or dissolved in
produced oil, water or gas that is transferred from the hydrocarbon recovery facilities to
downstream users.
Fugitive CO2 and CH4 emissions from injection wells and other surface equipment are
calculated on a component count approach. Fugitive emissions of CO2 entrained in or dissolved
in hydrocarbon liquids or gases or water produced from the formation and distributed off-site are
calculated based on quantities of crude oil, water and gas produced and the CO2 content of
each product. Since produced water is often injected back into the producing formation as part
of the EOR process, those volumes are not included in this fugitive emissions calculation.
Project Proponents shall only include fluids leaving the project boundary.
The following equation is used to calculate fugitive emissions from the injection wells and other
surface facilities at the CO2 storage site.
Equation 24: Fugitive CO2e Emissions from Wells and Surface Equipment
𝐏𝐄𝐒-𝐏-𝐅𝐮𝐠𝐢𝐭𝐢𝐯𝐞𝐲= 𝐏𝐄𝐒-𝐏-𝐅𝐮𝐠 𝐄𝐪𝐮𝐢𝐩𝐦𝐞𝐧𝐭𝐲
+ 𝐏𝐄𝐒-𝐏-𝐅𝐮𝐠 𝐄𝐧𝐭𝐫𝐚𝐢𝐧𝐞𝐝 𝐂𝐎𝟐𝐲
WHERE
PES-P-Fugitivey
Project emissions from fugitive releases of CO2 or CH4 at the
injection wells or other surface facilities located between the point of
transfer from the CO2 pipeline and the injection wells; at the
producing wells; at the hydrocarbon gathering processing and
40 For CO2 Injection pump blowdowns it may be necessary to use the density of CO2 at supercritical
conditions, which can be obtained from the National Institute of Standards and Technology (NIST) Database of thermodynamic properties using the Span and Wagner Equation of State.
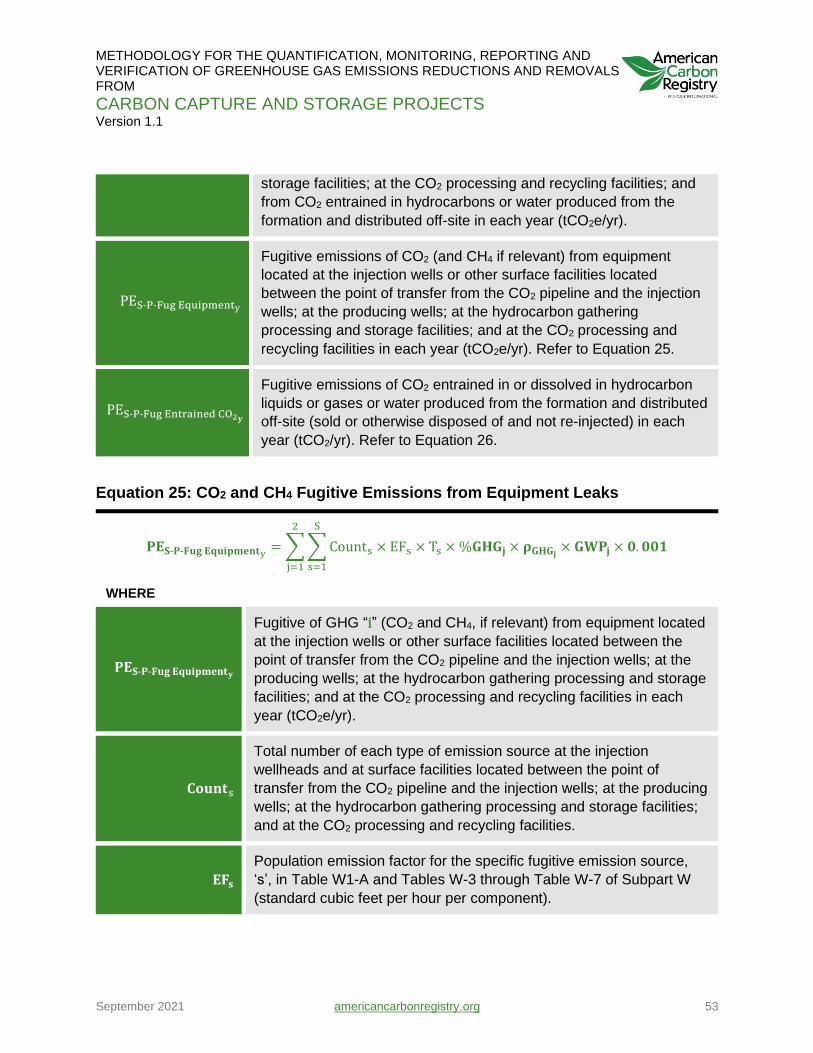
METHODOLOGY FOR THE QUANTIFICATION, MONITORING, REPORTING AND VERIFICATION OF GREENHOUSE GAS EMISSIONS REDUCTIONS AND REMOVALS FROM
CARBON CAPTURE AND STORAGE PROJECTS Version 1.1
September 2021 americancarbonregistry.org 53
storage facilities; at the CO2 processing and recycling facilities; and
from CO2 entrained in hydrocarbons or water produced from the
formation and distributed off-site in each year (tCO2e/yr).
PES-P-Fug Equipmenty
Fugitive emissions of CO2 (and CH4 if relevant) from equipment
located at the injection wells or other surface facilities located
between the point of transfer from the CO2 pipeline and the injection
wells; at the producing wells; at the hydrocarbon gathering
processing and storage facilities; and at the CO2 processing and
recycling facilities in each year (tCO2e/yr). Refer to Equation 25.
PES-P-Fug Entrained CO2𝐲
Fugitive emissions of CO2 entrained in or dissolved in hydrocarbon
liquids or gases or water produced from the formation and distributed
off-site (sold or otherwise disposed of and not re-injected) in each
year (tCO2/yr). Refer to Equation 26.
Equation 25: CO2 and CH4 Fugitive Emissions from Equipment Leaks
𝐏𝐄𝐒-𝐏-𝐅𝐮𝐠 𝐄𝐪𝐮𝐢𝐩𝐦𝐞𝐧𝐭y= ∑ ∑ Counts × EFs
S
s=1
2
j=1
× Ts × %𝐆𝐇𝐆𝐣 × 𝛒𝐆𝐇𝐆𝐣× 𝐆𝐖𝐏𝐣 × 𝟎. 𝟎𝟎𝟏
WHERE
𝐏𝐄𝐒-𝐏-𝐅𝐮𝐠 𝐄𝐪𝐮𝐢𝐩𝐦𝐞𝐧𝐭𝐲
Fugitive of GHG “i” (CO2 and CH4, if relevant) from equipment located
at the injection wells or other surface facilities located between the
point of transfer from the CO2 pipeline and the injection wells; at the
producing wells; at the hydrocarbon gathering processing and storage
facilities; and at the CO2 processing and recycling facilities in each
year (tCO2e/yr).
𝐂𝐨𝐮𝐧𝐭s
Total number of each type of emission source at the injection
wellheads and at surface facilities located between the point of
transfer from the CO2 pipeline and the injection wells; at the producing
wells; at the hydrocarbon gathering processing and storage facilities;
and at the CO2 processing and recycling facilities.
𝐄𝐅𝐬
Population emission factor for the specific fugitive emission source,
‘s’, in Table W1-A and Tables W-3 through Table W-7 of Subpart W
(standard cubic feet per hour per component).
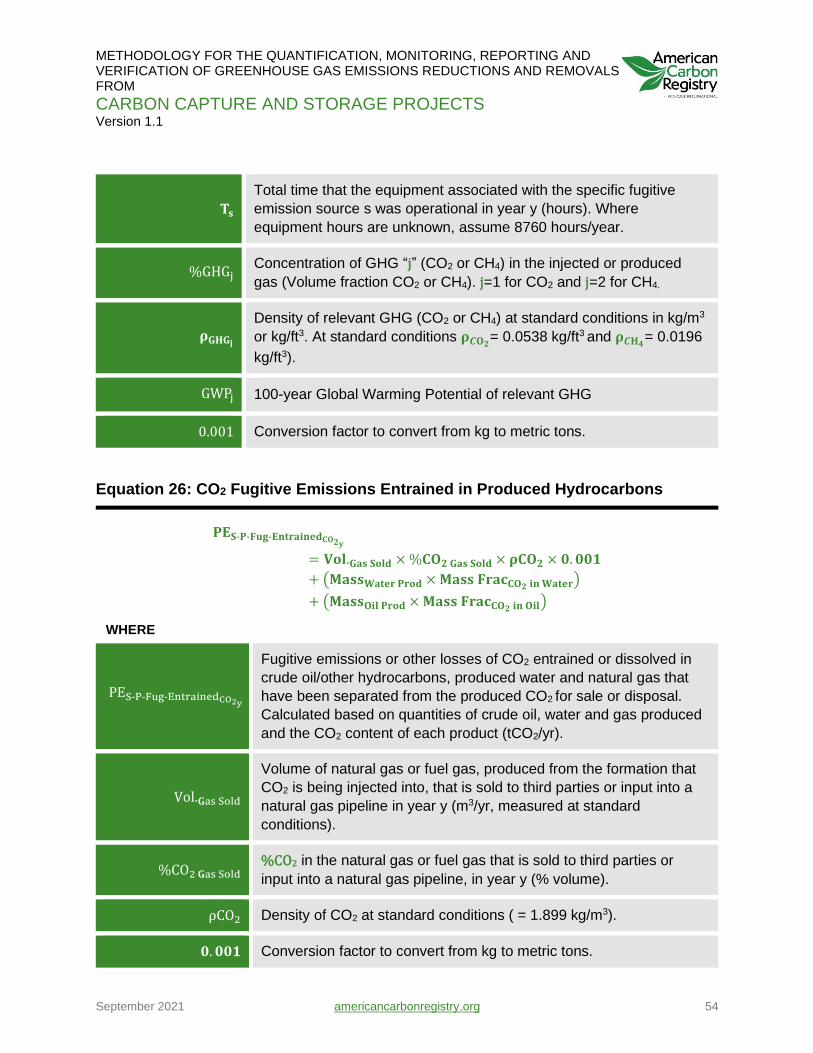
METHODOLOGY FOR THE QUANTIFICATION, MONITORING, REPORTING AND VERIFICATION OF GREENHOUSE GAS EMISSIONS REDUCTIONS AND REMOVALS FROM
CARBON CAPTURE AND STORAGE PROJECTS Version 1.1
September 2021 americancarbonregistry.org 54
𝐓𝐬
Total time that the equipment associated with the specific fugitive
emission source s was operational in year y (hours). Where
equipment hours are unknown, assume 8760 hours/year.
%GHGj Concentration of GHG “j” (CO2 or CH4) in the injected or produced
gas (Volume fraction CO2 or CH4). j=1 for CO2 and j=2 for CH4.
𝛒𝐆𝐇𝐆𝐣
Density of relevant GHG (CO2 or CH4) at standard conditions in kg/m3
or kg/ft3. At standard conditions 𝛒𝑪𝐎𝟐= 0.0538 kg/ft3 and 𝛒𝑪𝐇𝟒
= 0.0196
kg/ft3).
GWPj 100-year Global Warming Potential of relevant GHG
0.001 Conversion factor to convert from kg to metric tons.
Equation 26: CO2 Fugitive Emissions Entrained in Produced Hydrocarbons
𝐏𝐄𝐒-𝐏-𝐅𝐮𝐠-𝐄𝐧𝐭𝐫𝐚𝐢𝐧𝐞𝐝𝐂𝐎𝟐𝐲
= 𝐕𝐨𝐥.𝐆𝐚𝐬 𝐒𝐨𝐥𝐝 × %𝐂𝐎𝟐 𝐆𝐚𝐬 𝐒𝐨𝐥𝐝 × 𝛒𝐂𝐎𝟐 × 𝟎. 𝟎𝟎𝟏
+ (𝐌𝐚𝐬𝐬𝐖𝐚𝐭𝐞𝐫 𝐏𝐫𝐨𝐝 × 𝐌𝐚𝐬𝐬 𝐅𝐫𝐚𝐜𝐂𝐎𝟐 𝐢𝐧 𝐖𝐚𝐭𝐞𝐫)
+ (𝐌𝐚𝐬𝐬𝐎𝐢𝐥 𝐏𝐫𝐨𝐝 × 𝐌𝐚𝐬𝐬 𝐅𝐫𝐚𝐜𝐂𝐎𝟐 𝐢𝐧 𝐎𝐢𝐥)
WHERE
PES-P-Fug-EntrainedCO2y
Fugitive emissions or other losses of CO2 entrained or dissolved in
crude oil/other hydrocarbons, produced water and natural gas that
have been separated from the produced CO2 for sale or disposal.
Calculated based on quantities of crude oil, water and gas produced
and the CO2 content of each product (tCO2/yr).
Vol.𝐆as Sold
Volume of natural gas or fuel gas, produced from the formation that
CO2 is being injected into, that is sold to third parties or input into a
natural gas pipeline in year y (m3/yr, measured at standard
conditions).
%CO2 𝐆as Sold %CO2 in the natural gas or fuel gas that is sold to third parties or
input into a natural gas pipeline, in year y (% volume).
ρCO2 Density of CO2 at standard conditions ( = 1.899 kg/m3).
𝟎. 𝟎𝟎𝟏 Conversion factor to convert from kg to metric tons.
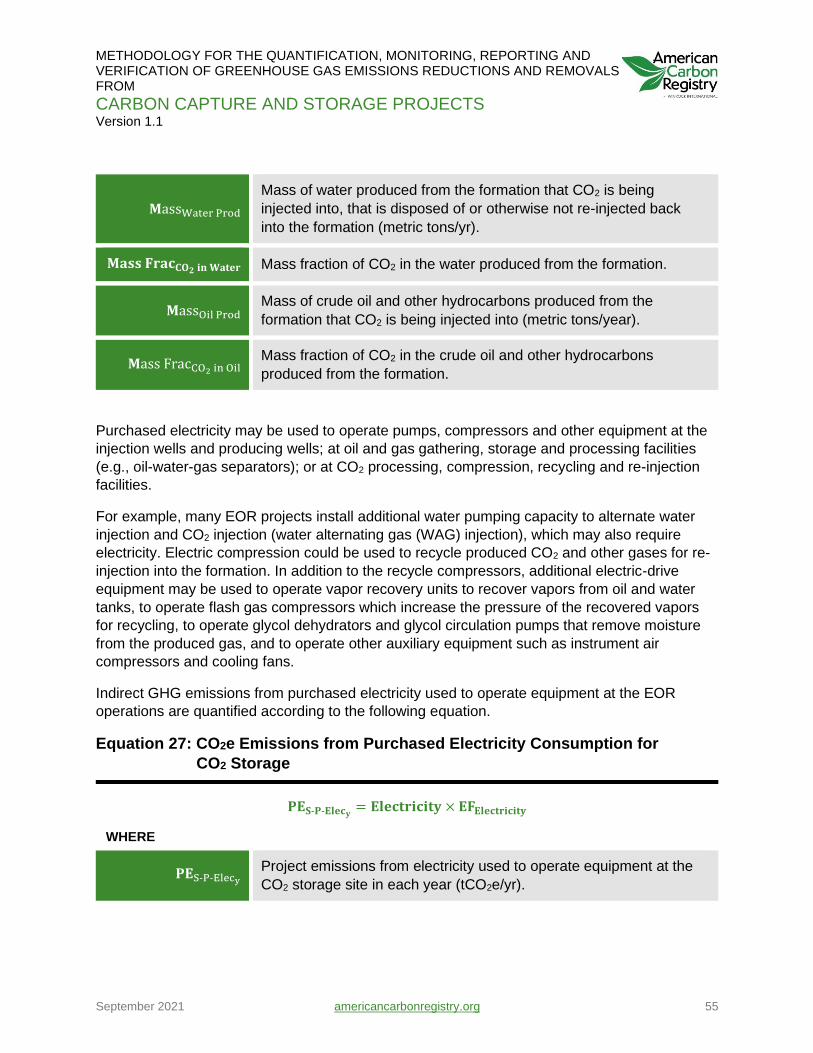
METHODOLOGY FOR THE QUANTIFICATION, MONITORING, REPORTING AND VERIFICATION OF GREENHOUSE GAS EMISSIONS REDUCTIONS AND REMOVALS FROM
CARBON CAPTURE AND STORAGE PROJECTS Version 1.1
September 2021 americancarbonregistry.org 55
𝐌assWater Prod
Mass of water produced from the formation that CO2 is being
injected into, that is disposed of or otherwise not re-injected back
into the formation (metric tons/yr).
𝐌𝐚𝐬𝐬 𝐅𝐫𝐚𝐜𝐂𝐎𝟐 𝐢𝐧 𝐖𝐚𝐭𝐞𝐫 Mass fraction of CO2 in the water produced from the formation.
𝐌assOil Prod Mass of crude oil and other hydrocarbons produced from the
formation that CO2 is being injected into (metric tons/year).
𝐌ass FracCO2 in Oil Mass fraction of CO2 in the crude oil and other hydrocarbons
produced from the formation.
Purchased electricity may be used to operate pumps, compressors and other equipment at the
injection wells and producing wells; at oil and gas gathering, storage and processing facilities
(e.g., oil-water-gas separators); or at CO2 processing, compression, recycling and re-injection
facilities.
For example, many EOR projects install additional water pumping capacity to alternate water
injection and CO2 injection (water alternating gas (WAG) injection), which may also require
electricity. Electric compression could be used to recycle produced CO2 and other gases for re-
injection into the formation. In addition to the recycle compressors, additional electric-drive
equipment may be used to operate vapor recovery units to recover vapors from oil and water
tanks, to operate flash gas compressors which increase the pressure of the recovered vapors
for recycling, to operate glycol dehydrators and glycol circulation pumps that remove moisture
from the produced gas, and to operate other auxiliary equipment such as instrument air
compressors and cooling fans.
Indirect GHG emissions from purchased electricity used to operate equipment at the EOR
operations are quantified according to the following equation.
Equation 27: CO2e Emissions from Purchased Electricity Consumption for
CO2 Storage
𝐏𝐄𝐒-𝐏-𝐄𝐥𝐞𝐜𝐲= 𝐄𝐥𝐞𝐜𝐭𝐫𝐢𝐜𝐢𝐭𝐲 × 𝐄𝐅𝐄𝐥𝐞𝐜𝐭𝐫𝐢𝐜𝐢𝐭𝐲
WHERE
𝐏𝐄S-P-Elecy Project emissions from electricity used to operate equipment at the
CO2 storage site in each year (tCO2e/yr).
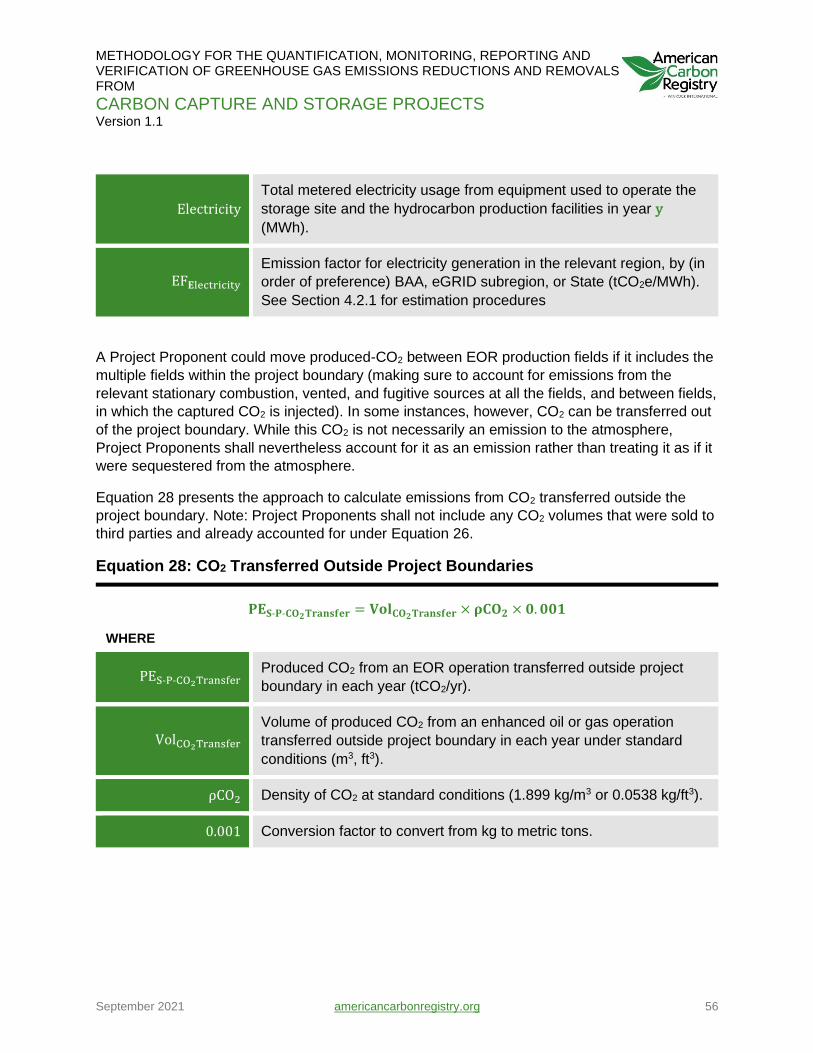
METHODOLOGY FOR THE QUANTIFICATION, MONITORING, REPORTING AND VERIFICATION OF GREENHOUSE GAS EMISSIONS REDUCTIONS AND REMOVALS FROM
CARBON CAPTURE AND STORAGE PROJECTS Version 1.1
September 2021 americancarbonregistry.org 56
Electricity
Total metered electricity usage from equipment used to operate the
storage site and the hydrocarbon production facilities in year y
(MWh).
EF𝐄lectricity
Emission factor for electricity generation in the relevant region, by (in
order of preference) BAA, eGRID subregion, or State (tCO2e/MWh).
See Section 4.2.1 for estimation procedures
A Project Proponent could move produced-CO2 between EOR production fields if it includes the
multiple fields within the project boundary (making sure to account for emissions from the
relevant stationary combustion, vented, and fugitive sources at all the fields, and between fields,
in which the captured CO2 is injected). In some instances, however, CO2 can be transferred out
of the project boundary. While this CO2 is not necessarily an emission to the atmosphere,
Project Proponents shall nevertheless account for it as an emission rather than treating it as if it
were sequestered from the atmosphere.
Equation 28 presents the approach to calculate emissions from CO2 transferred outside the
project boundary. Note: Project Proponents shall not include any CO2 volumes that were sold to
third parties and already accounted for under Equation 26.
Equation 28: CO2 Transferred Outside Project Boundaries
𝐏𝐄𝐒-𝐏-𝐂𝐎𝟐𝐓𝐫𝐚𝐧𝐬𝐟𝐞𝐫 = 𝐕𝐨𝐥𝐂𝐎𝟐𝐓𝐫𝐚𝐧𝐬𝐟𝐞𝐫 × 𝛒𝐂𝐎𝟐 × 𝟎. 𝟎𝟎𝟏
WHERE
PES-P-CO2Transfer Produced CO2 from an EOR operation transferred outside project
boundary in each year (tCO2/yr).
VolCO2Transfer Volume of produced CO2 from an enhanced oil or gas operation
transferred outside project boundary in each year under standard
conditions (m3, ft3).
ρCO2 Density of CO2 at standard conditions (1.899 kg/m3 or 0.0538 kg/ft3).
0.001 Conversion factor to convert from kg to metric tons.
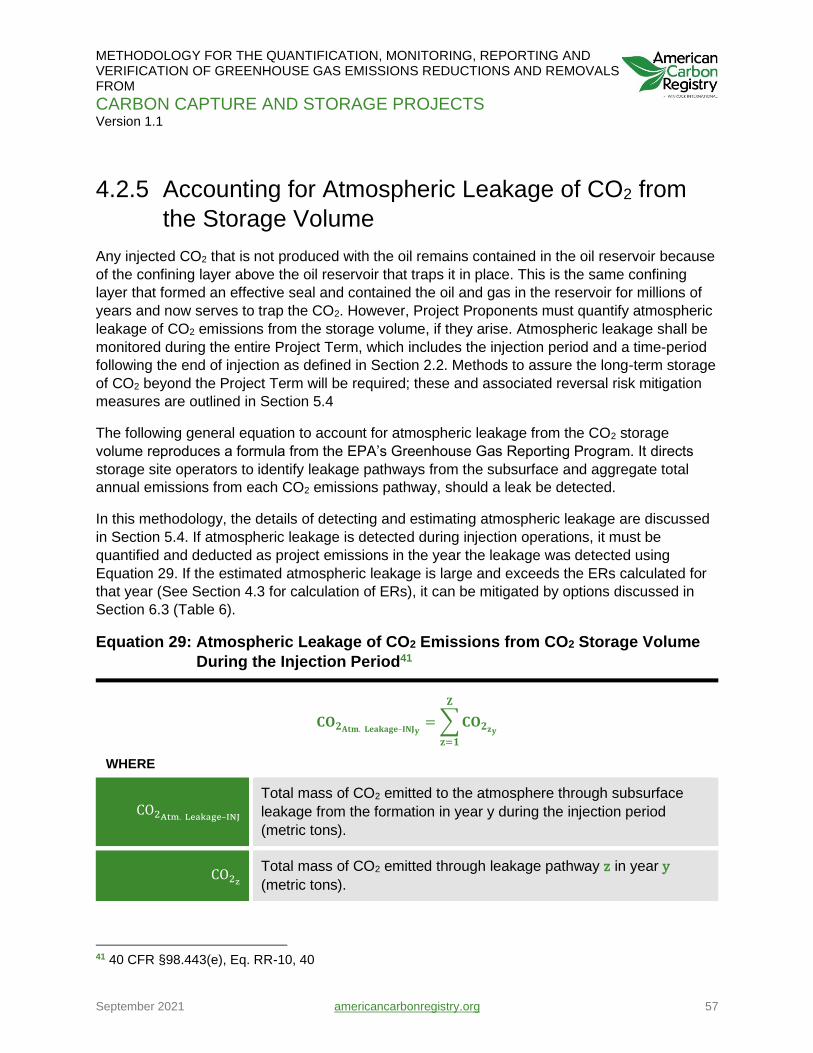
METHODOLOGY FOR THE QUANTIFICATION, MONITORING, REPORTING AND VERIFICATION OF GREENHOUSE GAS EMISSIONS REDUCTIONS AND REMOVALS FROM
CARBON CAPTURE AND STORAGE PROJECTS Version 1.1
September 2021 americancarbonregistry.org 57
4.2.5 Accounting for Atmospheric Leakage of CO2 from
the Storage Volume
Any injected CO2 that is not produced with the oil remains contained in the oil reservoir because
of the confining layer above the oil reservoir that traps it in place. This is the same confining
layer that formed an effective seal and contained the oil and gas in the reservoir for millions of
years and now serves to trap the CO2. However, Project Proponents must quantify atmospheric
leakage of CO2 emissions from the storage volume, if they arise. Atmospheric leakage shall be
monitored during the entire Project Term, which includes the injection period and a time-period
following the end of injection as defined in Section 2.2. Methods to assure the long-term storage
of CO2 beyond the Project Term will be required; these and associated reversal risk mitigation
measures are outlined in Section 5.4
The following general equation to account for atmospheric leakage from the CO2 storage
volume reproduces a formula from the EPA’s Greenhouse Gas Reporting Program. It directs
storage site operators to identify leakage pathways from the subsurface and aggregate total
annual emissions from each CO2 emissions pathway, should a leak be detected.
In this methodology, the details of detecting and estimating atmospheric leakage are discussed
in Section 5.4. If atmospheric leakage is detected during injection operations, it must be
quantified and deducted as project emissions in the year the leakage was detected using
Equation 29. If the estimated atmospheric leakage is large and exceeds the ERs calculated for
that year (See Section 4.3 for calculation of ERs), it can be mitigated by options discussed in
Section 6.3 (Table 6).
Equation 29: Atmospheric Leakage of CO2 Emissions from CO2 Storage Volume
During the Injection Period41
𝐂𝐎𝟐𝐀𝐭𝐦. 𝐋𝐞𝐚𝐤𝐚𝐠𝐞–𝐈𝐍𝐉𝐲= ∑ 𝐂𝐎𝟐𝐳𝐲
𝐙
𝐳=𝟏
WHERE
CO2Atm. Leakage–INJ
Total mass of CO2 emitted to the atmosphere through subsurface
leakage from the formation in year y during the injection period
(metric tons).
CO2z
Total mass of CO2 emitted through leakage pathway z in year y
(metric tons).
41 40 CFR §98.443(e), Eq. RR-10, 40
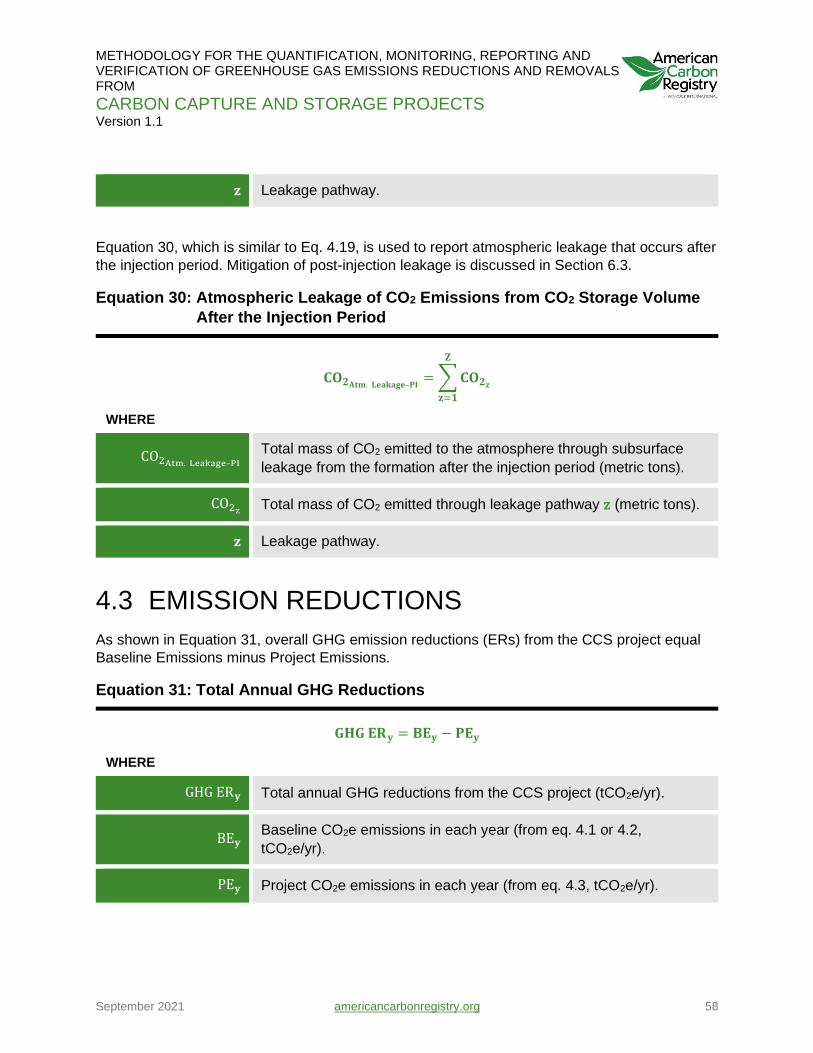
METHODOLOGY FOR THE QUANTIFICATION, MONITORING, REPORTING AND VERIFICATION OF GREENHOUSE GAS EMISSIONS REDUCTIONS AND REMOVALS FROM
CARBON CAPTURE AND STORAGE PROJECTS Version 1.1
September 2021 americancarbonregistry.org 58
𝐳 Leakage pathway.
Equation 30, which is similar to Eq. 4.19, is used to report atmospheric leakage that occurs after
the injection period. Mitigation of post-injection leakage is discussed in Section 6.3.
Equation 30: Atmospheric Leakage of CO2 Emissions from CO2 Storage Volume
After the Injection Period
𝐂𝐎𝟐𝐀𝐭𝐦. 𝐋𝐞𝐚𝐤𝐚𝐠𝐞–𝐏𝐈= ∑ 𝐂𝐎𝟐𝐳
𝐙
𝐳=𝟏
WHERE
CO2Atm. Leakage–PI
Total mass of CO2 emitted to the atmosphere through subsurface
leakage from the formation after the injection period (metric tons).
CO2z Total mass of CO2 emitted through leakage pathway z (metric tons).
𝐳 Leakage pathway.
4.3 EMISSION REDUCTIONS
As shown in Equation 31, overall GHG emission reductions (ERs) from the CCS project equal
Baseline Emissions minus Project Emissions.
Equation 31: Total Annual GHG Reductions
𝐆𝐇𝐆 𝐄𝐑𝐲 = 𝐁𝐄𝐲 − 𝐏𝐄𝐲
WHERE
GHG ER𝐲 Total annual GHG reductions from the CCS project (tCO2e/yr).
BE𝐲 Baseline CO2e emissions in each year (from eq. 4.1 or 4.2,
tCO2e/yr).
PE𝐲 Project CO2e emissions in each year (from eq. 4.3, tCO2e/yr).
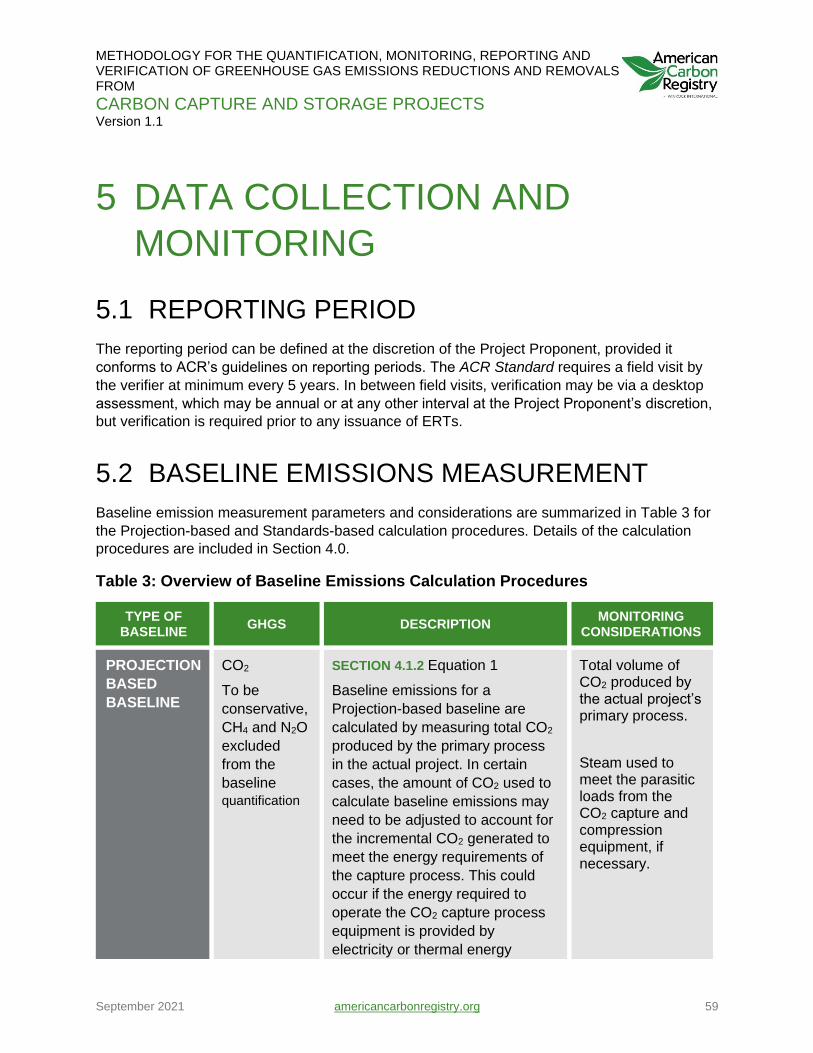
METHODOLOGY FOR THE QUANTIFICATION, MONITORING, REPORTING AND VERIFICATION OF GREENHOUSE GAS EMISSIONS REDUCTIONS AND REMOVALS FROM
CARBON CAPTURE AND STORAGE PROJECTS Version 1.1
September 2021 americancarbonregistry.org 59
5 DATA COLLECTION AND
MONITORING
5.1 REPORTING PERIOD
The reporting period can be defined at the discretion of the Project Proponent, provided it
conforms to ACR’s guidelines on reporting periods. The ACR Standard requires a field visit by
the verifier at minimum every 5 years. In between field visits, verification may be via a desktop
assessment, which may be annual or at any other interval at the Project Proponent’s discretion,
but verification is required prior to any issuance of ERTs.
5.2 BASELINE EMISSIONS MEASUREMENT
Baseline emission measurement parameters and considerations are summarized in Table 3 for
the Projection-based and Standards-based calculation procedures. Details of the calculation
procedures are included in Section 4.0.
Table 3: Overview of Baseline Emissions Calculation Procedures
TYPE OF BASELINE
GHGS DESCRIPTION MONITORING
CONSIDERATIONS
PROJECTION
BASED
BASELINE
CO2
To be
conservative,
CH4 and N2O
excluded
from the
baseline
quantification
SECTION 4.1.2 Equation 1
Baseline emissions for a
Projection-based baseline are
calculated by measuring total CO2
produced by the primary process
in the actual project. In certain
cases, the amount of CO2 used to
calculate baseline emissions may
need to be adjusted to account for
the incremental CO2 generated to
meet the energy requirements of
the capture process. This could
occur if the energy required to
operate the CO2 capture process
equipment is provided by
electricity or thermal energy
Total volume of CO2 produced by the actual project’s primary process.
Steam used to meet the parasitic loads from the CO2 capture and compression equipment, if necessary.
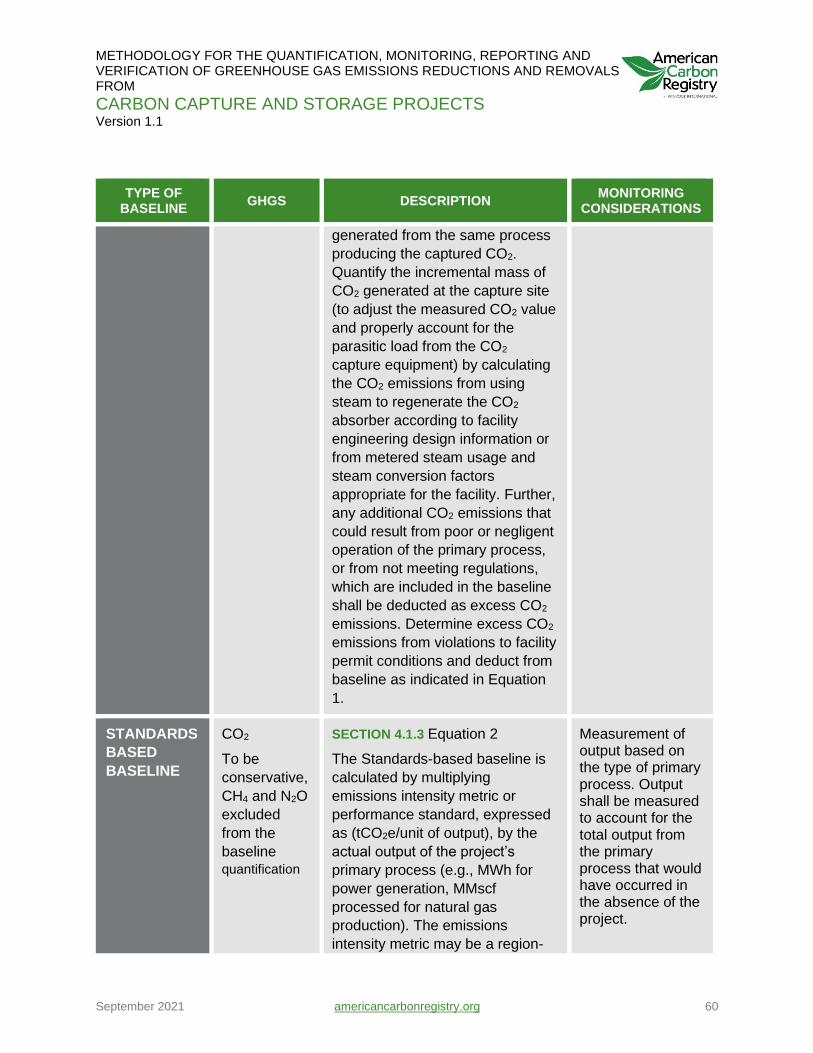
METHODOLOGY FOR THE QUANTIFICATION, MONITORING, REPORTING AND VERIFICATION OF GREENHOUSE GAS EMISSIONS REDUCTIONS AND REMOVALS FROM
CARBON CAPTURE AND STORAGE PROJECTS Version 1.1
September 2021 americancarbonregistry.org 60
TYPE OF BASELINE
GHGS DESCRIPTION MONITORING
CONSIDERATIONS
generated from the same process
producing the captured CO2.
Quantify the incremental mass of
CO2 generated at the capture site
(to adjust the measured CO2 value
and properly account for the
parasitic load from the CO2
capture equipment) by calculating
the CO2 emissions from using
steam to regenerate the CO2
absorber according to facility
engineering design information or
from metered steam usage and
steam conversion factors
appropriate for the facility. Further,
any additional CO2 emissions that
could result from poor or negligent
operation of the primary process,
or from not meeting regulations,
which are included in the baseline
shall be deducted as excess CO2
emissions. Determine excess CO2
emissions from violations to facility
permit conditions and deduct from
baseline as indicated in Equation
1.
STANDARDS
BASED
BASELINE
CO2
To be
conservative,
CH4 and N2O
excluded
from the
baseline
quantification
SECTION 4.1.3 Equation 2
The Standards-based baseline is
calculated by multiplying
emissions intensity metric or
performance standard, expressed
as (tCO2e/unit of output), by the
actual output of the project’s
primary process (e.g., MWh for
power generation, MMscf
processed for natural gas
production). The emissions
intensity metric may be a region-
Measurement of output based on the type of primary process. Output shall be measured to account for the total output from the primary process that would have occurred in the absence of the project.
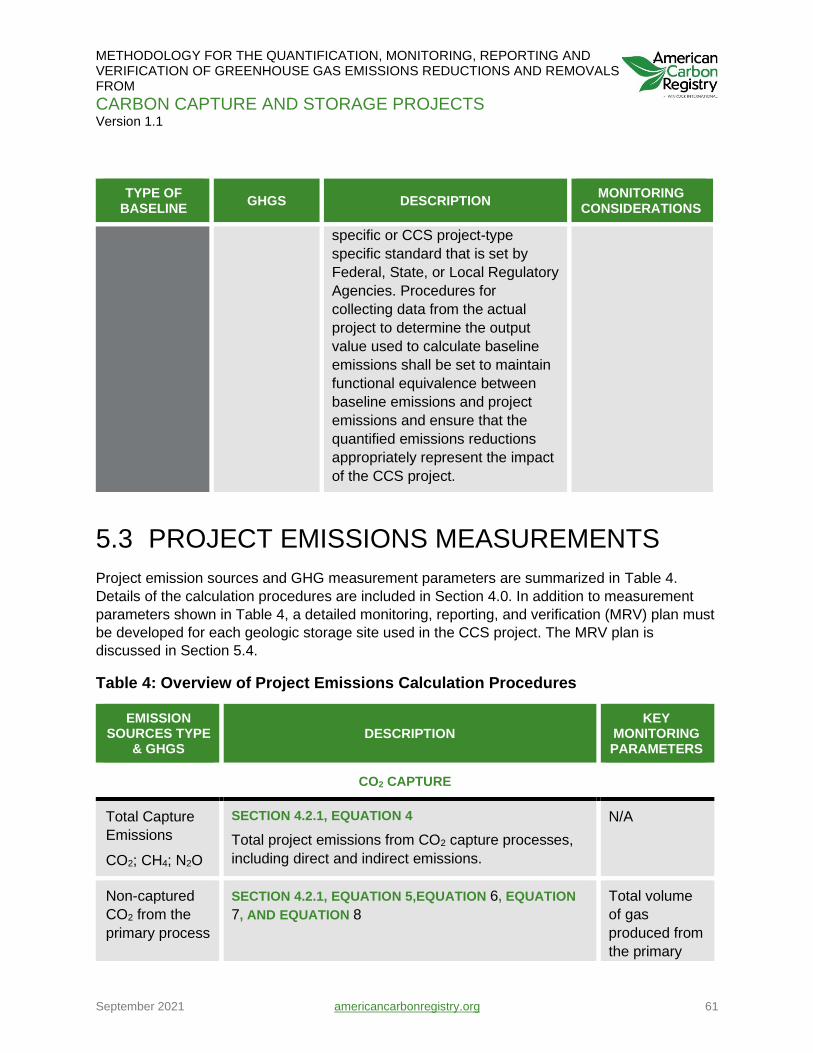
METHODOLOGY FOR THE QUANTIFICATION, MONITORING, REPORTING AND VERIFICATION OF GREENHOUSE GAS EMISSIONS REDUCTIONS AND REMOVALS FROM
CARBON CAPTURE AND STORAGE PROJECTS Version 1.1
September 2021 americancarbonregistry.org 61
TYPE OF BASELINE
GHGS DESCRIPTION MONITORING
CONSIDERATIONS
specific or CCS project-type
specific standard that is set by
Federal, State, or Local Regulatory
Agencies. Procedures for
collecting data from the actual
project to determine the output
value used to calculate baseline
emissions shall be set to maintain
functional equivalence between
baseline emissions and project
emissions and ensure that the
quantified emissions reductions
appropriately represent the impact
of the CCS project.
5.3 PROJECT EMISSIONS MEASUREMENTS
Project emission sources and GHG measurement parameters are summarized in Table 4.
Details of the calculation procedures are included in Section 4.0. In addition to measurement
parameters shown in Table 4, a detailed monitoring, reporting, and verification (MRV) plan must
be developed for each geologic storage site used in the CCS project. The MRV plan is
discussed in Section 5.4.
Table 4: Overview of Project Emissions Calculation Procedures
EMISSION SOURCES TYPE
& GHGS DESCRIPTION
KEY MONITORING PARAMETERS
CO2 CAPTURE
Total Capture
Emissions
CO2; CH4; N2O
SECTION 4.2.1, EQUATION 4
Total project emissions from CO2 capture processes,
including direct and indirect emissions.
N/A
Non-captured
CO2 from the
primary process
SECTION 4.2.1, EQUATION 5,EQUATION 6, EQUATION
7, AND EQUATION 8
Total volume
of gas
produced from
the primary
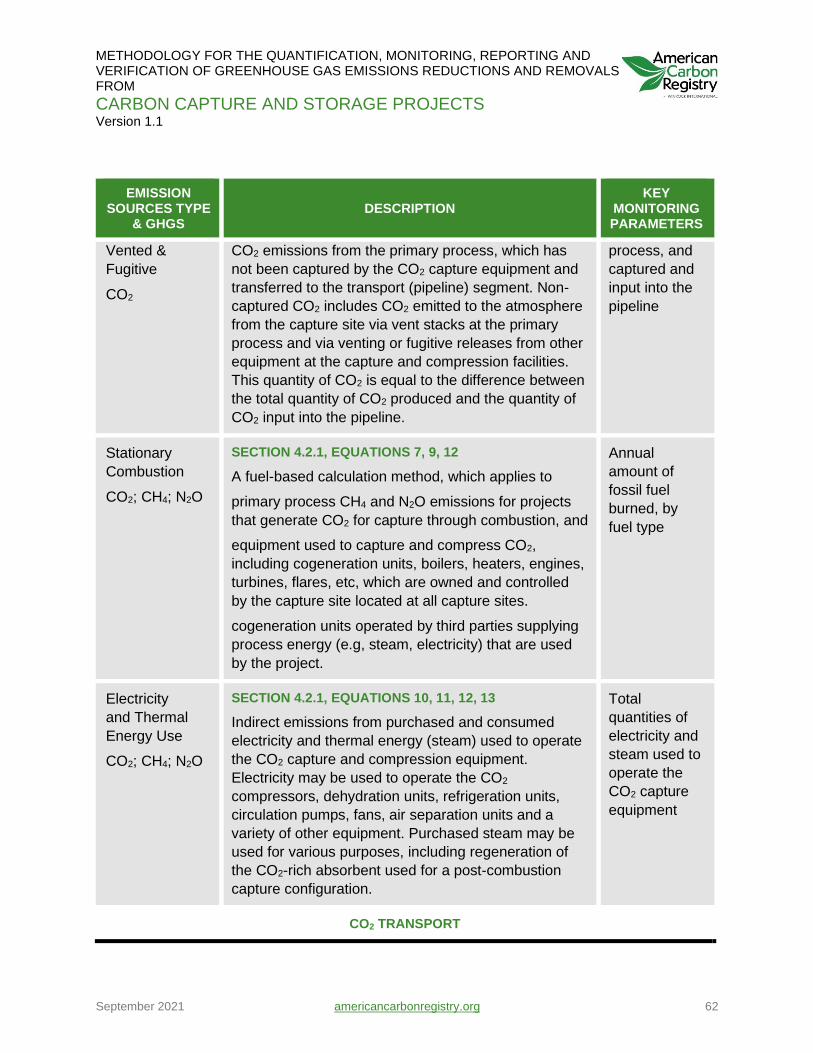
METHODOLOGY FOR THE QUANTIFICATION, MONITORING, REPORTING AND VERIFICATION OF GREENHOUSE GAS EMISSIONS REDUCTIONS AND REMOVALS FROM
CARBON CAPTURE AND STORAGE PROJECTS Version 1.1
September 2021 americancarbonregistry.org 62
EMISSION SOURCES TYPE
& GHGS DESCRIPTION
KEY MONITORING PARAMETERS
Vented &
Fugitive
CO2
CO2 emissions from the primary process, which has
not been captured by the CO2 capture equipment and
transferred to the transport (pipeline) segment. Non-
captured CO2 includes CO2 emitted to the atmosphere
from the capture site via vent stacks at the primary
process and via venting or fugitive releases from other
equipment at the capture and compression facilities.
This quantity of CO2 is equal to the difference between
the total quantity of CO2 produced and the quantity of
CO2 input into the pipeline.
process, and
captured and
input into the
pipeline
Stationary
Combustion
CO2; CH4; N2O
SECTION 4.2.1, EQUATIONS 7, 9, 12
A fuel-based calculation method, which applies to
primary process CH4 and N2O emissions for projects
that generate CO2 for capture through combustion, and
equipment used to capture and compress CO2,
including cogeneration units, boilers, heaters, engines,
turbines, flares, etc, which are owned and controlled
by the capture site located at all capture sites.
cogeneration units operated by third parties supplying
process energy (e.g, steam, electricity) that are used
by the project.
Annual
amount of
fossil fuel
burned, by
fuel type
Electricity
and Thermal
Energy Use
CO2; CH4; N2O
SECTION 4.2.1, EQUATIONS 10, 11, 12, 13
Indirect emissions from purchased and consumed
electricity and thermal energy (steam) used to operate
the CO2 capture and compression equipment.
Electricity may be used to operate the CO2
compressors, dehydration units, refrigeration units,
circulation pumps, fans, air separation units and a
variety of other equipment. Purchased steam may be
used for various purposes, including regeneration of
the CO2-rich absorbent used for a post-combustion
capture configuration.
Total
quantities of
electricity and
steam used to
operate the
CO2 capture
equipment
CO2 TRANSPORT
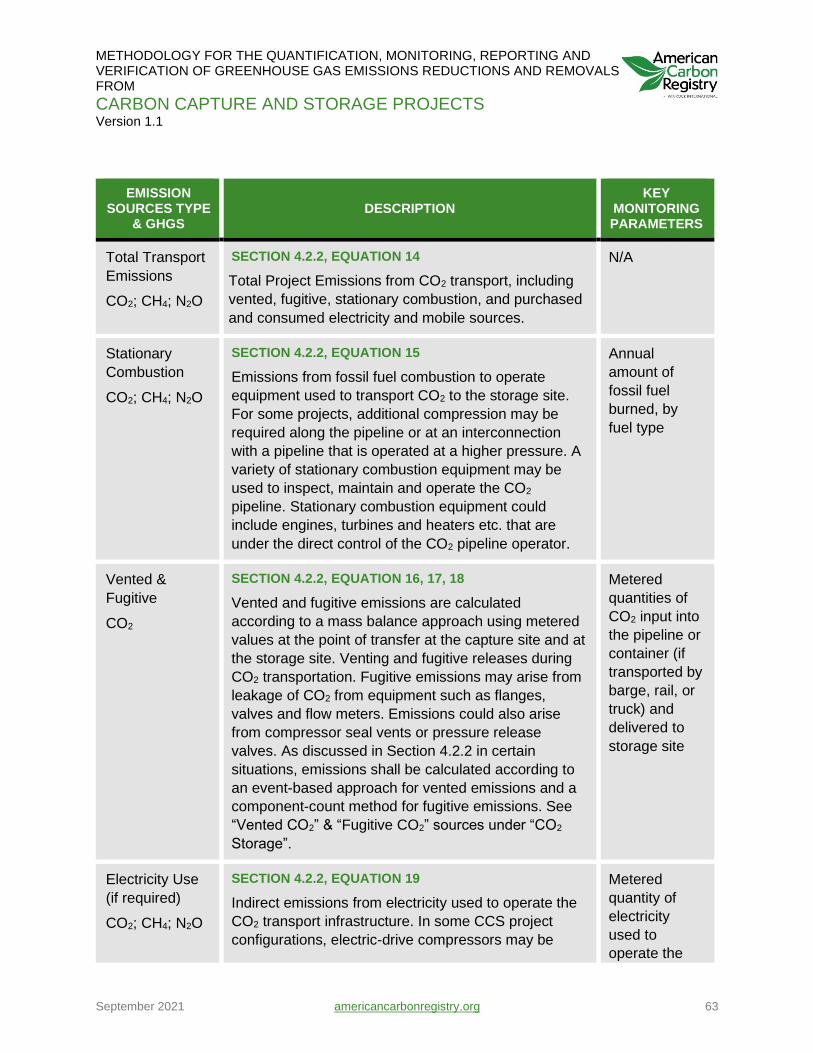
METHODOLOGY FOR THE QUANTIFICATION, MONITORING, REPORTING AND VERIFICATION OF GREENHOUSE GAS EMISSIONS REDUCTIONS AND REMOVALS FROM
CARBON CAPTURE AND STORAGE PROJECTS Version 1.1
September 2021 americancarbonregistry.org 63
EMISSION SOURCES TYPE
& GHGS DESCRIPTION
KEY MONITORING PARAMETERS
Total Transport
Emissions
CO2; CH4; N2O
SECTION 4.2.2, EQUATION 14
Total Project Emissions from CO2 transport, including
vented, fugitive, stationary combustion, and purchased
and consumed electricity and mobile sources.
N/A
Stationary
Combustion
CO2; CH4; N2O
SECTION 4.2.2, EQUATION 15
Emissions from fossil fuel combustion to operate
equipment used to transport CO2 to the storage site.
For some projects, additional compression may be
required along the pipeline or at an interconnection
with a pipeline that is operated at a higher pressure. A
variety of stationary combustion equipment may be
used to inspect, maintain and operate the CO2
pipeline. Stationary combustion equipment could
include engines, turbines and heaters etc. that are
under the direct control of the CO2 pipeline operator.
Annual
amount of
fossil fuel
burned, by
fuel type
Vented &
Fugitive
CO2
SECTION 4.2.2, EQUATION 16, 17, 18
Vented and fugitive emissions are calculated
according to a mass balance approach using metered
values at the point of transfer at the capture site and at
the storage site. Venting and fugitive releases during
CO2 transportation. Fugitive emissions may arise from
leakage of CO2 from equipment such as flanges,
valves and flow meters. Emissions could also arise
from compressor seal vents or pressure release
valves. As discussed in Section 4.2.2 in certain
situations, emissions shall be calculated according to
an event-based approach for vented emissions and a
component-count method for fugitive emissions. See
“Vented CO2” & “Fugitive CO2” sources under “CO2
Storage”.
Metered
quantities of
CO2 input into
the pipeline or
container (if
transported by
barge, rail, or
truck) and
delivered to
storage site
Electricity Use
(if required)
CO2; CH4; N2O
SECTION 4.2.2, EQUATION 19
Indirect emissions from electricity used to operate the
CO2 transport infrastructure. In some CCS project
configurations, electric-drive compressors may be
Metered
quantity of
electricity
used to
operate the
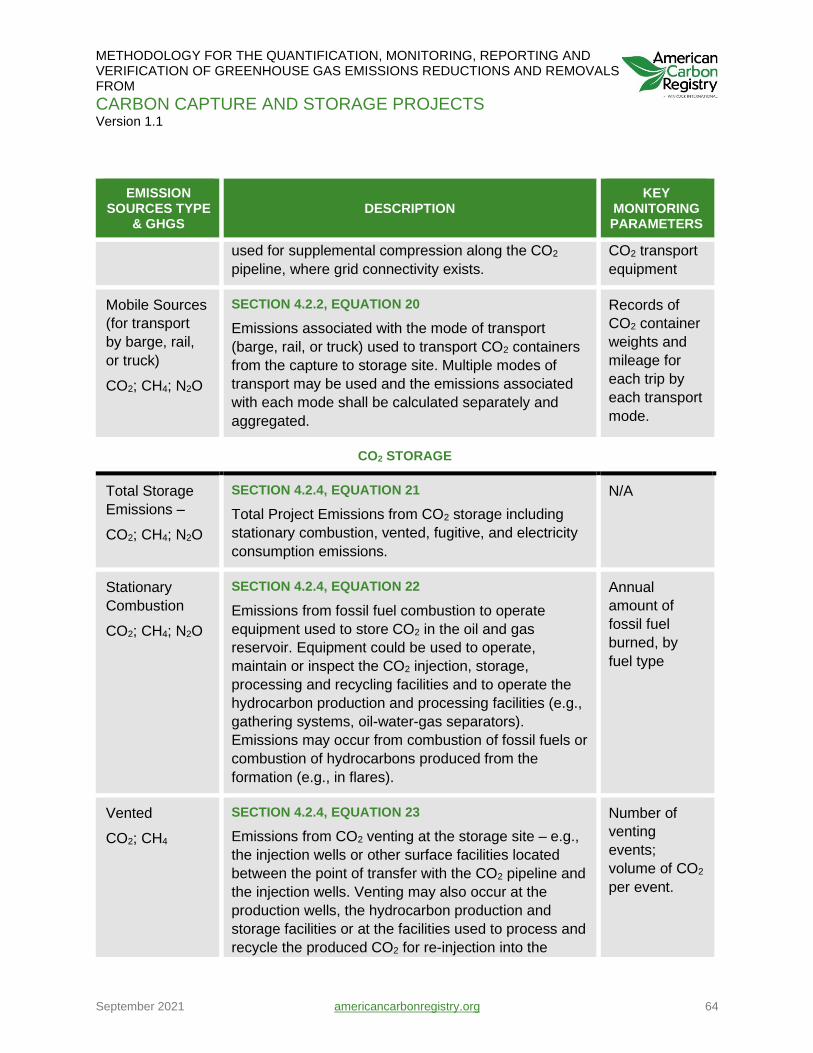
METHODOLOGY FOR THE QUANTIFICATION, MONITORING, REPORTING AND VERIFICATION OF GREENHOUSE GAS EMISSIONS REDUCTIONS AND REMOVALS FROM
CARBON CAPTURE AND STORAGE PROJECTS Version 1.1
September 2021 americancarbonregistry.org 64
EMISSION SOURCES TYPE
& GHGS DESCRIPTION
KEY MONITORING PARAMETERS
used for supplemental compression along the CO2
pipeline, where grid connectivity exists.
CO2 transport
equipment
Mobile Sources
(for transport
by barge, rail,
or truck)
CO2; CH4; N2O
SECTION 4.2.2, EQUATION 20
Emissions associated with the mode of transport
(barge, rail, or truck) used to transport CO2 containers
from the capture to storage site. Multiple modes of
transport may be used and the emissions associated
with each mode shall be calculated separately and
aggregated.
Records of
CO2 container
weights and
mileage for
each trip by
each transport
mode.
CO2 STORAGE
Total Storage
Emissions –
CO2; CH4; N2O
SECTION 4.2.4, EQUATION 21
Total Project Emissions from CO2 storage including
stationary combustion, vented, fugitive, and electricity
consumption emissions.
N/A
Stationary
Combustion
CO2; CH4; N2O
SECTION 4.2.4, EQUATION 22
Emissions from fossil fuel combustion to operate
equipment used to store CO2 in the oil and gas
reservoir. Equipment could be used to operate,
maintain or inspect the CO2 injection, storage,
processing and recycling facilities and to operate the
hydrocarbon production and processing facilities (e.g.,
gathering systems, oil-water-gas separators).
Emissions may occur from combustion of fossil fuels or
combustion of hydrocarbons produced from the
formation (e.g., in flares).
Annual
amount of
fossil fuel
burned, by
fuel type
Vented
CO2; CH4
SECTION 4.2.4, EQUATION 23
Emissions from CO2 venting at the storage site – e.g.,
the injection wells or other surface facilities located
between the point of transfer with the CO2 pipeline and
the injection wells. Venting may also occur at the
production wells, the hydrocarbon production and
storage facilities or at the facilities used to process and
recycle the produced CO2 for re-injection into the
Number of
venting
events;
volume of CO2
per event.
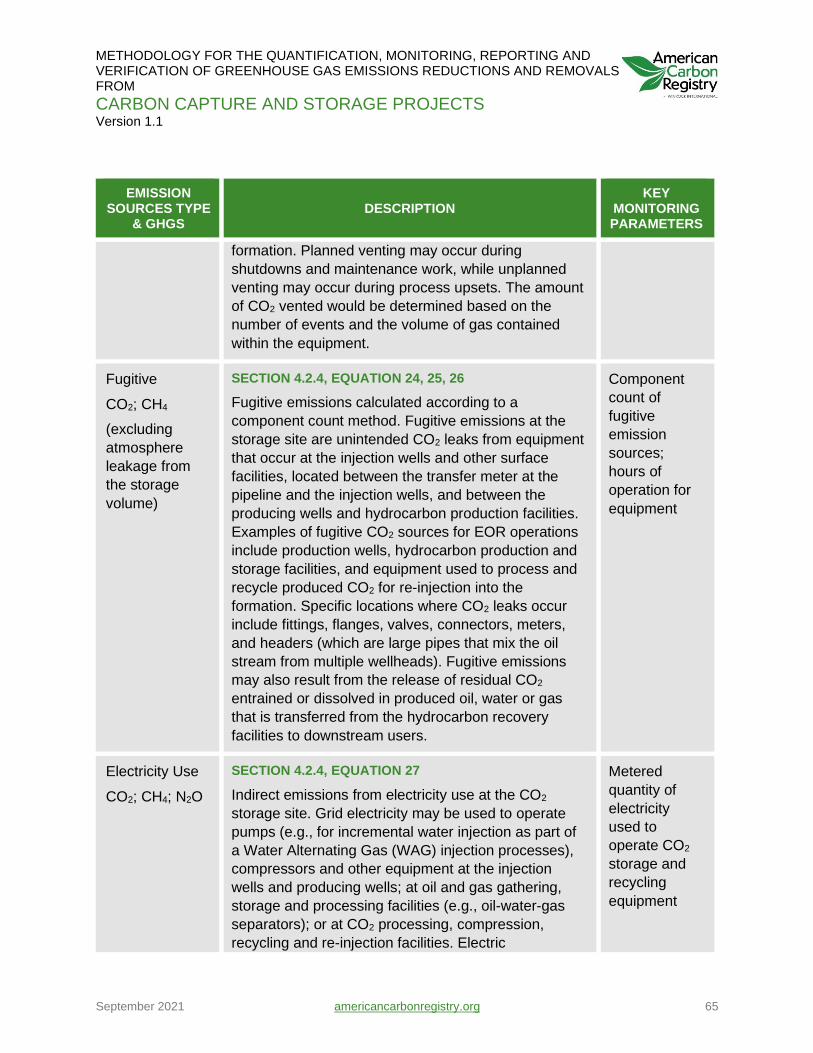
METHODOLOGY FOR THE QUANTIFICATION, MONITORING, REPORTING AND VERIFICATION OF GREENHOUSE GAS EMISSIONS REDUCTIONS AND REMOVALS FROM
CARBON CAPTURE AND STORAGE PROJECTS Version 1.1
September 2021 americancarbonregistry.org 65
EMISSION SOURCES TYPE
& GHGS DESCRIPTION
KEY MONITORING PARAMETERS
formation. Planned venting may occur during
shutdowns and maintenance work, while unplanned
venting may occur during process upsets. The amount
of CO2 vented would be determined based on the
number of events and the volume of gas contained
within the equipment.
Fugitive
CO2; CH4
(excluding
atmosphere
leakage from
the storage
volume)
SECTION 4.2.4, EQUATION 24, 25, 26
Fugitive emissions calculated according to a
component count method. Fugitive emissions at the
storage site are unintended CO2 leaks from equipment
that occur at the injection wells and other surface
facilities, located between the transfer meter at the
pipeline and the injection wells, and between the
producing wells and hydrocarbon production facilities.
Examples of fugitive CO2 sources for EOR operations
include production wells, hydrocarbon production and
storage facilities, and equipment used to process and
recycle produced CO2 for re-injection into the
formation. Specific locations where CO2 leaks occur
include fittings, flanges, valves, connectors, meters,
and headers (which are large pipes that mix the oil
stream from multiple wellheads). Fugitive emissions
may also result from the release of residual CO2
entrained or dissolved in produced oil, water or gas
that is transferred from the hydrocarbon recovery
facilities to downstream users.
Component
count of
fugitive
emission
sources;
hours of
operation for
equipment
Electricity Use
CO2; CH4; N2O
SECTION 4.2.4, EQUATION 27
Indirect emissions from electricity use at the CO2
storage site. Grid electricity may be used to operate
pumps (e.g., for incremental water injection as part of
a Water Alternating Gas (WAG) injection processes),
compressors and other equipment at the injection
wells and producing wells; at oil and gas gathering,
storage and processing facilities (e.g., oil-water-gas
separators); or at CO2 processing, compression,
recycling and re-injection facilities. Electric
Metered
quantity of
electricity
used to
operate CO2
storage and
recycling
equipment
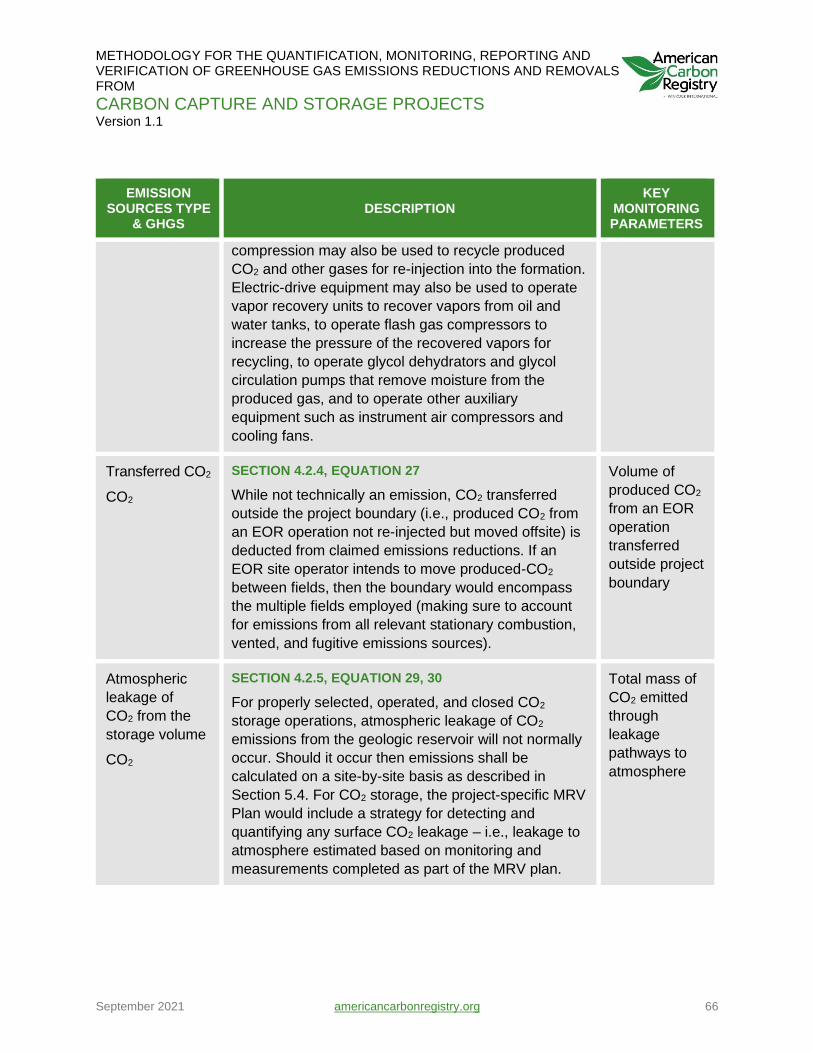
METHODOLOGY FOR THE QUANTIFICATION, MONITORING, REPORTING AND VERIFICATION OF GREENHOUSE GAS EMISSIONS REDUCTIONS AND REMOVALS FROM
CARBON CAPTURE AND STORAGE PROJECTS Version 1.1
September 2021 americancarbonregistry.org 66
EMISSION SOURCES TYPE
& GHGS DESCRIPTION
KEY MONITORING PARAMETERS
compression may also be used to recycle produced
CO2 and other gases for re-injection into the formation.
Electric-drive equipment may also be used to operate
vapor recovery units to recover vapors from oil and
water tanks, to operate flash gas compressors to
increase the pressure of the recovered vapors for
recycling, to operate glycol dehydrators and glycol
circulation pumps that remove moisture from the
produced gas, and to operate other auxiliary
equipment such as instrument air compressors and
cooling fans.
Transferred CO2
CO2
SECTION 4.2.4, EQUATION 27
While not technically an emission, CO2 transferred
outside the project boundary (i.e., produced CO2 from
an EOR operation not re-injected but moved offsite) is
deducted from claimed emissions reductions. If an
EOR site operator intends to move produced-CO2
between fields, then the boundary would encompass
the multiple fields employed (making sure to account
for emissions from all relevant stationary combustion,
vented, and fugitive emissions sources).
Volume of
produced CO2
from an EOR
operation
transferred
outside project
boundary
Atmospheric
leakage of
CO2 from the
storage volume
CO2
SECTION 4.2.5, EQUATION 29, 30
For properly selected, operated, and closed CO2
storage operations, atmospheric leakage of CO2
emissions from the geologic reservoir will not normally
occur. Should it occur then emissions shall be
calculated on a site-by-site basis as described in
Section 5.4. For CO2 storage, the project-specific MRV
Plan would include a strategy for detecting and
quantifying any surface CO2 leakage – i.e., leakage to
atmosphere estimated based on monitoring and
measurements completed as part of the MRV plan.
Total mass of
CO2 emitted
through
leakage
pathways to
atmosphere
METHODOLOGY FOR THE QUANTIFICATION, MONITORING, REPORTING AND VERIFICATION OF GREENHOUSE GAS EMISSIONS REDUCTIONS AND REMOVALS FROM
CARBON CAPTURE AND STORAGE PROJECTS Version 1.1
September 2021 americancarbonregistry.org 67
5.4 MONITORING, REPORTING, AND
VERIFICATION (MRV) PLAN
The IOGCC’s Task Force on Carbon Capture and Geologic Storage concluded that monitoring
and verification of CCS projects would be accomplished best in the subsurface, given the
uncertainties and changing technologies of surface monitoring techniques.42 The Task Force
has recommended that the operator submit a comprehensive monitoring plan that is tailored to
the specific characteristics of the site. Similar recommendations were made by the USDOE,
which indicated that MRV programs need to be flexible and site-specific to adapt to the inherent
variability and heterogeneity of geologic systems. MRV plans also change in scope as a project
progresses from the pre-injection phase to the post-injection phase. For all these reasons, MRV
plans need to be tailored to site-specific geologic conditions and operational considerations.43
5.4.1 MRV Plan Framework
A MRV framework for CCS projects shall include the following components:
Determination of the storage volume that is expected to contain the injected CO2 during and
after the injection period, determined through modeling and flow simulations.
Identification of potential leakage pathways within this storage volume (usually well bores,
faults, and fractures). This information can also feed into the flow simulation model as a
potential source of uncertainty.
Remediation of potential leakage pathways, as needed. This can help reduce the probability
of leakage and reduce uncertainty in detecting atmospheric leakage.
Development of a monitoring strategy to demonstrate effective retention of anthropogenic
CO2 during injection and post-injection periods and for detection of the potential for
atmospheric leakage.
A strategy for quantifying any atmospheric leakage of CO2.
A plan for monitoring the parameters included in Table 5.
5.4.1.1 DETERMINATION OF STORAGE VOLUME
The storage volume is the rock volume planned to contain the injected CO2, which includes a
vertical and lateral boundary. The vertical boundary shall be set at the top of the confining zone.
The lateral boundary shall be set initially at the expected lateral extent of the plume. The lateral
42 Storage of Carbon Dioxide in Geologic Structures, A Legal and Regulatory Guide for States and
Provinces, The Interstate Oil and Gas Compact Commission, September 2007 43 Best Practices for Monitoring, Verification, and Accounting of CO2 Stored in Deep Geologic Formations
– 2012 Update, DOE/NETL-2012/1568, October 2012
METHODOLOGY FOR THE QUANTIFICATION, MONITORING, REPORTING AND VERIFICATION OF GREENHOUSE GAS EMISSIONS REDUCTIONS AND REMOVALS FROM
CARBON CAPTURE AND STORAGE PROJECTS Version 1.1
September 2021 americancarbonregistry.org 68
extent is determined through flow simulations of the injection conducted to a point in time when
the CO2 plume ceases to migrate after injection is stopped. The simulation shall account for
uncertainties in modeled parameters and potential leakage pathways that could lead to leakage.
It may be necessary to redefine the lateral boundary during operations, if the actual injection
process differs from the modeled scenarios or other changes are detected that affect the extent
of the lateral boundary. An additional buffer region shall be included to account for these
uncertainties and for conservativeness. Both vertical and lateral boundaries shall encompass
the limits of acceptable CO2 migration.
5.4.1.2 IDENTIFICATION AND REMEDIATION OF POTENTIAL
ATMOSPHERIC LEAKAGE PATHWAYS
Potential leakage pathways shall be determined through a detailed site characterization.
Examples of conduits for CO2 leaks to the atmosphere include CO2 injection wells, oil or gas
production wells, monitoring wells, abandoned wells; and faults and fractures. While for properly
selected, operated, and closed CO2 storage operations, CO2 emissions from the geologic
reservoir to the atmosphere should not occur, assessing for potential leakage pathways is an
important part of a monitoring program.
Site characterization includes the development of a complete catalogue of existing wells
penetrating the injection zone or in the near vicinity of the reservoir, including information on the
current well status, data on how the well was completed (and plugged/ abandoned if
appropriate) including any cement bond logs available. Assurance as to the adequacy of the
plugging of abandoned wells is essential.
A corrective action plan shall be developed for those wells that are considered to be high risk for
leakage (i.e., poor condition of cement, poor maintenance, and penetrating the oil reservoir and
confining zones). The corrective action plan may involve either remediation or monitoring for
leakage at the well.
Good well construction and completion are important to prevent leakage. All CO2 injection wells
used for EOR operations in the US meet Class II well requirements outlined by the USEPA
underground injection control (UIC) program.44 There may be additional State requirements that
affect the construction, completion, operation, and testing of Class II wells. Operators shall
comply with all applicable State rules affecting Class II wells. As an example, standards and
procedures for Class II well operation in the State of Texas are discussed in Appendix C.
5.4.1.3 MONITORING STRATEGY
The monitoring strategy shall be geared to demonstrate effective retention of the injected
anthropogenic CO2 within the storage volume during and after injection. Based on site
44 USEPA, 40CFR Part 146, Underground Injection Control Program: Criteria and Standards

METHODOLOGY FOR THE QUANTIFICATION, MONITORING, REPORTING AND VERIFICATION OF GREENHOUSE GAS EMISSIONS REDUCTIONS AND REMOVALS FROM
CARBON CAPTURE AND STORAGE PROJECTS Version 1.1
September 2021 americancarbonregistry.org 69
evaluation and geological parameters in the storage volume, simulations of potential failure
scenarios that include a range of uncertainty in modeled parameters and site characteristics
shall be developed. Based on the sensitivities of individual parameters to the outcomes of those
simulations, the Project Proponent shall determine the specific monitoring parameters to be
monitored, the monitoring tools to be used, and the sampling frequency.
A fluid flow model is an essential component of the monitoring strategy. Working with the EOR
operator, required data (existing and newly collected) shall be compiled to develop a fluid flow
model that is calibrated with production history and used to predict CO2 distribution during the
injection and post-injection phases of the EOR project. To update and compare the model
results, material balances for total field CO2 injection, resulting from purchased CO2 and
recycled CO2 (CO2 recovered from oil production and re-injected into the reservoir), as well as
any water injected, shall be maintained. The observed material balances for fluids (oil, gas,
water, CO2) shall be compared to the fluid production predicted by the model.
If EOR operators are already required to perform certain test procedures as part of meeting
regulatory requirements, then those procedures shall be incorporated into the project’s MRV.
For example, many State regulators require periodic Mechanical Integrity Tests (MITs) to assure
well integrity. These activities can help in the early detection of CO2 leakage out of the injection
zone and allow for remedial actions to be taken in a timely manner, thereby reducing the
probability of atmospheric leakage from well bores.
Monitoring shall be designed so that it is sensitive to the leakage signal. Project Proponents
shall select and locate monitoring equipment and establish CO2 detection thresholds to calibrate
monitoring systems in a manner that provides confidence in the monitoring program’s ability to
accurately confirm the effectiveness of CO2 storage. The data collected shall test the
correctness of key modeling assumptions. The Project Proponent shall identify key project-
specific parameters that are indicative of leakage and determine appropriate ranges for those
parameters, such that exceedances are indicative of leakage.
Depending on site-specific conditions, the Project Proponent shall determine whether the
monitoring approach would benefit from establishing pre-injection levels. If deemed beneficial,
these measurements shall be done for a period of time that allows for the collection of data that
are representative of site conditions prior to the initiation of injection. On-going research on pre-
injection monitoring techniques and approaches can be used as a valuable resource to develop
a project-specific monitoring plan. Innovative strategies to determine sources of groundwater
contamination in the absence of pre-injection data, which include the use of stable carbon
isotopic signatures, noble gases, and other metrics like hydrogen carbonate can be adopted for
brownfield sites. The results of on-going research on soil monitoring can provide data to
determine its value in a pre-injection monitoring approach.45
45 Gulf Coast Carbon Center (GCCC) | Bureau of Economic Geology (utexas.edu)
METHODOLOGY FOR THE QUANTIFICATION, MONITORING, REPORTING AND VERIFICATION OF GREENHOUSE GAS EMISSIONS REDUCTIONS AND REMOVALS FROM
CARBON CAPTURE AND STORAGE PROJECTS Version 1.1
September 2021 americancarbonregistry.org 70
5.4.1.4 POST INJECTION MONITORING
Following completion of CO2 injection, monitoring shall be maintained during the post-injection
phase until the end of the Project Term to assure no atmospheric leakage. The absence of
atmospheric leakage during the Project Term is considered assured when it can be verified that
no migration of injected CO2 is detected across the boundaries of the storage volume and the
modeled failure scenarios all indicate that the CO2 will remain contained within the storage
volume. Specific monitoring tools shall be determined based on the site-specific experience
gained during the pre-injection and operational phases of the project. With the cessation of
injection and in the absence of any other changes to reservoir conditions, the pressures within
the reservoir should equilibrate and the movement of CO2 within the reservoir should stabilize.
Therefore, minimal lateral movement is expected and tracking of the lateral extent of the CO2
plume through appropriate measurements (such as pressure) and modeling will be adequate.
Due to buoyancy effects, the CO2 plume will tend to migrate to the upper regions of the reservoir
where it will be constrained by the caprock. Therefore, changes in these subsurface
measurements made above the confining zone may be indicative of potential leakage.
The minimum post-injection monitoring period for CCS projects is five (5) years. During this
period, subsurface pressure shall be recorded and changes in pressure measurements
evaluated, to determine if they are consistent with expected changes or are indicative of
leakage. Other monitoring tools shall be implemented in accordance with the site’s monitoring
plan to assure no leakage. Although atmospheric leakage has not necessarily occurred if the
CO2 migrates to regions outside the storage volume boundaries, it cannot be verified that no
leakage has occurred and additional steps are necessary in this case. Project Proponents shall
redefine the boundaries of the storage volume. For example, if there is evidence of lateral
movement outside the boundaries of the storage volume, then the lateral boundaries shall be
extended to regions beyond the original storage volume. However, Project Proponents shall
evaluate for the possibility of any new potential atmospheric leakage pathways and either
remediate them and/or modify the monitoring strategy to detect for leakage under new failure
scenarios. The duration of post-injection monitoring shall be extended beyond 5 years if no
leakage cannot be assured at the end of the 5-year period. In this case, the Project Term will be
extended in two-year increments and monitoring shall be continued until no leakage is assured.
5.4.1.5 POST-PROJECT TERM REQUIREMENTS FOR STORAGE OF CO2
The Project Proponent shall file and, if the Project Proponent is not the owner of the pore space
comprising and/or surface interests overlying the CO2 storage volume, cause to be filed by the
owners thereof, a Risk Mitigation Covenant in the real property records of each county, parish
and other governmental subdivision that maintains real property records showing ownership of
and encumbrances on real property in the jurisdictions in which the CO2 storage volume is
located. The Risk Mitigation Covenant shall apply to any activity occurring on or under the land,
shall run with the land (including both the surface and subsurface interests) and shall be in a
form approved by ACR. Further, the Risk Mitigation Covenant shall prohibit any planned activity

METHODOLOGY FOR THE QUANTIFICATION, MONITORING, REPORTING AND VERIFICATION OF GREENHOUSE GAS EMISSIONS REDUCTIONS AND REMOVALS FROM
CARBON CAPTURE AND STORAGE PROJECTS Version 1.1
September 2021 americancarbonregistry.org 71
that results in the release of the stored CO2 including as a collateral effect of future hydrocarbon
development (i.e., a reversal) unless measures are taken in advance to compensate for the
reversal by replacing the reversed ERTs for ACR’s retirement pursuant to a plan acceptable to
ACR.
To verify compliance with the terms of the Risk Mitigation Covenant, the Risk Mitigation
Covenant shall require that the Project Proponent and the owner of the property notify ACR
upon discovery of the occurrence of or plans to conduct any activity that results in a reversal,
shall require that the Project Proponent and owner of the property submit an annual attestation
of compliance to ACR, and shall afford ACR an access right to the property in order to conduct
inspections. The obligations under the Risk Mitigation Covenant shall be secured by a lien in
favor of ACR against the CO2 and the pore space comprising the CO2 storage volume, which
lien shall be included in the Risk Mitigation Covenant.
In the event that the Project Proponent is not the owner of the pore space comprising and/or
surface interests overlying the CO2 storage volume and is unable to provide the required Risk
Mitigation Covenant as part of the demonstration of project eligibility, as an alternative to the
Risk Mitigation Covenant ACR may accept (i) proof of the filing of a notice or memorandum of
agreement in a form acceptable to ACR in the real property records of each county, parish and
other governmental subdivision that maintains real property records showing ownership of and
encumbrances on real property in the jurisdictions in which the CO2 storage volume is located
that provides notice of the following terms of the Project Proponent’s agreement with such pore
space and/or surface interest right owners to any future owners: (a) the agreement that no
planned activity shall be conducted that would result in a reversal unless measures are taken in
advance to compensate for the reversal by replacing the reversed ERTs for ACR’s retirement
pursuant to a plan acceptable to ACR (b) the agreement to notify ACR upon discovery of the
occurrence of a reversal; and (c) a right of access by Project Proponent or its assigns, including
ACR, for access to conduct inspections; or (ii) another risk mitigation measure intended to
prevent, provide for the discovery of, and compensate for intentional reversals that is acceptable
to ACR.
The Risk Mitigation Covenant or alternative risk mitigation assurance shall be approved by ACR
and, as applicable, filed in all required jurisdictions, with a copy of the filed documents provided
to ACR prior to the issuance of any ERTs for the GHG project other than ERTs subject to
Invalidation. If a Project Proponent does not provide a Risk Mitigation Covenant or an
alternative risk mitigation assurance as described above, the ERTs issued by ACR for the
project shall be subject to Invalidation; provided however, ERTs subject to Invalidation may be
exchanged for ERTs that are not subject to Invalidation in the event the Project Proponent
provides ACR with a Risk Mitigation Covenant or alternative risk mitigation assurance satisfying
the requirements of this Section 5.4.1.
The obligations of the Project Proponent and any pore space or surface owner under the Risk
Mitigation Covenant or alternative risk mitigation assurance shall cease upon demonstration to
the reasonable satisfaction of ACR, as evidenced by a written acknowledgement by ACR, that
the federal government or the applicable state government has assumed ownership of and
METHODOLOGY FOR THE QUANTIFICATION, MONITORING, REPORTING AND VERIFICATION OF GREENHOUSE GAS EMISSIONS REDUCTIONS AND REMOVALS FROM
CARBON CAPTURE AND STORAGE PROJECTS Version 1.1
September 2021 americancarbonregistry.org 72
monitoring responsibility for the stored CO2 by the Project Proponent. Any pore space or surface
owner shall be relieved of intentional reversal mitigation requirements for any intentional
reversal occurring after such government assumption. ACR’s written acknowledgement shall be
in recordable form and may be filed in the applicable real property records by the Project
Proponent or any pore space or surface owner to evidence the termination of the Risk Mitigation
Covenant or alternative risk mitigation assurance.
5.4.1.6 QUANTIFICATION OF ATMOSPHERIC LEAKAGE
The project monitoring plan shall include a strategy for quantifying any atmospheric leakage of
CO2 from the storage volume. In the event that leaks from the storage volume do happen, which
are not remediated in time to prevent atmospheric leakage, Project Proponents shall quantify
the CO2 emissions on a site-by-site basis, according to a reasonable engineering approach.
This shall involve computations that incorporate a range of information about the specific
geologic reservoir, the CO2 injection regime, modeling assumptions, and other variables. The
EOR field operator has the best knowledge of site-specific conditions and shall combine this
knowledge with sound engineering practices to estimate atmospheric leakage, should it occur.
This includes the use of conservative factors and algorithms in their estimates. Further, the
uncertainty in the estimated value shall be calculated and included in the estimates. In the event
of containment failure, a simplified estimation to conservatively determine maximum leakage
can be used, rather than requiring rigorous quantification.
5.4.2 MRV Plan Reporting Requirements
Besides the normal GHG Project Plan reporting requirements specified by ACR, CCS projects
shall also include a site-specific MRV plan, which is subject to independent third-party validation
by a CCS expert on the VVB team (see below). It shall include:
Description of the reservoir where CO2 is injected.
Description of model, including key model parameters and their uncertainties, potential
failure scenarios evaluated, and simulation results to determine the extremities of the storage
volume that is expected to contain the injected CO2 through the end of the Project Term.
Site characterization of the storage volume, including identification of potential leakage
pathways and any remediation activities undertaken to reduce potential for leakage.
Monitoring strategy, including monitoring procedures and tools, and monitoring frequency. A
range of expected values for monitored parameters that indicate normal operation and that
containment is successful. Note: there may be changes to monitoring strategy as the
injection proceeds. The Project Proponent shall document and report changes and the
revisions shall be subject to review by the VVB at the next verification interval or next
validation (in the case of Crediting Period renewal), whichever comes first.
If leakage is detected, remedial actions taken to rectify the source of leakage, and/or
estimates of atmospheric leakage and how it was mitigated.

METHODOLOGY FOR THE QUANTIFICATION, MONITORING, REPORTING AND VERIFICATION OF GREENHOUSE GAS EMISSIONS REDUCTIONS AND REMOVALS FROM
CARBON CAPTURE AND STORAGE PROJECTS Version 1.1
September 2021 americancarbonregistry.org 73
It is required that the project-specific MRV Plan be developed by a professional with
demonstrated experience and knowledge of design and implementation of systems for
monitoring geologic storage of CO2, along with expertise in an earth science discipline relevant
to monitoring, such as reservoir engineering, geophysics, geology, hydrology, geomechanics,
geochemistry, or other relevant discipline. Demonstrated experience/knowledge shall be
evidenced by at least three years' experience in monitoring of CO2-EOR projects, and/or by
published, relevant peer-reviewed academic research on monitoring of CO2 storage. The
curriculum vitae of this professional will be reviewed by ACR and the VVB to confirm that he/she
meets the above requirements.
5.4.3 MRV Plan Validation and Verification Requirements
Validation of the MRV plan shall be conducted by a competent third-party Validation and
Verification Body (VVB) with in-house or subcontracted CCS expertise meeting the
requirements below. The VVB shall determine the adequacy of the MRV plan to meet the
storage goals. It includes verification of the model used; model parameters, assumptions and
uncertainties; failure scenarios evaluated; and the adequacy of the monitoring strategy to detect
leakage out of the storage volume. The VVB shall also review the EOR operator’s injection
permit and verify that the site remained in compliance during the reporting year. In instances of
non-compliance, the VVB shall determine whether it affects the ERs claimed and the potential to
affect future ERs or compromise long-term storage. The review shall also include a comparison
of the MRV Plan with existing protocols and regulations.
The project-specific MRV Plan must be independently validated by a professional with
demonstrated experience and a high degree of knowledge of design and implementation of
systems for monitoring geologic storage of CO2, along with expertise in an earth science
discipline relevant to monitoring, such as reservoir engineering, geophysics, geology, hydrology,
geomechanics, geochemistry, or other relevant discipline. Demonstrated experience/knowledge
shall be evidenced by at least three years' experience in monitoring of CO2-EOR projects,
and/or by published, relevant peer-reviewed academic research on monitoring of CO2 storage.
This professional shall be an independent third party serving as part of the VVB team. He/she
may be a subcontractor to the VVB as long as the VVB accepts full responsibility for his/her
work through their role as signatory of all validation and verification opinions. He/she shall be
subject to the VVB's project-specific Conflict of Interest evaluation.
The project-specific MRV Plan must be approved by this professional at the time of initial
validation. Subsequent verifications must also be reviewed by this professional, or a
professional meeting the same qualifications, to ensure that the project-specific MRV Plan is
being adhered to in every reporting period when credits are claimed. Subsequent validations (on
Crediting Period renewal every ten years) shall also include review by this professional, or a
professional meeting the same qualifications, of any changes to the MRV Plan.
METHODOLOGY FOR THE QUANTIFICATION, MONITORING, REPORTING AND VERIFICATION OF GREENHOUSE GAS EMISSIONS REDUCTIONS AND REMOVALS FROM
CARBON CAPTURE AND STORAGE PROJECTS Version 1.1
September 2021 americancarbonregistry.org 74
The validation of the initial MRV Plan and subsequent validations and verifications must also be
signed off by a registered Professional Engineer (PE) or geologist, who may be (but is not
required to be) the same individual as the professional described above.
5.5 MEASUREMENT TECHNIQUES
Volumetric flow rates will be measured by commercially available devices that measure the
mass or volumetric rate of flow of a gas or liquid moving through an open or closed conduit.
Flow meters include, but are not limited to, rotameters, turbine meters, coriolis meters, orifice
meters, ultra-sonic flow meters, and vortex flow meters. The devices shall be installed and
calibrated in accordance with manufacturer’s specifications. The flow meter will be operated in
accordance with an appropriate standard method published by a consensus-based standards
organization if such a method exists or an industry standard practice. The specific standard
used shall be documented and reported. Consensus-based standards organizations include, but
are not limited to, the following: ASTM International, the American National Standards Institute
(ANSI), the American Gas Association (AGA), the American Society of Mechanical Engineers
(ASME), the American Petroleum Institute (API), and the North American Energy Standards
Board (NAESB). Flow meter calibrations performed shall be National Institute of Standards and
Technology (NIST) traceable.
Gas or liquid composition analysis shall be measured by an appropriate standard method
published by a consensus-based standards organization, if such a method exists, or an industry
standard practice.
Flowrate measurements are made continuously, where continuous measurement is commonly
defined as one measurement every 15 minutes or less. The CO2 concentration in the gas
stream is measured at monthly intervals.
Monitoring methods for MRV of geologic storage sites are discussed in USDOE and USEPA
documents and are also contained in certain State regulations.46, 47, 48, 49
46 Best Practices for: Monitoring, Verification, and Accounting of CO2 Stored in Deep Geologic
Formations, DOE/NETL-311/081508, January 2009, https://www.globalccsinstitute.com/archive/hub/publications/159708/best-practices-monitoring-verification-accounting-co2-stored-deep-geologic-formations.pdf
47 Best Practices for: Monitoring, Verification, and Accounting of CO2 Stored in Deep Geologic Formations – 2012 Update, DOE/NETL-2012/1568, October 2012, https://www.netl.doe.gov/sites/default/files/2018-
10/BPM-MVA-2012.pdf 48 General Technical Support Document for Injection and Geologic Sequestration of Carbon Dioxide:
Subparts RR and UU Greenhouse Gas Reporting Program, (Chapter 4 & 5), USEPA, (2010) https://www.epa.gov/sites/production/files/2015-07/documents/subpart-rr-uu_tsd.pdf
49 Fluid Injection in Productive Reservoirs, Texas Administrative Code (TAC), Title 16, Part 1, RULE §3.46

METHODOLOGY FOR THE QUANTIFICATION, MONITORING, REPORTING AND VERIFICATION OF GREENHOUSE GAS EMISSIONS REDUCTIONS AND REMOVALS FROM
CARBON CAPTURE AND STORAGE PROJECTS Version 1.1
September 2021 americancarbonregistry.org 75
5.6 DATA AND ANALYSIS FOR VERIFICATION
This section provides information about specific parameters that shall be monitored to calculate
GHG emission reductions from a CCS project according to the quantification procedures in
Section 4.0. Project Proponents shall incorporate this information into their project-specific MRV
Plan and adapt it to accommodate the specific conditions associated with their CCS project.
To ensure the validity of GHG reduction claims, data collection and monitoring is essential.
Table 4 aggregates the specific monitoring parameters and activities needed for a
comprehensive assessment of the GHG reductions that might be claimed by a Project
Proponent. Project Proponents shall take into account the location, type of equipment and
frequency of measurement for each variable.
In addition to the parameters in Table 4, project proponents shall report the results of the MRV
measurements discussed in Section 5-4.
The EOR site must remain in compliance with its permit conditions through the injection
monitoring period. EOR site operators shall produce documentation indicating that their site has
been in regulatory compliance. If there are periods of non-compliance then the date(s) and
nature of non-compliance, remedial actions taken, and the date(s) when the site returns to being
in compliance shall be documented and provided during verification. If there are periods of non-
compliance, then the effect of non-compliance on the quantified emission reductions shall be
evaluated and, if necessary, the creditable emission reductions shall be reduced.
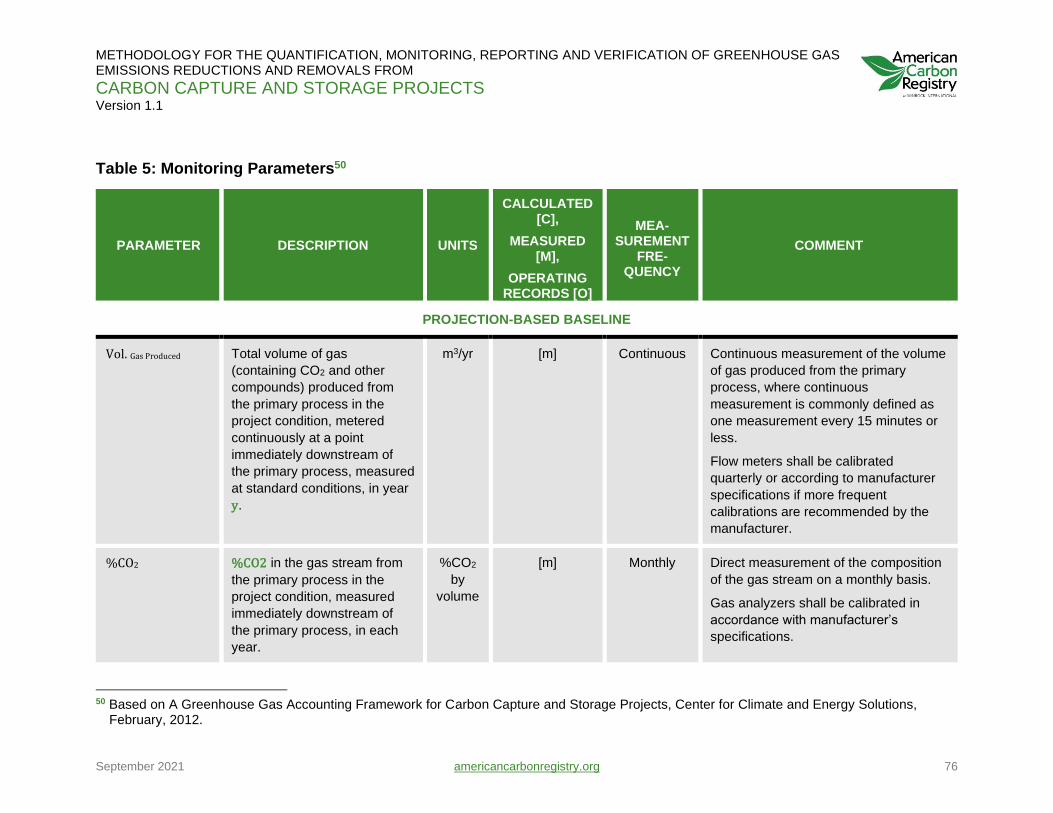
METHODOLOGY FOR THE QUANTIFICATION, MONITORING, REPORTING AND VERIFICATION OF GREENHOUSE GAS EMISSIONS REDUCTIONS AND REMOVALS FROM
CARBON CAPTURE AND STORAGE PROJECTS Version 1.1
September 2021 americancarbonregistry.org 76
Table 5: Monitoring Parameters50
PARAMETER DESCRIPTION UNITS
CALCULATED [C],
MEASURED [M],
OPERATING RECORDS [O]
MEA- SUREMENT
FRE-QUENCY
COMMENT
PROJECTION-BASED BASELINE
Vol. Gas Produced
Total volume of gas
(containing CO2 and other
compounds) produced from
the primary process in the
project condition, metered
continuously at a point
immediately downstream of
the primary process, measured
at standard conditions, in year
y.
m3/yr [m] Continuous Continuous measurement of the volume
of gas produced from the primary
process, where continuous
measurement is commonly defined as
one measurement every 15 minutes or
less.
Flow meters shall be calibrated
quarterly or according to manufacturer
specifications if more frequent
calibrations are recommended by the
manufacturer.
%CO2 %CO2 in the gas stream from
the primary process in the
project condition, measured
immediately downstream of
the primary process, in each
year.
%CO2
by
volume
[m] Monthly Direct measurement of the composition
of the gas stream on a monthly basis.
Gas analyzers shall be calibrated in
accordance with manufacturer’s
specifications.
50 Based on A Greenhouse Gas Accounting Framework for Carbon Capture and Storage Projects, Center for Climate and Energy Solutions,
February, 2012.
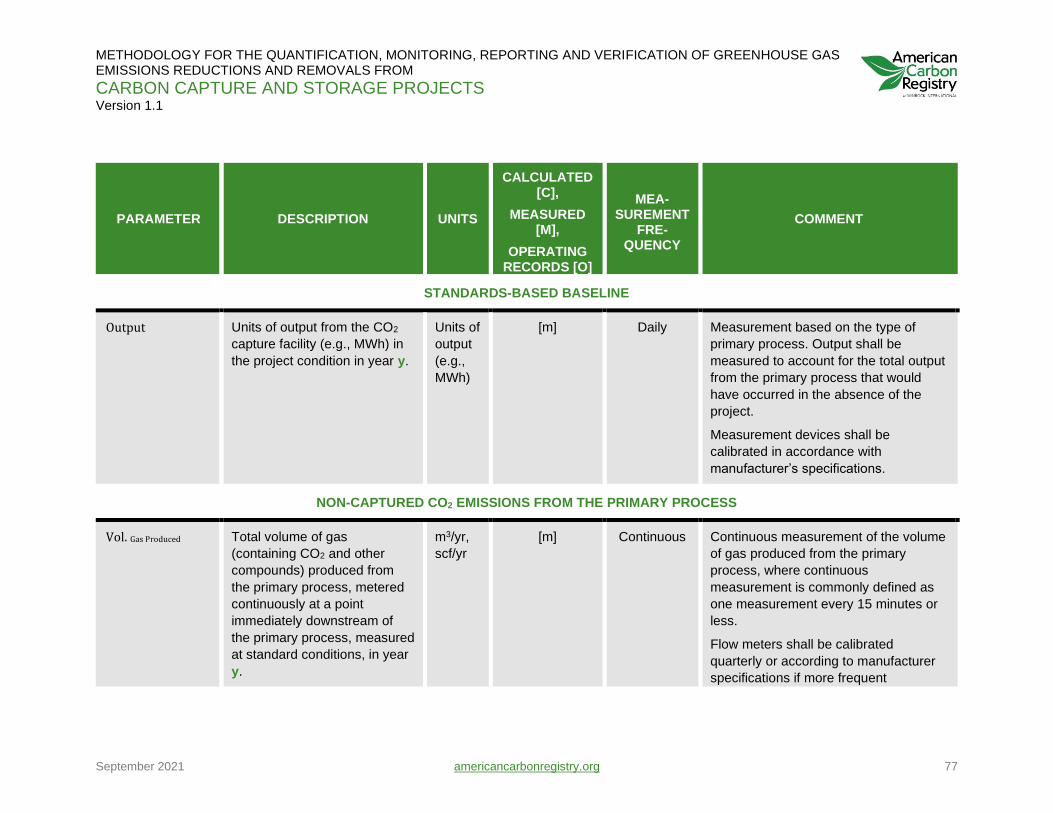
METHODOLOGY FOR THE QUANTIFICATION, MONITORING, REPORTING AND VERIFICATION OF GREENHOUSE GAS EMISSIONS REDUCTIONS AND REMOVALS FROM
CARBON CAPTURE AND STORAGE PROJECTS Version 1.1
September 2021 americancarbonregistry.org 77
PARAMETER DESCRIPTION UNITS
CALCULATED [C],
MEASURED [M],
OPERATING RECORDS [O]
MEA- SUREMENT
FRE-QUENCY
COMMENT
STANDARDS-BASED BASELINE
Output Units of output from the CO2
capture facility (e.g., MWh) in
the project condition in year y.
Units of
output
(e.g.,
MWh)
[m] Daily Measurement based on the type of
primary process. Output shall be
measured to account for the total output
from the primary process that would
have occurred in the absence of the
project.
Measurement devices shall be
calibrated in accordance with
manufacturer’s specifications.
NON-CAPTURED CO2 EMISSIONS FROM THE PRIMARY PROCESS
Vol. Gas Produced Total volume of gas
(containing CO2 and other
compounds) produced from
the primary process, metered
continuously at a point
immediately downstream of
the primary process, measured
at standard conditions, in year
y.
m3/yr,
scf/yr
[m] Continuous Continuous measurement of the volume
of gas produced from the primary
process, where continuous
measurement is commonly defined as
one measurement every 15 minutes or
less.
Flow meters shall be calibrated
quarterly or according to manufacturer
specifications if more frequent
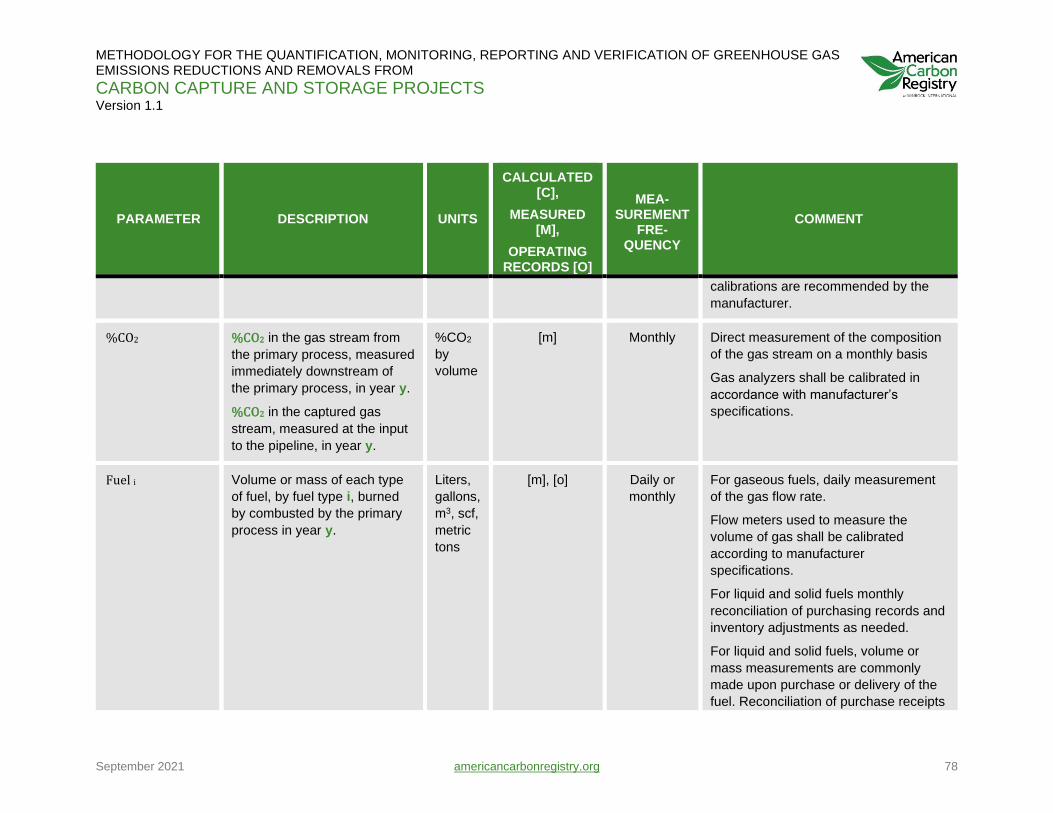
METHODOLOGY FOR THE QUANTIFICATION, MONITORING, REPORTING AND VERIFICATION OF GREENHOUSE GAS EMISSIONS REDUCTIONS AND REMOVALS FROM
CARBON CAPTURE AND STORAGE PROJECTS Version 1.1
September 2021 americancarbonregistry.org 78
PARAMETER DESCRIPTION UNITS
CALCULATED [C],
MEASURED [M],
OPERATING RECORDS [O]
MEA- SUREMENT
FRE-QUENCY
COMMENT
calibrations are recommended by the
manufacturer.
%CO2 %CO2 in the gas stream from
the primary process, measured
immediately downstream of
the primary process, in year y.
%CO2 in the captured gas
stream, measured at the input
to the pipeline, in year y.
%CO2
by
volume
[m] Monthly Direct measurement of the composition
of the gas stream on a monthly basis
Gas analyzers shall be calibrated in
accordance with manufacturer’s
specifications.
Fuel i Volume or mass of each type
of fuel, by fuel type i, burned
by combusted by the primary
process in year y.
Liters,
gallons,
m3, scf,
metric
tons
[m], [o] Daily or
monthly
For gaseous fuels, daily measurement
of the gas flow rate.
Flow meters used to measure the
volume of gas shall be calibrated
according to manufacturer
specifications.
For liquid and solid fuels monthly
reconciliation of purchasing records and
inventory adjustments as needed.
For liquid and solid fuels, volume or
mass measurements are commonly
made upon purchase or delivery of the
fuel. Reconciliation of purchase receipts
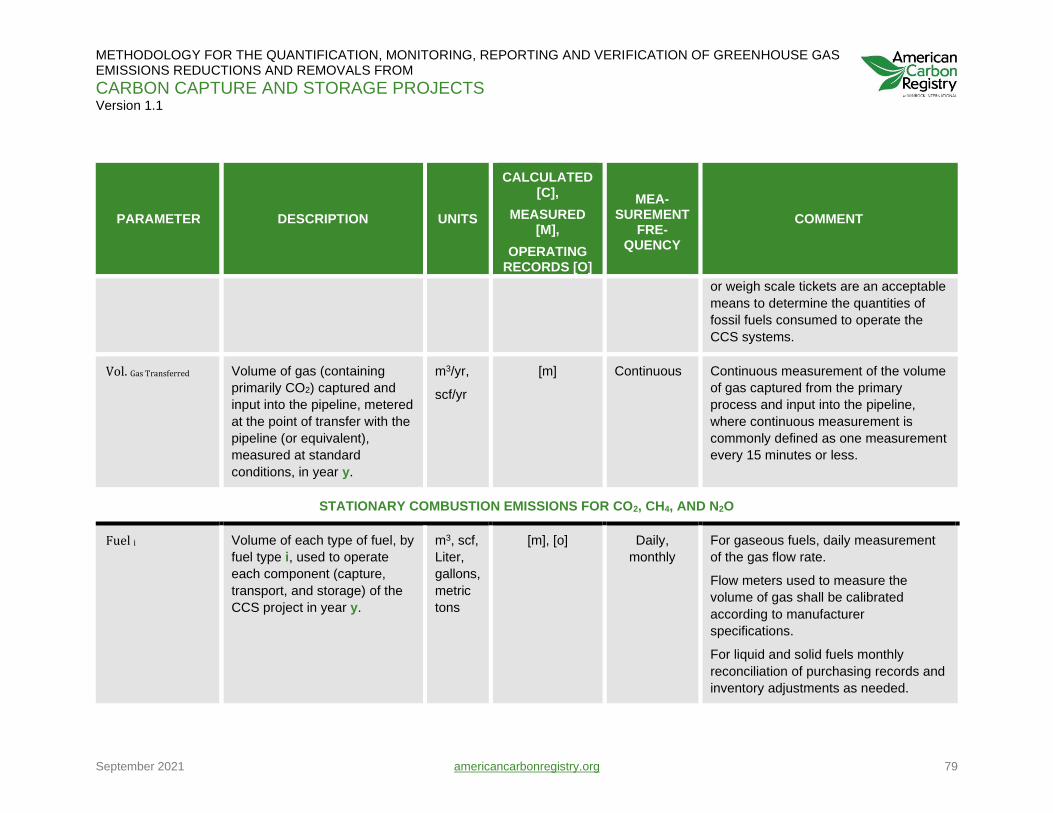
METHODOLOGY FOR THE QUANTIFICATION, MONITORING, REPORTING AND VERIFICATION OF GREENHOUSE GAS EMISSIONS REDUCTIONS AND REMOVALS FROM
CARBON CAPTURE AND STORAGE PROJECTS Version 1.1
September 2021 americancarbonregistry.org 79
PARAMETER DESCRIPTION UNITS
CALCULATED [C],
MEASURED [M],
OPERATING RECORDS [O]
MEA- SUREMENT
FRE-QUENCY
COMMENT
or weigh scale tickets are an acceptable
means to determine the quantities of
fossil fuels consumed to operate the
CCS systems.
Vol. Gas Transferred Volume of gas (containing
primarily CO2) captured and
input into the pipeline, metered
at the point of transfer with the
pipeline (or equivalent),
measured at standard
conditions, in year y.
m3/yr,
scf/yr
[m] Continuous Continuous measurement of the volume
of gas captured from the primary
process and input into the pipeline,
where continuous measurement is
commonly defined as one measurement
every 15 minutes or less.
STATIONARY COMBUSTION EMISSIONS FOR CO2, CH4, AND N2O
Fuel i Volume of each type of fuel, by
fuel type i, used to operate
each component (capture,
transport, and storage) of the
CCS project in year y.
m3, scf,
Liter,
gallons,
metric
tons
[m], [o] Daily,
monthly
For gaseous fuels, daily measurement
of the gas flow rate.
Flow meters used to measure the
volume of gas shall be calibrated
according to manufacturer
specifications.
For liquid and solid fuels monthly
reconciliation of purchasing records and
inventory adjustments as needed.
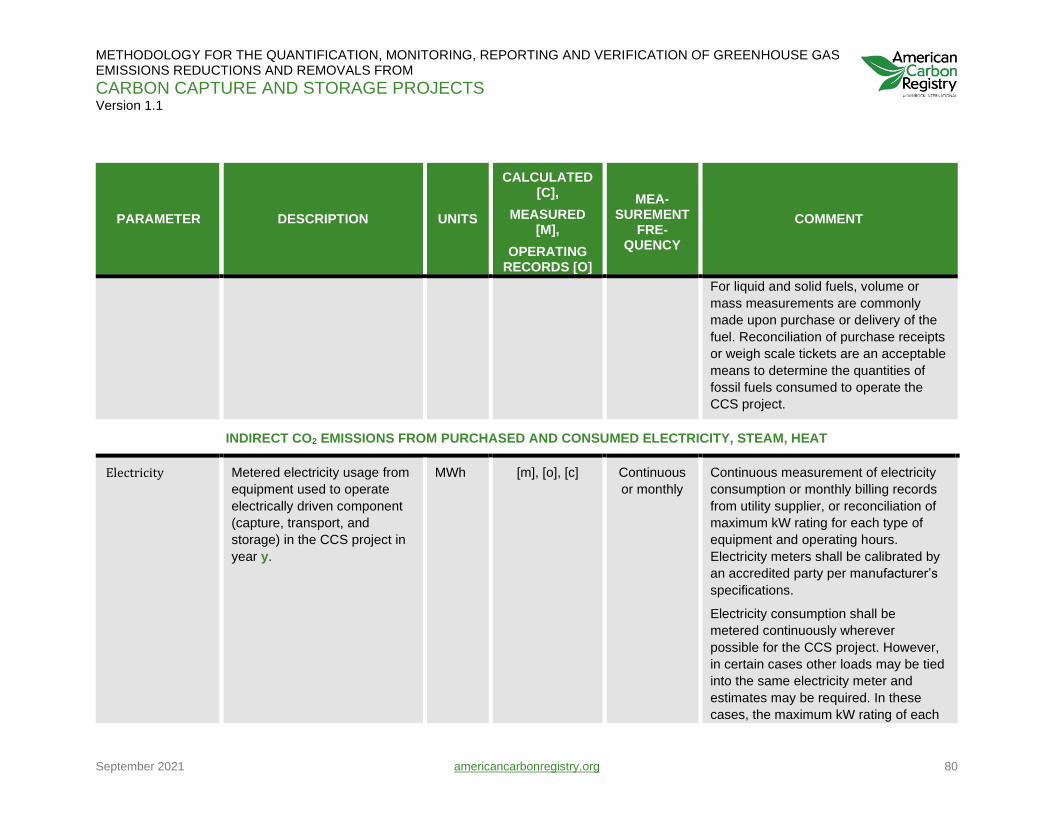
METHODOLOGY FOR THE QUANTIFICATION, MONITORING, REPORTING AND VERIFICATION OF GREENHOUSE GAS EMISSIONS REDUCTIONS AND REMOVALS FROM
CARBON CAPTURE AND STORAGE PROJECTS Version 1.1
September 2021 americancarbonregistry.org 80
PARAMETER DESCRIPTION UNITS
CALCULATED [C],
MEASURED [M],
OPERATING RECORDS [O]
MEA- SUREMENT
FRE-QUENCY
COMMENT
For liquid and solid fuels, volume or
mass measurements are commonly
made upon purchase or delivery of the
fuel. Reconciliation of purchase receipts
or weigh scale tickets are an acceptable
means to determine the quantities of
fossil fuels consumed to operate the
CCS project.
INDIRECT CO2 EMISSIONS FROM PURCHASED AND CONSUMED ELECTRICITY, STEAM, HEAT
Electricity Metered electricity usage from
equipment used to operate
electrically driven component
(capture, transport, and
storage) in the CCS project in
year y.
MWh [m], [o], [c] Continuous
or monthly
Continuous measurement of electricity
consumption or monthly billing records
from utility supplier, or reconciliation of
maximum kW rating for each type of
equipment and operating hours.
Electricity meters shall be calibrated by
an accredited party per manufacturer’s
specifications.
Electricity consumption shall be
metered continuously wherever
possible for the CCS project. However,
in certain cases other loads may be tied
into the same electricity meter and
estimates may be required. In these
cases, the maximum kW rating of each
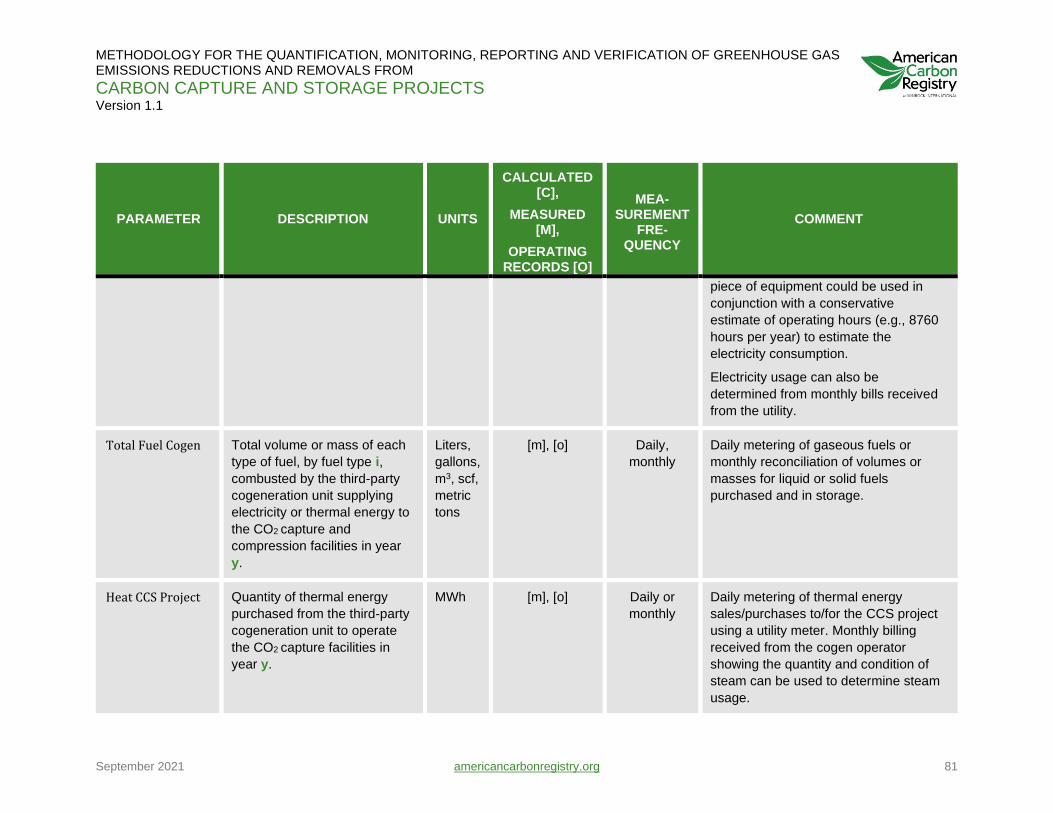
METHODOLOGY FOR THE QUANTIFICATION, MONITORING, REPORTING AND VERIFICATION OF GREENHOUSE GAS EMISSIONS REDUCTIONS AND REMOVALS FROM
CARBON CAPTURE AND STORAGE PROJECTS Version 1.1
September 2021 americancarbonregistry.org 81
PARAMETER DESCRIPTION UNITS
CALCULATED [C],
MEASURED [M],
OPERATING RECORDS [O]
MEA- SUREMENT
FRE-QUENCY
COMMENT
piece of equipment could be used in
conjunction with a conservative
estimate of operating hours (e.g., 8760
hours per year) to estimate the
electricity consumption.
Electricity usage can also be
determined from monthly bills received
from the utility.
Total Fuel Cogen Total volume or mass of each
type of fuel, by fuel type i,
combusted by the third-party
cogeneration unit supplying
electricity or thermal energy to
the CO2 capture and
compression facilities in year
y.
Liters,
gallons,
m3, scf,
metric
tons
[m], [o] Daily,
monthly
Daily metering of gaseous fuels or
monthly reconciliation of volumes or
masses for liquid or solid fuels
purchased and in storage.
Heat CCS Project Quantity of thermal energy
purchased from the third-party
cogeneration unit to operate
the CO2 capture facilities in
year y.
MWh [m], [o] Daily or
monthly
Daily metering of thermal energy
sales/purchases to/for the CCS project
using a utility meter. Monthly billing
received from the cogen operator
showing the quantity and condition of
steam can be used to determine steam
usage.
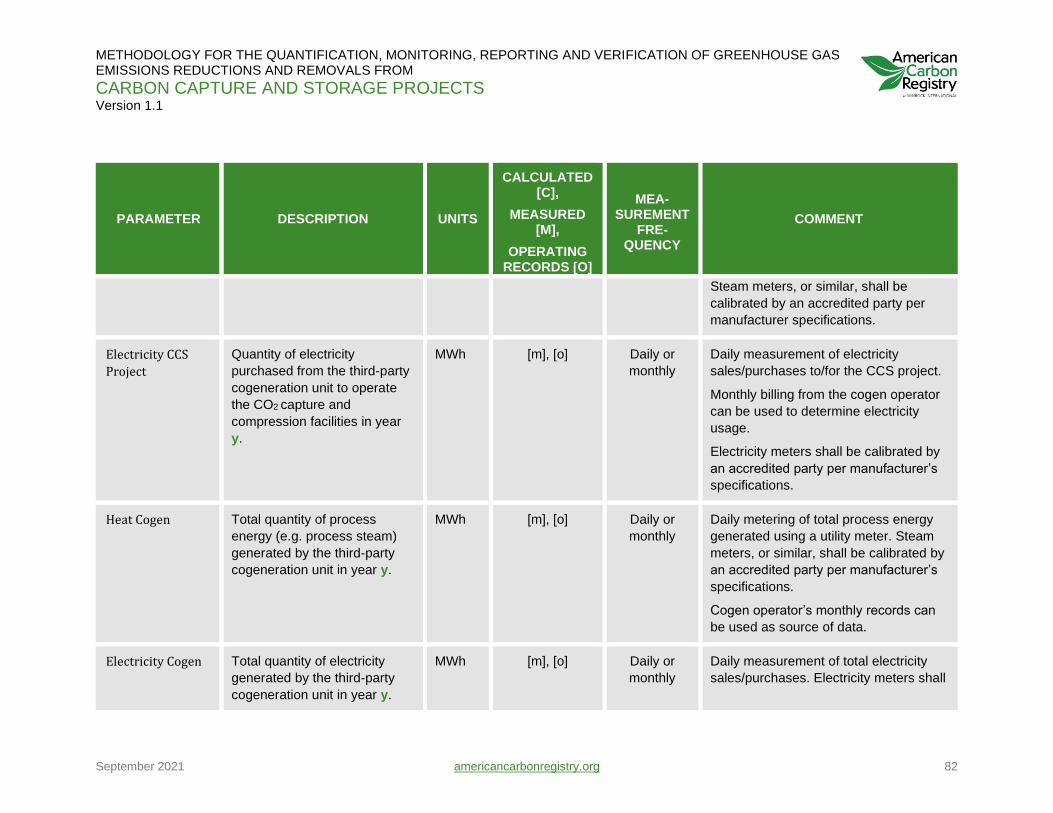
METHODOLOGY FOR THE QUANTIFICATION, MONITORING, REPORTING AND VERIFICATION OF GREENHOUSE GAS EMISSIONS REDUCTIONS AND REMOVALS FROM
CARBON CAPTURE AND STORAGE PROJECTS Version 1.1
September 2021 americancarbonregistry.org 82
PARAMETER DESCRIPTION UNITS
CALCULATED [C],
MEASURED [M],
OPERATING RECORDS [O]
MEA- SUREMENT
FRE-QUENCY
COMMENT
Steam meters, or similar, shall be
calibrated by an accredited party per
manufacturer specifications.
Electricity CCS
Project
Quantity of electricity
purchased from the third-party
cogeneration unit to operate
the CO2 capture and
compression facilities in year
y.
MWh [m], [o] Daily or
monthly
Daily measurement of electricity
sales/purchases to/for the CCS project.
Monthly billing from the cogen operator
can be used to determine electricity
usage.
Electricity meters shall be calibrated by
an accredited party per manufacturer’s
specifications.
Heat Cogen Total quantity of process
energy (e.g. process steam)
generated by the third-party
cogeneration unit in year y.
MWh [m], [o] Daily or
monthly
Daily metering of total process energy
generated using a utility meter. Steam
meters, or similar, shall be calibrated by
an accredited party per manufacturer’s
specifications.
Cogen operator’s monthly records can
be used as source of data.
Electricity Cogen Total quantity of electricity
generated by the third-party
cogeneration unit in year y.
MWh [m], [o] Daily or
monthly
Daily measurement of total electricity
sales/purchases. Electricity meters shall
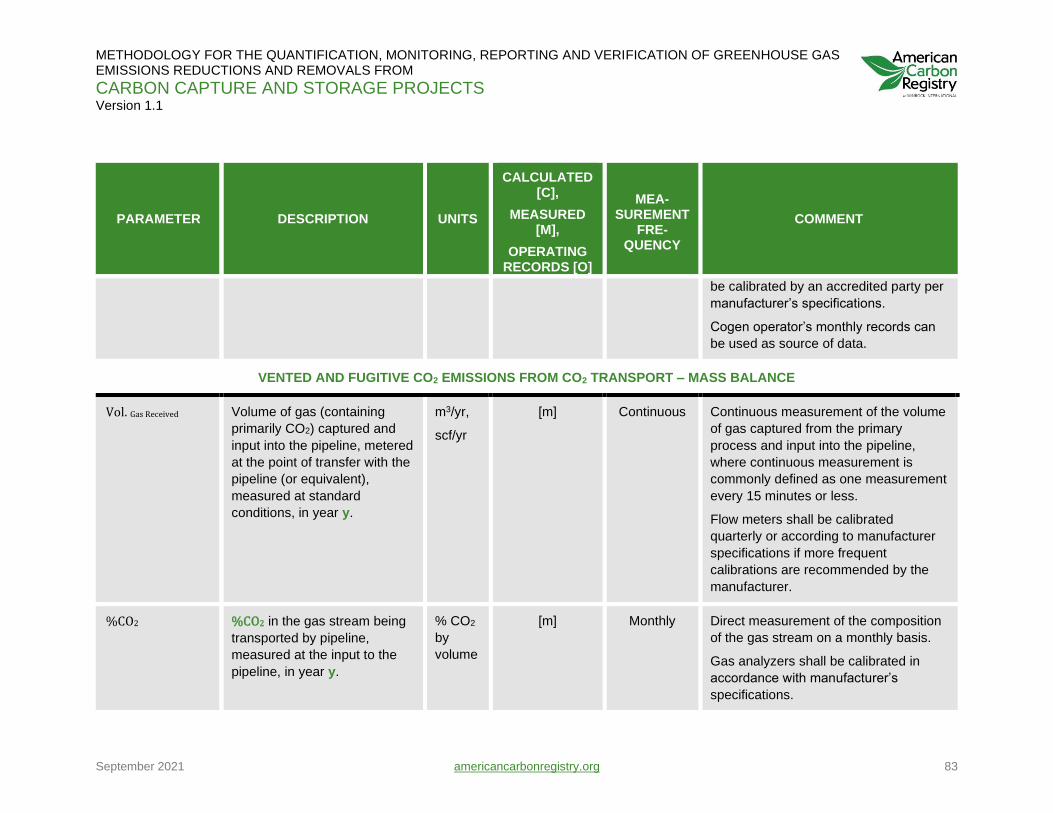
METHODOLOGY FOR THE QUANTIFICATION, MONITORING, REPORTING AND VERIFICATION OF GREENHOUSE GAS EMISSIONS REDUCTIONS AND REMOVALS FROM
CARBON CAPTURE AND STORAGE PROJECTS Version 1.1
September 2021 americancarbonregistry.org 83
PARAMETER DESCRIPTION UNITS
CALCULATED [C],
MEASURED [M],
OPERATING RECORDS [O]
MEA- SUREMENT
FRE-QUENCY
COMMENT
be calibrated by an accredited party per
manufacturer’s specifications.
Cogen operator’s monthly records can
be used as source of data.
VENTED AND FUGITIVE CO2 EMISSIONS FROM CO2 TRANSPORT – MASS BALANCE
Vol. Gas Received Volume of gas (containing
primarily CO2) captured and
input into the pipeline, metered
at the point of transfer with the
pipeline (or equivalent),
measured at standard
conditions, in year y.
m3/yr,
scf/yr
[m] Continuous Continuous measurement of the volume
of gas captured from the primary
process and input into the pipeline,
where continuous measurement is
commonly defined as one measurement
every 15 minutes or less.
Flow meters shall be calibrated
quarterly or according to manufacturer
specifications if more frequent
calibrations are recommended by the
manufacturer.
%CO2 %CO2 in the gas stream being
transported by pipeline,
measured at the input to the
pipeline, in year y.
% CO2
by
volume
[m] Monthly Direct measurement of the composition
of the gas stream on a monthly basis.
Gas analyzers shall be calibrated in
accordance with manufacturer’s
specifications.
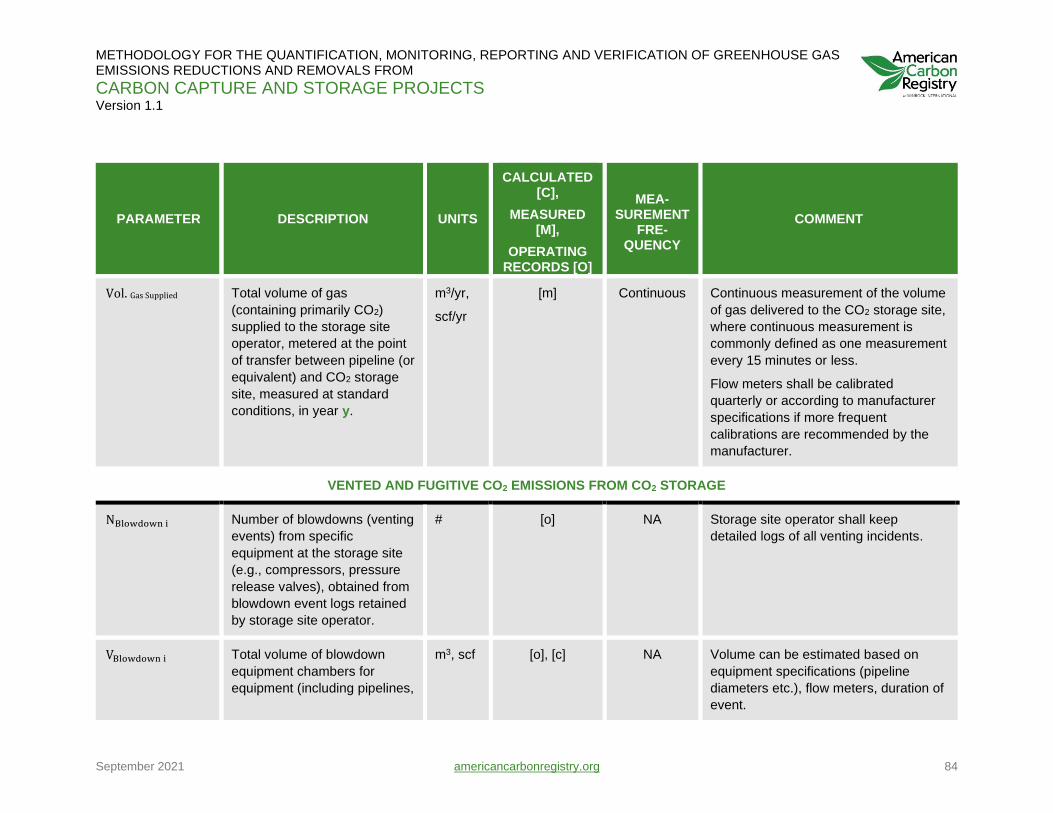
METHODOLOGY FOR THE QUANTIFICATION, MONITORING, REPORTING AND VERIFICATION OF GREENHOUSE GAS EMISSIONS REDUCTIONS AND REMOVALS FROM
CARBON CAPTURE AND STORAGE PROJECTS Version 1.1
September 2021 americancarbonregistry.org 84
PARAMETER DESCRIPTION UNITS
CALCULATED [C],
MEASURED [M],
OPERATING RECORDS [O]
MEA- SUREMENT
FRE-QUENCY
COMMENT
Vol. Gas Supplied Total volume of gas
(containing primarily CO2)
supplied to the storage site
operator, metered at the point
of transfer between pipeline (or
equivalent) and CO2 storage
site, measured at standard
conditions, in year y.
m3/yr,
scf/yr
[m] Continuous Continuous measurement of the volume
of gas delivered to the CO2 storage site,
where continuous measurement is
commonly defined as one measurement
every 15 minutes or less.
Flow meters shall be calibrated
quarterly or according to manufacturer
specifications if more frequent
calibrations are recommended by the
manufacturer.
VENTED AND FUGITIVE CO2 EMISSIONS FROM CO2 STORAGE
NBlowdown i Number of blowdowns (venting
events) from specific
equipment at the storage site
(e.g., compressors, pressure
release valves), obtained from
blowdown event logs retained
by storage site operator.
# [o] NA Storage site operator shall keep
detailed logs of all venting incidents.
VBlowdown i Total volume of blowdown
equipment chambers for
equipment (including pipelines,
m3, scf [o], [c] NA Volume can be estimated based on
equipment specifications (pipeline
diameters etc.), flow meters, duration of
event.
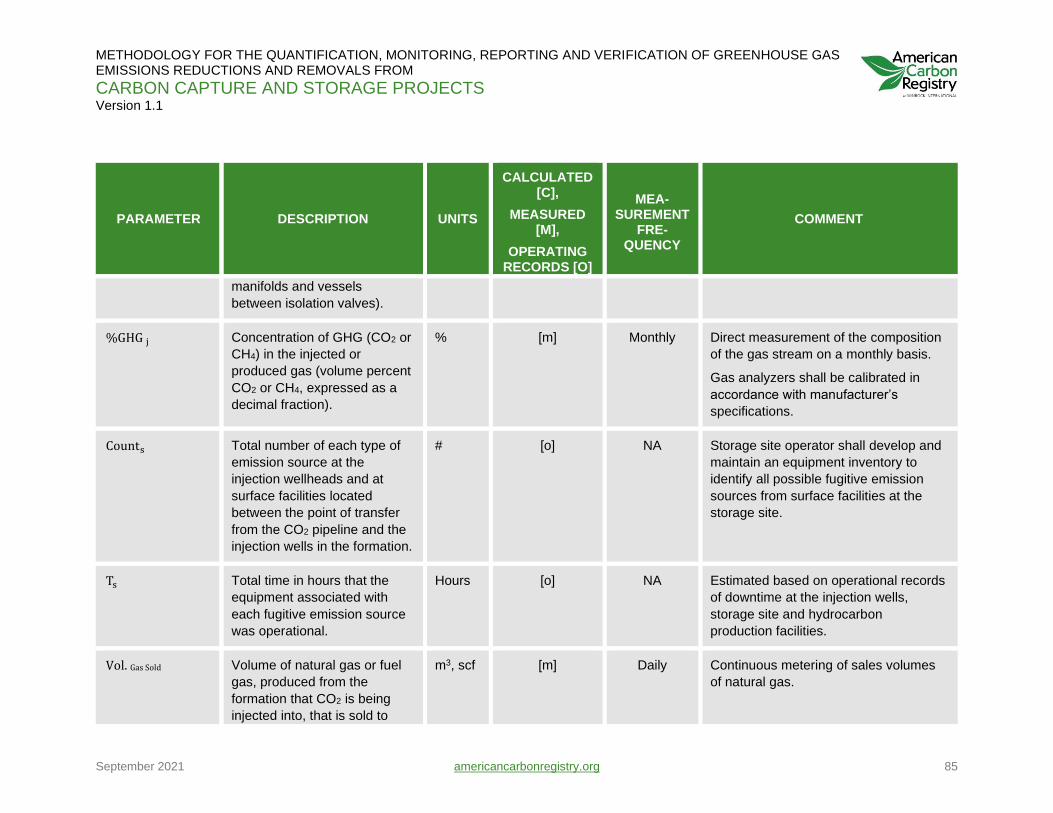
METHODOLOGY FOR THE QUANTIFICATION, MONITORING, REPORTING AND VERIFICATION OF GREENHOUSE GAS EMISSIONS REDUCTIONS AND REMOVALS FROM
CARBON CAPTURE AND STORAGE PROJECTS Version 1.1
September 2021 americancarbonregistry.org 85
PARAMETER DESCRIPTION UNITS
CALCULATED [C],
MEASURED [M],
OPERATING RECORDS [O]
MEA- SUREMENT
FRE-QUENCY
COMMENT
manifolds and vessels
between isolation valves).
%GHG j Concentration of GHG (CO2 or
CH4) in the injected or
produced gas (volume percent
CO2 or CH4, expressed as a
decimal fraction).
% [m] Monthly Direct measurement of the composition
of the gas stream on a monthly basis.
Gas analyzers shall be calibrated in
accordance with manufacturer’s
specifications.
Counts Total number of each type of
emission source at the
injection wellheads and at
surface facilities located
between the point of transfer
from the CO2 pipeline and the
injection wells in the formation.
# [o] NA Storage site operator shall develop and
maintain an equipment inventory to
identify all possible fugitive emission
sources from surface facilities at the
storage site.
Ts Total time in hours that the
equipment associated with
each fugitive emission source
was operational.
Hours [o] NA Estimated based on operational records
of downtime at the injection wells,
storage site and hydrocarbon
production facilities.
Vol. Gas Sold Volume of natural gas or fuel
gas, produced from the
formation that CO2 is being
injected into, that is sold to
m3, scf [m] Daily Continuous metering of sales volumes
of natural gas.
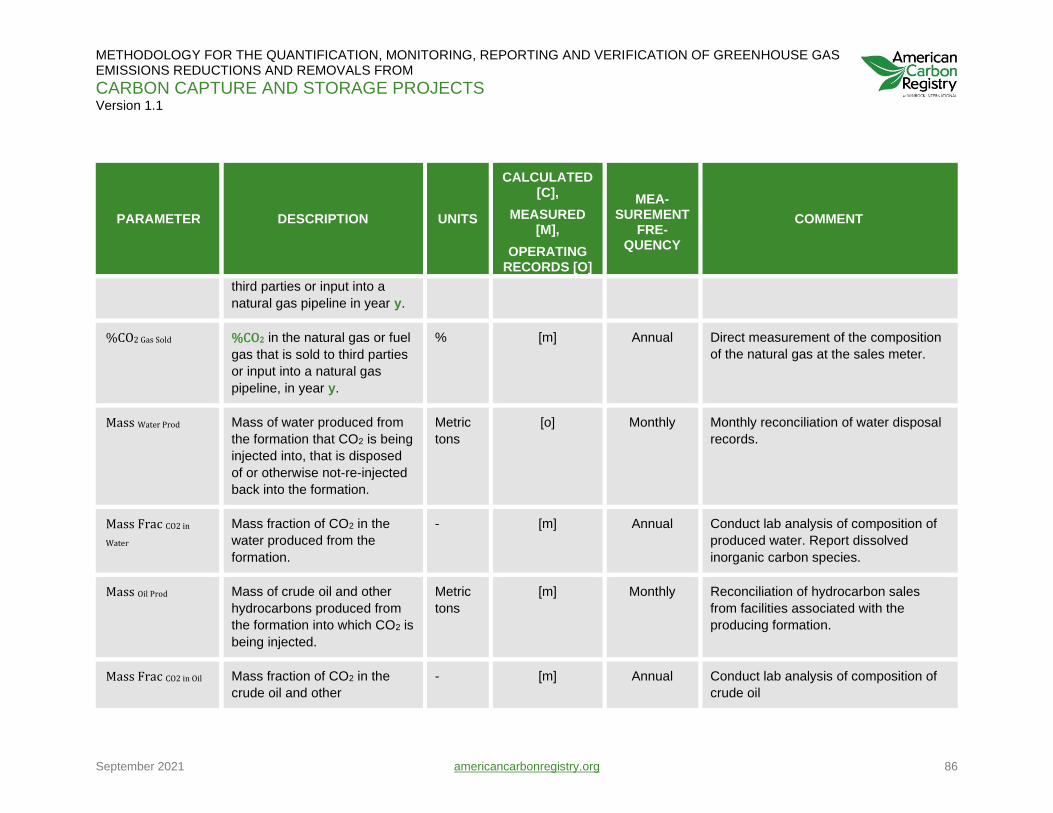
METHODOLOGY FOR THE QUANTIFICATION, MONITORING, REPORTING AND VERIFICATION OF GREENHOUSE GAS EMISSIONS REDUCTIONS AND REMOVALS FROM
CARBON CAPTURE AND STORAGE PROJECTS Version 1.1
September 2021 americancarbonregistry.org 86
PARAMETER DESCRIPTION UNITS
CALCULATED [C],
MEASURED [M],
OPERATING RECORDS [O]
MEA- SUREMENT
FRE-QUENCY
COMMENT
third parties or input into a
natural gas pipeline in year y.
%CO2 Gas Sold %CO2 in the natural gas or fuel
gas that is sold to third parties
or input into a natural gas
pipeline, in year y.
% [m] Annual Direct measurement of the composition
of the natural gas at the sales meter.
Mass Water Prod Mass of water produced from
the formation that CO2 is being
injected into, that is disposed
of or otherwise not-re-injected
back into the formation.
Metric
tons
[o] Monthly Monthly reconciliation of water disposal
records.
Mass Frac CO2 in
Water
Mass fraction of CO2 in the
water produced from the
formation.
- [m] Annual Conduct lab analysis of composition of
produced water. Report dissolved
inorganic carbon species.
Mass Oil Prod Mass of crude oil and other
hydrocarbons produced from
the formation into which CO2 is
being injected.
Metric
tons
[m] Monthly Reconciliation of hydrocarbon sales
from facilities associated with the
producing formation.
Mass Frac CO2 in Oil Mass fraction of CO2 in the
crude oil and other
- [m] Annual Conduct lab analysis of composition of
crude oil
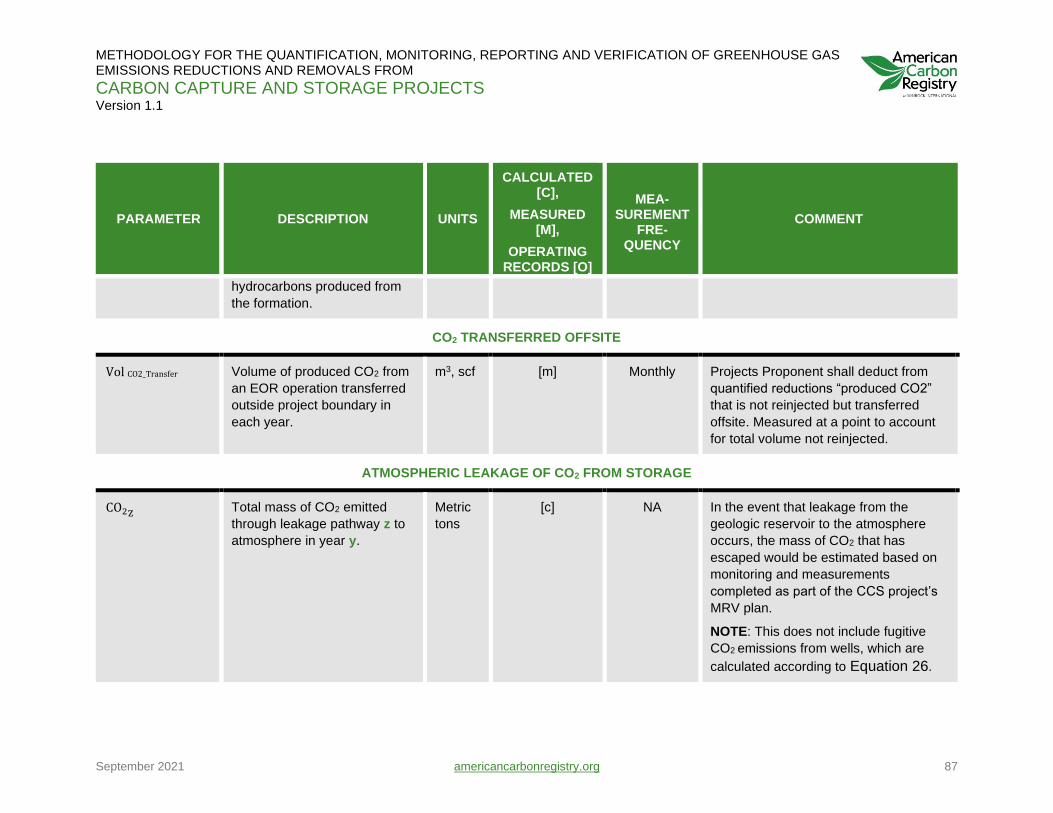
METHODOLOGY FOR THE QUANTIFICATION, MONITORING, REPORTING AND VERIFICATION OF GREENHOUSE GAS EMISSIONS REDUCTIONS AND REMOVALS FROM
CARBON CAPTURE AND STORAGE PROJECTS Version 1.1
September 2021 americancarbonregistry.org 87
PARAMETER DESCRIPTION UNITS
CALCULATED [C],
MEASURED [M],
OPERATING RECORDS [O]
MEA- SUREMENT
FRE-QUENCY
COMMENT
hydrocarbons produced from
the formation.
CO2 TRANSFERRED OFFSITE
Vol CO2_Transfer Volume of produced CO2 from
an EOR operation transferred
outside project boundary in
each year.
m3, scf [m] Monthly Projects Proponent shall deduct from
quantified reductions “produced CO2”
that is not reinjected but transferred
offsite. Measured at a point to account
for total volume not reinjected.
ATMOSPHERIC LEAKAGE OF CO2 FROM STORAGE
CO2Z Total mass of CO2 emitted
through leakage pathway z to
atmosphere in year y.
Metric
tons
[c] NA In the event that leakage from the
geologic reservoir to the atmosphere
occurs, the mass of CO2 that has
escaped would be estimated based on
monitoring and measurements
completed as part of the CCS project’s
MRV plan.
NOTE: This does not include fugitive
CO2 emissions from wells, which are
calculated according to Equation 26.

METHODOLOGY FOR THE QUANTIFICATION, MONITORING, REPORTING AND VERIFICATION OF GREENHOUSE GAS EMISSIONS REDUCTIONS AND REMOVALS FROM
CARBON CAPTURE AND STORAGE PROJECTS Version 1.1
September 2021 americancarbonregistry.org 88
6 EMISSIONS OWNERSHIP
AND QUALITY
6.1 STATEMENT OF DIRECT EMISSIONS
The Project Proponent shall attest annually that all emission reductions occur on the property
owned and/or controlled by the Project Proponents and that none of the emission reductions
claimed by the project are indirect emissions.
6.2 OFFSET TITLE
Since CCS projects involve capture, transport, and sequestration processes, which are often
conducted by different companies, the ownership to the title of CO2 credits associated with the
project’s emission reductions must be clearly defined. This can be done through contracts
among the parties in which one of the companies has clear ownership of the credits.
During the operational phase, documentation that traces the chain of custody of CO2 as it is
transferred from parties involved in the capture, transport, and sequestration processes shall be
established. This includes documents indicating the date (month/yr), CO2 volumes sold by the
supplier, transported, and received by the EOR operator. The documentation shall be
maintained by the Project Proponent and provided during verification. The documents shall be
retained for a minimum period of 3 years following the end of the crediting period.
6.3 PERMANENCE, LIABILITY, AND MITIGATION
For CCS projects, Project Proponents must demonstrate that the CO2 captured and stored is
permanently sequestered underground. The post-injection monitoring tasks as described in
Section 5.4 will be conducted for the Project Term defined in Section 2.2. Post-Project Term
requirements are described in Section 5.4.1. Site characterization coupled with the use of site-
specific monitoring and modeling provides data and information for the operator to calibrate,
validate and compare the model over the Project Term. This model will be used as a predictive
tool to monitor and track the CO2 plume during the post-injection period and beyond. The
predictions will be confirmed by measurements of pressure and/or other relevant parameters
made during the remainder of the Project Term (post-injection phase). As indicated in Section
5.4, no leakage is assured when it can be verified that no migration of injected CO2 is detected
across the boundaries of the storage volume and the modeled failure scenarios all indicate that
the CO2 will remain contained within the storage volume.

METHODOLOGY FOR THE QUANTIFICATION, MONITORING, REPORTING AND VERIFICATION OF GREENHOUSE GAS EMISSIONS REDUCTIONS AND REMOVALS FROM
CARBON CAPTURE AND STORAGE PROJECTS Version 1.1
September 2021 americancarbonregistry.org 89
An operator shall prove financial responsibility prior to gaining a permit to begin active injection
operations. This effort establishes a plan for safe operation of injection activities.
Implementation of this safety plan throughout operations should mitigate long-term liabilities.
Appendix D includes a listing of laws that have been enacted and/or bills that are currently
pending in the State legislatures at the time of publication of the methodology related to liability
and pore space ownership issues in CCS projects.
Long-term liabilities arise from migration of the CO2 plume, either vertically through well bores,
fractures, or faults or horizontally by moving to points of leakage. Over time, project
uncertainties can be greatly reduced through a well-designed monitoring program. As
uncertainties are addressed and reduced, confidence in the location of CO2 plume in the
reservoir increases over years of MRV operations.
Migration of CO2 plumes might qualify as trespass or nuisance under State law. The oil industry
has addressed this liability during EOR and the issue of trespass has been addressed in a
Texas case (Texas Railroad Commission v. Manziel)51, which held that injection associated with
a state-authorized secondary recovery project would not cause trespass. This was decided
even though fluids move across property lines. In other States, this issue would be dependent
on individual State regulations and statutes.
While the lateral migration of CO2 outside the confining zone could indicate that modifications to
the project’s MRV are necessary, these events should not disqualify or affect the project’s
emission reductions as long as there is no leakage to the atmosphere.
If a CO2-EOR project has a leak which causes damage, the operating Company may be liable in
criminal or civil courts. Case law has built up around claims associated with subsurface injection
and liabilities can be managed through the existing legal system. To cover liability of
atmospheric leakage, Project Proponents can purchase private insurance designed to cover
damages associated with releases, including third-party liability and liability to ACR, and those
resulting from lost credits due to reversals. Insurance premiums would be paid by the Project
Proponent to the insurance company, and, in the event of CO2 leakage to the atmosphere, the
insurance company would cover obligations to compensate for reversals in GHG emissions
reductions (e.g., purchase and retire ERTs).
In lieu of insurance, Project Proponents may opt to create an ERT Reserve Account. Each year
the Project Proponent would deposit 10 (ten) percent of the project’s ERTs in the Reserve
Account. In the event of reversals, a debit shall be measured and reported, verified, and
reconciled by the Account by retiring ERTs from the Reserve Account. To provide flexibility,
contributions to the Reserve Account need not come from the project itself whose risk is being
mitigated. A Project Proponent may make its contribution in ERTs of any type and vintage.
If atmospheric leakage occurs, remediation will be conducted in accordance with the site-
specific remediation plan, and any leaks to the atmosphere shall be estimated and mitigated.
51 Railroad Commission of Texas v. Manziel, 361 S.W. 2d 560 (Tex. 1962)
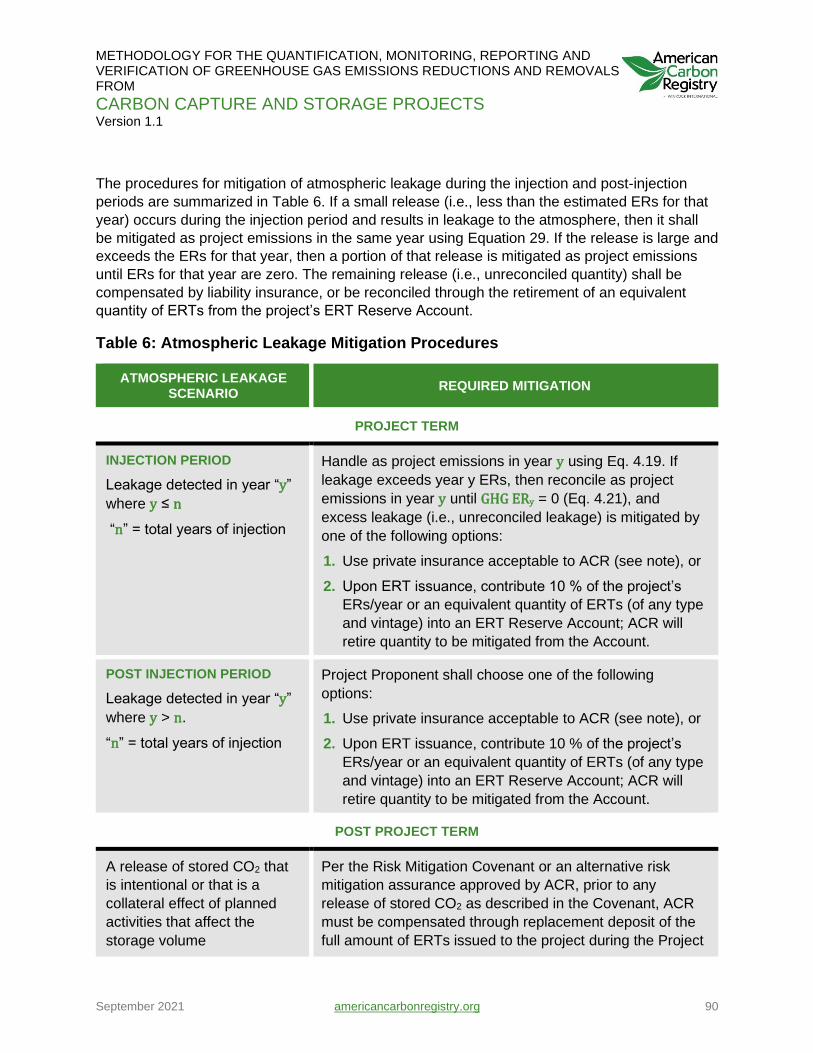
METHODOLOGY FOR THE QUANTIFICATION, MONITORING, REPORTING AND VERIFICATION OF GREENHOUSE GAS EMISSIONS REDUCTIONS AND REMOVALS FROM
CARBON CAPTURE AND STORAGE PROJECTS Version 1.1
September 2021 americancarbonregistry.org 90
The procedures for mitigation of atmospheric leakage during the injection and post-injection
periods are summarized in Table 6. If a small release (i.e., less than the estimated ERs for that
year) occurs during the injection period and results in leakage to the atmosphere, then it shall
be mitigated as project emissions in the same year using Equation 29. If the release is large and
exceeds the ERs for that year, then a portion of that release is mitigated as project emissions
until ERs for that year are zero. The remaining release (i.e., unreconciled quantity) shall be
compensated by liability insurance, or be reconciled through the retirement of an equivalent
quantity of ERTs from the project’s ERT Reserve Account.
Table 6: Atmospheric Leakage Mitigation Procedures
ATMOSPHERIC LEAKAGE SCENARIO
REQUIRED MITIGATION
PROJECT TERM
INJECTION PERIOD
Leakage detected in year “y”
where y ≤ n
“n” = total years of injection
Handle as project emissions in year y using Eq. 4.19. If
leakage exceeds year y ERs, then reconcile as project
emissions in year y until GHG ERy = 0 (Eq. 4.21), and
excess leakage (i.e., unreconciled leakage) is mitigated by
one of the following options:
1. Use private insurance acceptable to ACR (see note), or
2. Upon ERT issuance, contribute 10 % of the project’s
ERs/year or an equivalent quantity of ERTs (of any type
and vintage) into an ERT Reserve Account; ACR will
retire quantity to be mitigated from the Account.
POST INJECTION PERIOD
Leakage detected in year “y”
where y > n.
“n” = total years of injection
Project Proponent shall choose one of the following
options:
1. Use private insurance acceptable to ACR (see note), or
2. Upon ERT issuance, contribute 10 % of the project’s
ERs/year or an equivalent quantity of ERTs (of any type
and vintage) into an ERT Reserve Account; ACR will
retire quantity to be mitigated from the Account.
POST PROJECT TERM
A release of stored CO2 that
is intentional or that is a
collateral effect of planned
activities that affect the
storage volume
Per the Risk Mitigation Covenant or an alternative risk
mitigation assurance approved by ACR, prior to any
release of stored CO2 as described in the Covenant, ACR
must be compensated through replacement deposit of the
full amount of ERTs issued to the project during the Project

METHODOLOGY FOR THE QUANTIFICATION, MONITORING, REPORTING AND VERIFICATION OF GREENHOUSE GAS EMISSIONS REDUCTIONS AND REMOVALS FROM
CARBON CAPTURE AND STORAGE PROJECTS Version 1.1
September 2021 americancarbonregistry.org 91
ATMOSPHERIC LEAKAGE SCENARIO
REQUIRED MITIGATION
Term, allowing ACR to retire such ERTs. If an intentional or
collateral release occurs for a project with ERT’s subject to
Invalidation, ACR may invalidate such ERTs if replacement
ERTs are not deposited for retirement by ACR.
NOTE: Any private insurance policy must be evaluated and approved by ACR to make sure
there are no exclusions, term limitations, or liability limits that leave ACR exposed. Only once
ACR accepts the insurance product will ACR waive contributions to the ERT Reserve
Account.
If atmospheric leakage occurs during the post-injection period, then the Project Proponent shall
mitigate the leaked quantity by liability insurance or by the retirement of an equivalent quantity
of ERTs from the project’s ERT Reserve Account.
Project Proponents shall indicate their mitigation strategy (i.e., insurance or ERT Reserve
Account) in their GHG Project Plan. If Project Proponents choose to mitigate by insurance, then
that insurance product must be approved by ACR as indicated in Table 6. If Project Proponents
choose to mitigate by contributions to an ERT Reserve Account, those contributions shall begin
from the start of ERT crediting and shall constitute 10% of the project’s ERs each issuance, or
an equivalent quantity of ERTs (of any type and vintage).
In the event that atmospheric leakage exceeds the ERT Reserve Account contributions or the
coverage provided by insurance, the Project Proponent shall mitigate any unreconciled quantity
through deposit of sufficient ERTs for ACR’s retirement (of any type or vintage). If the Project
Proponent does not deposit sufficient ERTs to mitigate the leakage within 45 days, then ACR
retains the right to freeze the Proponent’s project account and retire any existing ERTs to
mitigate the unreconciled quantity.
6.4 PORE SPACE OWNERSHIP
CCS Project Proponents may need to own or obtain rights to the subsurface pore space where
CO2 will be injected and sequestered. In the U.S., with the exception of federal lands, the
acquisition of storage rights, which are considered property rights, generally is a function of
State law. In many States, no clear property right to use pore space has been assigned to
surface property owners covering the injection of fluids into deep geological formations. Such
injection under the underground injection control (UIC) program goes on without approval from
surface land owners except for those on whose property the injection well is located. These
projects appear to have adopted the “inverse rule of capture” rule that allows project owners to
be held non-liable if their injected fluids trespass into the subsurface of neighboring properties
METHODOLOGY FOR THE QUANTIFICATION, MONITORING, REPORTING AND VERIFICATION OF GREENHOUSE GAS EMISSIONS REDUCTIONS AND REMOVALS FROM
CARBON CAPTURE AND STORAGE PROJECTS Version 1.1
September 2021 americancarbonregistry.org 92
as long as their injection was in accordance with a federal or state-approved program. In effect
the subsurface rights vest in whoever is able to assert them physically on a first-come basis.52
As indicated in Appendix D, while pore space ownership issues are beginning to be addressed
through State law and regulation, those laws are not uniform. In the case of storage in non-EOR
projects, some states, including Montana, Wyoming, and North Dakota, have assigned pore
space ownership to the surface owners. In Wyoming and Montana, pore space ownership may
be severed and assigned to the mineral owner. In Texas, mineral rights are severed from
surface rights and there is no clear ownership of pore space between surface and mineral
owners; although, it is likely that pore space is owned by surface owners.
In the case of CO2 EOR projects, the right to inject CO2 into the subsurface oil reservoir
generally is contained in and part of the oil and gas lease that would have been obtained to
develop the project. Therefore, the right to use an oil reservoir for the associated storage of CO2
during the operational phase of a CO2 EOR project would be permissible under an oil and gas
lease.53 Once injected and secured in the reservoir, the operator is not required to extract the
injected CO2 at the completion of the operational phase of the project.
Migration of any injected fluid is only permissible provided the migration is in compliance with
regulations covering injection operations, does not interfere with preexisting mineral recovery
operations, cause damage to any adjacent subsurface and overlying surface properties, or
endanger public health and safety.54
In the case of EOR, it is typical that mineral lease rights and associated surface use rights
expire following the end of hydrocarbon production activities. However, monitoring after the end
of hydrocarbon extraction activities is needed as part of assuring no atmospheric leakage
(Section 5.4). Project Proponents shall ensure that EOR operators have continued access to the
surface to conduct post-injection monitoring activities and if necessary, remediation. Based on
the site-specific monitoring planned for the post-injection period and associated surface access
requirements, Project Proponents shall obtain needed surface use rights from the surface
owners for the duration of the Project Term. This will usually entail surface use agreements
similar to what is currently used to conduct groundwater remediation activities. Further, as
required by Section 5.4.1, Project Proponents shall obtain the consent of surface owners to the
filing of a Risk Mitigation Covenant or provide an alternative risk mitigation assurance
acceptable to ACR, and if it does not do so, the ERTs issued for the project shall be subject to
Invalidation.
52 Carbon Capture and Sequestration: Framing the Issues for Regulation, CCSReg Interim Report,
January 2009 53 Storage of Carbon Dioxide in Geologic Structures: A Legal and Regulatory Guide for States and
Provinces, IOGCC, 2007. 54 Carbon Capture and Sequestration: Framing the Issues for Regulation, Interim Report, CCSReg
Project, January 2009

METHODOLOGY FOR THE QUANTIFICATION, MONITORING, REPORTING AND VERIFICATION OF GREENHOUSE GAS EMISSIONS REDUCTIONS AND REMOVALS FROM
CARBON CAPTURE AND STORAGE PROJECTS Version 1.1
September 2021 americancarbonregistry.org 93
6.5 COMMUNITY AND
ENVIRONMENTAL IMPACTS
CCS projects involve the installation of capture technologies, pipelines and gas separation and
compression infrastructure. These CCS projects are capital-intensive and may require
environmental assessments. If an Environmental Assessment (EA) or an Environmental Impact
Statement (EIS) is required, that document or a summary thereof shall be provided to ACR and
provided to the VVB on request. There are different state and federal laws, regulations and
guidance that require an EA or EIS for certain government actions, such as the federal
Environmental Policy Act (NEPA) and state analogues. Project Proponents shall document in
the GHG Project Plan a mitigation plan for any foreseen negative community or environmental
impacts, and shall disclose in their annual Attestations any negative environmental or
community impacts or claims of negative environmental and community impacts made during
the reporting year. These claims include legal actions and/or other written complaints filed by
affected parties.
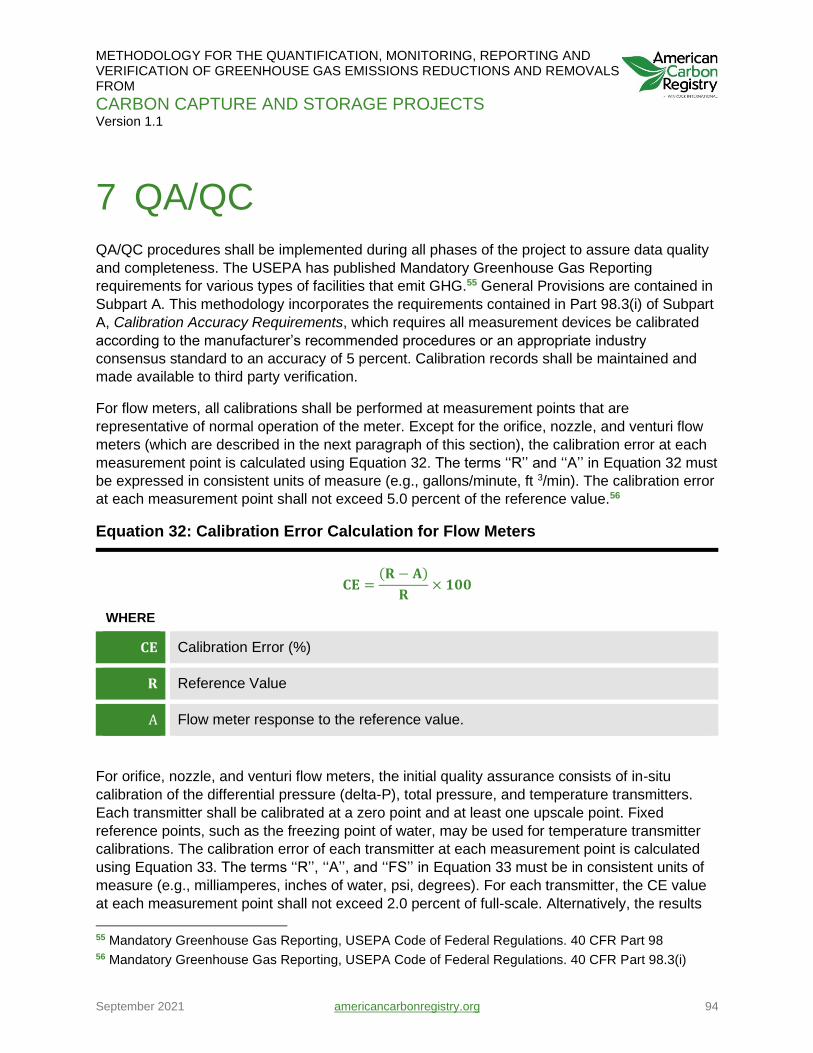
METHODOLOGY FOR THE QUANTIFICATION, MONITORING, REPORTING AND VERIFICATION OF GREENHOUSE GAS EMISSIONS REDUCTIONS AND REMOVALS FROM
CARBON CAPTURE AND STORAGE PROJECTS Version 1.1
September 2021 americancarbonregistry.org 94
7 QA/QC
QA/QC procedures shall be implemented during all phases of the project to assure data quality
and completeness. The USEPA has published Mandatory Greenhouse Gas Reporting
requirements for various types of facilities that emit GHG.55 General Provisions are contained in
Subpart A. This methodology incorporates the requirements contained in Part 98.3(i) of Subpart
A, Calibration Accuracy Requirements, which requires all measurement devices be calibrated
according to the manufacturer’s recommended procedures or an appropriate industry
consensus standard to an accuracy of 5 percent. Calibration records shall be maintained and
made available to third party verification.
For flow meters, all calibrations shall be performed at measurement points that are
representative of normal operation of the meter. Except for the orifice, nozzle, and venturi flow
meters (which are described in the next paragraph of this section), the calibration error at each
measurement point is calculated using Equation 32. The terms ‘‘R’’ and ‘‘A’’ in Equation 32 must
be expressed in consistent units of measure (e.g., gallons/minute, ft 3/min). The calibration error
at each measurement point shall not exceed 5.0 percent of the reference value.56
Equation 32: Calibration Error Calculation for Flow Meters
𝐂𝐄 =(𝐑 − 𝐀)
𝐑× 𝟏𝟎𝟎
WHERE
𝐂𝐄 Calibration Error (%)
𝐑 Reference Value
A Flow meter response to the reference value.
For orifice, nozzle, and venturi flow meters, the initial quality assurance consists of in-situ
calibration of the differential pressure (delta-P), total pressure, and temperature transmitters.
Each transmitter shall be calibrated at a zero point and at least one upscale point. Fixed
reference points, such as the freezing point of water, may be used for temperature transmitter
calibrations. The calibration error of each transmitter at each measurement point is calculated
using Equation 33. The terms ‘‘R’’, ‘‘A’’, and ‘‘FS’’ in Equation 33 must be in consistent units of
measure (e.g., milliamperes, inches of water, psi, degrees). For each transmitter, the CE value
at each measurement point shall not exceed 2.0 percent of full-scale. Alternatively, the results
55 Mandatory Greenhouse Gas Reporting, USEPA Code of Federal Regulations. 40 CFR Part 98 56 Mandatory Greenhouse Gas Reporting, USEPA Code of Federal Regulations. 40 CFR Part 98.3(i)
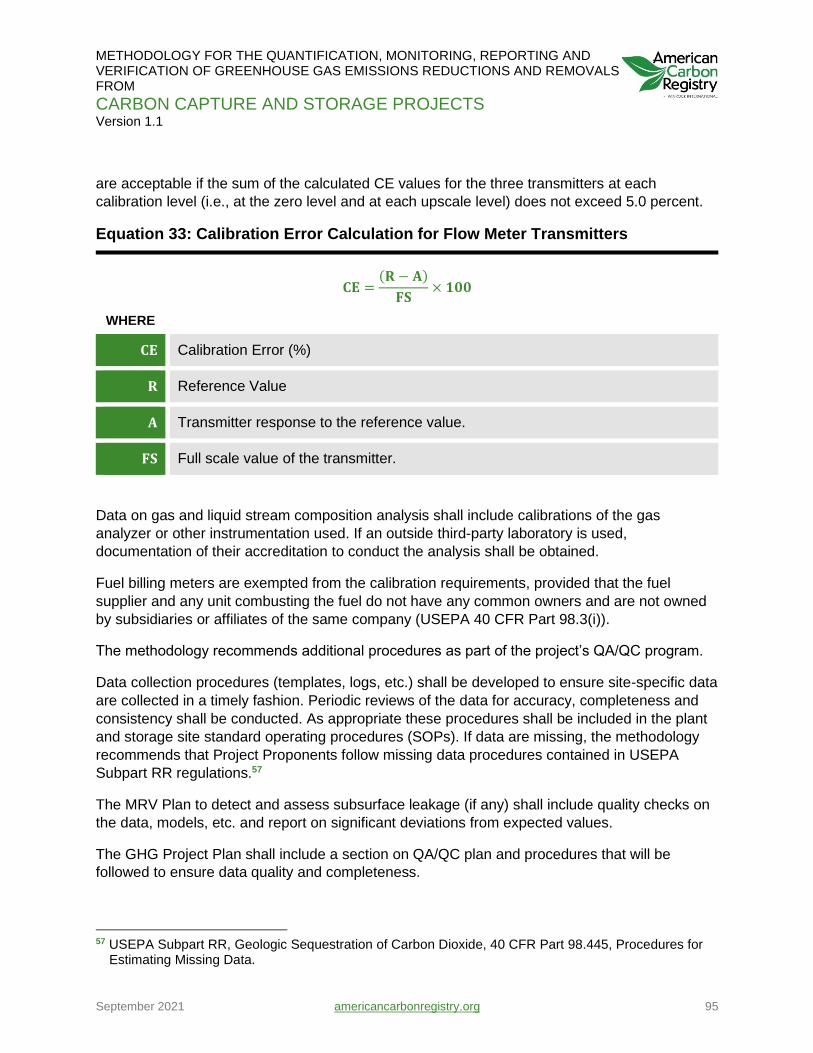
METHODOLOGY FOR THE QUANTIFICATION, MONITORING, REPORTING AND VERIFICATION OF GREENHOUSE GAS EMISSIONS REDUCTIONS AND REMOVALS FROM
CARBON CAPTURE AND STORAGE PROJECTS Version 1.1
September 2021 americancarbonregistry.org 95
are acceptable if the sum of the calculated CE values for the three transmitters at each
calibration level (i.e., at the zero level and at each upscale level) does not exceed 5.0 percent.
Equation 33: Calibration Error Calculation for Flow Meter Transmitters
𝐂𝐄 =(𝐑 − 𝐀)
𝐅𝐒× 𝟏𝟎𝟎
WHERE
𝐂𝐄 Calibration Error (%)
𝐑 Reference Value
𝐀 Transmitter response to the reference value.
𝐅𝐒 Full scale value of the transmitter.
Data on gas and liquid stream composition analysis shall include calibrations of the gas
analyzer or other instrumentation used. If an outside third-party laboratory is used,
documentation of their accreditation to conduct the analysis shall be obtained.
Fuel billing meters are exempted from the calibration requirements, provided that the fuel
supplier and any unit combusting the fuel do not have any common owners and are not owned
by subsidiaries or affiliates of the same company (USEPA 40 CFR Part 98.3(i)).
The methodology recommends additional procedures as part of the project’s QA/QC program.
Data collection procedures (templates, logs, etc.) shall be developed to ensure site-specific data
are collected in a timely fashion. Periodic reviews of the data for accuracy, completeness and
consistency shall be conducted. As appropriate these procedures shall be included in the plant
and storage site standard operating procedures (SOPs). If data are missing, the methodology
recommends that Project Proponents follow missing data procedures contained in USEPA
Subpart RR regulations.57
The MRV Plan to detect and assess subsurface leakage (if any) shall include quality checks on
the data, models, etc. and report on significant deviations from expected values.
The GHG Project Plan shall include a section on QA/QC plan and procedures that will be
followed to ensure data quality and completeness.
57 USEPA Subpart RR, Geologic Sequestration of Carbon Dioxide, 40 CFR Part 98.445, Procedures for
Estimating Missing Data.

METHODOLOGY FOR THE QUANTIFICATION, MONITORING, REPORTING AND VERIFICATION OF GREENHOUSE GAS EMISSIONS REDUCTIONS AND REMOVALS FROM
CARBON CAPTURE AND STORAGE PROJECTS Version 1.1
September 2021 americancarbonregistry.org 96
8 UNCERTAINTIES
The emission reduction calculations in this methodology are designed to minimize the possibility
of overestimation and over-crediting of GHG emission reductions, due to various uncertainties,
primarily associated with fluid flow and composition analysis of gas and liquid streams, plant
operating parameters, and accurate logs of emission leakage events maintained by site
operators.
While some of these uncertainties are more easily quantified than others, the sources and
relative magnitude of uncertainties (and changes thereof) shall be explicitly addressed and
discussed by the Project Proponent and described in the GHG Project Plan as part of the GHG
emissions calculation and reporting process.
Potential sources of uncertainty and the associated QA/QC program elements designed to
minimize them are summarized in Table 7. Overall uncertainty can be assessed by using the
uncertainties of each element in a calculation.
The accuracy and precision of measurement equipment, such as the flow meters, gas
composition analyzers, process measurements (e.g., electricity and steam), are readily
quantified and the uncertainties associated with each measurement are considered to be low.
The accuracy and completeness of site operator data on blowdown events and estimates of
fugitive emission losses depend on meticulous logs maintained by the operator. The uncertainty
in these parameters is considered low since site operators are currently required to report these
data to the USEPA as part of their reporting requirements under Subpart W.58 Operators that
are exempt from Subpart W reporting shall follow procedures contained in subpart W to
estimate losses from blowdown events and fugitive emissions.
The uncertainty in detection and assessment of leakage from the subsurface to the atmosphere
is dependent on the design and implementation of a site’s MRV Plan. For EOR sites, the
geologic storage site is generally well characterized and modeled. The development of a site-
specific MRV Plan, that identifies possible leakage pathways and utilizes a proper set of
monitoring tools to provide assurance of containment and to detect leakage, should it occur, is
critical. There is a wealth of oil and gas industry experience in the design and implementation of
proper monitoring tools, many of which are currently being utilized to optimize production.
Based on the implementation of a well-designed MRV Plan, the uncertainty in detection and
measurement of leakage is considered low for EOR sites.
58 Subpart W – Petroleum and Natural Gas Systems | Greenhouse Gas Reporting Program (GHGRP) | US EPA ,
states: owners or operators of facilities that contain petroleum and natural gas systems and emit 25,000 metric tons or more of GHGs per year must report emissions from all source categories located at the facility for which emission calculation methods are defined in the rule. It includes the reporting of venting and fugitive emissions from onshore petroleum and natural gas production facilities, such as EOR operations.
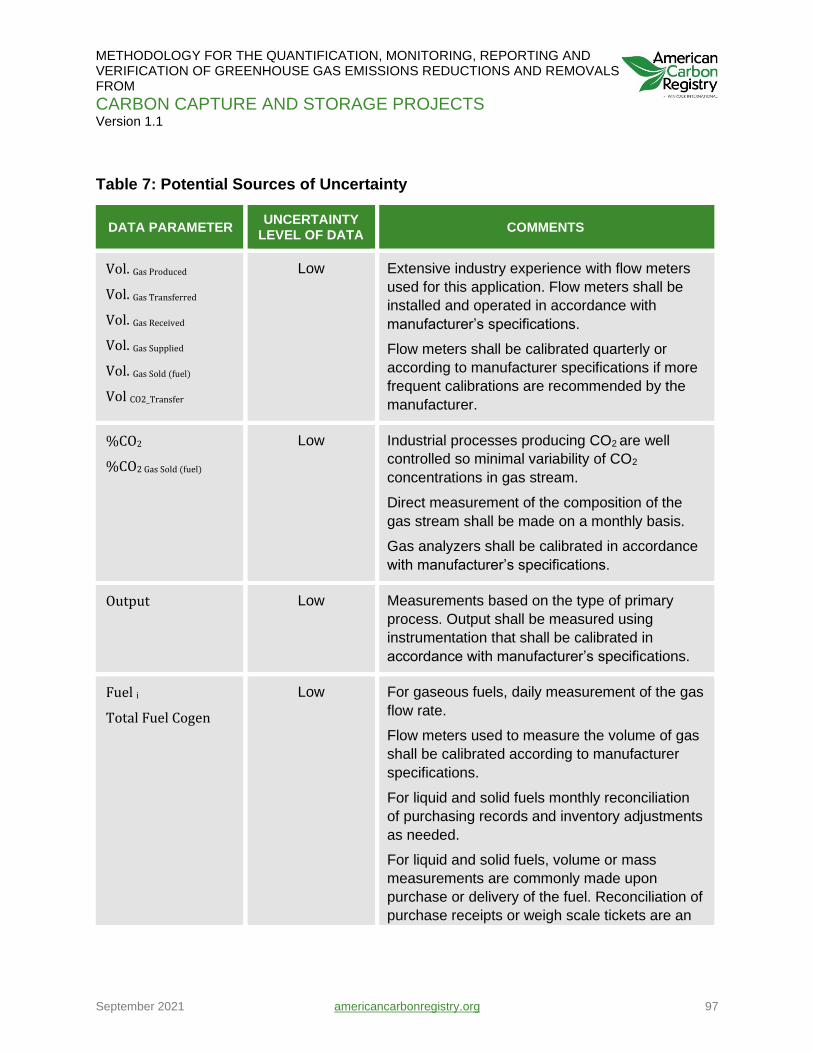
METHODOLOGY FOR THE QUANTIFICATION, MONITORING, REPORTING AND VERIFICATION OF GREENHOUSE GAS EMISSIONS REDUCTIONS AND REMOVALS FROM
CARBON CAPTURE AND STORAGE PROJECTS Version 1.1
September 2021 americancarbonregistry.org 97
Table 7: Potential Sources of Uncertainty
DATA PARAMETER UNCERTAINTY
LEVEL OF DATA COMMENTS
Vol. Gas Produced
Vol. Gas Transferred
Vol. Gas Received
Vol. Gas Supplied
Vol. Gas Sold (fuel)
Vol CO2_Transfer
Low Extensive industry experience with flow meters
used for this application. Flow meters shall be
installed and operated in accordance with
manufacturer’s specifications.
Flow meters shall be calibrated quarterly or
according to manufacturer specifications if more
frequent calibrations are recommended by the
manufacturer.
%CO2
%CO2 Gas Sold (fuel)
Low Industrial processes producing CO2 are well
controlled so minimal variability of CO2
concentrations in gas stream.
Direct measurement of the composition of the
gas stream shall be made on a monthly basis.
Gas analyzers shall be calibrated in accordance
with manufacturer’s specifications.
Output Low Measurements based on the type of primary
process. Output shall be measured using
instrumentation that shall be calibrated in
accordance with manufacturer’s specifications.
Fuel i
Total Fuel Cogen
Low For gaseous fuels, daily measurement of the gas
flow rate.
Flow meters used to measure the volume of gas
shall be calibrated according to manufacturer
specifications.
For liquid and solid fuels monthly reconciliation
of purchasing records and inventory adjustments
as needed.
For liquid and solid fuels, volume or mass
measurements are commonly made upon
purchase or delivery of the fuel. Reconciliation of
purchase receipts or weigh scale tickets are an
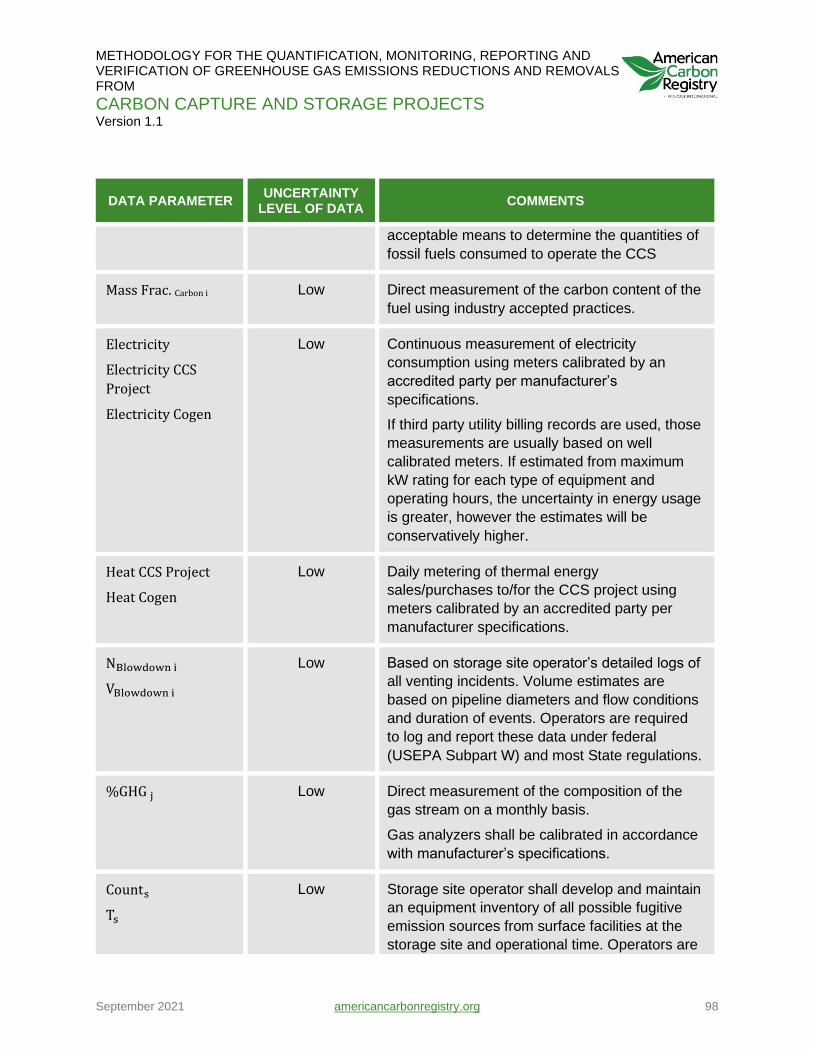
METHODOLOGY FOR THE QUANTIFICATION, MONITORING, REPORTING AND VERIFICATION OF GREENHOUSE GAS EMISSIONS REDUCTIONS AND REMOVALS FROM
CARBON CAPTURE AND STORAGE PROJECTS Version 1.1
September 2021 americancarbonregistry.org 98
DATA PARAMETER UNCERTAINTY
LEVEL OF DATA COMMENTS
acceptable means to determine the quantities of
fossil fuels consumed to operate the CCS
Mass Frac. Carbon i Low Direct measurement of the carbon content of the
fuel using industry accepted practices.
Electricity
Electricity CCS
Project
Electricity Cogen
Low Continuous measurement of electricity
consumption using meters calibrated by an
accredited party per manufacturer’s
specifications.
If third party utility billing records are used, those
measurements are usually based on well
calibrated meters. If estimated from maximum
kW rating for each type of equipment and
operating hours, the uncertainty in energy usage
is greater, however the estimates will be
conservatively higher.
Heat CCS Project
Heat Cogen
Low Daily metering of thermal energy
sales/purchases to/for the CCS project using
meters calibrated by an accredited party per
manufacturer specifications.
NBlowdown i
VBlowdown i
Low Based on storage site operator’s detailed logs of
all venting incidents. Volume estimates are
based on pipeline diameters and flow conditions
and duration of events. Operators are required
to log and report these data under federal
(USEPA Subpart W) and most State regulations.
%GHG j Low Direct measurement of the composition of the
gas stream on a monthly basis.
Gas analyzers shall be calibrated in accordance
with manufacturer’s specifications.
Counts
Ts
Low Storage site operator shall develop and maintain
an equipment inventory of all possible fugitive
emission sources from surface facilities at the
storage site and operational time. Operators are
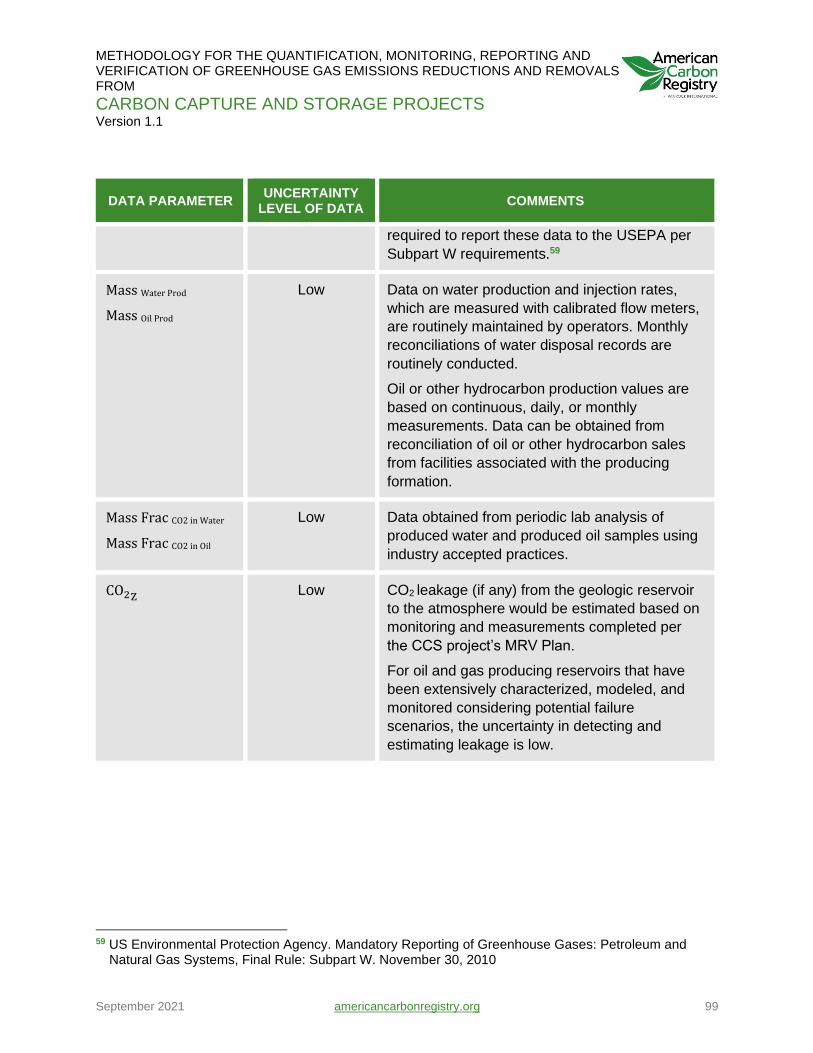
METHODOLOGY FOR THE QUANTIFICATION, MONITORING, REPORTING AND VERIFICATION OF GREENHOUSE GAS EMISSIONS REDUCTIONS AND REMOVALS FROM
CARBON CAPTURE AND STORAGE PROJECTS Version 1.1
September 2021 americancarbonregistry.org 99
DATA PARAMETER UNCERTAINTY
LEVEL OF DATA COMMENTS
required to report these data to the USEPA per
Subpart W requirements.59
Mass Water Prod
Mass Oil Prod
Low Data on water production and injection rates,
which are measured with calibrated flow meters,
are routinely maintained by operators. Monthly
reconciliations of water disposal records are
routinely conducted.
Oil or other hydrocarbon production values are
based on continuous, daily, or monthly
measurements. Data can be obtained from
reconciliation of oil or other hydrocarbon sales
from facilities associated with the producing
formation.
Mass Frac CO2 in Water
Mass Frac CO2 in Oil
Low Data obtained from periodic lab analysis of
produced water and produced oil samples using
industry accepted practices.
CO2Z Low CO2 leakage (if any) from the geologic reservoir
to the atmosphere would be estimated based on
monitoring and measurements completed per
the CCS project’s MRV Plan.
For oil and gas producing reservoirs that have
been extensively characterized, modeled, and
monitored considering potential failure
scenarios, the uncertainty in detecting and
estimating leakage is low.
59 US Environmental Protection Agency. Mandatory Reporting of Greenhouse Gases: Petroleum and
Natural Gas Systems, Final Rule: Subpart W. November 30, 2010
METHODOLOGY FOR THE QUANTIFICATION, MONITORING, REPORTING AND VERIFICATION OF GREENHOUSE GAS EMISSIONS REDUCTIONS AND REMOVALS FROM
CARBON CAPTURE AND STORAGE PROJECTS Version 1.1
September 2021 americancarbonregistry.org 100
DEFINITIONS
For additional definitions of standard terms see the latest version of the ACR Standard
Atmospheric
Leakage
Leakage of injected CO2 from the geologic storage reservoir to the atmosphere.
Carbon
Capture and
Storage
The separation and capture of carbon dioxide (CO2) from the atmospheric
emissions of industrial processes or the direct air capture (DAC) of atmospheric
CO2 and the transport and safe, permanent storage of the CO2 in deep
underground geologic formations.
Confining
Zone
Region in the subsurface above the Storage Volume that forms a nearly
impenetrable layer to the vertical migration of CO2.
Direct Air
Capture
Process of separating and capturing CO2 from the atmosphere.
Enhanced
Oil
Recovery
The process of producing hydrocarbons from subsurface reservoirs using
thermal, gas, or chemical injection techniques. In this methodology, EOR
concerns the injection of CO2 to produce hydrocarbons from the reservoir.
Excess CO2
Emissions
Additional CO2 emissions that could result from poor or negligent operation of
the primary process, or from not meeting existing regulations mandating the use
of certain technologies, or regulations directly controlling CO2 emissions or other
pollutant emissions which indirectly affect CO2 emissions. Projects shall not be
credited for storage of excess CO2 emissions.
Fugitive
Emissions
Emissions due to leaks from equipment such as flanges, valves, flow meters,
headers, etc. These emissions can occur in the capture, transport, injection, and
storage segments of the project and are calculated using procedures described
in Section 4.0.
Functional
Equivalence
A project and baseline are functionally equivalent if they provide the same
function while delivering comparable products in quality and quantity.
Geologic
Storage
The placement of CO2 into a subsurface formation, such as an oil and gas
producing reservoir or a deep saline aquifer, where it will remain safely and
permanently stored.
METHODOLOGY FOR THE QUANTIFICATION, MONITORING, REPORTING AND VERIFICATION OF GREENHOUSE GAS EMISSIONS REDUCTIONS AND REMOVALS FROM
CARBON CAPTURE AND STORAGE PROJECTS Version 1.1
September 2021 americancarbonregistry.org 101
Geologic
Storage
Reservoir
See Reservoir
Greenhouse
Gas (GHG)
Assessment
Boundary
The greenhouse gases included in the calculation of baseline and project
emissions. In this methodology these include carbon dioxide (CO2), methane
(CH4), and nitrous oxide (N2O).
Invalidation The voiding of an ERT by ACR. In the event that and for so long as a Project
Proponent has not filed a Risk Mitigation Covenant or provided an alternative
risk mitigation assurance acceptable to ACR as described in Section 5.4.1,
ERTs issued for the project shall be subject to invalidation by ACR in the event
of an intentional reversal for which compensation is not made.
Monitoring,
Reporting,
and
Verification
(MRV) Plan
A verifiable project-specific plan which includes the monitoring and reporting
requirements described in Section 5.4 of this methodology.
Oil and Gas
Reservoir
See Reservoir
Permanence Permanence refers to the perpetual nature of removal enhancements and the
risk of reversal of a project’s emissions reductions, i.e., the risk that atmospheric
benefit will not be permanent. GHG removals may not be permanent if a project
has exposure to risk factors, including unintentional reversals (i.e. atmospheric
leakage as defined above) and intentional reversals (e.g., release of stored CO2
that is intentional or that is a collateral effect of any planned activities affecting
the storage volume). For CCS projects, the absence of atmospheric leakage
during the Project Term is considered assured when it can be verified that no
migration of injected CO2 is detected across the boundaries of the storage
volume and the modeled failure scenarios all indicate that the CO2 will remain
contained within the storage volume (see 5.4.1). The risk of intentional reversal
is determined by an assurance that the injected CO2 remains in the storage
volume based on the post-injection monitoring strategy and post-Project Term
storage requirements described in Section 5.4.
Physical
Boundary
GHG emission sources included in the project.
METHODOLOGY FOR THE QUANTIFICATION, MONITORING, REPORTING AND VERIFICATION OF GREENHOUSE GAS EMISSIONS REDUCTIONS AND REMOVALS FROM
CARBON CAPTURE AND STORAGE PROJECTS Version 1.1
September 2021 americancarbonregistry.org 102
Primary
Process
The specific power generation or industrial process (e.g., natural gas
processing, hydrogen production, steelmaking) creating the captured CO2.
Primary
Recovery
Process
The production of hydrocarbons from the subsurface without the use of artificial
methods, such as water, steam, gas or chemical injection.
Producing
reservoir
See Reservoir.
Projection-
based
Baseline
A baseline that would correspond with the project’s actual CO2 capture site,
absent the capture and compression system located at the CO2 source.
Reversal Atmospheric leakage of injected CO2 from the Storage Volume that is not
remediated.
Reversal
Risk
Mitigation
Mechanism
Project Proponents shall mitigate reversal risk by contributing ERTs from the
project itself to the ACR ERT Reserve Account; contributing ERTs of another
type or vintage to the ACR ERT Reserve Account; providing evidence of
sufficient insurance coverage with an ACR-approved insurance product to
recover any future reversal; or using another ACR-approved risk mitigation
mechanism. ACR requires geologic sequestration Project Proponents to use
approved methodologies that assure permanence including ongoing QA/QC and
long-term monitoring and reversal risk mitigation measures as described in
Section 5.4.
Reservoir A three-dimensional confined region in the subsurface that encompasses the
region containing hydrocarbons being produced.
Risk
Mitigation
Covenant
A covenant filed in the real property records of each county, parish and other
governmental subdivision that maintains real property records showing
ownership of and encumbrances on real property in the jurisdictions in which the
CO2 storage volume is located, prohibiting any intentional reversal (e.g., release
of stored CO2 that is intentional or that is a collateral effect of any planned
activities affecting the storage volume) unless measures are taken in advance to
compensate for the reversal by replacing the reversed ERTs for ACR’s
retirement pursuant to a plan acceptable to ACR. See section 5.4.1.
Standards-
based
Baseline
A baseline represented by a performance or regulatory standard, usually
expressed in the form of an intensity metric (e.g., tonnes of CO2 per megawatt
hour of generated electricity).

METHODOLOGY FOR THE QUANTIFICATION, MONITORING, REPORTING AND VERIFICATION OF GREENHOUSE GAS EMISSIONS REDUCTIONS AND REMOVALS FROM
CARBON CAPTURE AND STORAGE PROJECTS Version 1.1
September 2021 americancarbonregistry.org 103
Storage
Volume
A space within the subsurface into which the project CO2 is injected and where
the injected CO2 is stored permanently.
Venting
Emissions
Emissions through dedicated vent stacks during normal operation, process
upsets, or shutdowns. These emissions can occur in the capture, transport,
injection, and storage segments of the project and are calculated using
procedures described in Section 4.0.
METHODOLOGY FOR THE QUANTIFICATION, MONITORING, REPORTING AND VERIFICATION OF GREENHOUSE GAS EMISSIONS REDUCTIONS AND REMOVALS FROM
CARBON CAPTURE AND STORAGE PROJECTS Version 1.1
September 2021 americancarbonregistry.org 104
Crude oil development and production in U.S. oil reservoirs has included three distinct phases:
primary, secondary, and tertiary (or enhanced) recovery. After primary and secondary
techniques have been used to recover the easy-to-produce oil, producers have attempted
several tertiary, or EOR, techniques.
Three major categories of EOR have been found to be commercially successful to varying
degrees depending on the oil and reservoir properties and implementation costs:
Thermal recovery, which involves the introduction of heat such as the injection of steam to
lower the viscosity, or thin, the heavy viscous oil, and improve its ability to flow through the
reservoir. Thermal techniques account for over 40 percent of U.S. EOR production, primarily
in California.
Gas injection, which uses gases such as natural gas, nitrogen, or carbon dioxide that expand
in a reservoir to push additional oil to a production wellbore, or that dissolve in the oil to lower
its viscosity and improves its flow rate. A description of CO2 injection for EOR is included in
this section. Gas injection accounts for nearly 60 percent of EOR production in the United
States.
Chemical injection, which can involve the use of long-chained molecules called polymers to
increase the effectiveness of waterfloods, or the use of detergent-like surfactants to help
lower the surface tension that often prevents oil droplets from moving through a reservoir.
Chemical techniques account for about one percent of U.S. EOR production.60
The injection of CO2 into oil reservoirs for EOR has been performed by the oil industry for more
than 40 years. CO2 EOR is based on the concept of miscible or immiscible displacement of oil
by CO2. A typical CO2 flood operation is shown in Figure 4. CO2 is compressed to supercritical
conditions and injected into injection wells that are strategically placed within the pattern of wells
across the areal extent of the reservoir. The injected CO2 enters the reservoir and moves
through the pore spaces of the rock, encountering residual droplets of crude oil, becoming
miscible with the oil, and forming a concentrated oil bank that is swept towards the producing
wells. At the producing wells—and there may be three, four or more producers per injection
well—oil mixed with water and gas is pumped to the surface, where it flows to a centralized
collection facility. The produced fluid containing oil, water, gas, and CO2 is separated at the
surface. Any produced CO2 is re-compressed and re-injected along with additional volumes of
60 Enhanced Oil Recovery | Department of Energy
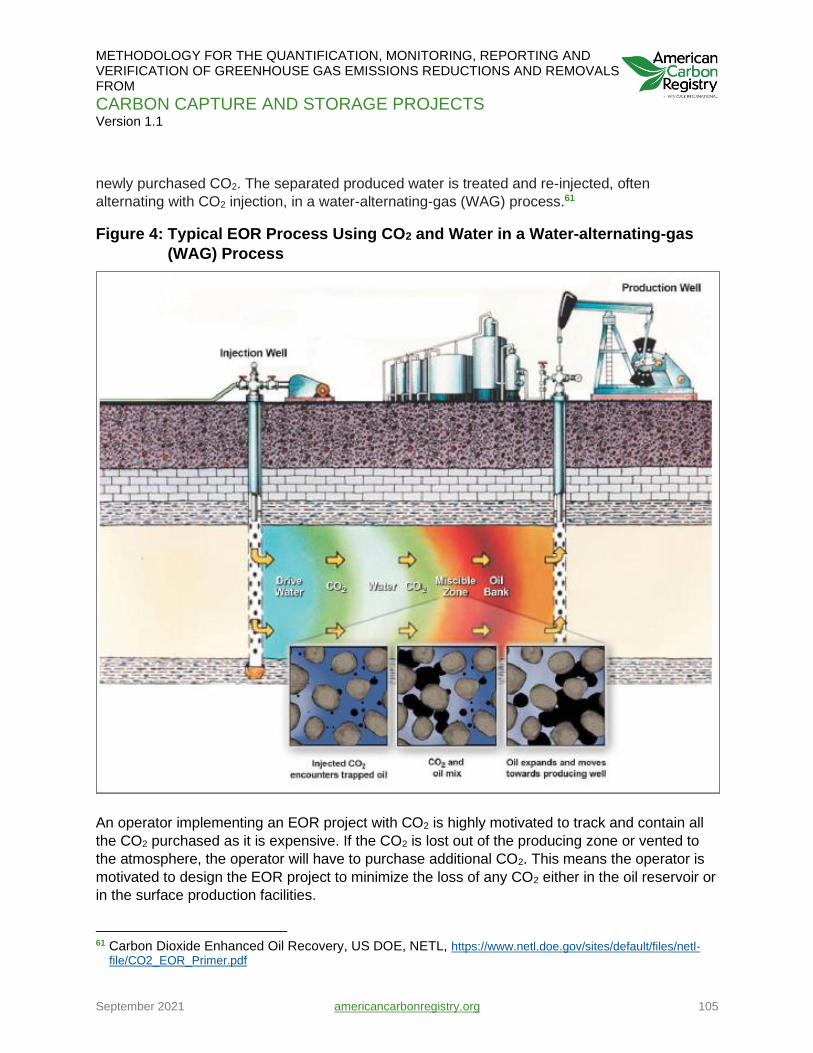
METHODOLOGY FOR THE QUANTIFICATION, MONITORING, REPORTING AND VERIFICATION OF GREENHOUSE GAS EMISSIONS REDUCTIONS AND REMOVALS FROM
CARBON CAPTURE AND STORAGE PROJECTS Version 1.1
September 2021 americancarbonregistry.org 105
newly purchased CO2. The separated produced water is treated and re-injected, often
alternating with CO2 injection, in a water-alternating-gas (WAG) process.61
Figure 4: Typical EOR Process Using CO2 and Water in a Water-alternating-gas
(WAG) Process
An operator implementing an EOR project with CO2 is highly motivated to track and contain all
the CO2 purchased as it is expensive. If the CO2 is lost out of the producing zone or vented to
the atmosphere, the operator will have to purchase additional CO2. This means the operator is
motivated to design the EOR project to minimize the loss of any CO2 either in the oil reservoir or
in the surface production facilities.
61 Carbon Dioxide Enhanced Oil Recovery, US DOE, NETL, https://www.netl.doe.gov/sites/default/files/netl-
file/CO2_EOR_Primer.pdf

METHODOLOGY FOR THE QUANTIFICATION, MONITORING, REPORTING AND VERIFICATION OF GREENHOUSE GAS EMISSIONS REDUCTIONS AND REMOVALS FROM
CARBON CAPTURE AND STORAGE PROJECTS Version 1.1
September 2021 americancarbonregistry.org 106
When CO2 is injected into the reservoir, it is generally injected at a pressure that results in total
or partial miscibility with the oil in the reservoir. A portion of CO2 will become soluble (mixed)
with the oil and be recovered when the oil is produced. Of the remaining CO2 injected, some of
the CO2 will be permanently trapped in the rock’s pore space, some will become dissolved in the
formation brine, and the remainder will migrate within the reservoir. The CO2 that is trapped in
the rock’s pore space is effectively sequestered forever. The CO2 that is not trapped in the pore
space and not mixed with the oil tends to migrate to the upper regions of the oil reservoir, as it is
lighter than the oil and water in the formation. However, it remains contained in the oil reservoir
because of the confining layer above the oil reservoir that traps it in place. This is the same
confining layer that formed an effective seal and contained the oil and gas in the reservoir for
millions of years and now serves to trap the CO2.
The CO2 that is produced with the oil will separate from the oil at the surface and be captured.
This captured CO2 is then compressed and re-injected into the oil reservoir where the process
starts all over again. The EOR operator maintains tight control over CO2 at the surface facilities
to minimize any losses as it is expensive to lose the CO2. In addition, the CO2 can be effectively
measured and monitored while being handled in the surface facilities.
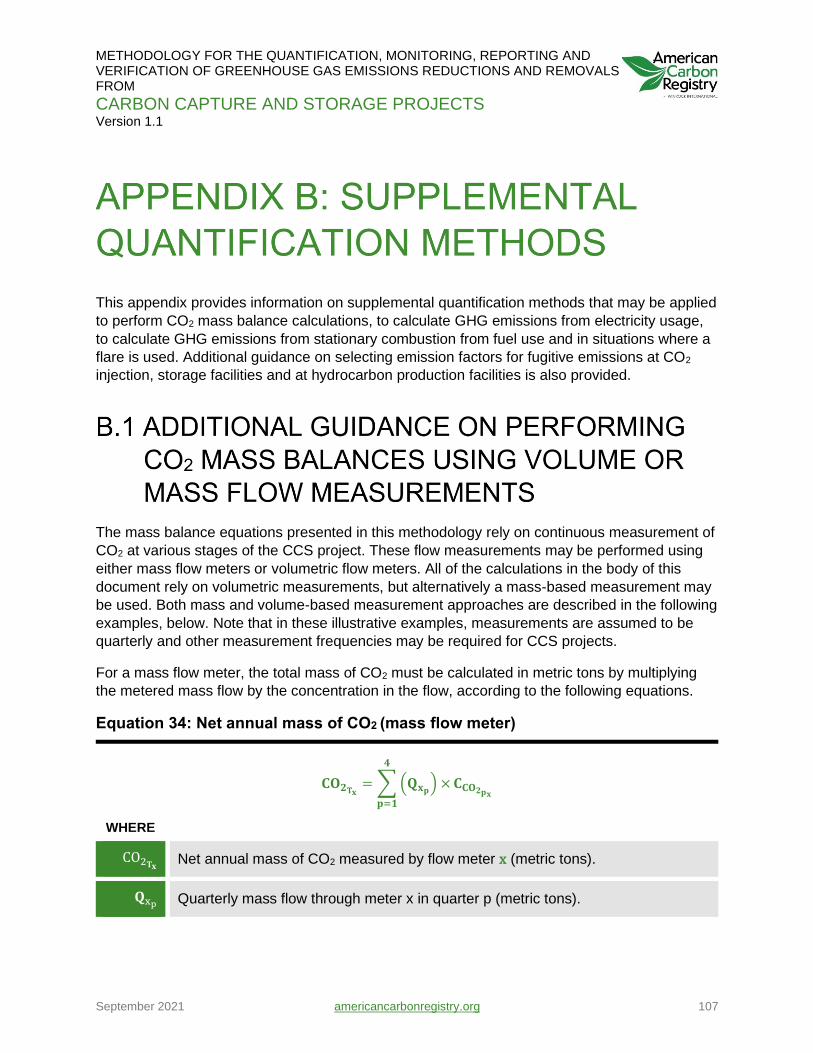
METHODOLOGY FOR THE QUANTIFICATION, MONITORING, REPORTING AND VERIFICATION OF GREENHOUSE GAS EMISSIONS REDUCTIONS AND REMOVALS FROM
CARBON CAPTURE AND STORAGE PROJECTS Version 1.1
September 2021 americancarbonregistry.org 107
This appendix provides information on supplemental quantification methods that may be applied
to perform CO2 mass balance calculations, to calculate GHG emissions from electricity usage,
to calculate GHG emissions from stationary combustion from fuel use and in situations where a
flare is used. Additional guidance on selecting emission factors for fugitive emissions at CO2
injection, storage facilities and at hydrocarbon production facilities is also provided.
The mass balance equations presented in this methodology rely on continuous measurement of
CO2 at various stages of the CCS project. These flow measurements may be performed using
either mass flow meters or volumetric flow meters. All of the calculations in the body of this
document rely on volumetric measurements, but alternatively a mass-based measurement may
be used. Both mass and volume-based measurement approaches are described in the following
examples, below. Note that in these illustrative examples, measurements are assumed to be
quarterly and other measurement frequencies may be required for CCS projects.
For a mass flow meter, the total mass of CO2 must be calculated in metric tons by multiplying
the metered mass flow by the concentration in the flow, according to the following equations.
Equation 34: Net annual mass of CO2 (mass flow meter)
𝐂𝐎𝟐𝐓𝐱= ∑ (𝐐𝐱𝐩
) ×
𝟒
𝐩=𝟏
𝐂𝐂𝐎𝟐𝐩𝐱
WHERE
CO2𝐓𝐱 Net annual mass of CO2 measured by flow meter x (metric tons).
𝐐xp Quarterly mass flow through meter x in quarter p (metric tons).
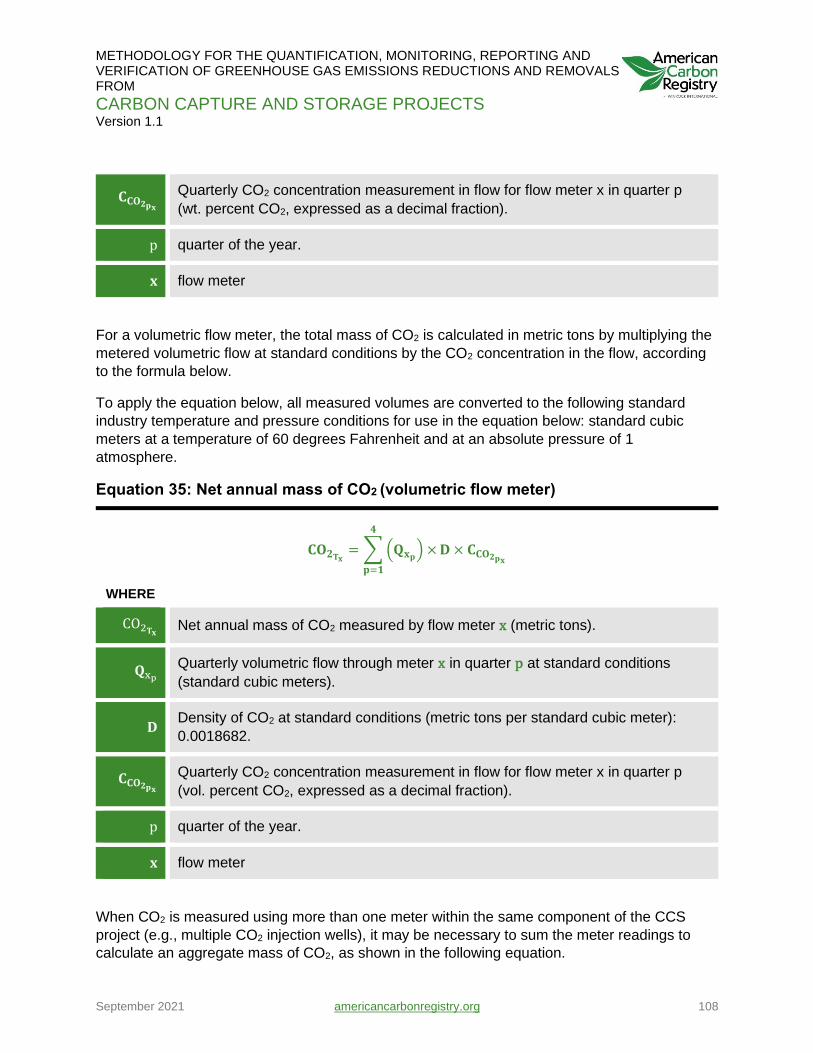
METHODOLOGY FOR THE QUANTIFICATION, MONITORING, REPORTING AND VERIFICATION OF GREENHOUSE GAS EMISSIONS REDUCTIONS AND REMOVALS FROM
CARBON CAPTURE AND STORAGE PROJECTS Version 1.1
September 2021 americancarbonregistry.org 108
𝐂𝐂𝐎𝟐𝐩𝐱 Quarterly CO2 concentration measurement in flow for flow meter x in quarter p
(wt. percent CO2, expressed as a decimal fraction).
p quarter of the year.
𝐱 flow meter
For a volumetric flow meter, the total mass of CO2 is calculated in metric tons by multiplying the
metered volumetric flow at standard conditions by the CO2 concentration in the flow, according
to the formula below.
To apply the equation below, all measured volumes are converted to the following standard
industry temperature and pressure conditions for use in the equation below: standard cubic
meters at a temperature of 60 degrees Fahrenheit and at an absolute pressure of 1
atmosphere.
Equation 35: Net annual mass of CO2 (volumetric flow meter)
𝐂𝐎𝟐𝐓𝐱= ∑ (𝐐𝐱𝐩
) ×
𝟒
𝐩=𝟏
𝐃 × 𝐂𝐂𝐎𝟐𝐩𝐱
WHERE
CO2𝐓𝐱 Net annual mass of CO2 measured by flow meter x (metric tons).
𝐐xp
Quarterly volumetric flow through meter x in quarter p at standard conditions
(standard cubic meters).
𝐃 Density of CO2 at standard conditions (metric tons per standard cubic meter):
0.0018682.
𝐂𝐂𝐎𝟐𝐩𝐱 Quarterly CO2 concentration measurement in flow for flow meter x in quarter p
(vol. percent CO2, expressed as a decimal fraction).
p quarter of the year.
𝐱 flow meter
When CO2 is measured using more than one meter within the same component of the CCS
project (e.g., multiple CO2 injection wells), it may be necessary to sum the meter readings to
calculate an aggregate mass of CO2, as shown in the following equation.
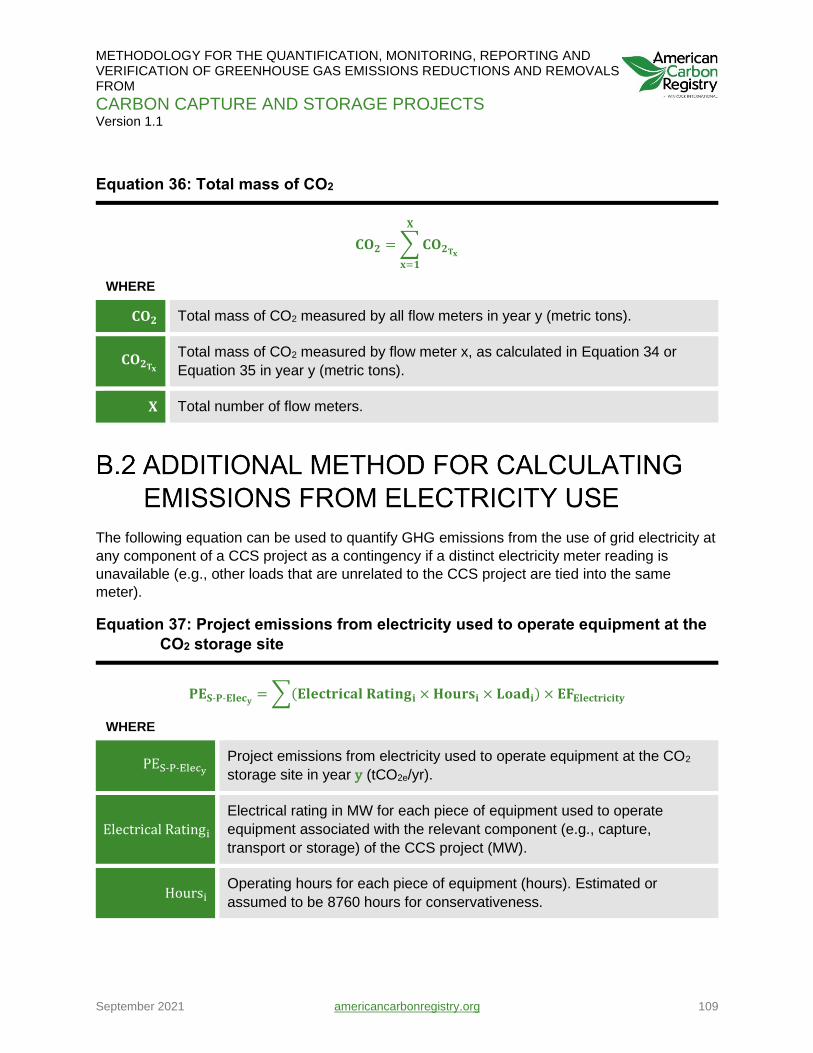
METHODOLOGY FOR THE QUANTIFICATION, MONITORING, REPORTING AND VERIFICATION OF GREENHOUSE GAS EMISSIONS REDUCTIONS AND REMOVALS FROM
CARBON CAPTURE AND STORAGE PROJECTS Version 1.1
September 2021 americancarbonregistry.org 109
Equation 36: Total mass of CO2
𝐂𝐎𝟐 = ∑ 𝐂𝐎𝟐𝐓𝐱
𝐗
𝐱=𝟏
WHERE
𝐂𝐎𝟐 Total mass of CO2 measured by all flow meters in year y (metric tons).
𝐂𝐎𝟐𝐓𝐱
Total mass of CO2 measured by flow meter x, as calculated in Equation 34 or
Equation 35 in year y (metric tons).
𝐗 Total number of flow meters.
The following equation can be used to quantify GHG emissions from the use of grid electricity at
any component of a CCS project as a contingency if a distinct electricity meter reading is
unavailable (e.g., other loads that are unrelated to the CCS project are tied into the same
meter).
Equation 37: Project emissions from electricity used to operate equipment at the
CO2 storage site
𝐏𝐄𝐒-𝐏-𝐄𝐥𝐞𝐜𝐲= ∑(𝐄𝐥𝐞𝐜𝐭𝐫𝐢𝐜𝐚𝐥 𝐑𝐚𝐭𝐢𝐧𝐠𝐢 × 𝐇𝐨𝐮𝐫𝐬𝐢 × 𝐋𝐨𝐚𝐝𝐢) × 𝐄𝐅𝐄𝐥𝐞𝐜𝐭𝐫𝐢𝐜𝐢𝐭𝐲
WHERE
PES-P-Elecy
Project emissions from electricity used to operate equipment at the CO2
storage site in year y (tCO2e/yr).
Electrical Ratingi
Electrical rating in MW for each piece of equipment used to operate
equipment associated with the relevant component (e.g., capture,
transport or storage) of the CCS project (MW).
Hoursi Operating hours for each piece of equipment (hours). Estimated or
assumed to be 8760 hours for conservativeness.
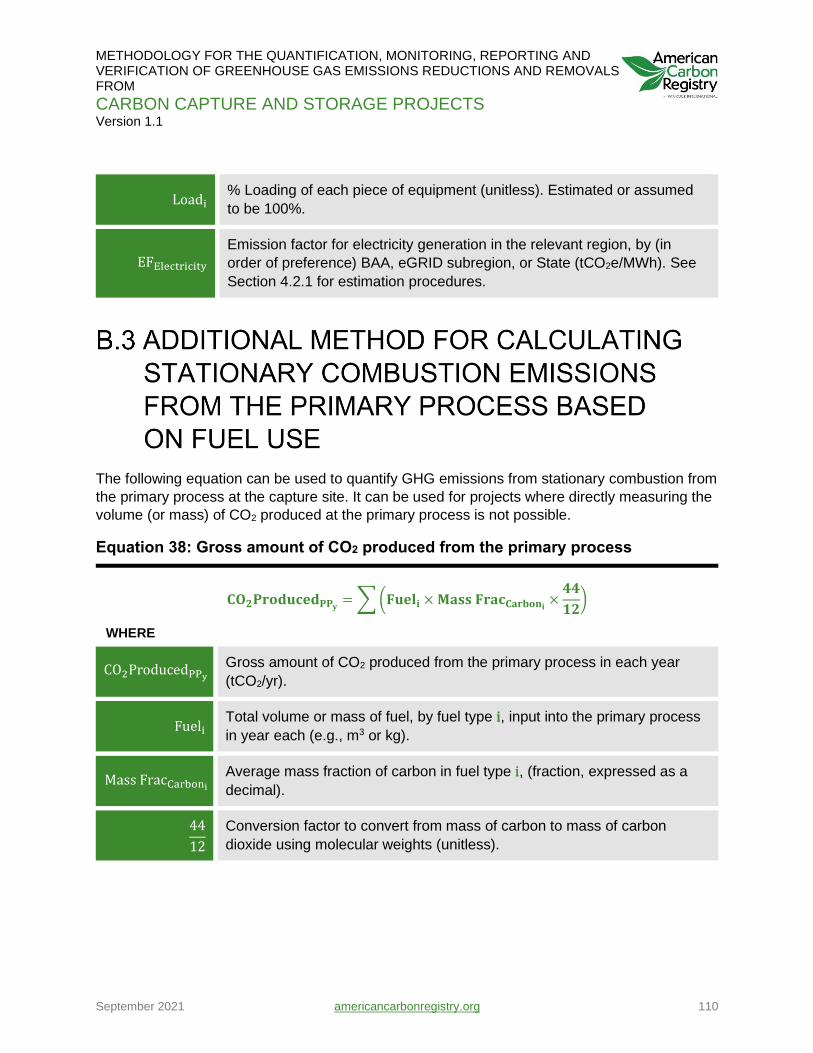
METHODOLOGY FOR THE QUANTIFICATION, MONITORING, REPORTING AND VERIFICATION OF GREENHOUSE GAS EMISSIONS REDUCTIONS AND REMOVALS FROM
CARBON CAPTURE AND STORAGE PROJECTS Version 1.1
September 2021 americancarbonregistry.org 110
Loadi % Loading of each piece of equipment (unitless). Estimated or assumed
to be 100%.
EFElectricity
Emission factor for electricity generation in the relevant region, by (in
order of preference) BAA, eGRID subregion, or State (tCO2e/MWh). See
Section 4.2.1 for estimation procedures.
The following equation can be used to quantify GHG emissions from stationary combustion from
the primary process at the capture site. It can be used for projects where directly measuring the
volume (or mass) of CO2 produced at the primary process is not possible.
Equation 38: Gross amount of CO2 produced from the primary process
𝐂𝐎𝟐𝐏𝐫𝐨𝐝𝐮𝐜𝐞𝐝𝐏𝐏𝐲= ∑ (𝐅𝐮𝐞𝐥𝐢 × 𝐌𝐚𝐬𝐬 𝐅𝐫𝐚𝐜𝐂𝐚𝐫𝐛𝐨𝐧𝐢
×𝟒𝟒
𝟏𝟐)
WHERE
CO2ProducedPPy Gross amount of CO2 produced from the primary process in each year
(tCO2/yr).
Fueli Total volume or mass of fuel, by fuel type i, input into the primary process
in year each (e.g., m3 or kg).
Mass FracCarboni
Average mass fraction of carbon in fuel type i, (fraction, expressed as a
decimal).
44
12
Conversion factor to convert from mass of carbon to mass of carbon
dioxide using molecular weights (unitless).
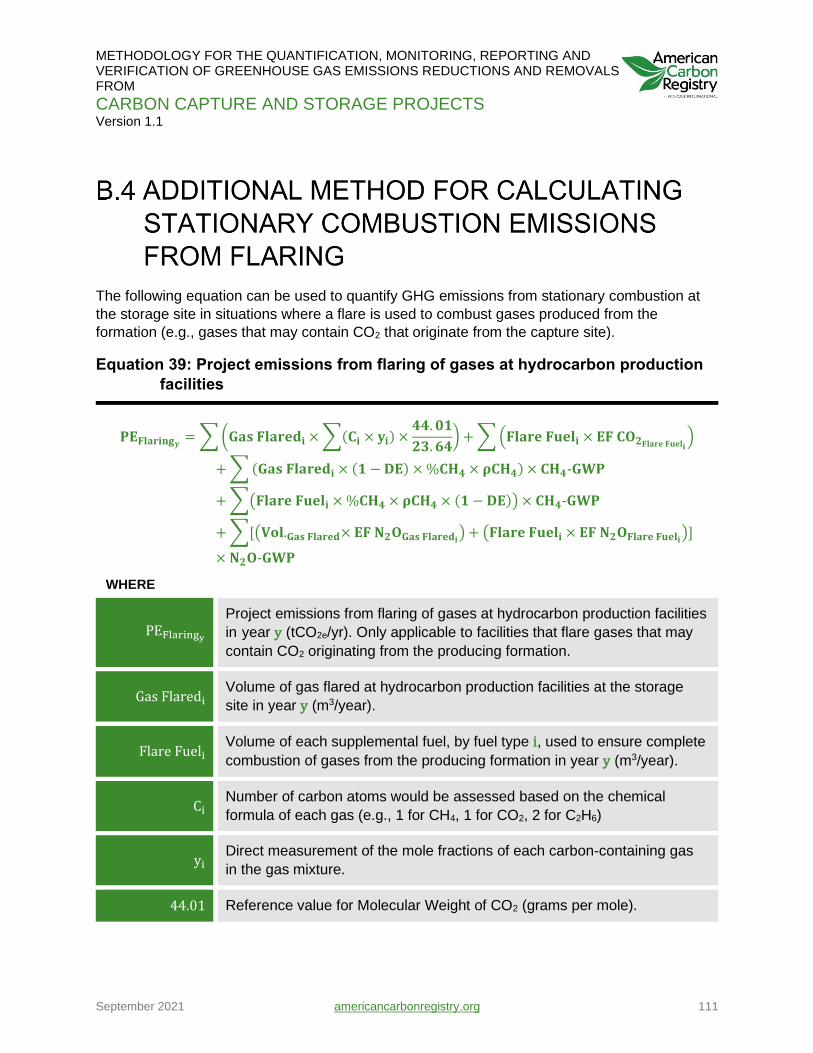
METHODOLOGY FOR THE QUANTIFICATION, MONITORING, REPORTING AND VERIFICATION OF GREENHOUSE GAS EMISSIONS REDUCTIONS AND REMOVALS FROM
CARBON CAPTURE AND STORAGE PROJECTS Version 1.1
September 2021 americancarbonregistry.org 111
The following equation can be used to quantify GHG emissions from stationary combustion at
the storage site in situations where a flare is used to combust gases produced from the
formation (e.g., gases that may contain CO2 that originate from the capture site).
Equation 39: Project emissions from flaring of gases at hydrocarbon production
facilities
𝐏𝐄𝐅𝐥𝐚𝐫𝐢𝐧𝐠𝐲= ∑ (𝐆𝐚𝐬 𝐅𝐥𝐚𝐫𝐞𝐝𝐢 × ∑(𝐂𝐢 × 𝐲𝐢) ×
𝟒𝟒. 𝟎𝟏
𝟐𝟑. 𝟔𝟒) + ∑ (𝐅𝐥𝐚𝐫𝐞 𝐅𝐮𝐞𝐥𝐢 × 𝐄𝐅 𝐂𝐎𝟐𝐅𝐥𝐚𝐫𝐞 𝐅𝐮𝐞𝐥𝐢
)
+ ∑ (𝐆𝐚𝐬 𝐅𝐥𝐚𝐫𝐞𝐝𝐢 × (𝟏 − 𝐃𝐄) × %𝐂𝐇𝟒 × 𝛒𝐂𝐇𝟒) × 𝐂𝐇𝟒-𝐆𝐖𝐏
+ ∑(𝐅𝐥𝐚𝐫𝐞 𝐅𝐮𝐞𝐥𝐢 × %𝐂𝐇𝟒 × 𝛒𝐂𝐇𝟒 × (𝟏 − 𝐃𝐄)) × 𝐂𝐇𝟒-𝐆𝐖𝐏
+ ∑[(𝐕𝐨𝐥.𝐆𝐚𝐬 𝐅𝐥𝐚𝐫𝐞𝐝× 𝐄𝐅 𝐍𝟐𝐎𝐆𝐚𝐬 𝐅𝐥𝐚𝐫𝐞𝐝𝐢) + (𝐅𝐥𝐚𝐫𝐞 𝐅𝐮𝐞𝐥𝐢 × 𝐄𝐅 𝐍𝟐𝐎𝐅𝐥𝐚𝐫𝐞 𝐅𝐮𝐞𝐥𝐢
)]
× 𝐍𝟐𝐎-𝐆𝐖𝐏
WHERE
PEFlaringy
Project emissions from flaring of gases at hydrocarbon production facilities
in year y (tCO2e/yr). Only applicable to facilities that flare gases that may
contain CO2 originating from the producing formation.
Gas Flaredi Volume of gas flared at hydrocarbon production facilities at the storage
site in year y (m3/year).
Flare Fueli Volume of each supplemental fuel, by fuel type i, used to ensure complete
combustion of gases from the producing formation in year y (m3/year).
Ci Number of carbon atoms would be assessed based on the chemical
formula of each gas (e.g., 1 for CH4, 1 for CO2, 2 for C2H6)
yi Direct measurement of the mole fractions of each carbon-containing gas
in the gas mixture.
44.01 Reference value for Molecular Weight of CO2 (grams per mole).
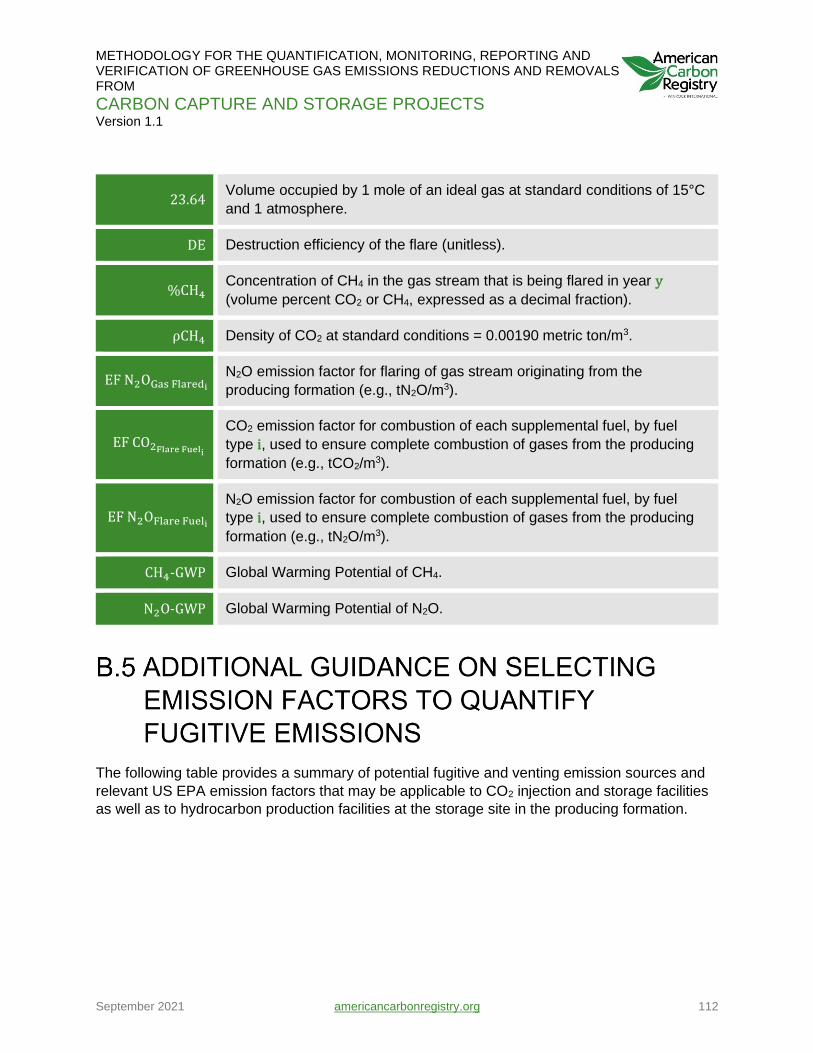
METHODOLOGY FOR THE QUANTIFICATION, MONITORING, REPORTING AND VERIFICATION OF GREENHOUSE GAS EMISSIONS REDUCTIONS AND REMOVALS FROM
CARBON CAPTURE AND STORAGE PROJECTS Version 1.1
September 2021 americancarbonregistry.org 112
23.64 Volume occupied by 1 mole of an ideal gas at standard conditions of 15°C
and 1 atmosphere.
DE Destruction efficiency of the flare (unitless).
%CH4 Concentration of CH4 in the gas stream that is being flared in year y
(volume percent CO2 or CH4, expressed as a decimal fraction).
ρCH4 Density of CO2 at standard conditions = 0.00190 metric ton/m3.
EF N2OGas Flaredi
N2O emission factor for flaring of gas stream originating from the
producing formation (e.g., tN2O/m3).
EF CO2Flare Fueli
CO2 emission factor for combustion of each supplemental fuel, by fuel
type i, used to ensure complete combustion of gases from the producing
formation (e.g., tCO2/m3).
EF N2OFlare Fueli
N2O emission factor for combustion of each supplemental fuel, by fuel
type i, used to ensure complete combustion of gases from the producing
formation (e.g., tN2O/m3).
CH4-GWP Global Warming Potential of CH4.
N2O-GWP Global Warming Potential of N2O.
The following table provides a summary of potential fugitive and venting emission sources and
relevant US EPA emission factors that may be applicable to CO2 injection and storage facilities
as well as to hydrocarbon production facilities at the storage site in the producing formation.
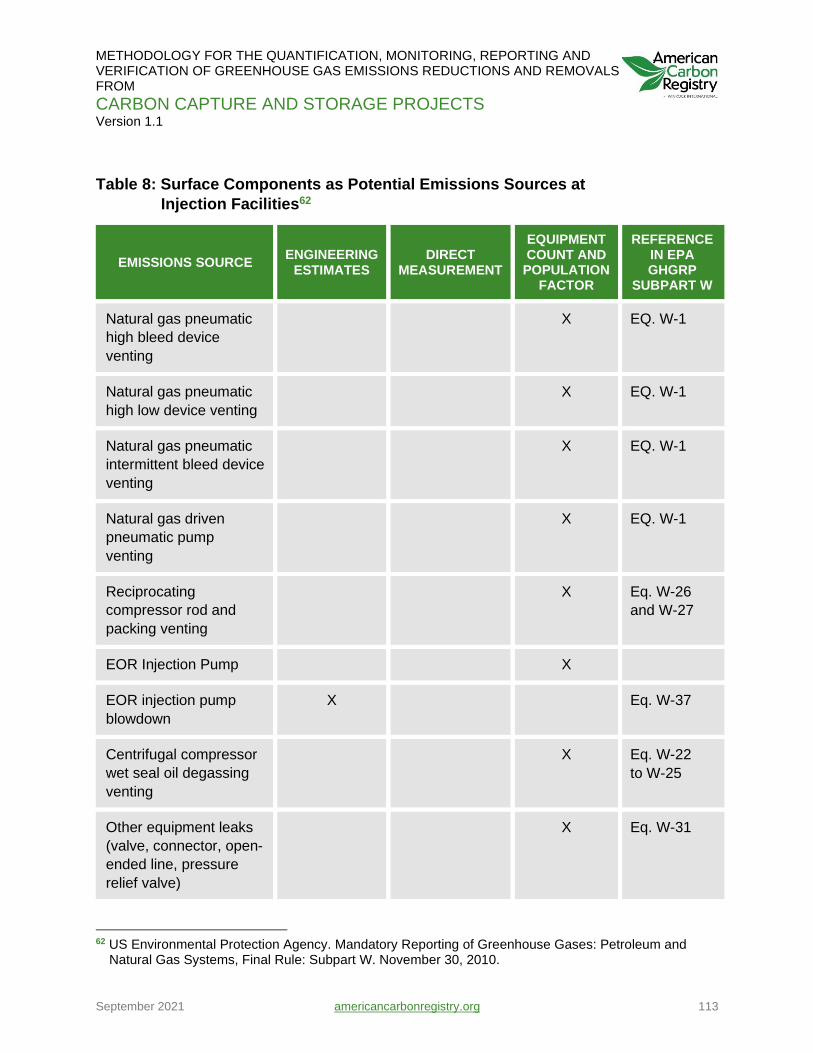
METHODOLOGY FOR THE QUANTIFICATION, MONITORING, REPORTING AND VERIFICATION OF GREENHOUSE GAS EMISSIONS REDUCTIONS AND REMOVALS FROM
CARBON CAPTURE AND STORAGE PROJECTS Version 1.1
September 2021 americancarbonregistry.org 113
Table 8: Surface Components as Potential Emissions Sources at
Injection Facilities62
EMISSIONS SOURCE ENGINEERING
ESTIMATES DIRECT
MEASUREMENT
EQUIPMENT COUNT AND
POPULATION FACTOR
REFERENCE IN EPA GHGRP
SUBPART W
Natural gas pneumatic
high bleed device
venting
X EQ. W-1
Natural gas pneumatic
high low device venting
X EQ. W-1
Natural gas pneumatic
intermittent bleed device
venting
X EQ. W-1
Natural gas driven
pneumatic pump
venting
X EQ. W-1
Reciprocating
compressor rod and
packing venting
X Eq. W-26
and W-27
EOR Injection Pump X
EOR injection pump
blowdown
X Eq. W-37
Centrifugal compressor
wet seal oil degassing
venting
X Eq. W-22
to W-25
Other equipment leaks
(valve, connector, open-
ended line, pressure
relief valve)
X Eq. W-31
62 US Environmental Protection Agency. Mandatory Reporting of Greenhouse Gases: Petroleum and
Natural Gas Systems, Final Rule: Subpart W. November 30, 2010.

METHODOLOGY FOR THE QUANTIFICATION, MONITORING, REPORTING AND VERIFICATION OF GREENHOUSE GAS EMISSIONS REDUCTIONS AND REMOVALS FROM
CARBON CAPTURE AND STORAGE PROJECTS Version 1.1
September 2021 americancarbonregistry.org 114
The official rules of the Railroad Commission of Texas are found in the Texas Administrative
Code (TAC) Title 16, Part 1, Chapters 1-20.63 Chapter 3 includes rules of the Oil and Gas
Division. Under Statewide Rules 9, 46, 95, 96, and 97, operators of injection and disposal wells
associated with oil and gas exploration, production, transportation, or underground storage
Class II wells must obtain a permit from the Railroad Commission. Thus, all Class II wells in
Texas must be approved by the Commission before injection operations can legally begin.
Pursuant to Rules 9, 46, 95, 96, and 97, and the applicable application forms, such permits will
be approved only if the applicant satisfies the burden of showing that fresh water will be
protected.
Once a permit is granted, the operator is bound by all applicable Commission rules and permit
conditions by virtue of accepting the right to operate pursuant to the permit. It is necessary to
examine permit conditions, as well as statewide rules, in order to determine what actions are
necessary for compliance.
Permits to dispose of salt water or other oil and gas wastes by injection into porous formations
that are not productive of oil, gas, or geothermal resources are issued under Statewide Rule 9.
Form W-14 is used to apply for this type of permit.
Permits to inject water, steam, gas, oil and gas wastes, or other fluids into porous formations
that are productive of oil, gas, or geothermal resources are issued under Statewide Rule 46.
Forms H-1 and H-1A are used to apply for this type of permit.
Permits to conduct hydrocarbon storage operations are issued under Statewide Rules 95, 96, or
97. Form H-4 is used to apply for these types of permits.
63 https://www.rrc.texas.gov/general-counsel/rules/current-rules/

METHODOLOGY FOR THE QUANTIFICATION, MONITORING, REPORTING AND VERIFICATION OF GREENHOUSE GAS EMISSIONS REDUCTIONS AND REMOVALS FROM
CARBON CAPTURE AND STORAGE PROJECTS Version 1.1
September 2021 americancarbonregistry.org 115
A commercial disposal well is a well whose owner or operator receives compensation from
others for the disposal of oilfield fluids or other oil and gas wastes that are wholly or partially
trucked to the well and the primary business purpose of the well is to provide these services for
compensation. Permits for commercial disposal wells contain special conditions for surface
facilities associated with waste management.
All permit applications for Class II wells come to the Technical Permitting Section, where they
are evaluated and processed. If a hearing is requested or required, the Technical Permitting
Section requests that a hearing be scheduled, and the Commission provides notice to all
interested persons. After the hearing, the examiners recommend final action to the
Commissioners, who decide if the permit will be issued. If no protests are received on an
application, the Director of Technical Permitting may administratively approve the application.
See the section titled "Injection and Disposal Well Permitting" for more detail on permitting
standards and procedures.
An injection or disposal well permit may be transferred only after notice to the Commission.
Written notice of intent to transfer the permit must be submitted to the Commission on Form P-4
at least 15 days prior to the date the operators plan for the transfer to occur. Permit transfer will
not occur until the Form P-4 has been approved by the Commission.
An injection or disposal well permit may be terminated, suspended, or modified for just cause,
such as a substantial change in well completion or operation, pollution of fresh water,
substantial violations of permit conditions or rules, misrepresentations by the applicant, or the
escape of injected fluids from the authorized zone. Notice and opportunity for hearing are
provided in the same manner as in the initial permit process.
The authorized injection or disposal strata must be isolated from overlying usable quality water
by a sufficient thickness of relatively impermeable strata, which is generally considered to be an
accumulative total of at least 250 feet of clay or shale. Variances in the total thickness required
are considered on the basis of continuity of strata, thickness of individual strata, or the presence
of relatively impermeable strata other than clay or shale. No injection or disposal well will be
permitted where faults, fractures, structure, or other geologic factors indicate that isolation of the
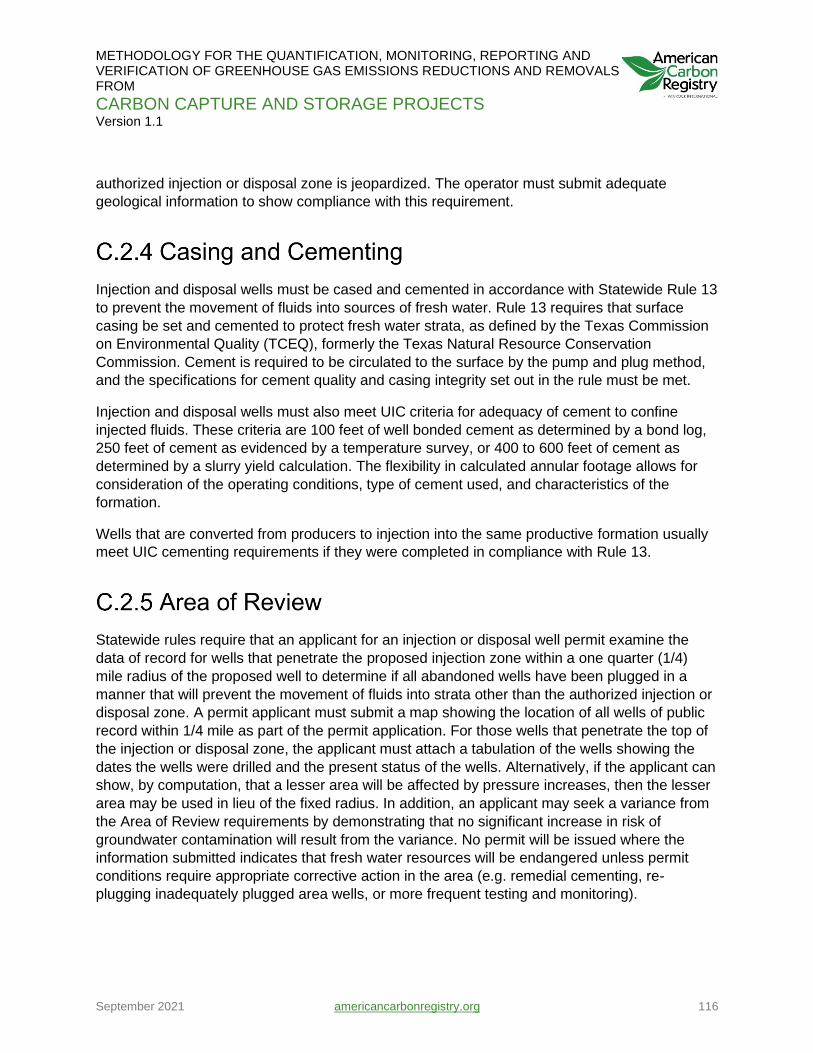
METHODOLOGY FOR THE QUANTIFICATION, MONITORING, REPORTING AND VERIFICATION OF GREENHOUSE GAS EMISSIONS REDUCTIONS AND REMOVALS FROM
CARBON CAPTURE AND STORAGE PROJECTS Version 1.1
September 2021 americancarbonregistry.org 116
authorized injection or disposal zone is jeopardized. The operator must submit adequate
geological information to show compliance with this requirement.
Injection and disposal wells must be cased and cemented in accordance with Statewide Rule 13
to prevent the movement of fluids into sources of fresh water. Rule 13 requires that surface
casing be set and cemented to protect fresh water strata, as defined by the Texas Commission
on Environmental Quality (TCEQ), formerly the Texas Natural Resource Conservation
Commission. Cement is required to be circulated to the surface by the pump and plug method,
and the specifications for cement quality and casing integrity set out in the rule must be met.
Injection and disposal wells must also meet UIC criteria for adequacy of cement to confine
injected fluids. These criteria are 100 feet of well bonded cement as determined by a bond log,
250 feet of cement as evidenced by a temperature survey, or 400 to 600 feet of cement as
determined by a slurry yield calculation. The flexibility in calculated annular footage allows for
consideration of the operating conditions, type of cement used, and characteristics of the
formation.
Wells that are converted from producers to injection into the same productive formation usually
meet UIC cementing requirements if they were completed in compliance with Rule 13.
Statewide rules require that an applicant for an injection or disposal well permit examine the
data of record for wells that penetrate the proposed injection zone within a one quarter (1/4)
mile radius of the proposed well to determine if all abandoned wells have been plugged in a
manner that will prevent the movement of fluids into strata other than the authorized injection or
disposal zone. A permit applicant must submit a map showing the location of all wells of public
record within 1/4 mile as part of the permit application. For those wells that penetrate the top of
the injection or disposal zone, the applicant must attach a tabulation of the wells showing the
dates the wells were drilled and the present status of the wells. Alternatively, if the applicant can
show, by computation, that a lesser area will be affected by pressure increases, then the lesser
area may be used in lieu of the fixed radius. In addition, an applicant may seek a variance from
the Area of Review requirements by demonstrating that no significant increase in risk of
groundwater contamination will result from the variance. No permit will be issued where the
information submitted indicates that fresh water resources will be endangered unless permit
conditions require appropriate corrective action in the area (e.g. remedial cementing, re-
plugging inadequately plugged area wells, or more frequent testing and monitoring).

METHODOLOGY FOR THE QUANTIFICATION, MONITORING, REPORTING AND VERIFICATION OF GREENHOUSE GAS EMISSIONS REDUCTIONS AND REMOVALS FROM
CARBON CAPTURE AND STORAGE PROJECTS Version 1.1
September 2021 americancarbonregistry.org 117
All newly drilled or converted injection wells permitted under Rule 46 and all disposal wells
permitted under Rule 9 must be equipped with tubing set on a mechanical packer unless an
exception is granted by the director for good cause. Pressure observation valves are required
on the tubing and each annulus.
Maximum injection pressure limitations have been part of the Commission's permitting program
for many years and continue to be required as a condition of each injection or disposal well
permit. Pressure limitations are established to provide adequate assurance that injection will not
initiate fractures in the confining zones. The maximum surface injection pressure may not
ordinarily exceed 1/2 psi per foot of depth to the top of the authorized injection or disposal
interval. A fracture pressure step-rate test must be performed to justify a higher pressure.
The operator of each injection or disposal well is required by the statewide rules to monitor the
injection pressure and volume on a monthly basis and to report the results annually on Form H-
10. Any downhole problem that indicates the presence of leaks in the well must be reported to
the appropriate district office within twenty-four (24) hours.
See the section titled "Injection and Disposal Well Monitoring" for more detail on monitoring
requirements.
All injection and disposal wells must be pressure tested before injection operations begin, after
any workover that disturbs the seal between the tubing, packer, and casing, and at least once
every five (5) years to determine if leaks exist in the tubing, packer, or casing. Some permits
require more frequent tests, such as annual pressure tests for converted wells with short
surface casing. The appropriate district office must be notified before any pressure test to allow
a Commission representative to witness the test. The operator must then file a record of the test
with the district office (Form H-5) within 30 days of the test. As an alternative to the five-year
pressure testing, the operator may monitor the casing-tubing annulus pressure and report the
results annually if the reported information demonstrates mechanical integrity and provided that
the well is pressure tested at least once every ten (10) years.
Wells not equipped with tubing and packer or with other non-standard completions may require
special down hole surveys to demonstrate mechanical integrity. These surveys must be
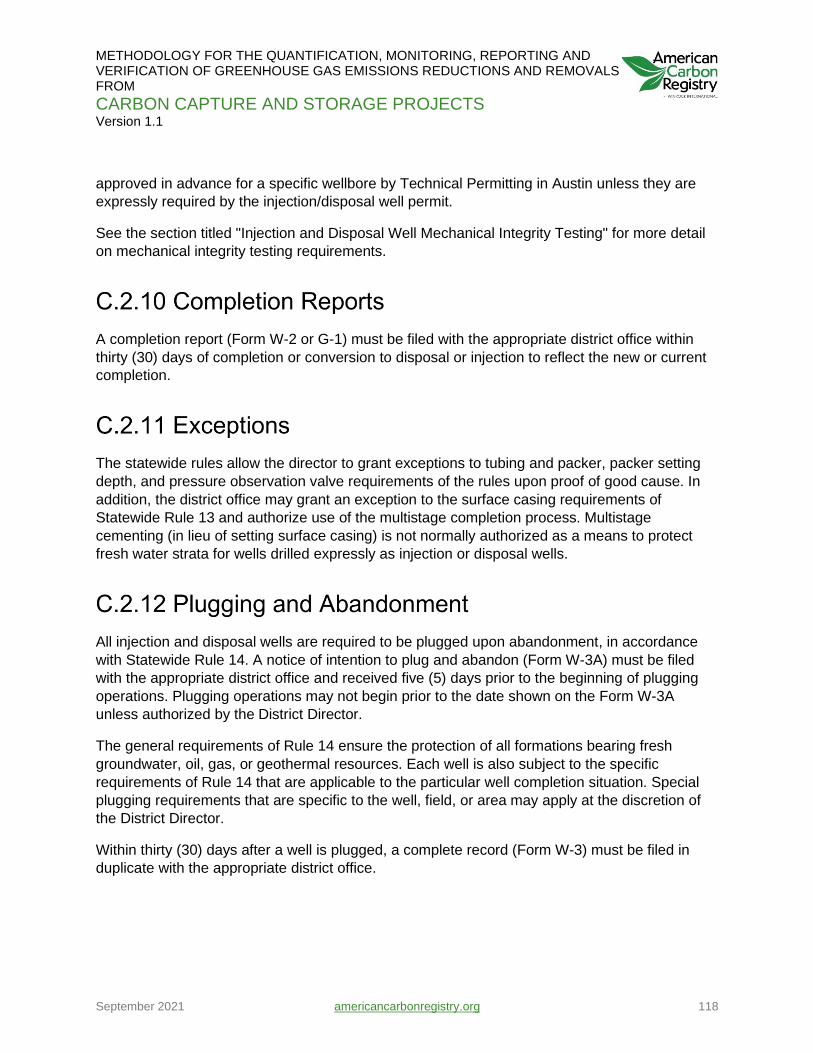
METHODOLOGY FOR THE QUANTIFICATION, MONITORING, REPORTING AND VERIFICATION OF GREENHOUSE GAS EMISSIONS REDUCTIONS AND REMOVALS FROM
CARBON CAPTURE AND STORAGE PROJECTS Version 1.1
September 2021 americancarbonregistry.org 118
approved in advance for a specific wellbore by Technical Permitting in Austin unless they are
expressly required by the injection/disposal well permit.
See the section titled "Injection and Disposal Well Mechanical Integrity Testing" for more detail
on mechanical integrity testing requirements.
A completion report (Form W-2 or G-1) must be filed with the appropriate district office within
thirty (30) days of completion or conversion to disposal or injection to reflect the new or current
completion.
The statewide rules allow the director to grant exceptions to tubing and packer, packer setting
depth, and pressure observation valve requirements of the rules upon proof of good cause. In
addition, the district office may grant an exception to the surface casing requirements of
Statewide Rule 13 and authorize use of the multistage completion process. Multistage
cementing (in lieu of setting surface casing) is not normally authorized as a means to protect
fresh water strata for wells drilled expressly as injection or disposal wells.
All injection and disposal wells are required to be plugged upon abandonment, in accordance
with Statewide Rule 14. A notice of intention to plug and abandon (Form W-3A) must be filed
with the appropriate district office and received five (5) days prior to the beginning of plugging
operations. Plugging operations may not begin prior to the date shown on the Form W-3A
unless authorized by the District Director.
The general requirements of Rule 14 ensure the protection of all formations bearing fresh
groundwater, oil, gas, or geothermal resources. Each well is also subject to the specific
requirements of Rule 14 that are applicable to the particular well completion situation. Special
plugging requirements that are specific to the well, field, or area may apply at the discretion of
the District Director.
Within thirty (30) days after a well is plugged, a complete record (Form W-3) must be filed in
duplicate with the appropriate district office.
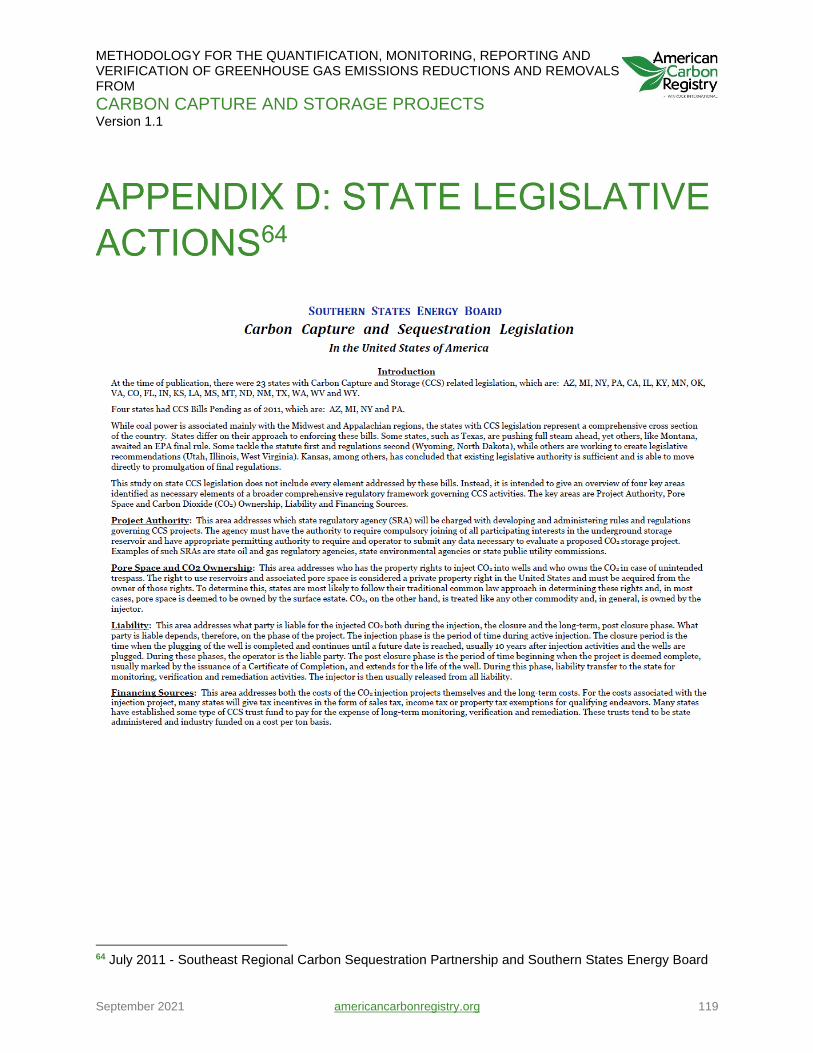
METHODOLOGY FOR THE QUANTIFICATION, MONITORING, REPORTING AND VERIFICATION OF GREENHOUSE GAS EMISSIONS REDUCTIONS AND REMOVALS FROM
CARBON CAPTURE AND STORAGE PROJECTS Version 1.1
September 2021 americancarbonregistry.org 119
64 July 2011 - Southeast Regional Carbon Sequestration Partnership and Southern States Energy Board

METHODOLOGY FOR THE QUANTIFICATION, MONITORING, REPORTING AND VERIFICATION OF GREENHOUSE GAS EMISSIONS REDUCTIONS AND REMOVALS FROM
CARBON CAPTURE AND STORAGE PROJECTS Version 1.1
September 2021 americancarbonregistry.org 120

METHODOLOGY FOR THE QUANTIFICATION, MONITORING, REPORTING AND VERIFICATION OF GREENHOUSE GAS EMISSIONS REDUCTIONS AND REMOVALS FROM
CARBON CAPTURE AND STORAGE PROJECTS Version 1.1
September 2021 americancarbonregistry.org 121
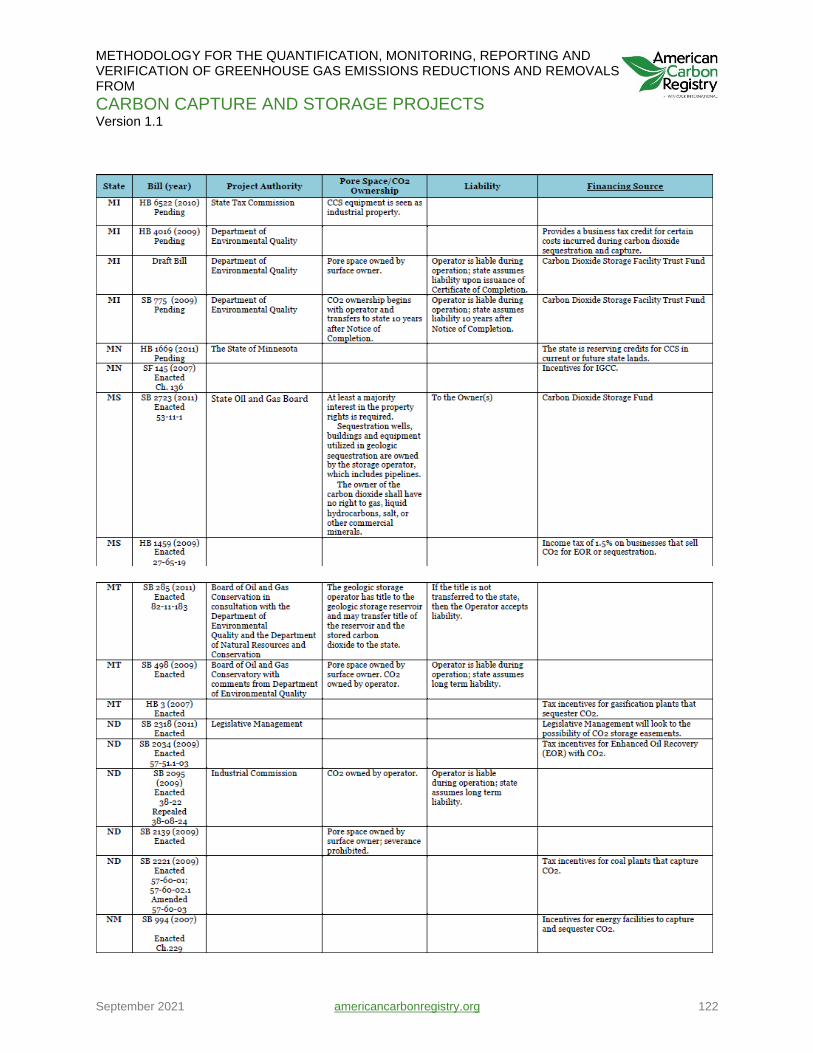
METHODOLOGY FOR THE QUANTIFICATION, MONITORING, REPORTING AND VERIFICATION OF GREENHOUSE GAS EMISSIONS REDUCTIONS AND REMOVALS FROM
CARBON CAPTURE AND STORAGE PROJECTS Version 1.1
September 2021 americancarbonregistry.org 122

METHODOLOGY FOR THE QUANTIFICATION, MONITORING, REPORTING AND VERIFICATION OF GREENHOUSE GAS EMISSIONS REDUCTIONS AND REMOVALS FROM
CARBON CAPTURE AND STORAGE PROJECTS Version 1.1
September 2021 americancarbonregistry.org 123

METHODOLOGY FOR THE QUANTIFICATION, MONITORING, REPORTING AND VERIFICATION OF GREENHOUSE GAS EMISSIONS REDUCTIONS AND REMOVALS FROM
CARBON CAPTURE AND STORAGE PROJECTS Version 1.1
September 2021 americancarbonregistry.org 124
The appropriate citation is American Carbon Registry (2015), Methodology for Greenhouse Gas
Emission Reductions from Carbon Capture and Storage Projects, Version 1.0. Winrock
International, Little Rock, Arkansas.