callan institute market review - cmers.com · quarters of a year since 2013. europe best region for...
TRANSCRIPT

2017 Fundraising
Sets New Record
PRIVATE EQUITY
Investor enthusiasm
abounds for private
equity as evidenced by
record fundraising. However, rising
valuations, increasing borrowing
costs, and the yet-to-be-determined
impact of tax reform on borrowing
levels and valuations bear vigilance
moving forward.
Risk Takers See
Less as More
HEDGE FUNDS/MACs
The Credit Suisse
Hedge Fund Index rose
2.3%, while the Callan
Hedge Fund-of-Funds Database
advanced 1.8%. The Callan Multi-
Asset Class Database was up
3.6%. In general, hedge funds expe-
rienced positive but more modest
results than market indices.
DC Plans on Track to
Win Big in 2017
DEFINED CONTRIBUTION
The Callan DC Index™
recorded a solid 3.8%
gain during the third quar-
ter, its eighth straight quarter of pos-
itive performance. And the Index is
up 11.9% year to date, which marks
its best showing for the irst three quarters of a year since 2013.
Europe Best Region
for REITs
REAL ESTATE
The NCREIF Property
Index notched its 36th
straight quarter of posi-
tive returns, rising 1.8%, while the
NCREIF Open End Diversiied Core Equity Index was up 2.1%.
European REITs were the best per-
formers; U.S. REITs generated posi-
tive returns.
Non-U.S. Bias
Rewarded Plans
FUND SPONSOR
Endowments and foun-
dations (+3.8%) per-
formed best last quarter,
followed by public plans (+3.7%),
Taft-Hartley plans (+3.6%), and cor-
porate plans (+3.5%). By fund size,
plans with assets under $100 mil-
lion performed best, thanks to larger
allocations to non-U.S. equity.
Knowledge. Experience. Integrity.
Fourth Quarter 2017
Sentiment Restored.
Is It Time to Worry?
ECONOMY
The U.S. economy ended
2017 with a 2.6% gain in
GDP in the fourth quarter,
averaging 2.3% for the year, up from
1.5% in 2016. That is especially
impressive given the damage from
severe hurricanes in the third quar-
ter. Enthusiasm for growth is appar-
ent, but is now the time to worry?
2P A G E
13P A G E
Synchronicity Powers
Global Markets
EQUITY
A strong quarter closed
out a strong year for mar-
kets around the world,
powered by synchronized global
economic growth, a new tax law in
the U.S., and low interest rates and
inlation. Emerging markets out-paced developed markets for the
fourth straight quarter.
4P A G E
Tight Spreads in U.S.;
Developed Returns Flat
FIXED INCOME
In the U.S., longer-term
bonds topped short-term
and intermediate-maturity
bonds. Investment-grade corporate
debt was the best-performing ixed income sector. Returns were mostly
lat in developed markets; emerging market debt delivered more muted
returns than in earlier quarters.
9P A G E
6P A G E
14P A G E
15P A G E
11P A G E
CALLAN INSTITUTE Capital
Market Review
Broad Market Quarterly Returns
+5.0% +0.4%+6.3% +1.6%
U.S. EquityRussell 3000
U.S. Fixed IncomeBloomberg Barclays Agg
Non-U.S. EquityMSCI ACWI ex USA
Non-U.S. Fixed IncomeBloomberg Barclays Gbl ex US
Sources: Bloomberg Barclays, MSCI, Russell Investment Group

2
Sentiment Restored. Is It Time to Worry?
ECONOMY | Jay Kloepfer
The U.S. economy closed out 2017 with decent momentum,
recording a solid 2.6% gain in GDP in the fourth quarter after
growth above 3% in each of the prior two quarters. Investor sen-
timent felt disconnected as the year unfolded; the underlying
global economy appeared to be steadily improving and capital
markets reported robust results, while unease around geopoli-
tics and the impact of multiple natural disasters stoked anxiety
about the future. By midyear, 2017 felt like the culmination of the
unhappiest bull market we’d ever seen. Stock markets then pro-
ceeded to hit a number of record highs as the year concluded,
the job market continued to improve, unemployment reached a
generational low in the U.S., and retail sales rose. A historic revi-
sion to the tax code became law at the end of the year, which
included a substantial corporate tax cut. After perhaps jumping
the gun in the irst part of the year, then held back by frustration after not getting expected tax and regulatory changes enacted
during the middle quarters, the “animal spirits” of the economy
and the capital markets appear to have been unleashed once
again. Enthusiasm for growth and risk-taking seem apparent. Is
now the time to worry, as phrases like a market “melt-up” enter
the popular lexicon?
GDP growth averaged 2.3% for the year, up from 1.5% in 2016.
The result for 2017 was impressive given the damage caused
by severe hurricanes in the third quarter. Since the Global
Financial Crisis (GFC), GDP has increased at a very modest
2.2% annual average, far below the growth typically seen fol-
lowing a recession and below the 3% long-term average since
the early 1960s. While gains have been slow and steady, they
have gone on now for a sustained period of time, one of the
longest expansions on record, and as a result the unemploy-
ment rate has been pushed to a generational low of 4.1%. The
job market keeps chugging along, creating over 2.1 million new
jobs in 2017, or 183,000 per month. The peak years of job cre-
ation in the current cycle were 2014 (3 million) and 2015 (2.7
million). While the monthly rate of 183,000 is still robust, and
well in excess of the 100,000 needed to keep the market at
a steady state, the rate of job creation is tailing off, suggest-
ing we might be reaching the limits of full employment. Despite
this tight labor market, wage gains remain remarkably subdued,
with annual gains in hourly earnings in the 2%-2.5% range for
each of the last four years. The rate of growth in total compen-
sation has begun to rise; the employment cost index has inched
up from 2% growth to hit 3% in several quarters during 2017.
02 0398 99 00 01 04 05 06 07 08 09 10 11 12 13 14 15 16 17
-10%
-8%
-6%
-4%
-2%
0%
2%
4%
6%
8%
Quarterly Real GDP Growth (20 Years)
-15%
-10%
-5%
0%
5%
10%
15%
20%
PPI (All Commodities)CPI (All Urban Consumers)
02 0398 99 00 01 04 05 06 07 08 09 10 11 12 13 14 15 16 17
Inlation Year-Over-Year
Source: Bureau of Labor Statistics
Source: Bureau of Economic Analysis

3Knowledge. Experience. Integrity.
U.S. ECONOMY (Continued)
Conidence in the sustainability of the current spate of growth rose with the release of the aforementioned animal spirits. The
impact of the tax cut is expected to be modest, perhaps adding
0.2 to 0.3 percentage points to GDP growth in 2018, and most
if not all of the investment gains are already built into the stock
market. The wild card is how corporations plan to “spend” the
tax cut. The optimistic outcome is that the extra money goes
into capital expansion and job growth. Other outcomes include
returning the capital to owners through dividends and share
buybacks, to existing workers through wage gains, or to con-
sumers in the form of price cuts. Longer term, the $1.5 trillion
increase in the deicit is viewed as a potential drag on growth.
One other potential stimulus still to take shape is the proposed
program of substantial infrastructure spending. This spending
could spur further growth when the economy is already running
hot, and therefore stimulate inlation beyond the current benign levels. The tight labor market suggests we might already be
facing limitations on growth from the existing set of labor and
capital inputs available in the U.S. economy.
Inlation remains remarkably benign, clipping along at 2.1% in December (year-over-year). Oil prices have recovered from the
sharp decline of several years ago, which spurred top-line inla-
tion, but core inlation (net of food and energy) remains below the Fed’s target of 2%. The tight labor market, the impact of the
corporate tax cut, and the potential for substantial infrastruc-
ture spending all suggest that inlation could inally be poised to move. Another potential impetus for inlation is the improving outlook for the global economy, which appears to be moving into
synchronized growth across disparate regions.
The Long-Term View
2017
4th Qtr
Periods ended Dec. 31, 2017
Index Year 5 Yrs 10 Yrs 25 Yrs
U.S. Equity
Russell 3000 6.34 21.13 15.58 8.60 9.72
S&P 500 6.64 21.83 15.79 8.50 9.69
Russell 2000 3.34 14.65 14.12 8.71 9.54
Non-U.S. Equity
MSCI ACWI ex USA 5.00 27.19 6.80 1.84 --
MSCI Emerging Markets 7.44 37.28 4.35 1.68 7.76
MSCI ACWI ex USA Small Cap 6.56 31.65 10.03 4.69 --
Fixed Income
Bloomberg Barclays Agg 0.39 3.54 2.10 4.01 5.48
90-Day T-Bill 0.28 0.86 0.27 0.39 2.60
Bloomberg Barclays Long G/C 2.84 10.71 4.43 7.26 7.67
Bloomberg Barclays Gl Agg ex US 1.63 10.51 -0.20 2.40 5.02
Real Estate
NCREIF Property 1.70 6.85 10.16 6.07 9.11
FTSE NAREIT Equity 1.51 5.23 9.46 7.44 10.76
Alternatives
CS Hedge Fund 2.30 7.12 4.23 3.24 --
Cambridge PE* -- 9.25 12.76 9.39 15.38
Bloomberg Commodity 4.71 1.70 -8.45 -6.83 2.47
Gold Spot Price 1.91 13.68 -4.82 4.56 5.63
Inlation – CPI-U -0.12 2.11 1.43 1.61 2.23
*Most recent quarterly data not available, annual returns as of 9/30/2017
Sources: Bloomberg Barclays, Bloomberg, Credit Suisse, FTSE, MSCI, NCREIF,
Russell Investment Group, Standard & Poor’s, Thomson Reuters/Cambridge, Bureau
of Economic Analysis
Recent Quarterly Economic Indicators
4Q17 3Q17 2Q17 1Q17 4Q16 3Q16 2Q16 1Q16
Employment Cost–Total Compensation Growth 2.6% 2.5% 2.4% 2.4% 2.2% 2.3% 2.3% 1.9%
Nonfarm Business–Productivity Growth -0.1% 2.7% 1.5% 0.1% 1.3% 2.5% 0.8% -1.2%
GDP Growth 2.6% 3.2% 3.1% 1.2% 1.8% 2.8% 2.2% 0.6%
Manufacturing Capacity Utilization 76.4% 75.2% 75.7% 75.4% 75.1% 74.9% 75.1% 75.4%
Consumer Sentiment Index (1966=100) 98.4 95.1 96.4 97.2 93.2 90.3 92.4 91.5
Sources: Bureau of Economic Analysis, Bureau of Labor Statistics, Federal Reserve, IHS Economics, Reuters/University of Michigan
4
Non-U.S. Bias Rewarded Plans in 2017
FUND SPONSOR
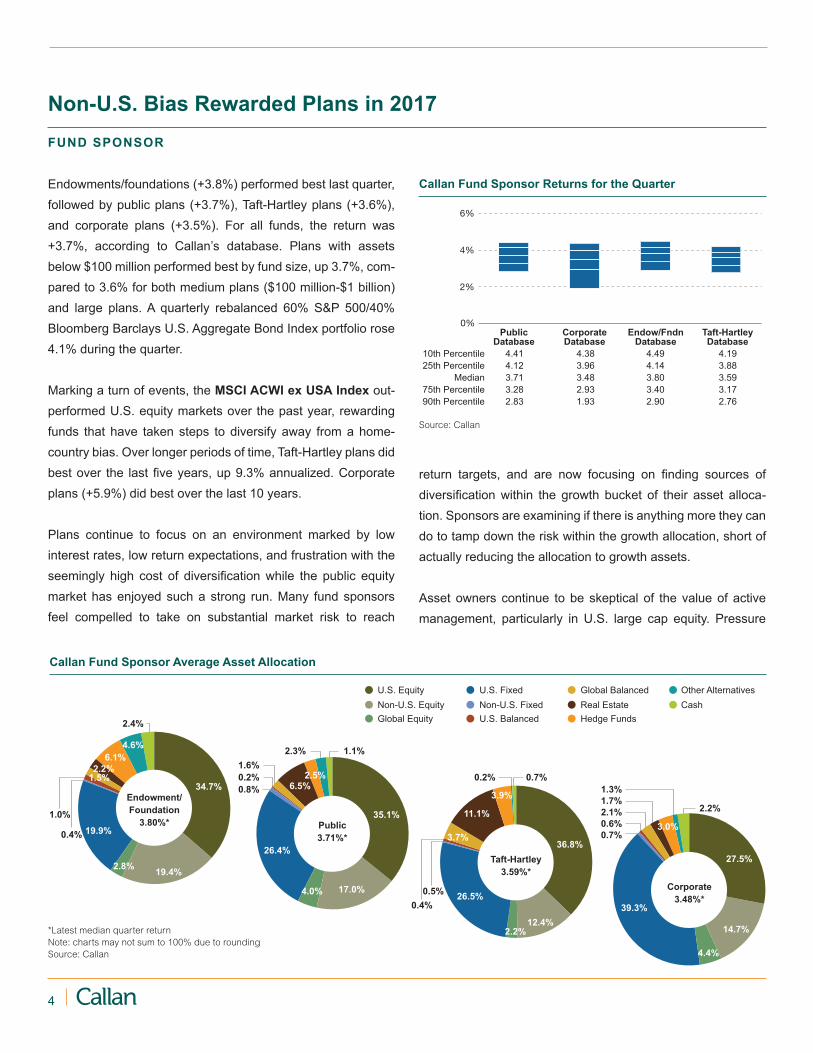
Endowments/foundations (+3.8%) performed best last quarter,
followed by public plans (+3.7%), Taft-Hartley plans (+3.6%),
and corporate plans (+3.5%). For all funds, the return was
+3.7%, according to Callan’s database. Plans with assets
below $100 million performed best by fund size, up 3.7%, com-
pared to 3.6% for both medium plans ($100 million-$1 billion)
and large plans. A quarterly rebalanced 60% S&P 500/40%
Bloomberg Barclays U.S. Aggregate Bond Index portfolio rose
4.1% during the quarter.
Marking a turn of events, the MSCI ACWI ex USA Index out-
performed U.S. equity markets over the past year, rewarding
funds that have taken steps to diversify away from a home-
country bias. Over longer periods of time, Taft-Hartley plans did
best over the last ive years, up 9.3% annualized. Corporate plans (+5.9%) did best over the last 10 years.
Plans continue to focus on an environment marked by low
interest rates, low return expectations, and frustration with the
seemingly high cost of diversiication while the public equity market has enjoyed such a strong run. Many fund sponsors
feel compelled to take on substantial market risk to reach
0%
2%
4%
6%
Public Corporate Endow/Fndn Taft-Hartley Database Database Database Database
10th Percentile 4.41 4.38 4.49 4.19
25th Percentile 4.12 3.96 4.14 3.88
Median 3.71 3.48 3.80 3.59
75th Percentile 3.28 2.93 3.40 3.17
90th Percentile 2.83 1.93 2.90 2.76
Callan Fund Sponsor Returns for the Quarter
Source: Callan
U.S. Fixed
Non-U.S. Fixed
Global Balanced
Real Estate
Hedge Funds
Other Alternatives
Cash
U.S. Balanced
U.S. Equity
Non-U.S. Equity
Global Equity
1.7%
1.3%
Public
3.71%*
35.1%
17.0%
26.4%
1.6%
2.3%
6.5%0.8%
4.0%
2.5%
1.1%
Endowment/
Foundation
3.80%*
34.7%
19.4%
19.9%
1.5%
1.0%
0.4%
6.1%
2.2%
4.6%
2.4%
Taft-Hartley
3.59%*
0.2%
Corporate
3.48%*0.4%
2.2%
0.2% 0.7%
36.8%
26.5%
12.4%
0.5%
3.7%
11.1%
3.9%
14.7%
2.2%
27.5%
39.3%
2.1%
0.6%
0.7%3.0%
4.4%
2.8%
Callan Fund Sponsor Average Asset Allocation
*Latest median quarter return
Note: charts may not sum to 100% due to rounding
Source: Callan
return targets, and are now focusing on inding sources of diversiication within the growth bucket of their asset alloca-
tion. Sponsors are examining if there is anything more they can
do to tamp down the risk within the growth allocation, short of
actually reducing the allocation to growth assets.
Asset owners continue to be skeptical of the value of active
management, particularly in U.S. large cap equity. Pressure

5Knowledge. Experience. Integrity.
FUND SPONSOR (Continued)
0%
20%
40%
60%
80%
100%
08 09 10 11 12 13
U.S. Fixed
Non-U.S. Fixed
Global Balanced
Real Estate
Hedge Funds
Other Alternatives
Cash
U.S. Balanced
U.S. Equity
Non-U.S. Equity
Global Equity
14 15 16 17
Callan Public Fund Database Average Asset Allocation (10 Years)
Source: Callan. Callan’s database includes the following groups: public deined beneit, corporate deined beneit, endowments/foundations, and Taft-Hartley plans.
Approximately 10% to 15% of the database constituents are Callan’s clients. All database group returns presented gross of fees. Past performance is no guarantee of future
results. Reference to or inclusion in this report of any product, service, or entity should not be construed as a recommendation, approval, ailiation, or endorsement of such
product, service, or entity by Callan.
to reduce fees or show the ability to generate consistent alpha
has been building for quite some time. Some fund sponsors
have undertaken structure work to consider the amount of
active versus passive management and to see if there is a way
to simplify their manager rosters to gain economies of scale in
an effort to reduce costs.
As in past quarters, funds have adjusted their allocations in
these ways over the last ive years: – Corporate plans have widened their range of U.S. ixed
income allocations, as they are in different stages of efforts
to de-risk plan assets.
– Many public funds have increased their allocation to non-
U.S. equity and real estate at the expense of ixed income. Simultaneously, some of the ixed income exposure has become more equity-like in nature.
– Endowments and foundations continue to shift from ixed income to asset classes with higher return expectations,
such as global equity, non-U.S. equity, and real estate.
The regulatory environment continues to drive the decision-
making process for deined contribution (DC) plan sponsors. Heightened fee sensitivity and litigation have resulted in little
traction for non-traditional asset classes such as liquid alterna-
tives. DC plans are also focused on the best ways to reduce/
eliminate revenue sharing, as well as obtaining even lower
fees from investment managers. They are also looking for
opportunities to continue streamlining investment fund lineups
to achieve suficient diversiication while minimizing participant confusion—including white label options.
Public plans continue to seek return enhancement and further
diversiication. Reduced capital market return expectations and funding challenges have created a dificult situation for many public DB plans, and some plans are simply constrained by
their circumstances. Alternative beta, MACs, and other liquid
strategies are being used in a wide range of capacities and are
experiencing increased interest.
6
U.S. Stocks: Accelerating Growth Spurs Equities
The U.S. equity market continued its
upward trajectory in the fourth quarter,
closing out a very strong year marked
by continued low volatility despite a
turbulent U.S. political landscape and a record year in terms
of global catastrophes. Investors embraced accelerating global
economic growth as well as low interest rates and inlation. Corporate earnings registered double-digit growth for the quar-
ter, receiving a boost from the U.S. tax overhaul bill, which was
signed into law in late December.
The S&P 500 Index rose 6.6% in the fourth quarter, and its
21.8% gain for the year was its best since 2013. The Index hit
62 record highs during the year and had only eight days of 1%
or more luctuations, the lowest number since 1964. The S&P
500 Price Index has nearly tripled (+295%) since its low in
March 2009. Valuations are stretched by most measures, but
estimates for future earnings are also strong. Large cap stocks
(Russell 1000: +6.6%) outperformed small cap (Russell 2000:
+3.3%) across styles for the quarter.
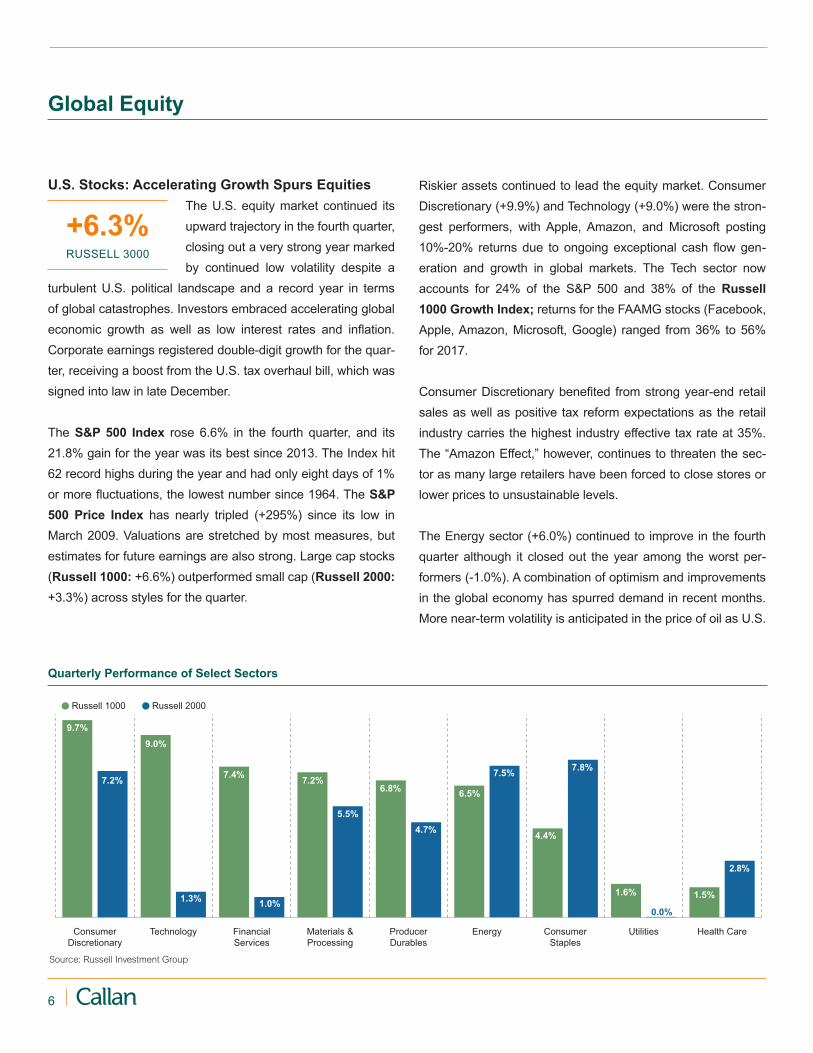
+6.3%RUSSELL 3000
Global Equity
Riskier assets continued to lead the equity market. Consumer
Discretionary (+9.9%) and Technology (+9.0%) were the stron-
gest performers, with Apple, Amazon, and Microsoft posting
10%-20% returns due to ongoing exceptional cash low gen-
eration and growth in global markets. The Tech sector now
accounts for 24% of the S&P 500 and 38% of the Russell
1000 Growth Index; returns for the FAAMG stocks (Facebook,
Apple, Amazon, Microsoft, Google) ranged from 36% to 56%
for 2017.
Consumer Discretionary beneited from strong year-end retail sales as well as positive tax reform expectations as the retail
industry carries the highest industry effective tax rate at 35%.
The “Amazon Effect,” however, continues to threaten the sec-
tor as many large retailers have been forced to close stores or
lower prices to unsustainable levels.
The Energy sector (+6.0%) continued to improve in the fourth
quarter although it closed out the year among the worst per-
formers (-1.0%). A combination of optimism and improvements
in the global economy has spurred demand in recent months.
More near-term volatility is anticipated in the price of oil as U.S.
Russell 1000 Russell 2000
Health CareUtilitiesConsumer
Staples
EnergyProducer
Durables
Materials &
Processing
Financial
Services
TechnologyConsumer
Discretionary
9.7%
7.2%
9.0%
1.3%1.0%
7.2%
5.5%
6.8%
4.7%
6.5%
7.5%
4.4%
7.8%
1.6%
0.0%
1.5%
2.8%
7.4%
Quarterly Performance of Select Sectors
Source: Russell Investment Group
7Knowledge. Experience. Integrity.
output is expected to surpass production out of Saudi Arabia for
the irst time since the early 1990s.
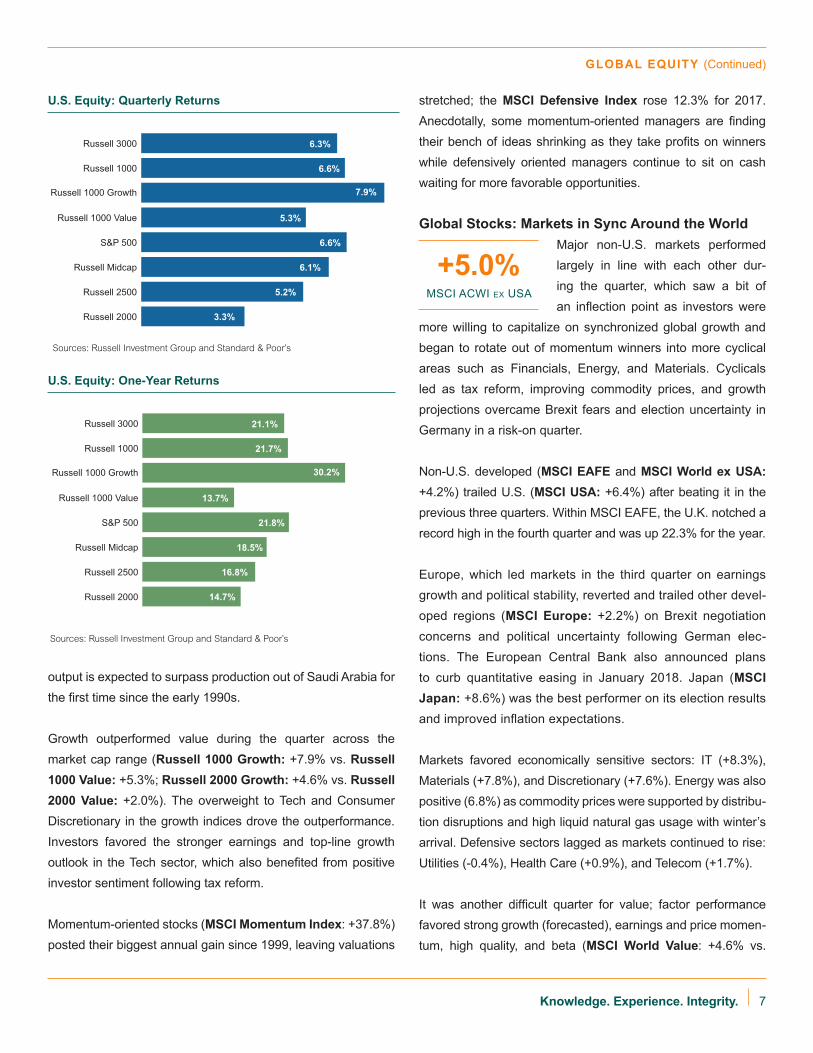
Growth outperformed value during the quarter across the
market cap range (Russell 1000 Growth: +7.9% vs. Russell
1000 Value: +5.3%; Russell 2000 Growth: +4.6% vs. Russell
2000 Value: +2.0%). The overweight to Tech and Consumer
Discretionary in the growth indices drove the outperformance.
Investors favored the stronger earnings and top-line growth
outlook in the Tech sector, which also beneited from positive investor sentiment following tax reform.
Momentum-oriented stocks (MSCI Momentum Index: +37.8%) posted their biggest annual gain since 1999, leaving valuations
stretched; the MSCI Defensive Index rose 12.3% for 2017.
Anecdotally, some momentum-oriented managers are inding their bench of ideas shrinking as they take proits on winners while defensively oriented managers continue to sit on cash
waiting for more favorable opportunities.
Global Stocks: Markets in Sync Around the World
Major non-U.S. markets performed
largely in line with each other dur-
ing the quarter, which saw a bit of
an inlection point as investors were more willing to capitalize on synchronized global growth and
began to rotate out of momentum winners into more cyclical
areas such as Financials, Energy, and Materials. Cyclicals
led as tax reform, improving commodity prices, and growth
projections overcame Brexit fears and election uncertainty in
Germany in a risk-on quarter.
Non-U.S. developed (MSCI EAFE and MSCI World ex USA:
+4.2%) trailed U.S. (MSCI USA: +6.4%) after beating it in the
previous three quarters. Within MSCI EAFE, the U.K. notched a
record high in the fourth quarter and was up 22.3% for the year.
Europe, which led markets in the third quarter on earnings
growth and political stability, reverted and trailed other devel-
oped regions (MSCI Europe: +2.2%) on Brexit negotiation
concerns and political uncertainty following German elec-
tions. The European Central Bank also announced plans
to curb quantitative easing in January 2018. Japan (MSCI
Japan: +8.6%) was the best performer on its election results
and improved inlation expectations.
Markets favored economically sensitive sectors: IT (+8.3%), Materials (+7.8%), and Discretionary (+7.6%). Energy was also
positive (6.8%) as commodity prices were supported by distribu-
tion disruptions and high liquid natural gas usage with winter’s
arrival. Defensive sectors lagged as markets continued to rise: Utilities (-0.4%), Health Care (+0.9%), and Telecom (+1.7%).
It was another dificult quarter for value; factor performance favored strong growth (forecasted), earnings and price momen-
tum, high quality, and beta (MSCI World Value: +4.6% vs.
Russell 2000
Russell 2500
Russell Midcap
S&P 500
Russell 1000 Value
Russell 1000 Growth
Russell 1000
Russell 3000
13.7%
18.5%
21.7%
21.1%
21.8%
16.8%
30.2%
14.7%
Russell 2000
Russell 2500
Russell Midcap
S&P 500
Russell 1000 Value
Russell 1000 Growth
Russell 1000
Russell 3000
5.3%
6.1%
6.6%
6.3%
6.6%
5.2%
7.9%
3.3%
U.S. Equity: Quarterly Returns
U.S. Equity: One-Year Returns
Sources: Russell Investment Group and Standard & Poor’s
Sources: Russell Investment Group and Standard & Poor’s
+5.0%MSCI ACWI ex USA
GLOBAL EQUITY (Continued)

8
MSCI World Growth: +6.4%). Valuation factors were mixed with price-to-book ratios and yield detracting from performance,
while earnings-based multiples contributed.
Emerging Markets: Asian Stocks Power Strong
Quarter, Driven by China and Korea
Emerging market equities outper-
formed developed in the quarter and
for the year (MSCI Emerging Markets
(USD): +7.4%; +37.3%). Latin America
was the only weak spot in the quarter (-2.3%) but was up a robust
23.7% for the year. Emerging Asia performed the best for the
quarter and the year (+8.4%; +42.8%) driven by strong results
from China (+7.6%; +54.1%) and Korea (+11.4%; +47.3%).
Local China A shares did even better (MSCI China A 50
Index: +13.7%). October’s 19th National Congress of the
Communist Party solidiied power around Xi Jinping, recon-
irming key policy objectives. Chinese technology continued to perform well but was less of a performance outlier than in
previous quarters. China’s increasing and less-visible debt is
a growing concern, while expectations for stronger growth are
buoying the market.
South Africa (MSCI South Africa: +21.4%) was the best per-
former as commodity prices irmed and investors cheered a leadership change. Mexico (MSCI Mexico: -8.0%) was the
worst-performing emerging market country as the peso sold off
on NAFTA negotiation concerns.
Economically sensitive sectors sold off (Discretionary: -23.6%, Financials: -21.2%). Emerging market Health Care (+16.6%) saw very good performance with outsized contribution from
China and South Korea as changing demographics continued
to drive demand. Value factors struggled in emerging markets
while growth, earnings momentum, price momentum, volatility,
and beta were positive.
Non-U.S. Small Cap: Health Care Powers EM Gains
Developed non-U.S. small cap (MSCI
World ex USA Small Cap: +5.8%)
outperformed its large/mid counter-
part modestly, led by Asia. Australia
(+11.6%) and Japan (+8.7%) led the segment.
Emerging market small cap (MSCI Emerging Market Small
Cap: +9.2%) was the best-performing segment of the equity
markets in the fourth quarter, led by Health Care (+28%); Real
Estate (-0.1%) was the laggard.
MSCI Pacific ex Japan
54.1%
22.4%
27.2%
31.7%
31.0%
24.2%
24.0%
26.8%
22.3%
24.0%
37.3%
31.9%
25.9%
MSCI ACWI ex USA Small Cap
MSCI ACWI
MSCI ACWI ex USA
MSCI World ex USA Small Cap
MSCI World ex USA
MSCI World
MSCI Europe ex UK
MSCI UK
MSCI Japan
MSCI Emerging Markets
MSCI China
MSCI Frontier Markets
MSCI Pacific ex Japan
7.6%
5.5%
5.0%
6.6%
5.8%
4.2%
5.7%
5.7%
0.9%
8.5%
7.4%
5.6%
7.0%
MSCI ACWI ex USA Small Cap
MSCI ACWI
MSCI ACWI ex USA
MSCI World ex USA Small Cap
MSCI World ex USA
MSCI World
MSCI Europe ex UK
MSCI UK
MSCI Japan
MSCI Emerging Markets
MSCI China
MSCI Frontier Markets
Non-U.S. Equity: Quarterly Returns (U.S. Dollar) Non-U.S. Equity: One-Year Returns (U.S. Dollar)
Source: MSCI Source: MSCI
+7.4%MSCI EM
+6.6%MSCI ACWI ex USA SC
GLOBAL EQUITY (Continued)

9Knowledge. Experience. Integrity.
Global Fixed Income
U.S. Bonds: Strong Fundamentals Tighten Spreads
The U.S. yield curve continued its lat-tening trend in the fourth quarter. The
2-year U.S. Treasury yield climbed 42
basis points to close at 1.89%, up 69
bps from the end of 2016. At the long end of the yield curve,
the 30-year U.S. Treasury yield fell 12 bps during the quarter,
ending the year at 2.74%, 32 bps lower than its close in 2016.
This trend relects the Fed’s bias to be less accommodative through monetary policy, as well as benign inlation in the face of a strong labor market. As a result, longer-term bonds sharply
outperformed short-term and intermediate-maturity bonds for
the quarter and the year.
Volatility in ixed income as well as equity markets sits near his-
torical lows. The overall risk appetite remains elevated, driven
in part by globally strong growth and loose monetary policy from
central banks, as well as business and consumer conidence. The market is pricing in three Fed rate hikes for 2018, not far
from the Fed’s own expectation of where rates will end up in the
longer run. Yields on 10-year Treasuries rose modestly from
2.33% at the end of the third quarter to 2.41%.
The Bloomberg Barclays Long U.S. Treasury Index gained
2.4% in the quarter and 8.5% in 2017 versus a -0.4% quarterly and
+1.1% annual return for the Bloomberg Barclays Intermediate
Treasury Index. Consistent with the low volatility theme evident
in the equity markets, the U.S. Treasury 10-year traded in a nar-
row 60 bps band for the year, the lowest since 2000.
The Bloomberg Barclays U.S. Aggregate Bond Index rose
0.4% during the quarter. Corporate bonds outperformed for
the quarter and the year, and yield spreads were the tightest
since the Global Financial Crisis, hitting 93 bps over Treasuries.
U.S. Treasury Yield Curves
0%
1%
2%
3%
4%
Maturity (Years)
December 31, 2017 September 30, 2017 December 31, 2016
302520151050
Source: Bloomberg
U.S. Fixed Income: Quarterly Returns U.S. Fixed Income: One-Year Returns
2.8%
1.2%
-0.2%
-0.2%
0.4%
0.5%
1.3%
0.4%
Bloomberg Barclays Gov/Credit 1-3 Yr
Bloomberg Barclays Interm Gov/Credit
Bloomberg Barclays Aggregate
Bloomberg Barclays Long Gov/Credit
Bloomberg Barclays Universal
CS Leveraged Loans
Bloomberg Barclays Corp. High Yield
Bloomberg Barclays U.S. TIPS
10.7%
4.3%
2.1%
0.8%
4.1%
7.5%
3.0%
3.5%
Bloomberg Barclays Gov/Credit 1-3 Yr
Bloomberg Barclays Interm Gov/Credit
Bloomberg Barclays Aggregate
Bloomberg Barclays Long Gov/Credit
Bloomberg Barclays Universal
CS Leveraged Loans
Bloomberg Barclays Corp. High Yield
Bloomberg Barclays U.S. TIPS
Sources: Bloomberg Barclays and Credit Suisse Sources: Bloomberg Barclays and Credit Suisse
+0.4%BB AGGREGATE

10
Investment-grade corporate credit was the strongest-perform-
ing ixed income sector; tax reform may boost the sector by improving proitability and reducing issuance.
High yield corporates also did well, with the Bloomberg
Barclays U.S. Corporate High Yield Index up 0.5% for the
quarter and 7.5% for the year. The annual default rate was the
lowest since 2013. Issuance was robust in the fourth quarter
at $68 billion, but tax reform could negatively impact issuance.
TIPS outperformed nominal U.S. Treasuries as expecta-
tions for inlation rose. The Bloomberg Barclays U.S. TIPS
Index rose 1.3% for the quarter and 3.0% for the year, and
the 10-year breakeven spread (the difference between nominal
and real yields) rose to 1.96%.
The municipal bond market performed well in 2017 as rates were
steady and demand remained strong. The tax overhaul pack-
age is expected to have mixed effects. The change in personal
income rates is too small to have a meaningful impact, while the
decrease in corporate tax rates is expected to reduce demand
for munis from certain corporations. Limiting state and local tax
deductions could increase demand for in-state munis in high
tax states. Issuance spiked in anticipation of changing regula-
tions, setting a record $62.5 billion for December supply, but the
market absorbed it well. The Bloomberg Barclays Municipal
Bond Index returned 0.7% for the quarter and 5.4% for the year.
Global Bonds: Flat Returns in Developed Markets;
EM Returns Muted
Quarterly returns were mostly lat in developed markets. The Bloomberg
Barclays Global Aggregate Bond
Index rose +1.1% (unhedged) and
0.8% (hedged).
Emerging market debt delivered more muted returns than in
earlier quarters. Higher commodity prices and global growth
supported the asset class broadly. The JPM EMBI Global
Diversiied Index ($ denominated) gained 1.2% in the quarter
and 10.3% for the year. Returns were mixed, but beleaguered
Venezuela was the outlier for the quarter (-29%) and the year
(-34%). The local currency JPM GBI-EM Global Diversiied Index increased +0.8% in the quarter and +15.2% for the year.
In the quarter, Asian countries (+5%) performed best while Latin
America sank nearly 5%.
Non-U.S. Fixed Income: Quarterly Returns
Non-U.S. Fixed Income: One-Year Returns
1.6%
0.8%
0.8%
1.1%
1.2%
1.0%
0.6%
0.9%
Bloomberg Barclays Global Aggregate
Bloomberg Barclays Global Agg (hdg)
Bloomberg Barclays Global High Yield
Bloomberg Barclays Global Agg ex US
JPM EMBI Global Diversified
JPM GBI-EM Global Diversified
JPM EMBI Gl Div / JPM GBI-EM Gl Div
JPM CEMBI
15.2%
3.0%
7.4%
10.3%
12.7%
7.9%
10.4%
Bloomberg Barclays Global Aggregate
Bloomberg Barclays Global Agg (hdg)
Bloomberg Barclays Global High Yield
Bloomberg Barclays Global Agg ex US
JPM EMBI Global Diversified
JPM GBI-EM Global Diversified
JPM EMBI Gl Div / JPM GBI-EM Gl Div
JPM CEMBI
10.5%
Sources: Bloomberg Barclays and JP Morgan
Sources: Bloomberg Barclays and JP Morgan
7 bps
-4 bps
-18 bps
-5 bps
-2 bps
Germany
U.S. Treasury
U.K.
Canada
Japan
Change in 10-year Global Government Bond Yields
3Q17 to 4Q17
Source: Bloomberg Barclays
+2.5%BB GBL AGG ex US
GLOBAL FIXED INCOME (Continued)

11Knowledge. Experience. Integrity.
Steady Returns in U.S.; Europe Best Region for REITs
REAL ESTATE | Kevin Nagy
The NCREIF Property Index advanced 1.8% during the
fourth quarter (1.2% from income and 0.6% from apprecia-
tion). This marked the 36th consecutive quarter of positive
returns for the Index.
Industrial (+3.3%) was the best-performing sector for the
seventh consecutive quarter. Ofice (+1.7%) and Apartments (+1.6%) also did well. Hotels (+1.0%) were the worst per-
former and the only property type to experience a negative
appreciation return. Hotels only had one quarter of positive
appreciation during 2017. The West region was the strongest
performer for the ifth quarter in a row, returning 2.3%, and the Midwest lagged with a 1.3% return. The West also had
the strongest appreciation return at 1.2%; all other regions
had appreciation below 0.5%. Transaction volume fell slightly
to $11.5 billion, a 3% decrease from the third quarter and an
18% decline from the fourth quarter of 2016. Appraisal capital-
ization rates rose 16 basis points to 4.55%. Transaction capi-
talization increased even more, rising 59 bps to 5.85%. The
spread between appraisal and transactional rates increased
to 130 bps.
Occupancy rates increased to 93.6%, up 20 bps from the third
quarter and 37 bps from the fourth quarter of 2016. Industrial
and Retail occupancy rates increased slightly while Apartment
and Ofice rates decreased.
The NCREIF Open End Diversiied Core Equity Index rose
2.1% (1.1% from income and 1.0% from appreciation), a 20
bps increase from the third quarter. The appreciation return
increased for the second quarter in a row. Leverage ticked up 1
basis point to 21.4%.
Global real estate investment trusts (REITs) tracked by the FTSE
EPRA/NAREIT Developed REIT Index (USD) outperformed
U.S. REITs and posted a 3.8% return. The median active global
REIT manager, as measured by the Callan Global REIT Style
Group, gained 4.6%, beating the Index. U.S. REITs, as mea-
sured by the FTSE NAREIT Equity REITs Index, advanced
1.5% for the quarter. The median active U.S. REIT manager, as
measured by Callan’s U.S. REIT Style Group, returned 2.4%,
also beating the Index.
In the U.S., a strong November helped REITs overcome nega-
tive performance in October and December. Infrastructure
(+8.8%), Hotels (+5.4%), and Timber (+4.9%) made solid
gains, while Health Care (-5.3%), Diversiied (-2.0%), Specialty (-1.9%), and Residential (-0.2%) were the worst performers.
Retail (+6.8%) bounced back from a dismal second and third
quarter on the back of high M&A activity and a strong holiday
shopping season.
Rolling One-Year Returns
-60%
-30%
0%
30%
60%
90%
120%
REIT Style Global REIT StylePrivate Real Estate Database
02 0398 99 00 01 04 05 06 07 08 09 10 11 12 13 14 15 16 17
Source: Callan

12
Europe, as represented by the FTSE EPRA/NAREIT Europe
Index, was the strongest-performing region for the third con-
secutive quarter, returning 7.6% in U.S. dollar terms. U.K. REITs
outperformed their continental counterparts due to optimism over
a “soft Brexit” and better than expected earnings from London-
centric real estate proxies. Continental Europe continued to
beneit from robust economic growth that was not fazed by the Catalonian election results, among other political surprises.
The Asia-Paciic region, represented by the FTSE EPRA/
NAREIT Asia Index, jumped 5.5% in U.S. dollar terms, besting
the U.S. but lagging Europe. Singapore was the strongest per-
former, helped by a rally in the broader Singaporean stock mar-
ket. Hong Kong and Australia also had good quarters. Japan
lagged behind, but was still positive.
REAL ESTATE (Continued)
NCREIF Transaction and Appraisal Capitalization Rates
0%
3%
6%
9%
Appraisal Capitalization RatesTransaction Capitalization Rates
08 09 10 11 12 13 14 15 16 17
Source: NCREIF
Note: Transaction capitalization rate is equal weighted.
NCREIF Capitalization Rates by Property Type
0%
3%
6%
9%
IndustrialApartment RetailOffice
08 09 10 11 12 13 14 15 16 17
Source: NCREIF
Note: Capitalization rates are appraisal-based.
13Knowledge. Experience. Integrity.
Private Equity Performance Database (%) (Pooled Horizon IRRs through September 30, 2017*)
Strategy 3 Months Year 3 Years 5 Years 10 Years 15 Years 20 Years
All Venture 3.52 8.82 12.30 15.51 9.47 9.00 17.94
Growth Equity 4.90 15.83 10.68 13.21 10.06 12.60 13.13
All Buyouts 4.63 19.33 12.61 14.35 8.78 14.39 12.53
Mezzanine 4.16 13.07 9.43 10.15 9.02 9.47 8.64
Distressed 2.39 14.92 9.03 11.35 9.13 11.33 11.34
All Private Equity 4.31 16.19 11.93 14.08 9.06 12.75 13.01
S&P 500 4.48 18.61 10.81 14.22 7.44 10.04 7.00
Private equity returns are net of fees.
Sources: Standard & Poor’s and Thomson Reuters/Cambridge
*Most recent data available at time of publication
2017 Fundraising Sets New Record
PRIVATE EQUITY | Harshal Shah
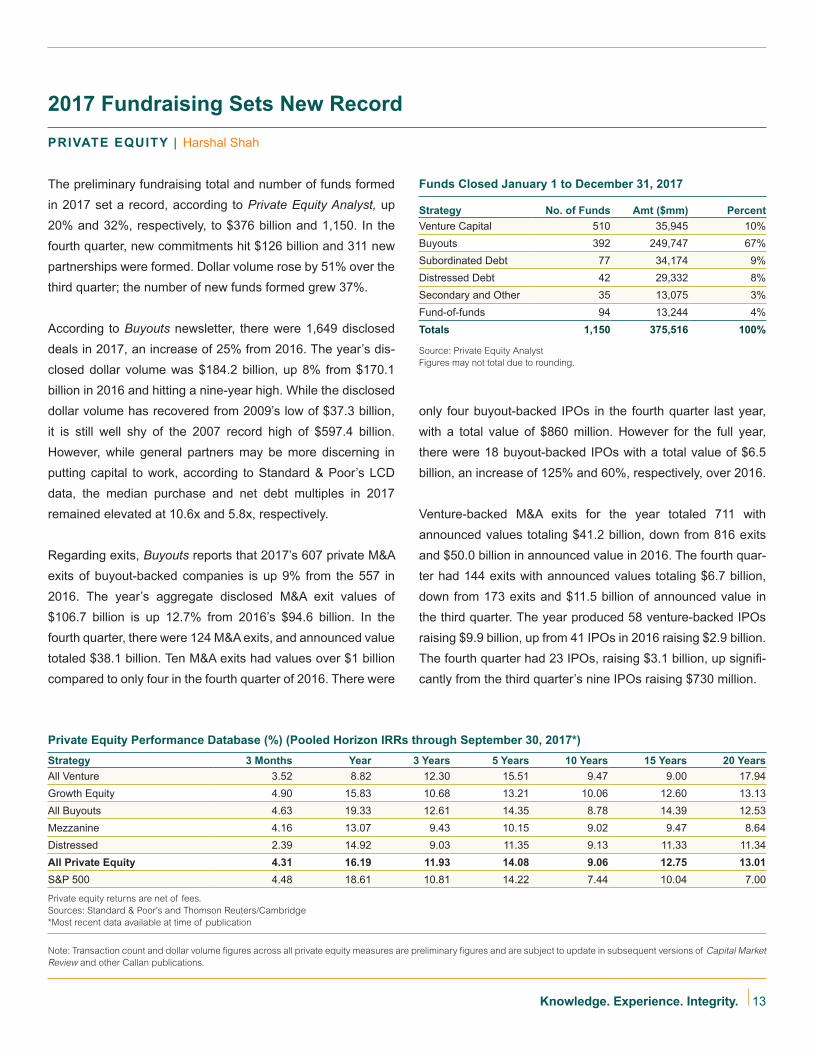
Funds Closed January 1 to December 31, 2017
Strategy No. of Funds Amt ($mm) Percent
Venture Capital 510 35,945 10%
Buyouts 392 249,747 67%
Subordinated Debt 77 34,174 9%
Distressed Debt 42 29,332 8%
Secondary and Other 35 13,075 3%
Fund-of-funds 94 13,244 4%
Totals 1,150 375,516 100%
Source: Private Equity Analyst
Figures may not total due to rounding.
Note: Transaction count and dollar volume igures across all private equity measures are preliminary igures and are subject to update in subsequent versions of Capital Market
Review and other Callan publications.
The preliminary fundraising total and number of funds formed
in 2017 set a record, according to Private Equity Analyst, up
20% and 32%, respectively, to $376 billion and 1,150. In the
fourth quarter, new commitments hit $126 billion and 311 new
partnerships were formed. Dollar volume rose by 51% over the
third quarter; the number of new funds formed grew 37%.
According to Buyouts newsletter, there were 1,649 disclosed
deals in 2017, an increase of 25% from 2016. The year’s dis-
closed dollar volume was $184.2 billion, up 8% from $170.1
billion in 2016 and hitting a nine-year high. While the disclosed
dollar volume has recovered from 2009’s low of $37.3 billion,
it is still well shy of the 2007 record high of $597.4 billion.
However, while general partners may be more discerning in
putting capital to work, according to Standard & Poor’s LCD
data, the median purchase and net debt multiples in 2017
remained elevated at 10.6x and 5.8x, respectively.
Regarding exits, Buyouts reports that 2017’s 607 private M&A
exits of buyout-backed companies is up 9% from the 557 in
2016. The year’s aggregate disclosed M&A exit values of
$106.7 billion is up 12.7% from 2016’s $94.6 billion. In the
fourth quarter, there were 124 M&A exits, and announced value
totaled $38.1 billion. Ten M&A exits had values over $1 billion
compared to only four in the fourth quarter of 2016. There were
only four buyout-backed IPOs in the fourth quarter last year,
with a total value of $860 million. However for the full year,
there were 18 buyout-backed IPOs with a total value of $6.5
billion, an increase of 125% and 60%, respectively, over 2016.
Venture-backed M&A exits for the year totaled 711 with
announced values totaling $41.2 billion, down from 816 exits
and $50.0 billion in announced value in 2016. The fourth quar-
ter had 144 exits with announced values totaling $6.7 billion,
down from 173 exits and $11.5 billion of announced value in
the third quarter. The year produced 58 venture-backed IPOs
raising $9.9 billion, up from 41 IPOs in 2016 raising $2.9 billion.
The fourth quarter had 23 IPOs, raising $3.1 billion, up signii-
cantly from the third quarter’s nine IPOs raising $730 million.

14
Callan Database Median and Index Returns* for Periods ended December 31, 2017
Hedge Fund Universe Quarter Year 3 Years 5 Years 10 Years 15 Years
Callan Fund-of-Funds Database 1.53 6.98 2.90 5.01 3.04 5.22
Callan Absolute Return FOF Style 1.47 5.11 3.20 4.59 3.00 4.90
Callan Core Diversiied FOF Style 1.51 6.42 2.36 4.79 2.77 5.18
Callan Long/Short Equity FOF Style 1.81 11.25 3.76 6.00 3.20 5.84
Credit Suisse Hedge Fund Index 2.30 7.12 2.50 4.23 3.24 6.01
HFRI Asset Wtd Composite 1.99 6.52 3.06 4.60 3.34 --
HFRI Fund Wtd Comp 2.65 8.68 4.25 4.95 3.23 6.10
HFRI Equity Hedge (Total) 3.51 13.46 5.82 6.63 3.19 6.09
HFRI Event-Driven (Total) 2.04 7.73 4.73 5.49 4.17 7.26
HFRI Macro (Total) Index 2.42 2.21 0.65 1.40 1.95 4.65
HFRI Relative Value (Total) 1.05 5.11 4.11 4.68 4.81 6.02
90-Day T-Bill + 5% 1.50 5.86 5.41 5.27 5.39 6.28
Liquid Alternative Universe Quarter Year 3 Years 5 Years 10 Years 15 Years
Callan Absolute Return MAC 0.90 5.07 3.27 4.46 5.16 --
Callan Risk Premia MAC 3.95 5.51 2.04 3.57 7.16 --
Callan Long-Biased MAC 3.35 13.87 5.46 6.39 5.76 8.70
Callan Risk Parity MAC 4.66 11.88 6.47 5.81 6.75 --
60% S&P 500/40% BB Agg 4.14 14.26 7.76 10.25 7.09 7.90
CS NB MARP Index (5%v) -0.63 -1.61 2.05 3.55 7.15 --
SG Trend Index 7.70 2.19 -1.36 3.35 3.15 4.21
*Gross of fees. Sources: Bloomberg Barclays, Callan, Credit Suisse, Hedge Fund Research, Societe Generale, and Standard and Poor’s
Risk Takers See Less as More
HEDGE FUNDS/MACs | Jim McKee
Given the quarter’s surge of raw equity beta, alpha-seeking
hedge funds saw positive but more modest results. Representing
a paper portfolio of hedge fund interests without implementa-
tion costs, the Credit Suisse Hedge Fund Index (CS HFI) rose
2.3% in the fourth quarter. Actual hedge fund portfolios repre-
sented by the median manager in the Callan Hedge Fund-of-
Funds Database advanced 1.5%, net of all fees and expenses.
Within CS HFI, the best-performing strategy was Managed
Futures (+6.6%), followed by Emerging Markets (+3.4%)
and Long/Short Equity (+3.3%). Less fortunate was Risk Arb
(+0.1%); some major pending deals met regulatory resistance,
causing those deal spreads to widen signiicantly. Within Callan’s Hedge FOF Database, market exposures margin-
ally affected performance in the fourth quarter. With the added
momentum from equity markets, the median Callan Long/Short
Equity FOF (+1.8%) beat the Callan Absolute Return FOF
(+1.5%). The Core Diversiied FOF gained 1.5%.
The Credit Suisse Neuberger Multi-Asset Risk Premia
Index, a proxy for liquid alternative beta, slipped 0.6%
based upon a 5% volatility target. Within the Index’s under-
lying styles, winners were Equity Momentum (+7.6%) and
Commodity Momentum (+4.8%). The Callan Multi-Asset
Class Database group’s median manager rose 3.6%, gross
of fees. Within this group, the median Callan Risk Premia
MAC gained 4.0%, aided by equity and commodity momen-
tum. Typically targeting equal risk-weighted allocations to
major asset classes with leverage, the Callan Risk Parity
MAC gained 4.7%, beating a 60% stock/40% bond bench-
mark (+4.1%). The Callan Long-Biased MAC (+3.4%) per-
formed well, given its dynamic asset allocation mandate with
a typically long equity bias, but trailed the 60/40 benchmark.
Focused on non-directional strategies of long and short
asset class exposures, the Callan Absolute Return MAC
added 0.9%.

15Knowledge. Experience. Integrity.
The Callan DC Index is an equally weighted index tracking the cash lows and performance of nearly 90 plans, representing more than one million
DC participants and over $135 billion in assets. The Index is updated
quarterly and is available on Callan’s website, as is the quarterly DC
Observer newsletter.
The Callan DC Index™ recorded a solid 3.8% gain during the
third quarter, its eighth straight quarter of positive performance.
And the Index is up 11.9% year to date—its best showing for the
irst three quarters of a year since 2013.
The Index beneited from strong U.S. equity performance, but a lack of diversiication to non-U.S. equity markets continued to hinder DC plan performance. The typical DC participant has
less than 6% in non-U.S. equity exposure, compared to 20.1%
for the typical Age 45 target date fund (TDF).
Accordingly, the Age 45 TDF outpaced the DC Index by about
50 basis points for the third quarter and 200 bps year to date.
Plan balances rose 3.78%, driven by return growth (3.76%)
rather than inlows (plan sponsor and participant contributions), which contributed a meager 0.02%.
U.S. large cap and small/mid cap equities experienced signii-
cant outlows during the quarter. Non-U.S. and emerging mar-ket stocks represented the only equity asset classes to witness
inlows. As usual, TDFs accounted for the majority of inlow activity during the third quarter, capturing 72 cents of every dol-
lar moving within DC plans.
Turnover within the Index (i.e., net transfer activity) ticked up
from last quarter to 0.58%, but remained below the historical
average of 0.63%.
The DC Index’s overall equity allocation increased to over 70%
in the most recent period, but it remains below its 2007 peak of
73%. TDFs grew to their largest allocation yet, holding 30.8% of
total DC assets in the third quarter. U.S. large cap equity com-
mands the second-largest portion of participant assets (22.7%).
DC Plans on Track to Win Big in 2017
DEFINED CONTRIBUTION | Tom Szkwarla
Net Cash Flow Analysis (Third Quarter 2017)
(Top Two and Bottom Two Asset Gatherers)
Asset Class
Flows as % of
Total Net Flows
Target Date Funds 71.56%
Non-U.S. Equity 12.99%
U.S. Small/Mid Cap -28.25%
U.S. Large Cap -40.72%
Total Turnover** 0.58%
Data provided here is the most recent available at time of publication.
Source: Callan DC Index
Note: DC Index inception date is January 2006.
* The Age 45 Fund transitioned from the average 2030 TDF to the 2035 TDF in
June 2013.
** Total Index “turnover” measures the percentage of total invested assets (transfers
only, excluding contributions and withdrawals) that moved between asset classes.
Investment Performance
Growth Sources
Third Quarter 2017
Age 45 Target Date* Total DC Index
3.76% 4.27%
6.09%
Annualized Since
Inception
14.09%
11.93%
6.85%
Year-to-Date
Third Quarter 2017
% Net Flows % Return Growth% Total Growth
8.13%
Annualized Since
Inception
2.04% 0.02%0.24%
6.09%
3.78% 3.76%
12.17%11.93%
Year-to-Date