callan institute capital market review - cmers.com · callan employs more than 150 people and...
TRANSCRIPT
Two Percent is the New Three Percent | U.S. ECONOMYThe U.S. economy grew at a 2.2% annual rate in the first quarter
of 2012, slower than the 3.0% achieved in the fourth quarter of
2011, but exactly in line with expectations. As economists have
revised growth expectations down, the tenor of this expansion
remains one of weakness. see page 16
An Apple a Day Keeps the Bears at Bay | U.S. EQUITYTen percent returns were the minimum among diversified U.S.
equity indices, as the Russell 3000 grew 12.87%. Micro caps
and low quality stocks benefited from risk-seeking behavior as
volatility and correlations dropped. see page 1
Risk Returns to Favor | U.S. FIXED INCOMEAppetite for riskier fixed income securities pushed the BarclaysAggregate Index ahead 0.30% during the quarter, with all
sectors outperforming like-duration Treasuries. The BarclaysCorporate High Yield Index increased 5.34%, driven by lower
quality bonds. see page 4
Rally, With a Grain of Salt | NON-U.S. EQUITYJanuary and February energized global markets, with the MSCI
EM Index (+14.14%) rocketing past MSCI EAFE (+10.86%) over
the first quarter. Yet a chill lingered in March as healthy sector
performance could not completely silence fears of a continuing
sovereign debt crisis. see page 7
A Good Four-Letter Word From Europe: LTRO |NON-U.S. FIXED INCOMEEurope’s latest rescue efforts led to a strong quarter for the
European constituents of the Citi Non-U.S. World GovernmentBond Index (-0.22%). Ireland (+13.14%) and Italy (+14.08%)
surged. see page 10
Real Estate Pushes Forward | REAL ESTATEThe NCREIF Property Index advanced 2.59% while domestic
REITs appreciated 10.79%. Real estate stocks in Asia/Pacific
(+16.51%) led global REIT performance, followed by Europe
(+12.73%). see page 12
A Fresh Start | PRIVATE EQUITYThe strong public equity market rally helped boost private equity
fundraising and IPO activity, although new company investments
and M&A exit volumes declined. see page 14
Alpha Able, Beta Better | HEDGE FUNDSBenefiting from strong equity and credit markets in the first
quarter, the Dow Jones Credit Suisse Hedge Fund Indexgained 4.04%. The best-performing strategy was Long-Short
Equity (+7.19%). With lower correlations among stocks, markets
also rewarded security selection skills, aiding relative value
strategies. see page 15
Started Strong But For How Long? | DIVERSIFIED
ACCOUNTS AND THE CALLAN DC INDEX™Public funds (+7.74%) negotiated a marginal lead while
endowments/foundations (+6.84%) were the laggards for the
second consecutive quarter. Domestic balanced managers were
up 8.91%, surpassing their institutional counterparts as well as
the blended 60% Russell 3000 and 40% Barclays Aggregate
benchmark. see page 18
FIRST QUARTER 2012
Cash (90-Day T-Bills)
U.S. Equity (Russell 3000)Non-U.S. Equity (MSCI EAFE)
U.S. Fixed (Barclays Aggregate)Non-U.S. Fixed (Citi Non-U.S.)
Real Estate (NCREIF Property Index)Hedge Funds (DJCS HFI)
Broad Market Quarterly Returns
Sources: Barclays Capital Inc., Citigroup, Credit Suisse Hedge Index LLC, Merrill Lynch, MSCI Inc., NCREIF, Russell Investment Group, Standard & Poor’s
0.30%-0.22%
2.59%4.04%
0.01%
12.87%10.86%
Callan Associates • Knowledge for Investors
Capital Market Review
CALLAN INVESTMENTSINSTITUTE

About Callan Associates
Founded in 1973, Callan Associates Inc. is one of the largest independently owned investment consulting
firms in the country. Headquartered in San Francisco, Calif., the firm provides research, education, decision
support and advice to a broad array of institutional investors through four distinct lines of business: Fund
Sponsor Consulting, Independent Adviser Group, Institutional Consulting Group and the Trust Advisory
Group. Callan employs more than 150 people and maintains four regional offices located in Denver,
Chicago, Atlanta and Florham Park, N.J.
About the Callan Investments Institute
The Callan Investments Institute, established in 1980, is a source of continuing education for those in the
institutional investment community. The Institute conducts conferences and workshops and provides
published research, surveys and newsletters. The Institute strives to present the most timely and relevant
research and education available so our clients and our associates stay abreast of important trends in the
investments industry.
The Capital Market Review is a quarterly macroeconomic indicator newsletter that provides thoughtful insights
on the economy and recent performance in the equity, fixed income, alternatives, international, real estate and
other capital markets.
Editor-in-Chief – Stephanie Meade; Performance Data – Alpay Soyoguz, CFA, Adam Mills; Publication Layout – Nicole Silva
First Quarter 2012 • Capital Market Review | 1
AN APPLE A DAY KEEPS THE BEARS AT BAY In the first quarter of 2012, markets mirrored the
upward trajectory of the fourth quarter of 2011. While
the market’s direction has been comfortably consis-
tent, correlations and volatility have been noticeably
lower—a welcome reprieve after the rollercoaster
ride experienced last year. Stocks have risen steadi-
ly each month in 2012, with the largest drop only 2%.
While some macroeconomic fears linger, much of the
rally in equities was due to an easing of those anxi-
eties. The European Central Bank provided the requi-
site funds to stabilize European banks, and it was
announced that U.S. GDP grew by 3% in 2011 while
the unemployment rate fell to a three-year low. The
bull market also celebrated its three-year anniver-
sary, during which the S&P 500 more than doubled,
increasing 122%.
The broad market, as measured by the Russell 3000Index (+12.87%), continued its climb, posting returns
similar to the fourth quarter of last year. Although
micro caps displayed the best returns (RussellMicrocap: +15.29%), investors seemed unable to dif-
ferentiate large cap stocks (Russell 1000: +12.90%)
from small and mid cap stocks (Russell 2000 Index:
+12.44%; Russell Midcap: +12.94%). Although the
S&P 500 (+12.59%) was consistent with its peers, the
S&P quality indices revealed a risk-seeking theme
(S&P 500 LQ: +14.85%; S&P 500 HQ: +10.11%).
Along that motif, growth continued to outpace value
(Russell 3000 Growth: +14.58%; Russell 3000Value: +11.16%), although dispersion was more
evident in large cap names.
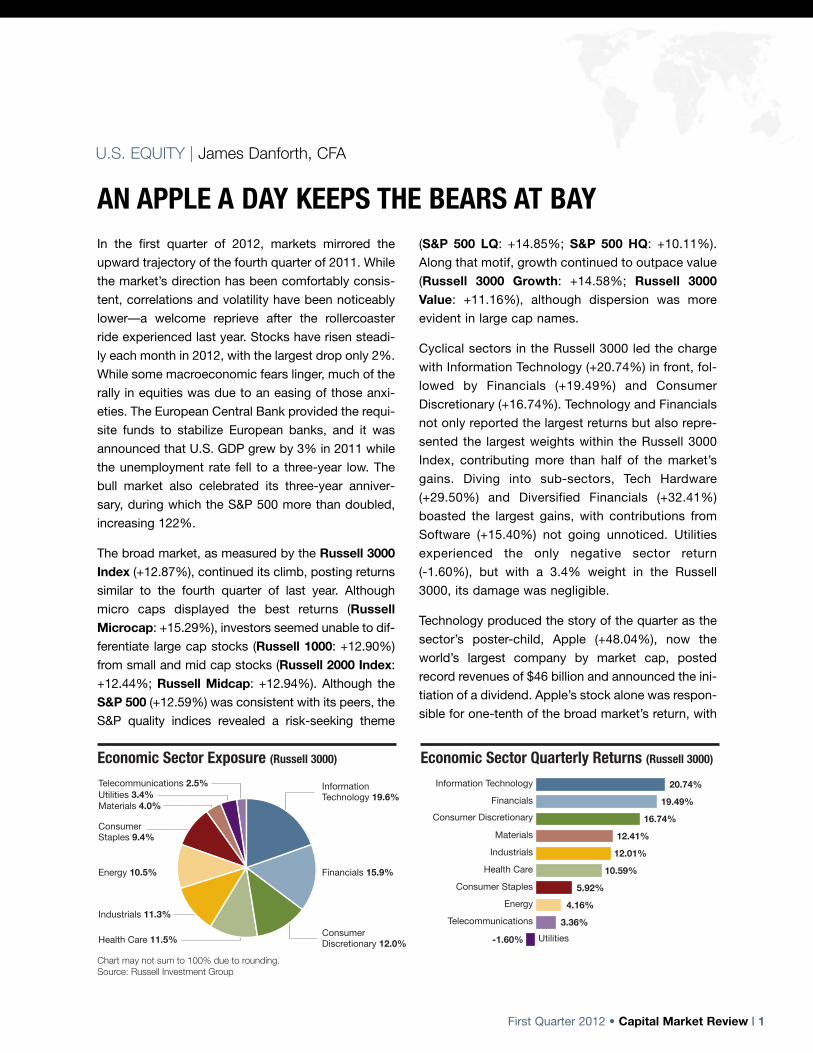
Cyclical sectors in the Russell 3000 led the charge
with Information Technology (+20.74%) in front, fol-
lowed by Financials (+19.49%) and Consumer
Discretionary (+16.74%). Technology and Financials
not only reported the largest returns but also repre-
sented the largest weights within the Russell 3000
Index, contributing more than half of the market’s
gains. Diving into sub-sectors, Tech Hardware
(+29.50%) and Diversified Financials (+32.41%)
boasted the largest gains, with contributions from
Software (+15.40%) not going unnoticed. Utilities
experienced the only negative sector return
(-1.60%), but with a 3.4% weight in the Russell
3000, its damage was negligible.
Technology produced the story of the quarter as the
sector’s poster-child, Apple (+48.04%), now the
world’s largest company by market cap, posted
record revenues of $46 billion and announced the ini-
tiation of a dividend. Apple’s stock alone was respon-
sible for one-tenth of the broad market’s return, with
Utilities
Telecommunications
Energy
Consumer Staples
Health Care
Industrials
Materials
Consumer DiscretionaryFinancials
Information Technology
Economic Sector Exposure (Russell 3000) Economic Sector Quarterly Returns (Russell 3000)
20.74%
19.49%
16.74%
12.41%
12.01%
10.59%
5.92%
4.16%
3.36%
-1.60%
Telecommunications 2.5%
Energy 10.5% Financials 15.9%
Information Technology 19.6%
Consumer Staples 9.4%
Consumer Discretionary 12.0%
Utilities 3.4%Materials 4.0%
Industrials 11.3%
Chart may not sum to 100% due to rounding.Source: Russell Investment Group
Health Care 11.5%
U.S. EQUITY | James Danforth, CFA

2 | Capital Market Review • First Quarter 2012
a 1.24% individual return contribution to the Russell
3000. The stock’s impact eclipses that of the entire
Software industry, as well as the total from the bot-
tom half of the sector groups combined.
The broad-based rally in Financials, including gains
across all sub-sectors and industries, resulted from
the Federal Reserve’s announcement to keep interest
rates near zero, positive stress tests for banks, and
decreased concerns with financial regulation and the
possibility of a European financial crisis. J.P. Morgan
Chase (+39.27%) added the second largest contribu-
tion by an individual stock but only offered 36 basis
points to the Index, as its weight is only one-third that
of Apple’s. Bank of America (+72.34%) experienced
a more dramatic revival due to strong financials
released in January, which partially erased a 60%
loss in 2011.
Energy and Materials stocks started the year strong
but weakened in March when the World Bank sharply
lowered its global growth outlook. Oil prices hit a high
in February, based on concerns over tension with
Iran, but then receded. As production of natural gas
exploded, profits dove to a decade low hurting the
Gas Utility sub-sector (-6.24%). The stock market
rally dampened the price of gold as well, depressing
miners and gold-related stocks (-11.22%).
02 039293 94 95 96 97 98 99 00 01-30%
-20%
-10%
0%
10%
20%
30%
04 05 06 07 08 09 10 1112
Russell 1000 Growth
Russell 1000Russell 1000 Value
Rolling One-Year Relative Returns versus Russell 1000
Source: Russell Investment Group
U.S. EQUITY | continued
Large Cap Large Cap Small Cap Small Cap Growth Style Value Style Growth Style Value Style 10th Percentile 19.36 14.67 17.59 15.80 25th Percentile 17.74 12.94 16.04 14.25 Median 16.31 11.83 14.52 12.99 75th Percentile 14.85 10.85 13.00 11.53 90th Percentile 13.56 9.48 12.12 8.69 R1000 Growth R1000 Value R2000 Growth R2000 Value Benchmark 14.69 11.12 13.28 11.59
Callan Style Group Quarterly Returns
Sources: Callan Associates Inc., Russell Investment Group
5%
10%
15%
20%
U.S. Equity Index Characteristics as of March 31, 2012S&P 1500 S&P 500 S&P 400 S&P 600 Rus 3000 Rus 1000 Rus Midcap Rus 2000
Cap Range Min ($MM) 15 1116 542 15 8 45 45 8Cap Range Max ($B) 558.93 558.93 9.42 3.19 554.36 554.36 22.72 3.33Number of Issues 1,500 500 400 600 2,918 977 779 1,941% of S&P 1500 100% 88% 8% 4% 100% 92% 27% 8%Wtd Avg Mkt Cap ($B) 97.12 109.63 3.95 1.29 90.39 97.91 8.68 1.36Price/Book Ratio 2.2 2.2 2.1 1.8 2.2 2.2 2.1 1.8P/E Ratio (forecasted) 13.3 13 15.7 16.2 13.4 13.2 15 16.7Dividend Yield 2.0% 2.0% 1.4% 1.2% 1.9% 2.0% 1.6% 1.4%5-Yr Earnings (forecasted) 11.4% 11.2% 13.6% 11.9% 11.6% 11.5% 11.9% 12.6%Sources: Russell Investment Group, Standard & Poor’s
First Quarter 2012 • Capital Market Review | 3
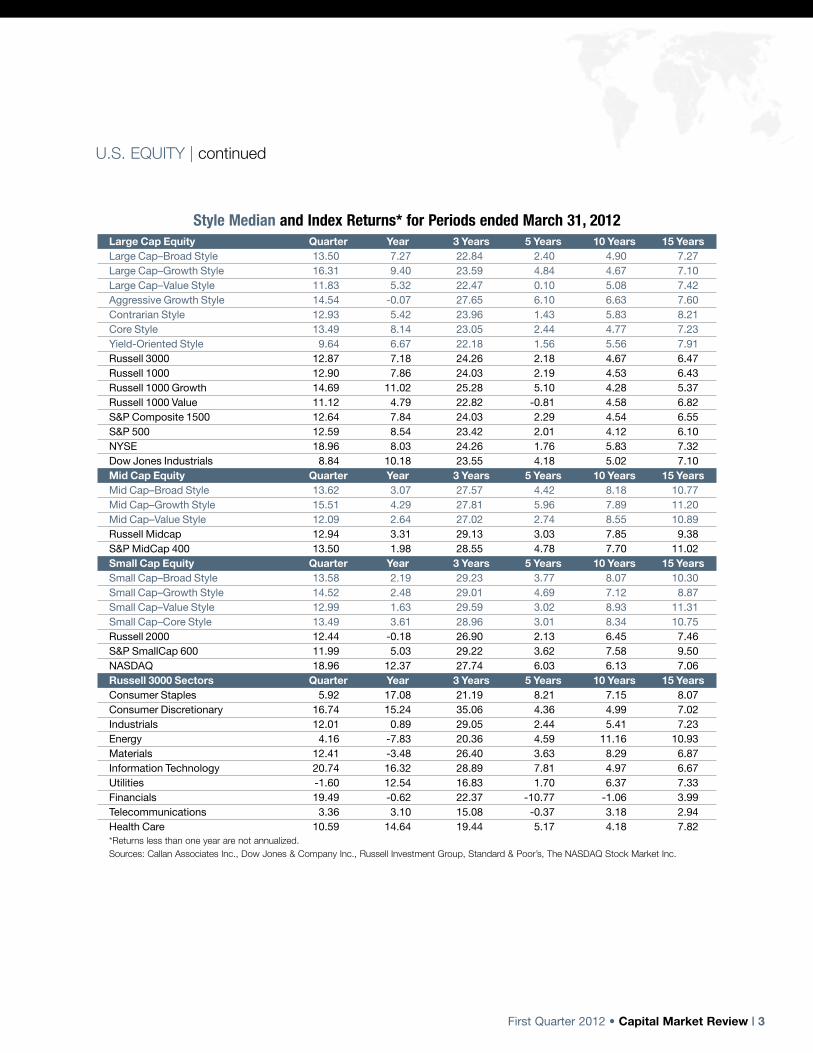
U.S. EQUITY | continued
Style Median and Index Returns* for Periods ended March 31, 2012Large Cap Equity Quarter Year 3 Years 5 Years 10 Years 15 YearsLarge Cap–Broad Style 13.50 7.27 22.84 2.40 4.90 7.27Large Cap–Growth Style 16.31 9.40 23.59 4.84 4.67 7.10Large Cap–Value Style 11.83 5.32 22.47 0.10 5.08 7.42Aggressive Growth Style 14.54 -0.07 27.65 6.10 6.63 7.60Contrarian Style 12.93 5.42 23.96 1.43 5.83 8.21Core Style 13.49 8.14 23.05 2.44 4.77 7.23Yield-Oriented Style 9.64 6.67 22.18 1.56 5.56 7.91Russell 3000 12.87 7.18 24.26 2.18 4.67 6.47Russell 1000 12.90 7.86 24.03 2.19 4.53 6.43Russell 1000 Growth 14.69 11.02 25.28 5.10 4.28 5.37Russell 1000 Value 11.12 4.79 22.82 -0.81 4.58 6.82S&P Composite 1500 12.64 7.84 24.03 2.29 4.54 6.55S&P 500 12.59 8.54 23.42 2.01 4.12 6.10NYSE 18.96 8.03 24.26 1.76 5.83 7.32Dow Jones Industrials 8.84 10.18 23.55 4.18 5.02 7.10Mid Cap Equity Quarter Year 3 Years 5 Years 10 Years 15 YearsMid Cap–Broad Style 13.62 3.07 27.57 4.42 8.18 10.77Mid Cap–Growth Style 15.51 4.29 27.81 5.96 7.89 11.20Mid Cap–Value Style 12.09 2.64 27.02 2.74 8.55 10.89Russell Midcap 12.94 3.31 29.13 3.03 7.85 9.38S&P MidCap 400 13.50 1.98 28.55 4.78 7.70 11.02Small Cap Equity Quarter Year 3 Years 5 Years 10 Years 15 YearsSmall Cap–Broad Style 13.58 2.19 29.23 3.77 8.07 10.30Small Cap–Growth Style 14.52 2.48 29.01 4.69 7.12 8.87Small Cap–Value Style 12.99 1.63 29.59 3.02 8.93 11.31Small Cap–Core Style 13.49 3.61 28.96 3.01 8.34 10.75Russell 2000 12.44 -0.18 26.90 2.13 6.45 7.46S&P SmallCap 600 11.99 5.03 29.22 3.62 7.58 9.50NASDAQ 18.96 12.37 27.74 6.03 6.13 7.06Russell 3000 Sectors Quarter Year 3 Years 5 Years 10 Years 15 YearsConsumer Staples 5.92 17.08 21.19 8.21 7.15 8.07Consumer Discretionary 16.74 15.24 35.06 4.36 4.99 7.02Industrials 12.01 0.89 29.05 2.44 5.41 7.23Energy 4.16 -7.83 20.36 4.59 11.16 10.93Materials 12.41 -3.48 26.40 3.63 8.29 6.87Information Technology 20.74 16.32 28.89 7.81 4.97 6.67Utilities -1.60 12.54 16.83 1.70 6.37 7.33Financials 19.49 -0.62 22.37 -10.77 -1.06 3.99Telecommunications 3.36 3.10 15.08 -0.37 3.18 2.94Health Care 10.59 14.64 19.44 5.17 4.18 7.82*Returns less than one year are not annualized.Sources: Callan Associates Inc., Dow Jones & Company Inc., Russell Investment Group, Standard & Poor’s, The NASDAQ Stock Market Inc.

4 | Capital Market Review • First Quarter 2012
RISK RETURNS TO FAVORThe first quarter was mixed across fixed income sec-
tors, but risky assets generally outperformed
Treasuries as bond investors sought out yield. The
European Central Bank’s Long-Term Refinancing
Operation helped to ease investor concerns regarding
global contagion from a potential sovereign debt cri-
sis, and U.S. economic news skewed positive
throughout the quarter. The Barclays AggregateIndex increased 0.30%, driven by strong relative per-
formance from all spread sectors.
The Fed maintained its low rate policies, electing to
keep both the federal funds rate and the discount rate
at 0.00% to 0.25% and 0.75%, respectively. Ben
Bernanke reiterated the Fed’s commitment to low
interest rates on several occasions throughout the
quarter, and additional quantitative easing remains a
possibility. While the short end of the curve rose only
modestly, yields beyond two years increased notice-
ably. Five-year yields grew by 21 bps, 10-year yields
climbed by 33 bps and 30-year yields leaped higher
by 44 bps. The jump in yields at the long end of the
curve resulted in a steepened curve, with the spread
between two-year and 30-year Treasuries expanding
35 bps to 301 bps. The breakeven rate (the difference
between nominal and real yields) on the 10-year
Treasury ended the quarter at 2.33%, a 35 bps
increase from year-end. Ten-year TIPS notably contin-
ued to offer a negative real yield (-0.12%).
Stable to improving macroeconomic news resulted in
a rally in risk assets during the quarter, with no single
sector underperforming Treasuries. Commercial mort-
gage-backed securities (CMBS) grew 3.74% on a
like-duration basis, building on the previous quarter.
Asset-backed securities (ABS) eclipsed like-duration
Treasuries by 1.20%. Mortgage-backed securities
(MBS) also advanced 1.01% versus like-duration
Treasuries, supported by the Fed’s ongoing presence
in the market.
Investment-grade credit continued to strengthen, sur-
passing like-duration Treasuries by 3.69%. Corporate
issues benefited from strong balance sheets and pos-
itive earnings trends. The healthy results of the Fed’s
stress tests of U.S. banks, released during the quar-
ter, helped the Financials sector post a whopping
6.22% gain relative to like-duration Treasuries.
Industrials and Utilities also advanced 2.64% and
2.34% versus like-duration Treasuries, respectively.
U.S. FIXED INCOME | Steven Center, CFA
0%
1%
2%
3%
4%
5%U.S. Treasury Yield Curves
Maturity (Years)Source: Bloomberg
March 31, 2012December 31, 2011March 31, 2011
302520151050
Historical 10-Year Yields
0%
1%
2%
3%
4%
5%
6%
7% U.S. 10-Year Treasury Yield10-Year TIPS YieldBreakeven Inflation Rate
07 08 09 10 11 120605040302
Source: Bloomberg
First Quarter 2012 • Capital Market Review | 5
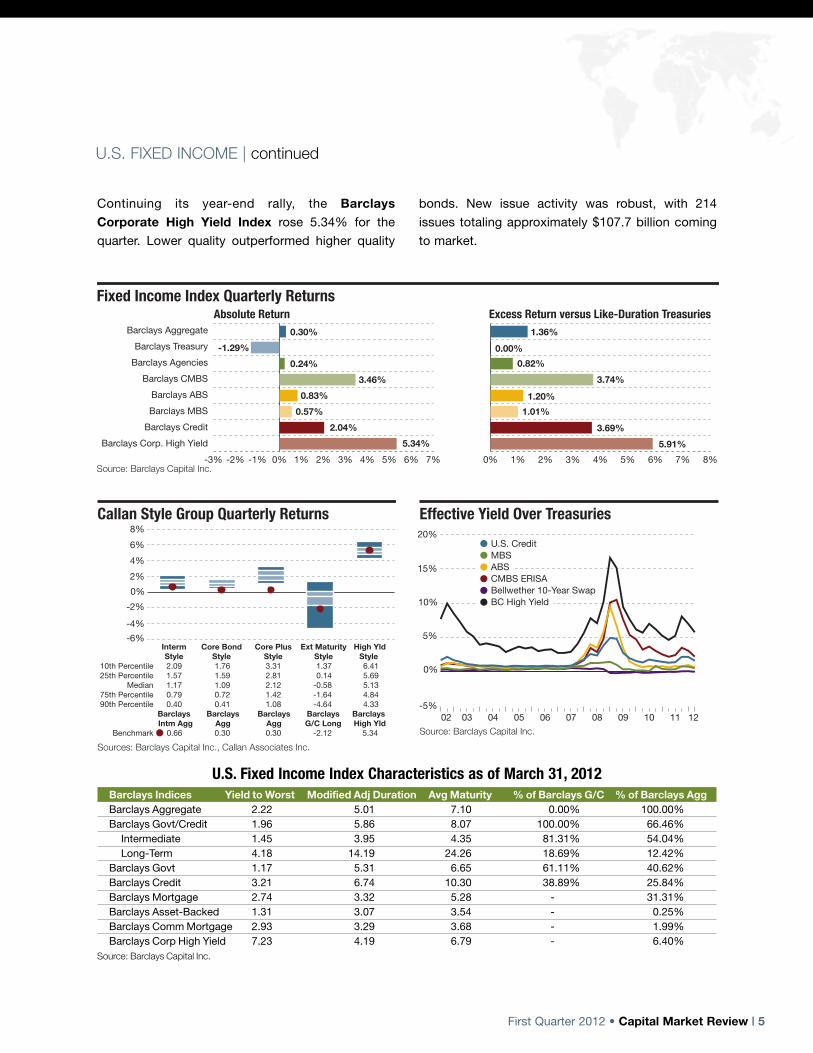
Continuing its year-end rally, the BarclaysCorporate High Yield Index rose 5.34% for the
quarter. Lower quality outperformed higher quality
bonds. New issue activity was robust, with 214
issues totaling approximately $107.7 billion coming
to market.
U.S. FIXED INCOME | continued
Effective Yield Over Treasuries
-5%
0%
5%
10%
15%
20%U.S. Credit
Bellwether 10-Year SwapBC High Yield
MBSABSCMBS ERISA
07 08 09 10 11 120605040302
Source: Barclays Capital Inc.
0% 1% 2% 3% 4% 5% 6% 7% 8%
Fixed Income Index Quarterly ReturnsAbsolute Return Excess Return versus Like-Duration Treasuries
-3% -2% -1% 0% 1% 2% 3% 4% 5% 6% 7%
-1.29% 0.00%
0.30% 1.36%
0.24% 0.82%
3.46% 3.74%
0.83% 1.20%
0.57% 1.01%
2.04% 3.69%
5.34% 5.91%
Barclays Treasury
Barclays Aggregate
Barclays Agencies
Barclays MBS
Barclays CMBS
Barclays ABS
Barclays Credit
Barclays Corp. High Yield
Source: Barclays Capital Inc.
Callan Style Group Quarterly Returns
Interm Core Bond Core Plus Ext Maturity High Yld Style Style Style Style Style 10th Percentile 2.09 1.76 3.31 1.37 6.41 25th Percentile 1.57 1.59 2.81 0.14 5.69 Median 1.17 1.09 2.12 -0.58 5.13 75th Percentile 0.79 0.72 1.42 -1.64 4.84 90th Percentile 0.40 0.41 1.08 -4.64 4.33 Barclays Barclays Barclays Barclays Barclays Intm Agg Agg Agg G/C Long High Yld Benchmark 0.66 0.30 0.30 -2.12 5.34
Sources: Barclays Capital Inc., Callan Associates Inc.
-6%-4%
-2%0%2%4%6%8%
U.S. Fixed Income Index Characteristics as of March 31, 2012Barclays Indices Yield to Worst Modified Adj Duration Avg Maturity % of Barclays G/C % of Barclays AggBarclays Aggregate 2.22 5.01 7.10 0.00% 100.00%Barclays Govt/Credit 1.96 5.86 8.07 100.00% 66.46%
Intermediate 1.45 3.95 4.35 81.31% 54.04%Long-Term 4.18 14.19 24.26 18.69% 12.42%
Barclays Govt 1.17 5.31 6.65 61.11% 40.62%Barclays Credit 3.21 6.74 10.30 38.89% 25.84%Barclays Mortgage 2.74 3.32 5.28 - 31.31%Barclays Asset-Backed 1.31 3.07 3.54 - 0.25%Barclays Comm Mortgage 2.93 3.29 3.68 - 1.99%Barclays Corp High Yield 7.23 4.19 6.79 - 6.40%
Source: Barclays Capital Inc.
6 | Capital Market Review • First Quarter 2012
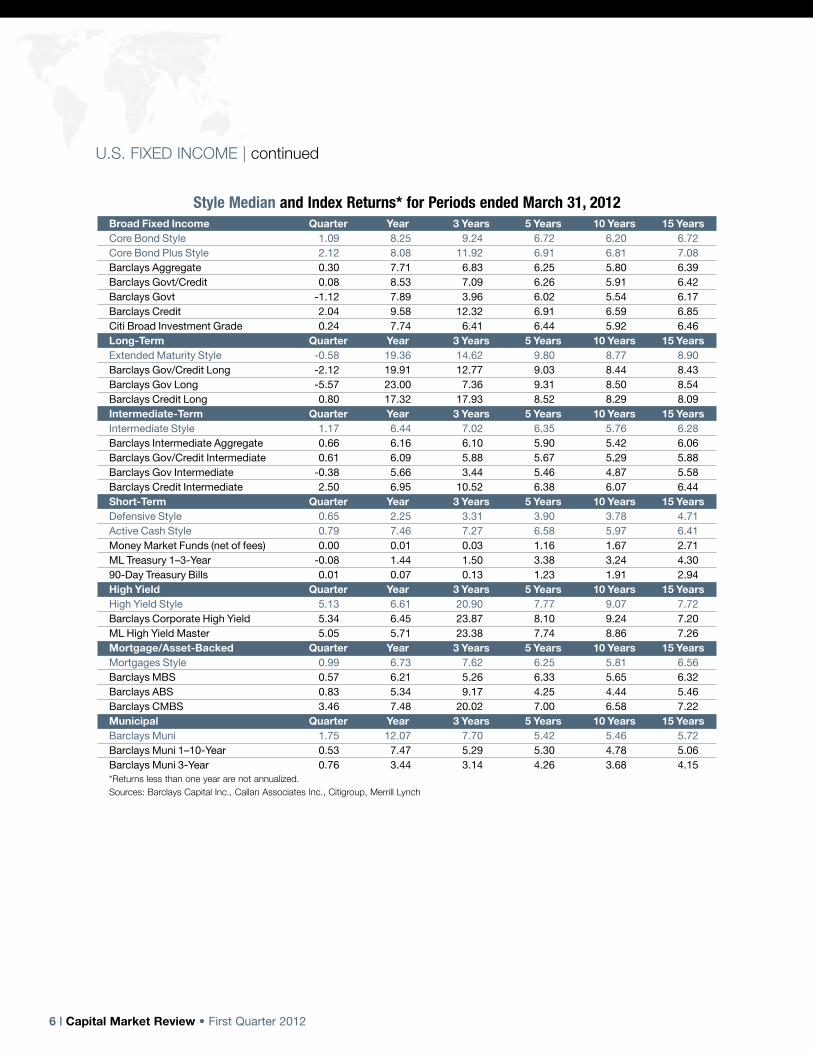
Style Median and Index Returns* for Periods ended March 31, 2012Broad Fixed Income Quarter Year 3 Years 5 Years 10 Years 15 YearsCore Bond Style 1.09 8.25 9.24 6.72 6.20 6.72Core Bond Plus Style 2.12 8.08 11.92 6.91 6.81 7.08Barclays Aggregate 0.30 7.71 6.83 6.25 5.80 6.39Barclays Govt/Credit 0.08 8.53 7.09 6.26 5.91 6.42Barclays Govt -1.12 7.89 3.96 6.02 5.54 6.17Barclays Credit 2.04 9.58 12.32 6.91 6.59 6.85Citi Broad Investment Grade 0.24 7.74 6.41 6.44 5.92 6.46Long-Term Quarter Year 3 Years 5 Years 10 Years 15 YearsExtended Maturity Style -0.58 19.36 14.62 9.80 8.77 8.90Barclays Gov/Credit Long -2.12 19.91 12.77 9.03 8.44 8.43Barclays Gov Long -5.57 23.00 7.36 9.31 8.50 8.54Barclays Credit Long 0.80 17.32 17.93 8.52 8.29 8.09Intermediate-Term Quarter Year 3 Years 5 Years 10 Years 15 YearsIntermediate Style 1.17 6.44 7.02 6.35 5.76 6.28Barclays Intermediate Aggregate 0.66 6.16 6.10 5.90 5.42 6.06Barclays Gov/Credit Intermediate 0.61 6.09 5.88 5.67 5.29 5.88Barclays Gov Intermediate -0.38 5.66 3.44 5.46 4.87 5.58Barclays Credit Intermediate 2.50 6.95 10.52 6.38 6.07 6.44Short-Term Quarter Year 3 Years 5 Years 10 Years 15 YearsDefensive Style 0.65 2.25 3.31 3.90 3.78 4.71Active Cash Style 0.79 7.46 7.27 6.58 5.97 6.41Money Market Funds (net of fees) 0.00 0.01 0.03 1.16 1.67 2.71ML Treasury 1–3-Year -0.08 1.44 1.50 3.38 3.24 4.3090-Day Treasury Bills 0.01 0.07 0.13 1.23 1.91 2.94High Yield Quarter Year 3 Years 5 Years 10 Years 15 YearsHigh Yield Style 5.13 6.61 20.90 7.77 9.07 7.72Barclays Corporate High Yield 5.34 6.45 23.87 8.10 9.24 7.20ML High Yield Master 5.05 5.71 23.38 7.74 8.86 7.26Mortgage/Asset-Backed Quarter Year 3 Years 5 Years 10 Years 15 YearsMortgages Style 0.99 6.73 7.62 6.25 5.81 6.56Barclays MBS 0.57 6.21 5.26 6.33 5.65 6.32Barclays ABS 0.83 5.34 9.17 4.25 4.44 5.46Barclays CMBS 3.46 7.48 20.02 7.00 6.58 7.22Municipal Quarter Year 3 Years 5 Years 10 Years 15 YearsBarclays Muni 1.75 12.07 7.70 5.42 5.46 5.72Barclays Muni 1–10-Year 0.53 7.47 5.29 5.30 4.78 5.06Barclays Muni 3-Year 0.76 3.44 3.14 4.26 3.68 4.15*Returns less than one year are not annualized.Sources: Barclays Capital Inc., Callan Associates Inc., Citigroup, Merrill Lynch
U.S. FIXED INCOME | continued
First Quarter 2012 • Capital Market Review | 7
RALLY, WITH A GRAIN OF SALTNON-U.S. EQUITY | Matthew Lai
Spurred on by a positive showing at the end of 2011,
the markets started the new year with a bang.
Investors appeared more optimistic than cautious,
and numerous exchanges and indices across the
globe posted double-digit returns. Developed and
emerging sectors were universally in the black, save
for a marginal detour in the form of EAFE
Telecommunications (-0.47%). Yet the specters of
2011 could not be completely shaken: GDP fore-
casts for the European Union still pointed to a reces-
sion, and the tenuous traction of any sort of recovery
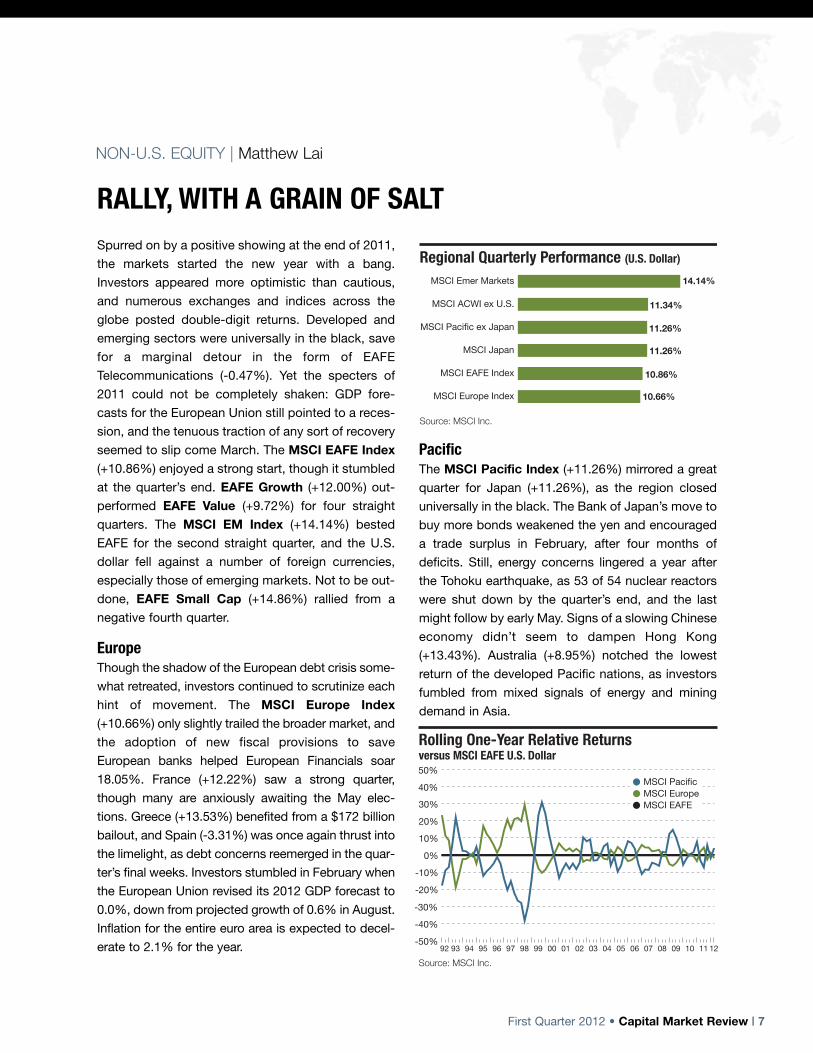
seemed to slip come March. The MSCI EAFE Index(+10.86%) enjoyed a strong start, though it stumbled
at the quarter’s end. EAFE Growth (+12.00%) out-
performed EAFE Value (+9.72%) for four straight
quarters. The MSCI EM Index (+14.14%) bested
EAFE for the second straight quarter, and the U.S.
dollar fell against a number of foreign currencies,
especially those of emerging markets. Not to be out-
done, EAFE Small Cap (+14.86%) rallied from a
negative fourth quarter.
Europe Though the shadow of the European debt crisis some-
what retreated, investors continued to scrutinize each
hint of movement. The MSCI Europe Index(+10.66%) only slightly trailed the broader market, and
the adoption of new fiscal provisions to save
European banks helped European Financials soar
18.05%. France (+12.22%) saw a strong quarter,
though many are anxiously awaiting the May elec-
tions. Greece (+13.53%) benefited from a $172 billion
bailout, and Spain (-3.31%) was once again thrust into
the limelight, as debt concerns reemerged in the quar-
ter’s final weeks. Investors stumbled in February when
the European Union revised its 2012 GDP forecast to
0.0%, down from projected growth of 0.6% in August.
Inflation for the entire euro area is expected to decel-
erate to 2.1% for the year.
PacificThe MSCI Pacific Index (+11.26%) mirrored a great
quarter for Japan (+11.26%), as the region closed
universally in the black. The Bank of Japan’s move to
buy more bonds weakened the yen and encouraged
a trade surplus in February, after four months of
deficits. Still, energy concerns lingered a year after
the Tohoku earthquake, as 53 of 54 nuclear reactors
were shut down by the quarter’s end, and the last
might follow by early May. Signs of a slowing Chinese
economy didn’t seem to dampen Hong Kong
(+13.43%). Australia (+8.95%) notched the lowest
return of the developed Pacific nations, as investors
fumbled from mixed signals of energy and mining
demand in Asia.
MSCI Europe Index
MSCI EAFE Index
MSCI Japan
MSCI Pacific ex Japan
MSCI ACWI ex U.S.
MSCI Emer Markets
Regional Quarterly Performance (U.S. Dollar)14.14%
10.86%
11.34%
11.26%
11.26%
10.66%
Source: MSCI Inc.
02 0392 93 94 95 96 97 98 99 00 01-50%
-40%
-30%
-20%
-10%
0%
10%
20%
30%
40%
50%
04 05 06 07 08 09 10 11 12
MSCI Pacific
MSCI EAFEMSCI Europe
Rolling One-Year Relative Returns versus MSCI EAFE U.S. Dollar
Source: MSCI Inc.
8 | Capital Market Review • First Quarter 2012
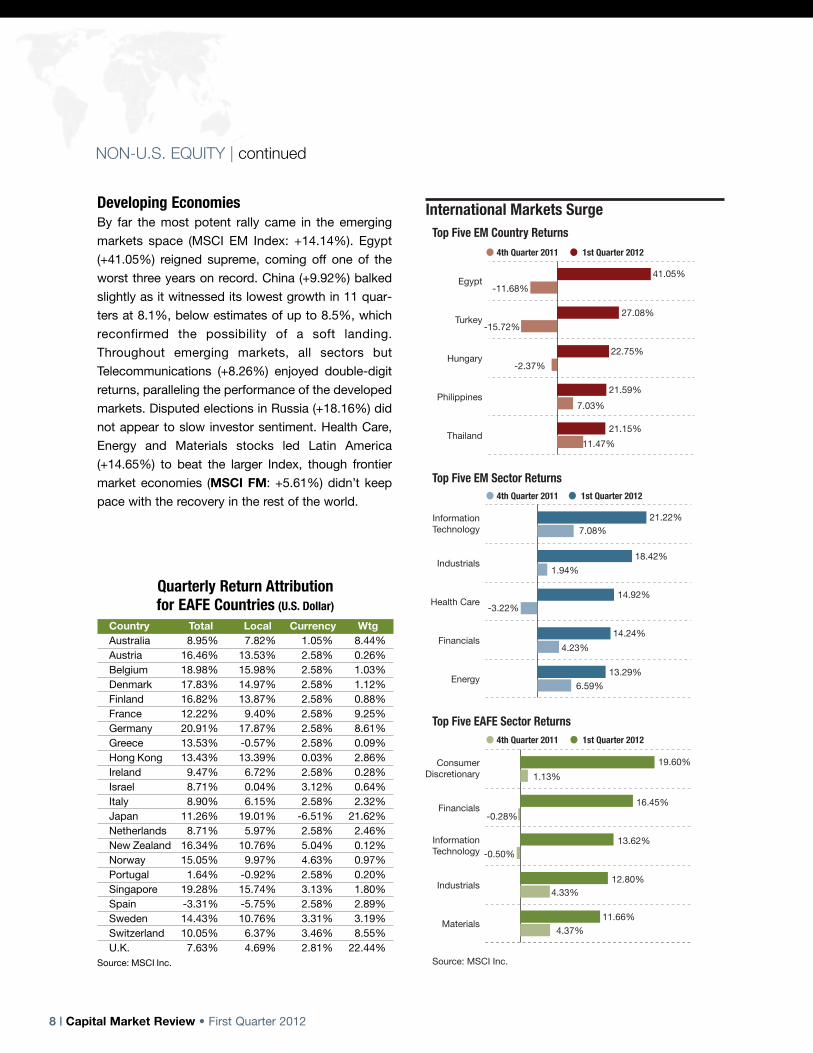
Developing EconomiesBy far the most potent rally came in the emerging
markets space (MSCI EM Index: +14.14%). Egypt
(+41.05%) reigned supreme, coming off one of the
worst three years on record. China (+9.92%) balked
slightly as it witnessed its lowest growth in 11 quar-
ters at 8.1%, below estimates of up to 8.5%, which
reconfirmed the possibility of a soft landing.
Throughout emerging markets, all sectors but
Telecommunications (+8.26%) enjoyed double-digit
returns, paralleling the performance of the developed
markets. Disputed elections in Russia (+18.16%) did
not appear to slow investor sentiment. Health Care,
Energy and Materials stocks led Latin America
(+14.65%) to beat the larger Index, though frontier
market economies (MSCI FM: +5.61%) didn’t keep
pace with the recovery in the rest of the world.
NON-U.S. EQUITY | continued
4th Quarter 2011 1st Quarter 2012
4th Quarter 2011 1st Quarter 2012
4th Quarter 2011 1st Quarter 2012
Top Five EM Country Returns
Top Five EM Sector Returns
Top Five EAFE Sector Returns
International Markets Surge
0.11%
21.22%
1.94%
4.23%
14.24%
14.92%
13.29%
18.42%
7.08%
2.92%
-3.22%
6.59%Energy
Financials
Health Care
Industrials
InformationTechnology
0.11%
19.60%
-0.28%
4.33%12.80%
13.62%
11.66%
16.45%
1.13%
2.92%
-0.50%
4.37%Materials
Industrials
InformationTechnology
Financials
ConsumerDiscretionary
0.11%
41.05%
-15.72%
7.03%
21.59%
22.75%
21.15%
27.08%
-11.68%
-2.37%
11.47%Thailand
Philippines
Hungary
Turkey
Egypt
Source: MSCI Inc.
Quarterly Return Attribution for EAFE Countries (U.S. Dollar)
Country Total Local Currency Wtg Australia 8.95% 7.82% 1.05% 8.44%
Austria 16.46% 13.53% 2.58% 0.26%Belgium 18.98% 15.98% 2.58% 1.03%Denmark 17.83% 14.97% 2.58% 1.12%Finland 16.82% 13.87% 2.58% 0.88%France 12.22% 9.40% 2.58% 9.25%Germany 20.91% 17.87% 2.58% 8.61%Greece 13.53% -0.57% 2.58% 0.09%Hong Kong 13.43% 13.39% 0.03% 2.86%Ireland 9.47% 6.72% 2.58% 0.28%Israel 8.71% 0.04% 3.12% 0.64%Italy 8.90% 6.15% 2.58% 2.32%Japan 11.26% 19.01% -6.51% 21.62%Netherlands 8.71% 5.97% 2.58% 2.46%New Zealand 16.34% 10.76% 5.04% 0.12%Norway 15.05% 9.97% 4.63% 0.97%Portugal 1.64% -0.92% 2.58% 0.20%Singapore 19.28% 15.74% 3.13% 1.80%Spain -3.31% -5.75% 2.58% 2.89%Sweden 14.43% 10.76% 3.31% 3.19%Switzerland 10.05% 6.37% 3.46% 8.55%U.K. 7.63% 4.69% 2.81% 22.44%
Source: MSCI Inc.

First Quarter 2012 • Capital Market Review | 9
-30%-20%-10%
0%10%20%30%40%
50%60%70%80%
Major Currencies’ Cumulative Returns versus U.S. Dollar
02 0392 93 94 95 96 97 98 99 00 01 04 05 06 07 08 09 10 1112
*euro returns from 1Q99
Source: MSCI Inc.
German mark
Japanese yenU.K. sterling
euro*
Callan Style Group Quarterly Returns
Global Eq Non-U.S. Eq Emg Mkts Small Cap Style Style Style Style 10th Percentile 16.20 15.01 16.70 17.91 25th Percentile 14.74 13.19 15.65 16.70 Median 12.83 11.69 13.98 15.66 75th Percentile 11.35 10.66 13.21 13.71 90th Percentile 10.13 9.59 12.29 13.12 MSCI MSCI MSCI MSCI World EAFE Emg Mkts Small Cap Benchmark 11.56 10.86 14.14 14.86
Sources: Callan Associates Inc., MSCI Inc.
5%
10%
15%
20%
Style Median and Index Returns* for Periods ended March 31, 2012International Equity Quarter Year 3 Years 5 Years 10 Years 15 YearsGlobal Style 12.83 0.03 20.30 0.09 6.37 7.06Non-U.S. Style 11.69 -4.64 18.34 -1.76 7.22 6.5Core Style 11.24 -4.64 17.94 -1.95 6.92 6.45MSCI EAFE–Unhedged 10.86 -5.77 17.13 -3.51 5.70 4.22MSCI EAFE–Local 10.22 -4.12 12.08 -5.42 1.45 2.69MSCI EAFE Growth–Unhedged 12.00 -3.71 17.74 -1.89 5.51 3.17MSCI EAFE Value–Unhedged 9.72 -7.83 16.50 -5.18 5.80 5.09MSCI World–Unhedged 11.56 0.56 20.24 -0.70 4.72 4.94MSCI World–Local 11.19 1.45 17.34 -1.79 2.70 4.22MSCI AC World ex U.S.–Unhedged 11.34 -6.75 19.65 -1.11 7.74 5.53MSCI AC World–Unhedged 12.02 -0.19 21.38 0.34 5.86 5.63Pacific Equity Quarter Year 3 Years 5 Years 10 Years 15 YearsPacific Basin Style 11.81 -2.49 20.48 1.42 9.36 4.40Japan Style 11.03 2.61 14.21 -4.54 5.19 1.57Pacific Rim Style 12.78 -6.67 23.97 4.94 13.08 7.30MSCI Pacific–Unhedged 11.27 -2.03 16.57 -2.42 6.41 2.30MSCI Pacific–Local 15.43 -2.75 8.17 -8.45 1.34 -0.29MSCI Japan–Unhedged 11.26 0.26 11.93 -5.20 3.94 0.71MSCI Japan–Local 19.01 -0.45 5.32 -11.80 -0.90 -1.99Europe Equity Quarter Year 3 Years 5 Years 10 Years 15 YearsEurope Style 11.50 -7.00 18.57 -2.61 7.08 7.20MSCI Europe–Unhedged 10.66 -7.54 17.58 -3.99 5.43 5.35MSCI Europe–Local 7.60 -4.49 14.59 -3.56 1.81 4.54Emerging Markets Quarter Year 3 Years 5 Years 10 Years 15 YearsEmerging Markets Style 13.98 -9.43 25.34 4.37 14.85 9.72MSCI EM–Unhedged 14.14 -8.52 25.42 4.97 14.47 7.49MSCI EM–Local 10.76 -3.73 20.10 5.03 12.49 9.71International Small Cap Equity Quarter Year 3 Years 5 Years 10 Years 15 YearsSmall Cap Style 15.66 -3.79 25.91 -0.25 11.68 10.05MSCI EAFE Small Cap–Unhedged 14.86 -6.23 24.12 -2.79 9.92 -
*Returns less than one year are not annualized.Sources: Callan Associates Inc., MSCI Inc.
NON-U.S. EQUITY | continued
10 | Capital Market Review • First Quarter 2012
A GOOD FOUR-LETTER WORD FROM EUROPE: LTROThe European Central Bank’s (ECB) latest rescue
effort proved successful in lowering the yields of the
countries most deeply mired in the European credit
crisis. The newly minted Long-Term Refinancing
Operation (LTRO) consisted of short-term loans to
several hundred lenders across the European mon-
etary union to spur these institutions to purchase
the bonds of struggling European governments.
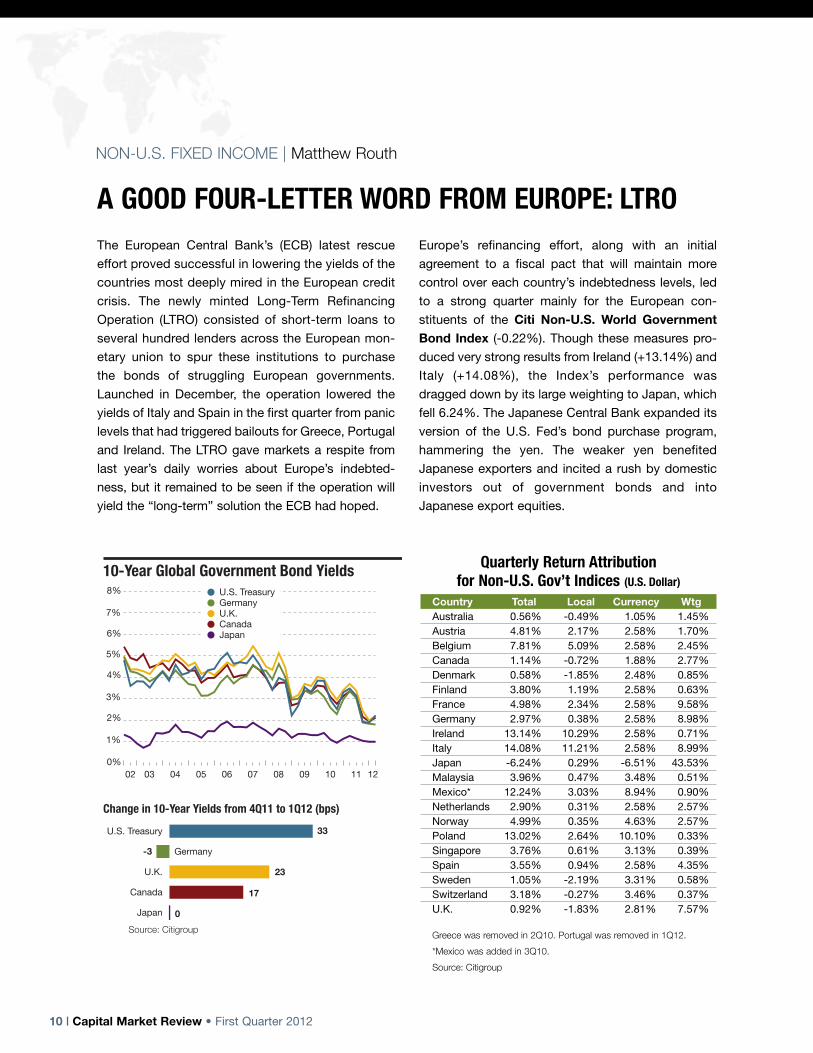
Launched in December, the operation lowered the
yields of Italy and Spain in the first quarter from panic
levels that had triggered bailouts for Greece, Portugal
and Ireland. The LTRO gave markets a respite from
last year’s daily worries about Europe’s indebted-
ness, but it remained to be seen if the operation will
yield the “long-term” solution the ECB had hoped.
Europe’s refinancing effort, along with an initial
agreement to a fiscal pact that will maintain more
control over each country’s indebtedness levels, led
to a strong quarter mainly for the European con-
stituents of the Citi Non-U.S. World GovernmentBond Index (-0.22%). Though these measures pro-
duced very strong results from Ireland (+13.14%) and
Italy (+14.08%), the Index’s performance was
dragged down by its large weighting to Japan, which
fell 6.24%. The Japanese Central Bank expanded its
version of the U.S. Fed’s bond purchase program,
hammering the yen. The weaker yen benefited
Japanese exporters and incited a rush by domestic
investors out of government bonds and into
Japanese export equities.
10-Year Global Government Bond Yields
0%
1%
2%
3%
4%
5%
6%
7%
8%GermanyU.S. Treasury
U.K.CanadaJapan
07 08 09 10 11 120605040302
Change in 10-Year Yields from 4Q11 to 1Q12 (bps)
Japan
Canada
U.K.
Germany
U.S. Treasury 33
-3
23
17
0
Source: Citigroup
NON-U.S. FIXED INCOME | Matthew Routh
Quarterly Return Attribution for Non-U.S. Gov’t Indices (U.S. Dollar)
Country Total Local Currency WtgAustralia 0.56% -0.49% 1.05% 1.45%Austria 4.81% 2.17% 2.58% 1.70%Belgium 7.81% 5.09% 2.58% 2.45%Canada 1.14% -0.72% 1.88% 2.77%Denmark 0.58% -1.85% 2.48% 0.85%Finland 3.80% 1.19% 2.58% 0.63%France 4.98% 2.34% 2.58% 9.58%Germany 2.97% 0.38% 2.58% 8.98%Ireland 13.14% 10.29% 2.58% 0.71%Italy 14.08% 11.21% 2.58% 8.99%Japan -6.24% 0.29% -6.51% 43.53%Malaysia 3.96% 0.47% 3.48% 0.51%Mexico* 12.24% 3.03% 8.94% 0.90%Netherlands 2.90% 0.31% 2.58% 2.57%Norway 4.99% 0.35% 4.63% 2.57%Poland 13.02% 2.64% 10.10% 0.33%Singapore 3.76% 0.61% 3.13% 0.39%Spain 3.55% 0.94% 2.58% 4.35%Sweden 1.05% -2.19% 3.31% 0.58%Switzerland 3.18% -0.27% 3.46% 0.37%U.K. 0.92% -1.83% 2.81% 7.57%
Greece was removed in 2Q10. Portugal was removed in 1Q12.
*Mexico was added in 3Q10.
Source: Citigroup
First Quarter 2012 • Capital Market Review | 11
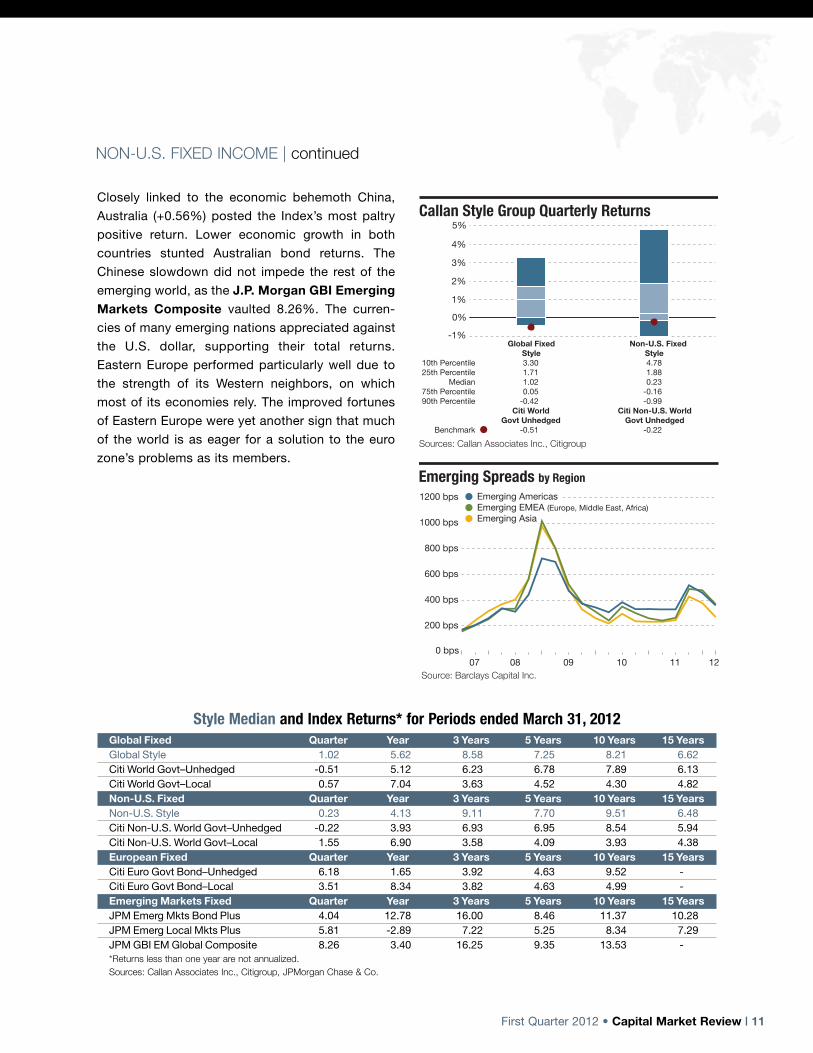
Closely linked to the economic behemoth China,
Australia (+0.56%) posted the Index’s most paltry
positive return. Lower economic growth in both
countries stunted Australian bond returns. The
Chinese slowdown did not impede the rest of the
emerging world, as the J.P. Morgan GBI EmergingMarkets Composite vaulted 8.26%. The curren-
cies of many emerging nations appreciated against
the U.S. dollar, supporting their total returns.
Eastern Europe performed particularly well due to
the strength of its Western neighbors, on which
most of its economies rely. The improved fortunes
of Eastern Europe were yet another sign that much
of the world is as eager for a solution to the euro
zone’s problems as its members.
Callan Style Group Quarterly Returns
Global Fixed Non-U.S. Fixed Style Style 10th Percentile 3.30 4.78 25th Percentile 1.71 1.88 Median 1.02 0.23 75th Percentile 0.05 -0.16 90th Percentile -0.42 -0.99 Citi World Citi Non-U.S. World Govt Unhedged Govt Unhedged Benchmark -0.51 -0.22
Sources: Callan Associates Inc., Citigroup
-1%
0%
1%
2%
3%
4%
5%
0 bps
200 bps
400 bps
600 bps
800 bps
1000 bps
1200 bps
Emerging Spreads by Region
07 08 09 10 11 12
Emerging AmericasEmerging EMEA (Europe, Middle East, Africa)
Source: Barclays Capital Inc.
Emerging Asia
Style Median and Index Returns* for Periods ended March 31, 2012Global Fixed Quarter Year 3 Years 5 Years 10 Years 15 YearsGlobal Style 1.02 5.62 8.58 7.25 8.21 6.62Citi World Govt–Unhedged -0.51 5.12 6.23 6.78 7.89 6.13Citi World Govt–Local 0.57 7.04 3.63 4.52 4.30 4.82Non-U.S. Fixed Quarter Year 3 Years 5 Years 10 Years 15 YearsNon-U.S. Style 0.23 4.13 9.11 7.70 9.51 6.48Citi Non-U.S. World Govt–Unhedged -0.22 3.93 6.93 6.95 8.54 5.94Citi Non-U.S. World Govt–Local 1.55 6.90 3.58 4.09 3.93 4.38European Fixed Quarter Year 3 Years 5 Years 10 Years 15 YearsCiti Euro Govt Bond–Unhedged 6.18 1.65 3.92 4.63 9.52 -Citi Euro Govt Bond–Local 3.51 8.34 3.82 4.63 4.99 -Emerging Markets Fixed Quarter Year 3 Years 5 Years 10 Years 15 YearsJPM Emerg Mkts Bond Plus 4.04 12.78 16.00 8.46 11.37 10.28JPM Emerg Local Mkts Plus 5.81 -2.89 7.22 5.25 8.34 7.29JPM GBI EM Global Composite 8.26 3.40 16.25 9.35 13.53 -*Returns less than one year are not annualized.Sources: Callan Associates Inc., Citigroup, JPMorgan Chase & Co.
NON-U.S. FIXED INCOME | continued

12 | Capital Market Review • First Quarter 2012
REAL ESTATE PUSHES FORWARDDomestic institutional real estate, as measured by the
NCREIF Property Index, advanced 2.59% during the
fourth quarter, as income contributed 1.43% and
appreciation represented 1.15%. Of the property type
sub-indexes, Retail (+2.81%) outperformed while
Hotels (+1.50%) lagged. Regionally, the West led per-
formance with 3.05% while the East (+2.06%) trailed.
NCREIF recorded 84 transactions during the quarter,
representing a transactional capitalization rate of
5.69%. This was only slightly below the rate reached
in the peak real estate years, from third quarter of
2005 to first quarter of 2008.
The FTSE NAREIT Equity Index, a measure of
domestic real estate securities performance, grew
10.79%. The price return totaled 9.84% and the Index
traded at a 3.54% dividend yield as of quarter end.
The Industrial subsector significantly outperformed all
other property sectors, soaring 23.61%. A particular-
ly strong January drove performance, as increasing
confidence in global economic activity matched
growing global trade expectations. The Health Care
(+2.27%) and Self Storage (+6.61%) sectors lagged
their peers.
Globally, the FTSE EPRA/NAREIT Developed REITIndex advanced 12.90%. Developed Asia con-
tributed 16.51% while developed Europe and North
America climbed 12.73% and 10.64%, respectively.
Office assets in Japan contributed to REIT perform-
ance in the Asia/Pacific region, as occupancy levels
increased in Tokyo. However, large developers are
reportedly scouting global real estate due to a lack of
local growth opportunities. Singapore developers
witnessed strong quarterly performance as signifi-
cant demand returned for private homes; however,
an oversupply of office space tempered relative gains
in commercial properties.
In Europe, Simon Property Group announced the
acquisition of a stake in Klépierre, a French shopping
center owner. The acquisition reflects the firm’s new
focus to seek growth globally, with an emphasis on
European markets.
In the first quarter, domestic REITs raised $21.2 bil-
lion across 65 offerings. Secondary equity offerings
comprised just over half of all capital raised, totaling
$10.6 billion. Preferred equity offerings ($4.0 billion)
exceeded total 2011 volume. REITs amassed $6.3
billion of unsecured debt during the quarter. Finally,
domestic commercial mortgage-backed securities’
issuance equaled approximately $6.0 billion.
Health Care
Self Storage
Residential
Diversified
Timber*
Lodging/Resorts
Infrastructure*
Retail
Industrial/Office
NAREIT All Equity Sector Quarterly Performance14.66%
14.56%
14.53%
13.49%
12.01%
11.04%
8.49%
6.61%
2.27%
*Timber replaced Specialty in 4Q10. Infrastructure was added in 1Q12.Source: NAREIT
REAL ESTATE | Jay Nayak
Overall Capitalization RatesSector 1Q12 4Q11 1Q11Apartment 5.04% 5.15% 5.26%Industrial 6.05% 6.08% 6.30%Office 5.42% 5.36% 5.90%Retail 5.91% 6.26% 6.32%Rates based on unleveraged, value-weighted, appraisal capitalization data.Source: NCREIF

First Quarter 2012 • Capital Market Review | 13
Real Estate REIT Global REIT Database Database Database 10th Percentile 4.37 12.20 14.99 25th Percentile 3.31 11.38 13.62 Median 2.62 10.97 12.64 75th Percentile 2.38 10.43 12.11 90th Percentile 1.62 9.86 10.94 NCREIF FTSE NAREIT EPRA/NAREIT Property Equity Developed Benchmark 2.59 10.79 12.90
Callan Style Group Quarterly Returns
Sources: Callan Associates Inc., NAREIT, NCREIF, The FTSE Group
0%
3%
6%
9%
12%
15%
REAL ESTATE | continued
Style Median and Index Returns* for Periods ended March 31, 2012Private Real Estate Quarter Year 3 Years 5 Years 10 Years 15 YearsReal Estate Database (net of fees) 2.62 13.96 3.35 -1.41 5.95 8.14NCREIF Property** 2.59 13.41 5.96 2.88 8.17 9.43Public Real Estate Quarter Year 3 Years 5 Years 10 Years 15 YearsREIT Database 10.97 14.07 43.30 0.84 11.59 11.49FTSE NAREIT Equity 10.79 12.83 42.34 -0.06 10.46 9.61Global Real Estate Quarter Year 3 Years 5 Years 10 Years 15 YearsREIT Global Database 12.64 4.00 30.68 -3.02 11.02 -FTSE EPRA/NAREIT Developed 12.90 3.19 31.46 -4.12 10.35 7.40*Returns less than one year are not annualized.**Represents data available as of publication date.All REIT returns are reported gross in USD. Sources: Callan Associates Inc., NAREIT, NCREIF, The FTSE Group
Rolling One-Year Returns
-60%
-40%
-20%
0%
20%
40%
60%
80%
100%
120%
REIT DatabaseGlobal REIT Database*
Real Estate Database
02 039594 96 97 98 99 00 01 04 05 06 07 08 09 10 11 12
*Global REIT returns from 2Q04Source: Callan Associates Inc.
NCREIF Property IndexQuarterly Returns by Property Type
Hotels
Office
Industrial
Apartments
Retail
1.50%
2.34%
2.70%
2.79%
2.81%
Quarterly Returns by Region
2.06%
2.52%
2.72%
3.05%
Source: NCREIF
East
Midwest
South
West
14 | Capital Market Review • First Quarter 2012
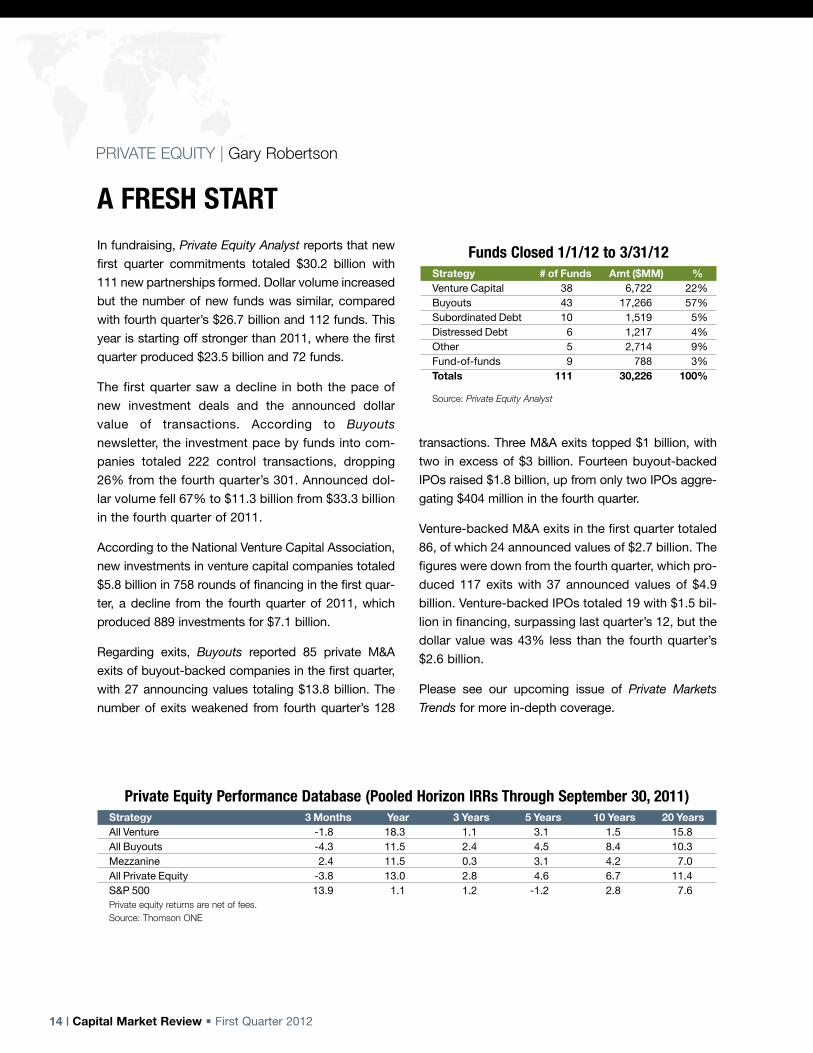
A FRESH START In fundraising, Private Equity Analyst reports that new
first quarter commitments totaled $30.2 billion with
111 new partnerships formed. Dollar volume increased
but the number of new funds was similar, compared
with fourth quarter’s $26.7 billion and 112 funds. This
year is starting off stronger than 2011, where the first
quarter produced $23.5 billion and 72 funds.
The first quarter saw a decline in both the pace of
new investment deals and the announced dollar
value of transactions. According to Buyouts
newsletter, the investment pace by funds into com-
panies totaled 222 control transactions, dropping
26% from the fourth quarter’s 301. Announced dol-
lar volume fell 67% to $11.3 billion from $33.3 billion
in the fourth quarter of 2011.
According to the National Venture Capital Association,
new investments in venture capital companies totaled
$5.8 billion in 758 rounds of financing in the first quar-
ter, a decline from the fourth quarter of 2011, which
produced 889 investments for $7.1 billion.
Regarding exits, Buyouts reported 85 private M&A
exits of buyout-backed companies in the first quarter,
with 27 announcing values totaling $13.8 billion. The
number of exits weakened from fourth quarter’s 128
transactions. Three M&A exits topped $1 billion, with
two in excess of $3 billion. Fourteen buyout-backed
IPOs raised $1.8 billion, up from only two IPOs aggre-
gating $404 million in the fourth quarter.
Venture-backed M&A exits in the first quarter totaled
86, of which 24 announced values of $2.7 billion. The
figures were down from the fourth quarter, which pro-
duced 117 exits with 37 announced values of $4.9
billion. Venture-backed IPOs totaled 19 with $1.5 bil-
lion in financing, surpassing last quarter’s 12, but the
dollar value was 43% less than the fourth quarter’s
$2.6 billion.
Please see our upcoming issue of Private Markets
Trends for more in-depth coverage.
PRIVATE EQUITY | Gary Robertson
Private Equity Performance Database (Pooled Horizon IRRs Through September 30, 2011)Strategy 3 Months Year 3 Years 5 Years 10 Years 20 YearsAll Venture -1.8 18.3 1.1 3.1 1.5 15.8All Buyouts -4.3 11.5 2.4 4.5 8.4 10.3 Mezzanine 2.4 11.5 0.3 3.1 4.2 7.0 All Private Equity -3.8 13.0 2.8 4.6 6.7 11.4 S&P 500 13.9 1.1 1.2 -1.2 2.8 7.6 Private equity returns are net of fees. Source: Thomson ONE
Funds Closed 1/1/12 to 3/31/12Strategy # of Funds Amt ($MM) %Venture Capital 38 6,722 22%Buyouts 43 17,266 57%Subordinated Debt 10 1,519 5%Distressed Debt 6 1,217 4%Other 5 2,714 9%Fund-of-funds 9 788 3%Totals 111 30,226 100%
Source: Private Equity Analyst
First Quarter 2012 • Capital Market Review | 15
ALPHA ABLE, BETA BETTERHEDGE FUNDS | Jim McKee
In the first quarter, the European Central Bank provid-
ed further financial aid to beleaguered European
banks with its Long-Term Refinancing Operation. This
huge capital infusion reduced short-term risks of bank
failures and sovereign credits in peripheral euro coun-
tries. The risk trade was on, notwithstanding the euro
community’s longer-term solvency challenge. In the
first quarter, the MSCI ACWI jumped 12.02% while
Barclays Corporate High Yield gained 5.34%.
Amid this positive but still guarded global outlook,
equities and credits also traded more on underlying
fundamentals with less market volatility. Reflecting
raw hedge fund performance without implementation
costs, the Dow Jones Credit Suisse Hedge FundIndex (DJCS HFI) gained 4.04% in the first quarter.
Representing actual hedge fund portfolios, the medi-
an manager in the Callan Hedge Fund-of-FundsDatabase gained 3.69%, net of fees.
Within the DJCS HFI, the quarter’s leading strategy
was Long-Short Equity (+7.19%), boosted by rising
markets. While fundamentals helped relative value
strategies, gains were more modest in Convertible
Arb (+4.86%), Fixed Income Arb (+2.94%) and Equity
Market Neutral (+1.35%).
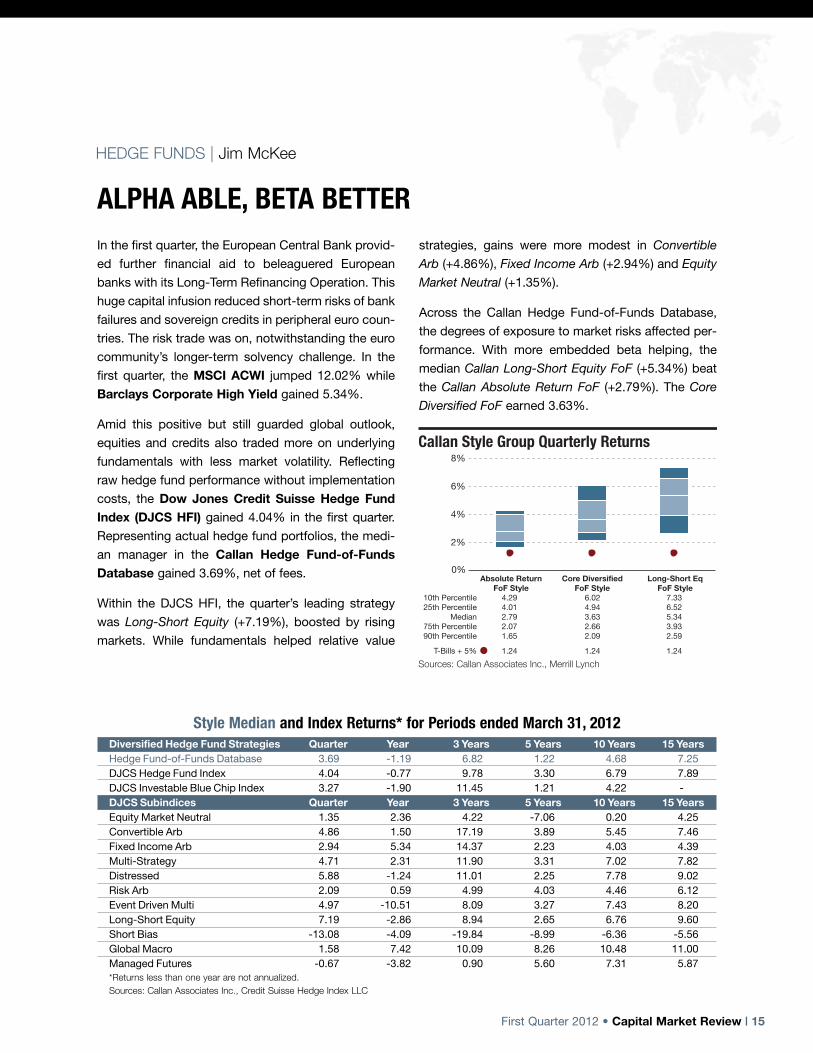
Across the Callan Hedge Fund-of-Funds Database,
the degrees of exposure to market risks affected per-
formance. With more embedded beta helping, the
median Callan Long-Short Equity FoF (+5.34%) beat
the Callan Absolute Return FoF (+2.79%). The Core
Diversified FoF earned 3.63%.
Absolute Return Core Diversified Long-Short Eq FoF Style FoF Style FoF Style 10th Percentile 4.29 6.02 7.33 25th Percentile 4.01 4.94 6.52 Median 2.79 3.63 5.34 75th Percentile 2.07 2.66 3.93 90th Percentile 1.65 2.09 2.59
T-Bills + 5% 1.24 1.24 1.24
Callan Style Group Quarterly Returns
Sources: Callan Associates Inc., Merrill Lynch
0%
2%
4%
6%
8%
Style Median and Index Returns* for Periods ended March 31, 2012Diversified Hedge Fund Strategies Quarter Year 3 Years 5 Years 10 Years 15 YearsHedge Fund-of-Funds Database 3.69 -1.19 6.82 1.22 4.68 7.25DJCS Hedge Fund Index 4.04 -0.77 9.78 3.30 6.79 7.89DJCS Investable Blue Chip Index 3.27 -1.90 11.45 1.21 4.22 -DJCS Subindices Quarter Year 3 Years 5 Years 10 Years 15 YearsEquity Market Neutral 1.35 2.36 4.22 -7.06 0.20 4.25Convertible Arb 4.86 1.50 17.19 3.89 5.45 7.46Fixed Income Arb 2.94 5.34 14.37 2.23 4.03 4.39Multi-Strategy 4.71 2.31 11.90 3.31 7.02 7.82Distressed 5.88 -1.24 11.01 2.25 7.78 9.02Risk Arb 2.09 0.59 4.99 4.03 4.46 6.12Event Driven Multi 4.97 -10.51 8.09 3.27 7.43 8.20Long-Short Equity 7.19 -2.86 8.94 2.65 6.76 9.60Short Bias -13.08 -4.09 -19.84 -8.99 -6.36 -5.56Global Macro 1.58 7.42 10.09 8.26 10.48 11.00Managed Futures -0.67 -3.82 0.90 5.60 7.31 5.87*Returns less than one year are not annualized.Sources: Callan Associates Inc., Credit Suisse Hedge Index LLC

16 | Capital Market Review • First Quarter 2012
TWO PERCENT IS THE NEW THREE PERCENTThe U.S. economy grew at a 2.2% annual rate in the
first quarter of 2012, slower than the 3.0% achieved
in the fourth quarter of 2011, but exactly in line with
expectations. The current recovery is now two years
old, almost mature when compared to the typical
recovery cycle enjoyed over the last 65 years. Yet the
tenor of this expansion remains one of weakness—
weak job growth, weak consumption growth, a weak
housing market, a weak global economy and weak
expectations for the future, both short and long term.
Economists often speak of trend real GDP growth, a
mean to which the U.S. economy reverts over time.
Research suggests this mean has held up over the
past 30 to 40 years at north of 3% per year. Since the
onset of the financial crisis in 2007, many economists
have revised their expectations for “long term full
employment real GDP potential growth” down a full
percentage point, to just above 2%, at least for the
next five to 10 years. Aging demographics, declining
productivity, pressures on continuing profitability and
the maturity of the developed markets’ economies
are cited as the reasons for the downgraded expec-
tations, along with the extended hangover from the
financial crisis and the Great Recession of 2008-
2009. Trend real GDP growth settling in at 2%, rather
than climbing back to 3%, has potentially serious
implications for each of the remaining sluggish seg-
ments of the economy—spending, jobs, housing—
and for interest rates and return expectations for the
capital markets.
Personal consumption expenditures drove growth in
the first quarter of 2012, particularly spending on
durable goods, which increased 15.3%. Spending
on motor vehicles and parts contributed approxi-
mately one-third to total GDP growth. Imports and
exports both surged, essentially cancelling out their
respective impact on GDP. One other area of
strength was spending on residential housing, which
rose 19.1% and contributed 0.4% to the quarter’s
total 2.2% GDP growth. The slowdown in GDP
growth from the fourth quarter’s 3.0% was in large
part due to a pullback in inventory accumulation,
which had accounted for 1.8% of the fourth quarter
GDP. The other segments dragging down expansion
in the first quarter were federal, state and local gov-
ernment, which together subtracted 0.6% from GDP.
The deceleration in GDP was completely expected
by both economic forecasters and the capital mar-
kets, although the result turned out to be a bit more
positive than expected after the weak March
employment report came out. The job market, which
cranked out monthly gains averaging close to
250,000 net new jobs in December, January and
February, reported just 120,000 in March, close to
the replacement rate but not much more. The job
market may have inched ahead of the underlying
indicators of aggregate demand, fueled in part by a
sharp rise in confidence—no doubt egged on by the
U.S. ECONOMY | Jay Kloepfer
Inflation Year-Over-Year
-15%
-10%
-5%
0%
5%
10%
15%
20%
PPI (All Commodities)CPI (All Urban Consumers)
02 0391 92 93 94 95 96 97 98 99 00 01 04 05 06 07 08 09 10 11 12
Source: Bureau of Labor Statistics
First Quarter 2012 • Capital Market Review | 17
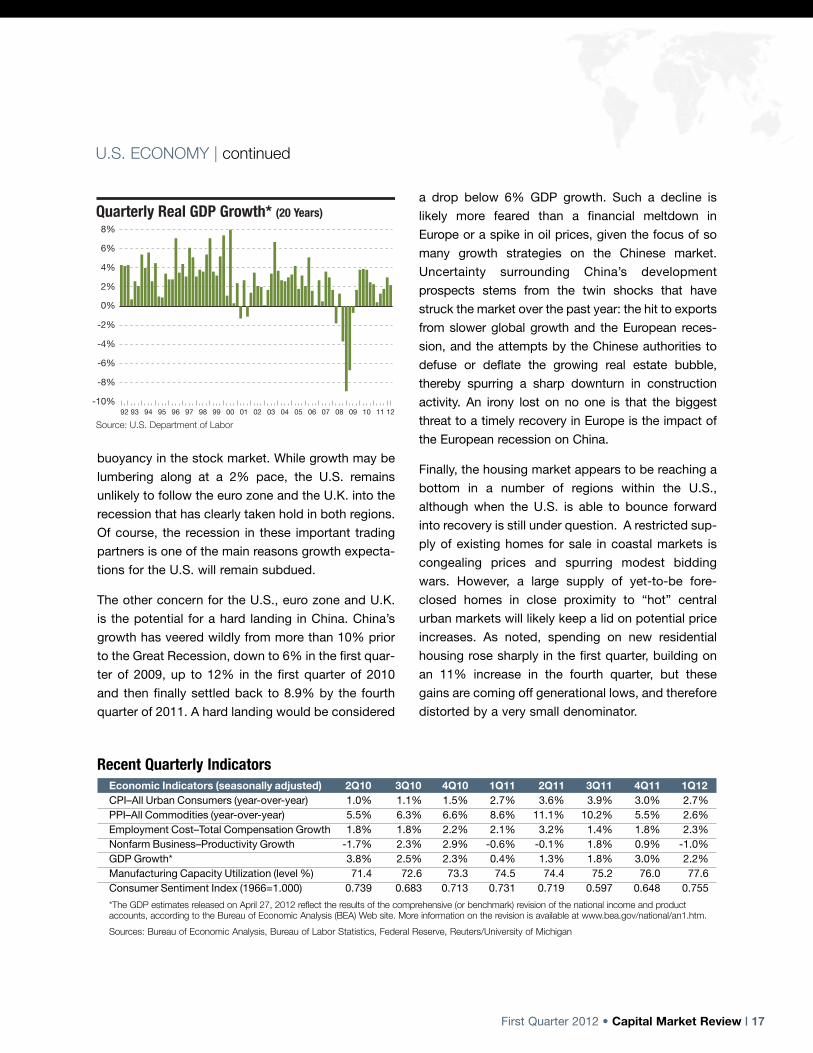
buoyancy in the stock market. While growth may be
lumbering along at a 2% pace, the U.S. remains
unlikely to follow the euro zone and the U.K. into the
recession that has clearly taken hold in both regions.
Of course, the recession in these important trading
partners is one of the main reasons growth expecta-
tions for the U.S. will remain subdued.
The other concern for the U.S., euro zone and U.K.
is the potential for a hard landing in China. China’s
growth has veered wildly from more than 10% prior
to the Great Recession, down to 6% in the first quar-
ter of 2009, up to 12% in the first quarter of 2010
and then finally settled back to 8.9% by the fourth
quarter of 2011. A hard landing would be considered
a drop below 6% GDP growth. Such a decline is
likely more feared than a financial meltdown in
Europe or a spike in oil prices, given the focus of so
many growth strategies on the Chinese market.
Uncertainty surrounding China’s development
prospects stems from the twin shocks that have
struck the market over the past year: the hit to exports
from slower global growth and the European reces-
sion, and the attempts by the Chinese authorities to
defuse or deflate the growing real estate bubble,
thereby spurring a sharp downturn in construction
activity. An irony lost on no one is that the biggest
threat to a timely recovery in Europe is the impact of
the European recession on China.
Finally, the housing market appears to be reaching a
bottom in a number of regions within the U.S.,
although when the U.S. is able to bounce forward
into recovery is still under question. A restricted sup-
ply of existing homes for sale in coastal markets is
congealing prices and spurring modest bidding
wars. However, a large supply of yet-to-be fore-
closed homes in close proximity to “hot” central
urban markets will likely keep a lid on potential price
increases. As noted, spending on new residential
housing rose sharply in the first quarter, building on
an 11% increase in the fourth quarter, but these
gains are coming off generational lows, and therefore
distorted by a very small denominator.
U.S. ECONOMY | continued
Recent Quarterly IndicatorsEconomic Indicators (seasonally adjusted) 2Q10 3Q10 4Q10 1Q11 2Q11 3Q11 4Q11 1Q12CPI–All Urban Consumers (year-over-year) 1.0% 1.1% 1.5% 2.7% 3.6% 3.9% 3.0% 2.7%PPI–All Commodities (year-over-year) 5.5% 6.3% 6.6% 8.6% 11.1% 10.2% 5.5% 2.6%Employment Cost–Total Compensation Growth 1.8% 1.8% 2.2% 2.1% 3.2% 1.4% 1.8% 2.3%Nonfarm Business–Productivity Growth -1.7% 2.3% 2.9% -0.6% -0.1% 1.8% 0.9% -1.0%GDP Growth* 3.8% 2.5% 2.3% 0.4% 1.3% 1.8% 3.0% 2.2%Manufacturing Capacity Utilization (level %) 71.4 72.6 73.3 74.5 74.4 75.2 76.0 77.6Consumer Sentiment Index (1966=1.000) 0.739 0.683 0.713 0.731 0.719 0.597 0.648 0.755
*The GDP estimates released on April 27, 2012 reflect the results of the comprehensive (or benchmark) revision of the national income and productaccounts, according to the Bureau of Economic Analysis (BEA) Web site. More information on the revision is available at www.bea.gov/national/an1.htm.
Sources: Bureau of Economic Analysis, Bureau of Labor Statistics, Federal Reserve, Reuters/University of Michigan
Quarterly Real GDP Growth* (20 Years)
02 0392 93 94 95 96 97 98 99 00 01 04 05 06 07 08 09 10 11 12-10%
-8%
-6%
-4%
-2%
0%
2%
4%
6%
8%
Source: U.S. Department of Labor

18 | Capital Market Review • First Quarter 2012
STARTED STRONG BUT FOR HOW LONG?DIVERSIFIED ACCOUNTS | Connie Lee, CFA
Domestic and foreign equity markets offered
investors steadily climbing returns to end the first
quarter with double-digit gains (Russell 3000:
+12.87%, MSCI ACWI ex U.S.: +11.34%). The U.S.
recovery continued along its positive, though grad-
ual, path while jarring headlines from abroad were
minimal, tempering market volatility. The European
Central Bank’s Long-Term Refinancing Operation,
which introduced $640 billion in loans in December
and an additional $713 billion in February, helped
carry forward the positive momentum from the previ-
ous quarter. Investors gravitated toward riskier
assets, which muted fixed income markets. Largely
weighed down by the U.S. Treasury sector, the
Barclays U.S. Aggregate Index eked out 0.30%.
Abroad, the Citi Non-U.S. World Government BondIndex lost 0.22%.
Using the median manager returns from the current
quarter and ending asset allocations from the prior
quarter, Callan estimates the recent total returns of
the institutional investor community.
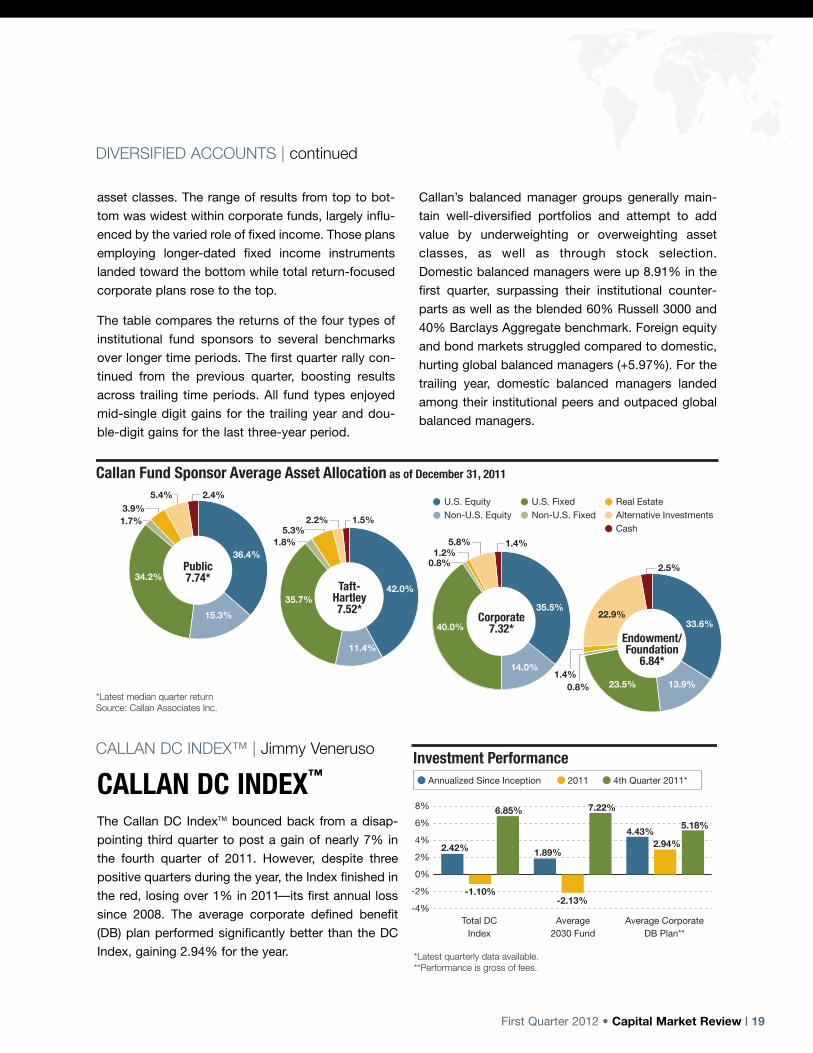
The Callan Fund Sponsor Returns chart—illustrating
the range of performance for public, corporate and
Taft-Hartley pension funds, as well as endowments
and foundations—reveals strong gains across the
board. The range of median returns by fund type
was narrow with public funds (+7.74%) claiming a
marginal lead while endowments/foundations
(+6.84%) were the laggards for the second consecu-
tive quarter. Taft-Hartley and corporate funds landed
in between, advancing 7.52% and 7.32%, respec-
tively. Results were also fairly clustered among top
performing funds, as illustrated by the range of 10th
percentile returns (+8.74% to +9.58%). Differences
along the bottom percentile were more pronounced
(+3.34% to +5.71%).
Asset allocation decisions help explain the differ-
ence in performance. Public and Taft-Hartley funds
held slightly higher allocations to public equity mar-
kets, allowing them to edge out their institutional
peers, as equity markets surged past most other
0%
2%
4%
6%
8%
10%Callan Fund Sponsor Quarterly Returns
Public Corporate Endow/Fndn Taft-Hartley Database Database Database Database 10th Percentile 9.38 9.42 9.58 8.74 25th Percentile 8.59 8.53 8.35 8.13 Median 7.74 7.32 6.84 7.52 75th Percentile 6.92 5.07 5.36 6.64 90th Percentile 4.18 3.34 4.04 5.71
Source: Callan Associates Inc.
Style Median and Index Returns* for Periods ended March 31, 2012Fund Sponsor Quarter Year 3 Years 5 Years 10 Years 15 YearsPublic Database 7.74 4.41 16.23 3.20 6.03 7.09Corporate Database 7.32 5.67 17.14 3.65 6.30 7.44Endowments/Foundations Database 6.84 3.53 14.60 2.99 6.05 7.17Taft-Hartley Database 7.52 5.12 15.42 2.94 5.41 6.41Diversified Manager Quarter Year 3 Years 5 Years 10 Years 15 YearsAsset Allocator Style 11.66 3.58 21.69 1.85 5.66 6.59Domestic Balanced Database 8.91 3.99 18.72 3.39 5.64 7.18Global Balanced Database 5.97 2.59 14.63 2.21 7.64 7.3160% Russell 3000 + 40% Barclays Agg 7.84 8.26 17.69 4.51 5.67 7.0160% MSCI World + 40% Barclays Glbl Agg 7.29 3.06 15.53 2.73 6.29 5.95*Returns less than one year are not annualized.Sources: Callan Associates Inc., Barclays Capital Inc., MSCI Inc., Russell Investment Group
First Quarter 2012 • Capital Market Review | 19
DIVERSIFIED ACCOUNTS | continued
asset classes. The range of results from top to bot-
tom was widest within corporate funds, largely influ-
enced by the varied role of fixed income. Those plans
employing longer-dated fixed income instruments
landed toward the bottom while total return-focused
corporate plans rose to the top.
The table compares the returns of the four types of
institutional fund sponsors to several benchmarks
over longer time periods. The first quarter rally con-
tinued from the previous quarter, boosting results
across trailing time periods. All fund types enjoyed
mid-single digit gains for the trailing year and dou-
ble-digit gains for the last three-year period.
Callan’s balanced manager groups generally main-
tain well-diversified portfolios and attempt to add
value by underweighting or overweighting asset
classes, as well as through stock selection.
Domestic balanced managers were up 8.91% in the
first quarter, surpassing their institutional counter-
parts as well as the blended 60% Russell 3000 and
40% Barclays Aggregate benchmark. Foreign equity
and bond markets struggled compared to domestic,
hurting global balanced managers (+5.97%). For the
trailing year, domestic balanced managers landed
among their institutional peers and outpaced global
balanced managers.
Callan Fund Sponsor Average Asset Allocation as of December 31, 2011
*Latest median quarter returnSource: Callan Associates Inc.
U.S. EquityNon-U.S. Equity
U.S. FixedNon-U.S. Fixed
Real EstateAlternative InvestmentsCash
Endowment/Foundation
6.84*
33.6%
13.9%23.5%0.8%1.4%
22.9%
2.5%
Taft-Hartley7.52*
42.0%
11.4%
35.7%
1.8%5.3%
2.2% 1.5%
Public7.74*
15.3%
1.7%3.9%
5.4% 2.4%
36.4%
34.2%
Corporate7.32*
0.8%1.2%
5.8% 1.4%
35.5%
40.0%
14.0%
CALLAN DC INDEX™CALLAN DC INDEX™ | Jimmy Veneruso
*Latest quarterly data available.**Performance is gross of fees.
-4%
-2%
0%
2%
4%
6%
8%
Investment Performance
7.22%
2011Annualized Since Inception 4th Quarter 2011*
2.42% 1.89%
-2.13%
4.43%2.94%
6.85%
-1.10%
5.18%
Total DCIndex
Average2030 Fund
Average CorporateDB Plan**
The Callan DC IndexTM bounced back from a disap-
pointing third quarter to post a gain of nearly 7% in
the fourth quarter of 2011. However, despite three
positive quarters during the year, the Index finished in
the red, losing over 1% in 2011—its first annual loss
since 2008. The average corporate defined benefit
(DB) plan performed significantly better than the DC
Index, gaining 2.94% for the year.
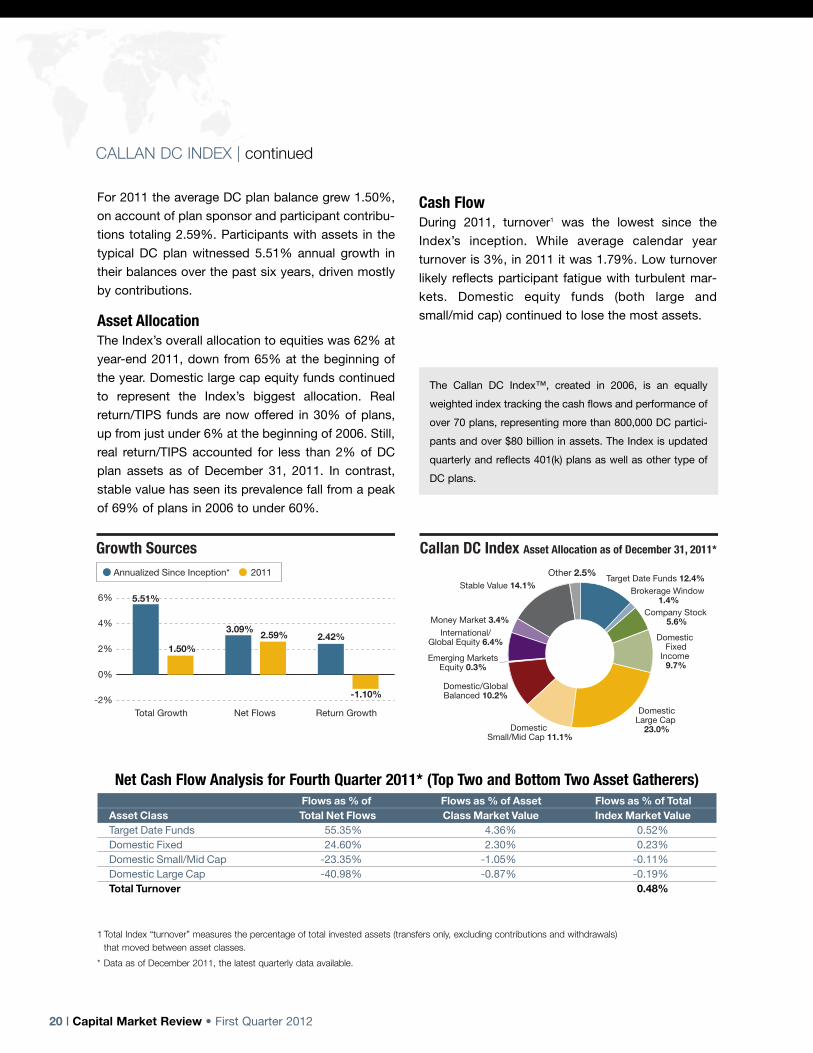
For 2011 the average DC plan balance grew 1.50%,
on account of plan sponsor and participant contribu-
tions totaling 2.59%. Participants with assets in the
typical DC plan witnessed 5.51% annual growth in
their balances over the past six years, driven mostly
by contributions.
Asset AllocationThe Index’s overall allocation to equities was 62% at
year-end 2011, down from 65% at the beginning of
the year. Domestic large cap equity funds continued
to represent the Index’s biggest allocation. Real
return/TIPS funds are now offered in 30% of plans,
up from just under 6% at the beginning of 2006. Still,
real return/TIPS accounted for less than 2% of DC
plan assets as of December 31, 2011. In contrast,
stable value has seen its prevalence fall from a peak
of 69% of plans in 2006 to under 60%.
Cash FlowDuring 2011, turnover1 was the lowest since the
Index’s inception. While average calendar year
turnover is 3%, in 2011 it was 1.79%. Low turnover
likely reflects participant fatigue with turbulent mar-
kets. Domestic equity funds (both large and
small/mid cap) continued to lose the most assets.
20 | Capital Market Review • First Quarter 2012
CALLAN DC INDEX | continued
Net Cash Flow Analysis for Fourth Quarter 2011* (Top Two and Bottom Two Asset Gatherers)Flows as % of Flows as % of Asset Flows as % of Total
Asset Class Total Net Flows Class Market Value Index Market ValueTarget Date Funds 55.35% 4.36% 0.52%Domestic Fixed 24.60% 2.30% 0.23%Domestic Small/Mid Cap -23.35% -1.05% -0.11%Domestic Large Cap -40.98% -0.87% -0.19%Total Turnover 0.48%
Growth Sources
3.09%2.59% 2.42%
-1.10%
5.51%
1.50%
-2%
0%
2%
4%
6%
Total Growth Net Flows Return Growth
Annualized Since Inception* 2011
Callan DC Index Asset Allocation as of December 31, 2011*
Other 2.5%Target Date Funds 12.4%
Brokerage Window 1.4%
Company Stock 5.6%
Domestic Fixed
Income 9.7%
DomesticLarge Cap
23.0%Domestic Small/Mid Cap 11.1%
Domestic/GlobalBalanced 10.2%
Emerging MarketsEquity 0.3%
International/Global Equity 6.4%
Money Market 3.4%
Stable Value 14.1%
The Callan DC Index™, created in 2006, is an equally
weighted index tracking the cash flows and performance of
over 70 plans, representing more than 800,000 DC partici-
pants and over $80 billion in assets. The Index is updated
quarterly and reflects 401(k) plans as well as other type of
DC plans.
1 Total Index “turnover” measures the percentage of total invested assets (transfers only, excluding contributions and withdrawals)that moved between asset classes.
* Data as of December 2011, the latest quarterly data available.

CERTAIN INFORMATION HEREIN HAS BEEN COMPILED BY CALLAN AND IS BASED ON INFORMATION PROVIDED BY A
VARIETY OF SOURCES BELIEVED TO BE RELIABLE FOR WHICH CALLAN HAS NOT NECESSARILY VERIFIED THE
ACCURACY OR COMPLETENESS OF OR UPDATED. THIS REPORT IS FOR INFORMATIONAL PURPOSES ONLY AND
SHOULD NOT BE CONSTRUED AS LEGAL OR TAX ADVICE ON ANY MATTER. ANY INVESTMENT DECISION YOU MAKE
ON THE BASIS OF THIS REPORT IS YOUR SOLE RESPONSIBILITY. YOU SHOULD CONSULT WITH LEGAL AND TAX
ADVISERS BEFORE APPLYING ANY OF THIS INFORMATION TO YOUR PARTICULAR SITUATION. REFERENCE IN THIS
REPORT TO ANY PRODUCT, SERVICE OR ENTITY SHOULD NOT BE CONSTRUED AS A RECOMMENDATION, APPROVAL,
AFFILIATION OR ENDORSEMENT OF SUCH PRODUCT, SERVICE OR ENTITY BY CALLAN. PAST PERFORMANCE IS NO
GUARANTEE OF FUTURE RESULTS. THIS REPORT MAY CONSIST OF STATEMENTS OF OPINION, WHICH ARE MADE AS
OF THE DATE THEY ARE EXPRESSED AND ARE NOT STATEMENTS OF FACT.
THE CALLAN INVESTMENTS INSTITUTE (THE “INSTITUTE”) IS, AND WILL BE, THE SOLE OWNER AND COPYRIGHT
HOLDER OF ALL MATERIAL PREPARED OR DEVELOPED BY THE INSTITUTE. NO PARTY HAS THE RIGHT TO
REPRODUCE, REVISE, RESELL, DISSEMINATE EXTERNALLY, DISSEMINATE TO SUBSIDIARIES OR PARENTS, OR POST
ON INTERNAL WEB SITES ANY PART OF ANY MATERIAL PREPARED OR DEVELOPED BY THE INSTITUTE, WITHOUT THE
INSTITUTE’S PERMISSION. INSTITUTE CLIENTS ONLY HAVE THE RIGHT TO UTILIZE SUCH MATERIAL INTERNALLY IN
THEIR BUSINESS.
© 2012 CALLAN ASSOCIATES INC.

Callan Associates
Corporate Headquarters101 California Street
Suite 3500San Francisco, CA 94111
1.800.227.32881.415.974.5060
Regional Consulting Offices
Atlanta300 Galleria Parkway
Suite 950Atlanta, GA 30339
1.800.522.97821.770.618.2140
Chicago120 N. LaSalle Street
Suite 2100Chicago, IL 60602
1.800.999.35361.312.346.3536
Denver1660 Wynkoop Street
Suite 950Denver, CO 80202
1.303.861.1900
New Jersey200 Park Avenue
Suite 230Florham Park, NJ 07932
1.800.274.58781.973.593.8050
www.callan.com