california demonstration project: pavement … demonstration project: pavement replacement using a...
TRANSCRIPT

i
California Demonstration Project: Pavement Replacement Using a Precast Concrete Pavement System on I-15 in Ontario
Final Report June 2013

FOREWORD The purpose of the Highways for LIFE (HfL) pilot program is to accelerate the use of innovations that improve highway safety and quality while reducing congestion caused by construction. LIFE is an acronym for Longer-lasting highway infrastructure using Innovations to accomplish the Fast construction of Efficient and safe highways and bridges. Specifically, HfL focuses on speeding up the widespread adoption of proven innovations in the highway community. Such innovations encompass technologies, materials, tools, equipment, procedures, specifications, methodologies, processes, and practices used to finance, design, or construct highways. HfL is based on the recognition that innovations are available that, if widely and rapidly implemented, would result in significant benefits to road users and highway agencies. Although innovations themselves are important, HfL is as much about changing the highway community’s culture from one that considers innovation something that only adds to the workload, delays projects, raises costs, or increases risk to one that sees it as an opportunity to provide better highway transportation service. HfL is also an effort to change the way highway community decisionmakers and participants perceive their jobs and the service they provide. The HfL pilot program, described in Safe, Accountable, Flexible, Efficient Transportation Equity Act: A Legacy for Users (SAFETEA-LU) Section 1502, includes funding for demonstration construction projects. By providing incentives for projects, HfL promotes improvements in safety, construction-related congestion, and quality that can be achieved through the use of performance goals and innovations. This report documents one such HfL demonstration project. Additional information on the HfL program is at www.fhwa.dot.gov/hfl.
NOTICE
This document is disseminated under the sponsorship of the U.S. Department of Transportation in the interest of information exchange. The U.S. Government assumes no liability for its contents or use thereof. This report does not constitute a standard, specification, or regulation. The U.S. Government does not endorse products or manufacturers. Trade and manufacturers’ names appear in this report only because they are considered essential to the object of the document.

ii
1. Report No. 2. Government Accession No
3. Recipient’s Catalog No
3. Title and Subtitle California Demonstration Project: Pavement Replacement Using a Precast Pavement System on I-15 in Ontario
5. Report Date June 2013 6. Performing Organization Code
7. Authors Chetana Rao, Ph.D., Paul Littleton, P.E., Suri Sadasivam, Ph.D., and Gerry Ullman
8. Performing Organization Report No.
9. Performing Organization Name and Address Applied Research Associates, Inc. 100 Trade Centre Drive, Suite 200 Champaign, IL 61820
10. Work Unit No. (TRAIS) C6B 11. Contract or Grant No.
12. Sponsoring Agency Name and Address Office of Infrastructure Federal Highway Administration 1200 New Jersey Avenue, SE Washington, DC 20590
13. Type of Report and Period Covered Draft Report November 2011–May 2012
14. Sponsoring Agency Code
15. Supplementary Notes Contracting Officers Technical Representatives: Byron Lord, Mary Huie 16. Abstract As part of a national initiative sponsored by the Federal Highway Administration under the Highways for LIFE program, the California Department of Transportation was awarded a $5 million grant to showcase and demonstrate the use of precast concrete pavement system (PCPS) technology for the replacement of concrete slabs on Interstate 15 in Ontario, CA. The project involved the rehabilitation of 4.7 miles of roadway including 696 PCPS slab installations. The rehabilitation project provided the opportunity to evaluate PCPS alongside traditional cast-in-place slab replacement methods. In addition, the project involved the use of other innovative technologies. The design phase of this project utilized CA4PRS analysis to optimize construction staging plans and Dynameq to characterize traffic flow during construction and rehabilitation activities. Also, a road safety audit was performed in the early stages of the construction to critically examine safety considerations in various design and planning elements. This report documents the details of this project, including a description of the applied PCPS technology and its design, construction staging techniques and maintenance of traffic, slab installation, and performance evaluations and economic analysis. This report also contains other items relevant to HfL projects, including a description of HfL goals, technology transfer activities on the project, and a detailed analysis of data to evaluate if the HfL goals were satisfied. This project serves as a great example of the successful use of multiple innovations on a large scale project. The project also demonstrates the key factors for success: vast breadth of knowledge and expertise required; the importance of planning and attention to details, and the significance of good communication across various divisions within an agency. Specifically, in the case of PCPS, this project achieved tremendously high production rates for slab installations in nighttime work windows. Besides the initial trial installations behind k-rails, all PCPS installations performed in nighttime work windows did not require closure of more than 2 lanes, which was compensated with the addition of two median lanes in the project. Given the construction staging plans and the lane closure patterns, the economic analysis shows no significant cost implications due to the use of PCPS technology for slab replacement. 17. Key Words Highways for LIFE, precast concrete pavement system, PCPS, Super-Slab®
18. Distribution Statement No restriction. This document is available to the public through the Highways for LIFE website: http://www.fhwa.dot.gov/hfl/
Security Classif.(of this report) Unclassified
19. Security Classif. (of this page) Unclassified
20. No. of Pages 71
21. Price
Form DOT F 1700.7 (8-72) Reproduction of completed page authorized

iii iii
SI* (MODERN METRIC) CONVERSION FACTORS APPROXIMATE CONVERSIONS TO SI UNITS
Symbol When You Know Multiply By To Find Symbol LENGTH
(none) Mil 25.4 micrometers μm in Inches 25.4 millimeters mm ft Feet 0.305 meters m yd Yards 0.914 meters m mi Miles 1.61 kilometers km
AREA in2 square inches 645.2 square millimeters mm2 ft2 square feet 0.093 square meters m2 yd2 square yards 0.836 square meters m2 ac Acres 0.405 hectares ha mi2 square miles 2.59 square kilometers km2
VOLUME fl oz fluid ounces 29.57 millimeters mL gal Gallons 3.785 liters L ft3 cubic feet 0.028 cubic meters m3 yd3 cubic yards 0.765 cubic meters m3
NOTE: volumes greater than 1000 L shall be shown in m3 MASS
oz Ounces 28.35 grams g lb Pounds 0.454 kilograms kg T short tons (2000 lb) 0.907 megagrams (or "metric ton") Mg (or "t")
TEMPERATURE (exact degrees) °F Fahrenheit 5 (F-32)/9
or (F-32)/1.8 Celsius °C
ILLUMINATION fc foot-candles 10.76 lux lx fl foot-Lamberts 3.426 candela per square meter cd/m2
FORCE and PRESSURE or STRESS lbf Poundforce 4.45 Newtons N lbf/in2 (psi) poundforce per square inch 6.89 kiloPascals kPa k/in2 (ksi) kips per square inch 6.89 megaPascals MPa
DENSITY lb/ft3 (pcf) pounds per cubic foot 16.02 kilograms per cubic meter kg/m3
APPROXIMATE CONVERSIONS FROM SI UNITS Symbol When You Know Multiply By To Find Symbol
LENGTH μm Micrometers 0.039 mil (none) mm Millimeters 0.039 inches in m Meters 3.28 feet ft m Meters 1.09 yards yd km Kilometers 0.621 miles mi
AREA mm2 square millimeters 0.0016 square inches in2 m2 square meters 10.764 square feet ft2 m2 square meters 1.195 square yards yd2 ha Hectares 2.47 acres ac km2 square kilometers 0.386 square miles mi2
VOLUME mL Milliliters 0.034 fluid ounces fl oz L Liters 0.264 gallons gal m3 cubic meters 35.314 cubic feet ft3 m3 cubic meters 1.307 cubic yards yd3
MASS g Grams 0.035 ounces oz kg Kilograms 2.202 pounds lb Mg (or "t") megagrams (or "metric ton") 1.103 short tons (2000 lb) T
TEMPERATURE °C Celsius 1.8C+32 Fahrenheit °F
ILLUMINATION lx Lux 0.0929 foot-candles fc cd/m2 candela per square meter 0.2919 foot-Lamberts fl
FORCE and PRESSURE or STRESS N Newtons 0.225 poundforce lbf kPA kiloPascals 0.145 poundforce per square inch lbf/in2 (psi) MPa megaPascals 0.145 kips per square inch k/in2 (ksi) *SI is the symbol for the International System of Units. Appropriate rounding should be made to comply with Section 4 of ASTM E380. (Revised March 2003)

iv
ACKNOWLEDGMENTS The project team would like to acknowledge the invaluable insights and guidance of Federal Highway Administration (FHWA) Highways for LIFE (HfL) Team Leader Byron Lord and Program Coordinators Mary Huie and Kathleen Bergeron, who served as the technical panel on this demonstration project. Their vast knowledge of and experience with the various aspects of construction, technology deployment, and technology transfer helped immensely in developing both the approach and the technical matter for this document. Also, Steve Healow and Tay Dam of the FHWA California Division helped coordinate the project team’s communication and interaction with the California Department of Transportation (Caltrans). The authors also thank Caltrans District 8 staff for providing the necessary support for monitoring this project. Project Designer Jonathan den Hartog was the point of contact for all information critical to the development of this report, including information on design and the innovative technologies adopted on this project. den Hartog also provided design drawings, several relevant reports, photographs, and slides pertinent to the report. Resident Engineer Nahro Saoud was the point of contact for key field-related information.

v
CONTENTS
INTRODUCTION .................................................................................................... 1 HIGHWAYS FOR LIFE DEMONSTRATION PROJECTS .................................................................1
REPORT SCOPE AND ORGANIZATION .........................................................................................3
PROJECT OVERVIEW AND LESSONS LEARNED ........................................ 4 PROJECT OVERVIEW ...................................................................................................................4
HFL PERFORMANCE GOALS .......................................................................................................7
ECONOMIC ANALYSIS .................................................................................................................8
LESSONS LEARNED ......................................................................................................................8
CONCLUSIONS ............................................................................................................................10
PROJECT DETAILS ............................................................................................. 11 PROJECT BACKGROUND ............................................................................................................11
PROJECT CONSTRUCTION .........................................................................................................18
DATA ACQUISITION AND ANALYSIS ............................................................. 36 SAFETY ......................................................................................................................................36
CONSTRUCTION CONGESTION—EFFECT OF RAMP CLOSURES ON TRAVEL TIMES ...............38
USER SATISFACTION .................................................................................................................46
TECHNOLOGY TRANSFER .............................................................................. 48 RSA TECHNOLOGY ...................................................................................................................48
PCPS TECHNOLOGY .................................................................................................................48
ECONOMIC ANALYSIS ...................................................................................... 52 AGENCY COSTS .........................................................................................................................53
USER COSTS ...............................................................................................................................53
LIFE CYCLE COST ANALYSIS ....................................................................................................57
COST SUMMARY ........................................................................................................................59
APPENDIX: USER SATISFACTION SURVEY AND RESULTS .................... 60

vi
FIGURES Figure 1. Project location. (Courtesy Caltrans, Google™) .........................................................11 Figure 2. As-built lane use plan...................................................................................................14 Figure 3. Contraflow lane use plan. ............................................................................................14 Figure 4. CSOL lane use plan. ....................................................................................................15 Figure 5. Segment of project that used PCPS for slab replacement. (Source: Google Maps) ....17 Figure 6. Alignment of roadway that received PCPS slab installation, with horizontal and
vertical curves included in the alignment. ...................................................................17 Figure 7. View of the outer lanes of northbound I-15 just before the I-10 overpass. .................25 Figure 8. Typical plan details for Super-Slab®............................................................................26 Figure 9. Epoxy-coated steel reinforcement is shown in a typical panel layout. ........................27 Figure 10. Workers use a roller-type screed to level the panels. ...................................................27 Figure 11. Longitudinally textured surface of a freshly made panel. ............................................28 Figure 12. Underside of a panel. Note the gaskets, dowel pockets, and grooves for the bedding
grout. ............................................................................................................................29 Figure 13. Underside of a panel. Note dowels bar and tie bar pockets. .........................................29 Figure 14. Existing panels were removed in manageable pieces. ..................................................30 Figure 15. A milling machine is used to level the CTB as needed. ...............................................30 Figure 16. Workers use a track-mounted screed to level the base. ................................................31 Figure 17. A panel is set in place. ..................................................................................................31 Figure 18. Grouting operation........................................................................................................32 Figure 19. Finished PCPS. .............................................................................................................33 Figure 20. Cracked panel and core. ...............................................................................................34 Figure 21. I-15 and I-10 ramp closure analysis region..................................................................39 Figure 22. OBSI dual probe system and the SRTT. ......................................................................44 Figure 23. Mean A-weighted SI frequency spectra before and after construction. .......................44 Figure 24. High-speed inertial profiler mounted behind the test vehicle. .....................................45 Figure 25. Mean IRI values before and after construction. ...........................................................46 Figure 26. Project showcase event announcement and invitation. ................................................49 Figure 27. Presenters at the HfL showcase. ...................................................................................50 Figure 28. Participants in the workshop conducted as part of the HfL showcase. ........................50 Figure 29. Site visits during the HfL showcase included I-15 PCPS installation site (top) and
precast plant (bottom). .................................................................................................51

vii
TABLES Table 1. Traffic data on I-15 from Route 60 to I-10. ...................................................................12 Table 2. Traffic data on I-15 from I-10 to Route 60. ...................................................................12 Table 3. CA4PRS alternate comparison (estimated dollar values shown). .................................13 Table 4. Mix design proportions for the PCC used in the PCPS. ................................................18 Table 5. PCC mix design information in the project where accelerated strength development
was critical. ...................................................................................................................19 Table 6. Risk rating as a combination of severity and frequency of crash (Gibbs, 2008). ..........21 Table 7. RSA recommendations and Caltrans’ response to each safety issue identified. ...........22 Table 8. Summary of PCPS panel installations by day. ..............................................................35 Table 9. Breakdown of the type and amount of crashes before construction. .............................36 Table 10. Breakdown of the type and amount of crashes during construction. .............................37 Table 11. Post construction crash data ...........................................................................................37 Table 12. Pre and post construction crash rates .............................................................................37 Table 13. Summary of distances and speeds on route segments in analysis region. .....................40 Table 14. Saturday travel time comparisons for NB I-15 to WB I-10. ..........................................41 Table 15. Sunday travel time comparisons for NB I-15 to WB I-10. ............................................41 Table 16. Saturday travel time comparisons for NB I-15 to EB I-10. ...........................................41 Table 17. Sunday travel time comparisons for NB I-15 to EB I-10. .............................................42 Table 18. Additional travel distance and delays incurred. .............................................................43 Table 19. Analysis scenarios..........................................................................................................53 Table 20. Agency costs. .................................................................................................................53 Table 21. Preconstruction and during construction crash counts. .................................................54 Table 22. Preconstruction and during construction crash rates. ....................................................55 Table 23. Unit comprehensive crash costs estimated for this project. ...........................................55 Table 24. Work zone road user costs for LCCA. ...........................................................................57 Table 25. Case A: total project costs. ............................................................................................58 Table 26. Case B: panel replacement costs. ...................................................................................59

viii
ABBREVIATIONS AND SYMBOLS AADT annual average daily traffic AASHTO American Association of State Highway and Transportation Officials ADT average daily traffic dB(A) A-weighted decibel CTB cement-treated base DOT department of transportation FHWA Federal Highway Administration HfL Highways for LIFE IRI International Roughness Index LCCA life cycle cost analysis ITS intelligent transportation system M&R maintenance and rehabilitation MVMT million vehicle-miles traveled NPV net present value OBSI onboard sound intensity OSHA Occupational Safety and Health Administration PCC portland cement concrete PCPS precast concrete pavement system PHV peak hour volume RSA road safety audit RUC road user cost SAFETEA-LU Safe, Accountable, Flexible, Efficient Transportation Equity Act: A
Legacy for Users SI sound intensity SRTT standard reference test tire TRB Transportation Research Board VOC vehicle operating cost

1
INTRODUCTION HIGHWAYS FOR LIFE DEMONSTRATION PROJECTS The Highways for LIFE (HfL) pilot program, the Federal Highway Administration (FHWA) initiative to accelerate innovation in the highway community, provides incentive funding for demonstration construction projects. Through these projects, the HfL program promotes and documents improvements in safety, construction-related congestion, and quality that can be achieved by setting performance goals and adopting innovations. The HfL program—described in the Safe, Accountable, Flexible, Efficient Transportation Equity Act: A Legacy for Users (SAFETEA-LU)—may provide incentives to a maximum of 15 demonstration projects a year. The funding amount may total up to 20 percent of the project cost, but not more than $5 million. Also, the Federal share for an HfL project may be up to 100 percent, thus waiving the typical State-match portion. At the State’s request, a combination of funding and waived match may be applied to a project. To be considered for HfL funding, a project must involve constructing, reconstructing, or rehabilitating a route or connection on an eligible Federal-aid highway. It must use innovative technologies, manufacturing processes, financing, or contracting methods that improve safety, reduce construction congestion, and enhance quality and user satisfaction. To provide a target for each of these areas, HfL has established demonstration project performance goals. The performance goals emphasize the needs of highway users and reinforce the importance of addressing safety, congestion, user satisfaction, and quality in every project. The goals define the desired result while encouraging innovative solutions, raising the bar in highway transportation service and safety. User-based performance goals also serve as a new business model for how highway agencies can manage the project delivery process. HfL project promotion involves showing the highway community and the public how demonstration projects are designed and built and how they perform. Broadly promoting successes encourages more widespread application of performance goals and innovations in the future. Project Solicitation, Evaluation, and Selection FHWA issued open solicitations for HfL project applications in fiscal years 2006, 2007, 2008, 2009, 2010, 2011, and 2012. State highway agencies submitted applications through FHWA Divisions. The HfL team reviewed each application for completeness and clarity, and then contacted applicants to discuss technical issues and obtain commitments on project issues. Documentation of these questions and comments was sent to applicants, who responded in writing. The project selection panel consisted of representatives of the FHWA offices of Infrastructure, Safety, and Operations; the Resource Center Construction and Project Management team; the Division offices; and the HfL team. After evaluating and rating the applications and

2
supplemental information, panel members convened to reach a consensus on the projects to recommend for approval. The panel gave priority to projects that accomplish the following:
• Address the HfL performance goals for safety, construction congestion, quality, and user satisfaction.
• Use innovative technologies, manufacturing processes, financing, contracting practices, and performance measures that demonstrate substantial improvements in safety, congestion, quality, and cost-effectiveness. An innovation must be one the applicant State has never or rarely used, even if it is standard practice in other States.
• Include innovations that will change administration of the State’s highway program to more quickly build long-lasting, high-quality, cost-effective projects that improve safety and reduce congestion.
• Will be ready for construction within 1 year of approval of the project application. For the HfL program, FHWA considers a project ready for construction when the FHWA Division authorizes it.
• Demonstrate the willingness of the applicant department of transportation (DOT) to participate in technology transfer and information dissemination activities associated with the project.
HfL Project Performance Goals The HfL performance goals focus on the expressed needs and wants of highway users. They are set at a level that represents the best of what the highway community can do, not just the average of what has been done. States are encouraged to use all applicable goals on a project:
• Safety o Work zone safety during construction—Work zone crash rate equal to or less than the
preconstruction rate at the project location. o Worker safety during construction—Incident rate for worker injuries of less than 4.0,
based on incidents reported on Occupational Safety and Health Administration (OSHA) Form 300.
o Facility safety after construction—Twenty percent reduction in fatalities and injuries in 3-year average crash rates, using preconstruction rates as the baseline.
• Construction Congestion o Faster construction—Fifty percent reduction in the time highway users are impacted,
compared to traditional methods. o Trip time during construction—Less than 10 percent increase in trip time compared to
the average preconstruction speed, using 100 percent sampling. o Queue length during construction—A moving queue length of less than 0.5 miles
(mi) in a rural area or less than 1.5 mi in an urban area (in both cases at a travel speed 20 percent less than the posted speed).
• Quality o Smoothness—International Roughness Index (IRI) measurement of less than 48
inches per mile (in/mi). o Noise—Tire-pavement noise measurement of less than 96.0 A-weighted decibels
(dB(A)), using the onboard sound intensity (OBSI) test method.

3
• User satisfaction—An assessment of how satisfied users are with the new facility compared to its previous condition and with the approach used to minimize disruption during construction. The goal is a measurement of 4 or more on a 7-point Likert scale.
REPORT SCOPE AND ORGANIZATION This report documents the Caltrans HfL demonstration project featuring use of a precast concrete pavement system (PCPS) to rehabilitate a section of Interstate 15 and innovative methods to develop an effective construction staging plan. The report presents project details relevant to the HfL program, including discussion of the innovations employed, construction highlights, HfL performance metrics measurement, and economic analysis. The report also discusses the technology transfer activities that took place during the project and lessons learned.

4
PROJECT OVERVIEW AND LESSONS LEARNED PROJECT OVERVIEW The project consisted of rehabilitating 4.7 mi (7.4 kilometers (km)) of I-15 near the city of Ontario in Riverside County between Route 60 and the San Bernardino–Riverside County line at Seventh Street just north of the I-10/15 interchange. This segment of I-15, about 40 mi east of Los Angeles, is a major route for Las Vegas traffic and carries very heavy traffic. I-15 has four mainline lanes in each direction at this location with auxiliary lanes accommodating merging traffic from area crossroads. The average daily traffic (ADT) is about 200,000 vehicles with six percent trucks. The area also has a concentration of commercial activities, including two shopping malls, auto centers, airports, a National Association for Stock Car Auto Racing (NASCAR) speedway, railroads, and warehouses. The presence of the interchange is an added challenge to maintaining traffic during construction; as many as six lanes approach the interchange. A large amount of traffic merges in and out of I-15; Route 60 at the south end of the project carries six to eight lanes of traffic and I-10 toward the north end of the project carries eight lanes of traffic. The two outer lanes were rehabilitated in both directions under this project, which amounted to about 12 lane-mi of continuous lane replacement and intermittent slab replacement. Other roadway portions that underwent rehabilitation included interchange ramps, freeway-to-freeway connectors, and asphalt shoulders. To support the major rehabilitation activities and accommodate traffic flow or traffic detours during the construction work, the project also entailed median paving, new median barriers, widening of the inside shoulder, bridge widening, and structure crossings. Other bridgework was included in the project, which consisted of deck rehabilitation, replacement of structure approach slabs, and upgrading of bridge approach rails. Project Innovations The magnitude of work involved on this project required Caltrans to do a great deal of planning. The agency performed a detailed evaluation of available technologies to optimize project resources for the best outcome, which involved several aspects of the project. Caltrans considers the following technologies as innovative approaches that contributed to the project's success, especially in meeting the HfL objectives:
• Precast concrete pavement system (PCPS) technology for rapid slab replacement within short work windows. PCPS reduced traffic delays and improved safety and performance (long service life) of the pavement. PCPS technology, planned during the design stage, was the primary innovation Caltrans listed to qualify for HfL funding.
• The road safety audit (RSA) procedure to critically examine each design detail to identify potential safety concerns and provide mitigation strategies. An RSA audit was performed on the project during the construction stage.
• Construction Analysis for Pavement Rehabilitation Strategies (CA4PRS) schedule and traffic analysis software that helps planners and designers select the best alternative to reduce highway construction time and its impact on traffic. The CA4PRS analysis was performed by Caltrans independent of the HfL funding approval and was the basis for

5
selecting the rehabilitation strategy for developing the project funding and the bid documents.
• Dynameq™ staging and traffic simulation software to evaluate congestion relief strategies and lane management. Again, Caltrans completed Dynameq analysis before, and independent of, the HfL funding application or funding.
PCPS Traditional practice for the rapid repair of concrete pavements on heavily congested highways in California involves the use of a fast-setting concrete mix so that slab replacement can be performed within tight work windows. Caltrans uses the Rapid Set® Concrete (RSC) referred to as "4x4 mix" because the concrete is designed to achieve at least 400 pounds per square inch (psi) flexural strength within 4 hours. While Caltrans has had much success with this mix design, the agency believes the service life of the 4x4 mix may be influenced by unpredictable site conditions affecting both the casting and curing processes. The primary concerns are associated with difficulty of placement and curing and shrinkage issues. Caltrans has explored the use of PCPS for slab replacement on other projects. The I-15 project was the first project District 8 considered for the application of PCPS technology. The traffic patterns and limitations in lane closures made this project a select candidate for evaluating the feasibility of using PCPS technology. Caltrans recognized at the outset that the initial cost for Super-Slab® is higher than traditional methods (i.e., rapid-set concrete placed in night closures) of rehabilitating roadways, but the life cycle costs appeared to be closer. Caltrans expected to yield a high-quality pavement with a long service life due in part to controlled manufacturing conditions and a high level of quality control. Caltrans anticipates the high-quality PCPS to achieve a lifespan greater than 30 years in contrast to RSC, which has an estimated pavement life of about 10 years. Furthermore, the reduced construction time made possible by the use of Super-Slab® translates to a reduction in the time construction activities impact the traveling public. This results in a lower road-user cost (RUC) from construction delays. Caltrans expected to recover the higher initial cost through a lower life cycle cost compared to traditional rehabilitation strategies. The chosen PCPS system, Super-Slab® by the Fort Miller Co., Inc., was used to replace slabs along the most critical section of the highway in one northbound lane near the interchange with I-10. The idea was to demonstrate how such a system could allow the contractor to perform continuous and intermittent lane replacement quickly during nighttime and weekend closures while maintaining construction quality and minimizing traffic delays. Since Super-Slab® is a proprietary system, a Public Interest Finding required to justify why this project is specifying this product and was prepared. Super-Slab® was then specified in the contract. RSA An RSA is a formal safety performance examination of an existing or future road or intersection by an independent, multidisciplinary team. Through this process, potential road safety issues are estimated and methods for improvement are identified for all road users. An RSA was performed during the early stages of construction by a multidisciplinary team that was not closely associated with the planning and design phases of the project. Caltrans reviewed the team

6
recommendations and incorporated several into the project. CA4PRS The application of the CA4PRS software tool in the early design phase of the project helped guide engineers in determining an optimal staging plan for the rehabilitation activities. The program was produced through a pooled fund study among a consortium of four States (California, Minnesota, Texas, and Washington) and supported by FHWA. CA4PRS was used to help estimate the amount of time necessary to construct each stage of the project, as well as quickly assess multiple alternatives to rehabilitating the pavement. This software was also instrumental in evaluating the production rates for different rehabilitation scenarios. This tool integrates traffic, design, and construction issues to select the most effective and economical rehabilitation strategy from a set of user-defined alternatives. Therefore, CA4PRS allowed a large number of alternatives to be quickly analyzed to determine the most efficient means of construction. Dynameq Designers further analyzed the staging and its impacts on traffic using Dynameq software developed by INRO, which combines the advantages of microscopic and macroscopic modeling to create a mesoscopic model. This model provided a level of detail similar to that achieved by microscopic models while achieving the faster, more efficient model runs of macroscopic models. This approach made it more economically feasible to analyze multiple scenarios for staging. Construction Staging and Schedule Caltrans received HfL funding of $5 million toward the I-15 project. The construction contractor selected after the bid process was Security Paving Company, Inc. of California with a bid amount of $52 million. The construction sequence involved paving two median lanes and moving traffic over to free two outside lanes in the southbound direction for rehabilitation and slab replacement performed through weekdays and weekends. This process was then repeated for the northbound direction. This staging plan essentially ensured no reduction in lane capacity during the rehabilitation process. The roadway segment that underwent PCPS slab replacement involved 1.8 mi using 696 slabs of continuous replacement covering an area of 118,400 square feet (ft²). Also, 16 existing panels were replaced at intermittent (noncontinuous) locations. PCPS slab installations were performed mostly during 8-hour nighttime closures and a short portion during 55-hour weekend closures, which was primarily when the ramps and connectors were closed. The contractor’s bid for the PCPS elements was a unit price of about $1,500 to $1,574 per cubic yard (yd3) (~$2090 per cubic meter (m3) or $418 per square meter (m2)), totaling $4.6 million on the entire project. This price included slab fabrication and shipping to the site, existing pavement removal, installation, grouting, and grinding after installation to meet smoothness requirements. The bid item did not include joint sealing. Joint sealing was paid under a separate item.

7
As stated earlier, this was a major rehabilitation project and used five major construction stages and 25 substages over 400 working days (about 2 years) and both weekend closures (between late Friday night and early Monday morning) and nighttime closures (between 9 p.m. and 5 a.m.). Eight full roadbed closures were included. Clearly, the challenges for successful completion extended far beyond the use of PCPS for rapid slab replacement. The closure of ramps and connectors at the I-10 interchange over a weekend was, by far, the most critical construction phase because this was expected to create traffic congestion on both highways leading to the intersection. Also, any snag in the planning, scheduling, or execution process could have the highest impact on traffic management. The CA4PRS analysis was used to justify the estimates for the number of road closure requirements and set the incentive and disincentive clauses in the construction contract. The optimum number of closures offered to the contractor was 32 weekend closures. An incentive of $150,000 per closure was offered for fewer than 26 closures up to a maximum of $900,000 in incentives. The contract also levied a disincentive of $175,000 per closure for every closure over 32. The disincentive included $25,000 for the public awareness campaign to alert the public about the closure. The contractor received the maximum incentive on the project. HFL PERFORMANCE GOALS Safety, construction congestion, quality, and user satisfaction data were collected before, during, and after construction to demonstrate that innovations can be an integral part of a project while simultaneously meeting the HfL performance goals in these areas.
• Safety o Work zone safety during construction—Crash rates dropped nearly in half during
construction compared to historical rates, which met the HfL goal of achieving a work zone crash rate equal to or less than the preconstruction rate.
o Worker safety during construction—It is not evident if the contractor was able to meet the HfL goal of less than 4.0 on the OSHA 300 rating. The contractor indicated that the firm does not maintain records on a project basis and instead aggregates safety performance on an annual basis for all construction projects.
o Facility safety after construction—No direct safety improvements were included in this project, but shoulder widening and increased rideability will likely improve driving conditions. These improvements may have some positive impact on the safety performance of the facility after construction. Since the post construction crash statistics was available for only 50 days as opposed to 4 years of available preconstruction crash data, the data coverage was statistically inadequate to conclude that the overall safety of the facility has improved after construction. Furthermore, Caltrans acknowledges that it does not anticipate recording a significant decrease in crash rates because the roadway alignment, lane configurations, and traffic patterns, among other roadway features, have not changed as a result of the rehabilitation.
• Construction Congestion o Faster construction—The HfL goal is a 50 percent reduction in the time traffic is
impacted compared to traditional construction methods. No factual information was

8
collected during the project to suggest that the use of PCPS reduced construction time because the conventional approach of using fast-setting concrete could allow nighttime construction within the same work windows. However, the construction sequence and staging, especially the paving of two median lanes, certainly reduced construction congestion by virtually maintaining traffic flow similar to preconstruction phases.
o Trip time—The HfL goal of no more than a 10 percent increase in trip time compared to the average preconstruction conditions was not achieved throughout the construction phase. During the most critical weekend closure, an average increase of 80 percent was noted in the detour for northbound I-15 to westbound I-10 and an increase in 36 percent was noted in the detour for northbound I-15 to eastbound I-10.
o Queue length during construction—The traffic studies under this project did not explicitly measure queue lengths impacted by the construction activities. Instead, delay times of 3,084 vehicle-hours were estimated on I-15 northbound lanes, which represents the impact of construction during the critical ramp closure.
• Quality o Smoothness—Rehabilitation efforts improved smoothness. IRI decreased from 225
in/mi before construction to 66 in/mi after construction. Motorists will notice a smoother ride, although the HfL goal for IRI of 48 in/mi was not met on this project.
o Noise—The sound intensity (SI) data showed a noticeable 5.9 dB(A) decrease in noise from a preconstruction value of 108.3 dB(A) to 102.4 dB(A) after construction. Although the new pavement is noticeably quieter, it does not meet the HfL SI requirement of 96.0 dB(A) or less.
o User satisfaction—Most motorists surveyed were satisfied with the finished highway and the way the project was carried out, which met the performance goal of 4 or more points on a 7-point Likert scale.
ECONOMIC ANALYSIS The costs and benefits of this innovative project approach were compared with those of a project of similar size and scope delivered using a more traditional approach. A comprehensive economic analysis that accounted for construction, road user, and safety costs revealed that the cost of using PCPS was about the same as conventional cast-in-place methods using RSC. LESSONS LEARNED Through this project, Caltrans gained valuable insights into the innovative technologies and materials used. The agency learned what contributed to the project's success and what issues need improvement or more careful consideration in future project deliveries. The following are some of the lessons learned: General
• On projects of this magnitude, construction experience is important. • Breadth of knowledge is required to execute projects that include several engineering
aspects—traffic, pavement design, construction, and cost estimation.

9
• Team approach and communication across various departments and divisions of an agency are critical. The agency should consider assigning an individual or a team to manage interdepartmental communication and rapport.
• Innovations may be adopted on large-scale projects if agencies can pay attention to the details and are mindful of the learning curve in adopting new technologies.
• In retrospect, it appears that production rates during major closures were underestimated, and more can be accomplished in an extended weekend closure than originally anticipated.
Super-Slab®
• It is possible to use PCPS for rapid slab replacement in heavy traffic areas with short work windows. Planning is critical, as is realizing the significance of crew mobilization on such projects.
• Accurate thickness data of the existing pavement are critical because the Super-Slab® panels must be cast to match the thickness of the existing panels as closely as possible. Designers should consider maximizing the number of cores taken from the existing pavement to increase the accuracy of design.
• Designers may wish to consider conducting a 3D survey of the existing pavement during design (in addition to the one required of the contractor), in order to better anticipate faulting, profile issues, and warped panel needs prior to construction..
• Removing the existing panels was the critical task governing the amount of production the contractor could achieve during each closure period.
• Bedding layer composition may be reconsidered for achieving desired results. • Base material grading is a very critical operation in the installation process and for good
performance. Caltrans noted a strong correlation between improper grading and slab cracking.
• Inspectors need to be well trained for PCPS. Typically, inspectors are not familiar with PCPS.
CA4PRS
• The preconstruction study involving data collection and deciding how the contractor would perform the work was time-consuming because the software analysis setup.
• Validating the software model took must less time than the preconstruction study. • A multidisciplinary team made up of operations, design, and construction experts would
likely get the most utility from the CA4PRS software when analyzing a project of this size and complexity.
Dynameq
• The project demonstrated the application of a mesoscopic scale model for traffic analysis on a large scale project with a very complex construction staging plan.
RSA
• An RSA looks at project safety at a great level of detail. • The use of an independent audit team helps identify issues that may not be apparent to the
design and construction planning teams.

10
• RSA evaluations might be most useful if performed early in the design process or well before the planning stages. Recommendations, even if considered worthwhile, might be too expensive to incorporate after the plans are finalized or the bidding process is underway.
CONCLUSIONS Caltrans concluded that it is possible to successfully complete the rehabilitation of a heavily congested major urban roadway with minimal disruption to traffic while maintaining high safety standards and designing for a long-life structure. This project highlighted the importance of emphasizing these project goals during the planning, design, and construction phases. The project demonstrated that precast concrete pavement construction can be successfully used for rapid repair of highways in urban areas with heavy traffic. The analyses performed to develop the construction staging plan and to simulate traffic to evaluate the network-wide impact of various construction staging scenarios were useful in developing the incentive and disincentive clauses in the construction contract. Through efficient use of equipment and combining of stages made possible by lower than anticipated traffic impacts, the contractor was able to complete the project with fewer major closures than anticipated. An analysis of these changes provided important lessons that can be utilized in construction planning on future complex projects.

11
PROJECT DETAILS PROJECT BACKGROUND Caltrans District 8 undertook a major project to rehabilitate I-15 in Ontario in San Bernardino and Riverside Counties, CA from 2009 through 2011. Caltrans conducted a great deal of preconstruction planning before designing and building the project. The project limits spanned a distance of 4.7 mi on I-15 between Route 60 and Seventh Street just north of the I-10/15 interchange. This segment of I-15, about 40 mi east of Los Angeles, is a major route for Las Vegas traffic and carries very heavy traffic. The area also has a concentration of commercial activities, including two shopping malls, auto centers, airports, a NASCAR speedway, railroads, warehouses, etc. Figure 1 shows the general project location and the various commercial activities in the area.
Ontario International
Airport
RR Track
RR Track
California Speedway (NASCAR)
Ontario Mills Mall
Scandia Amusement
Park
Auto Dealers
Warehouses
Figure 1. Project location. (Courtesy Caltrans, Google™)
This segment carries eight lanes of traffic—four mainline lanes in each direction—with auxiliary lanes accommodating merging traffic from area crossroads. The estimated ADT is 200,000 vehicles with 6 percent trucks. Caltrans evaluated detailed traffic estimates and projections for the planning and design of this project. Historical and projected traffic data on I-15 are presented in table 1 for south of the junction with I-10 and in table 2 for north of the junction with I-10.

12
Table 1. Traffic data on I-15 from Route 60 to I-10.
Traffic Data Year 2003 (Existing)
Year 2013 (Forecast)
Average daily traffic (ADT) 196,500 215,300 Peak hour volume (PHV/DHV) 14,740 16,150
Percent trucks in peak hour 6 6
Table 2. Traffic data on I-15 from I-10 to Route 60.
Traffic Data Year 2003 (Existing)
Year 2013 (Forecast)
Average daily traffic (ADT) 165,600 182,800 Peak hour volume (PHV/DHV) 12,750 14,080
Percent trucks in peak hour 6 6 A large amount of traffic merges into and out of the eastbound and westbound lanes of I-15; Route 60 at the south end of the project carries six to eight lanes of traffic and I-10 toward the north end of the project carries eight lanes of traffic. The two outer lanes were rehabilitated in both directions under this project, which amounted to about 12 lane-mi of continuous lane replacement and intermittent slab replacement. Other roadway portions that underwent rehabilitation included interchange ramps, freeway-to-freeway connectors, and asphalt shoulders. To support the major rehabilitation activities and accommodate traffic flow and detours during the construction work, the project also entailed median paving, new median barriers, widening of the inside shoulder, bridge widening, and structure crossings. Also included in the project was other bridgework, which consisted of deck rehabilitation, replacement of structure approach slabs, and upgrading of bridge approach rails. Preconstruction Analysis After an extensive planning process, Caltrans began design activities in 2004. The large traffic volumes and the inability to shut down or even significantly reduce traffic flow made necessary a critical review of construction and staging options during the planning, design, and construction phases. The presence of the interchange is an added challenge to maintaining traffic during construction; as many as six lanes approach the interchange in each direction. Caltrans adopted an integrated preconstruction analysis approach to compare all feasible scenarios for the project limits and select the best approach in terms of schedule, traffic delay, and total cost. Consequently, Caltrans used traffic modeling tools and traffic network analysis tools in its preconstruction analysis, which was conducted in two phases:
• An evaluation of alternatives and selection of the most optimum alternative • Detailed analysis of the selected alternative

13
CA4PRS for Comparison of Alternate Rehabilitation Scenarios Caltrans used the CA4PRS software tool to compare alternative construction scenarios and analyze the preferred alternative. The purpose of analyzing the preferred alternative was to provide a detailed estimate of the number of working days and closures needed for each construction stage. Caltrans analyzed five alternatives to determine the most efficient in terms of road user costs (RUC) based on each phase of construction and production rates for each alternative. The study validated the preferred alternative (as-built) based on construction schedules, traffic, and RUC of each alternative. The five alternatives and the estimated closure duration are as follows:
1. Median widening (as-built)—35 weekends of closure 2. Value analysis bypass—Option eliminated from the analysis because of safety concerns 3. Rapid rehabilitation and contraflow (55-hour weekend)—35 weekends 4. Rapid rehabilitation (progressive continuous)—8 weeks 5. Traditional nighttime (portland cement concrete (PCC) slab replacement)—1,220
weeknights 6. Crack-seat and asphalt concrete (AC) overlay (CSOL)—20 weekends
Table 3 is a summary of the results from the analysis.
Table 3. CA4PRS alternate comparison (estimated dollar values shown).
Alternative Closure Duration Traffic Cost ($million)
Cost Ratio (percent) RUC
($million) Delay
(minutes)* Agency Total**
1 As-built 35 weekends 3 16 78 79 100 3 Contraflow 35 weekends 119 363 83 123 156 4 Progressive Continuous 8 weeks 123 363 77 118 149 5 Traditional Nighttime 1,220 nights 133 22 88 133 168 6 CSOL 20 weekends 69 363 60 83 105
*Delay is per closure **Total cost = 1/3 RUC + Agency Cost The main component of the as-built alternative, or option 1, was the maintenance-of-traffic plan. This alternative required that the project include bridge widening on all bridge structures within the project limits and paving of the median. Also, four lanes of traffic were maintained by shifting the mainline traffic onto the median shoulders while the two outermost lanes were rehabilitated, as illustrated in figure 2. This process was repeated for both directions. The medians received an asphalt overlay to handle the mainline traffic volumes. Several structures were widened to accommodate traffic though the medians. However, because of conflicts with existing median bridge columns at the I-10/15 interchange crossover structures, the median traffic was shifted back onto the mainline area. At this location, traffic was reduced from four to two lanes in one direction to provide a safe work area to rehabilitate the roadway.

14
Caltrans estimated that the as-built rehabilitation activities would take 35 55-hour weekend closures and 410 working days, making this the least expensive alternative in RUC and bottom-line total costs. The actual project was completed in just 32 weekends and 410 weeknights.
Figure 2. As-built lane use plan.
Both the contraflow and progressive continuous alternatives would have resulted in high traffic delays and high RUC. These alternatives are more suitable for short-duration projects. Figure 3 shows an illustration of contraflow lane use.
North Bound
Traffic Roadbed (SB) Construction Roadbed (NB)
Lane Reconstruction
Construction Access
South Bound
Quick C
hange M
oveable Barrier
Figure 3. Contraflow lane use plan.
Traditional rehabilitation based on 1,220 nights of temporary lane closures would have caused only modest delays, but given the long project duration would have resulted in high RUC. The final alternative using CSOL was close in value to the as-built alternative, but it would have had
15
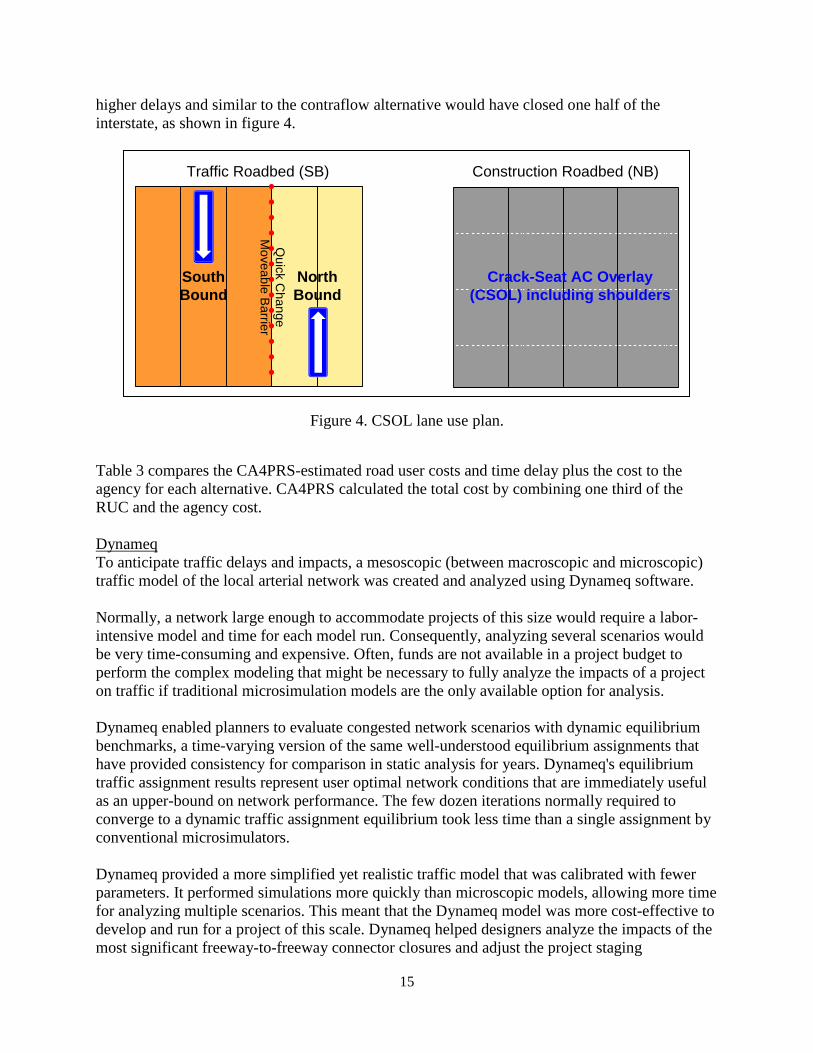
higher delays and similar to the contraflow alternative would have closed one half of the interstate, as shown in figure 4.
North Bound
Traffic Roadbed (SB) Construction Roadbed (NB)
Construction Access
South Bound
Quick C
hange M
oveable Barrier
Crack-Seat AC Overlay (CSOL) including shoulders
Figure 4. CSOL lane use plan.
Table 3 compares the CA4PRS-estimated road user costs and time delay plus the cost to the agency for each alternative. CA4PRS calculated the total cost by combining one third of the RUC and the agency cost. Dynameq To anticipate traffic delays and impacts, a mesoscopic (between macroscopic and microscopic) traffic model of the local arterial network was created and analyzed using Dynameq software. Normally, a network large enough to accommodate projects of this size would require a labor-intensive model and time for each model run. Consequently, analyzing several scenarios would be very time-consuming and expensive. Often, funds are not available in a project budget to perform the complex modeling that might be necessary to fully analyze the impacts of a project on traffic if traditional microsimulation models are the only available option for analysis. Dynameq enabled planners to evaluate congested network scenarios with dynamic equilibrium benchmarks, a time-varying version of the same well-understood equilibrium assignments that have provided consistency for comparison in static analysis for years. Dynameq's equilibrium traffic assignment results represent user optimal network conditions that are immediately useful as an upper-bound on network performance. The few dozen iterations normally required to converge to a dynamic traffic assignment equilibrium took less time than a single assignment by conventional microsimulators. Dynameq provided a more simplified yet realistic traffic model that was calibrated with fewer parameters. It performed simulations more quickly than microscopic models, allowing more time for analyzing multiple scenarios. This meant that the Dynameq model was more cost-effective to develop and run for a project of this scale. Dynameq helped designers analyze the impacts of the most significant freeway-to-freeway connector closures and adjust the project staging
16
accordingly to minimize impact on the traveling public. Two traffic studies were performed under this project. The first was a preliminary study and the second involved a more detailed analysis of the results of the first study. Specifically, Dynameq analyzed the detailed construction staging plan and performed an operational analysis of the primary detour routes for six key stages in the construction process when detours were considered critical. The six staging scenarios analyzed are summarized below:
• 2B—Closure of I-10W to I-15S and I-15S to Jurupa ramps • 2C—Closure of I-10E to I-15S ramp • 2D—Closures of I-15S to I-10W and 4th Street to I-15S ramps • 3D—Closures of Jurupa to I-15N and I-15N to I-10E and I-10W ramps • 3F—Closure of EB I-10 to NB I-15 connector and both NB ramps at 4th Street • 4B—Closure of SB I-15 to WB and EB Route 60
Contract Details Security Paving Co. Inc. was awarded $51,863,899.55 to complete this project, based on low-bid selection. PCPS was $4.6 million of the total contract. The contractor’s bid for the PCPS elements was a unit price of about $1,500 to 1,574/yd3 ($418/m2), totaling $4.6 million on the entire project. This price included slab fabrication and shipping to the site, existing pavement removal, installation, grouting, and grinding after installation to meet smoothness requirements. The bid item did not include joint sealing, which was covered under a separate bid item The overall project limits and the PCPS section are shown in figure 5. PCPS was placed in the two outermost lanes and in some cases in only the outermost lane of northbound I-15 for about 1.2 mi between East Jurupa Street and Ontario Mills Parkway. Areas that did not receive PCPS were rehabilitated with traditional continuous lane replacement or random panel replacement. The existing pavement was 9- to 12-in thick concrete over a 5-in cement treated base (CTB). The alignment also included a fair degree of horizontal and vertical curves, as shown in figure 6. The existing outer lane was typically 12 ft wide, but varied to as much as 13 ft near gore areas.

17
Figure 5. Segment of project that used PCPS for slab replacement. (Source: Google Maps)
North limit of the rehabilitation project
South limit of the rehabilitation project
North limit of the precast pavement
South limit of the precast pavement
Figure 6. Alignment of roadway that received PCPS slab installation, with horizontal and vertical curves included in the alignment.
Caltrans designed the project to allow for a portion of PCPS to be constructed behind temporary concrete barrier, with no closure, which served as the contractor's installation learning curve. Prior to this project, Caltrans had conducted accelerated testing of the Super-Slab® concrete slabs

18
to confirm their structural capacity under heavy load simulation. The results indicated service life beyond the current design requirements. PROJECT CONSTRUCTION General Comments Project construction began in 2009. As is often the case, the contractor changed several elements of the construction staging plan and was aggressive in accelerating the construction process while also minimizing the number of weekend closures. Caltrans observed that the contractor had identified the demolition operation to be the critical operation in the slab replacement process. These changes included performing random slab replacements during the night work, sometimes paving two lanes wide on connectors, and combining stages. In all, about 18 closures were used, which fetched the contractor the full incentive offered on the contract. The construction zone also experienced lower traffic delays than anticipated. It is not clear if this reduction was due in part to the slowed economy and public awareness efforts. Materials The mix design used for the fabrication of the PCPS panels is shown in table 4. Several other segments of the project used concrete mixes designed to achieve pavement opening strengths at various ages—14, 12, 8, and 4 hours. These mix designs were used in different areas and lanes of the project, depending on the opening time criteria for each specific area. Mix designs used for other opening time requirements are summarized in table 5. Note that all aggregate blends met the Caltrans gradation requirements.
Table 4. Mix design proportions for the PCC used in the PCPS.
Material Quantity
Cement (Type III), lb/yd3 752 (8 sacks) Class F fly ash, lb/yd3 0 Sand, lb/yd3 1,356 3/8" (9.5 mm) aggregate, lb/yd3 213 1” (25mm) aggregate, lb/yd3 1,463 Air by volume 1.25% Admixtures
ADVA 575 (superplasticizer), fl oz 45.1 RECOVER (hydration stabilizer), fl oz 22.6 POLARSET (set accelerator), fl oz 640
Water, lb/yd3 274.9 (~33 gallons) W/(C + FA + SF)—by weight 0.37 Unit weight, pcf 150.3

19
Table 5. PCC mix design information in the project where accelerated strength development was critical.
Mix—Use in Project 24-hour mix 12-hour mix 8-hour mix 4-hour mix
Requirement, Design Flexural Strength 600 psi (4.2 Mpa) @ 7 days, 400 psi (2.8 Mpa) @ 24 hours
600 psi (4.2 Mpa) @ 7 days, 400 psi (2.8 Mpa) @ 12 hours
600 psi (4.2 Mpa) @ 7 days, 400 psi (2.8 Mpa) @ 8 hours
600 psi (4.2 Mpa) @ 7 days, 400 psi (2.8 Mpa) @ 4 hours
Material in Mix Design
Cement, lb/yd3 733 (7.8 sacks)–Type II/V cement
752 (8 sacks)–CalPortland Type III,
low alkali
753 (8 sacks)– CalPortland Type III,
low alkali
799 (8.5 sacks)– CalPortland Type III,
low alkali
Class F fly ash, lb/yd3 0 0 0 0 Silica fume, lb/yd3 0 0 0 0 Washed concrete sand, lb/yd3 1,145 1,195 1,195 1,164 #4 (0.375") aggregate, lb/yd3 520 511 511 505 #3 (1.0") aggregate, lb/yd3 1,374 1,392 1,392 1,389 #2 (1.5") aggregate, lb/yd3 0 0 0 0 Air by volume 3% 2% 2% 2% Admixtures
WRDA–64, fl oz. (WRA) 28.3 DAREX II, fl oz. (AEA) 0.7 DARASET 400, fl oz. (set accelerator) 146.6 ADVA 575, fl oz. (superplasticizer) 45.1 45.1 47.9 RECOVER, fl oz. (hydration stabilizer) 7.5 7.5 8 POLARSET, fl oz. (set accelerator) 300.8 376 639.2
Water (allowable), lb/yd3 (water adjusted based on water in admixture) 272 (~34 gallons) 255 (~32 gallons) 253 (~32 gallons) 244 (~32 gallons)
W/(C + FA + SF)—by weight 0.38 0.35 0.35 0.33 Unit weight, pcf 150 152 152 153
Test results 550 psi flexural strength at 24 hours

20
Road Safety Audits An RSA is a formal evaluation of the safety standards of a project and is conducted by an independent, multidisciplinary audit team. The safety performance examination may be performed at any stage of the project, as early as the preconstruction stage (i.e., a future project in its planning and feasibility and design stages), during construction (work zones, preopening stages), or in the postconstruction, in-service stage (existing roads). The goal is to promote safety by identifying issues or project features that can result in unintended and harmful incidents and making improvements that can mitigate the condition. The analysis typically involves the integration of multimodal safety concerns and the consideration of human factors in the design. An RSA also considers the safety of all road users—passenger cars, pedestrians, pedal cyclists, motorcyclists, and large trucks. In special cases, it may also consider public safety vehicle users (police or fire), maintenance vehicles, older drivers, etc. When RSAs are performed along a specific roadway segment, they also consider the interactions at the project limits by examining connections to existing infrastructure beyond the limits and looking at the segment or intersection from the point of view of users entering and exiting it. While promoting the awareness of safe design practices, RSAs are a step further than traditional safety reviews. An RSA is essentially a process through which the project team takes the time and makes the effort to identify all project elements as a whole and examine how the various elements interact with each other, especially the combination of minimum standards from each perspective. For example, what are the implications of providing a minimum-radius curve on an approach to an intersection where the minimum stopping sight distance is provided? Can vehicles (especially trucks) safely brake? Finally, the goal of an RSA is not simply to identify potential problems, but also to identify potential solutions. The RSA audit process often proactively seeks mitigation measures to address these risks. For instance, it may be as simple as setting up a stop sign at a specific project location or additional signs during a construction phase. RSA recommendations might also be more involved. Some questionable elements may be unavoidable in a design, such as when constraints (geometric, fiscal, etc.) limit the project. For example, limited land availability may result in the need to incorporate a horizontal curve with a radius below the minimum design value for anticipated speeds. The RSA can identify potential measures to identify this hazard (appropriate signing) and induce lower approach speeds (narrower lanes or transverse rumble strips), which can be implemented at reasonable expense during construction. RSA for I-15 HfL Project–Recommendations and Implementation For the I-15 HfL project, the RSA analysis was conducted at the preconstruction stage and the scope included the entire length of the project from the I-15/Route 60 separation to the Seventh

21
Street undercrossing in Rancho Cucamonga. The description of the RSA evaluation and the recommendations were documented in a report submitted to Caltrans.1 The project team used design drawings (cross sections, layout, pavement delineation, sign plan, sign details, detour plans, traffic handling plans, and stage construction details), collision data summaries, and volume data summaries for the analysis. The team also conducted site reviews of the entire project limits. First, the RSA team noted that the project design had incorporated several features that would greatly enhance safety during construction:
• A smoother pavement surface for ride quality • Continuous center median barrier to reduce high-speed head-on crashes • Full paved shoulders to allow disabled vehicles to pull over or errant drivers enough
space and time to regain control and merge back onto the driving lanes • Updated crash cushions to reduce injury risk in the event of a collision with fixed objects
close to travel lanes Next, the RSA team analysis involved identifying project elements with safety concerns and assigning them a risk rating on a scale of A through F (lowest risk level through highest risk level). The risk ratings were based on standard combinations of frequency and severity of cr
ashes caused by each safety issue, as shown in table 6.
Table 6. Risk rating as a combination of severity and frequency of crash (Gibbs, 2008).
Frequency Rating Severity Rating*
Low Moderate High Extreme Frequent C D E F Occasional B C D E Infrequent A B C D Rare A A B C
Crash Risk A—lowest risk, B—low risk, C—moderate-low risk, D—moderate-high risk, E—high risk, F—highest risk
Using the risk ratings as a basis, the RSA team categorized each identified safety concern and made several recommendations for improving safety, especially during the construction phase of the project. These recommendations are tabulated in table 7. The table also identifies the recommendations Caltrans incorporated into the project as well as reasons for not incorporating recommendations.
1 Margaret Gibbs, Road Safety Audit: Rehabilitation of I-15, submitted to Caltrans with Reference H-08172,
Opus International Consultants (BC) Ltd., September 2008.

22
Table 7. RSA recommendations and Caltrans’ response to each safety issue identified.
Safety Issue Risk Rating Suggestions Caltrans’ Response
1
Unshielded bridge piers in system interchanges may pose a fixed-object hazard.
C • Roadside barrier or attenuator
Two locations with the specific concern were identified. Both locations satisfy Highway Design Manual (HDM) standard for clear recovery zone. Constructing barriers will pose additional grading concerns within the available space. Also, crash history data revealed no incidents of vehicles striking the bridge pier at these locations.
2
Congestion may contribute to a higher risk of crashes.
C • Advance signing • Ramp metering
Improved signing, upgrades to existing sign panels, and ramp metering on Jurupa Avenue and Fourth Street interchanges were planned for this project to address congestion.
3
Signing and pavement marking issues:
Pavement markings and signs may provide limited guidance to drivers.
C • Shadow pavement markings
Several approaches used to address this: paint stripe delineating the lanes on PCC pavement, raised markers on top of the stripes to improve visibility, and shadow striping considered pending cost approval.
Driver comprehension of text based signs may be limited.
B • Symbol-based signs All signs upgraded to latest standards. Text-based upgraded to sign-based signage.
Drivers may not be aware of exit-only lanes.
B-C • “EXIT ONLY” sign panel
• Destination pavement markings
Caltrans (traffic design) used destination pavement markings to improve indication of exit-only lanes.

23
Safety Issue Risk Rating Suggestions Caltrans’ Response
Guide signing at Route 60 interchange may confuse drivers.
B-C • Modify signing • Destination pavement
markings • Continuous center option
lane
Solution suggested can be cost prohibitive ($300,000 per sign). Followup project was initiated by Caltrans to address this issue.
Driver clarity at long unmarked gore areas
B-C • Chevron markings • Longitudinal rumble
strips • Colored pavement
Long gore areas were striped with chevron markings.
Driver clarity at long unmarked merge areas
C-D • Lane-drop arrows • Lane-drop markings
Lane drop arrows were added to the plans.
4 Trucks may penetrate median barriers.
C • TL-5 median barriers • TL-5 roadside barriers on
ramps
This change is cost prohibitive ($140,000) for a low-risk issue, so it was postponed to a future project.
5
Larger paved surfaces will generate increased surface flows, which may affect drainage in outside lanes.
A-D • Confirm drainage The design stage evaluated this concern because of the expected increase in flows from median paving. Additional downdrains and overside drains were added as part of this project. Also, flat shoulder areas were reconstructed to a standard cross slope, increasing capacity.
6
The WB-to-SB ramp at the I-10 interchange has a history of wet-weather crashes.
B-C • High-friction overlay treatment
• Enhanced signing, including dynamic signing
Traffic design reevaluated the crash data at this location and found only two crashes, both nonfatal, related to wet conditions from January 2006 to March 2008. Hence, no further action was considered necessary.
7 Temporary features during construction may entail some additional risks.
B-D • Relocation of temporary barriers
• Barrier attenuation • Temporary signing
improvements • Revision of detour plan
A revised sheet was issued as a CCO showing changes to the placement of the temporary barriers and the detour signs as recommended. Changes to the traffic split on the detour routes, however, could not be accommodated because the original decisions were based on results of the traffic

24
Safety Issue Risk Rating Suggestions Caltrans’ Response
• Confirmation of temporary pedestrian and bike connections
modeling tools. It was also not possible to change the decision to exclude exit numbers on sign (#2 and up) because this was based on the decision to avoid clutter at the signs and keep a good traffic flow. Pedestrian and bike connections were verified.
8 Shoulder transition treatment at bridges and risk of off-road collision
A-B • Shoulder rumble strip • barrier extension
Plans were updated to revise the alignment of barriers and reduce this risk.
9
Motorcyclists traversing joints between AC and PCC surfaces may encounter uneven surface.
A-C • Monitor joints for settlement
Only an issue during construction. A note was placed for the RE to pay special attention to this issue during the paving of the median and subsequent stages.
10
SB off-ramp to Jurupa Avenue has a history of crashes.
C-D • Transverse rumble strips Caltrans reevaluated the crash data at this location and the possibility of putting transverse rumble strips at this location, chevron striping in the gore, or both.
11
Off-road crash risk was observed on I-15/I-10 system connector ramp.
B-D • Chevron markings • Low-growing shrubs in
gore • Extend existing guardrail
Chevron markings were added to the gore area by CCO.

25
Super-Slab®
The Super-Slab® precast concrete panel system manufactured by the Fort Miller Co., Inc. was used to replace cracked concrete pavement on portions I-15 near the interchange with I-10 in a complex traffic pattern area where ramps and auxiliary lanes merge with mainline lanes. A total of 662 panels were placed in continuous lane rehabilitation and 34 panels were used to replace individual failed existing panels. Figure 7 is a view of the outer lanes of northbound I-15 just before the I-10 overpass and connecting ramps.
Figure 7. View of the outer lanes of northbound I-15 just before the I-10 overpass.
The Super-Slab® system was designed as a reinforced concrete pavement with panels typically fabricated 12 ft wide by 16 ft long. These dimensions varied as required to meet the planned geometry and final grade of the pavement. Panel thickness varied from 9 to 12 in. The required thicknesses, superelevation, and warp were determined for each slab and documented in the plan documents, and each slab was fabricated for delivery to the site in accordance with the contractor’s schedule. A typical detail for a pavement cross section is shown in figure 8.

26
Figure 8. Typical plan details for Super-Slab®.
A typical panel was cast with load transfer dowels and dowel pockets on opposite ends. Once the panels were placed, the pockets were filled with high-strength grout to create load transfer capability from panel to panel. Panels were placed on a precisely graded subgrade surface, accomplished by using hand-operated grading equipment. Full panel support was assured by injecting bedding grout under the panels through grout distribution grooves cast into the bottom of the panels. The Super-Slab® system was designed to match the warp of the roadway surface caused by superelevation and/or cross slope. The x, y, and z values of every corner of every panel were computed before fabrication and were used to cast each panel and to level the base surface before installation. This was important because some panels were placed in a superelevation. Panels were precast about 25 mi from the project at a facility that provided covered casting beds and steam curing. Casting forms were adjusted to account for the warp of each panel. Conventional materials were used in the manufacturing process, such as lifting hardware, epoxy-coated steel reinforcing, and high-early concrete mix made with Type III cement. The panels

27
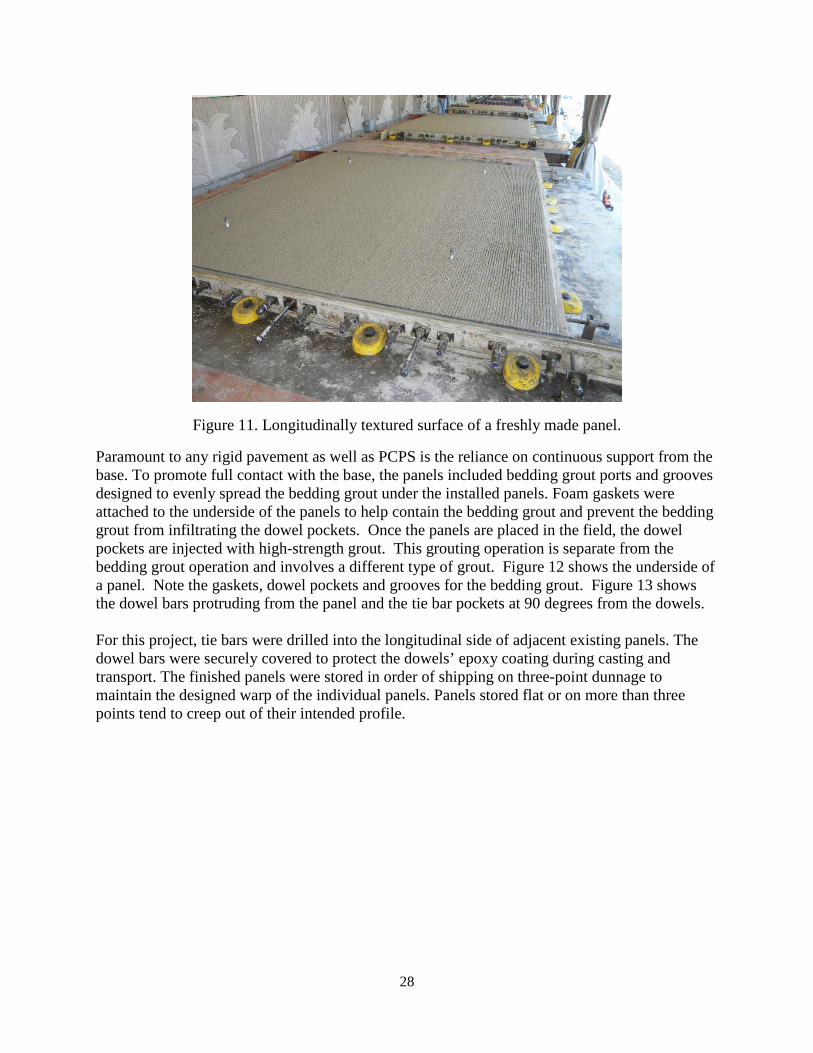
were leveled with a hand-operated roller screed and then received longitudinal brooming and tining. Figure 9 shows the reinforcing steel workers have arranged in a form before casting. Workers used the roller screed to level the panels, as seen in figure 10. Figure 11 shows the surface texture of a freshly made panel.
Figure 9. Epoxy-coated steel reinforcement is shown in a typical panel layout.
Figure 10. Workers use a roller-type screed to level the panels.
28
Figure 11. Longitudinally textured surface of a freshly made panel.
Paramount to any rigid pavement as well as PCPS is the reliance on continuous support from the base. To promote full contact with the base, the panels included bedding grout ports and grooves designed to evenly spread the bedding grout under the installed panels. Foam gaskets were attached to the underside of the panels to help contain the bedding grout and prevent the bedding grout from infiltrating the dowel pockets. Once the panels are placed in the field, the dowel pockets are injected with high-strength grout. This grouting operation is separate from the bedding grout operation and involves a different type of grout. Figure 12 shows the underside of a panel. Note the gaskets, dowel pockets and grooves for the bedding grout. Figure 13 shows the dowel bars protruding from the panel and the tie bar pockets at 90 degrees from the dowels. For this project, tie bars were drilled into the longitudinal side of adjacent existing panels. The dowel bars were securely covered to protect the dowels’ epoxy coating during casting and transport. The finished panels were stored in order of shipping on three-point dunnage to maintain the designed warp of the individual panels. Panels stored flat or on more than three points tend to creep out of their intended profile.

29
Figure 12. Underside of a panel. Note the gaskets, dowel pockets, and grooves for the bedding grout.
Figure 13. Underside of a panel. Note dowels bar and tie bar pockets.
The existing panels (often cracked at midlength) were sawcut in half longitudinally so the contractor could use the smallest excavator practical to lift the pieces off the roadbed and into dump-bed trucks for removal. This technique limited the amount of base disturbance. Pavement removal is illustrated in figure 14. Removing the existing panels was the critical task governing

30
the amount of production the contractor could achieve during each closure period. On average, the contractor could place 32 panels a night.
Figure 14. Existing panels were removed in manageable pieces.
After the panels were removed, the contractor used a milling machine to level the cement-treated base (CTB) as necessary. A milling machine with minimal distance between the cutting head and the housing is necessary to allow the machine to get as close to the excavated area as possible. Figure 15 shows the milling machine in operation.
Figure 15. A milling machine is used to level the CTB as needed.

31
A thin layer of bedding sand was placed and leveled with a track-mounted, hand-operated screed. The tracks used by the screed can be seen in Figure 16 as workers push the screed forward. These tracks are set by survey equipment, to ensure precise grading that incorporates panel warp and profile corrections. Workers made three passes, each time progressively leveling the base to the final grade. Grade control of the bedding layer is critical to ensure fully supported panels. Any small pockets under the panels can reliably be filled with the bedding grout.
Figure 16. Workers use a track-mounted screed to level the base.
The Super-Slab® panels were strong enough to allow the crane to sit on the previously placed panel while setting the next panel, as shown in Figure 17. This made for effective use of critical space in the work zone.
Figure 17. A panel is set in place.
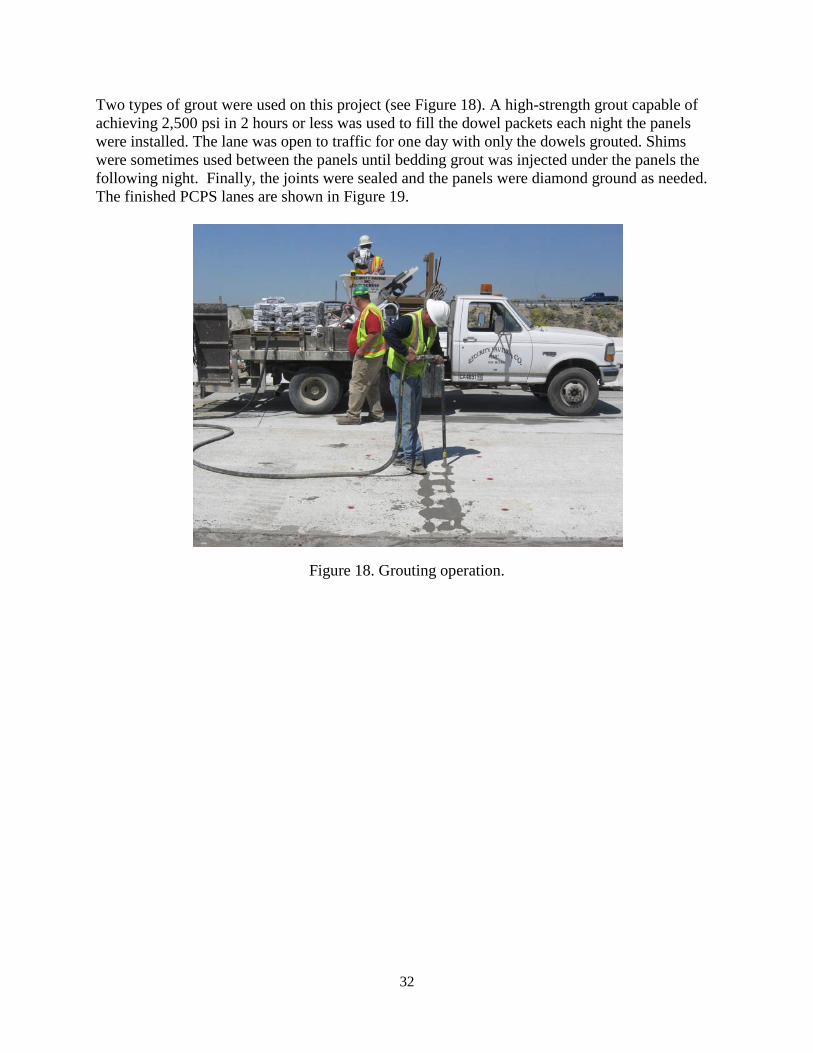
32
Two types of grout were used on this project (see Figure 18). A high-strength grout capable of achieving 2,500 psi in 2 hours or less was used to fill the dowel packets each night the panels were installed. The lane was open to traffic for one day with only the dowels grouted. Shims were sometimes used between the panels until bedding grout was injected under the panels the following night. Finally, the joints were sealed and the panels were diamond ground as needed. The finished PCPS lanes are shown in Figure 19.
Figure 18. Grouting operation.

33
Figure 19. Finished PCPS.
Installation and Production Rates for Super Slab® The contractor on the I-15 project achieved remarkable production rates. The innovators of the Super Slab® technology observed that this was the highest production in the field in tight work windows. The production rates by day, tabulated in table 8, indicate that the contractor did not need much time to familiarize the crew with the technology. It appears that good planning and attention to details contributed to the efficiency. An average of 33 slabs was installed per day and 32 slabs per nighttime work window. The Fort Miller Co., Inc. (owner of the Super-Slab technology) and Caltrans inspectors did note some issues during installation. The base layer grading was the primary concern, and the importance of grading and the provision of full support for the slabs was recognized in the process. Slabs without the specified support were found to eventually crack in the field, and about 25 percent of the slabs cracked after installation. Caltrans found a strong correlation between the days when grading issues were identified and slabs installed on those days cracked. It is likely that other factors contributed as well, such as opening to traffic with no shimming. The concern from a performance standpoint is that thin slabs leave little margin for error. Cracks were observed in some Super-Slab® panels shortly after the panels were installed and opened to traffic. Cores indicated that the cracks do not penetrate the full depth and the compressive strength of the cores was satisfactory. Petrographic analysis of the core samples also indicate that the material was well consolidated without the risk of durability-related problems. The majority of this cracking was very tight, and difficult to see with the naked eye. Due to this fact, and the presence of reinforcing steel in the panels, the panels were left in place, treated with methacrylate, and are being monitored for performance.
34
Figure 20. Cracked panel and core.

35
Table 8. Summary of PCPS panel installations by day.
Date Number of slabs (Count)
Length (m) (ft)
5/3/2010* 4 16.46 54.00 5/4/2010* 34 139.91 459.02 5/5/2010* 20 82.30 270.01 5/26/2010 21 86.42 283.51 6/1/2010 33 135.80 445.52 6/2/2010 33 135.80 445.52 6/3/2010 39 160.49 526.52 6/6/2010 21 86.42 283.51 6/7/2010 21 86.42 283.51 6/8/2010 39 160.49 526.52 6/9/2010 39 160.49 526.52 6/10/2010 33 135.80 445.52 6/14/2010* 29 119.34 391.52 6/15/2010* 51 209.87 688.55 6/17/2010 39 160.49 526.52 6/21/2010 39 160.49 526.52 6/22/2010 39 160.49 526.52 6/23/2010 39 160.49 526.52 6/24/2010 21 86.42 283.51 6/27/2010 18 74.07 243.01 7/9/2010* 84 345.66 1,134.05
*Not performed in 8-hour nighttime work window
36
DATA ACQUISITION AND ANALYSIS Data on safety, traffic flow, quality, and user satisfaction before, during, and after construction were collected to determine if this project met the HfL performance goals. The primary objective of acquiring these types of data was to quantify project performance and provide an objective basis from which to determine the feasibility of the project innovations and to demonstrate that the innovations can be used to do the following:
• Achieve a safer work environment for the traveling public and workers. • Reduce construction time and minimize traffic interruptions. • Produce a high-quality project and gain user satisfaction.
This section discusses how well the Caltrans demonstration project met the HfL performance goals related to these areas. SAFETY This portion of I-15 is considered one of the busiest in California because of the proximity to Ontario International Airport and the Port of Los Angeles. The higher volume of traffic associated with this stretch of highway is prone to higher crash rates than the statewide average for a similar type of facility. The project included the HfL performance goal of achieving a work zone crash rate equal to or less than the existing conditions. Caltrans’ crash records before the start of construction, between 2006 and 2009, indicate a crash rate of 1.030 per million vehicle-miles traveled (MVMT). Table 9 lists the breakdown of the crashes recorded before construction.
Table 9. Breakdown of the type and amount of crashes before construction.
Year Fatality Injury Property Damage
Only Total
2006 0 22 41 63 2007 0 25 49 74 2008 0 17 32 49 2009 0 6 8 14 Total 0 70 130 200
During construction, from 2009 to 2010, the crash rate dropped by half to 0.490 per MVMT, meeting the HfL goal. Table 10 lists the breakdown of the crashes recorded during construction. The reason for the reduced crash rate during construction was not clear because traditional rehabilitation methods took place concurrently with the installation of PCPS. Table 11 presents the post construction crash data of the facility by the county the pavement sections are located. The safety performance of the facility after construction was evaluated using pre and post construction crash rates. Table 12 shows the crash rates by severity type for both pre and post construction periods.

37
Table 10. Breakdown of the type and amount of crashes during construction.
Year Fatality Injury Property Damage
Only Total
2009 0 15 25 40 2010 1 7 17 25 Total 1 22 42 65
Table 11. Post construction crash data
Year Days ADT Length Fatalities Injuries PDO Total RIV 50 214000 0.807 0 3 4 7 SBD 50 205800 3.811 0 12 24 36 Total 50 209900 4.618 0 15 28 43
Table 12. Pre and post construction crash rates
Preconstruction Post construction Difference
Days of Coverage 1460 50 Average ADT 215600 209900 Section Length 4.618 4.618 Million Vehicle Miles Travelled 1453.6 48.5 Total Crashes 0.94 0.89 -5.6%
Fatalities 0.005 0.00 - Injuries 0.32 0.31 -1.8%
PDO 0.62 0.58 -6.8% As indicated in table 12, the total crashes decreased marginally by 5.6 percent after construction; the injury rates by 1.8 percent and the property damage rates by 6.8 percent. There was no fatal event after construction. Since the post construction data was available only for 50 days, the data coverage was statistically inadequate to conclude that the overall safety of the facility has improved after construction. The project included the performance goal of achieving an incident rate for worker injuries of less than 4.0 based on the OSHA 300 rate. The contractor indicated that the firm does not maintain records on a project basis and instead aggregates safety performance on an annual basis for all construction projects. Caltrans does not anticipate achieving a 20 percent reduction in fatalities and injuries in this section of I-15 because this is a rehabilitation project and the geometrics and other major features of the facility will remain the same at completion. Caltrans does anticipate a less tangible impact in reduced pavement maintenance costs because the higher quality PCPS is projected to have three times the lifespan of traditional RSC. This will result in less exposure of maintenance personnel to traffic, which further reduces worker injuries and construction work zone incidents.

38
CONSTRUCTION CONGESTION—EFFECT OF RAMP CLOSURES ON TRAVEL TIMES Introduction Freeway-to-freeway connectors and ramps were planned to be closed for 55-hour weekend periods over about 35 weekends to accommodate work on the connectors and ramps and within the mainline weaving areas. The I-15 Ontario corridor has consistently high weekday commuter traffic and similar volumes on weekends when leisure travelers from Los Angeles head to and from Las Vegas and resort locations along the Colorado River. In 2009, the annual average daily traffic (AADT) volumes on I-15 near the I-10 interchange were about 214,000 vehicles per day (vpd). About 40 to 50 percent of the I-15 traffic exits to I-10 from each direction. As stated earlier, rehabilitation around this interchange was the most critical for construction congestion and estimating delay times. Therefore, the analysis was performed when the ramp was closed during a 55-hour weekend closure. To assess the impacts of the ramp closures, the project team conducted a series of travel time runs to determine the additional time required to traverse the detour routes (compared to the normal travel route along I-15) and the total hours of vehicle delay per day that resulted from that detour. Travel time studies were conducted before closure of the northbound I-15 ramps to I-10, on April 24 and 25, 2010. Researchers returned to the site and collected travel times on July 10 and 11, 2010, with the exit ramps from northbound I-15 to eastbound and westbound I-10 closed. Data Collection The floating vehicle method was used to collect travel times, which attempts to mimic the typical driving speed of other vehicles along the various roadway segments of the detour route. During the April 2010 data collection, the exit ramp from southbound I-15 to Pomona Freeway (Route 60), which included a dropped lane on I-15, was closed. This closure created delays on southbound I-15. There were no closures in the northbound direction at this time. Data were collected again in July 2010 while the exit ramps from northbound I-15 to both eastbound and westbound I-10 were closed simultaneously, with separate detours for each movement. During this time, the exit ramp from southbound I-15 to Pomona Freeway was open. Data were collected only during daytime hours, since traffic demands were lower at night and thus any effects of the total roadway closure were smaller. Specifically, on Saturdays data were collected from 9 a.m. to noon and 3 to 6 p.m., and on Sundays from 10:30 a.m. to 3 p.m. A minimum of three travel time runs were made over each segment each day in each direction. Figure 21 identifies key nodes used in the travel time data collection process within the study region. Table 11 identifies the travel distance between nodes and the typical average speed on each segment during the April 2010 data collection. The analysis was based on the desire to compare travel times between northbound I-15 at Cantu-Galleano Road to westbound I-10 at Archibald Avenue and northbound I-15 at Cantu-Galleano Road to eastbound I-10 at Cherry Avenue.

39
Cantu-Galleano Road
Foothill Blvd. (US 66)
4th Street
Pomona Fwy (Route 60)
Figure 21. I-15 and I-10 ramp closure analysis region.
The normal routes for these segments in April 2010 were simply along the northbound I-15 direct connect ramps to I-10 in either direction. For the northbound I-15 to westbound I-10 detour route in July 2010, travelers continued along I-15 (past closed direct connect ramp) to the 4th Street exit, then along 4th Street westbound to the I-15 South entry ramp, then onto southbound I-15 to the exit ramp to westbound I-10. This detour added 1.8 mi to the segment length. For the northbound I-15 to eastbound I-10 detour, travelers exited at Jurupa Street, followed Jurupa Street eastbound to Etiwanda Avenue, turning left at the traffic signal onto northbound Etiwanda Avenue to the eastbound I-10 entry ramp. This detour added only 0.3 mi to

40
the segment length, but travelers also incurred delay because of the signalized intersection at Jurupa and Etiwanda. Analysis of the April 2010 data indicated significant travel time variations during each day for the northbound segments, so the data from the two days were analyzed separately. A similar result was obtained for much of the travel time data collected in July 2010. Consequently, those travel times were also analyzed separately by segment. A summary of distances and speeds is shown in table 13.
Table 13. Summary of distances and speeds on route segments in analysis region.
Movement
Distance (mi)
Saturday Average
Speed (mi/h)
Sunday Average
Speed (mi/h) April 2010
NB I-15 through movement 7.1 61 67 NB I-15 to WB I-10 6.9 40a 64 NB I-15 to EB I-10 7.3 49a 66 EB I-10 to NB I-15 5.3 61 58 WB I-10 to NB I-15 5.7 65 62 SB I-15 through movement 7.2 46b 46b
July 2010 NB I-15 through movement 7.1 38a 60 NB I-15 to WB I-10 Detour 8.7 29 44 NB I-15 to EB I-10 Detour 7.6 41 46 EB I-10 to NB I-15 5.3 35a 50 WB I-10 to NB I-15 5.7 30a 46 SB I-15 through movement 7.2 74 74
aSpeed reductions on northbound I-15 attributed to congestion near 4th Street exit ramp bSpeed reductions on southbound I-15 attributed to closure of ramp to Pomona Freeway (Route 60) Overall, average speeds for the primary movements being evaluated decreased when the detours were in place. For the northbound I-15 to westbound I-10 movement, speeds decreased 28 percent and 31 percent on Saturday and Sunday, respectively. This is not surprising because the geometric conditions on the 4th Street detour include two loop ramps with small radius curves. For the northbound I-15 to eastbound I-10 movement, speeds decreased 16 percent and 30 percent on Saturday and Sunday, respectively. This is also not surprising, given that traffic speeds include time stopped at any of the six signalized intersections along this detour route. For the northbound I-15 to westbound I-10 movement, a comparison of Saturday segment travel times between the two data collection periods is presented in table 14. Sunday segment travel times for this same movement are provided in table 15. Similarly, tables 16 and 17 provide travel times for Saturday and Sunday, respectively, for the northbound I-15 to eastbound I-10 movement.

41
Table 14. Saturday travel time comparisons for NB I-15 to WB I-10.
Segment Travel Time, minutes April 2010 July 2010 Difference
Cantu Galleano Road to Route 60 1.4 0.9 -0.5 Route 60 to Jurupa Street 3.3 3.6 0.3 Jurupa Street to I-10 exit ramp 1.0 2.4 1.4 I-10 ramp (April) or 4th Street detour (July) 0.9 6.9 6.0 I-10 entry ramp to Milliken Avenue 0.3 0.3 0.0 Milliken Avenue to Archibald Avenue 1.7 1.5 -0.2 TOTAL 8.6 15.6 7.0
Table 15. Sunday travel time comparisons for NB I-15 to WB I-10.
Segment Travel Time, minutes April 2010 July 2010 Difference
Cantu Galleano Road to Route 60 0.9 0.9 0.0 Route 60 to Jurupa Street 1.7 1.7 0.0 Jurupa Street to I-10 exit ramp 1.0 0.9 -0.1 I-10 ramp (April) or 4th Street detour (July) 0.8 5.8 5.0 I-10 entry ramp to Milliken Avenue 0.3 0.3 0.0 Milliken Avenue to Archibald Avenue 1.6 1.5 -0.1 TOTAL 6.3 11.1 4.8
Table 16. Saturday travel time comparisons for NB I-15 to EB I-10.
Segment Travel Time, minutes April 2010 July 2010 Difference
Cantu Galleano Road to Route 60 1.4 0.9 -0.5 Route 60 to Jurupa Street 3.3 2.8 -0.5 Jurupa Street to I-10 exit ramp (April) 1.0 --
3.2 I-10 ramp (April) 0.5 -- I-10 entry ramp to Etiwanda Avenue (April) 0.8 -- Jurupa Street to I-10 @ Etiwanda Avenue (June)
-- 5.5
Etiwanda Avenue to Cherry Avenue 1.7 1.5 -0.2 TOTAL 8.7 10.7 2.0

42
Table 17. Sunday travel time comparisons for NB I-15 to EB I-10.
Segment Travel Time, minutes April 2010 July 2010 Difference
Cantu Galleano Road to Route 60 0.9 0.9 0.0 Route 60 to Jurupa Street 1.7 1.6 -0.1 Jurupa Street to I-10 exit ramp (April) 1.0 --
3.3 I-10 ramp (April) 0.5 -- I-10 entry ramp to Etiwanda Avenue (April) 0.8 -- Jurupa Street to I-10 @ Etiwanda Avenue (June)
-- 5.6
Etiwanda Avenue to Cherry Avenue 1.5 1.5 0.0 TOTAL 6.4 9.6 3.2 Overall, the detour for northbound I-15 to westbound I-10 created an average of 5.9 additional minutes of weekend delay per vehicle when the ramp was closed between 9 a.m. and 6 p.m. This corresponds to an average 80 percent increase in travel time. In addition, the detour for northbound I-15 to eastbound I-10 added an average of 2.5 minutes of delay when the ramp was closed. This corresponds to an average 36 percent increase in travel time. Delay Analysis Results The total amount of delay incurred over the weekend closure was the sum of the additional travel times (and distance) for traffic normally exiting at the I-15/I-10 interchange (northbound on this particular weekend) and the traffic remaining on I-15 delayed by congestion when it occurred (in the northbound direction, it appears that delays were created at the 4th Street exit during the day on Saturday, but not on Sunday). Ramp ADTs for the interchange indicate that 54,000 vpd exit northbound. Typically, the number of weekend trips is slightly less than weekday trips. Although it was noted earlier that I-15 is used extensively on the weekends for travel between Los Angeles and Las Vegas, use of the northbound exit ramp from I-15 to I-10 was assumed to not maintain that same level of use on the weekend. Data from freeway facilities in Texas and elsewhere suggest that Saturday volumes are typically 92 percent of AADT values and Sunday volumes are typically 80 percent of AADT values. Consequently, it was assumed that 0.92 x 50,500 = 46,460 vehicles used the exit ramp on Saturday, and 0.80 x 50,500 = 40,400 vehicles used the ramps on Sunday. An additional 10 percent of daily traffic was assumed to normally use the ramps on Friday night (9 p.m. to midnight) and 7 percent was assumed to use the ramps on Monday morning (midnight to 5 a.m.). These two periods added 0.16*50,500 = 8,080 vehicles. For the entire closure period, a total of 94,940 vehicles had to divert to exit to I-10 from I-15 northbound. It was assumed that traffic split equally between eastbound and westbound on I-10. Based on these assumed ramp volumes, a total of (94,940/2*1.8) + (94,940/2*0.3) = 99,687 additional vehicle-miles traveled were incurred during the weekend closure. For travel time delays created, traffic normally exiting to I-10 westbound incurred (94,940/2*5.9/60) = 4,668 vehicle-hours of additional delay. For traffic normally exiting to I-10 eastbound, a total of (94,940/2*2.5/60) = 1,978 vehicle-hours of additional delay were incurred.

43
In addition to the delays incurred by exiting traffic, traffic remaining on I-15 through the interchange experienced congestion-related delays during part of the weekend closure. Based on travel time study data, it was assumed that congestion-related delays were experienced only on Saturday during daytime hours (9 a.m. to 7 p.m.). On Saturdays, about 60 percent of ADT traffic occurs during that time period. Assuming a conservative value of 92 percent of AADT traffic occurring on Saturdays, traffic heading northbound beyond the 4th Street exit was approximated as (0.92*0.60*214000/2 – 46460/2*.60) = 45,126 vehicles. During the hours of congestion, table 14 implies that northbound traffic was delayed an average of 4.1 minutes per vehicle at the 4th Street exit. Multiplying this value by the 45,126 vehicles indicates an additional 3,084 vehicle-hours of delay. Table 18 summarizes these numbers.
Table 18. Additional travel distance and delays incurred.
Measure Value Additional Travel Distance: Exit to I-10 Eastbound Exit to I-10 Westbound TOTAL
14,241 vehicle-miles 85,446 vehicle-miles 99,687 vehicle-miles
Additional Travel Time Delay: Exit to I-10 Eastbound Exit to I-10 Westbound I-15 Northbound TOTAL
1,978 vehicle-hours 4,668 vehicle-hours 3,084 vehicle-hours 9,730 vehicle-hours
Quality Pavement Test Site Researchers collected sound intensity (SI) and smoothness test data from a 2,000-ft section of the outermost lane of northbound I-15 beginning at the ramp to I-10 eastbound. Comparing this data before and after construction provides a measure of the quality of the finished pavement. Sound Intensity Testing Researchers recorded SI measurements using the current accepted OBSI technique described in American Association of State Highway and Transportation Officials (AASHTO) TP 76-10, which includes dual vertical sound intensity probes and an ASTM-recommended standard reference test tire (SRTT). SI data collection occurred before construction and on the new pavement shortly after opening to traffic. The SI measurements were recorded and analyzed using an onboard computer and data collection system. The two SI probes simultaneously captured noise data from the leading and trailing tire–pavement contact areas. Figure 22 shows the dual probe instrumentation and the tread pattern of the SRTT.

44
Figure 22. OBSI dual probe system and the SRTT. The average of the front and rear OBSI values was computed to produce the global SI level. Raw noise data were normalized for the ambient air temperature and barometric pressure at the time of testing. The resulting mean SI level was A-weighted to produce the SI frequency spectra in one-third octave bands, as shown in figure 23.
315 400 500 630 800 1000 1250 1600 2000 2500 3150 4000Preconstruction 89.9 91.9 94.4 96.9 102.5 102.2 98.9 99.0 96.2 91.4 89.0 88.2Postconstruction 84.3 85.3 89.5 95.8 96.5 94.4 93.6 91.0 88.1 84.1 80.8 78.8
65.0
70.0
75.0
80.0
85.0
90.0
95.0
100.0
105.0
Soun
d In
tens
ity, d
B(A)
Frequency, Hz
Figure 23. Mean A-weighted SI frequency spectra before and after construction.
Global SI levels were calculated using logarithmic addition of the one-third octave band frequencies across the spectra. The global SI value was 108.3 dB(A) for the existing pavement and 102.4 dB(A) for the new pavement. While not meeting the HfL goal of 96.0 dB(A), the 5.9 dB(A) drop in SI is a significant improvement. Overall, each frequency was reduced, indicating the absence of the distinct tone or whine common to concrete pavement with a transverse or overly aggressive surface texture.

45
Smoothness Measurement Smoothness testing was done in conjunction with SI testing using a high-speed inertial profiler attached to the test vehicle. The smoothness, or profile, data were collected from both wheelpaths and averaged to produce an IRI value. A low value is an indication of higher ride quality (i.e., smoother road). Figure 24 shows the test vehicle with the profiler positioned in line with the right rear wheel. Figure 25 graphically presents the IRI values for the preconstruction and newly constructed pavement. Two bridge decks were excluded from the data set. The existing distressed pavement had a 225 in/mi value and the new pavement was 66 in/mi. Again, while not meeting the HfL goal of 48 in/mi, the 66 in/mi is much smoother than the existing pavement and a noticeable improvement.
Figure 24. High-speed inertial profiler mounted behind the test vehicle.

46
Figure 25. Mean IRI values before and after construction. USER SATISFACTION The HfL requirement for user satisfaction includes a performance goal of 4 or more on a Likert scale of 1 to 7 (in other words, 57 percent or more participants showing favorable response) for the following two questions:
• How satisfied is the user with the new facility compared with its previous condition? • How satisfied is the user with the approach used to construct the new facility in terms of
minimizing disruption? Instead of the HfL questions, Caltrans posed 12 alternative questions to roadway users, asking them to rate their responses or to select an answer category. The survey questions and responses are documented in an Appendix to this report. Thirty-six survey responses were received and analyzed. Most respondents (23 out of 36 or 63 percent) either agreed or strongly agreed with question 12, indicating they were satisfied with the rehabilitated pavement. This question is similar to the HfL question on how satisfied the user is with the new facility. Twenty-six out of 36 (or 72 percent) of respondents to question 11 supported Caltrans' measures to minimize traffic impact, indicating a favorable response to the HfL question gauging how satisfied the user is with the approach used to construct the new facility in terms of minimizing disruption. Complete survey results are in the appendix.
0
50
100
150
200
250
300
0 500 1,000 1,500 2,000
IRI,
in/m
i
Distance, ft
Preconstruction Postconstruction
Preconstruction Mean IRI = 225 in/mi
Postconstruction Mean IRI = 66 in/mi
BridgeBridge

47
While the survey was not formatted to a 7-point Likert scale, the favorable response to both HfL questions were 63 percent or better, which meets the goal of 4 or more points on a 7-point Likert scale or the equivalent of 57 percent of users being satisfied.

48
TECHNOLOGY TRANSFER Two technology transfer events were organized in connection with the I-15 rehabilitation project to promote the innovative technologies used on the project. The first was a July 21–23, 2008, workshop on RSAs held before the start of construction and the second was a PCPS showcase during slab replacement activities held June 22–23, 2010. RSA TECHNOLOGY The workshop included a technical workshop on RSA concepts in a lecture format as well as a practical RSA exercise on a real-world project. The course, conducted on the Caltrans District 8 premises, was attended primarily by Caltrans staff with interest in safety aspects of projects during the design or construction stage or roadways in service. Several individuals working on the I-15 project participated in the event. The goals of the workshop were to explain the RSA process and how it can make roadways safer and to enable participants to apply their knowledge and skills through a practice RSA on the I-15 project. Craig Allred of the FHWA Resource Center conducted the workshop. Allred and Margaret Gibbs of Opus Hamilton in Canada oversaw the RSA exercise on the I-15 project. Gibbs prepared the final report summarizing the RSA team’s findings. The lecture phase of the workshop accomplished the following:
• Introduced RSAs as a useful tool to reduce traffic injuries and fatalities • Explained the need for RSAs • Explained the benefits of RSAs • Listed the resources available to facilitate the RSA process • Described the steps involved in conducting the RSA process • Described how to perform and document a simple RSA as a member of an RSA team • Identified time, cost, and liability barriers and explained solutions to those concerns
During the second phase of the workshop, an RSA team of workshop participants was assembled that included individuals not closely involved in the design phase of the project. The careful selection of RSA team members was primarily to exclude biased inputs. The RSA recommendations are summarized in table 7 of this report. Also listed are Caltrans responses to the recommendations, including why some were not implemented. PCPS TECHNOLOGY The second technology transfer activity organized during this project was a showcase on PCPS technology, which included a workshop, a tour of the precast facility, and a site visit to observe actual slab installations. The showcase was conducted over two days. The event was given a great deal of publicity (see announcement in figure 26) and attracted participants from all over the country. The program opened with a welcome address by Dr. Ray Wolfe, Caltrans District 8 director, and included the following presentations:

49
• "Overview of the HfL Program," by Cindy Vigue, director of state programs for FHWA's
California Division • "Overview on the Caltrans Project and Project Innovations," by Jonathan den Hartog of
Caltrans District 8 • "Construction Sequencing," by Peter Smith of Fort Miller Co.
Next, after a jobsite safety briefing, the participants observed the installation of PCPS slabs on the I-15 site during the nighttime work windows. The next morning, the participants visited the precast plant to observe the casting process. The participants viewed the formwork, the placement of reinforcement steel and concrete, the finishing, and the curing process. They also looked at the stockpiling of the finished slabs ready for trucking to the site. The participants returned to a lecture and discussion setting for the following presentations:
• "PCPS—A Part of the Pavement Management Toolkit," by Dr. Chetana Rao of ARA, Inc.
• "Road Safety Audit Process," by Craig Allred of FHWA's Resource Center • "Dynameq," by Jonathan den Hartog of Caltrans District 8 • "CA4PRS Analysis," by den Hartog • "PCPS Overview and Alternate Systems," by Sam Tyson of FHWA
The session ended with a panel discussion involving all participants.
Figure 26. Project showcase event announcement and invitation.
50
Figure 27. Presenters at the HfL showcase.
Figure 28. Participants in the workshop conducted as part of the HfL showcase.

51
Figure 29. Site visits during the HfL showcase included I-15 PCPS installation site (top) and precast plant (bottom).

52
ECONOMIC ANALYSIS A key aspect of HfL demonstration projects is quantifying, as much as possible, the value of the innovations deployed. This involves comparing the benefits and costs associated with the innovative project delivery approach adopted on an HfL project with those from a more traditional delivery approach on a project of similar size and scope. The latter type of project is referred to as a baseline case and is an important component of the economic analysis because it serves as the control for all cost comparisons. The details of the control case are in many cases assumed because quantitative information from the project does not exist for all parameters considered in the economic analysis. In contrast, the values are typically available for the specific project. Several innovations were adopted in the CA I-15 project. It was not possible to perform an economic analysis for each innovation because the economic impacts of each could not be isolated. For example, it is not possible to estimate the improvement in work zone crash rates solely from RSA recommendations. Also, the preconstruction analysis performed with the use of CA4PRS and Dynameq influenced the construction staging and construction alternatives selected. In addition, the CA4PRS analysis was based on projected economic benefits. The cost analysis performed in this study was therefore limited to the impact of the major innovation recognized by HfL, which is PCPS. The baseline case assumed here was the use of a fast-setting concrete mix that not only would be the alternative Caltrans would select for areas that were repaired using PCPS, but also would allow similar work windows. The contractor’s production rates with the use of the 4x4 mix elsewhere in the project were available for use in this analysis. For several reasons, beyond the limited scope of the Super Slab® repair area the project involved the addition of two lanes in the median to accommodate traffic. This rehabilitation alternative, selected primarily from CA4PRS analysis, resulted in no reduction in lane capacity or additional delays from lane closures for PCPS installation. This factor had a great impact on the economic analysis. For this economic analysis, Caltrans supplied the cost figures for the as-built project and baseline construction. Traditional methods would have involved the use of RSC using cast-in-place techniques. This analysis disregards the innovative approach used to determine the optimal staging plan for the rehabilitation activities because the relative benefit of the alternate staging scenarios have been previously discussed. Instead, the focus is the cost differential between PCPS and the baseline case of using RSC. In either rehabilitation case, the work would be done during 8-hour nighttime lane closures from 9 p.m. to 5 a.m. The analysis and performance period is a 30-year service life for PCPS and 10-years for RSC (based on Caltrans’ experience). Two scenarios were examined to evaluate the economic efficiency and life cycle performance of the PCPS innovation:
• Scenario A was the total project cost and impact of performance of PCPS versus RSC.
• Scenario B was the panel replacement costs and impact of performance of PCPS versus RSC.

53
Details of the scenarios are in table 19.
Table 19. Analysis scenarios.
Input Scenario A: Total Project Costs Scenario B: Panel Replacement Costs Agency costs Total project costs
• PCPS—bid price • RSC—adjusted bid price
Panel replacement cost • Based on project length and $/m3
Mobilization and traffic control
Included in total project costs Added costs • 5 percent mobilization • 2 percent traffic control
Maintenance costs at 10 and 20 years
Costs for RSC only • Panel replacement • 5 percent mobilization • 2 percent traffic control
Costs for RSC only • 5 percent mobilization • 2 percent traffic control
Work zone length 4.7 mi (total project length) 1.48 mi (panel replacement length
including work zone buffer space and tapers)
Work zone crash rate Crash rate during construction Cost modification factor applied to preconstruction crash rates
Mobility analysis Traffic demand capacity analysis with all four lanes open and a work zone speed limit of 65 mi/hr
Traffic demand capacity analysis conducted with three of four lanes open and a work zone speed limit of 65 mi/h
AGENCY COSTS A total of 696 precast panels were installed, 440 panels during nighttime closures and 256 during the day. Daytime installation costs vary from nighttime costs because of worker pay rates, among other factors. Only nighttime installations were considered in the agency costs. Table 20 presents the agency costs, production rates, and duration to install 440 panels.
Table 20. Agency costs.
Production Rates and Costs PCPS RSC
Production rate (panels/night) 32 100 (about) Production rate (m/night) 131.7 410
Material cost ($/m3) 2,090 (418/m2) 628 Panel installation cost ($) 2,768,796 831,964
Installation duration (days) 14 5 USER COSTS Generally, three categories of user costs are used in an economic/life-cycle cost analysis: vehicle operating costs (VOC), delay costs, and safety-related costs. The cost differential in delay costs and safety costs were considered different enough to be included in a comparative analysis of cost differences between the baseline and as-built alternatives.

54
Delay Costs The PCPS replacement was done on the two outermost lanes on each direction during nighttime. Four lanes of traffic were still maintained during closure by shifting the mainline traffic onto the median shoulders. This MOT strategy did not result in significant reduction in roadway capacity or speed before and during work zone. Therefore, the computation of delay costs and VOC was not required. Safety Costs The computation of work zone crash costs involved the following key steps (Mallela and Sadasivam, 2011):
1. Determine preconstruction and work zone crash rates. Estimate the traffic exposure measure in terms of million vehicle miles traveled (MVMT) and convert crash counts to crash rates (i.e. crash counts normalized to traffic exposure or crashes/MVMT).
2. Estimate unit crash costs by severity type. Adjust unit costs to current year dollars if necessary.
3. Compute work zone crash costs for the project. Step 1. Determine Preconstruction and Work Zone Crash Rates As stated earlier, this was a major rehabilitation project with five major and numerous minor construction stages. The construction work spanned over 400 working days involving both weekend and nighttime closures. Since the project duration was long, the actual work zone crash counts by the severity of crash type following KABCO scale and the exposure were available. Further, as the 4.617-mile roadway section under rehabilitation stretched over two counties: 0.807-mile section in Riverside and 3.81-mile in San Bernardino counties; separate crash counts were provided for the roadway sections in Riverside and San Bernardino-See Table 21.
Table 21. Preconstruction and during construction crash counts.
Crash Severity Level During Construction Crash Counts Preconstruction Crash Counts Riverside San Bernardino Riverside San Bernardino
Fatal 1 4 0 7 Injury 22 139 70 388 PDO 42 438 130 767
Traffic Exposure, MVMT 132.2 600.7 194.6 883.2
Table 21 also presents the preconstruction crash counts to evaluate if the work zones crash rates are equal to or less than the preconstruction rate at the project location. Table 22 presents the preconstruction and during construction crash rates. As indicated, the work zone crash rates for injuries and PDO types are less than those of preconstruction crash rate, while the work zone fatality rate is almost equal to that of crash fatality rate prior to construction.

55
Table 22. Preconstruction and during construction crash rates.
Crash Severity Level
During construction Preconstruction Total Riverside San
Bernardino Riverside San
Bernardino During
Construction Preconstruction
Fatal 0.0076 0.0067 0.0000 0.0079 0.0068 0.0065 Injury 0.1664 0.2314 0.3597 0.4393 0.2197 0.4249 PDO 0.3177 0.7291 0.6680 0.8684 0.6549 0.8323
Step 2. Estimate Unit Crash Rates Monetary damage of the crash incidents presented in Table 21 were not available; therefore, the monetary values in terms of human costs (i.e. tangible damage) and comprehensive costs (i.e. both tangible and intangible damage) were assumed based on national averages reported in a FHWA study.2 The reported crash cost estimates were in 2001 dollars and were adjusted to 2011 dollars using the Bureau of Labor Statistics (BLS) indices: Consumer Price Index (CPI) and Employment Cost Index (ECI). Table 23 presents the estimated crash costs per incident by crash type in both 2001 and 2011 dollars. The 2011 comprehensive crash costs in table 23 were normalized to the crash events happened on this roadway section using the preconstruction and during construction crash rates reported in table 22.
Table 23. Unit comprehensive crash costs estimated for this project.
$ per incident $ per MVMT ** Severity Level 2001 $ 2011 $* Preconstruction During Construction Fatal $4,106,620 $5,277,605 $34,276.52 $36,005 Injury $98,752 $125,202 $53,203.25 $27,504 PDO $7,800 $9,706 $8,077.62 $6,357
Total crash costs per MVMT for this project $95,557 $69,865 *Adjustment factor based on BLS CPI and ECI ** Normalized with pre- and during construction crash rates presented in table 22. $/MVMT = $/incident * crash rate
Step 3. Compute work zone crash costs for this project. To perform life cycle cost analysis, current and future work zone crash costs were computed for both PCPS and RSC alternatives. The current work zone crash costs were computed using the during construction crash rates, while to compute future crash costs, future work zone crash rates were estimated.
2 These costs were based on F. Council, E. Zaloshnja, T. Miller, and B. Persaud, Crash Cost Estimates by
Maximum Police-Reported Injury Severity Within Selected Crash Geometries (FHWA-HRT-05-051), Federal Highway Administration, Washington, DC, October 2005.

56
Current work zone crash costs The current work zone crash costs were computed by multiplying the work zone traffic exposure for the entire duration of road closure and the estimated during construction cost per MVMT from Table 23. The work zone traffic exposure is different for PCPS and RSC alternatives as their installation duration. Since the installation durations are different, work zone traffic exposure is computed for the PCPS and RSC alternatives as follows: Traffic Exposure (MVMT) = ADT * Project Length*Number of Installation Days / 1,000,000 Scenario A. Total Project Cost To perform life cycle analysis for Scenario A, the entire work zone of 4.617 mile long is considered. Traffic Exposure for PCPS = 117,000 veh * 4.617 miles* 14 days /1,000,000 = 7.563 MVMT Traffic Exposure for RSC = 117,000 veh * 4.617 miles* 14 days /1,000,000 = 2.701 MVMT Work zone crash cost = Traffic exposure * $/MVMT Current work zone crash cost for PCPS =7.563 MVMT * $ 69,865/MVMT = $ 528,367 Current work zone crash cost for RSC = 2.701 MVMT * $ 69,865/MVMT = $ 188,702 Scenario B. Panel Replacement Cost To perform life cycle analysis for Scenario B, only the pavement section where the panels are replaced, which is 1.482 mile long, is considered Traffic Exposure for PCPS = 117,000 veh * 1.482 miles* 14 days /1,000,000 = 2.428 MVMT Traffic Exposure for RSC = 117,000 veh * 1.482 miles* 14 days /1,000,000 = 0.867 MVMT Work zone crash cost = Traffic exposure * $/MVMT Current work zone crash cost for PCPS = 2.428 MVMT * $ 69,865/MVMT = $ 169,599 Current work zone crash cost for RSC = 0.867 MVMT * $ 69,865/MVMT = $ 60,571
Future work zone crash costs To facilitate the life cycle cost comparison between PCPS and RSC alternatives, the following assumptions were made:
• Over a 30-year analysis period, the future work zone crash costs are required only for RSC alternative at years 10 and 20. Since no rehabilitation is expected during the analysis period, the future work zone crash costs are not required for the PCPS alternative.
• Future work zone crash rates would not same as the during construction crash rate; rather, the crash rates were estimated by increasing the preconstruction crash rates by a factor

57
1.63 based on a study conducted by Ullman et al.3 Ullman et al investigated the safety of work zones for various scenarios: (1) crashes during daytime and nighttime work periods when lanes were closed and work was ongoing, (2) crashes when work was ongoing but no closures were required, and (3) crashes when no work was ongoing (the work zone was inactive). They concluded that crashes increased 60 to 66 percent (an average of 63 percent) when a traffic lane was closed day or night.
• For future rehabilitation, the work zone closure is not required for the entire current work zone of 4.617 miles. Only the 1.482-mile long pavement section where the RSC alternative is placed requires lane closure.
The future work zone crash costs were computed by multiplying the work zone traffic exposure, the estimated future work zone crash cost per MVMT. Since the estimated crash costs are normalized to crash rates of this roadway section, the future work zone crash cost per MVMT can be estimated by multiplying the preconstruction crash cost/MVMT from Table 23 with the work zone crash risk factor of 1.63. Future crash cost for the RSC alternative = (ADT * Project Length * Number of Days) *
Preconstruction Crash Cost/MVMT * 1.63 = (117,000 veh * 1.482 mile s * 5 days) * $ 95,557 * 1.63
= $ 135,039 Work Zone Road User Costs The work zone road user cost is the sum of delay costs, VOC and crash costs. Since delay and VOC costs are not computed for this project, the work zone road user costs include only the crash costs as computed in the previous paragraphs. The final estimates of work zone road user costs both PCPS and RSC alternatives over the 30-year life cycle period are presented in Table 24.
Table 24. Work zone road user costs for LCCA.
Year PCPS RSC Year 0 –Total Project Cost $ 528,367 $ 188,702
Year 0 – Panel Replacement Cost
$ 169,599 $ 60,571
Year 10 Not required $ 135,039 Year 20 Not required $ 135,039
LIFE CYCLE COST ANALYSIS A life cycle cost analysis (LCCA) based on a 2.3 percent discount rate and present worth method is discussed to provide a detailed context to compare both cost scenarios. A deterministic approach was used to examine the initial rehabilitation and future maintenance and rehabilitation (M&R) costs over the service life of the scenarios. 3 Ullman, G.L., M.D. Finley, J.E. Bryden, R. Srinivasan, and F.M. Council, Traffic Safety Evaluation of Nighttime and Daytime Work Zones (NCHRP Report 627), National Cooperative Highway Research Program, Transportation Research Board, Washington, DC, 2008.

58
The agency and user costs and the timing of these costs from the initial rehabilitation and subsequent M&R activities were combined to formulate a projected expenditure stream for case A and case B. The anticipated net present value (NPV) of future costs of the expenditure stream was calculated by using the discount rate, allowing for a direct dollar-for-dollar comparison. The salvage value, or the value of the remaining useful service life of the initial construction and the remaining usefulness of the last M&R activity, was assumed to be negligible in either scenario. The NPV was calculated as follows: where: NPV = net present value, $ i = discount rate, percent n = time of future cost, years The PCPS alternative as part of the total project cost is $1,253,106 or 2.5 percent of the baseline option in combined agency costs and road user costs in scenario A. On the other hand, considering only the panel replacement costs, the LCCA of scenario B reveals a difference of $710,571 or 29 percent. This analysis illustrates that the use of PCPS has a small impact on the overall project budget. The projected expenditure streams are shown in tables 25 and 26.
Table 25. Case A: total project costs.
( )∑
++= ni
CostFutureCostInitialNPV1
1*
Event Cost Item PCPS RSC
Year 0
Agency costs $51,863,900 $48,643,900
Road user costs $528,367 $188,702
Total costs $52,392,267 $48,832,602
Year 10
Agency costs $0 $1,476,600
Road user costs $0 $135,039
Total costs $0 $1,611,639
Discounted costs* $0 $1,283,842
Year 20
Agency costs $0 $1,476,600
Road user costs $0 $135,039
Total costs $0 $1,611,639
Discounted costs* $0 $1,022,716
Total Net Present Value $52,392,267 $51,139,160
Difference in Net Present Value 2.5 percent

59
Table 26. Case B: panel replacement costs.
Event Cost Item PCPS RSC
Year 0
Agency costs $2,962,612 $890,201
Road user costs $169,599 $60,571
Total costs $3,132,211 $950,772
Year 10
Agency costs $0 $890,201
Road user costs $0 $137,525
Total costs $0 $1,027,726
Discounted costs* $0 $818,692
Year 20
Agency costs $0 $890,201
Road user costs $0 $137,525
Total costs $0 $1,027,726
Discounted costs* $0 $652,175
Total Net Present Value $3,132,211 $2,421,640
Difference in Net Present Value 29 percent COST SUMMARY A close look at the agency costs and user costs during initial construction and M&R activities suggests these costs differ by less than 3 percent. The narrow LCCA differential is considered insignificant, given the extent of variables in the analysis. No tangible total cost savings were realized in this demonstration project. However, when the LCCA performed to compare the precast panel replacement with RSC showed a significant advantage for the former although the initial cost was much higher.
60
APPENDIX: USER SATISFACTION SURVEY AND RESULTS The following questions were by Caltrans to judge the highway users’ reaction to the I-15 rehabilitation project.
1. How often do you drive through the project location? a. More than once a week b. Weekly c. Monthly d. Less than once a month
2. Have you driven through the project site during a weekend closure? a. Yes b. No
3. What is your preferred method for getting road conditions and traffic information? a. Newspaper b. Radio c. Television d. E-mail e. Internet
4. When using the Internet to plan your drive, what is your primary online source? a. Google b. Caltrans Web site c. Facebook d. Twitter e. I don’t use the Internet to plan my drive
5. How often do you seek or receive Interstate 15-ONTFIX traffic-related information? a. Daily b. Weekly c. Biweekly d. Monthly e. Never
6. How helpful are the Interstate 15-ONTFIX project information updates in planning your commute?
a. Not helpful b. Somewhat helpful c. Adequate d. Very helpful e. Not applicable
7. Please rate the importance (1–5) of the following information sources: (1 = Least Important; 5 = Most Important)
o Project brochure o Project rack card o E-mail alert o Twitter update o Radio advertisement o Newspaper advertisement

61
o Public meeting 8. Extended (55-hour) weekend closures help Caltrans build a longer lasting pavement.
They require significantly fewer closures than if the work is only done at night. Thus, fewer extended weekend closures are preferred over many more nighttime closures.
a. Strongly disagree b. Disagree c. Neither agree nor disagree d. Agree e. Strongly agree
9. This project widened bridges and paved the median to avoid reducing the number of lanes during construction and to allow replacing deteriorated pavement with a longer lasting concrete. Thus, the 20 percent additional cost was worth it.
a. Strongly disagree b. Disagree c. Neither agree nor disagree d. Agree e. Strongly agree
10. Caltrans is testing the use of a precast pavement (Super Slab®) on a small portion of this project. This product has an estimated 30 to 40 year pavement life, and can be placed during nighttime closures. Traditional pavement placed in similar closures has an estimated 10-year life. Although this product costs 1.5 to 2 times more, Caltrans should use this product in pavement work for areas of very high traffic.
a. Strongly disagree b. Disagree c. Neither agree nor disagree d. Agree e. Strongly agree
11. Please indicate your agreement or disagreement with the following statement: I support the measures Caltrans took to minimize impacts to traffic for this project.
a. Strongly disagree b. Disagree c. Neither agree nor disagree d. Agree e. Strongly agree
12. Please indicate your agreement or disagreement with the following statement: I am satisfied with the rehabilitation of the pavement constructed in this project.
a. Strongly disagree b. Disagree c. Neither agree nor disagree d. Agree e. Strongly agree
Table A-1 presents the findings of the results.

62
Table A-1. User satisfaction survey results.
QUESTION #1 HOW OFTEN
DRIVE THROUGH PROJECT
LOCATION
QUESTION #2 EXPERIENCE
WITH WEEKEND CLOSURE
QUESTION #3 PREFERRED
METHOD FOR GETTING
INFORMATION
QUESTION #4 ONLINE SOURCE OF TRAVEL PLANNING
INFORMATION
QUESTION #5 HOW
OFTEN DO YOU SEEK INFORMA-
TION
QUESTION #6 HOW
HELPFUL WERE
UPDATES
QUESTION #7 RATE THE FOLLOWING SOURCES OF INFORMATION
QUESTION #8 WEEKEND CLOSURES
QUESTION #9 WAS 20% ADDED COST
WORTH IT
QUESTION #10 SHOULD CALTRANS USE SUPER-SLAB®
ON SIMILAR PROJECTS
QUESTION #11 TRAFFIC IMPACT
SUPPORT
QUESTION #12 PAVEMENT REHAB
SATISFACTION TWITTER RADIO NEWSPAPER PUBLIC MEETING
E-MAIL BROCHURE RACK CARD
More than once a week
No E-mail Caltrans Web site
Weekly Adequate 5 4 2 3 1 2 5 Strongly agree Strongly agree Strongly agree Strongly agree Strongly agree
More than once a week
Yes E-mail Caltrans Web site
Weekly Very helpful
5 4 5 5 1 5 5 Strongly disagree Strongly disagree Strongly disagree Strongly disagree Strongly disagree
Monthly Yes E-mail Other Web site Monthly Somewhat helpful
2 2 3 5 1 5 5 Neither agree nor disagree
Neither agree nor disagree
Strongly agree Agree Neither agree nor disagree
Weekly Yes Radio Google Never Not helpful 5 1 5 2 3 5 5 Neither agree nor disagree
Agree Neither agree nor disagree
Agree Agree
More than once a week
Yes Radio Caltrans Web site
Biweekly Adequate 3 1 1 4 1 4 5 Agree Agree Agree Agree Agree
More than once a week
No Radio Caltrans Web site
Weekly Very helpful
1 1 3 2 1 3 4 Strongly agree Agree Agree Agree Agree
More than once a week
Yes Radio Google Weekly Somewhat helpful
1 1 3 5 2 4 5 Strongly agree Agree Agree Strongly agree Strongly disagree
More than once a week
Yes Internet Twitter Biweekly Adequate 2 5 5 5 1 2 3 Agree Agree Agree Agree Neither agree nor disagree
More than once a week
Yes Internet Caltrans Web site
Weekly Adequate 1 4 5 5 3 5 5 Neither agree nor disagree
Neither agree nor disagree
Agree Disagree Disagree
Less than once a month
No Radio Caltrans Web site
Never Not applicable
4 1 3 1 1 1 4 Strongly disagree Strongly disagree Strongly agree Strongly agree Strongly agree
Monthly No Internet Caltrans Web site
Weekly Very helpful
1 2 2 2 1 1 5 Strongly agree Strongly agree Strongly agree Strongly agree Strongly agree
Weekly No Radio Google Never Not applicable
2 2 3 3 2 4 4 Agree Agree Agree Agree Agree
More than once a week
Yes Internet Caltrans Web site
Daily Very helpful
1 1 1 1 1 1 1 Strongly agree Strongly agree Strongly agree Strongly agree Strongly agree
More than once a week
No Internet Caltrans Web site
Weekly Very helpful
5 5 5 5 4 2 2 Strongly agree Strongly agree Agree Strongly agree Agree
More than once a week
No Internet Caltrans Web site
Weekly Very helpful
5 5 5 5 4 2 2 Strongly agree Strongly agree Agree Strongly agree Agree
Weekly No Internet Caltrans Web site
Biweekly Adequate 2 2 1 4 3 5 5 Neither agree nor disagree
Neither agree nor disagree
Strongly agree Agree Neither agree nor disagree
Weekly Yes Internet Google Monthly Somewhat helpful
1 3 1 2 5 3 4 Strongly agree Strongly disagree Strongly agree Agree Neither agree nor disagree
Weekly Yes Internet Caltrans Web site
Never Not applicable
5 5 5 5 5 5 5 Strongly disagree Strongly disagree Strongly disagree Strongly disagree Strongly disagree
Weekly Yes Internet Other Web site Daily Somewhat helpful
2 1 1 1 2 3 3 Neither agree nor disagree
Agree Strongly agree Agree Strongly agree
More than once a week
Yes Radio Other Web site Never Not applicable
5 1 1 4 2 3 4 Neither agree nor disagree
Agree Strongly agree Neither agree nor disagree
Agree
More than once a week
Yes E-mail Caltrans Web site
Weekly Somewhat helpful
3 5 5 5 1 3 5 Strongly agree Strongly agree Agree Agree Disagree
Monthly No Radio Twitter Monthly Adequate 1 1 5 3 3 2 2 Agree Agree Agree Agree Strongly disagree
More than once a week
No Internet Caltrans Web site
Never Very helpful
4 2 2 4 1 2 4 Strongly agree Strongly agree Strongly agree Strongly agree Strongly agree
More than once a week
Yes Internet Google Weekly Somewhat helpful
4 4 4 4 3 1 3 Strongly agree Strongly disagree Disagree Disagree Agree
More than once a week
Yes radio Other Web site Never Not applicable
5 5 5 5 5 5 5 Strongly agree Strongly agree Strongly agree Strongly agree Strongly agree

63
QUESTION #1 HOW OFTEN
DRIVE THROUGH PROJECT
LOCATION
QUESTION #2 EXPERIENCE
WITH WEEKEND CLOSURE
QUESTION #3 PREFERRED
METHOD FOR GETTING
INFORMATION
QUESTION #4 ONLINE SOURCE OF TRAVEL PLANNING
INFORMATION
QUESTION #5 HOW
OFTEN DO YOU SEEK INFORMA-
TION
QUESTION #6 HOW
HELPFUL WERE
UPDATES
QUESTION #7 RATE THE FOLLOWING SOURCES OF INFORMATION
QUESTION #8 WEEKEND CLOSURES
QUESTION #9 WAS 20% ADDED COST
WORTH IT
QUESTION #10 SHOULD CALTRANS USE SUPER-SLAB®
ON SIMILAR PROJECTS
QUESTION #11 TRAFFIC IMPACT
SUPPORT
QUESTION #12 PAVEMENT REHAB
SATISFACTION TWITTER RADIO NEWSPAPER PUBLIC MEETING
E-MAIL BROCHURE RACK CARD
More than once a week
Yes Internet Other Web site Never Not helpful 5 1 1 5 5 5 5 Neither agree nor disagree
Agree Agree Agree Agree
More than once a week
Yes Radio Caltrans Web site
Monthly Not applicable
5 1 2 4 5 3 5 Strongly agree Agree Strongly agree Agree Agree
More than once a week
Yes Internet Caltrans Web site
Weekly Adequate 4 3 3 4 4 3 5 Agree Agree Strongly agree Agree Agree
More than once a week
Yes E-mail Google Never Not helpful 5 1 5 5 1 5 5 Disagree Disagree Strongly agree Neither agree nor disagree
Neither agree nor disagree
More than once a week
No E-mail Google Weekly Somewhat helpful
3 1 2 5 1 5 5 Strongly disagree Strongly agree Agree Agree Agree
More than once a week
Yes Internet Caltrans Web site
Monthly Somewhat helpful
2 3 4 5 2 5 5 Agree Agree Agree Agree Neither agree nor disagree
Weekly Yes Internet Twitter Monthly Very helpful
1 3 2 5 4 3 4 Agree Agree Strongly agree Agree Agree
More than once a week
No Television Other Web site Never Not applicable
4 2 3 5 1 1 1 Agree Agree Disagree Neither agree nor disagree
Strongly agree
Weekly No Television Google Weekly Somewhat helpful
1 5 1 5 1 4 1 Disagree Agree Disagree Disagree Strongly disagree
Weekly No Radio Caltrans Web site
Weekly Not helpful 5 1 2 3 3 5 5 Strongly agree Neither agree nor disagree
Agree Neither agree nor disagree
Agree
More than once a week
Yes Internet Google Daily Somewhat helpful
2 3 4 2 2 5 5 Agree Neither agree nor disagree
Strongly agree Neither agree nor disagree
Agree