texas demonstration project: continuously reinforced ... · texas demonstration project:...
TRANSCRIPT

i
Final Report
April 2015
Texas Demonstration Project: Continuously Reinforced Concrete Pavement on FM 1938

1
FOREWORD
The purpose of the Highways for LIFE (HfL) pilot program is to accelerate the use of innovations that improve highway safety and quality while reducing congestion caused by construction. LIFE is an acronym for Longer-lasting highway infrastructure using Innovations to accomplish the Fast construction of Efficient and safe highways and bridges. Specifically, HfL focuses on speeding up the widespread adoption of proven innovations in the highway community. “Innovations” is an inclusive term used by HfL to encompass technologies, materials, tools, equipment, procedures, specifications, methodologies, processes, and practices used to finance, design, or construct highways. HfL is based on the recognition that innovations are available that, if widely and rapidly implemented, would result in significant benefits to road users and highway agencies. Although innovations themselves are important, HfL is as much about changing the highway community’s culture from one that considers innovation something that only adds to the workload, delays projects, raises costs, or increases risk to one that sees it as an opportunity to provide better highway transportation service. HfL is also an effort to change the way highway community decision makers and participants perceive their jobs and the service they provide. The HfL pilot program, described in Safe, Accountable, Flexible, Efficient Transportation Equity Act: A Legacy for Users (SAFETEA-LU) Section 1502, includes funding for demonstration construction projects. By providing incentives for projects, HfL promotes improvements in safety, construction-related congestion, and quality that can be achieved through the use of performance goals and innovations. This report documents one such HfL demonstration project. Additional information on the HfL program is at FHWA Highways for Life website.
NOTICE
This document is disseminated under the sponsorship of the U.S. Department of Transportation in the interest of information exchange. The U.S. Government assumes no liability for its contents or use thereof. This report does not constitute a standard, specification, or regulation. The U.S. Government does not endorse products or manufacturers. Trade and manufacturers’ names appear in this report only because they are considered essential to the object of the document.

2
1. Report No. 2. Government Accession No
3. Recipient’s Catalog No
3. Title and Subtitle Texas Demonstration Project: Continuously Reinforced Concrete Pavement on FM 1938
5. Report Date: April 2015
6. Performing Organization Code
7. Authors Jay Bledsoe and Shiraz Tayabji
8. Performing Organization Report No.
9. Performing Organization Name and Address Applied Research Associates, Inc. 100 Trade Centre Drive, Suite 200 Champaign, IL 61820
10. Work Unit No. (TRAIS) C6B 11. Contract or Grant No.
12. Sponsoring Agency Name and Address Office of Infrastructure
Federal Highway Administration 1200 New Jersey Avenue, SE ashington, DC 20590
13. Type of Report and Period Covered Final Report
14. Sponsoring Agency Code
15. Supplementary Notes Contracting Officer’s Representative: Julie Zirlin Contracting Officer’s Task Manager: Ewa Flom 16. Abstract As part of a national initiative sponsored by the Federal Highway Administration (FHWA) under the Highways for LIFE program, the Texas Department of Transportation (DOT) was awarded a $1,000,000 grant to demonstrate the use of proven, innovative technologies including non-woven geo-textile bond breaker between CRCP and cement-treated base, intelligent compaction of subgrade and base materials, optimized aggregate gradation for concrete pavement, improved concrete curing, texture and grooving of CRCP. This report documents deployment of innovations on the construction of FM 1938 in the cities of Southlake, Westlake and Keller, just north of Fort Worth, Texas. The project involved the construction of the new 2.6 mile freeway with six lanes from SH 114 to Dove Road and four lanes from Dove Road to Randol Mill Road. The purpose of the new roadway was to improve capacity and ease mobility on FM 1709. The construction of the FM 1938 project provided TxDOT with valuable insight to several aspects of the construction process. The use of optimized gradation showed potential cost savings through reduction in cement and pavement thickness requirements. The estimated cost savings with reduced cement requirements was about 60 cents per CY of concrete; however, the reduction in thickness could not be further reduced for this project due to the cover requirements for steel in the continuously reinforced design. The use of a non-woven fabric as a bond breaker was not considered an advantage on this project, especially given the use of continuous reinforcement. The installation was labor intensive and the use of the fabric did not result in any improved attributes. While intelligent compaction was not used under the pavement sections as originally planned, it did show promise as an evolving technology. The lithium based curing compounds were more expensive and requires additional research to determine its cost-benefits. 17. Key Words concrete, continuously reinforced concrete pavement, Highways for LIFE, , innovative construction, high-performance materials, , economic analysis
18. Distribution Statement No restriction. This document is available to the public through the Highways for LIFE website: FHWA Highways for Life website
Security Classif.(of this report) Unclassified
19. Security Classif. (of this page) Unclassified
20. No. of Pages 46
21. Price

3
SI* (MODERN METRIC) CONVERSION FACTORS APPROXIMATE CONVERSIONS TO SI UNITS
Symbol When You Know Multiply By To Find Symbol LENGTH
(none) mil 25.4 micrometers μm in inches 25.4 millimeters mm ft feet 0.305 meters m yd yards 0.914 meters m mi miles 1.61 kilometers km
AREA in2 square inches 645.2 square millimeters mm2 ft2 square feet 0.093 square meters m2 yd2 square yards 0.836 square meters m2 ac acres 0.405 hectares ha mi2 square miles 2.59 square kilometers km2
VOLUME fl oz fluid ounces 29.57 millimeters mL gal gallons 3.785 liters L ft3 cubic feet 0.028 cubic meters m3 yd3 cubic yards 0.765 cubic meters m3
NOTE: volumes greater than 1000 L shall be shown in m3 MASS
oz ounces 28.35 grams g lb pounds 0.454 kilograms kg T short tons (2000 lb) 0.907 megagrams (or "metric ton") Mg (or "t")
TEMPERATURE (exact degrees) °F Fahrenheit 5 (F-32)/9
or (F-32)/1.8 Celsius °C
ILLUMINATION fc foot-candles 10.76 lux lx fl foot-Lamberts 3.426 candela per square meter cd/m2
FORCE and PRESSURE or STRESS lbf poundforce 4.45 Newtons N lbf/in2 (psi) poundforce per square inch 6.89 kiloPascals kPa k/in2 (ksi) kips per square inch 6.89 megaPascals MPa
DENSITY lb/ft3 (pcf) pounds per cubic foot 16.02 kilograms per cubic meter kg/m3
APPROXIMATE CONVERSIONS FROM SI UNITS Symbol When You Know Multiply By To Find Symbol
LENGTH μm micrometers 0.039 mil (none) mm millimeters 0.039 inches in m meters 3.28 feet ft m meters 1.09 yards yd km kilometers 0.621 miles mi
AREA mm2 square millimeters 0.0016 square inches in2 m2 square meters 10.764 square feet ft2 m2 square meters 1.195 square yards yd2 ha hectares 2.47 acres ac km2 square kilometers 0.386 square miles mi2
VOLUME mL milliliters 0.034 fluid ounces fl oz L liters 0.264 gallons gal m3 cubic meters 35.314 cubic feet ft3 m3 cubic meters 1.307 cubic yards yd3
MASS g grams 0.035 ounces oz kg kilograms 2.202 pounds lb Mg (or "t") megagrams (or "metric ton") 1.103 short tons (2000 lb) T
TEMPERATURE °C Celsius 1.8C+32 Fahrenheit °F
ILLUMINATION lx lux 0.0929 foot-candles fc cd/m2 candela per square meter 0.2919 foot-Lamberts fl
FORCE and PRESSURE or STRESS N Newtons 0.225 poundforce lbf kPA kiloPascals 0.145 poundforce per square inch lbf/in2 (psi) MPa megaPascals 0.145 kips per square inch k/in2 (ksi)

4
TABLE OF CONTENTS INTRODUCTION......................................................................................................................... 7
HIGHWAYS FOR LIFE DEMONSTRATION PROJECTS ................................................................ 7 Project Solicitation, Evaluation, and Selection ....................................................................... 7 HfL Project Performance Goals .............................................................................................. 8
THE TEXAS HIGHWAYS FOR LIFE DEMONSTRATION PROJECT .............................................. 9 REPORT SCOPE AND ORGANIZATION ........................................................................................ 9
PROJECT OVERVIEW AND LESSONS LEARNED ........................................................... 11 PROJECT OVERVIEW ................................................................................................................ 11
Project Innovations ............................................................................................................... 11 HFL PERFORMANCE GOALS .................................................................................................... 13 ECONOMIC ANALYSIS .............................................................................................................. 14 LESSONS LEARNED ................................................................................................................... 14 CONCLUSIONS ........................................................................................................................... 15
PROJECT DETAILS ................................................................................................................. 16 PROJECT BACKGROUND ........................................................................................................... 16 PROJECT TEST FEATURES DETAILS ........................................................................................ 18 OPTIMIZED AGGREGATE GRADATION .................................................................................... 18
Mixture Proportioning .......................................................................................................... 19 Summary ............................................................................................................................... 24
INTELLIGENT COMPACTION .................................................................................................... 24 The Process ........................................................................................................................... 24 Results ................................................................................................................................... 25
NON-WOVEN GEO-TEXTILE BOND BREAKERS ....................................................................... 25 Constructability Issues .......................................................................................................... 25 Findings ................................................................................................................................. 25
IMPROVED CONCRETE CURING METHODS OF CRCP ............................................................ 29 The Process ........................................................................................................................... 29 The Findings ......................................................................................................................... 30
IMPROVED TEXTURING TECHNIQUES FOR CRCP .................................................................. 31 Noise Related Testing ........................................................................................................... 34 Friction (Skid) Testing .......................................................................................................... 35 Smoothness Testing .............................................................................................................. 35
DATA ACQUISITION AND ANALYSIS ................................................................................ 36 SAFETY ..................................................................................................................................... 36 CONSTRUCTION CONGESTION/ TRIP TIME/QUEUE LENGTH .................................................. 36 TRAFFIC STUDY ........................................................................................................................ 36 QUALITY ................................................................................................................................... 36 USER SATISFACTION ................................................................................................................. 37
TECHNOLOGY TRANSFER ................................................................................................... 38 ECONOMIC ANALYSIS .......................................................................................................... 40
CONSTRUCTION COSTS ............................................................................................................ 40 USER COSTS .............................................................................................................................. 40
REFERENCES ............................................................................................................................ 41

5
LIST OF FIGURES
Figure 1. Details of the Sections Incorporating Test Features .................................................... 13 Figure 2. General Project Location ............................................................................................. 16 Figure 3. Existing Two-Lane Facility, Precinct Road (Courtesy TxDOT)................................. 17 Figure 4. New Four- and Six-Land FM 1938 ............................................................................. 17 Figure 5. Aggregate Gradations .................................................................................................. 19 Figure 6. Optimized Aggregate Mix Placed in Front of Paver (Courtesy TxDOT) ................... 24 Figure 7. Non-Woven Geo-Textile Fabric Placement ................................................................ 26 Figure 8. Non-Woven Geo-Textile Fabric after Rain Storm ...................................................... 27 Figure 9. Crack Spacing Survey (Courtesy Texas Tech University). ......................................... 28 Figure 10. Slab deflections of section using fabric interlayer compared to traditional methods. . 28 Figure 11. The ATEK ACMM...................................................................................................... 30 Figure 12. Cracking pattern at the FM 1938 demonstration project ............................................. 31 Figure 13. Typical texture of longitudinally tined surface. .......................................................... 32 Figure 14. Typical texture of carpet drag surface. ........................................................................ 32 Figure 15. Typical texture of ½ inch transversely tined surface. .................................................. 33 Figure 16. Typical texture of 1 inch transversely tined surface. ................................................... 33 Figure 17. TxDOT OBSI Setup .................................................................................................... 34 Figure 18. OBSI Data from FM 1938 HfL Project. ...................................................................... 35 Figure 19. Showcase participants at the job site. .......................................................................... 38 Figure 20. Placement of rebar assembly. ...................................................................................... 38 Figure 20. Participants visiting the batching plant........................................................................ 39
LIST OF TABLES
Table 1. Mixture Proportions Evaluated and Test Results. .......................................................... 21 Table 2. Sieve Analysis of Optimized Aggregate for FM 1938. .................................................. 23

6
ABBREVIATIONS AND SYMBOLS
AASHTO American Association of State Highway and Transportation Officials AC Asphalt Concrete ACMM ATEK Concrete Maturity Meter ASTM American Society for Testing and Materials CBR California bearing ratio CRCP Continuously Reinforced Concrete Pavement dB Decibel DC dielectric content DCP Dynamic cone penetrometer DOTDepartment of Transportation EI Effectiveness Index FHWA Federal Highway Administration FWD Falling weight deflectometer HfL Highways for LIFE IC Intelligent Compaction IRIInternational Roughness Index mph Miles Per Hour OBSI onboard sound intensity OSHAOccupational Safety and Health Administration PBT Plate bearing test RH Relative Humidity RoW Right-of-Way SAFETEA-LU Safe, Accountable, Flexible, Efficient Transportation Equity Act: A
Legacy for Users TTI Texas Transportation Institute TxDOT Texas Department of Transportation SHRP 2 Strategic Highway Research Program SI sound intensity

7
INTRODUCTION
HIGHWAYS FOR LIFE DEMONSTRATION PROJECTS The Highways for LIFE (HfL) pilot program, the Federal Highway Administration (FHWA) initiative to accelerate innovation in the highway community, provides incentive funding for demonstration construction projects. Through these projects, the HfL program promotes and documents improvements in safety, construction-related congestion, and quality that can be achieved by setting performance goals and adopting innovations. The HfL program - described in the Safe, Accountable, Flexible, Efficient Transportation Equity Act: A Legacy for Users (SAFETEA-LU) - has provide incentives to a maximum of 15 demonstration projects a year. The funding amount may total up to 20 percent of the project cost, but not more than $5 million. Also, the Federal share for a HfL project may be up to 100 percent, thus waiving the typical State-match portion. At the State’s request, a combination of funding and waived match may be applied to a project. To be considered for HfL funding, a project must involve constructing, reconstructing, or rehabilitating a route or connection on an eligible Federal-aid highway. It must use innovative technologies, manufacturing processes, financing, or contracting methods that improve safety, reduce construction congestion, and enhance quality and user satisfaction. To provide a target for each of these areas, HfL has established demonstration project performance goals. The performance goals emphasize the needs of highway users and reinforce the importance of addressing safety, congestion, user satisfaction, and quality in every project. The goals define the desired result while encouraging innovative solutions, raising the bar in highway transportation service and safety. User-based performance goals also serve as a new business model for how highway agencies can manage the highway project delivery process. HfL project promotion involves showing the highway community and the public how demonstration projects are designed and built and how they perform. Broadly promoting successes encourages more widespread application of performance goals and innovations in the future. Project Solicitation, Evaluation, and Selection FHWA issued open solicitations for HfL project applications in fiscal years 2006 through 2013. State highway agencies submitted applications through FHWA Divisions. The HfL team reviewed each application for completeness and clarity, and contacted applicants to discuss technical issues and obtain commitments on project issues. Documentation of these questions and comments was sent to applicants, who responded in writing. The project selection panel consisted of representatives of the FHWA’s Offices of Infrastructure, Safety, and Operations; the Resource Center Construction and Project Management Team; the Division offices; and the HfL team. After evaluating and rating the applications and

8
supplemental information, panel members convened to reach a consensus on the projects to recommend for approval. The panel gave priority to projects that accomplish the following:
• Address the HfL performance goals for safety, construction congestion, quality, and user satisfaction.
• Use innovative technologies, manufacturing processes, financing, contracting practices, and performance measures that demonstrate substantial improvements in safety, congestion, quality, and cost-effectiveness. An innovation must be one that the applicant State has never or rarely used, even if it is standard practice in other States.
• Include innovations that will change administration of the State’s highway program to more quickly build long-lasting, high-quality, cost-effective projects that improve safety and reduce congestion.
• Will be ready for construction within 1 year of approval of the project application. For the HfL program, FHWA considers a project ready for construction when the FHWA Division authorizes it.
• Demonstrate the willingness of the applicant department of transportation (DOT) to participate in technology transfer and information dissemination activities associated with the project.
HfL Project Performance Goals The HfL performance goals focus on the expressed needs and wants of highway users. They are set at a level that represents the best of what the highway community can do, not just the average of what has been done. States are encouraged to use all applicable goals on a project:
• Safety
o Work zone safety during construction—Work zone crash rate equal to or less than the preconstruction rate at the project location.
o Worker safety during construction—Incident rate for worker injuries of less than 4.0, based on incidents reported via Occupational Safety and Health Administration (OSHA) Form 300.
o Facility safety after construction—At least twenty percent reduction in fatalities and injuries in 3-year average crash rates, using preconstruction rates as the baseline.
• Construction Congestion
o Faster construction—At least fifty percent reduction in the time highway users are
impacted, compared to traditional methods. o Trip time during construction—Less than 10 percent increase in trip time
compared to the average preconstruction speed, using 100 percent sampling. o Queue length during construction—A moving queue length of less than 0.5 mile
(mi) (0.8 kilometer (km)) in a rural area or less than 1.5 mi (2.4 km) in an urban area (in both cases at a travel speed 20 percent less than the posted speed).

9
• Quality o Smoothness—International Roughness Index (IRI) measurement of less than 48
inches per mile. o Noise—Tire-pavement noise measurement of less than 96.0 A-weighted decibels
(dB (A)), using the onboard sound intensity (OBSI) test method. • User Satisfaction
o User satisfaction—An assessment of how satisfied users are with the new facility compared to its previous condition and with the approach used to minimize disruption during construction. The goal is a measurement of 4-plus on a 7-point Likert scale.
THE TEXAS HIGHWAYS FOR LIFE DEMONSTRATION PROJECT
During 2010, the Texas Department of Transportation (TxDOT) began construction of a 2.6 mile pavement on new alignment along a section of FM 1938. The work was completed during 2012. The new pavement project consists of six lanes from SH 114 to Dove Road and four lanes from Dove Road to Randol Mill Road. The purpose of the new roadway was to improve capacity and ease mobility on FM 1709. TxDOT joint ventured the project with the cities of Southlake, Westlake, and Keller. The pavement type was continuously reinforced concrete pavement (CRCP). As part of the construction project, TxDOT, with support from FHWA’s HfL program, evaluated several technologies to achieve a longer lasting CRCP. These technologies are:
1. Improved base type for CRCP – four base types were evaluated. One test feature included the use of a non–woven geo–textile bond breaker between the concrete and the cement-treated base to speed up construction and reduce construction related costs.
2. Optimized aggregate gradation for the paving concrete – two aggregate gradations were evaluated. One gradation was the standard TxDOT gradation, and the other was an optimized gradation. The optimized aggregate gradation was used to reduce concrete drying shrinkage that would lead to tight cracks which provide a more durable and better performing CRCP.
3. Improved Concrete Curing – three curing compounds were evaluated. The use of water-based lithium curing compound was included to help mitigate the development of plastic shrinkage cracking.
4. Improved surface texture – four methods for providing surface texture were evaluated to identify a more durable and safe pavement surface that is also less noisy.
5. Intelligent compaction - use of intelligent compaction was evaluated for the base and subgrade to allow for real-time correction in the compaction process.
REPORT SCOPE AND ORGANIZATION This report documents TxDOT’s HfL demonstration project, which involved the construction of the new 2.6 mile freeway (FM 1938) from SH 114 to Randol Mill Road in the cities of Southlake, Westlake and Keller, just north of Fort Worth, Texas. The report is organized as follows:

10
• Project Overview and Lessons Learned • Project Details • Data Acquisition and Analysis • Technology Transfer • References
The report presents project details relevant to the HfL program, including safety, construction congestion and user satisfaction. HFL performance metrics and economic analysis lessons learned are also discussed along with innovative methods of public involvement and technology transfer.

11
PROJECT OVERVIEW AND LESSONS LEARNED PROJECT OVERVIEW The HfL project undertaken on FM 1938 was a cooperative effort between TxDOT and Tarrant County, the North Central Texas Council of Governments and the cities of Keller, Southlake and Westlake. The primary focus was to provide a more direct connection between State Highway 114 and Keller Parkway with greatly expanded capacity and increased access. The project replaced an existing narrow two-lane facility built in the 1950s with a 2.6 mile roadway consisting of a 6-lane segment from SH 114 to Dove Road, and a 4-lane section from Dove Road to Randol Mill Road at the South termini. The project was constructed on new alignment. Improved access was developed at all intersections and extensive enhancements were provided to match the surrounding landscape. Project Innovations Several innovations were included in this project covering many aspects of construction. They include:
1. Optimized aggregate gradation for the paving concrete – two aggregate gradations were evaluated. One gradation was the standard TxDOT gradation, and the other was an optimized gradation. The optimized aggregate gradation was used to reduce concrete drying shrinkage that would lead to tight cracks which provide a more durable and better performing CRCP.
2. The use of intelligent compaction for the subgrade to allow for real-time correction in the compaction process.
3. Improved base type for CRCP – four base types were evaluated with respect to compaction control and erodability. A non–woven geo–textile bond breaker between the concrete and the cement-treated base was also used to speed up construction which also reduced construction related costs.
4. Improved Concrete Curing – three curing compounds were evaluated. The use of water-based lithium curing compound was included to help mitigate the development of plastic shrinkage cracking.
5. Improved surface texture – four methods for providing surface texture were evaluated to identify a more durable and safe pavement surface that is also less noisy.
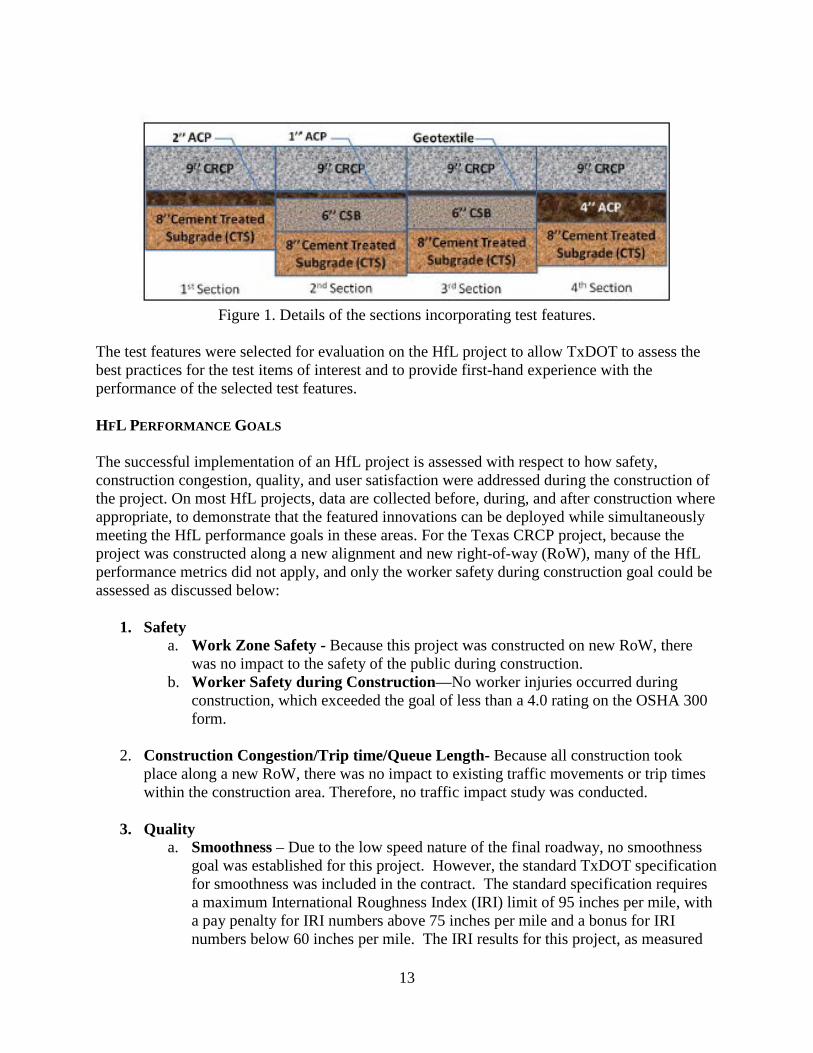
Figure 1 shows the layout of the project test features. The HfL project features were incorporated in four primary test sections, between Sta. 98+23 to Sta. 205+00, as shown in Figure 1 and detailed below:
1. Section 1 – Sta. 98+23 to Sta. 115+00 a. 9 in. CRCP b. 2 in. AC interlayer, Type B c. 8 in. cement treated subgrade
2. Section 2 – Sta. 115+00 to Sta. 132+00 a. 9 in. CRCP b. 1 in. AC interlayer, Type D

12
c. 6 in. cement stabilized base d. 8 in. cement treated subgrade
3. Section 3 – Sta. 132+00 to Sta. 160+00 a. 9 in. CRCP b. Non-woven geotextile c. 6 in. cement stabilized base d. 8 in. cement treated subgrade
4. Section 4 – Sta. 160+00 to Sta. 205+00 a. 9 in. CRCP b. 4 in. AC, Type B c. T treated subgrade (8 in. cement treated or 8 in. lime treated, 18 in. lime treated)
The test features were located within the four test sections as follows:
1. Aggregate gradation features a. Optimized gradation, three aggregates – Sta. 175+00 to Sta. 190+00 b. Standard concrete (Class P) with Gr-3 or GR-4 coarse aggregate (ASTM C33) –
Sta. 190+00 to Sta. 205+00 2. Embankment (subgrade) compaction features
a. Intelligent compaction – Sta. 98+23 to Sta. 160+00 b. Density control, Type D – Sta. 160+00 to Sta. 205+00
3. Concrete/stabilized base interface features a. Non-woven geotextile bond-breaker – Sta. 132+00 to Sta. 160+00 b. 1 in. AC interlayer – Sta. 115+00 to Sta. 132+00
4. Concrete curing features a. Lithium based, TxDOT supplied – Sta.98+23 to Sta. 115+00 b. Lithium based, Contractor supplied – Sta. 115+00 to 160+00 c. Type II – Sta. 160+00 to Sta. 205+00
5. Surface texture features a. Longitudinal tining, spaced at 1 in. – Sta. 98+23 to Sta. 115+00 b. Carpet drag only – Sta. 115+00 to Sta. 132+00 c. Transverse tining, spaced at ½ in. – Sta. 132+00 to Sta. 160+00 d. Transverse tining, spaced at 1 in. – Sta. 160+00 to Sta. 205+00
TxDOT also evaluated additional features as follows:
1. Cement stabilized base features a. Lower strength, 7-day compressive strength of 250 psi – Sta. 115+00 to Sta.
123+00 and Sta. 145+00 to Sta. 160+00 b. Standard strength, 7-day compressive strength of 600 psi – Sta. 123+00 to Sta.
145+00 2. Cement treated subgrade features
a. Higher cement content, 7-day compressive strength of 430 psi – Sta. 98+23 to Sta. 106+00
b. Lower cement content, 7-day compressive strength of 200 psi – Sta. 106+00 to Sta. 205+00
13
Figure 1. Details of the sections incorporating test features.
The test features were selected for evaluation on the HfL project to allow TxDOT to assess the best practices for the test items of interest and to provide first-hand experience with the performance of the selected test features. HFL PERFORMANCE GOALS The successful implementation of an HfL project is assessed with respect to how safety, construction congestion, quality, and user satisfaction were addressed during the construction of the project. On most HfL projects, data are collected before, during, and after construction where appropriate, to demonstrate that the featured innovations can be deployed while simultaneously meeting the HfL performance goals in these areas. For the Texas CRCP project, because the project was constructed along a new alignment and new right-of-way (RoW), many of the HfL performance metrics did not apply, and only the worker safety during construction goal could be assessed as discussed below:
1. Safety a. Work Zone Safety - Because this project was constructed on new RoW, there
was no impact to the safety of the public during construction. b. Worker Safety during Construction—No worker injuries occurred during
construction, which exceeded the goal of less than a 4.0 rating on the OSHA 300 form.
2. Construction Congestion/Trip time/Queue Length- Because all construction took place along a new RoW, there was no impact to existing traffic movements or trip times within the construction area. Therefore, no traffic impact study was conducted.
3. Quality a. Smoothness – Due to the low speed nature of the final roadway, no smoothness
goal was established for this project. However, the standard TxDOT specification for smoothness was included in the contract. The standard specification requires a maximum International Roughness Index (IRI) limit of 95 inches per mile, with a pay penalty for IRI numbers above 75 inches per mile and a bonus for IRI numbers below 60 inches per mile. The IRI results for this project, as measured

14
by TxDOT, averaged about 92 inches per mile, with no segments receiving a bonus and several requiring grinding to achieve the maximum allowed value of 95 inches per mile. The higher than expected values are attributed to the numerous short sections that were paved on the project. While no further testing was done after the bump grinding, the pavement is expected to be satisfactory with respect to smoothness due to the low speed limit at this location.
b. Noise – With a proposed speed limit of only 40 miles per hour (mph) for the completed project, the HfL goal for noise was not included in the evaluation. However, TxDOT did conduct extensive testing on the project using their noise measuring equipment. Several texture types were included on this project, with the resulting noise levels ranging from 94 to 100.9 dB.
c. Durability – Several innovations included in this project are expected to improve the durability and performance of the final project.
i. The use of optimized aggregate gradation improves concrete workability and results in fewer issues with slipform paving concrete placement and finishing. Another significant advantage with the use of optimized aggregate gradation is that less cement is necessary to obtain the desired concrete characteristics.
ii. The use of intelligent compaction technology resulted in better control over the compaction of the subgrade (embankment material), resulting in improved overall quality. The ability to make real time corrections to the subgrade compaction process translates into a more uniform paving platform and thus a longer lasting and durable pavement.
iii. The use of the non-woven geo-textiles rather than conventional asphalt bond breakers between cement stabilized bases and CRCP was not considered effective as it resulted in longer undesirable crack spacing.
4. User satisfaction - The project was constructed on new RoW and therefore had no impact on the public during construction. No user satisfaction survey was conducted. Increased public satisfaction is expected to result from shortened travel distances and times along the new corridor. Also, the public satisfaction will be enhanced over the long-term because the new pavement is expected to provide a longer service life without requiring frequent lane closures to perform repair and rehabilitation treatments.
ECONOMIC ANALYSIS No economic analysis was performed because alternative pavement types were not considered, and the test section features were pre-determined. LESSONS LEARNED Overall, the FM 1938 project was a success. Many of the innovations have shown promise, however additional research is required to adequately assess the results.
• The use of optimized gradation for Portland cement concrete shows particular promise. Testing showed that significantly less cement is required to achieve the design strength. In this case, the cement content was reduced to achieve the desired compressive strength, resulting in a significant cost savings.

15
• There were additional advantages to the optimized gradation concrete mix. While the mix as delivered appears very dry, it finishes very well. A sharp vertical edge is created behind the paver with very little slump. The contractor reported that finish labor was reduced and that the surface was easier to texture.
• The use of a non-woven fabric as a bond breaker was not considered an advantage on this project, especially given the use of continuous reinforcement. From the contractor perspective, it was labor intensive to apply initially. The fabric was easily damaged during steel installation. In areas where steel was cut, the fabric melted and repair under the steel mat was difficult. It also does not seem to work well for projects using staged construction. Rain on the exposed material resulted in silt and mud covering the surface and again this was very labor intensive to remove. The use of fabric as a bond breaker may be suitable for use on jointed pavements s, but is considered a disadvantage under CRCP, where shorter consistent crack spacing is desired.
• While intelligent compaction was not used under the pavement sections as originally planned, it did show promise as an evolving technology. It provided a more complete picture of the entire area being worked, resulting in decreased labor and reduced testing. In this case, it was found that a footed roller did not provide good results using the available instrumentation. A switch to a smooth roller was required. It was noted that in order to achieve reliable results the equipment needs to be calibrated to local soils before construction.
• The use of several different curing compounds was investigated on this project. At temperatures below 45 degrees, the application of the lithium based curing compound increased dry times dramatically and prevented longitudinal joint sawing in some cases up to 2 days. The lithium based compounds were also significantly more expensive, requiring additional research to determine if the cost is justified.
• While the tining and texture techniques employed were not necessarily new, experience reinforced the need to control tine pressure and spacing to achieve a good surface texture. Additional testing is needed to determine the best surface texture to provide good friction and a quiet surface. Conclusions
The TxDOT gained good experience with the innovations used on this project. Many of the procedures, especially the use of optimized aggregate in PCP and intelligent compaction, appear ready for implementation in future TxDOT projects.

16
PROJECT DETAILS PROJECT BACKGROUND The focus of the FM 1938 HfL project was to provide a more direct north/south connection between State Highway 114 and FM 1709 (Keller Parkway). The 2.2 mile project (Figure 2) shortens the length of the connector by 1 mile at a cost of approximately $16 million. The project provides improved access at all intersections along the route and extensive enhancements to match the surrounding landscape. Due to the higher cost of RoW in this area, about $1.1 million per acre, every effort was made to minimize the footprint of the project. TxDOT owns only 1 foot of RoW outside the shoulder edge, with the City acquiring an additional 8 feet of RoW. The project was a cooperative effort between TxDOT and Tarrant County, the North Central Texas Council of Governments and the cities of Keller, Southlake and Westlake. The existing two lane corridor (Figure 3), Precinct Road, was replaced with a six lane facility from SH 114 to Dove Road and a four lane divided facility from Dove Road to Randol Mill road at the South termini.
Figure 2. General Project Location

17
Figure 3. Existing Two-Lane Facility, Precinct Road (Courtesy TxDOT)
The existing facility carried about 5,400 vehicles per day prior to construction. When completed, the new facility (Figure 4) is predicted to carry more than 12,000 vehicles per day, providing increased mobility far into the future.
Figure 4. New Four- and Six-Land FM 1938

18
PROJECT TEST FEATURES DETAILS The details on following HfL specific test features are presented as follows:
1. Optimized aggregate gradation 2. Intelligent compaction 3. Geotextile interlayer 4. Lithium-based curing 5. Surface texture techniques
Information presented here is based on the project report prepared for TxDOT (Zollinger et al, 2013) and observations and limited data analysis performed by ARA staff. Although the project included evaluation of many other design/construction features, this report addresses only the five features listed above. OPTIMIZED AGGREGATE GRADATION The concept of optimized aggregate gradation for paving portland cement concrete is not new. However, it has not been commonly used by the pavement construction industry in Texas, even though TxDOT has had a specification for optimized aggregate gradation in place since 2004. Optimized aggregate graded concrete relies on aggregate strength and stone on stone contact to develop strength, using a minimum amount of cement paste to bind the mixture. The result is a mix that has increased workability and strength with reduced drying shrinkage and water demands. A cost savings is realized from a reduction in cementitious material required. For the FM 1938 project, the goal was to demonstrate that a concrete mixture with optimized aggregate gradation can provide a concrete with better workability for slipform paving while also meeting other TxDOT specified requirements for paving concrete using less cementitious material. As discussed, the pavement on this project consisted of 9- inch CRCP placed over different support conditions. A variety of bases and bond breakers were included for comparison. A control section using the standard Class P concrete on 4-inches of AC base with a treated subgrade was also included. Several methods were investigated to arrive at an optimum aggregate gradation. The methods evaluated included the following:
1. Maximum density of aggregates, based on the 0.45 power chart 2. Optimizing fineness modulus 3. Optimizing specific surface area of aggregates 4. Shilstone method 5. Percent retained graph 6. Aggregate dry pot unit weight 7. Packing modulus

19
Mixture Proportioning The main goal of the concrete mixture proportioning is to reduce the cementitious material content and obtain a concrete with desirable workability and specified properties. A total of eighteen aggregate gradations were evaluated using combinations of two aggregates (coarse and fine) or three aggregates (coarse, intermediate, and fine). The gradations of the three aggregates are shown in Figure 5. The eighteen concrete mixtures evaluated and the test results for each mixture are given in Table 1.
Figure 5. Aggregate Gradations
Based on the analysis of the test results, the following two mixtures were selected:
1. Optimized gradation mixture – using 4.5 bags of cementitious materials (35% flyash) and three aggregates. The sieve analysis of the optimized aggregate is shown in

20
3. Table 2.
a. Cement – 275 pcy b. Flyash – 148 pcy c. Aggregate
i. Grade 3 coarse aggregate – 1,627 pcy ii. 3/8 in. intermediate aggregate – 467 pcy
iii. Sand – 1,266 pcy iv. Water – 190 pcy
The concrete properties were as follows: • Slump – 0.75 in. • 7-day compressice strength – 3,600 psi • 28-day compressive stregth – 5,300 psi
4. Standard mixture - using 4.75 bags of cementitious materials (35% flyash) and two
aggregates. a. Cement – 290 pcy b. Flyash – 156 pcy c. Aggregate
i. Grade 3 coarse aggregate – 1,941 pcy ii. Sand – 1,395 pcy
iii. Water – 192 pcy
The concrete properties were as follows: • Slump – 0.75 in. • 7-day compressice strength – 4,280 psi • 28-day compressive stregth – 6,080 psi
The sieve analysis of the optimized aggregate is shown in Table 2.
For each mixture, the design water/cement ratio was 0.45, the target 28-day compressive strength was 4,400 psi, and the design air content was 4.5 percent. The results in the field for both mixtures exceeded the design 28-day compressive strength. It should be noted that obtaining higher concrete strength in the field compared to the design compressive strength is not desirable because the design of steel reinforcement in CRCP is based on the design concrete strength. Obtaining higher concrete strength in the field can result in longer spaced transverse cracking, which is not desirable for long-term performance of CRCP.

21
Table 1. Mixture Proportions Evaluated and Test Results.

22
Table 1. Mixture Proportions Evaluated and Test Results.

23
Table 2. Sieve Analysis of Optimized Aggregate for FM 1938.

24
Summary Based on observations at the construction site, the mixture with the optimized aggregate gradation provided excellent workability and finishing characteristics. While the mixture appeared dry as delivered, the mixture provided a stable vertical edge behind the paver and little finishing was required to restore the edge. Figure 6 shows the optimized aggregate gradation mixture in front of the slipform paver.
Figure 6. Optimized Aggregate Mix Placed in Front of Paver (Courtesy TxDOT) INTELLIGENT COMPACTION Intelligent compaction (IC) technology was used to aid in the construction of the subgrade embankment on this project. While IC technology has been used before, it is not commonly used at the project level in Texas. IC provides continuous real time data to aid in the compaction of soils. Through a computer interface installed on the compaction equipment, IC uses sensors mounted to the roller drum to equate displacements of the roller to material properties such as stiffness or penetration. Feedback from the computer allows the operator to adjust the amplitude, frequency, or speed of the roller to provide a more consistent compaction operation and achieve real-time corrections in the compaction process The Process The instrumented roller package used for the IC study was developed at the Texas Transportation Institute (TTI). The roller package is installed on a roller and includes the following:
1. GPS distance measurement sensor 2. An accelerometer which measures the vibratory response. Lower vibrator amplitude
readings indicate that the subgrade is weaker in those areas.

25
3. A computer with a live display
The roller drum response in terms of the roller vibrator amplitude was correlated with several subgrade stiffness testing procedures. These procedures included the following:
1. Dynamic cone penetrometer (DCP) 2. Falling weight deflectometer (FWD) 3. Plate bearing test (PBT)
Results IC technology proved very sensitive to variations in moisture content and sandy soils encountered on FM 1938. The IC package was effective in locating areas of weak support in the subgrade soil. However, the correlation with California Bearing Ratio (CBR), determined from DCP values, was rather weak in one area. It appears that the IC package can be used for proof-rolling but not for determining stiffness characteristics, until additional field testing is performed. NON-WOVEN GEO-TEXTILE BOND BREAKERS As part of the HfL project, the use of non-woven geo-textiles as a bond breaker between the base course and the CRCP was investigated as an alternative to the use of AC interlayer. The successful application of a geotextile as a bond breaker would reduce construction time and lead to cost savings. At the FM 1938 project, a standard non-woven geotextile was used at test section 3, between Sta. 132+00 to Sta. 160+00. The adjoining test sections using traditional AC layers as a bond breaker allowed comparison of the two interlayer techniques. The use of the geotextile interface layer under the CRCP was considered based on the findings of successful use of this practice in Germany and in the US, as detailed in Rasmussen et al (2009). It should be noted that the successful use in Europe and in the US was for jointed concrete pavement projects and not CRCP projects. Constructability Issues The geotextile fabric was laid down using standard placement procedures related to fabric overlap and nailing requirements. A view of the installed geotextile fabric is shown in Figure 7. There were several constructability issues associated with the use of fabric on the FM 1938 project. The fabric was labor intensive to install and repair of damaged areas was difficult, especially after placement of the reinforcing steel. Workers burned holes at many locations while cutting steel rods driven through the fabric to provide lateral stability of the steel mat during paving. Also, a sudden rain storm deposited mud on the fabric, as shown in Figure 8. Cleaning of the fabric with steel in place was extremely time consuming and resulted in additional damage to the material. Findings

26
The constructability and the short-term performance of the geotextile section (Section 3) was compared with the standard CRCP of Test Section 2, that incorporated an AC interlayer. Details of the two test sections are given below:
1. Section 2 – Sta. 115+00 to Sta. 132+00 a. 9 in. CRCP b. 1 in. AC interlayer, Type D c. 6 in. cement stabilized base d. 8 in. cement treated subgrade
2. Section 3 – Sta. 132+00 to Sta. 160+00 a. 9 in. CRCP b. Non-woven geotextile c. 6 in. cement stabilized base d. 8 in. cement treated subgrade
Figure 7. Non-Woven Geo-Textile Fabric Placement

27
Figure 8. Non-Woven Geo-Textile Fabric after Rain Storm
With respect to assessment of the short-term performance of the above two sections, the following metrics were compared:
1. Transverse crack spacing 2. Deflections, under falling weight deflectometer (FWD) loading 3. Slab curling and concrete stresses (using sensors installed at time of concrete placement)
Comparison of the section constructed using the non-woven geo-textile fabric to the control section using the traditional 1 inch AC interlayer indicated the following:
1. There was not much difference in crack spacing between the two sections as shown in Figure 9 below. However, the goetextile fabric section did have a larger amount of cracking that was greater than 10 ft. The larger crack spacing is attributed to the lower frictional resistance between the concrete and the fabric. Also, the geotextile fabric section exhibited larger variations in crack spacing.
2. There was a significant difference in deflection between the two sections based on FWD testing. The deflection of the fabric section was measured at 3.2 mils under a 9,000 pound load, compared to a deflection of only 1.4 mils for the 1 inch AC section.
3. There was less vertical displacement (curling) of the slab in the fabric section when compared to the 1-inch control section, resulting in less pavement stress. The curling measurements are shown in Figure 10.
Based on the data, the use of non-woven geo-textiles under CRCP was considered of questionable value when compared to traditional (AC interlayer) methods of providing a bond breaking interlayer.

28
Figure 9. Crack Spacing Survey (Courtesy Texas Tech University).
Figure 10. Slab deflections of section using fabric interlayer compared to traditional
methods.
29
IMPROVED CONCRETE CURING METHODS OF CRCP
Another innovation employed on this HfL project was the use of lithium based curing compounds. Curing has long been recognized as an important process in constructing durable concrete pavements. Curing of concrete is defined as the maintenance of adequate moisture and temperature conditions to allow the development of required physical properties. Curing should be initiated as soon as possible after placing the concrete to prevent excessive water loss and drying of the surface. Curing compounds work by sealing the concrete surface and reducing the rate of moisture loss. Poor curing practices can result in excessive curling, early age cracking, surface deterioration, low early strengths, and reduced durability. Most of the damage caused by poor curing is irreversible. Most highway agencies specify use of curing compounds that meet the requirements of ASTM C 309 or AASHTO M 148.
On this project, sections of CRCP were cured using the following three methods:
1. Lithium based, TxDOT supplied – Sta.98+23 to Sta. 115+00 2. Lithium based, Contractor supplied – Sta. 115+00 to 160+00 3. Type II, resin-based – Sta. 160+00 to Sta. 205+00 (control section)
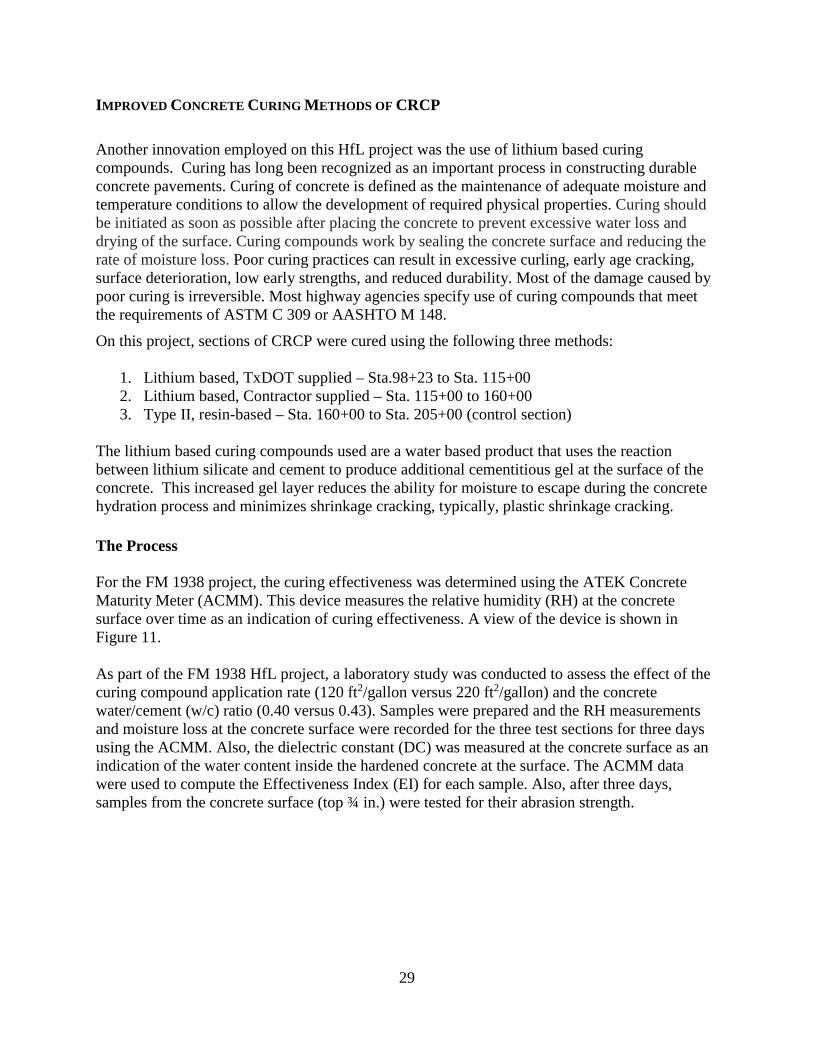
The lithium based curing compounds used are a water based product that uses the reaction between lithium silicate and cement to produce additional cementitious gel at the surface of the concrete. This increased gel layer reduces the ability for moisture to escape during the concrete hydration process and minimizes shrinkage cracking, typically, plastic shrinkage cracking. The Process For the FM 1938 project, the curing effectiveness was determined using the ATEK Concrete Maturity Meter (ACMM). This device measures the relative humidity (RH) at the concrete surface over time as an indication of curing effectiveness. A view of the device is shown in Figure 11. As part of the FM 1938 HfL project, a laboratory study was conducted to assess the effect of the curing compound application rate (120 ft2/gallon versus 220 ft2/gallon) and the concrete water/cement (w/c) ratio (0.40 versus 0.43). Samples were prepared and the RH measurements and moisture loss at the concrete surface were recorded for the three test sections for three days using the ACMM. Also, the dielectric constant (DC) was measured at the concrete surface as an indication of the water content inside the hardened concrete at the surface. The ACMM data were used to compute the Effectiveness Index (EI) for each sample. Also, after three days, samples from the concrete surface (top ¾ in.) were tested for their abrasion strength.

30
Figure 11. The ATEK ACMM (Source: Sun, 2013)
Findings The laboratory study resulted in the following observations:
1. Samples with the higher w/c ratio (0.43) always had a higher percentage of moisture loss than samples with lower w/c ration (0.40).
2. At the same w/c ration, a higher curing application rate was not always effective in limiting evaporation compared to samples with a lower application rate. This indicates that a rate of 220 ft2/gallon was high enough to maintain the moisture at a level similar as that experienced with a rate of 120 ft2/gallon
3. The abrasion test data indicate that the samples made the higher application rate lost less weight and exhibited a better curing quality than the samples made with the lower application rate.
The field testing at FM 1938 resulted in the following observations:
1. The cracking pattern was similar for the lithium curing compounds and Type 2 curing compound, as shown in Figure 12.

31
Figure 12. Cracking pattern at the FM 1938 demonstration project
IMPROVED TEXTURING TECHNIQUES FOR CRCP Surface texture is a critical end product requirement for concrete pavements. Surface texture affects the risk of wet-weather accidents and impacts tire/pavement surface characteristics. In the US, transverse tining was the surface of choice for many decades. In recent years many highway agencies in the US have migrated to use of longitudinal tining. TxDOT has been investigating surface texture methods for concrete pavements that effectively meet the needs with respect to safety (reduce wet weather accidents) and noise (reduce noise levels away from the vehicle and in the vehicle). The following surface texture methods were studied at the FM 1938 project.
1. Longitudinal tining, spaced at 1 in. – Sta. 98+23 to Sta. 115+00 (see Figure 13) 2. Carpet drag only – Sta. 115+00 to Sta. 132+00 (see Figure 14) 3. Transverse tining, spaced at ½ in. - Sta. 132+00 to Sta. 160+00 (see Figure 15) 4. Transverse tining, spaced at 1 in. - Sta. 160+00 to Sta. 205+00 (see Figure 16)

32
Figure 13. Typical texture of longitudinally tined surface.
Figure 14. Typical texture of carpet drag surface.

33
Figure 15. Typical texture of ½ inch transversely tined surface.
Figure 16. Typical texture of 1 inch transversely tined surface.

34
Noise Related Testing Noise testing was performed by TxDOT using the on board sound intensity (OBSI) method. The TxDOT OBSI setup is shown in Figure 17. The data from the OBSI testing, collected at 45 mph, are summarized in Figure 18. The transverse tined section with ½ in. spacing (Section 2) had the lowest noise level. However, Section 3 with longitudinal tining had not been opened to traffic at the time of noise testing. The results are considered typical for concrete pavements and were considered acceptable for this project given the relatively low projected speed limit of 45 mph.
Figure 17. TxDOT OBSI Setup

35
. Figure 18. OBSI Data from FM 1938 HfL Project.
Friction (Skid) Testing TxDOT collected skid resistance data using a smooth tire. The results are as follows:
1. For Section 2 (carpet drag), two tests were conducted and both tests resulted in value of 23. This is considered a low value.
2. For Section 2 (transverse tining at ½ in. spacing), two tests were conducted and test results were 44 and 46.
3. For Section 3 (transverse tining at 1 in. spacing), two tests were conducted and both tests resulted in value of 50.
Smoothness Testing In addition to noise testing, TxDOT conducted smoothness testing on all sections. Overall, the results for this project averaged about 92 inches per mile, with no segments receiving a bonus and several requiring grinding to achieve the maximum allowed value of 95 inches per mile. The higher than expected values are attributed to the numerous short sections that were paved on the project. While no further testing was done after the grinding, the pavement is expected to be satisfactory with respect to smoothness due to the low speed limit at this location.

36
DATA ACQUISITION AND ANALYSIS Data on safety, traffic flow, quality, and user satisfaction were collected before, during, and after construction to determine compliance with the HfL performance goals where appropriate. The primary objective of acquiring these types of data was to quantify the project performance, provide an objective basis on which to determine the feasibility of the project innovations, and demonstrate that the innovations can be used to do the following:
• Achieve a safer work environment for the traveling public and workers. • Reduce construction time and minimize traffic interruptions. • Produce a high-quality project and gain user satisfaction.
In the case of FM 1938, many of the goals were not considered relevant, due to the low speed nature of the final project and the fact that the construction took place on new RoW, resulting in no impact to the public with respect to congestion, travel time, or safety. This section discusses how TxDOT met the specific HfL performance goals related to this project. SAFETY Because the project was constructed on new RoW, there was no impact to the safety of the public during construction. No worker injuries occurred during construction, which exceeded the goal of less than a 4.0 rating on the OSHA 300 form. CONSTRUCTION CONGESTION/ TRIP TIME/QUEUE LENGTH Because all construction took place on new RoW there was no impact to existing traffic movements or trip times within the construction area. No measurements were taken in this area. TRAFFIC STUDY No impact to the public occurred as a result of the construction of this project; therefore, no traffic study was done. QUALITY Smoothness Due to the low speed nature of the final roadway, no smoothness goal was established for this project. However, the standard TxDOT specification for smoothness was included in the contract. The standard specification requires a maximum limit of 95 inches per mile, with a pay penalty for numbers above 75 inches per mile and a bonus for numbers below 60 inches per mile. The first results for this project as measured by TxDOT, averaged about 92 inches per mile, with no segments receiving a bonus and several requiring grinding to achieve the maximum allowed value of 95 inches per mile. The higher than expected values are attributed to the numerous short sections that were paved on the project. While no further testing was done after the grinding, the

37
pavement is expected to be satisfactory with respect to smoothness due to the low speed limit at this location. Noise With a proposed speed limit of only 45 mph for the completed project, no HFL goal for noise was included. However, the TxDOT did perform noise testing on the project using their own equipment. Several textures were included on this project, with the resulting noise levels ranging from 94 to about 101 dB. Durability Several innovations included in this project are expected to improve the durability and performance of the final project, as noted below:
• The optimized aggregation gradation is one way to help control cracking in the CRCP. Another advantage is the reduction of cement paste, resulting in less drying shrinkage and less overall cracking.
• The use of intelligent compaction technology should also result in increased pavement
durability and overall quality. The ability to make real time corrections to the compaction process should translate into a more uniform paving platform and thus a longer lasting and durable pavement.
• The use of non-woven geo-textiles rather than conventional asphalt bond breakers
between cement stabilized bases and CRCP pavements did not result in any benefit and negatively impacted the crack spacing development.
• The use of lithium based curing technique did not result in any significant benefit
compared to standard Type 2 curing
• The use of longitudinal texturing techniques did not show any improvement over the traditional transverse tining technique, based on early age testing. USER SATISFACTION
The project was constructed on new RoW and therefore had no impact on the public during construction. No satisfaction survey was conducted. Increased public satisfaction is expected to result from shortened travel distances and times along the new corridor once completed.

38
TECHNOLOGY TRANSFER
To promote further interest and use of the innovations included in this project, TxDOT, in conjunction with the FHWA, sponsored a one day showcase. The showcase was held May 1, 2012 at the Dallas/Ft. Worth Marriott Solana, in the City of Westlake. The event featured presentations by the FHWA, TxDOT, the project contractor, and representatives from several universities and consulting firms. The presentations were followed by a field trip to the project to observe paving with optimized aggregate concrete and a trip to the batch plant.
Figure 19. Showcase participants at the job site.
Figure 20. Placement of rebar assembly.

39
Figure 21. Participants visiting the batching plant. Approximately 86 people attended the showcase from TxDOT, FHWA, local agencies, the construction and consulting industries, and academia. The program included the following:
1. Opening comments provided by Brian Barth, Deputy District Engineer for TxDOT in the Fort Worth District.
2. An overview of the Highway for LIFE program given by Sal Deocampo, District Engineer, FHWA –Texas division.
3. A national perspective on concrete pavement innovation was given by Suneel Vanikar, the Concrete Team Leader from FHWA.
4. An overview of the FM 1938 project outlining the specific goals and objectives of this project along with a discussion each individual innovation was discussed by representatives of the DOT, consultants, contractors and academia.
a. Instrumented roller study – Andrew Wimsatt b. Non-woven geotextile bond breakers – Mike Darter c. The use of geotextiles in CRCP – Moon Won d. Improved curing of CRCP – Dan Zollinger e. FM 1938 noise, texture and profile data – German Claros f. Construction highlights - Stan Allen, Project manager, Ed Bell Construction g. Lessons learned during the construction of the FH 1938 project - John Poskey,
Project Manager, TxDOT

40
ECONOMIC ANALYSIS A key aspect of HfL demonstration projects is quantifying, as much as possible, the value of the innovations deployed. This entails comparing the benefits and costs associated with the innovative project delivery approach adopted on an HfL project with those from a more traditional delivery approach. CONSTRUCTION COSTS Among the five innovations deployed on this project, only the use of optimized gradation has resulted in tangible cost savings to the agency. With the use of optimized gradation, TxDOT saved 15 lbs of cement per cubic yard of concrete mix. The immediate cost savings with the use of optimized gradation are presented as follows:
Cost of cement per metric ton in 2011 dollars = $ 89.50 (Geological Survey 2005) Cost savings with 1 CY of concrete = 15 lbs * $ 89.50/ton = 60.9 cents Potential cost saving per lane mile (9 in. thickness) = $1,050
The applications of other innovations are expected to contribute to performance improvements of the in-service pavement such as improved density of subgrade with IC and reduced crack growth with lithium-based concrete curing methods. While these performance improvements may contribute to agency cost savings in the long-term, the benefits associated with these innovations cannot be readily monetized. Hence no detailed economic analysis was conducted for this project. USER COSTS Since this project involved the construction of a new roadway alignment, the presence of work zone did not adversely impact the existing traffic operations in terms of motorist delay, detour and safety risks. Hence, an analysis of work zone road user costs and benefits was not conducted for this project.

41
ACKNOWLEDGMENTS The project team would like to acknowledge the invaluable insights and guidance of Federal Highway administration (FHWA) Highways for Life (HfL) Team Leader Byron Lord and Program Managers Ewa Flom, Mary Huie, and Kathleen Bergeron, who served on the technical panel on the demonstration project. Also, the project team would like to thank the following for their support of the demonstration project and for providing information on the design, construction, and initial performance of the project:
• Robert Musselman and Sal Deocampo, FHWA Texas Division • Texas DOT
o Mike Bostic, Director of Construction, Fort Worth District o John Poskey and Amar Akram, North Tarant County Area Office, Fort Worth
District • Ed Bell Construction Company • Researchers
o Andrew Wimsatt, Texas A&M Transportation Institute o Dan Zollinger, Texas A&M Transportation Institute o Moon Won, Texas Tech University o Tyler Ley, Oklahoma State University o Kyle Riding, Kansas State University

42
REFERENCES
1. Zollinger, D., et al., Implementation of Curing, Texturing, Subbase, and Compaction Measurement Alternatives for Continuously Reinforced Concrete Pavement, Report No. FHWA/TX-13/5-6037-01-1, Texas Department of Transportation, Austin, Texas, February 2013.
2. Rasmussen, R., et al., Nonwoven Geotextile Interlayers for Separating Cementitious Pavement Layers: A Report of European Practice and US Field Trials, Federal Highway Administration, March 2009. Nonwoven Geotextile Interlayers for Separating Cementitious Pavement Layers: A Report of European Practice and US Field Trials
3. Geological Survey, Historical Statistics for Mineral and Material Commodities in the United States. Geological Survey, Historical Statistics for Mineral and Material Commodities in the United States