by the power of metrics - lean kanban north america 2015
TRANSCRIPT

By the Power of Metrics
LeanKanban North America 2015 - #LKNA15 Wolfgang Wiedenroth @wwiedenroth
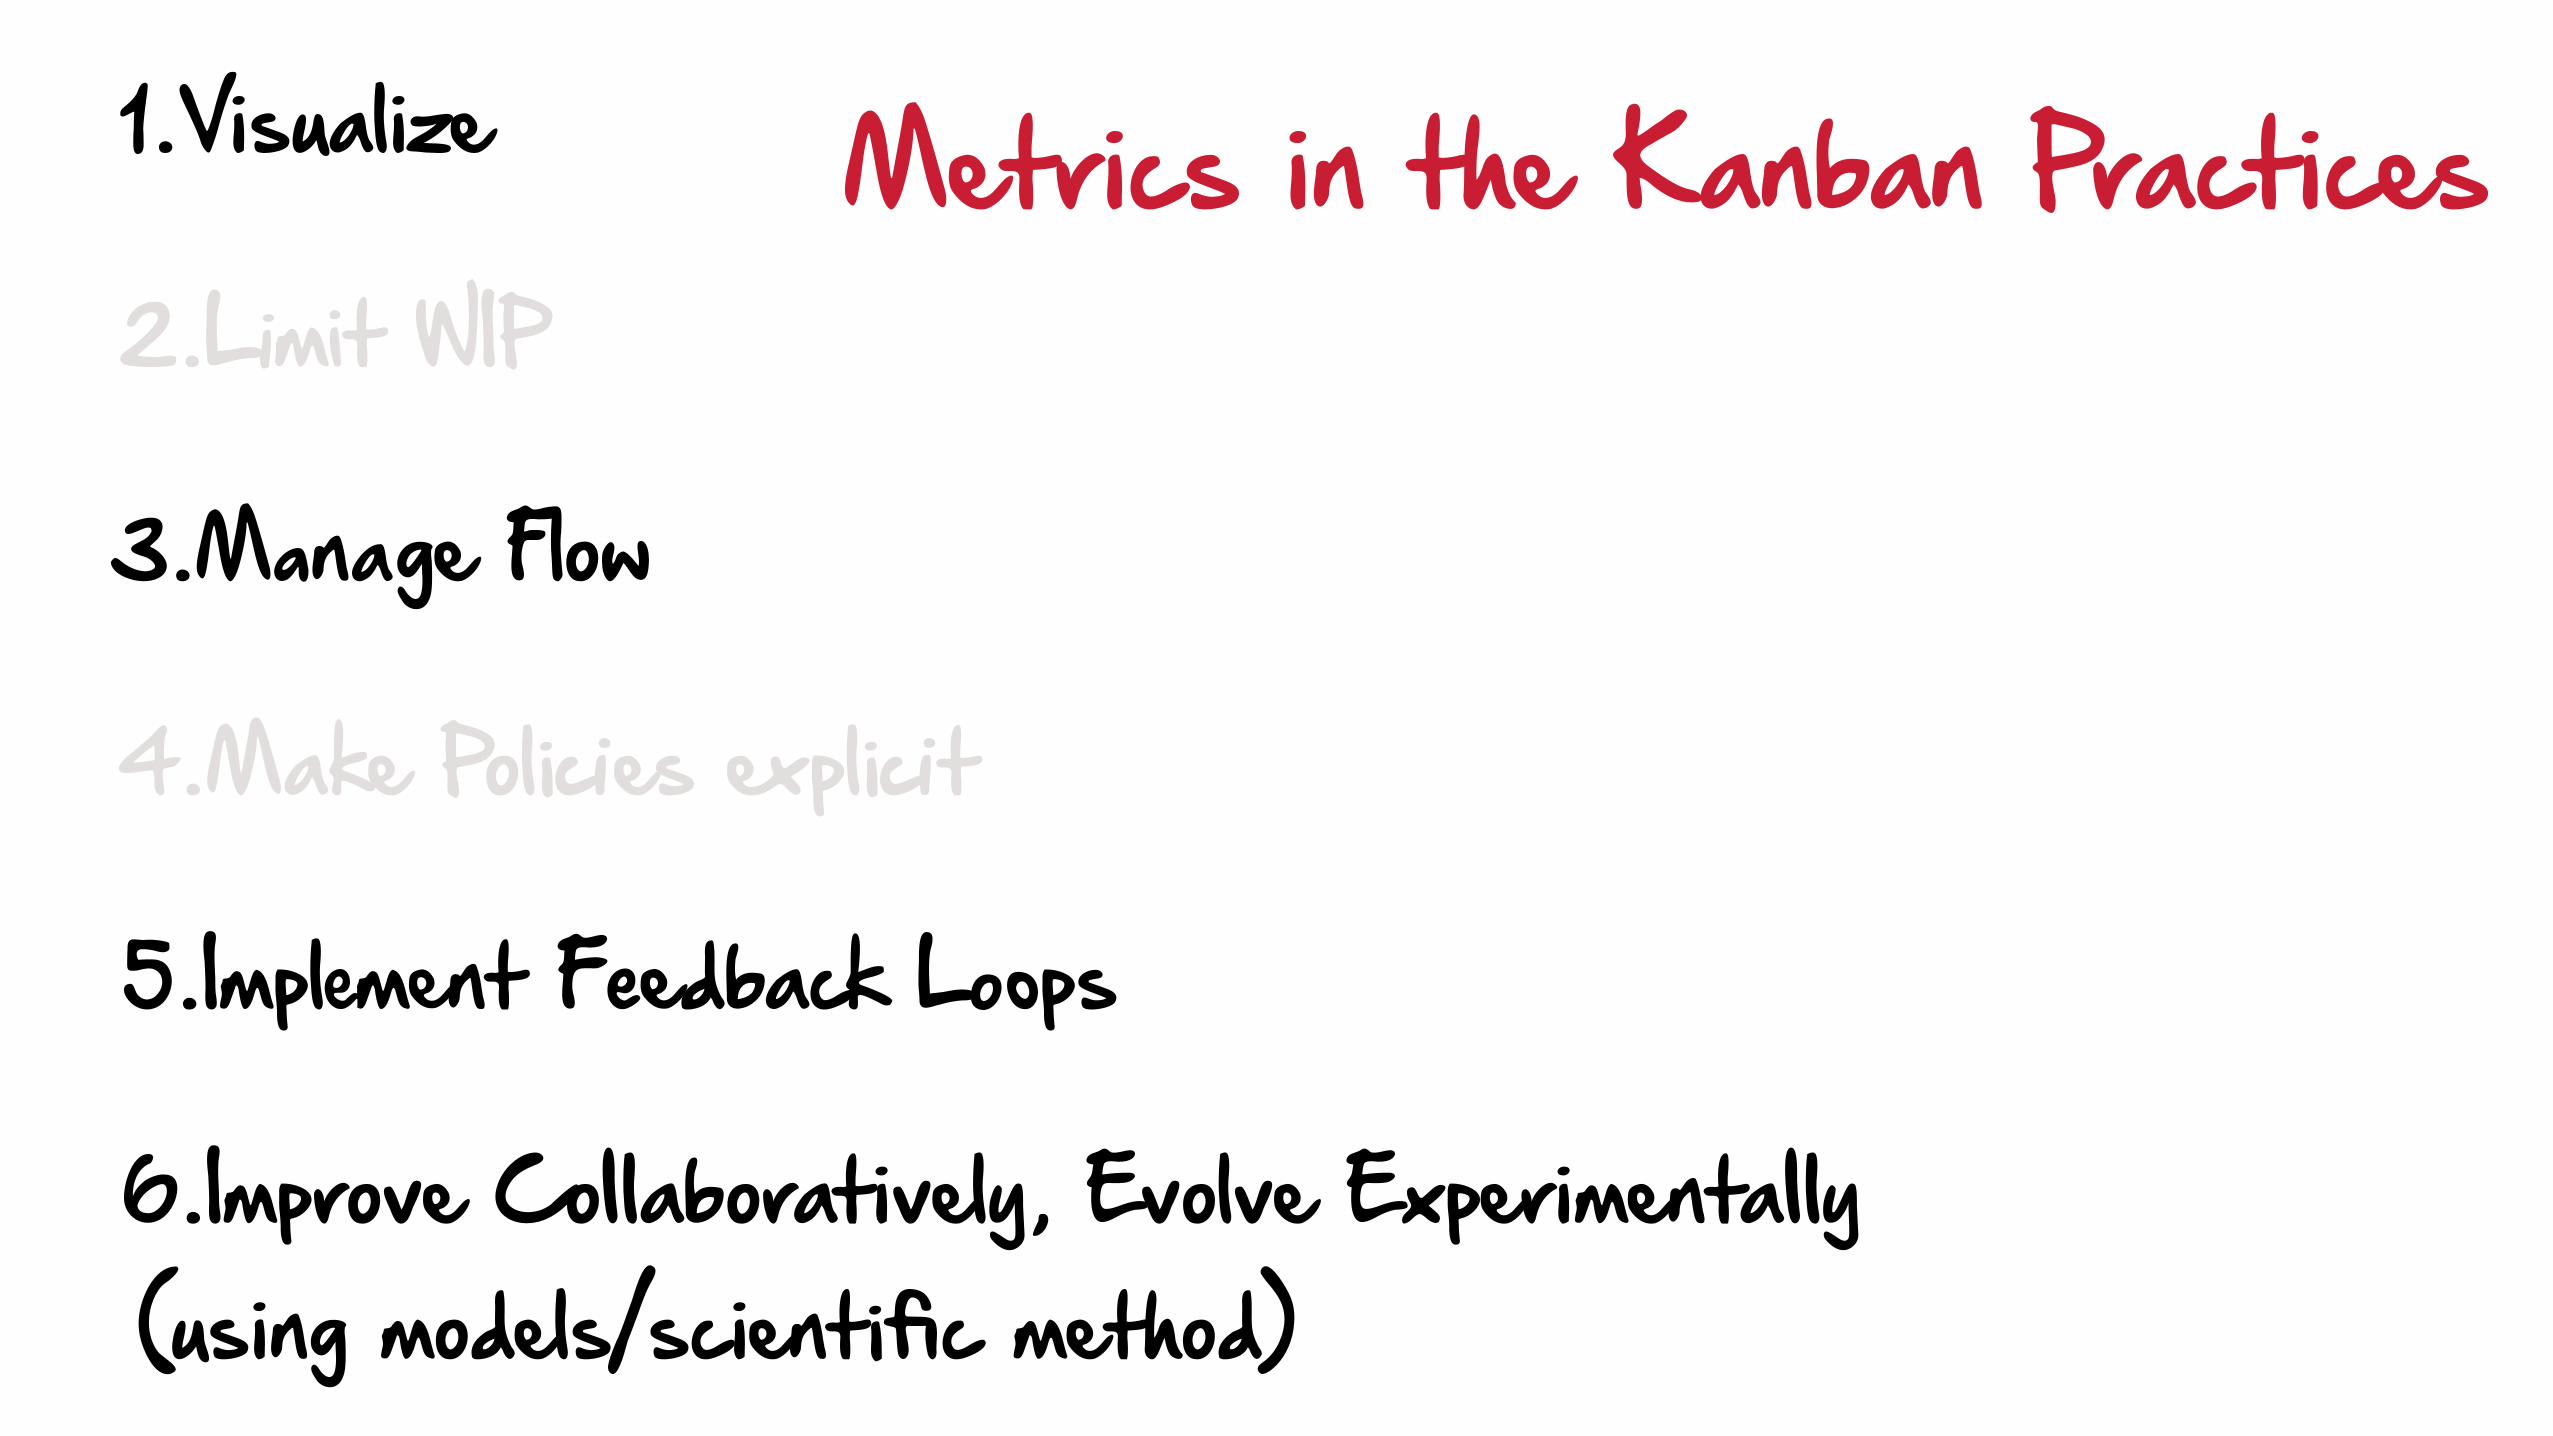
Metrics in the Kanban Practices1.Visualize
2.Limit WIP
3.Manage Flow
4.Make Policies explicit
5.Implement Feedback Loops
6.Improve Collaboratively, Evolve Experimentally (using models/scientific method)
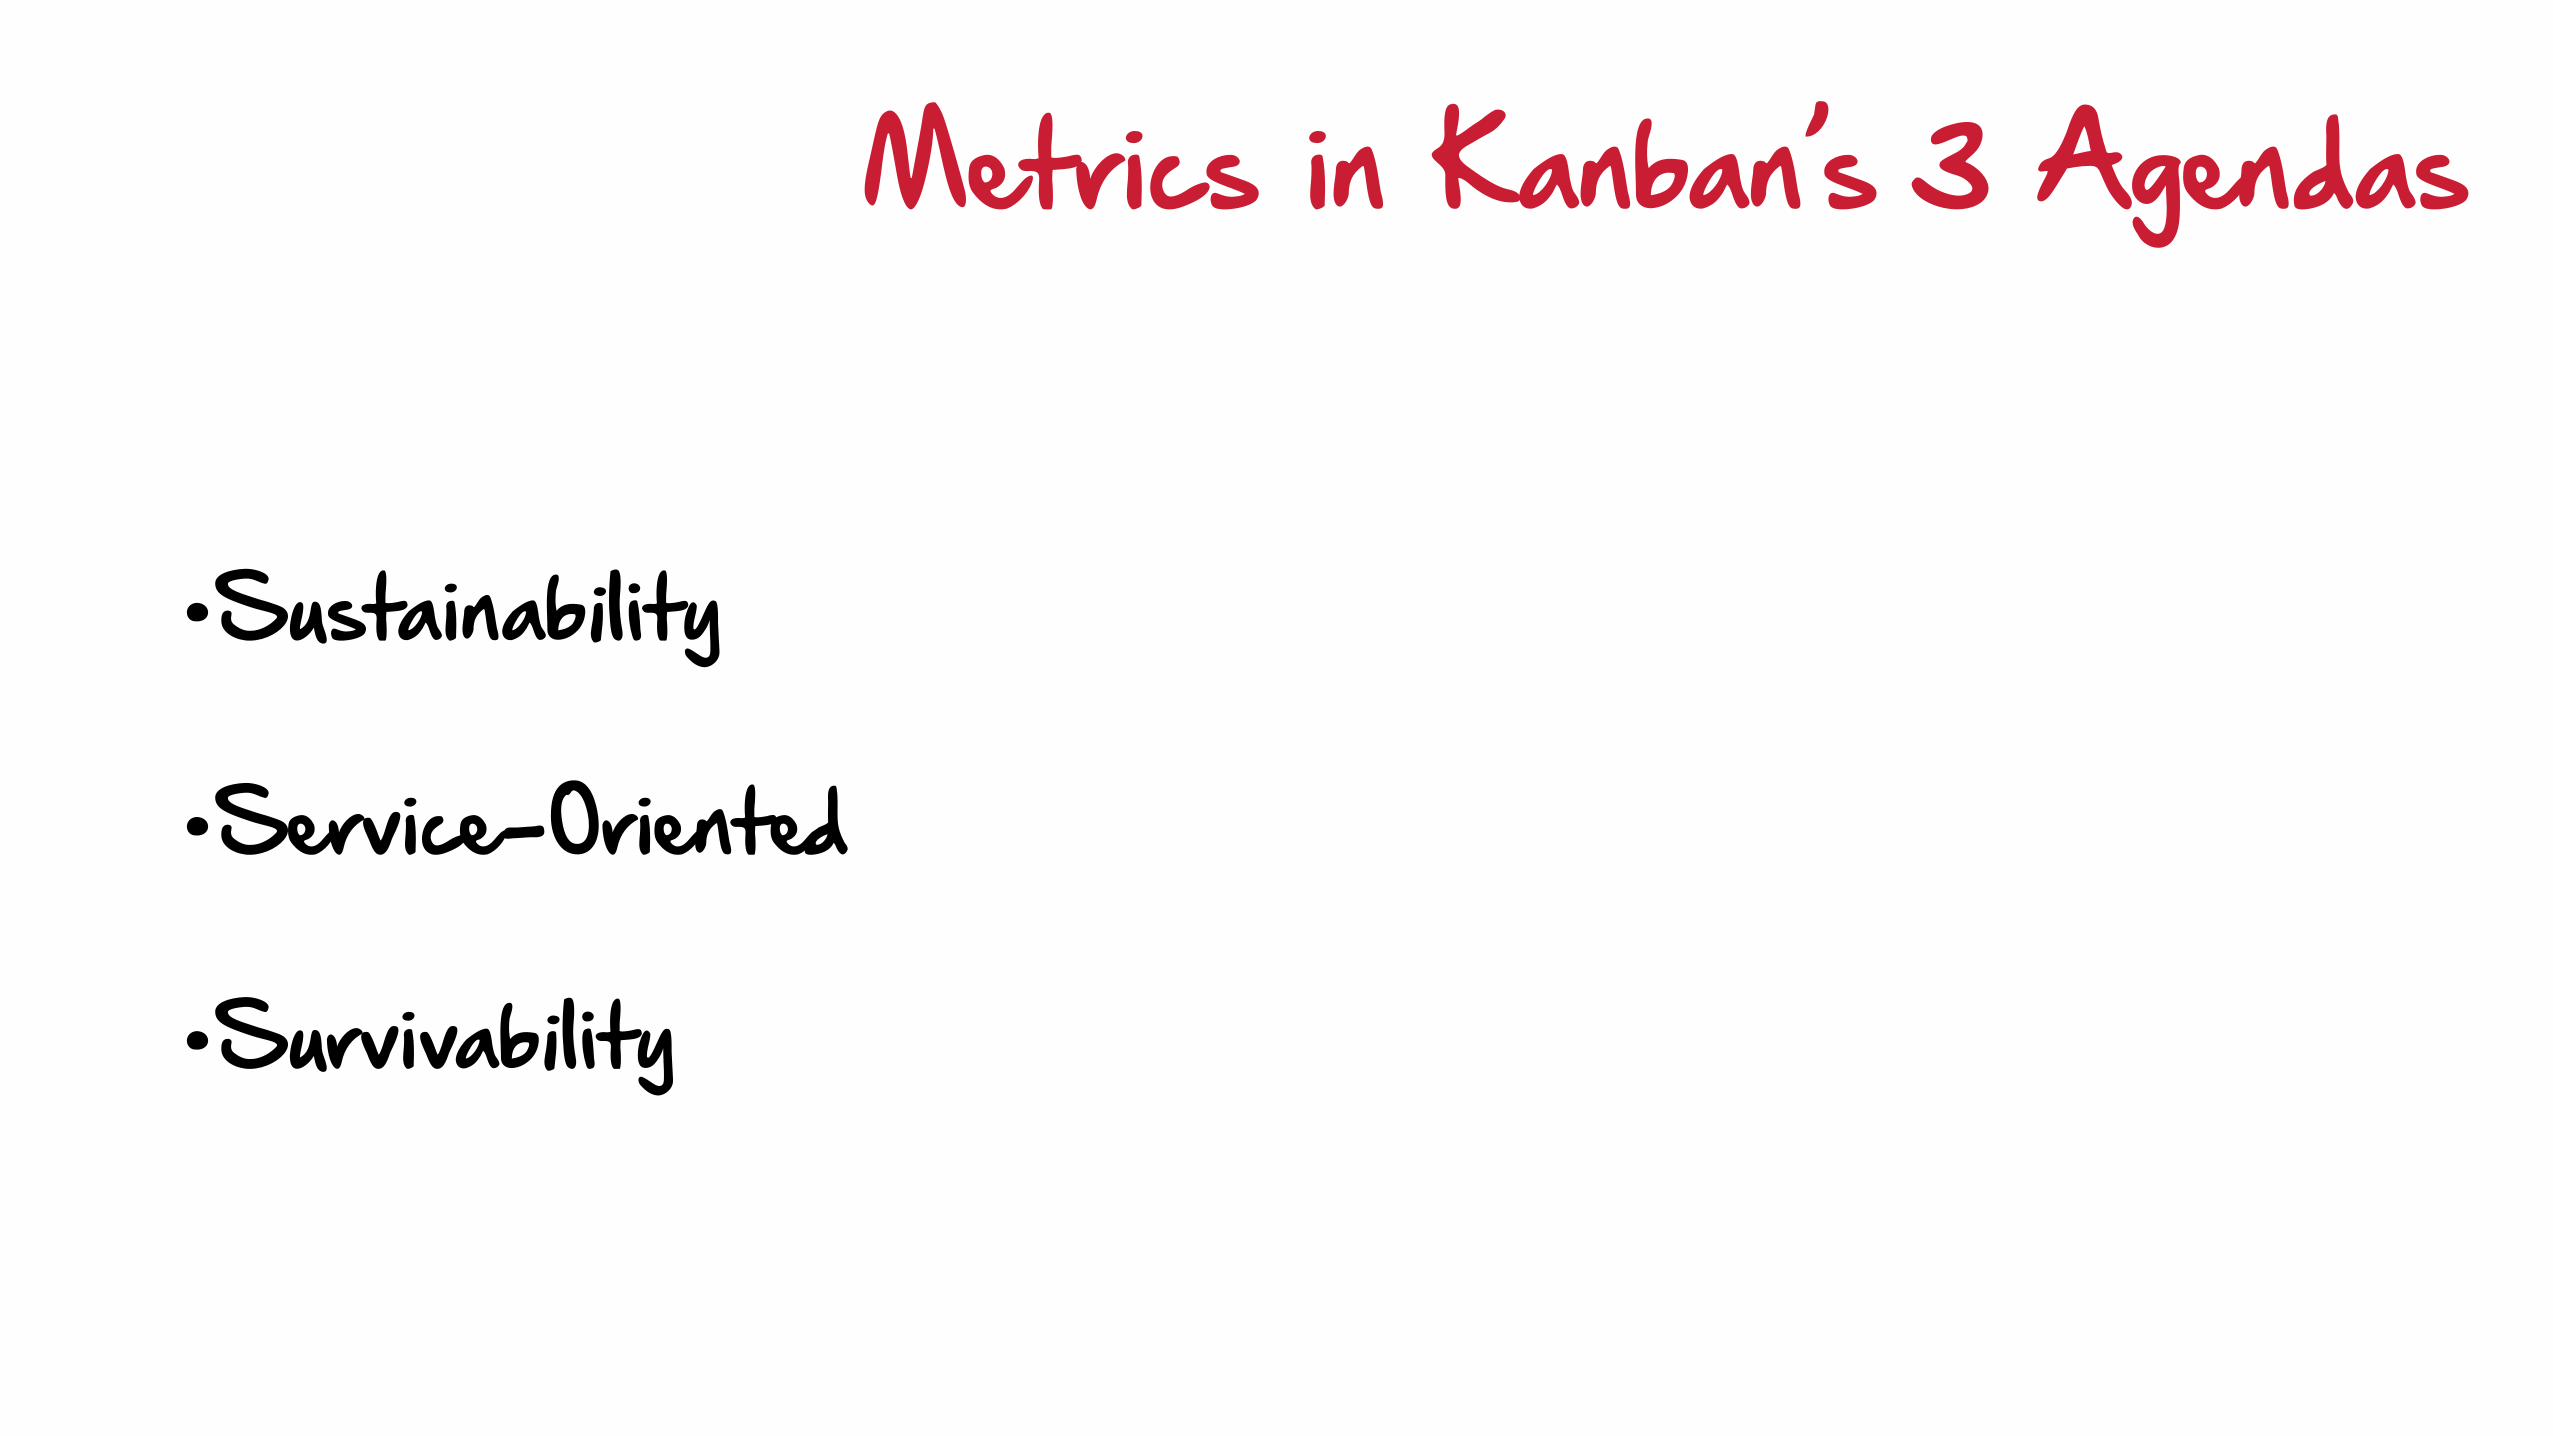
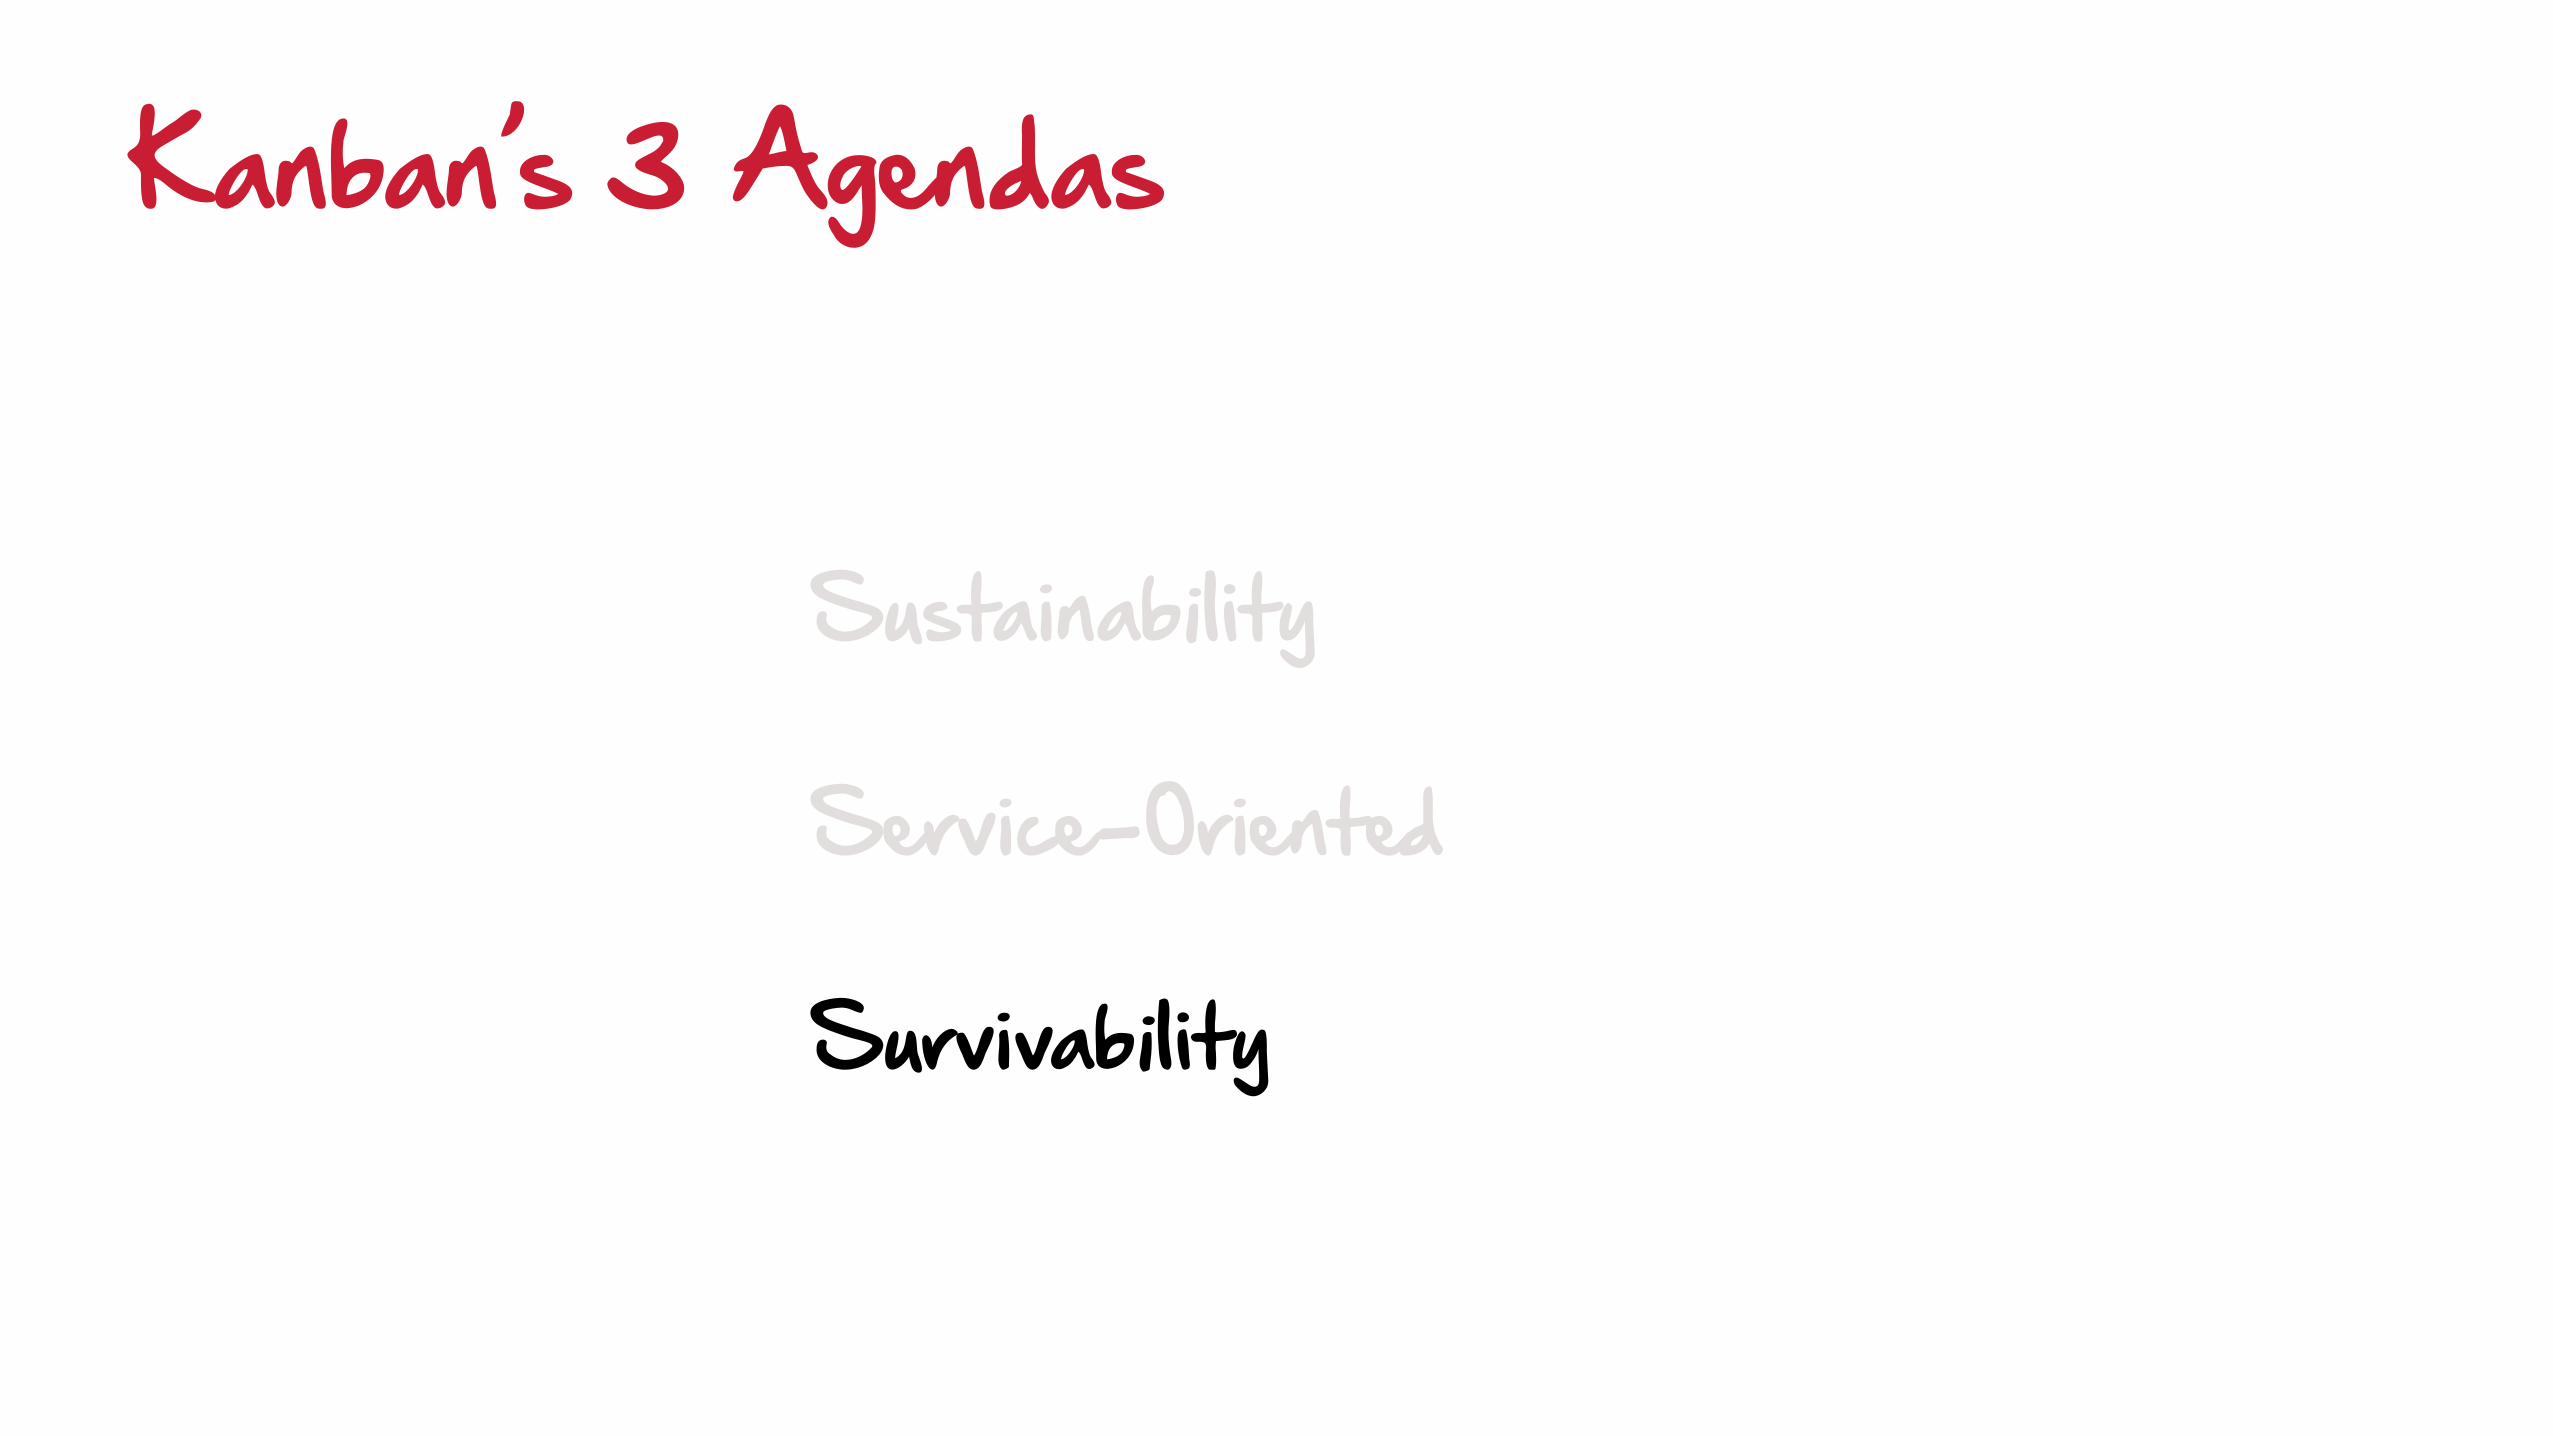
Metrics in Kanban’s 3 Agendas
•Sustainability
•Service-Oriented
•Survivability

Visualization
20#
25#
30#
35#
40#
45#
50#
55#
60#
65#
70#
75#
80#
85#
90#
95#
100#
105#
110#
115#
1#May#2012#
7#May#2012#
11#May#2012#
17#May#2012#
23#May#2012#
29#May#2012#
4#Jun#2012#
8#Jun#2012#
14#Jun#2012#
20#Jun#2012#
26#Jun#2012#
2#Jul#2012#
6#Jul#2012#
12#Jul#2012#
18#Jul#2012#
24#Jul#2012#
30#Jul#2012#
3#Aug#2012#
9#Aug#2012#
15#Aug#2012#
21#Aug#2012#
27#Aug#2012#
31#Aug#2012#
6#Sep#2012#
12#Sep#2012#
18#Sep#2012#
24#Sep#2012#
28#Sep#2012#
4#Oct#2012#
10#Oct#2012#
16#Oct#2012#
22#Oct#2012#
26#Oct#2012#
1#Nov#2012#
7#Nov#2012#
13#Nov#2012#
19#Nov#2012#
23#Nov#2012#
29#Nov#2012#
5#Dec#2012#
11#Dec#2012#
17#Dec#2012#
21#Dec#2012#
27#Dec#2012#
2#Jan#2013#
8#Jan#2013#
14#Jan#2013#
18#Jan#2013#
24#Jan#2013#
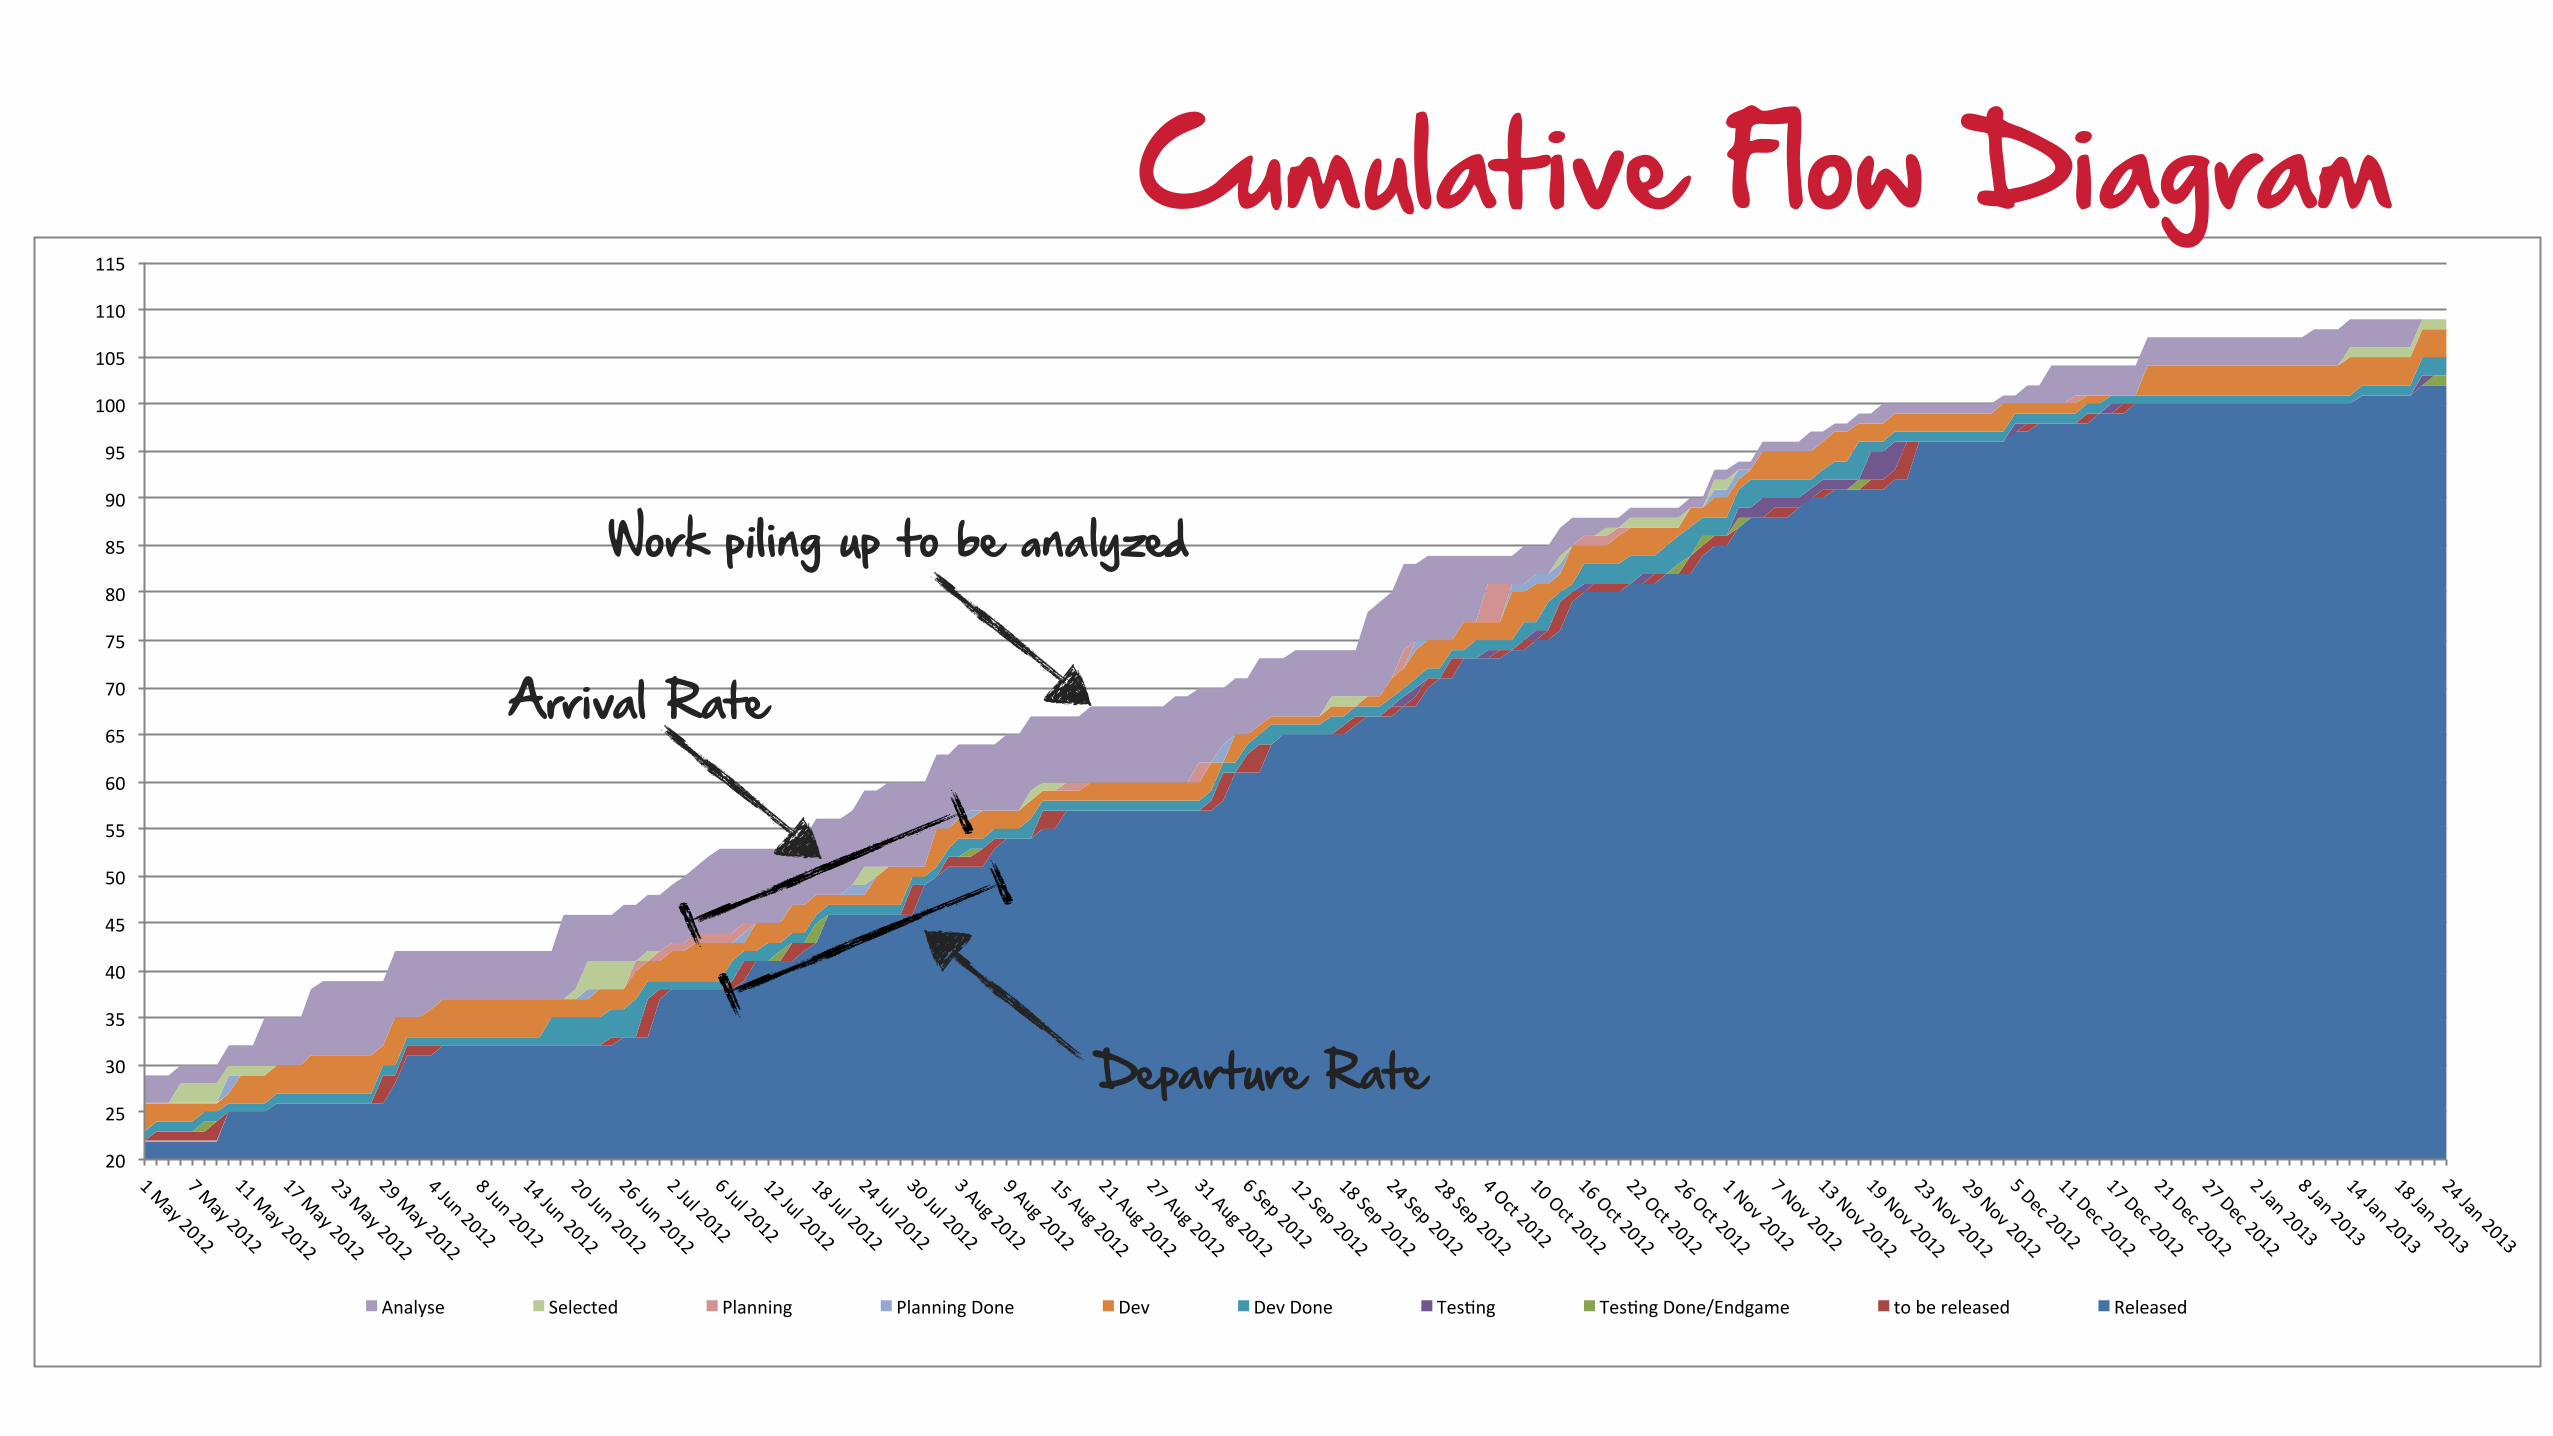
Analyse# Selected# Planning# Planning#Done# Dev# Dev#Done# TesDng# TesDng#Done/Endgame# to#be#released# Released#
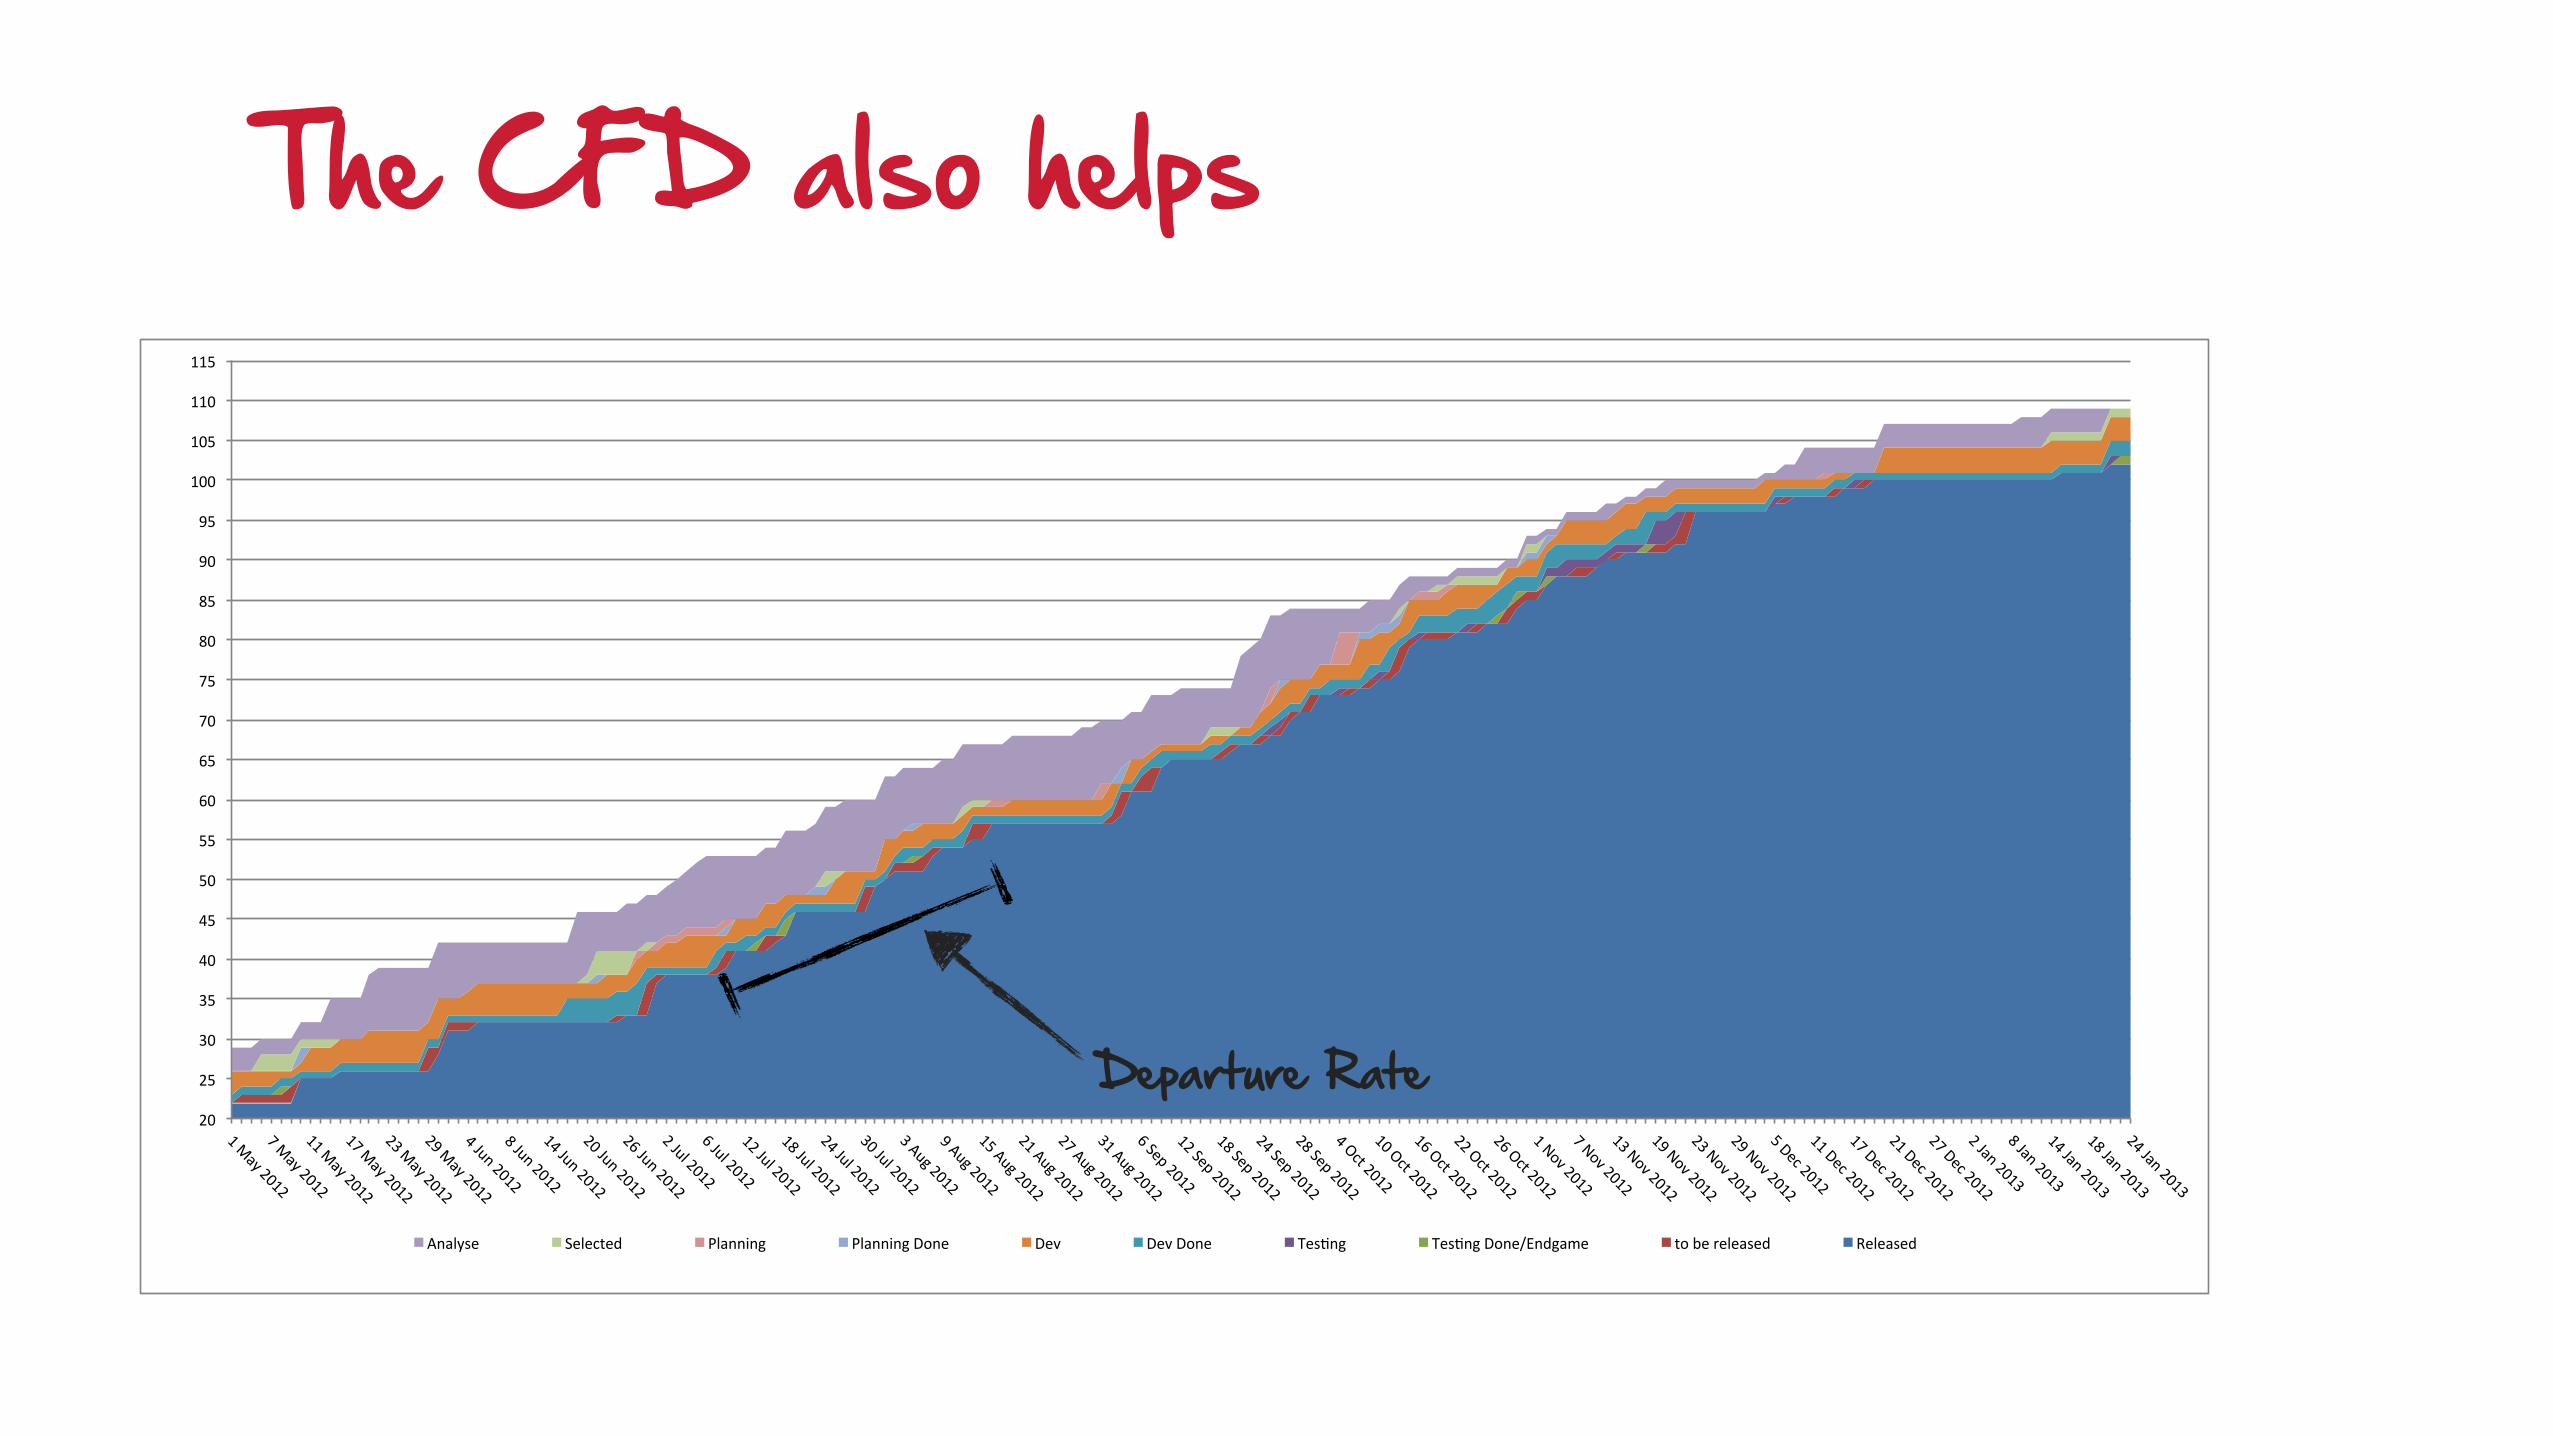
Cumulative Flow Diagram
Work piling up to be analyzed
Arrival Rate
Departure Rate
20#
25#
30#
35#
40#
45#
50#
55#
60#
65#
70#
75#
80#
85#
90#
95#
100#
105#
110#
115#
1#May#2012#
7#May#2012#
11#May#2012#
17#May#2012#
23#May#2012#
29#May#2012#
4#Jun#2012#
8#Jun#2012#
14#Jun#2012#
20#Jun#2012#
26#Jun#2012#
2#Jul#2012#
6#Jul#2012#
12#Jul#2012#
18#Jul#2012#
24#Jul#2012#
30#Jul#2012#
3#Aug#2012#
9#Aug#2012#
15#Aug#2012#
21#Aug#2012#
27#Aug#2012#
31#Aug#2012#
6#Sep#2012#
12#Sep#2012#
18#Sep#2012#
24#Sep#2012#
28#Sep#2012#
4#Oct#2012#
10#Oct#2012#
16#Oct#2012#
22#Oct#2012#
26#Oct#2012#
1#Nov#2012#
7#Nov#2012#
13#Nov#2012#
19#Nov#2012#
23#Nov#2012#
29#Nov#2012#
5#Dec#2012#
11#Dec#2012#
17#Dec#2012#
21#Dec#2012#
27#Dec#2012#
2#Jan#2013#
8#Jan#2013#
14#Jan#2013#
18#Jan#2013#
24#Jan#2013#
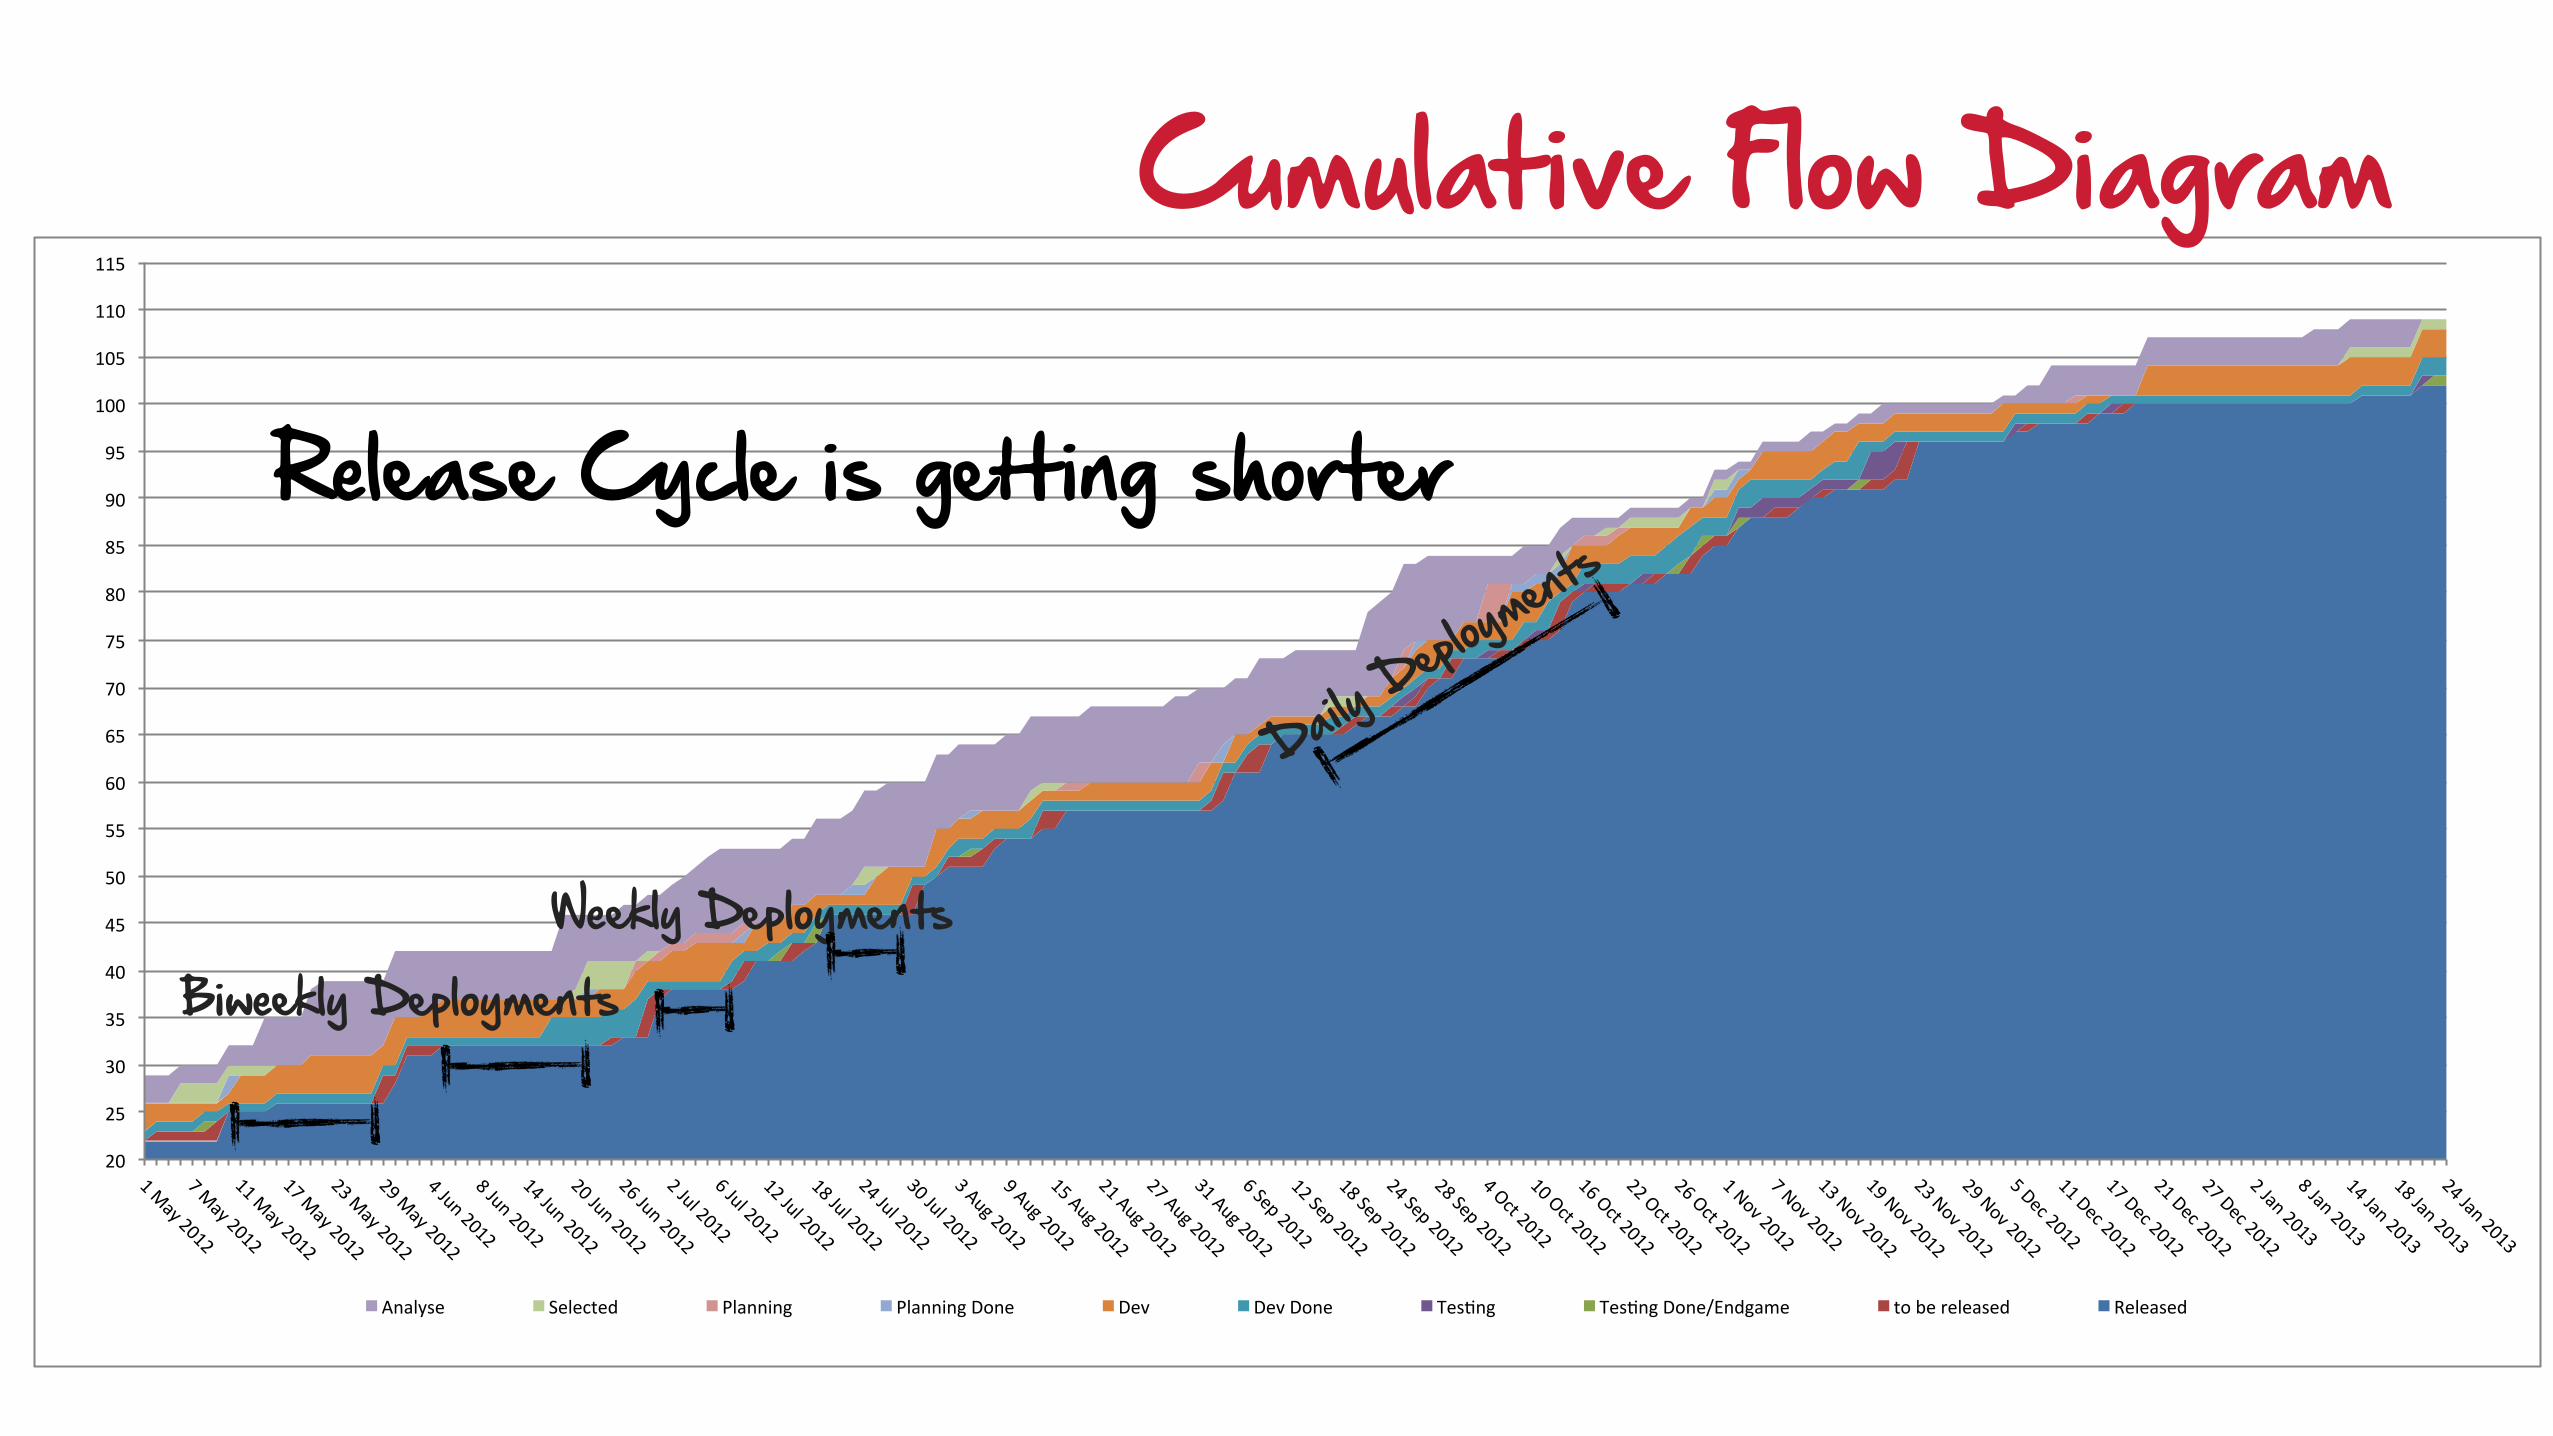
Analyse# Selected# Planning# Planning#Done# Dev# Dev#Done# TesDng# TesDng#Done/Endgame# to#be#released# Released#
Cumulative Flow Diagram
Release Cycle is getting shorter
Daily Deploy
ments
Biweekly DeploymentsWeekly Deployments
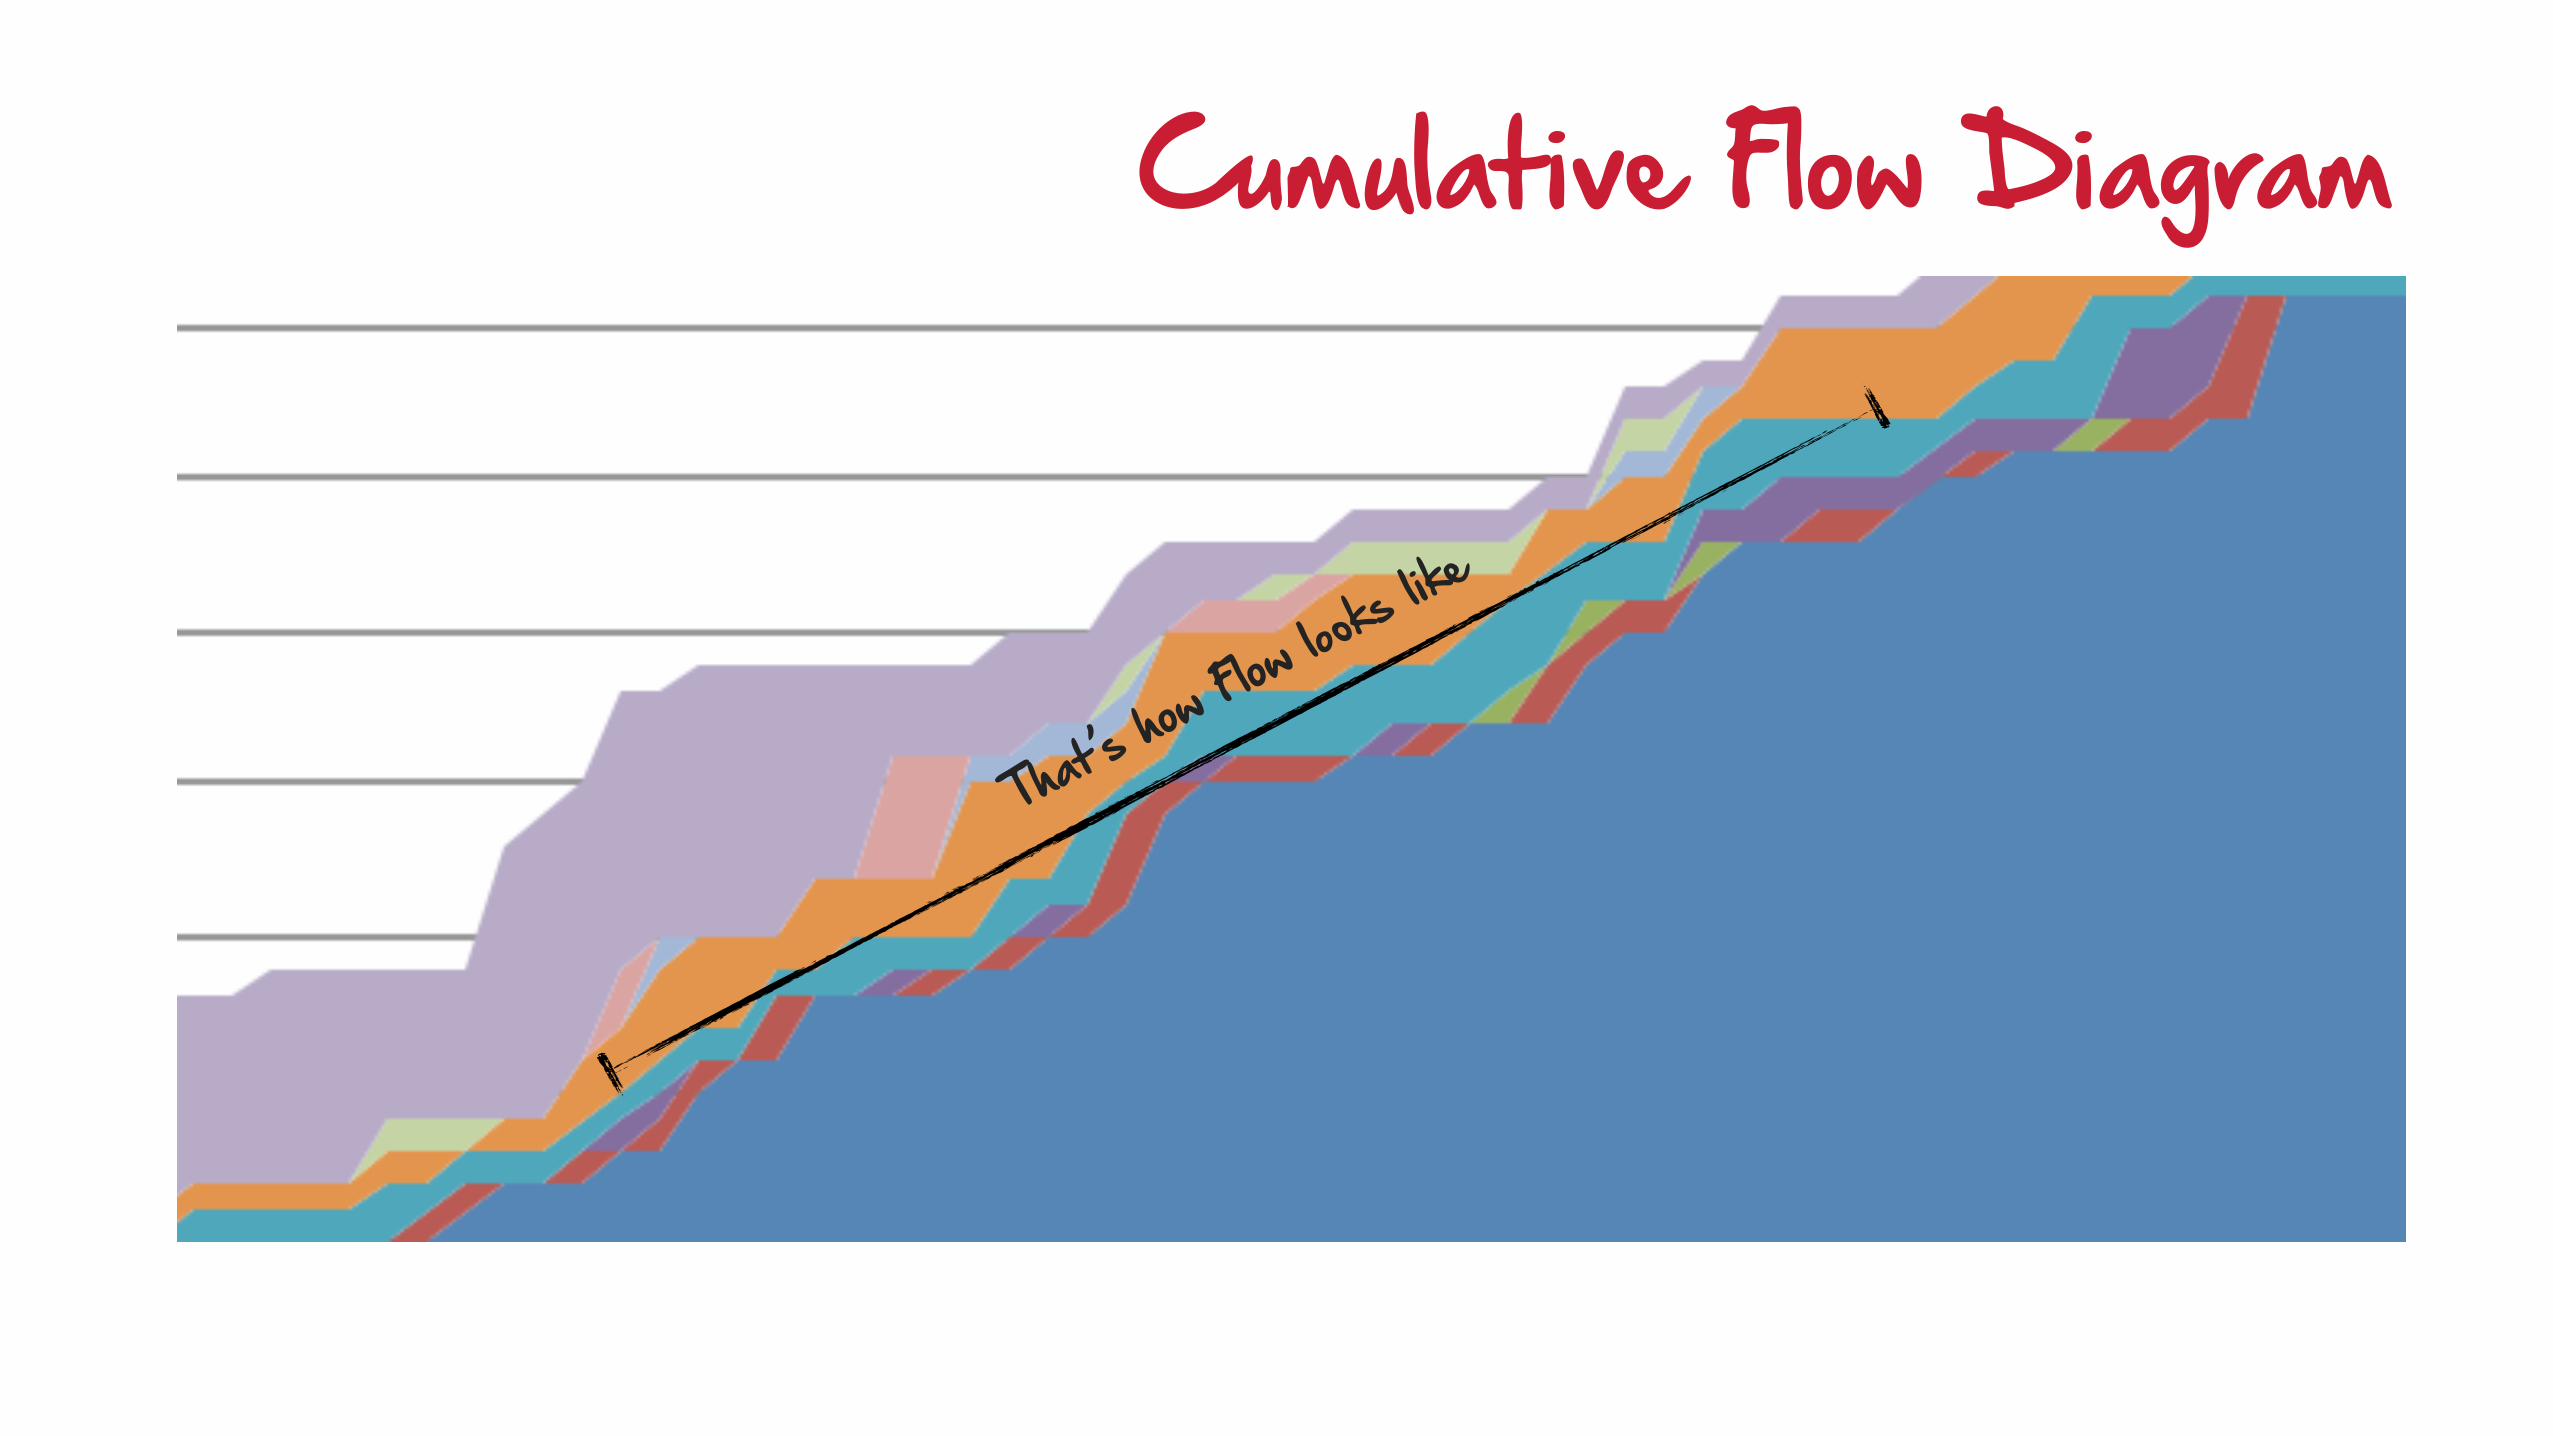
That’s ho
w Flow looks li
ke
Cumulative Flow Diagram
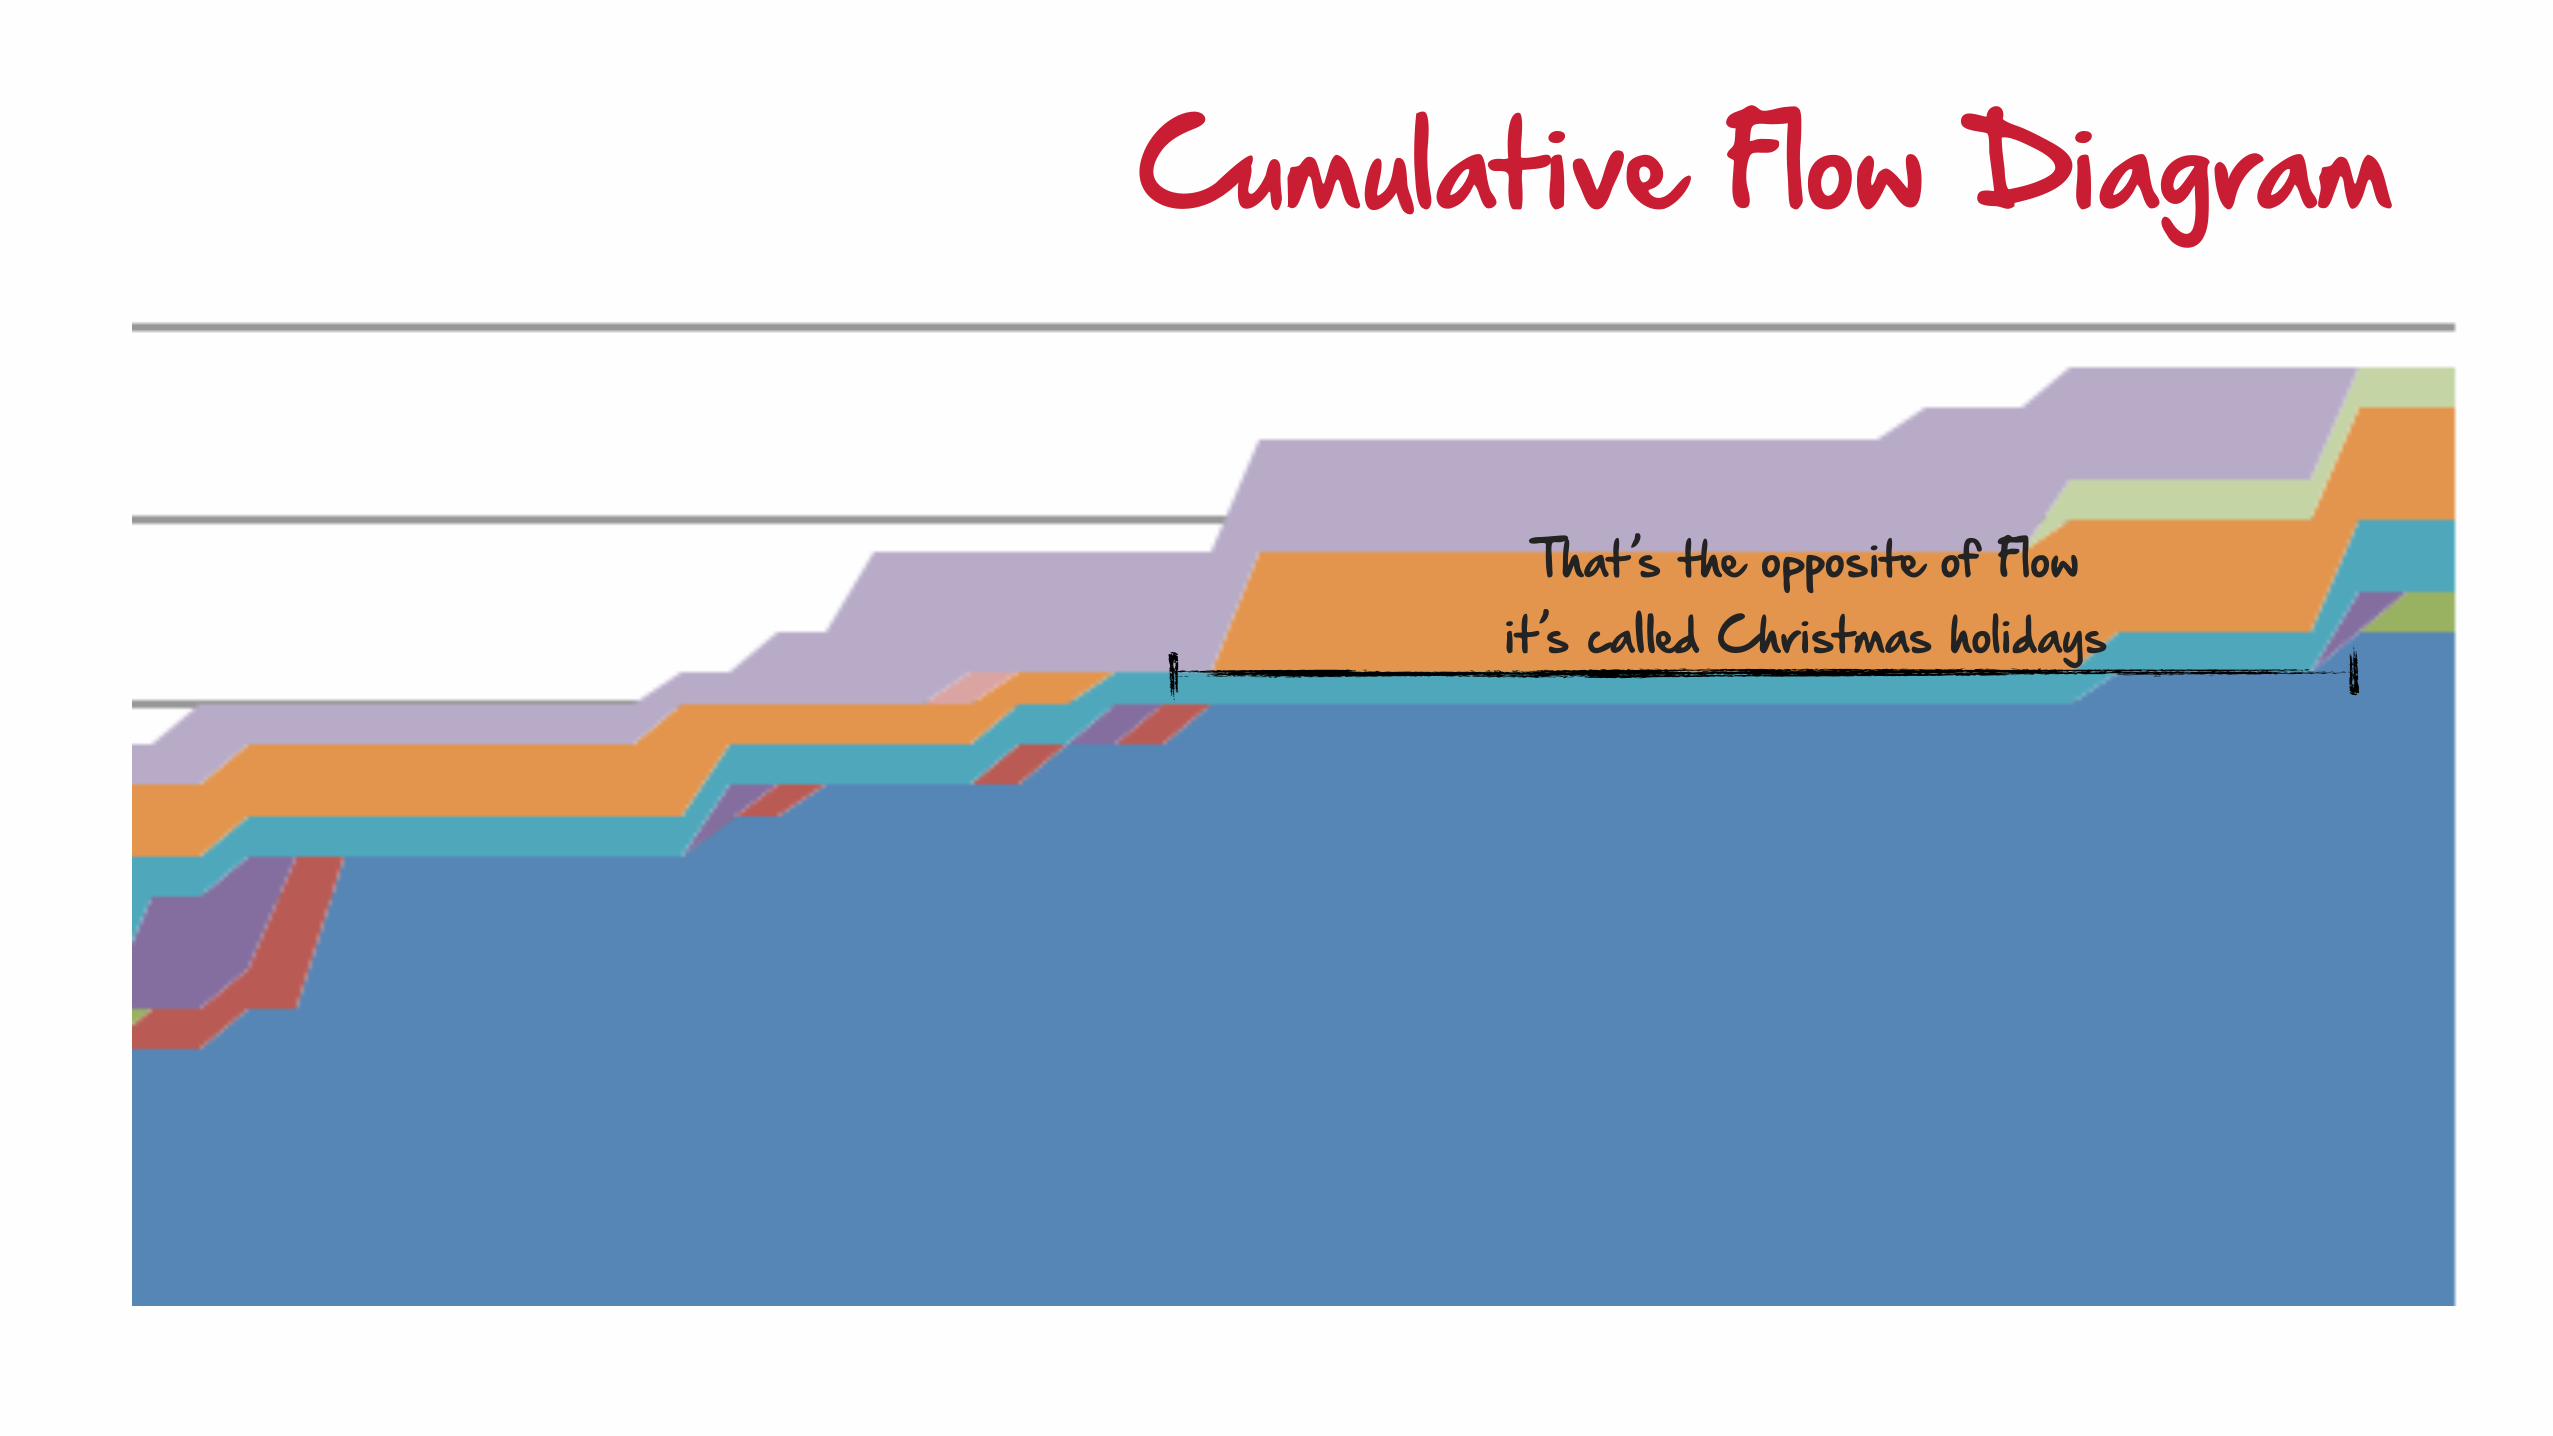
That’s the opposite of Flow it’s called Christmas holidays
Cumulative Flow Diagram
0"
2"
4"
6"
8"
10"
12"
14"
16"
18"
20"
1" 2" 3" 4" 5" 6" 7" 8" 9"10"11"12"13"14"15"16"17"18"19"20"21"22"23"24"25"26"27"28"29"30"31"32"33"34"35"36"37"38"39"40"41"42"43"44"45"46"47"48"49"50"51"52"53"54"55"56"57"58"59"60"61"62"63"64"65"66"67"68"69"70"
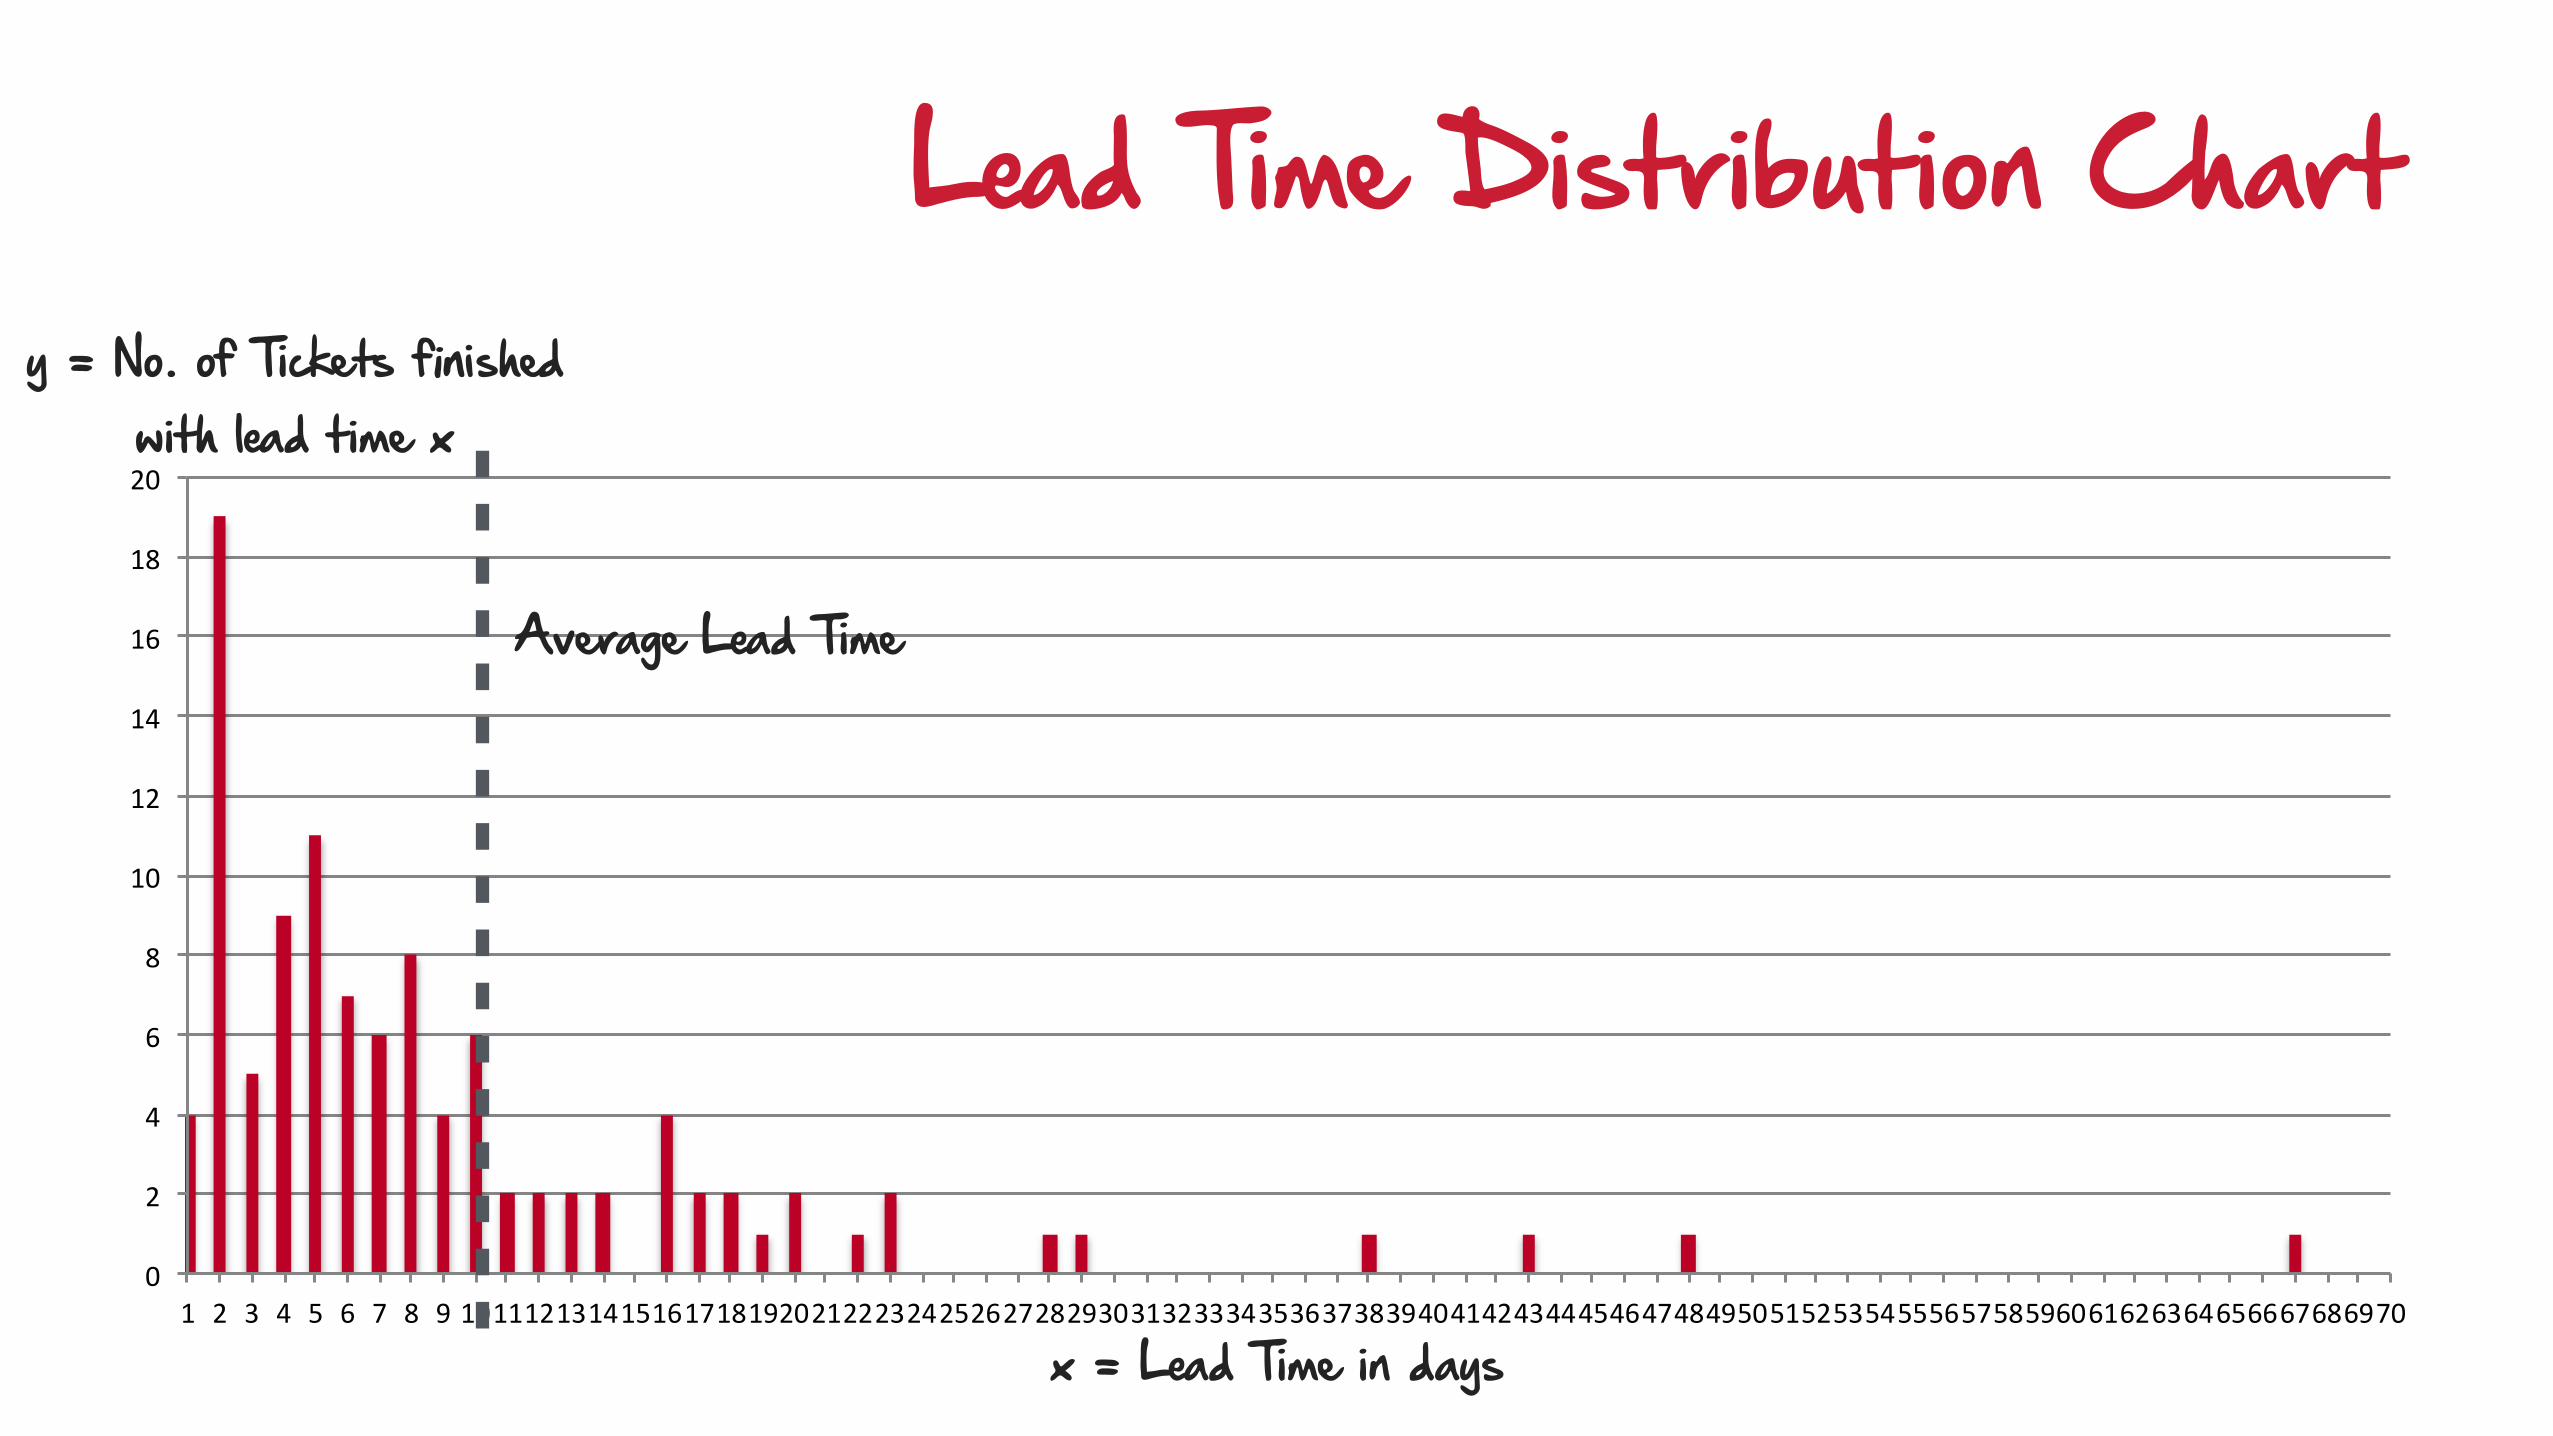
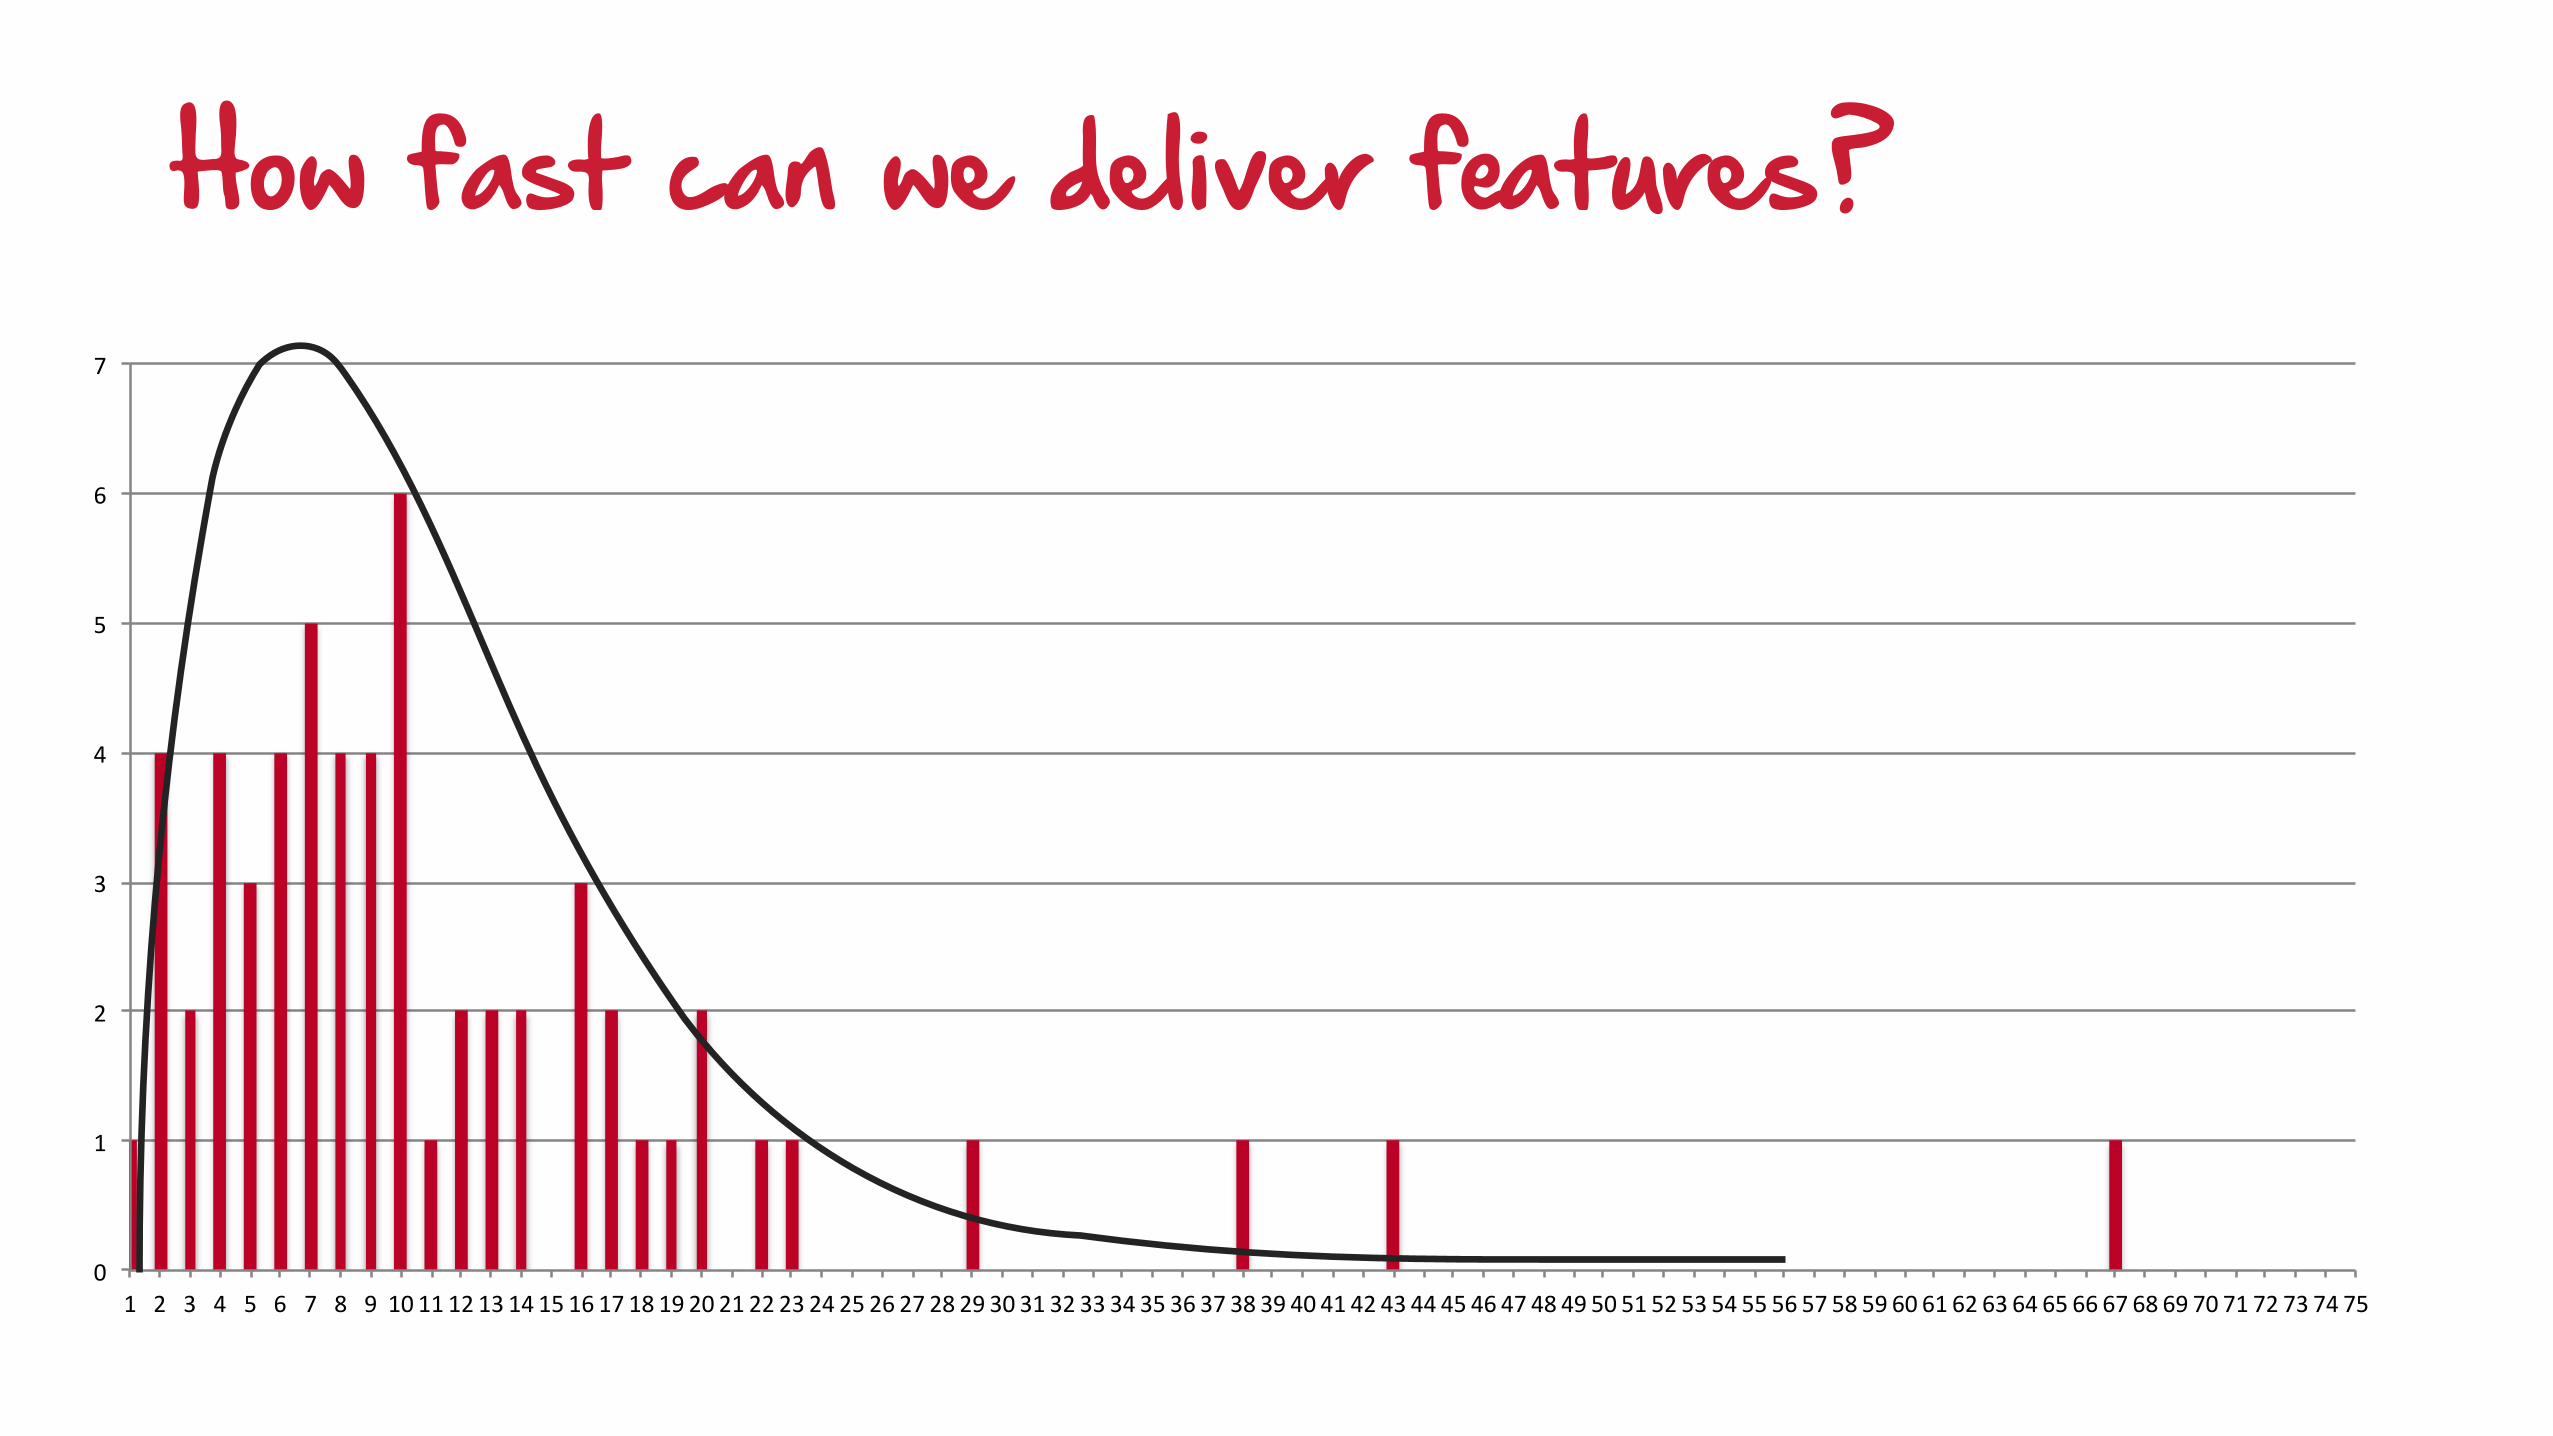
y = No. of Tickets finished with lead time x
x = Lead Time in days
Average Lead Time
Lead Time Distribution Chart
0"
1"
2"
3"
4"
5"
6"
6" 7" 8" 9" 10" 11" 12" 13" 14" 15" 16" 17" 18" 19" 20" 21" 22" 23" 24" 25" 26" 27" 28" 29" 30" 31" 32" 33" 34" 35" 36" 37" 38" 39" 40" 41" 42" 43" 44" 45" 46" 47" 48" 49" 50" 51" 52" 1" 2" 3" 4" 5" 6" 7" 8" 9"
MEDIAN"
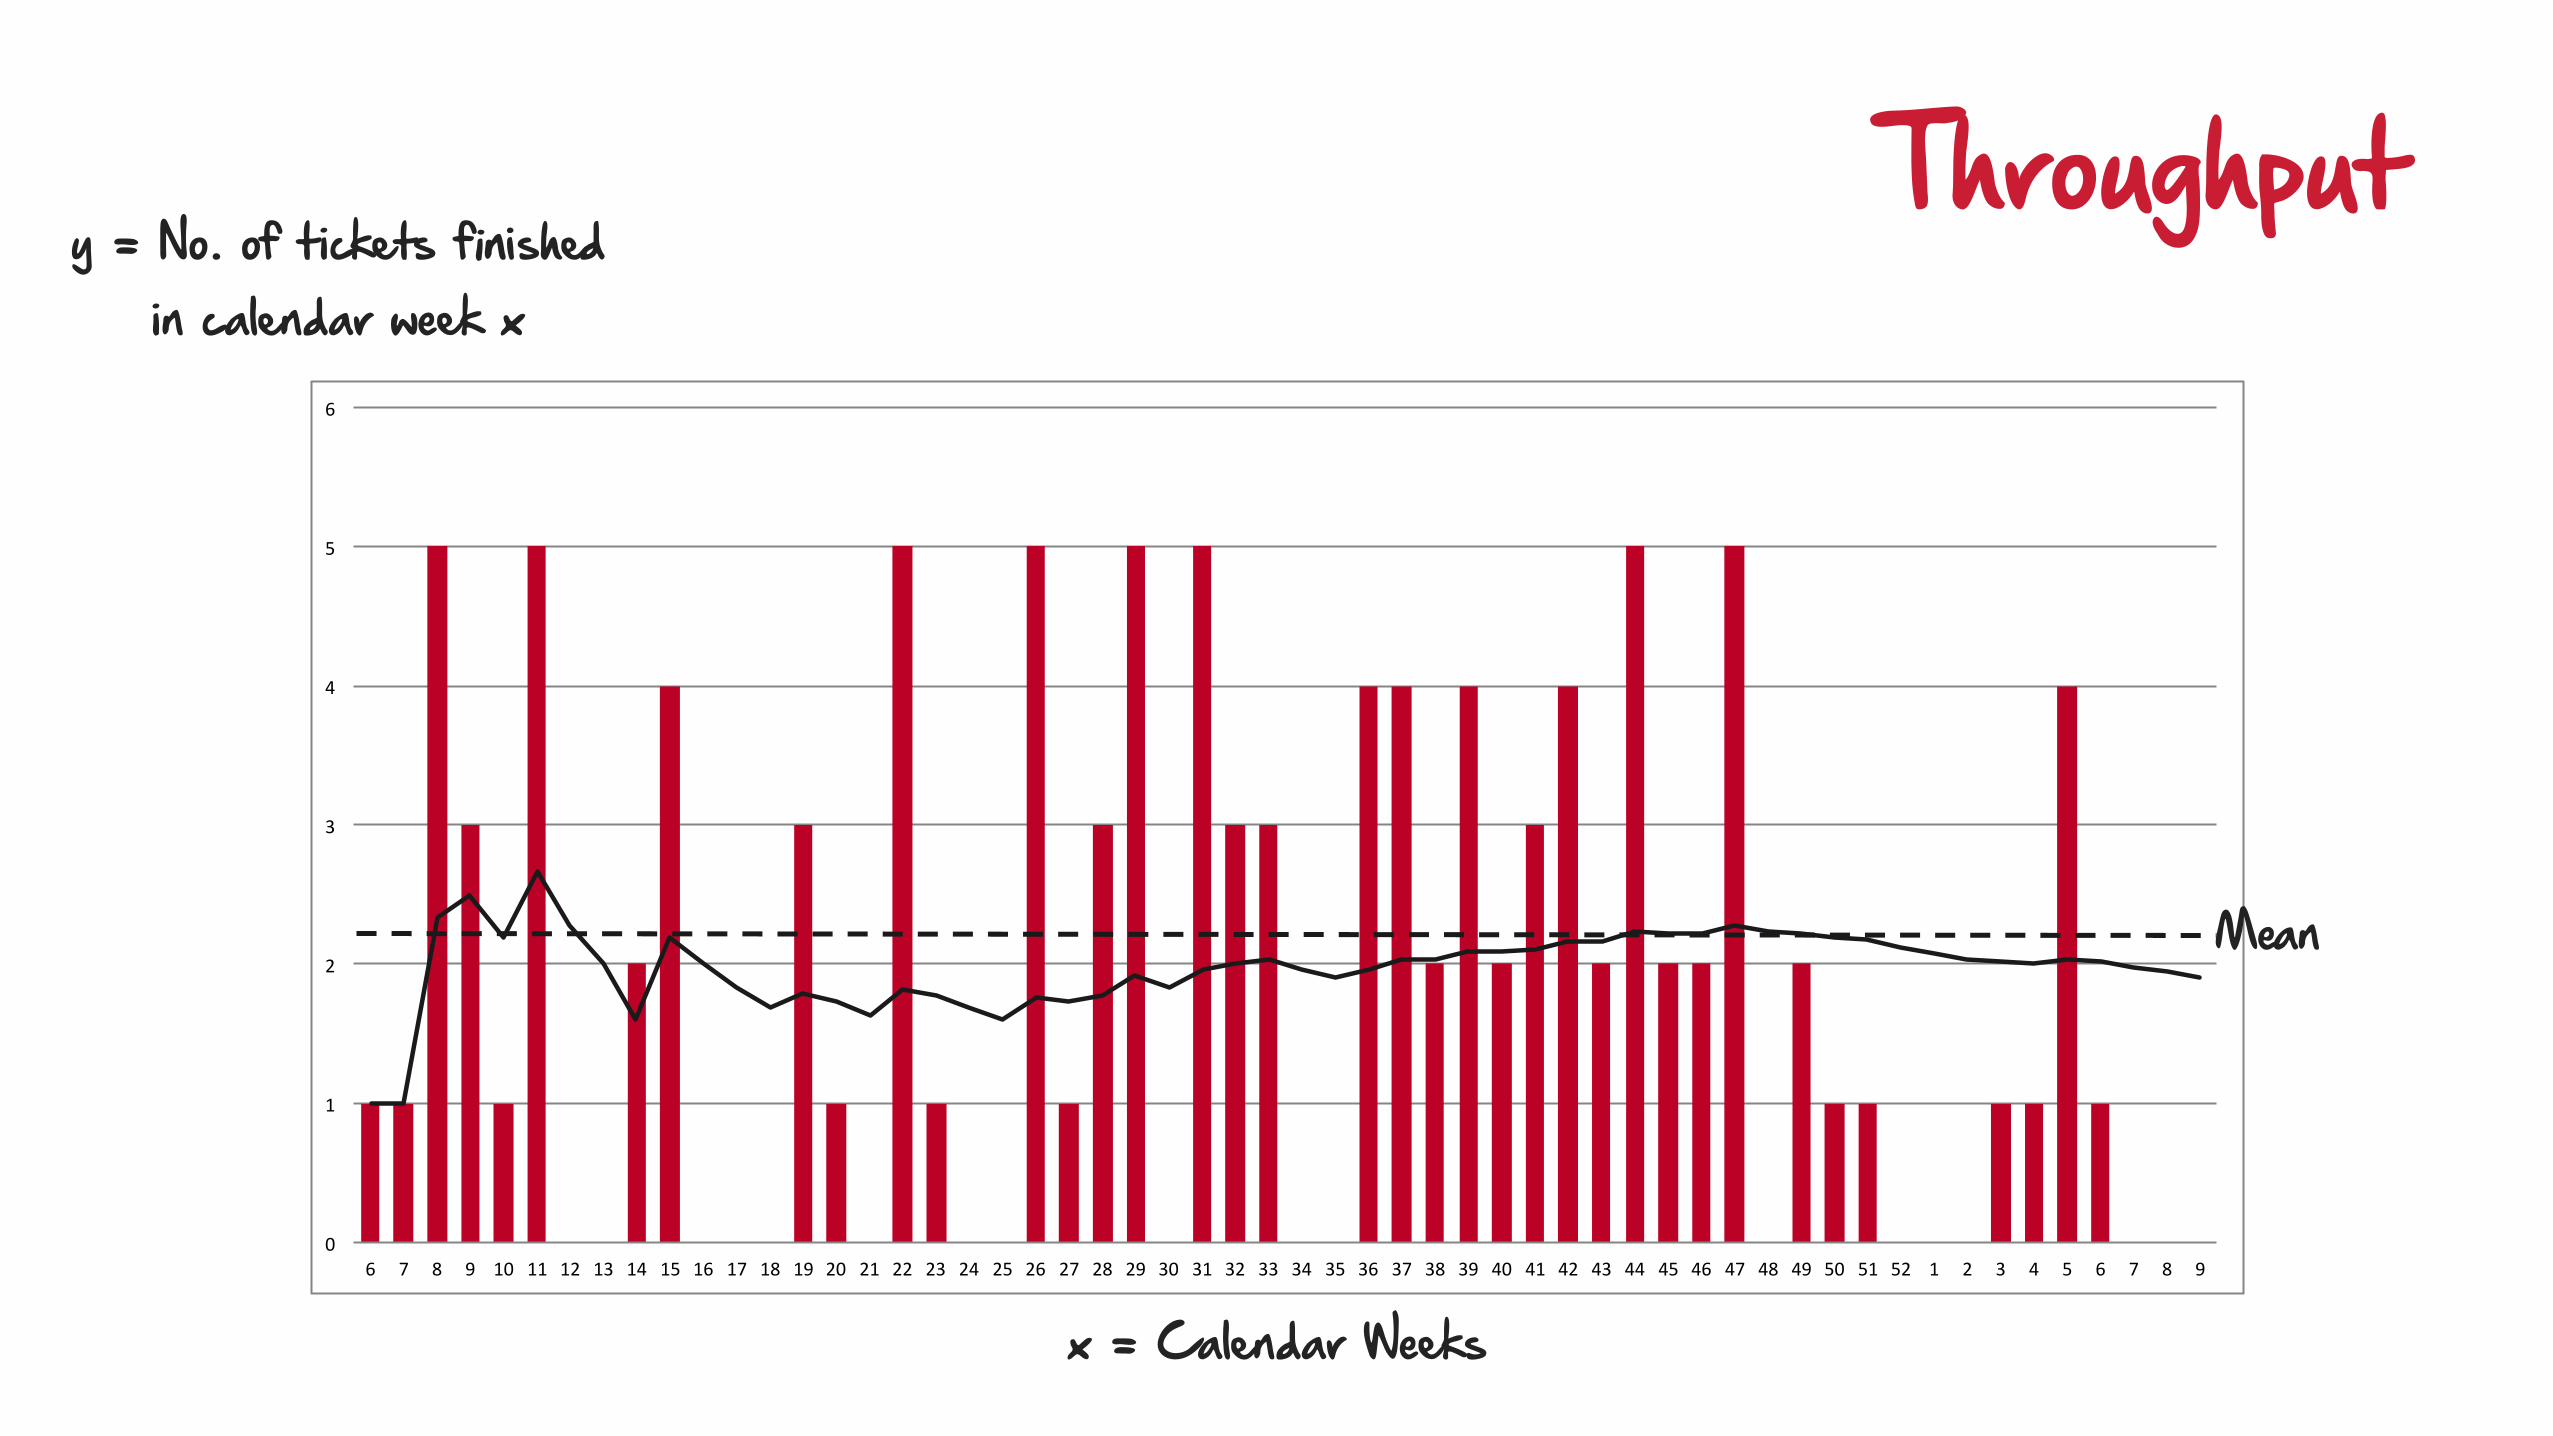
x = Calendar Weeks
y = No. of tickets finished in calendar week x
Throughput
Mean
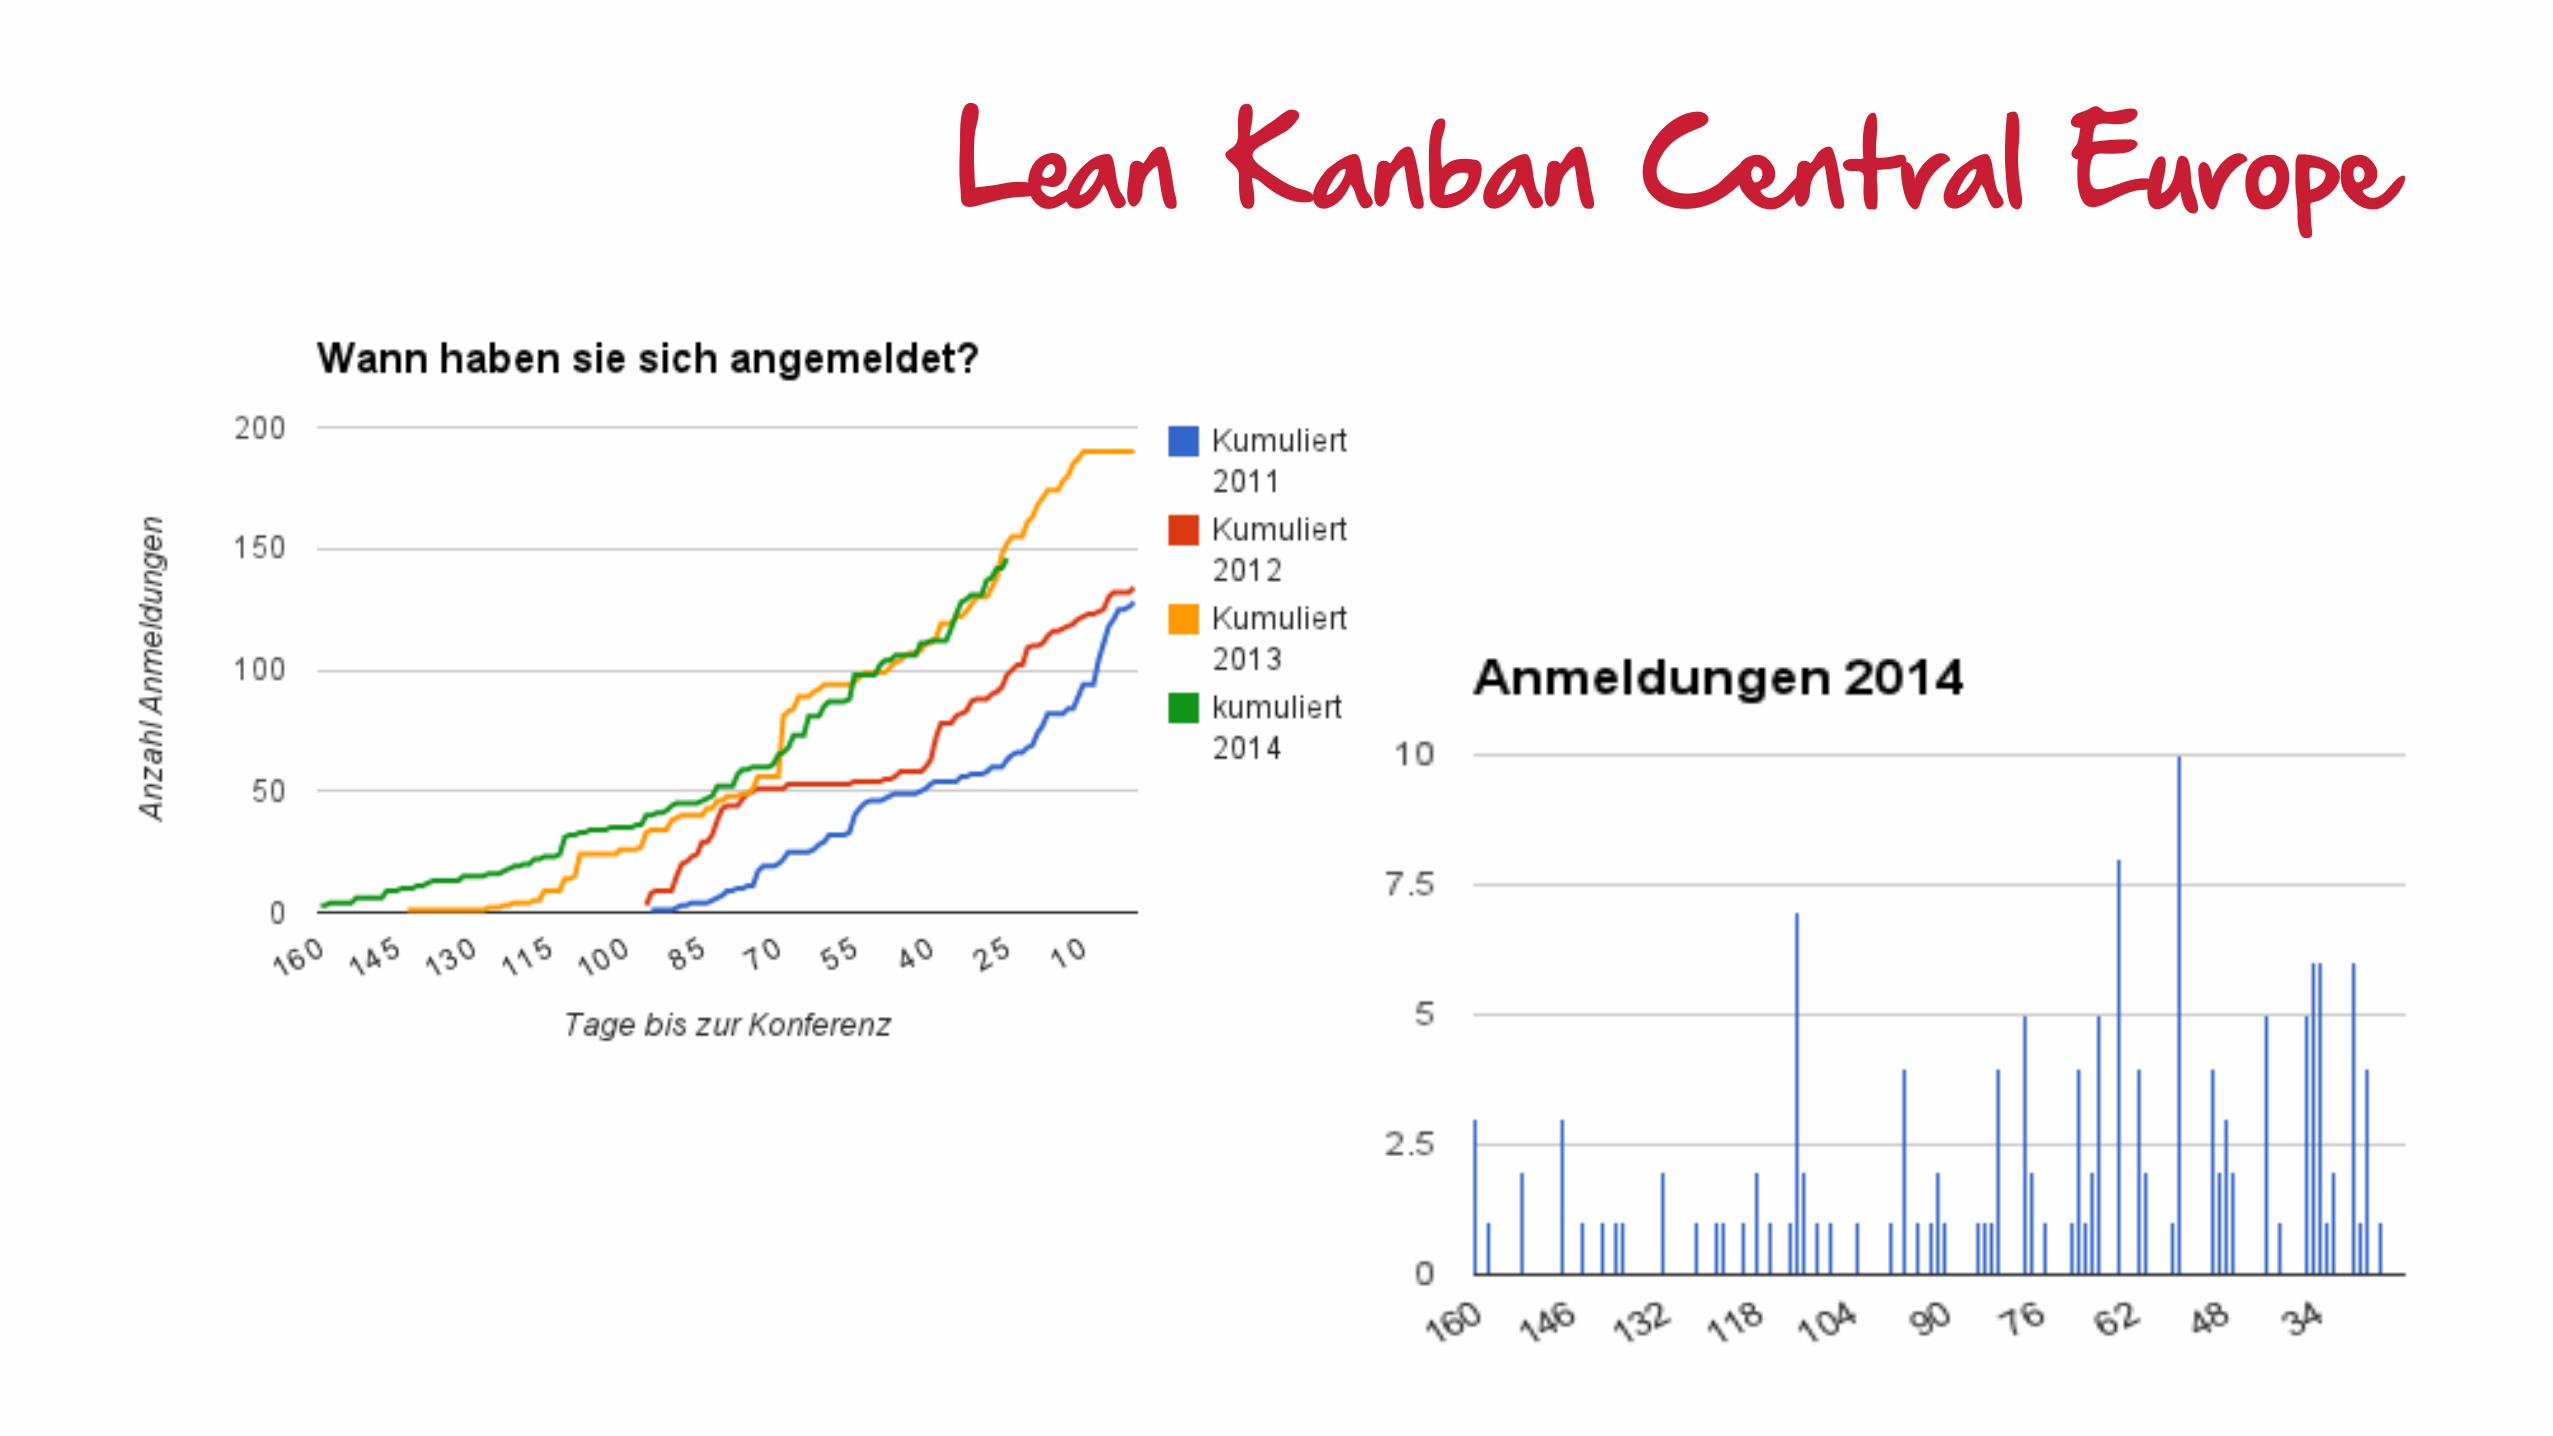
Lean Kanban Central Europe

Visualized metrics let you see things faster

Visualized metrics let you identify pattern
Visualized metrics give everyone the same picture and
raise awareness

Visualized metrics are great feedback loops

Manage Flow
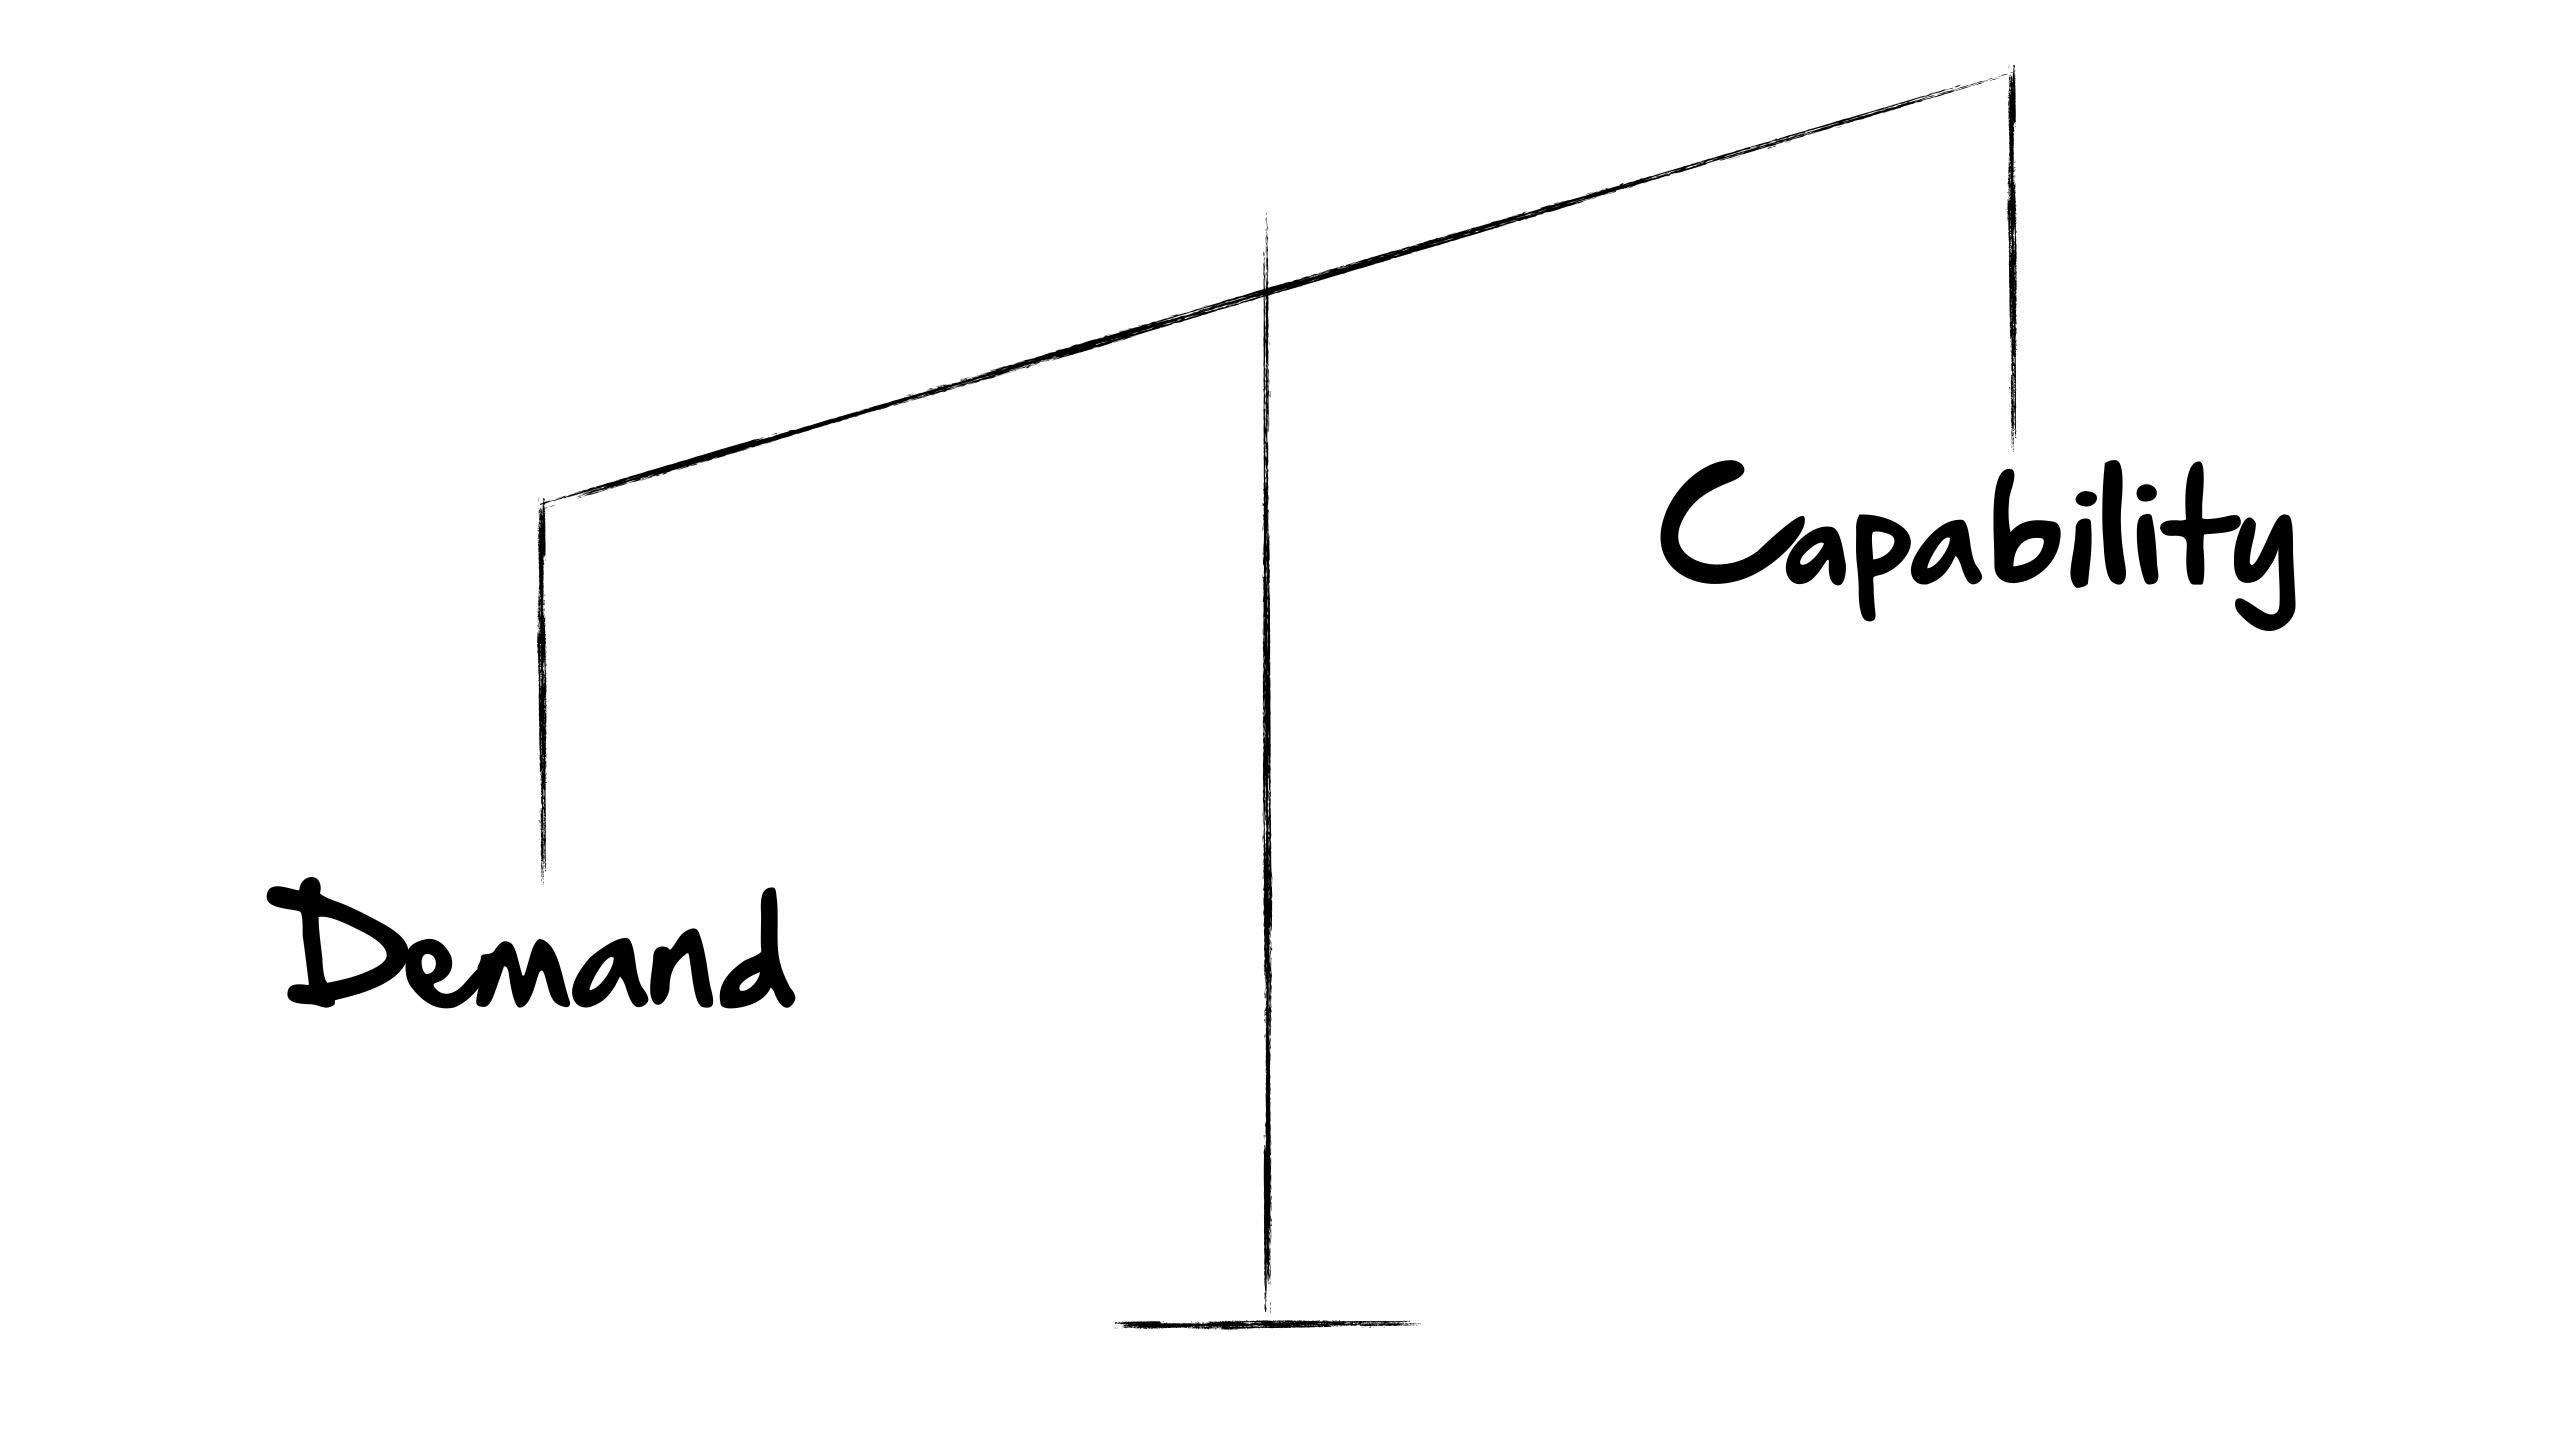
Demand
Capability
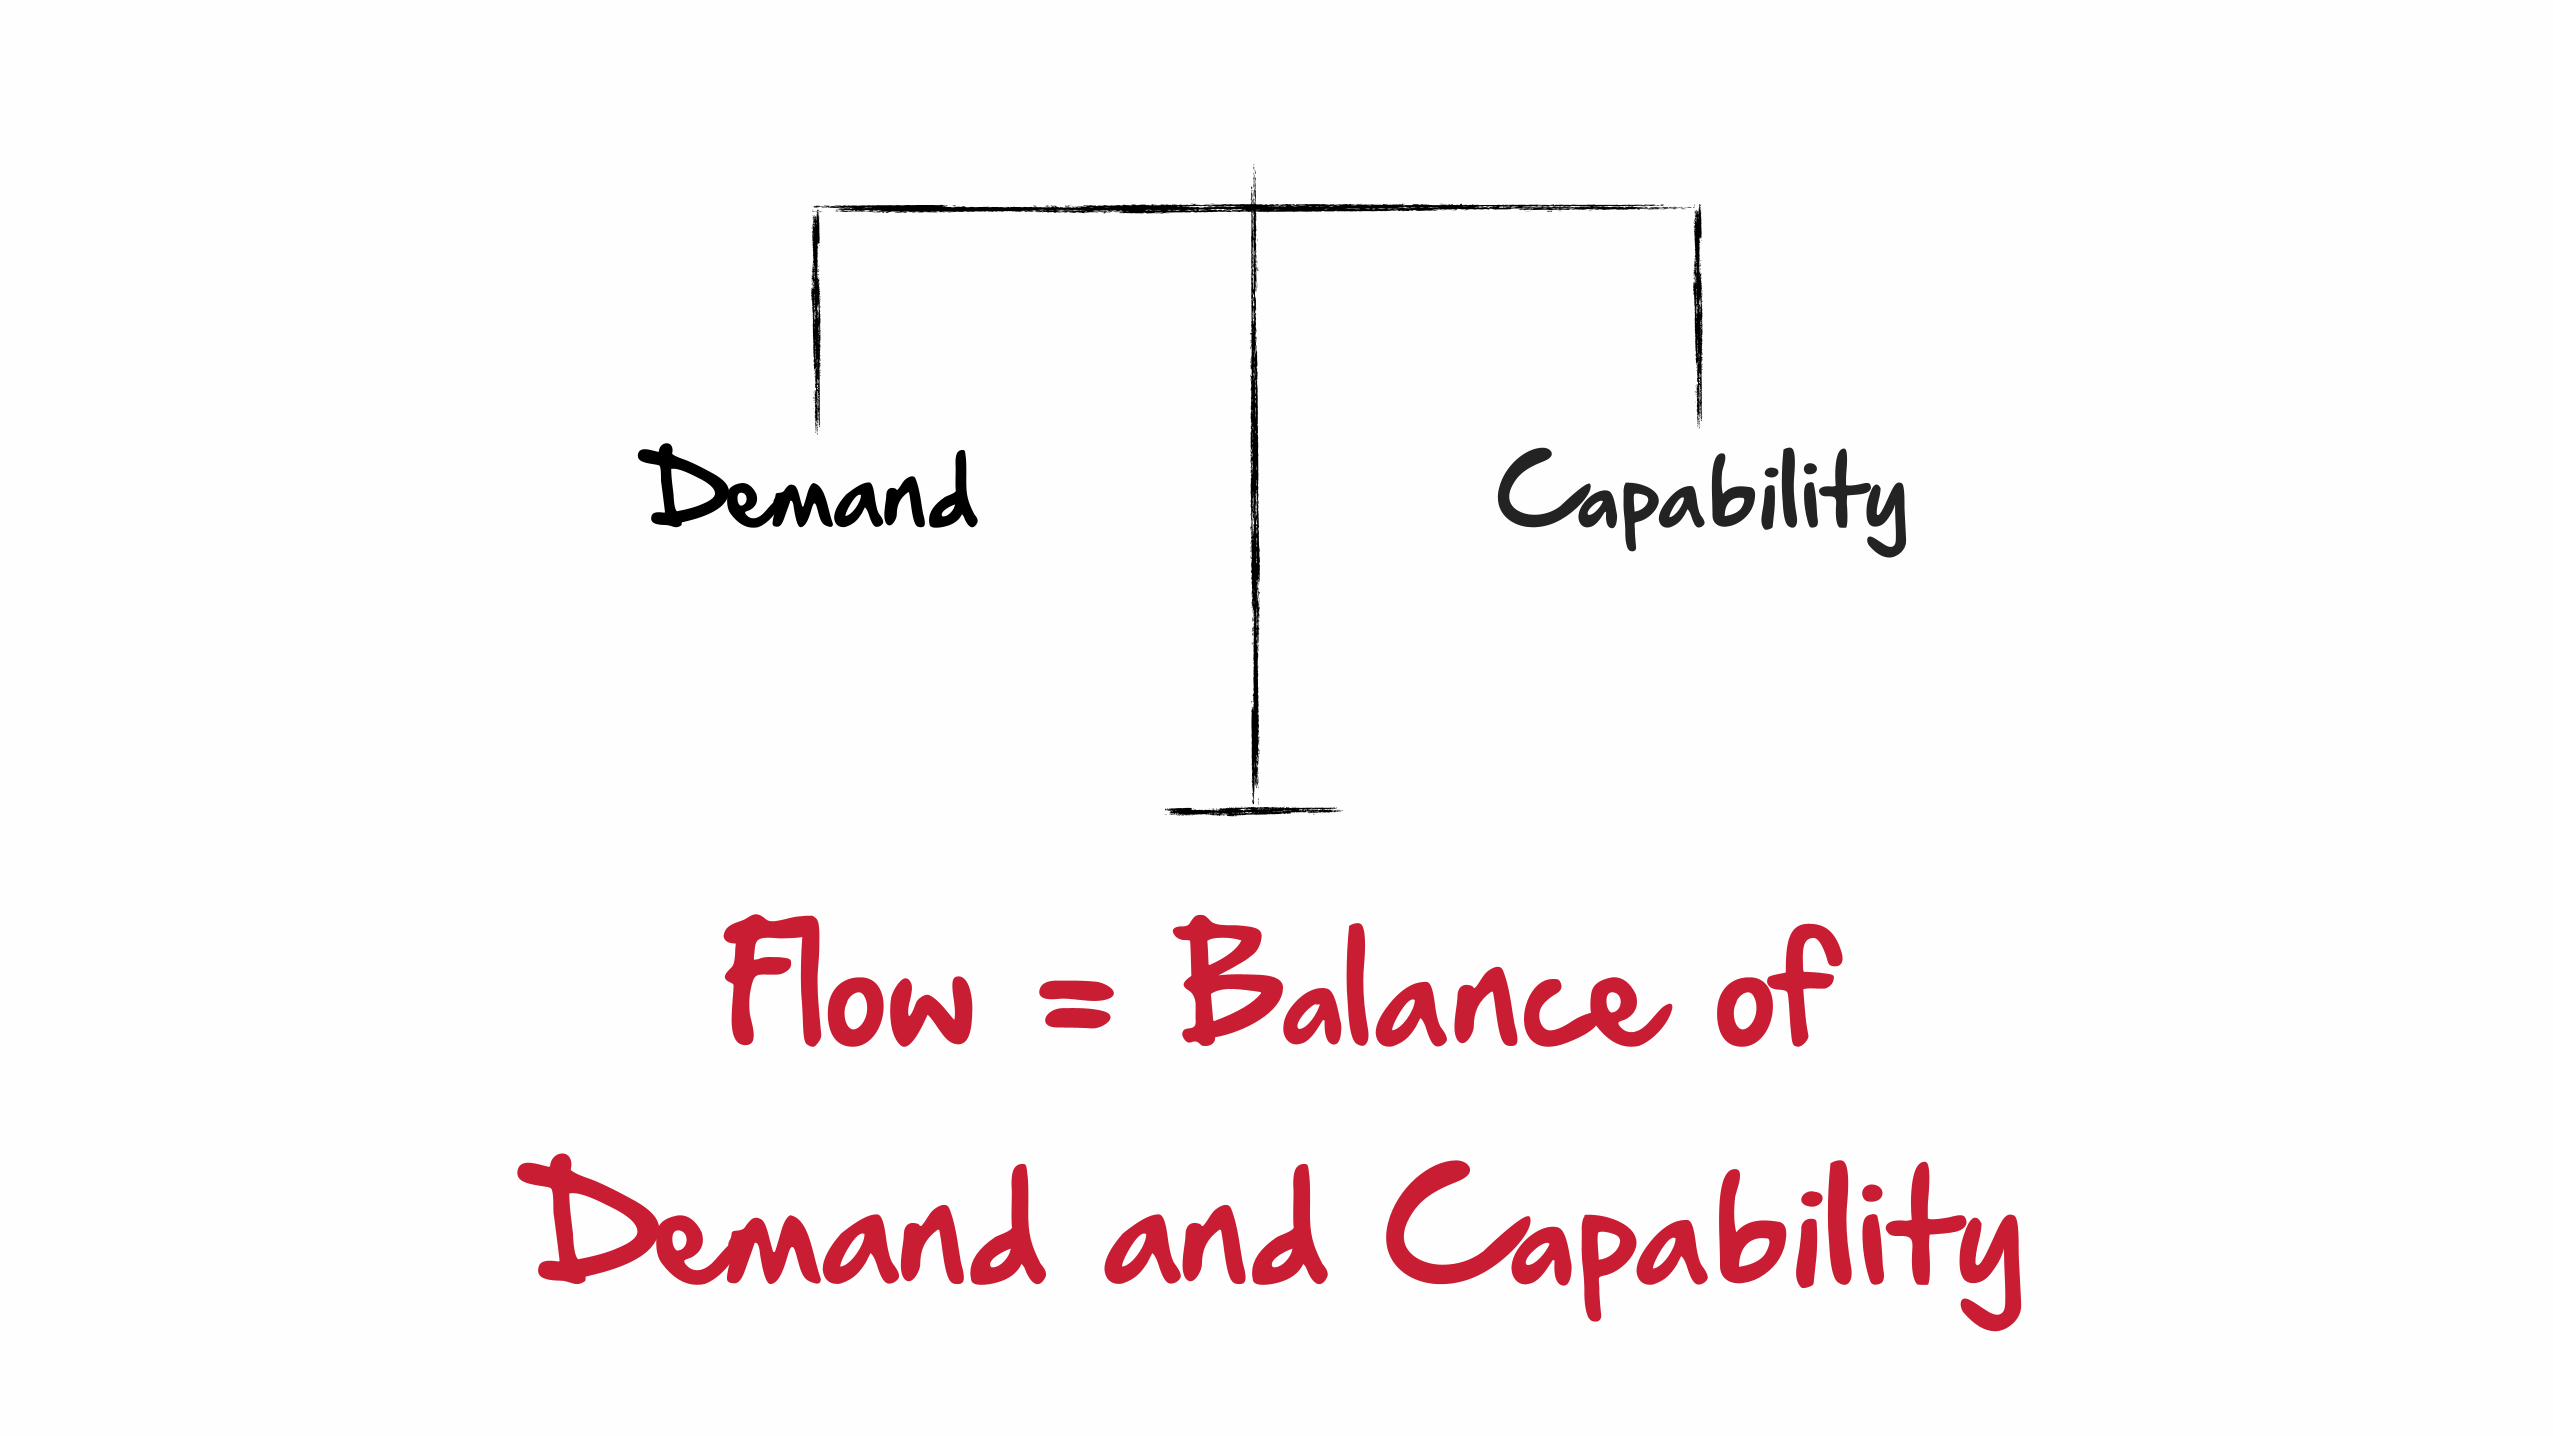
Demand Capability
Flow = Balance of Demand and Capability
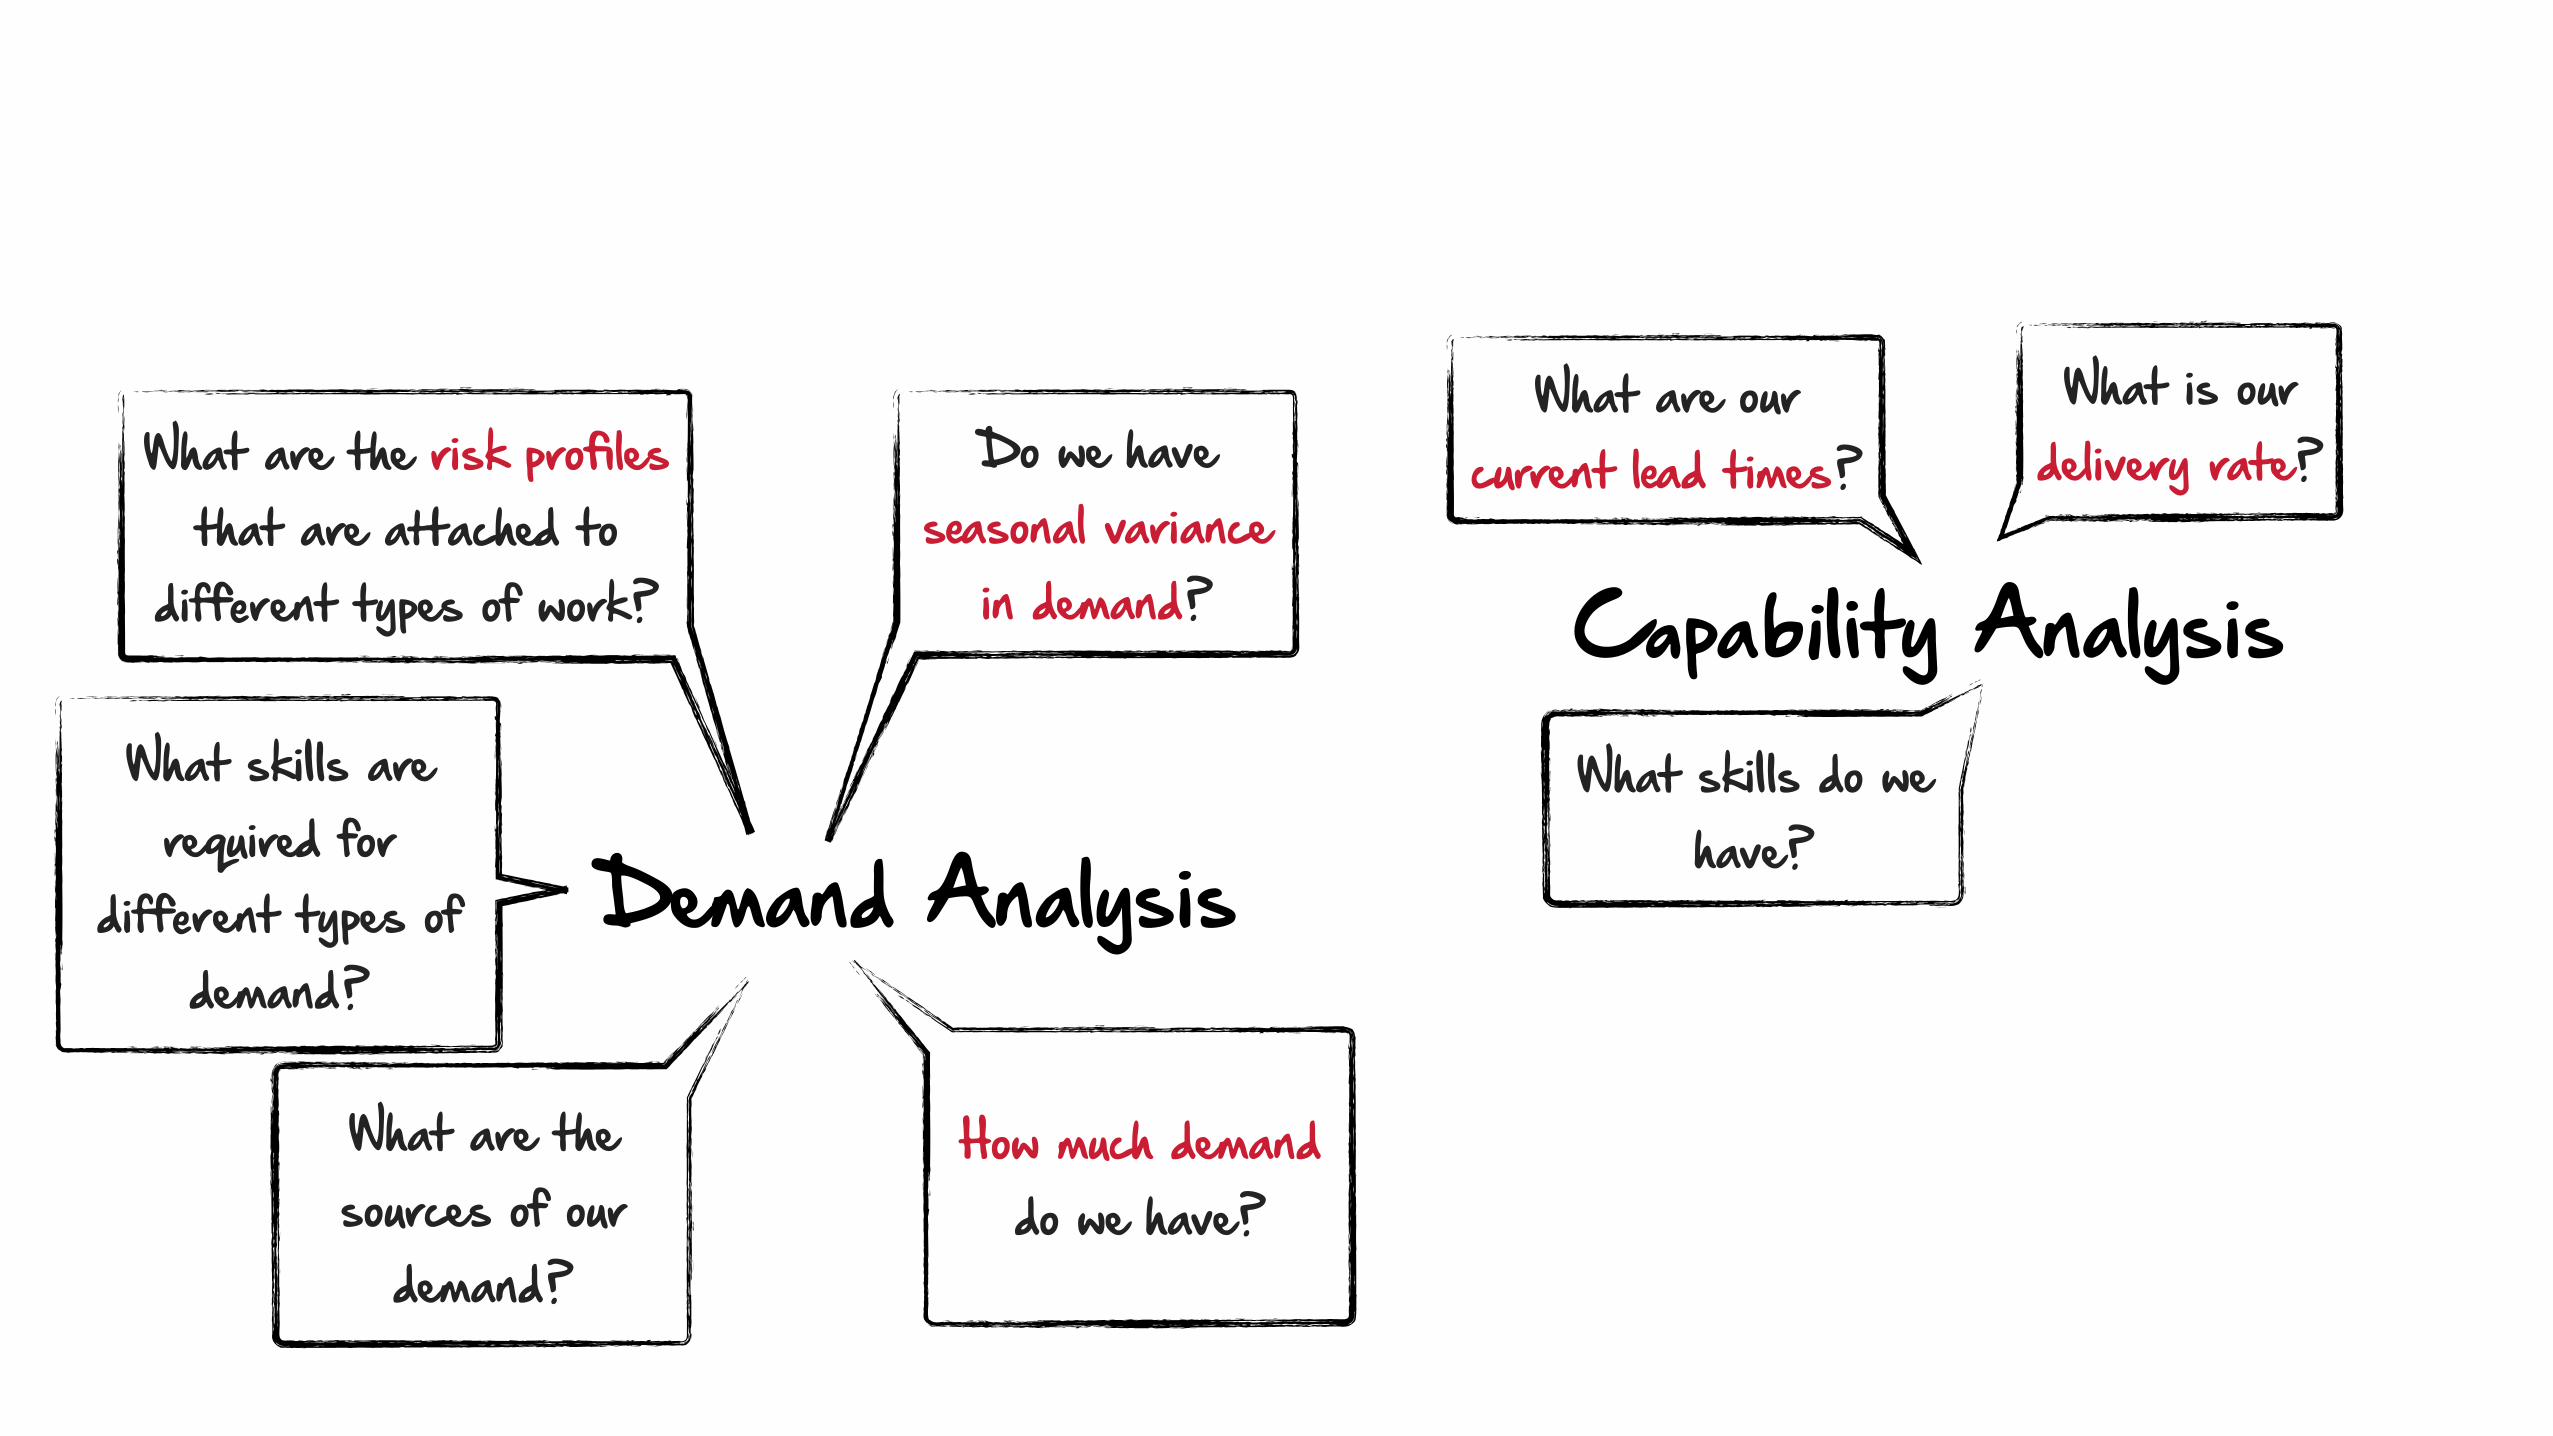
Capability Analysis
Demand Analysis
How much demand do we have?
What are the sources of our
demand?
Do we have seasonal variance
in demand?
What are the risk profiles that are attached to
different types of work?
What skills are required for
different types of demand?
What are our current lead times?
What is our delivery rate?
What skills do we have?
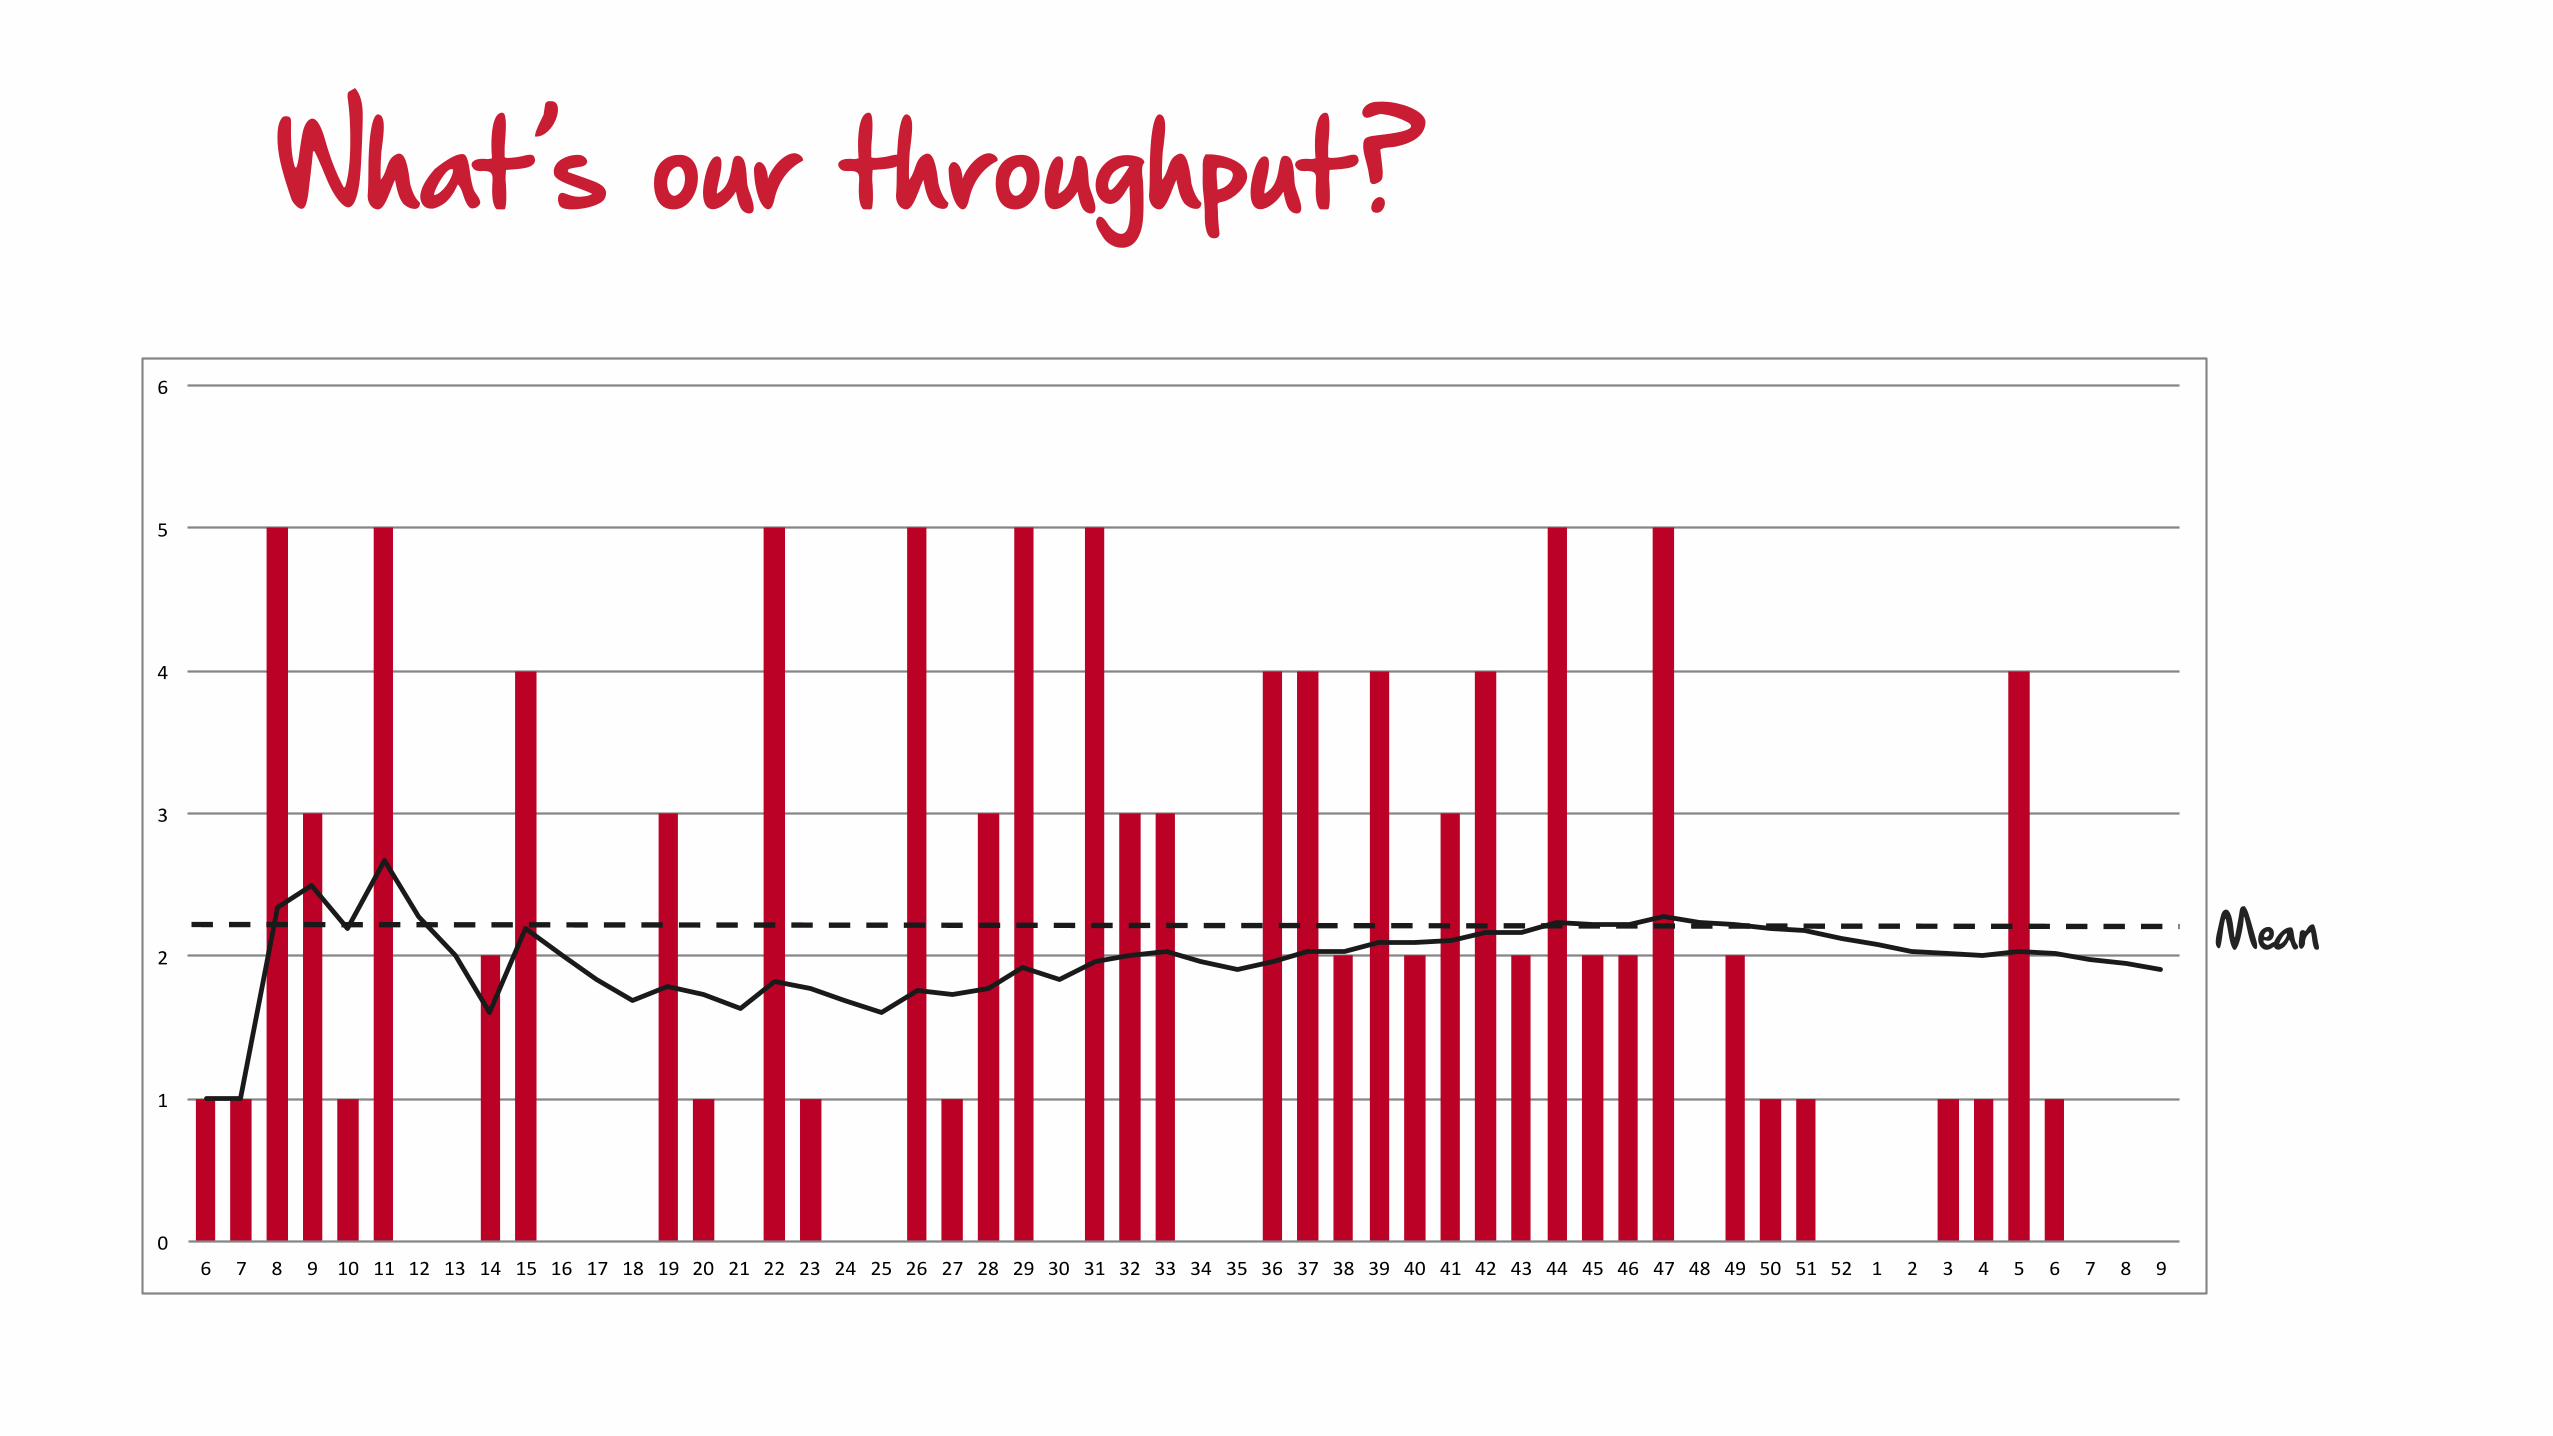
What’s our throughput?
Mean
0"
1"
2"
3"
4"
5"
6"
6" 7" 8" 9" 10" 11" 12" 13" 14" 15" 16" 17" 18" 19" 20" 21" 22" 23" 24" 25" 26" 27" 28" 29" 30" 31" 32" 33" 34" 35" 36" 37" 38" 39" 40" 41" 42" 43" 44" 45" 46" 47" 48" 49" 50" 51" 52" 1" 2" 3" 4" 5" 6" 7" 8" 9"
MEDIAN"
20#
25#
30#
35#
40#
45#
50#
55#
60#
65#
70#
75#
80#
85#
90#
95#
100#
105#
110#
115#
1#May#2012#
7#May#2012#
11#May#2012#
17#May#2012#
23#May#2012#
29#May#2012#
4#Jun#2012#
8#Jun#2012#
14#Jun#2012#
20#Jun#2012#
26#Jun#2012#
2#Jul#2012#
6#Jul#2012#
12#Jul#2012#
18#Jul#2012#
24#Jul#2012#
30#Jul#2012#
3#Aug#2012#
9#Aug#2012#
15#Aug#2012#
21#Aug#2012#
27#Aug#2012#
31#Aug#2012#
6#Sep#2012#
12#Sep#2012#
18#Sep#2012#
24#Sep#2012#
28#Sep#2012#
4#Oct#2012#
10#Oct#2012#
16#Oct#2012#
22#Oct#2012#
26#Oct#2012#
1#Nov#2012#
7#Nov#2012#
13#Nov#2012#
19#Nov#2012#
23#Nov#2012#
29#Nov#2012#
5#Dec#2012#
11#Dec#2012#
17#Dec#2012#
21#Dec#2012#
27#Dec#2012#
2#Jan#2013#
8#Jan#2013#
14#Jan#2013#
18#Jan#2013#
24#Jan#2013#
Analyse# Selected# Planning# Planning#Done# Dev# Dev#Done# TesDng# TesDng#Done/Endgame# to#be#released# Released#
The CFD also helps
Departure Rate
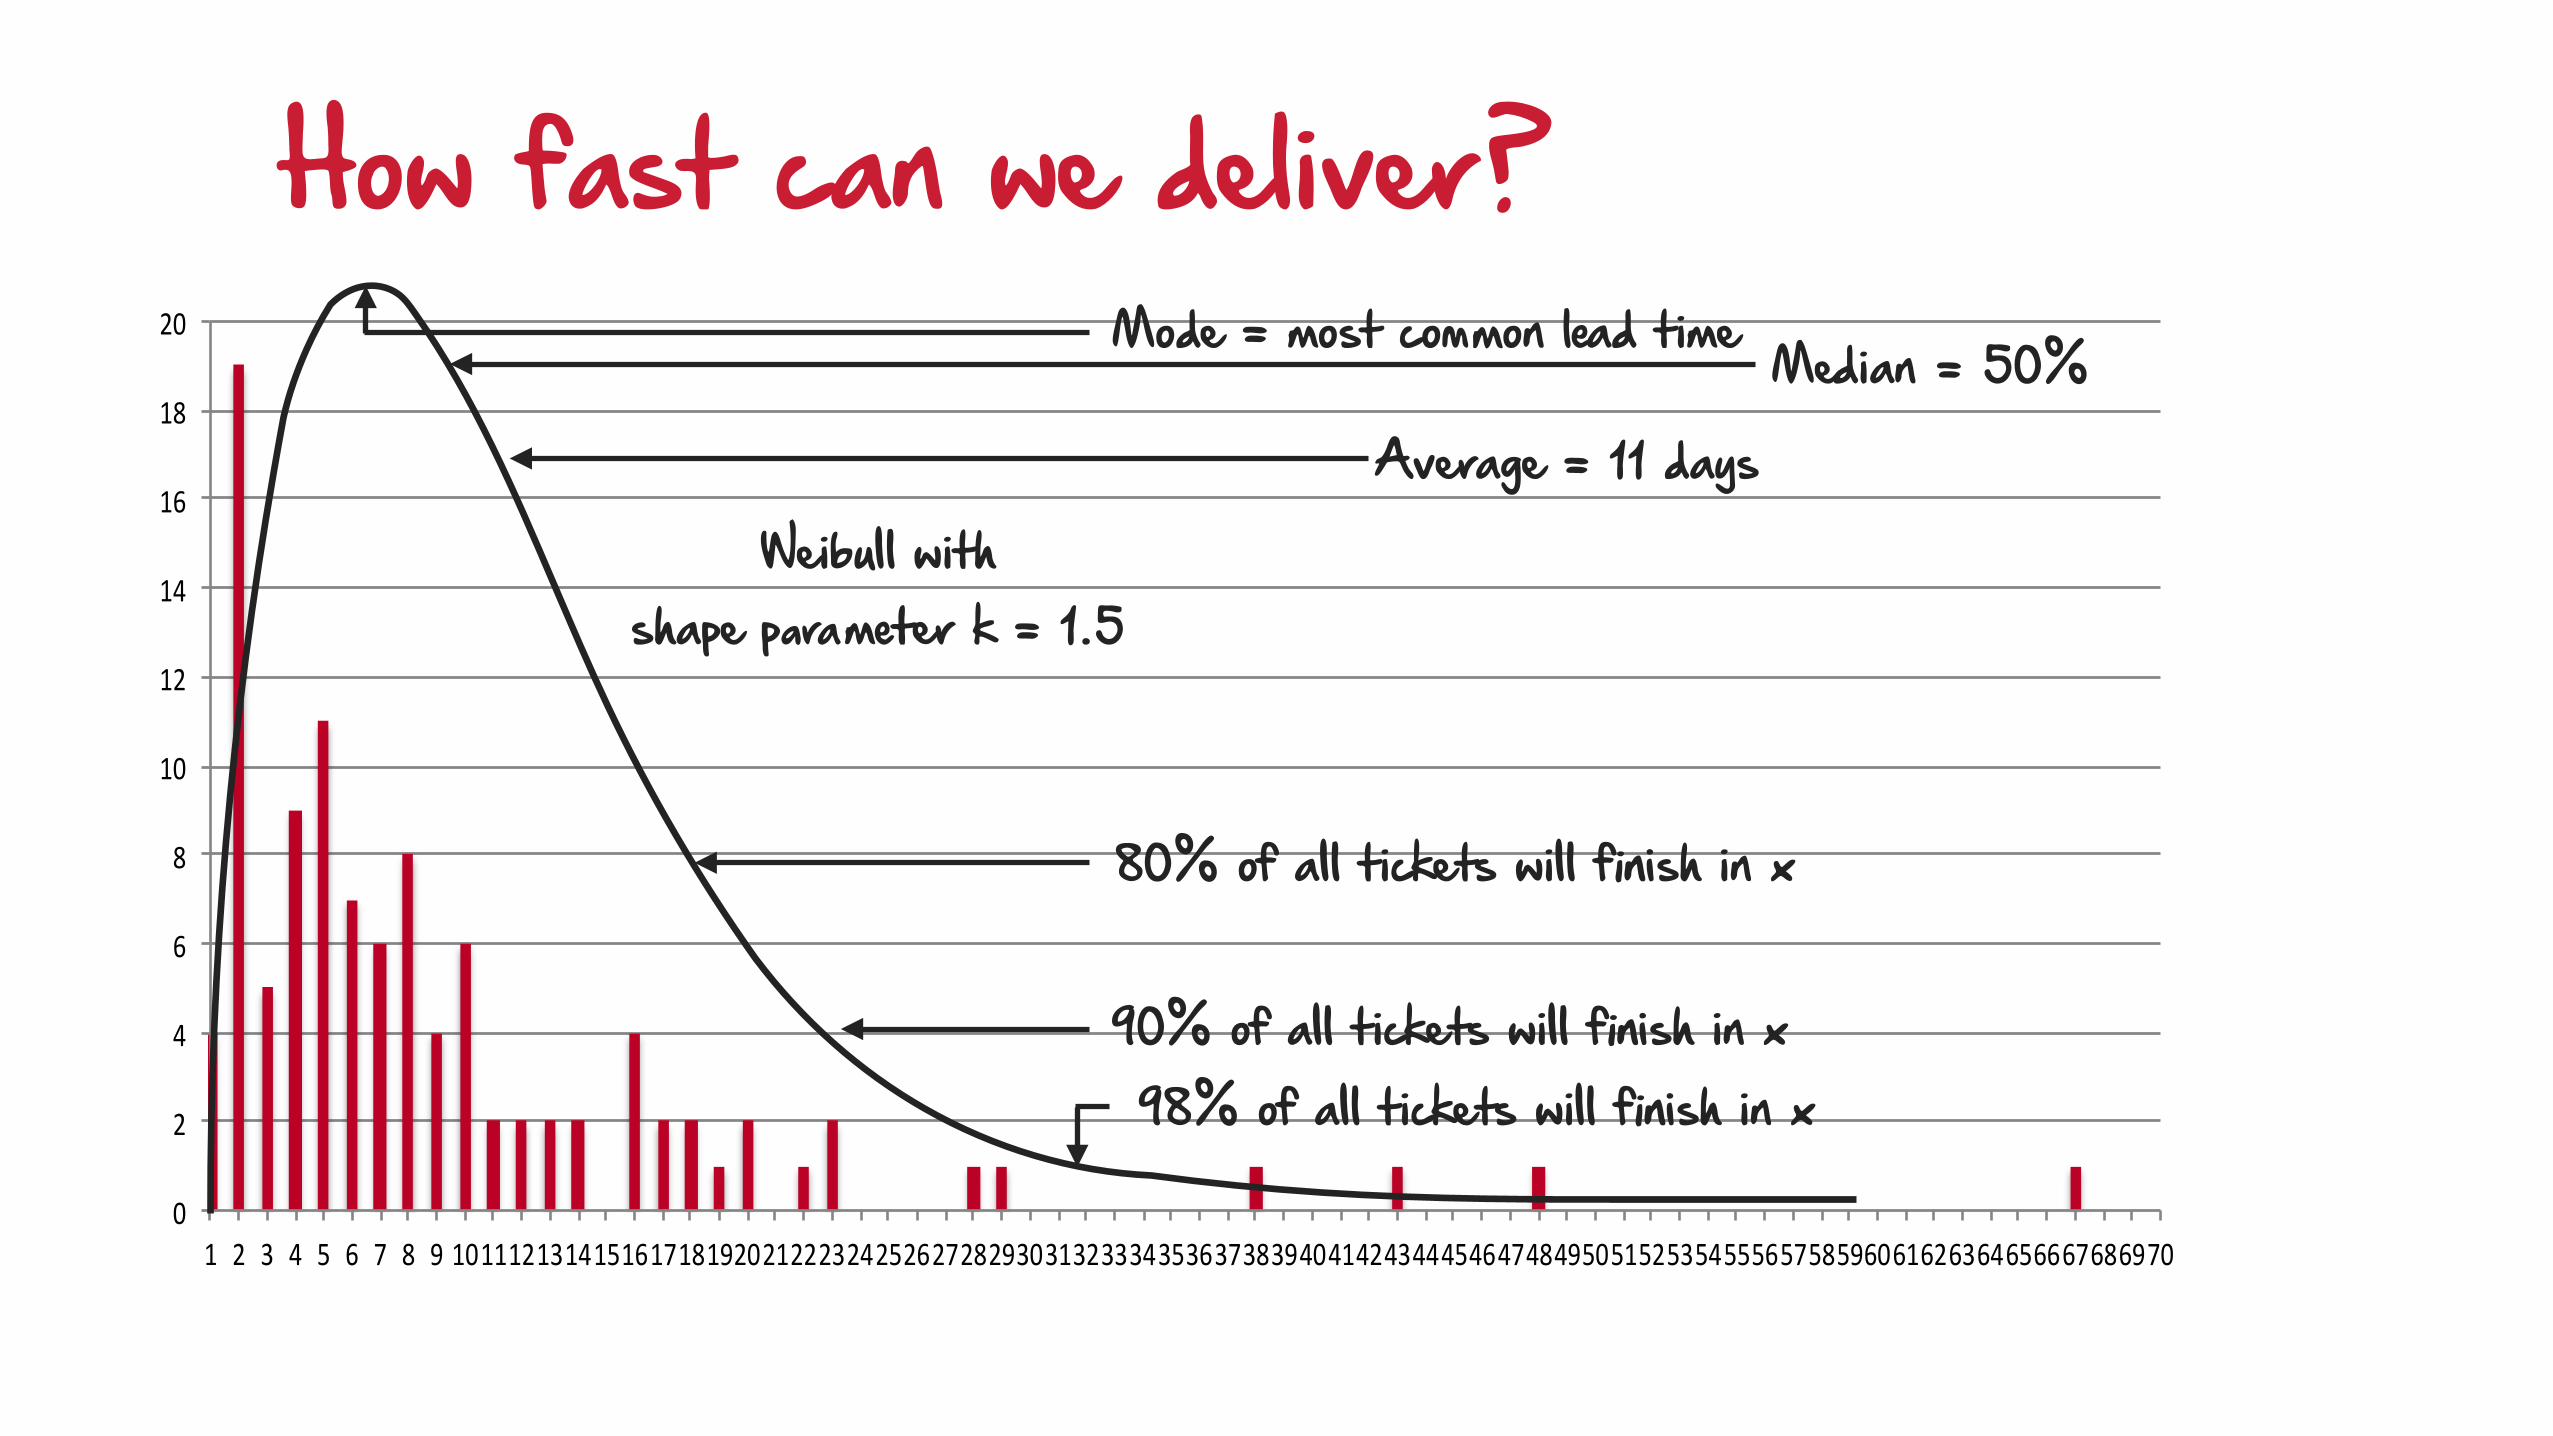
How fast can we deliver?
0"
2"
4"
6"
8"
10"
12"
14"
16"
18"
20"
1" 2" 3" 4" 5" 6" 7" 8" 9"10"11"12"13"14"15"16"17"18"19"20"21"22"23"24"25"26"27"28"29"30"31"32"33"34"35"36"37"38"39"40"41"42"43"44"45"46"47"48"49"50"51"52"53"54"55"56"57"58"59"60"61"62"63"64"65"66"67"68"69"70"
Mode = most common lead time Median = 50%
Average = 11 days
80% of all tickets will finish in x
90% of all tickets will finish in x98% of all tickets will finish in x
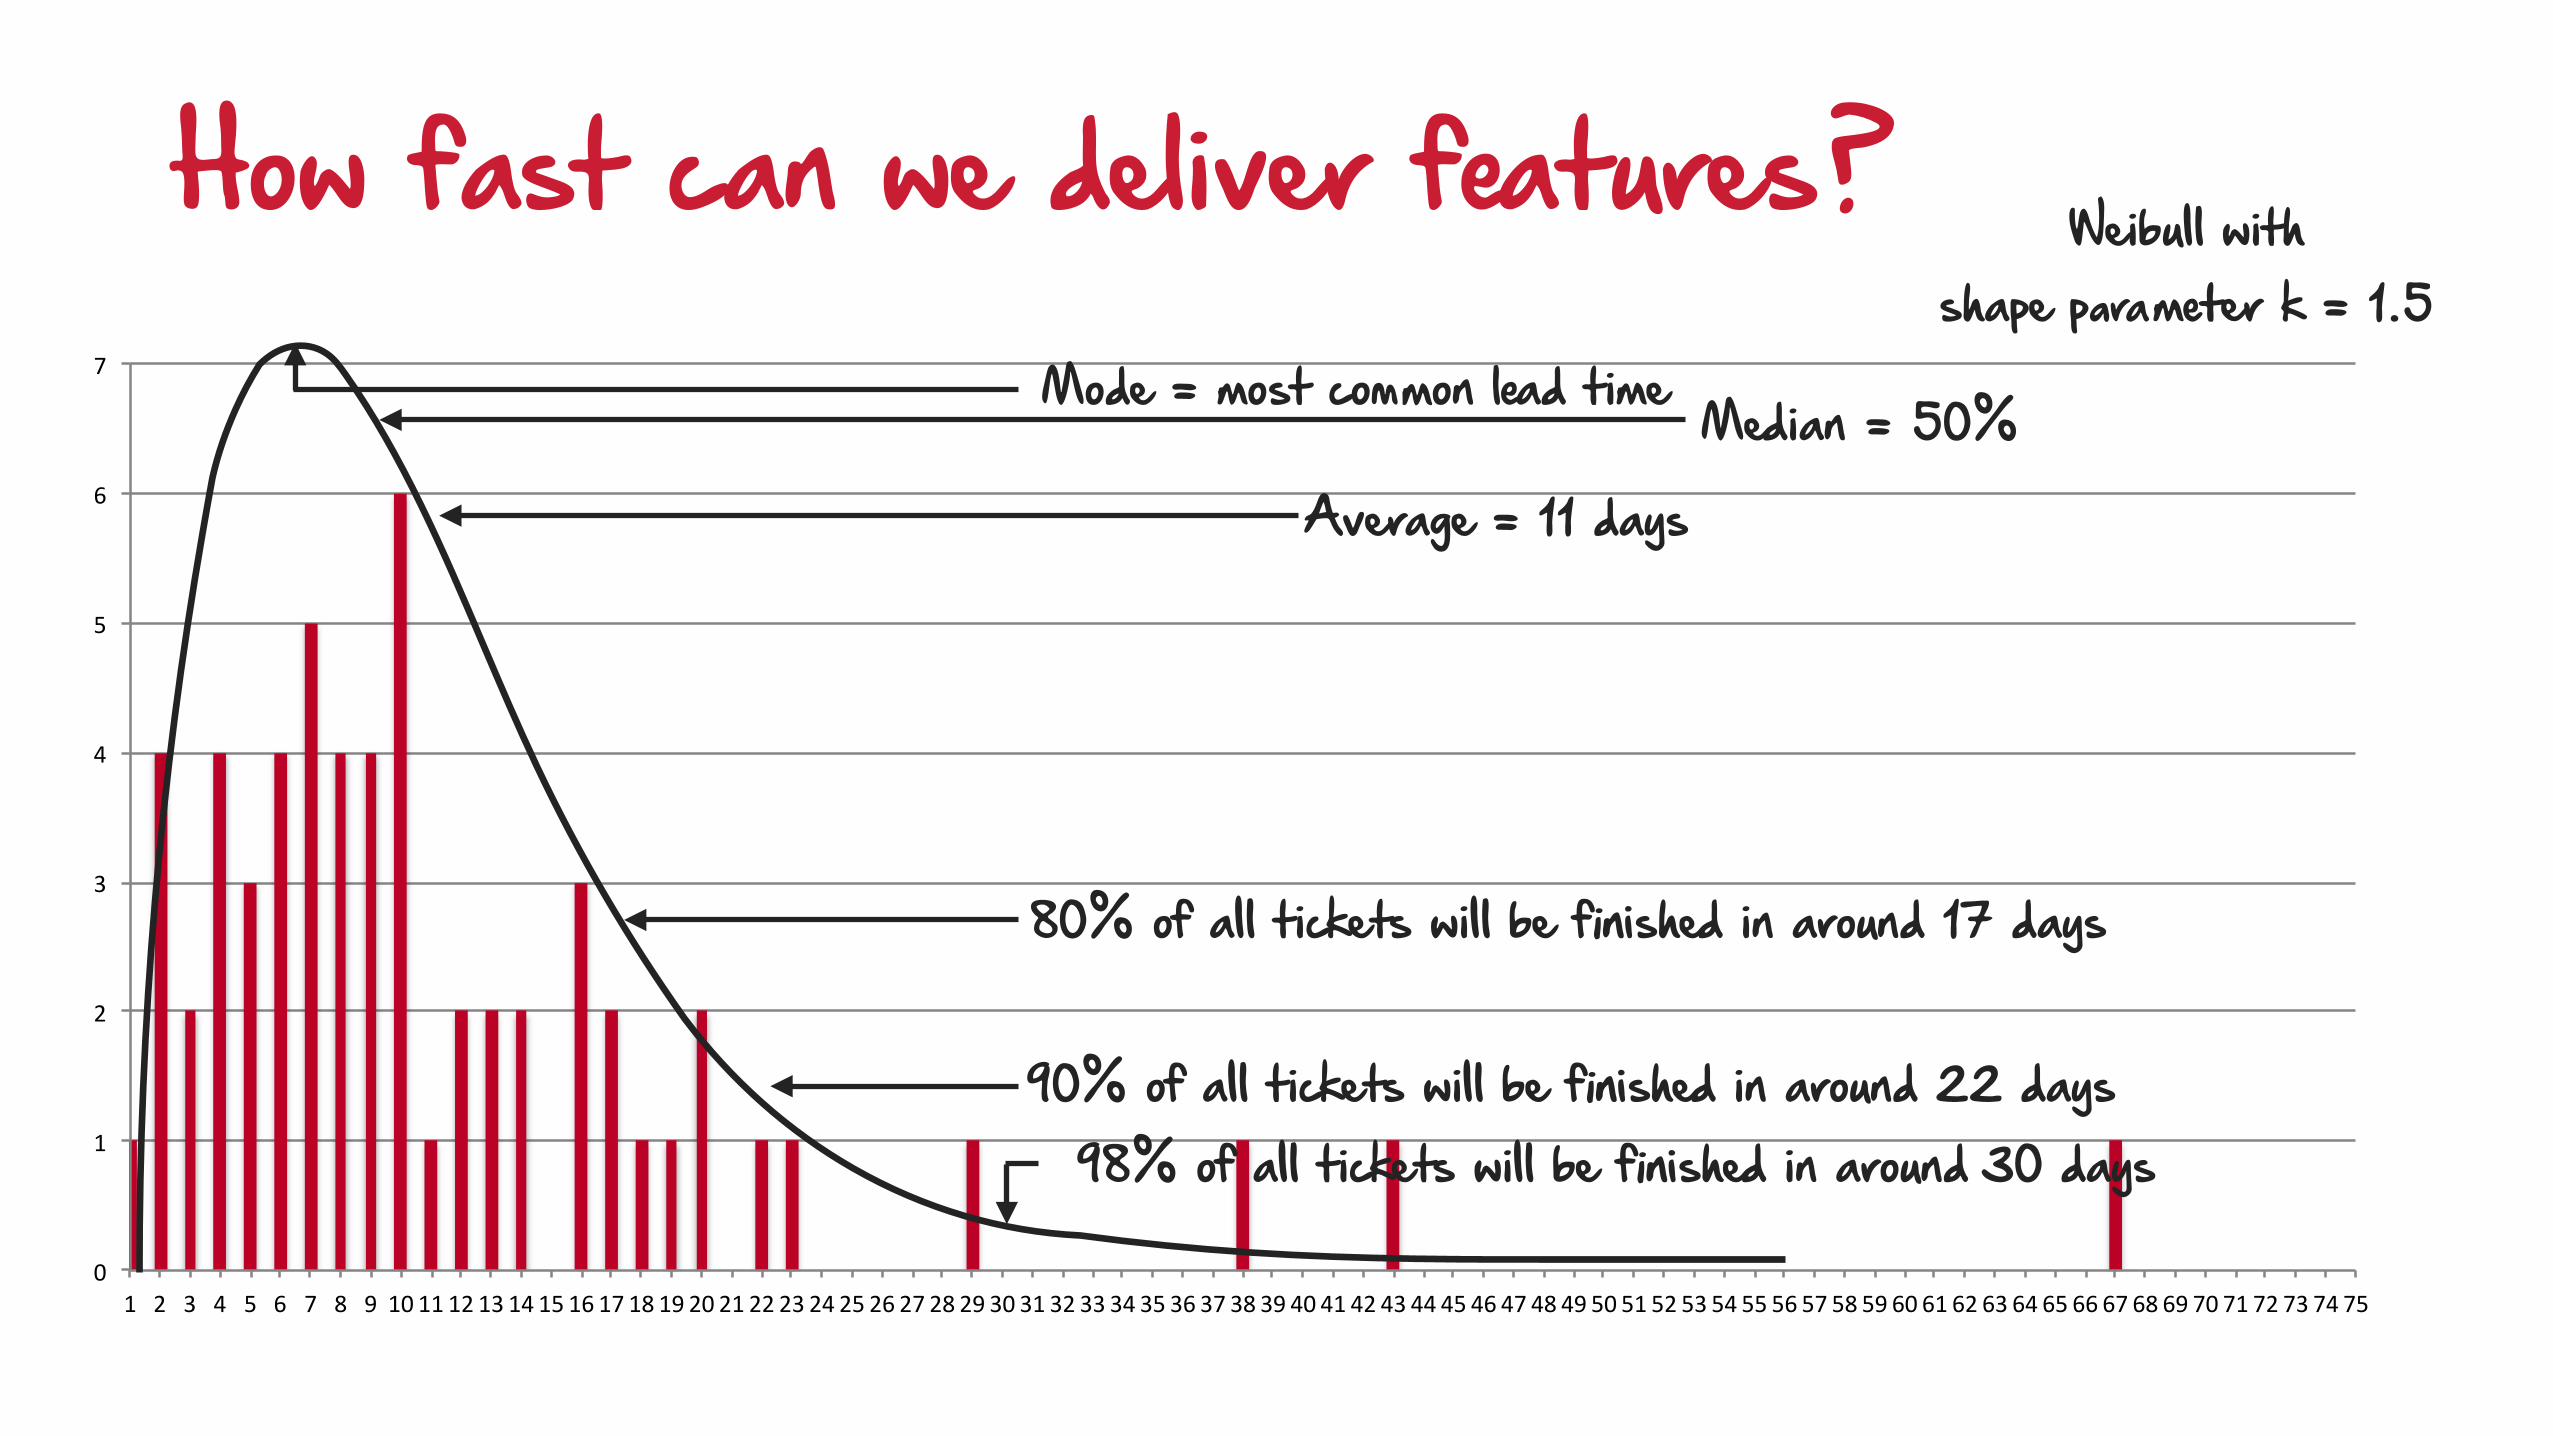
Weibull with shape parameter k = 1.5
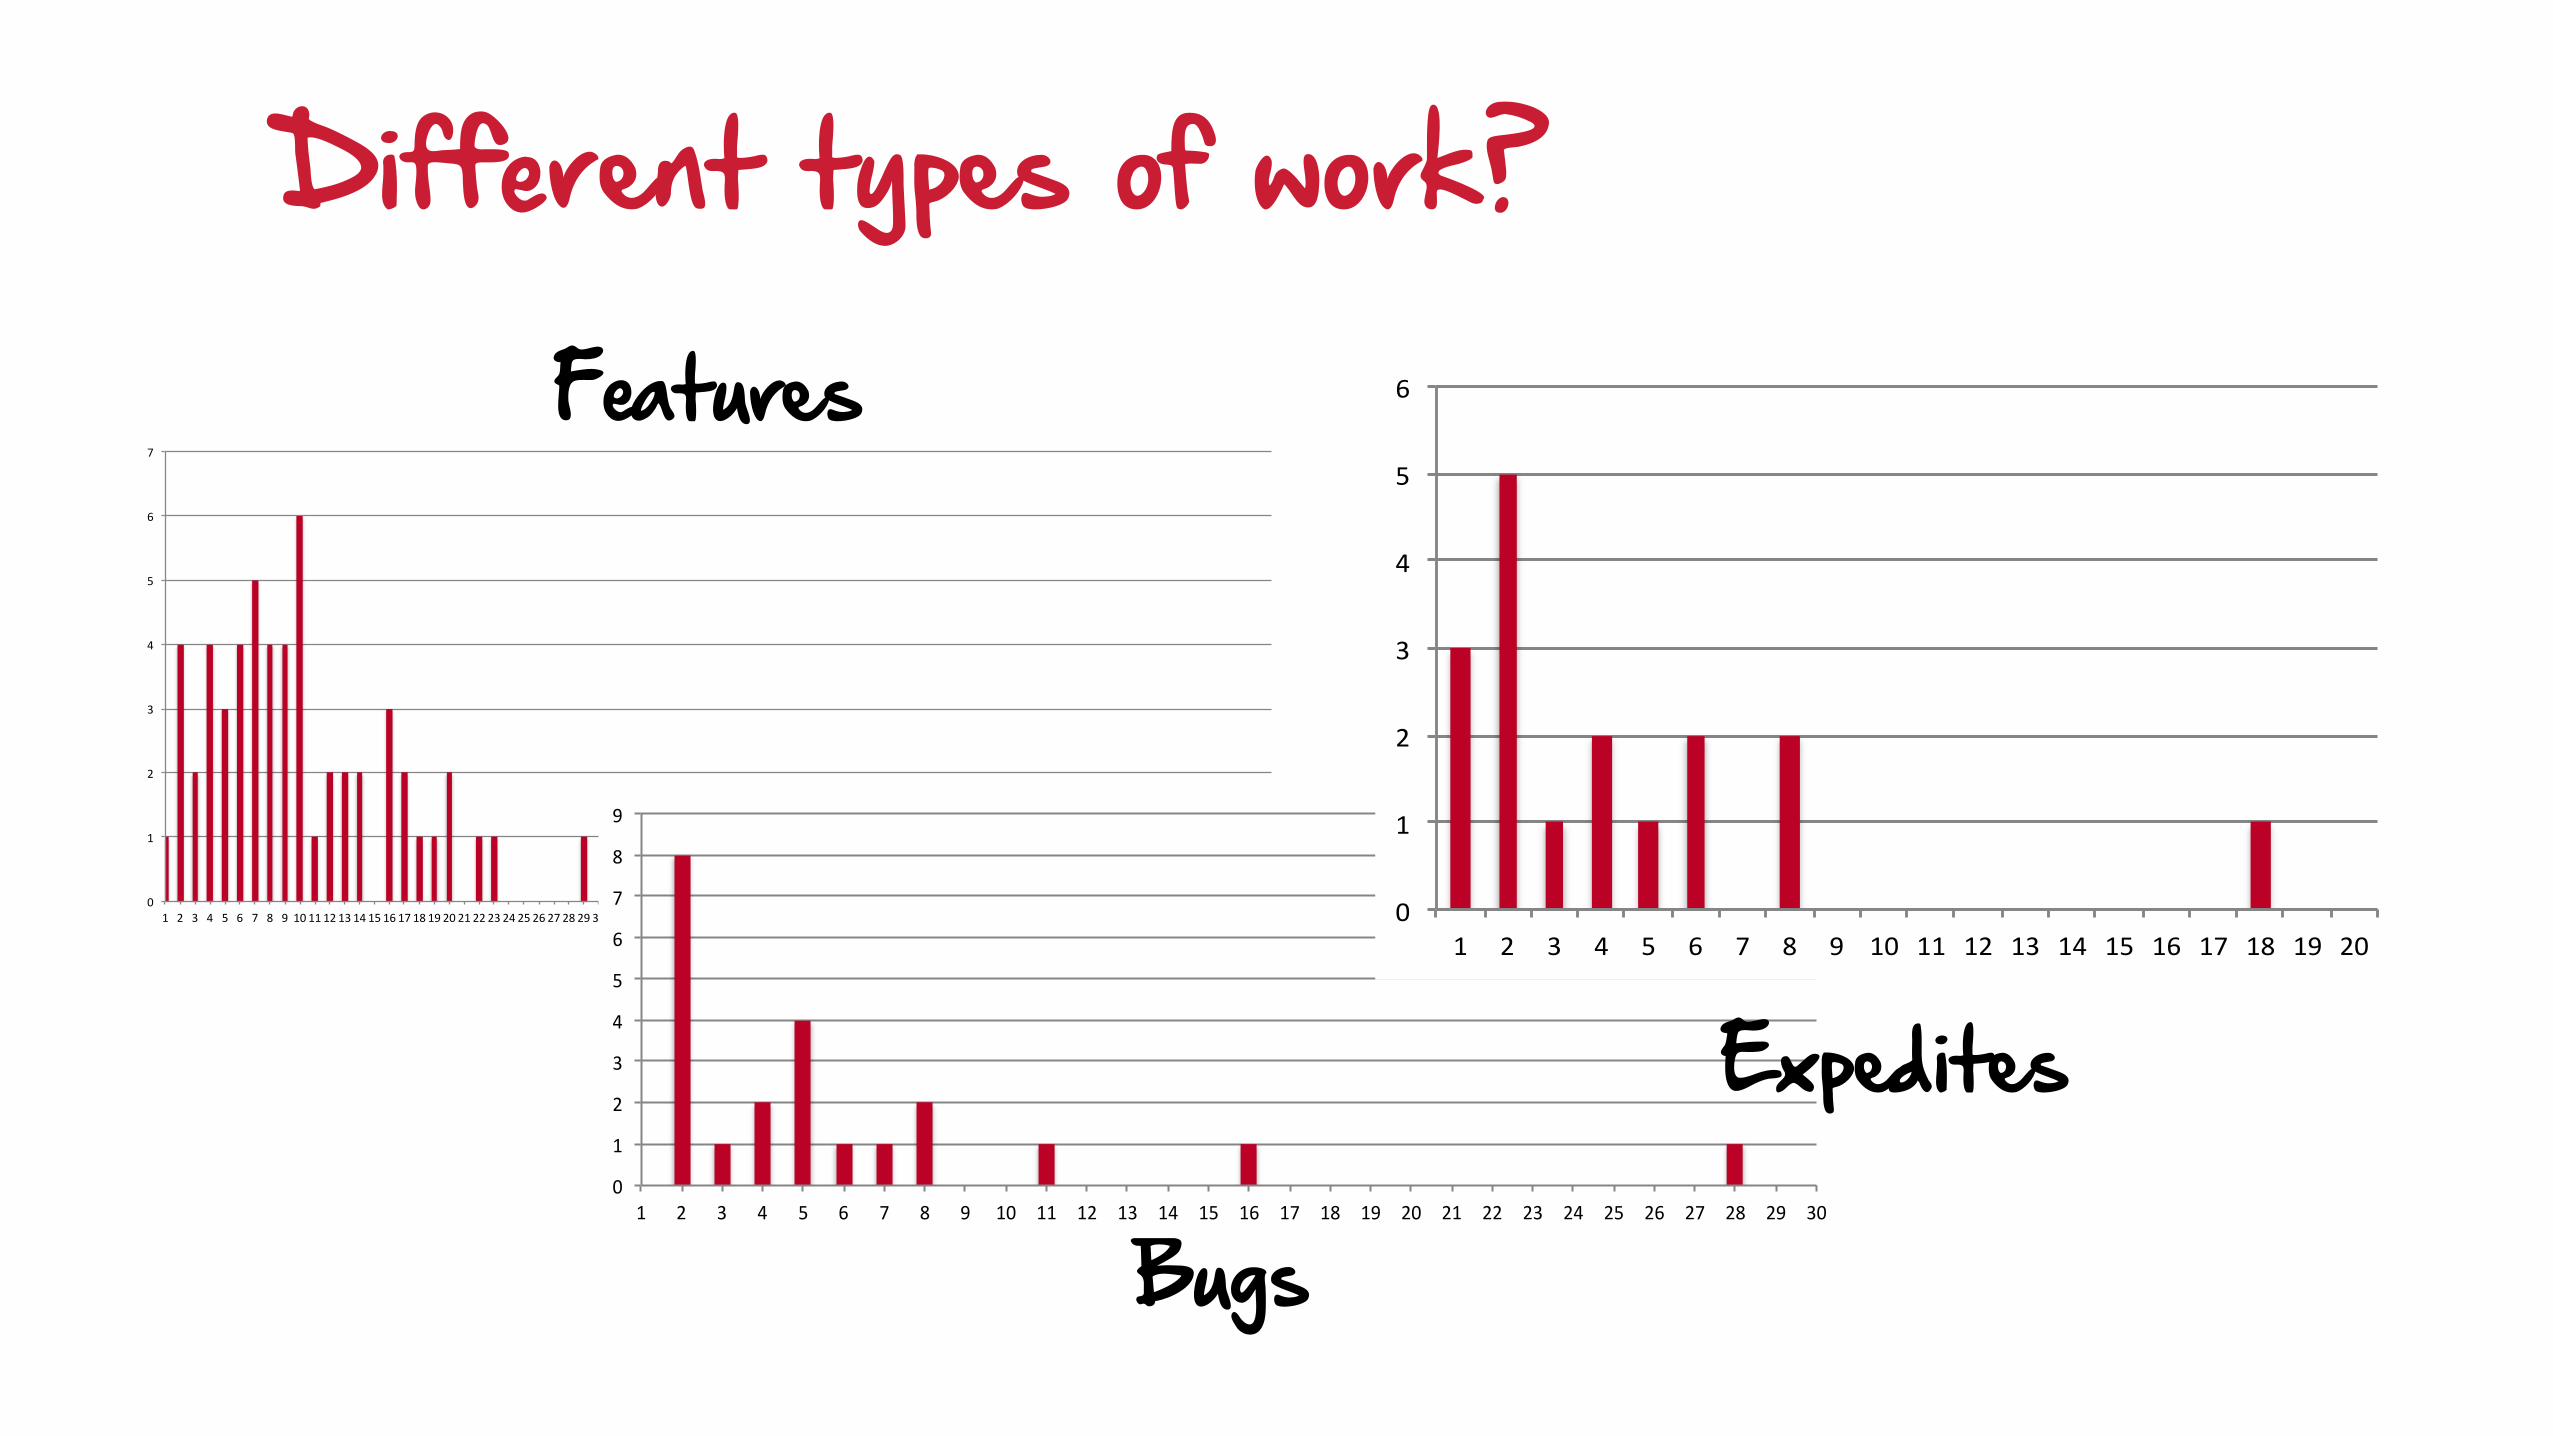
Features
0"
1"
2"
3"
4"
5"
6"
7"
1" 2" 3" 4" 5" 6" 7" 8" 9" 10"11"12"13"14"15"16"17"18"19"20"21"22"23"24"25"26"27"28"29"30"31"32"33"34"35"36"37"38"39"40"41"42"43"44"45"46"47"48"49"50"51"52"53"54"55"56"57"58"59"60"61"62"63"64"65"66"67"68"69"70"71"72"73"74"75"
Different types of work?
Bugs0"
1"
2"
3"
4"
5"
6"
7"
8"
9"
1" 2" 3" 4" 5" 6" 7" 8" 9" 10" 11" 12" 13" 14" 15" 16" 17" 18" 19" 20" 21" 22" 23" 24" 25" 26" 27" 28" 29" 30"
Expedites
0"
1"
2"
3"
4"
5"
6"
1" 2" 3" 4" 5" 6" 7" 8" 9" 10" 11" 12" 13" 14" 15" 16" 17" 18" 19" 20"
0"
1"
2"
3"
4"
5"
6"
7"
1" 2" 3" 4" 5" 6" 7" 8" 9" 10"11"12"13"14"15"16"17"18"19"20"21"22"23"24"25"26"27"28"29"30"31"32"33"34"35"36"37"38"39"40"41"42"43"44"45"46"47"48"49"50"51"52"53"54"55"56"57"58"59"60"61"62"63"64"65"66"67"68"69"70"71"72"73"74"75"
How fast can we deliver features?
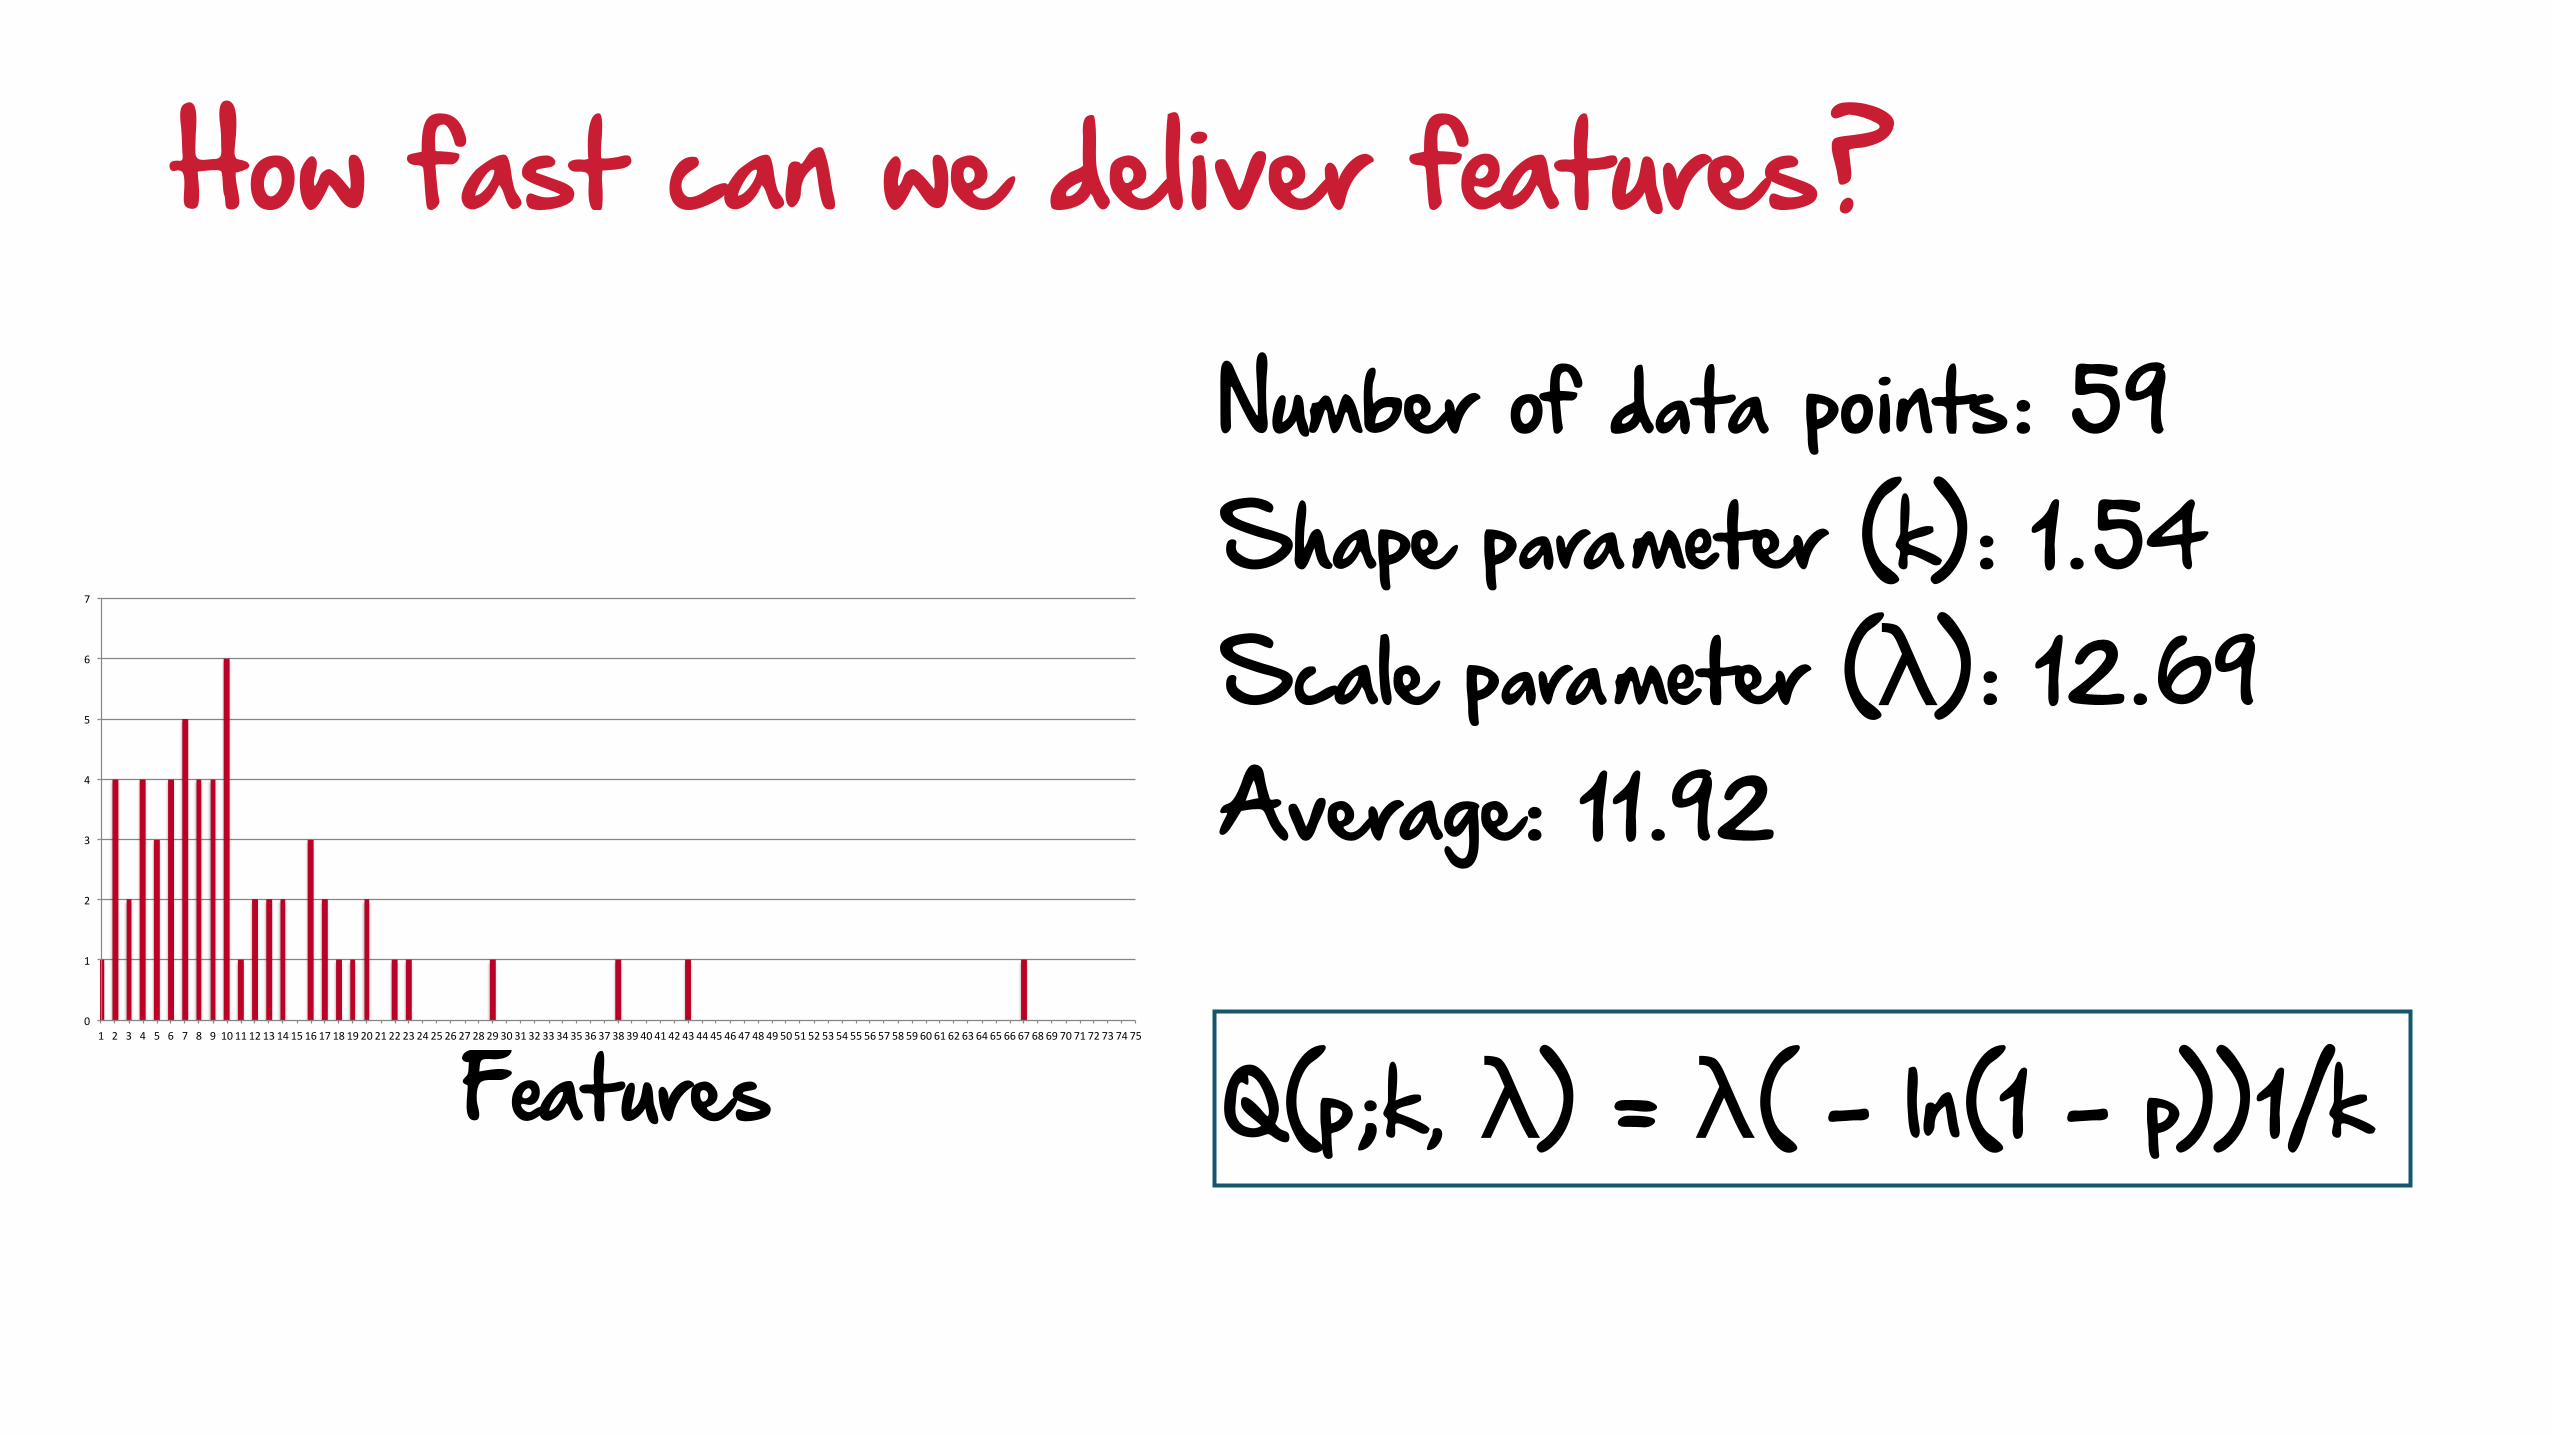
Features Q(p;k, λ) = λ( - ln(1 - p))1/k
Number of data points: 59Shape parameter (k): 1.54Scale parameter (λ): 12.69Average: 11.92
0"
1"
2"
3"
4"
5"
6"
7"
1" 2" 3" 4" 5" 6" 7" 8" 9" 10"11"12"13"14"15"16"17"18"19"20"21"22"23"24"25"26"27"28"29"30"31"32"33"34"35"36"37"38"39"40"41"42"43"44"45"46"47"48"49"50"51"52"53"54"55"56"57"58"59"60"61"62"63"64"65"66"67"68"69"70"71"72"73"74"75"
How fast can we deliver features?
0"
1"
2"
3"
4"
5"
6"
7"
1" 2" 3" 4" 5" 6" 7" 8" 9" 10"11"12"13"14"15"16"17"18"19"20"21"22"23"24"25"26"27"28"29"30"31"32"33"34"35"36"37"38"39"40"41"42"43"44"45"46"47"48"49"50"51"52"53"54"55"56"57"58"59"60"61"62"63"64"65"66"67"68"69"70"71"72"73"74"75"
How fast can we deliver features? Weibull with shape parameter k = 1.5
Mode = most common lead time Median = 50%
Average = 11 days
80% of all tickets will be finished in around 17 days
90% of all tickets will be finished in around 22 days98% of all tickets will be finished in around 30 days
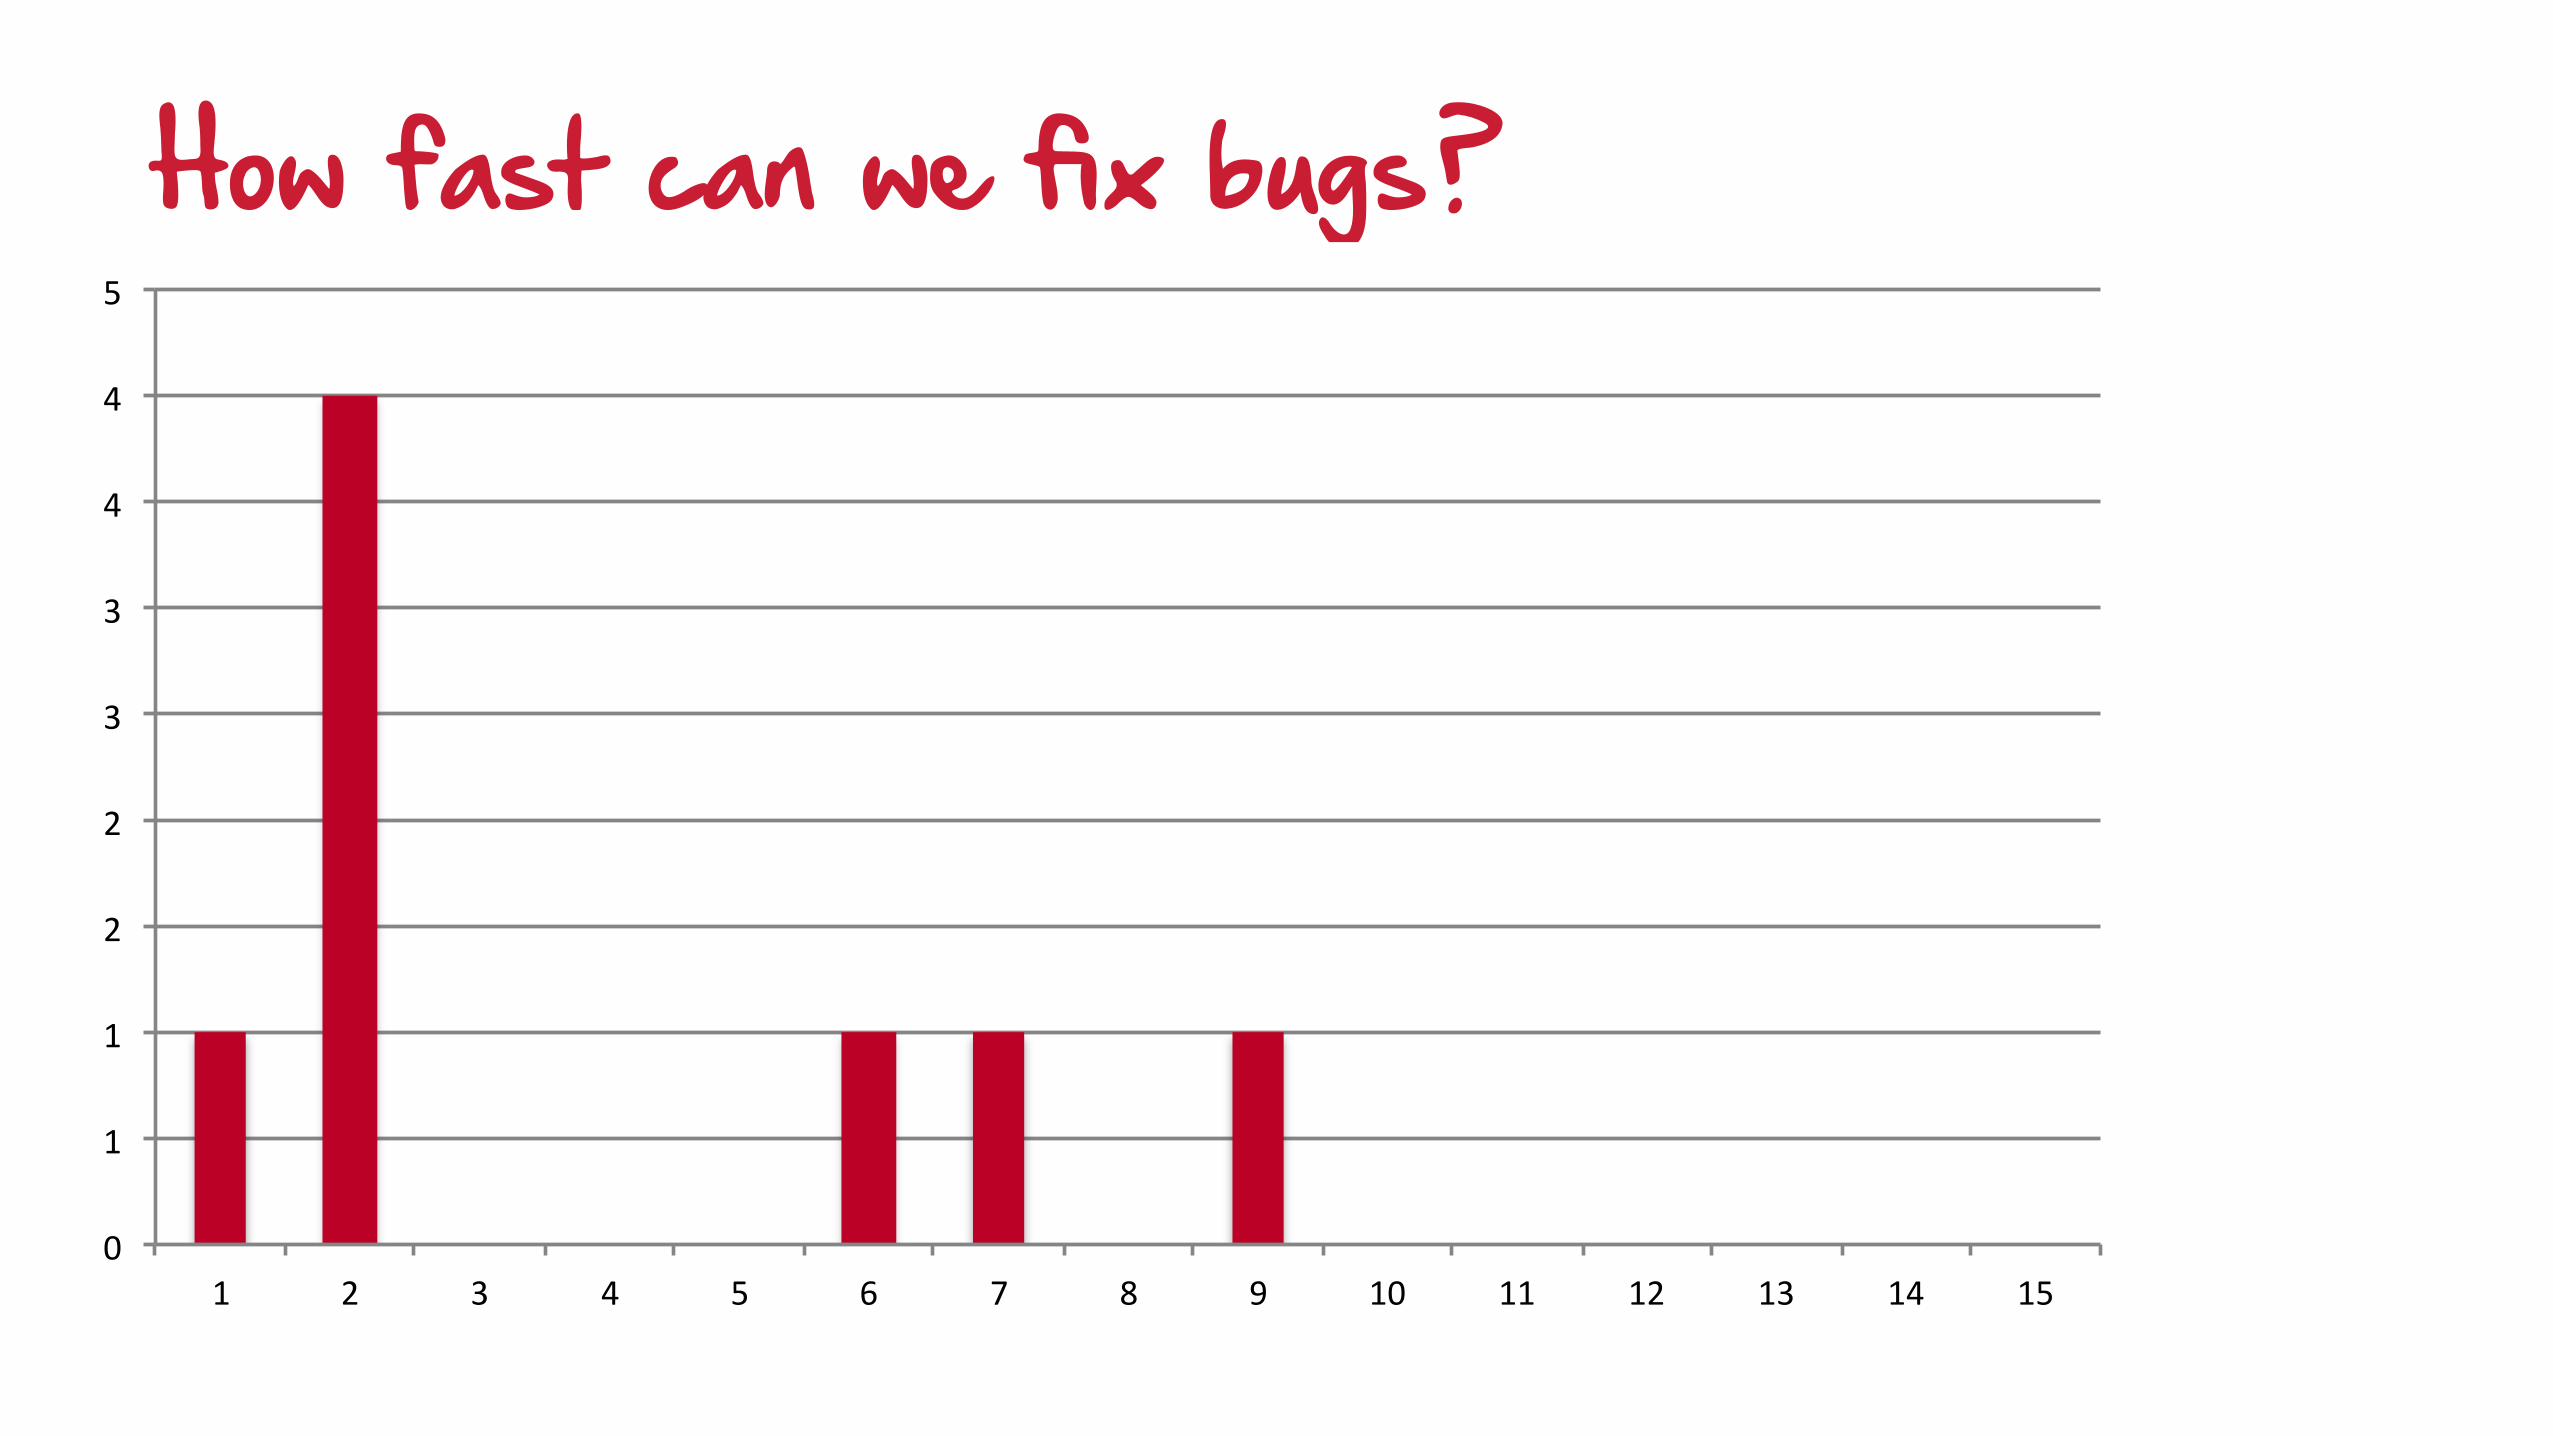
How fast can we fix bugs?
0"
1"
1"
2"
2"
3"
3"
4"
4"
5"
1" 2" 3" 4" 5" 6" 7" 8" 9" 10" 11" 12" 13" 14" 15"
Bugs
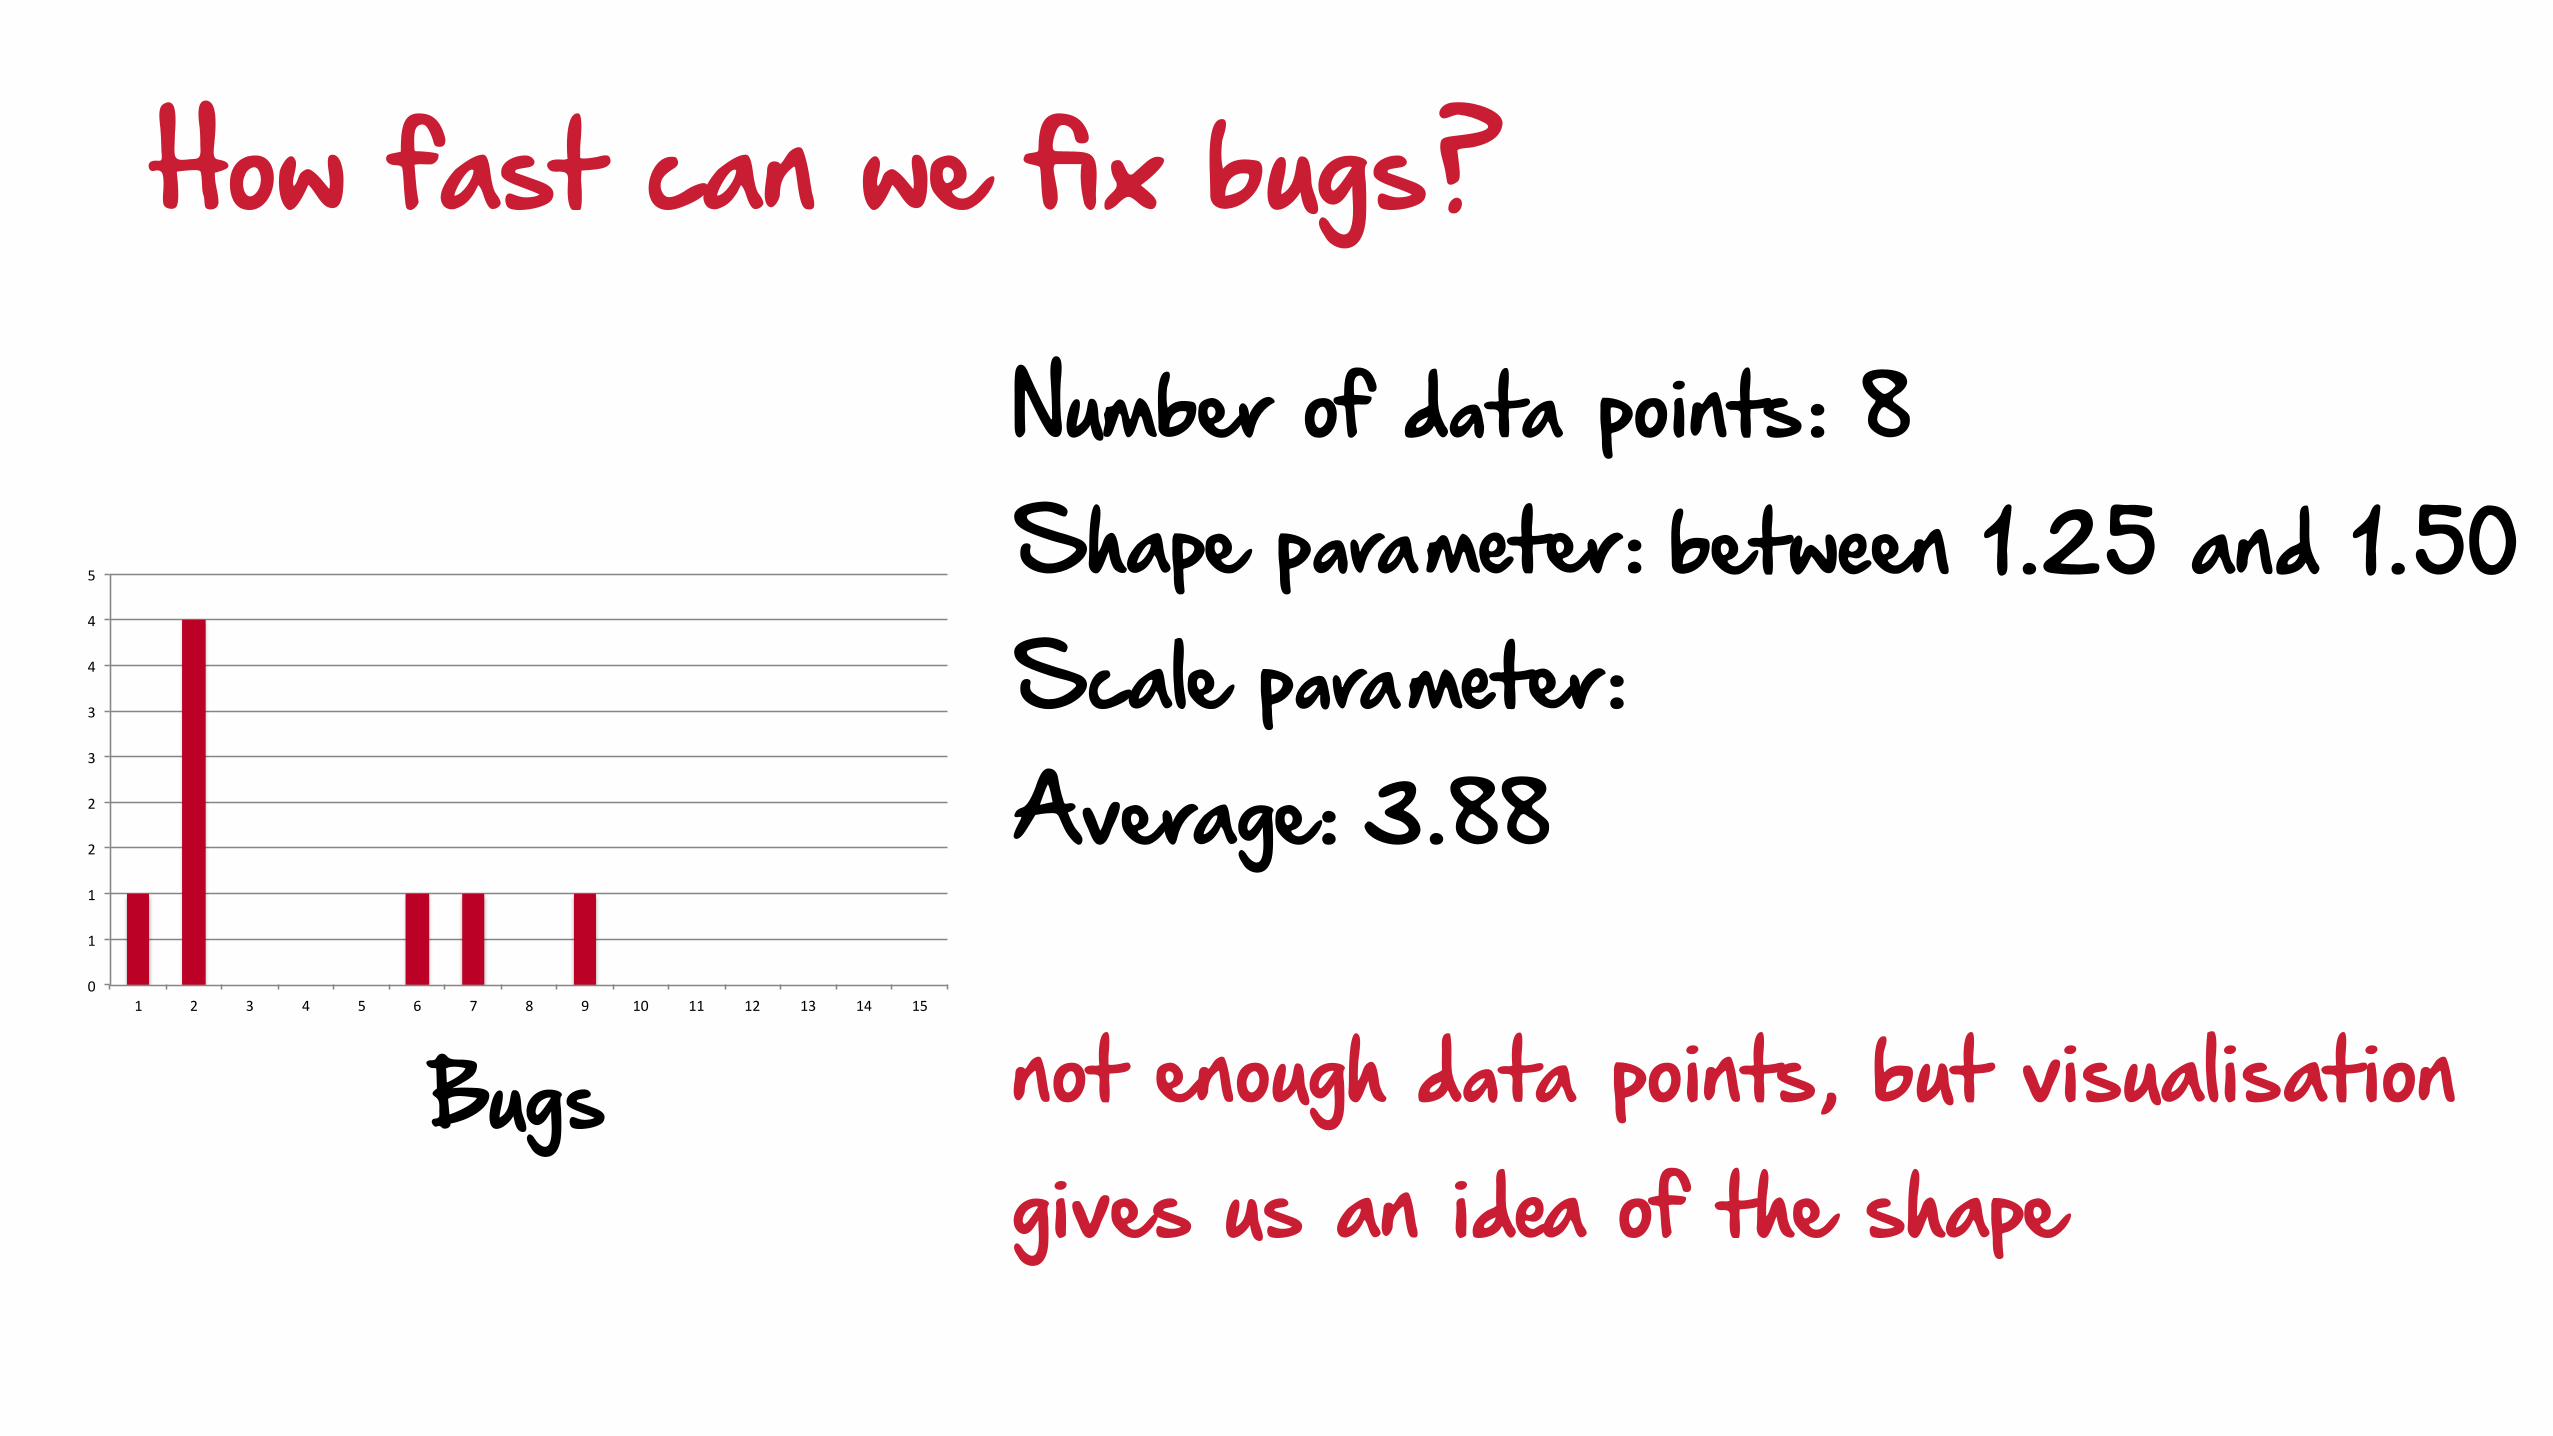
Number of data points: 8Shape parameter:Scale parameter: Average: 3.88
not enough data points, but visualisation gives us an idea of the shape
0"
1"
1"
2"
2"
3"
3"
4"
4"
5"
1" 2" 3" 4" 5" 6" 7" 8" 9" 10" 11" 12" 13" 14" 15"
How fast can we fix bugs?
between 1.25 and 1.50
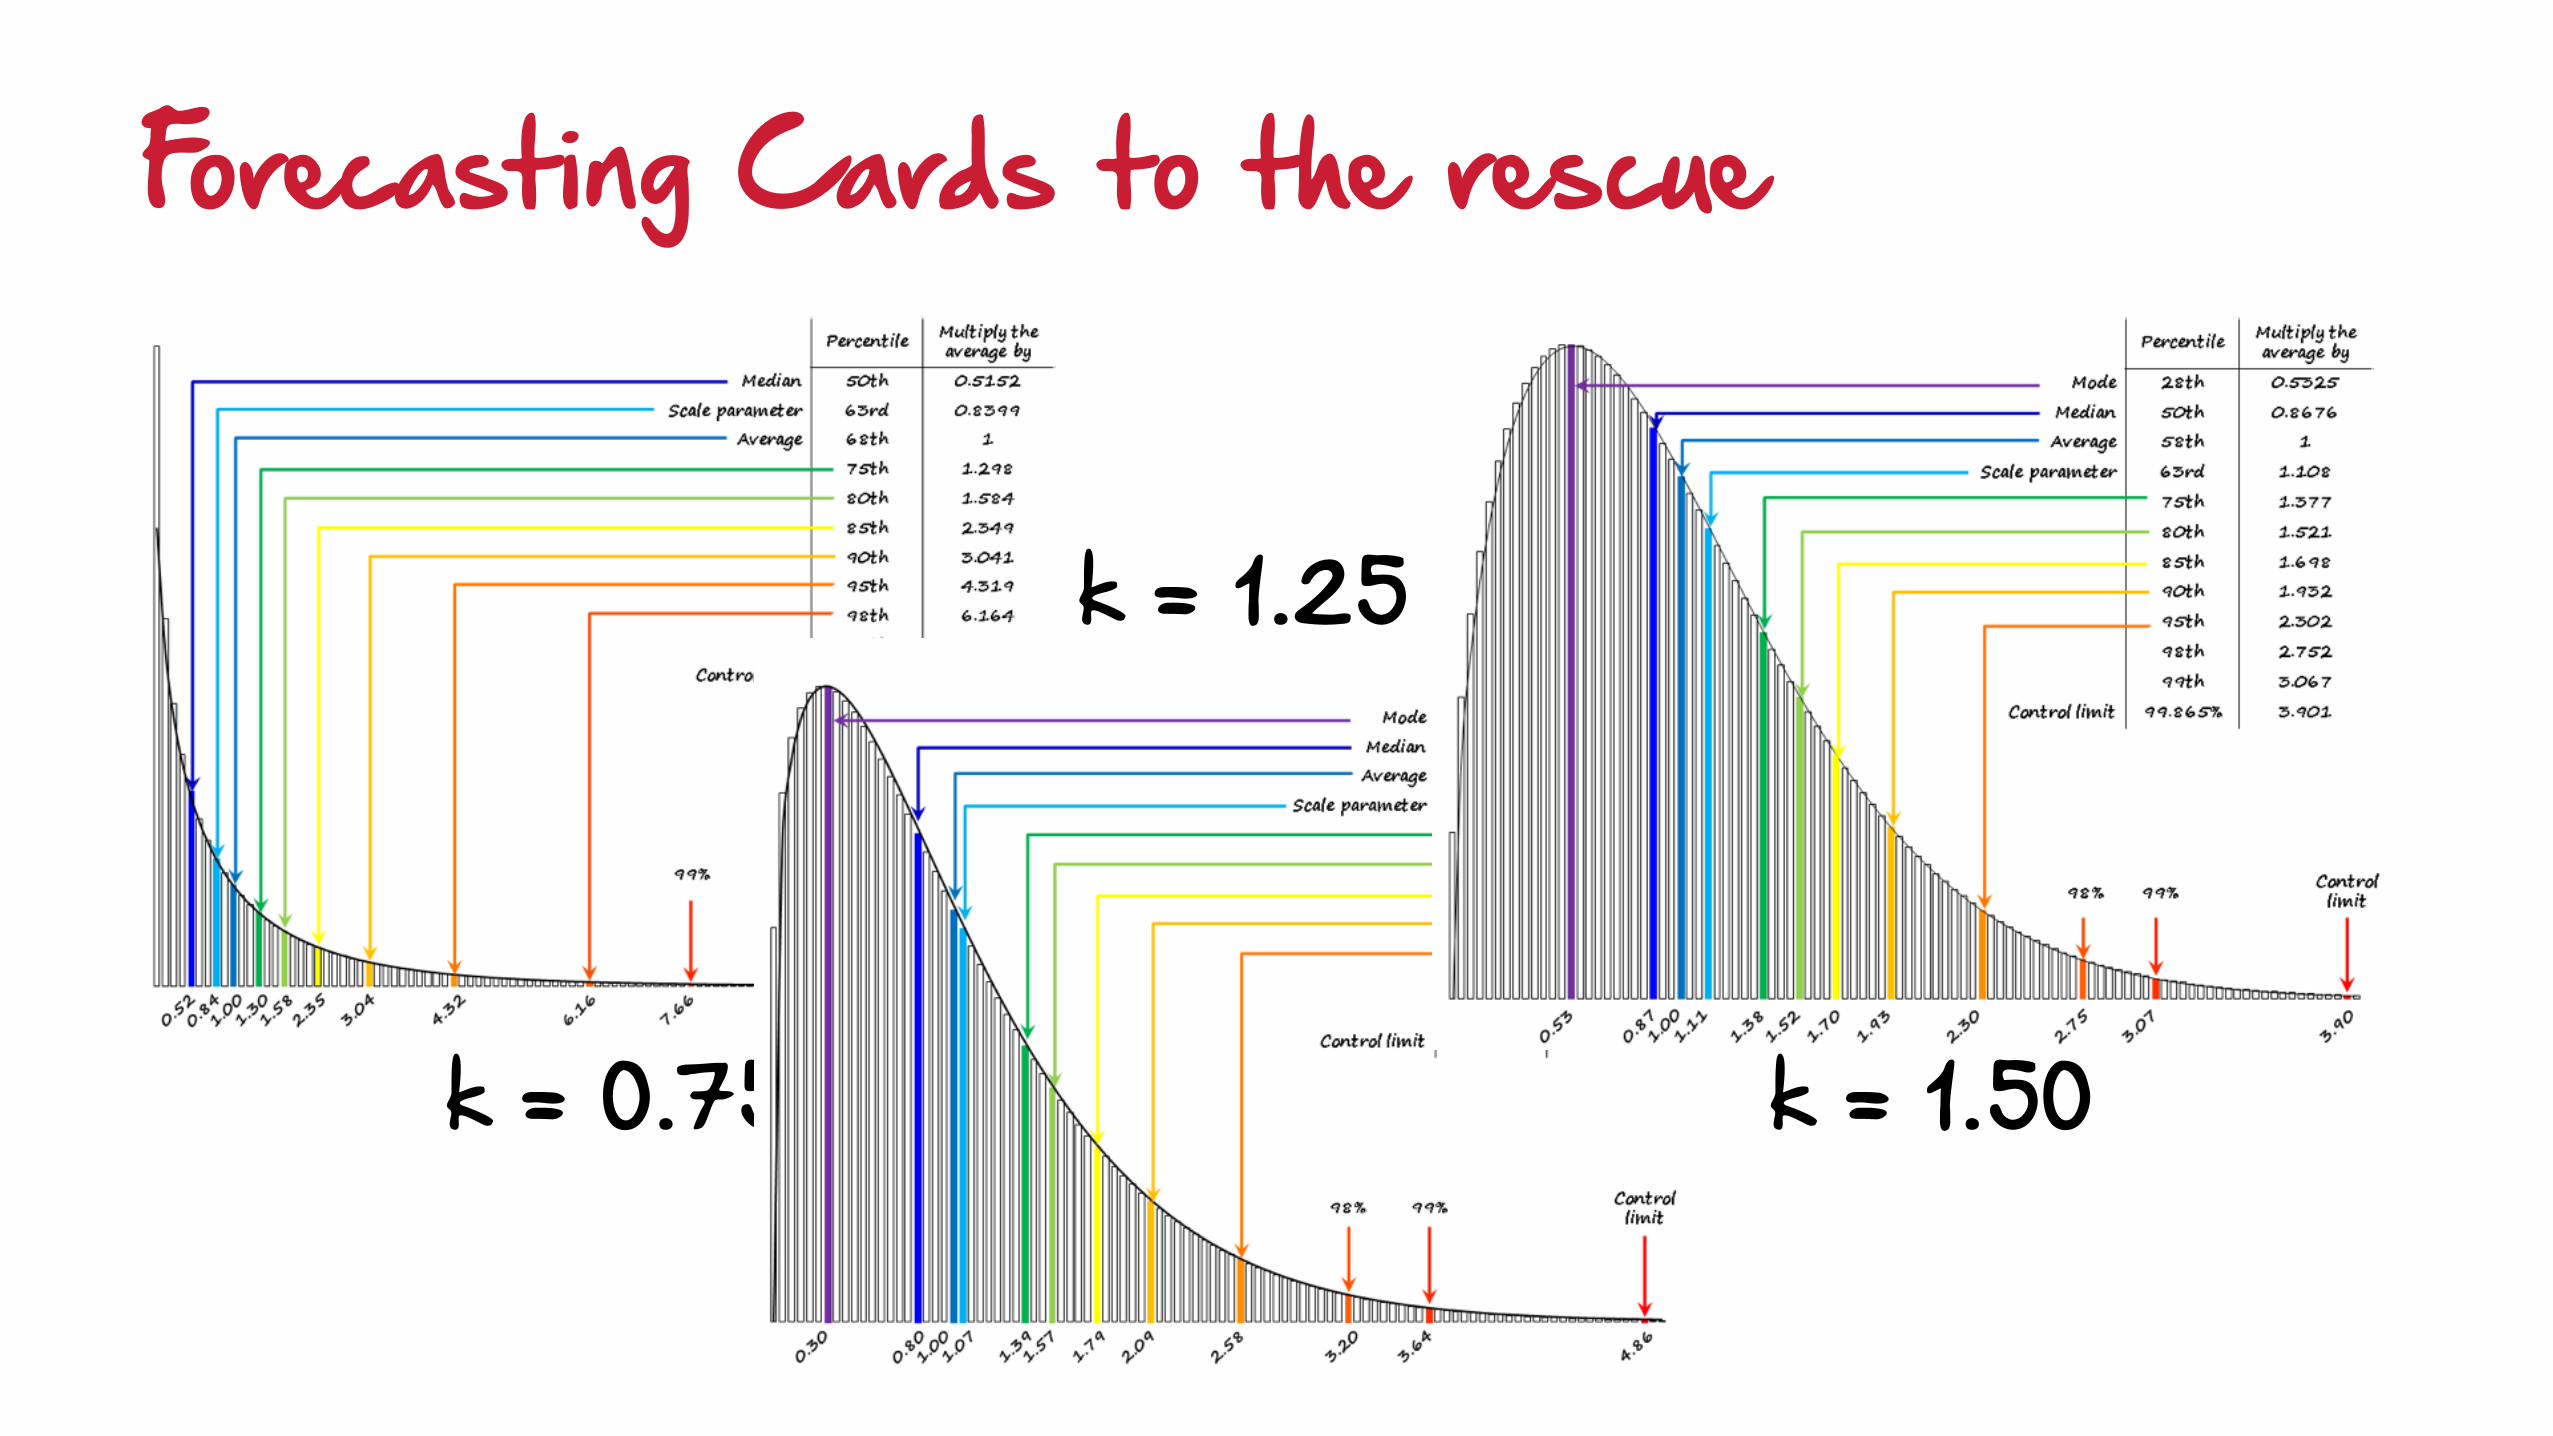
Forecasting Cards to the rescue
k = 0.75
k = 1.25
k = 1.50
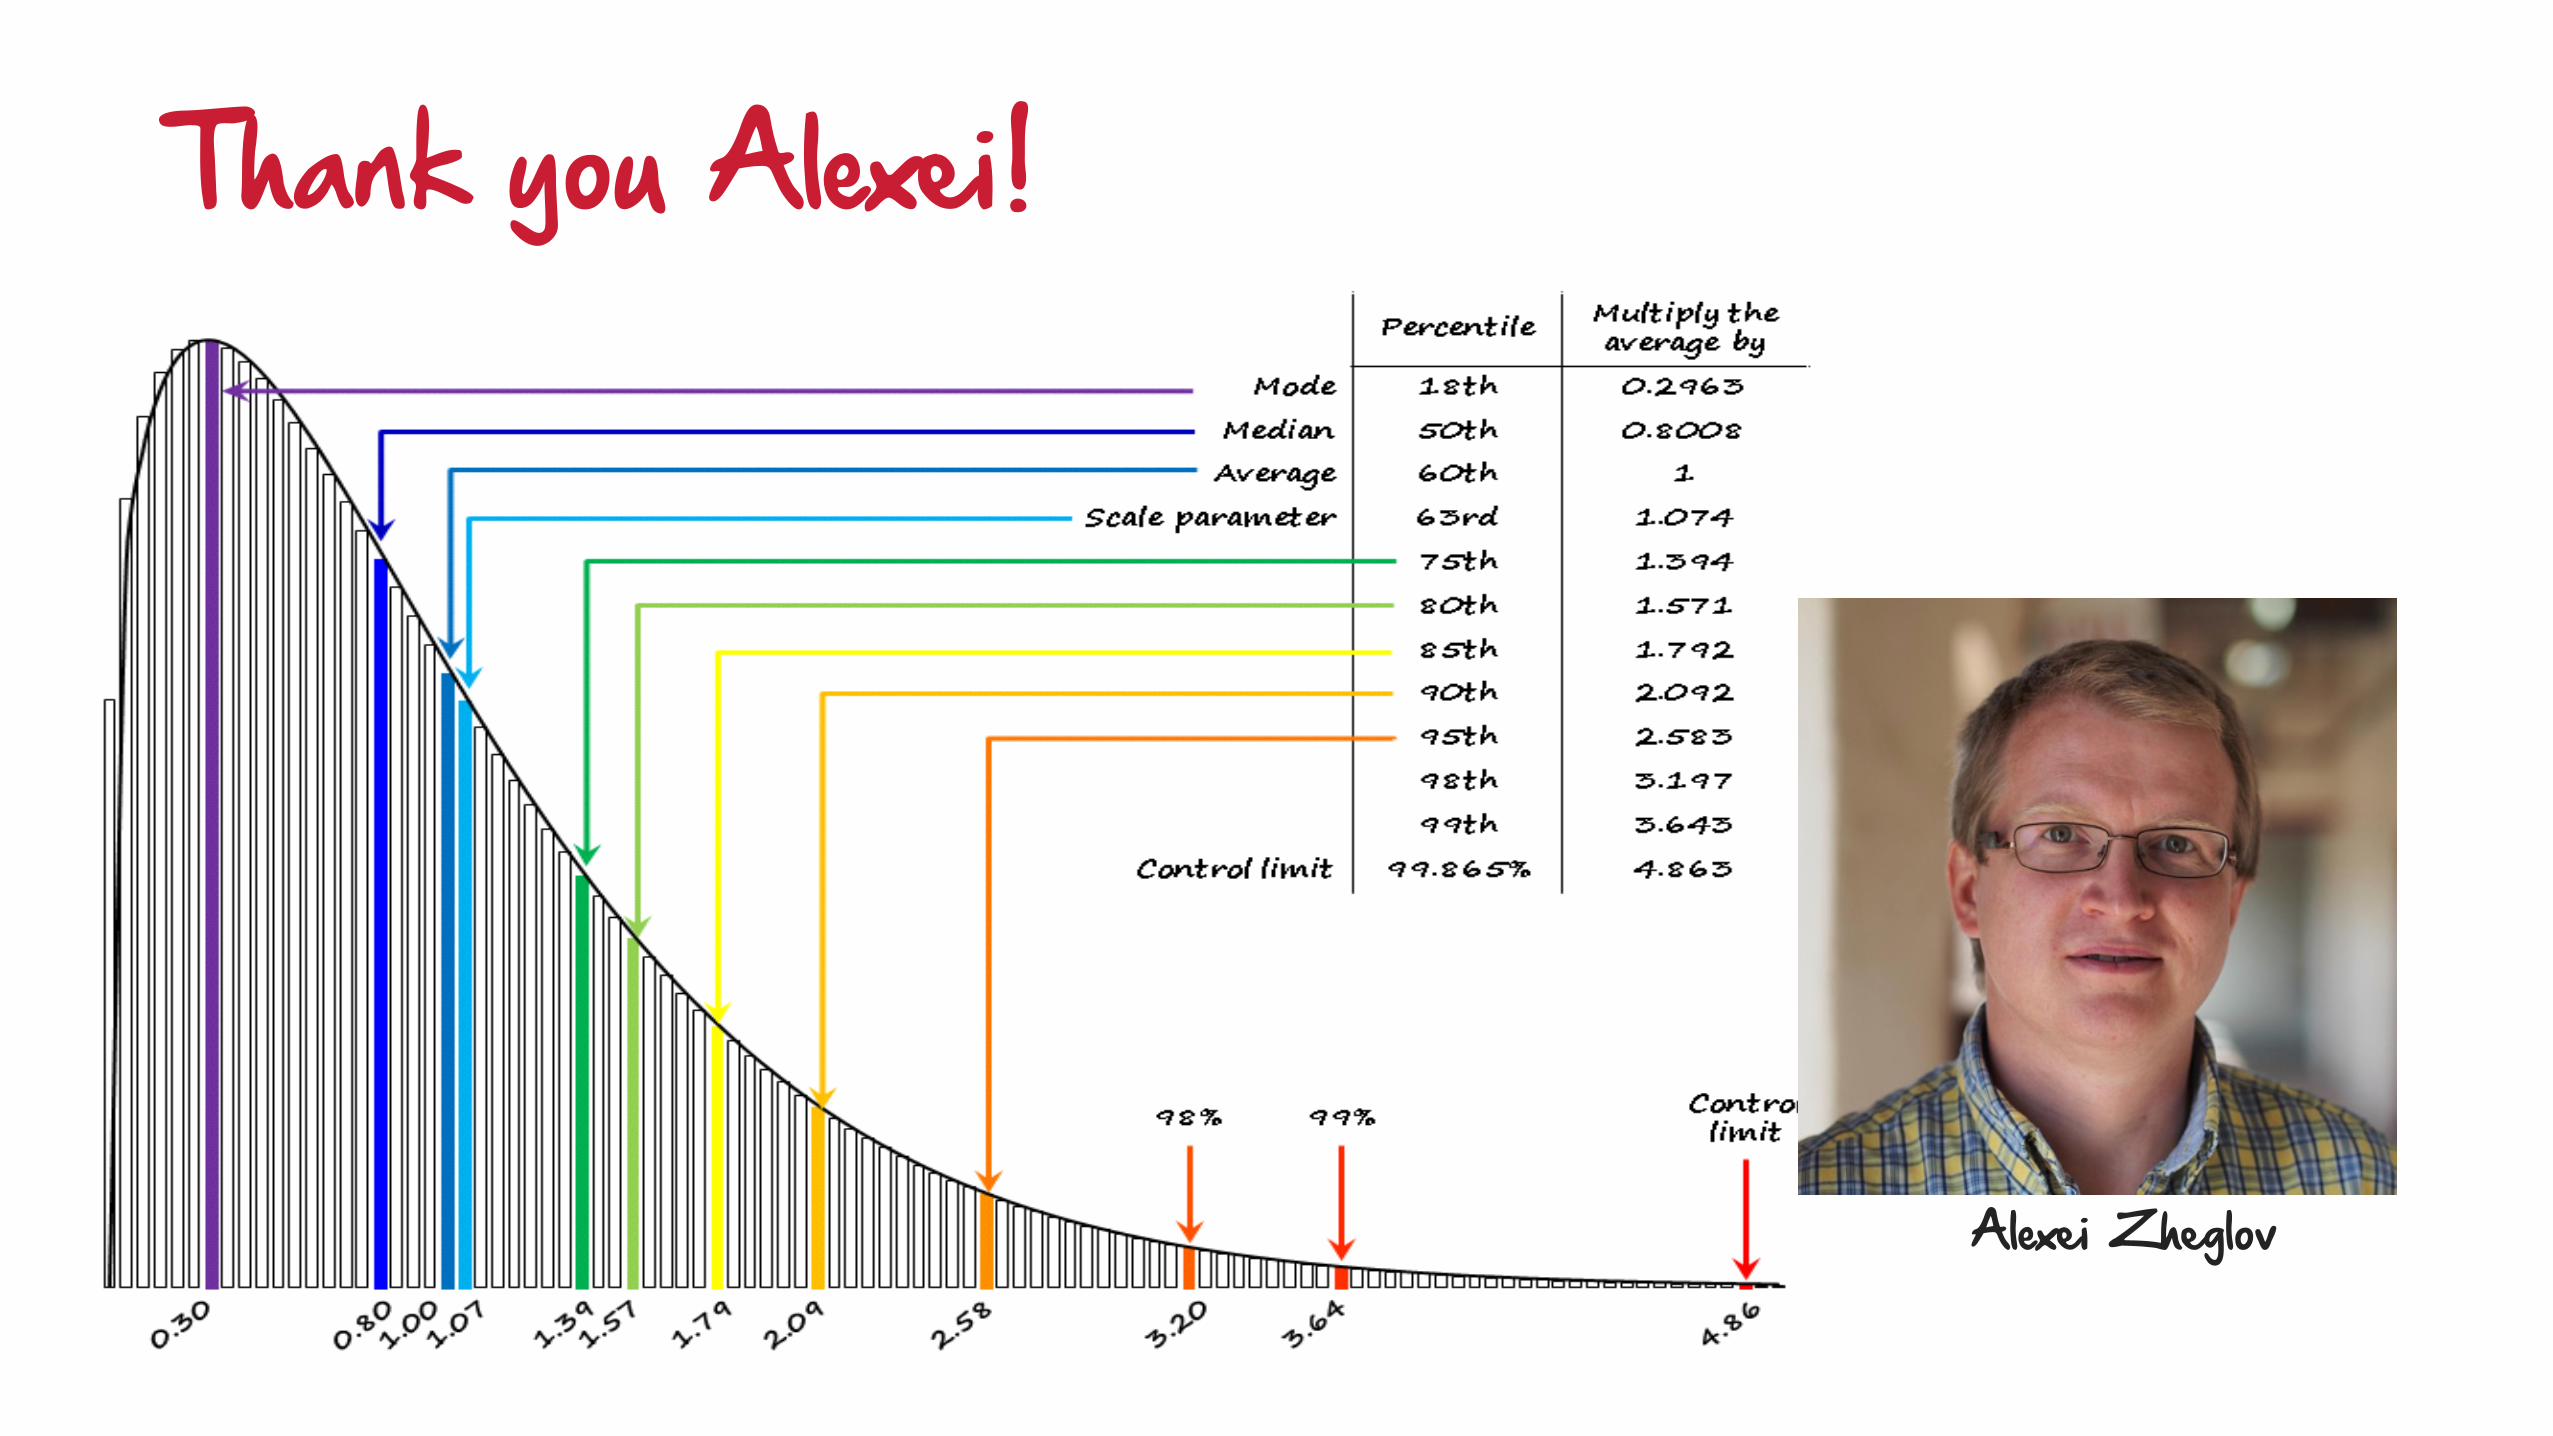
Thank you Alexei!
Alexei Zheglov
0"
1"
1"
2"
2"
3"
3"
4"
4"
5"
1" 2" 3" 4" 5" 6" 7" 8" 9" 10" 11" 12" 13" 14" 15"
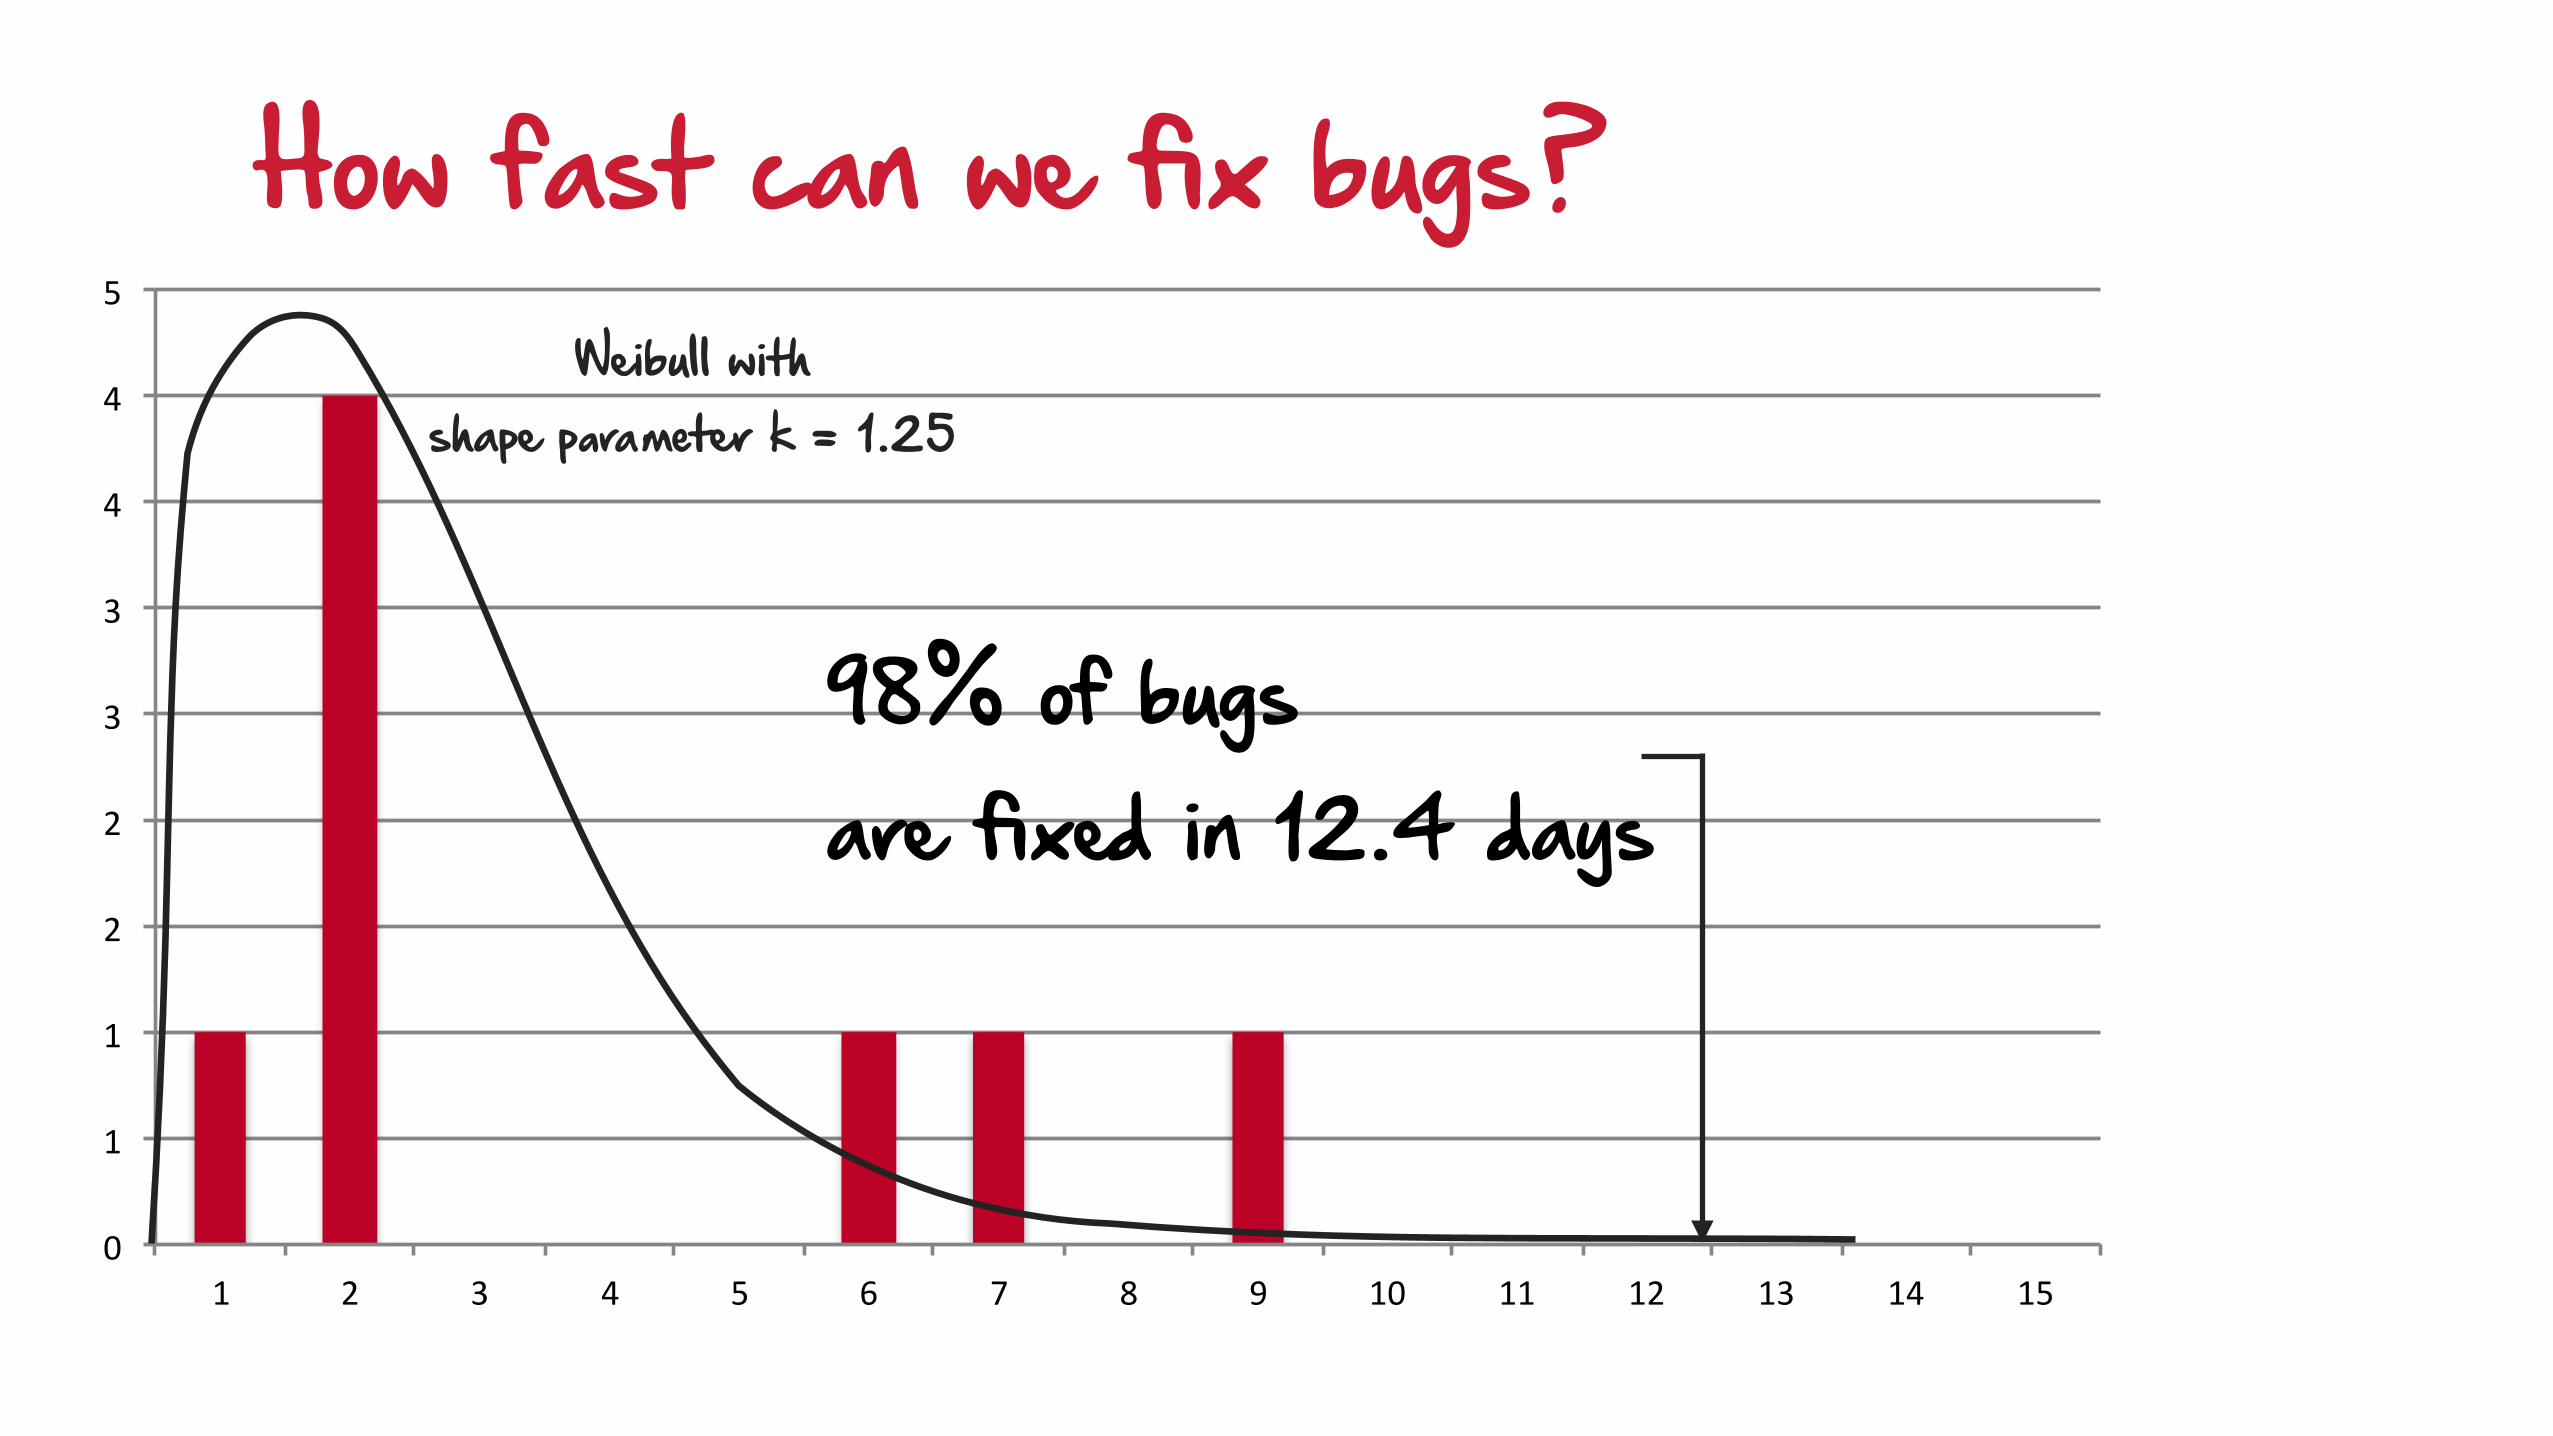
How fast can we fix bugs?
98% of bugs are fixed in 12.4 days
Weibull with shape parameter k = 1.25
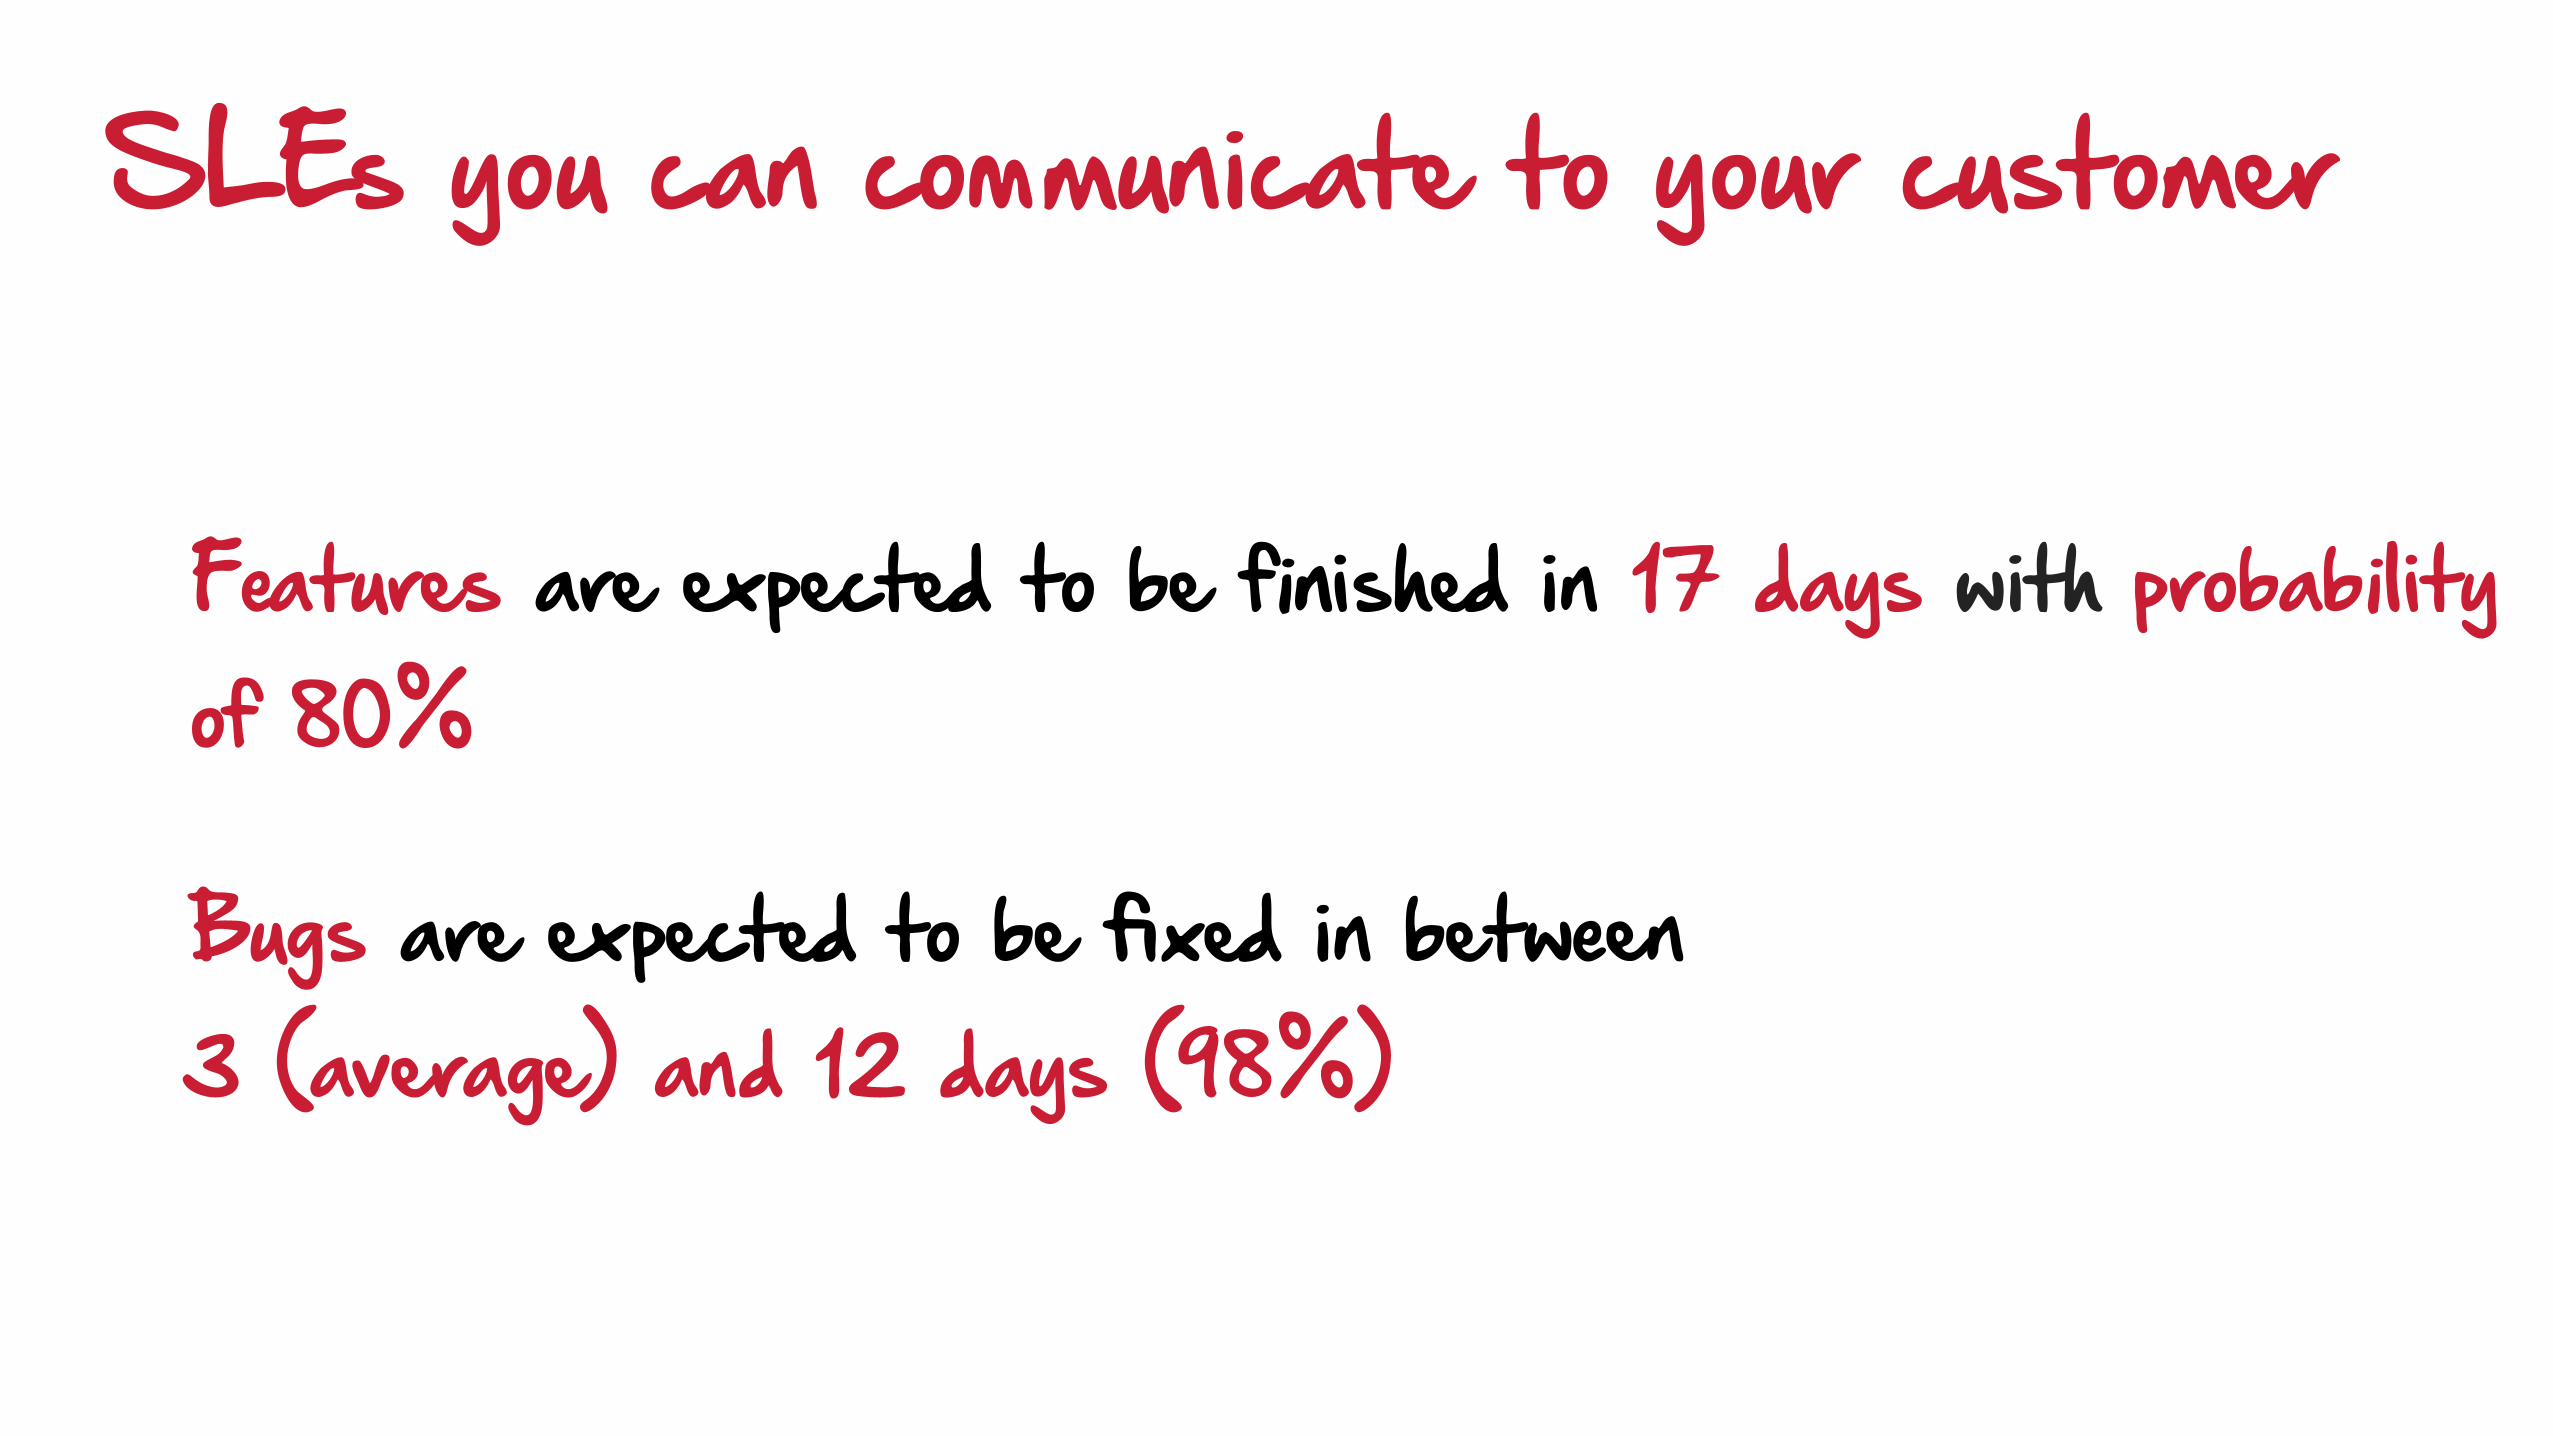
Features are expected to be finished in 17 days with probability of 80%
Bugs are expected to be fixed in between 3 (average) and 12 days (98%)
SLEs you can communicate to your customer

Calculate your project lead time and budget
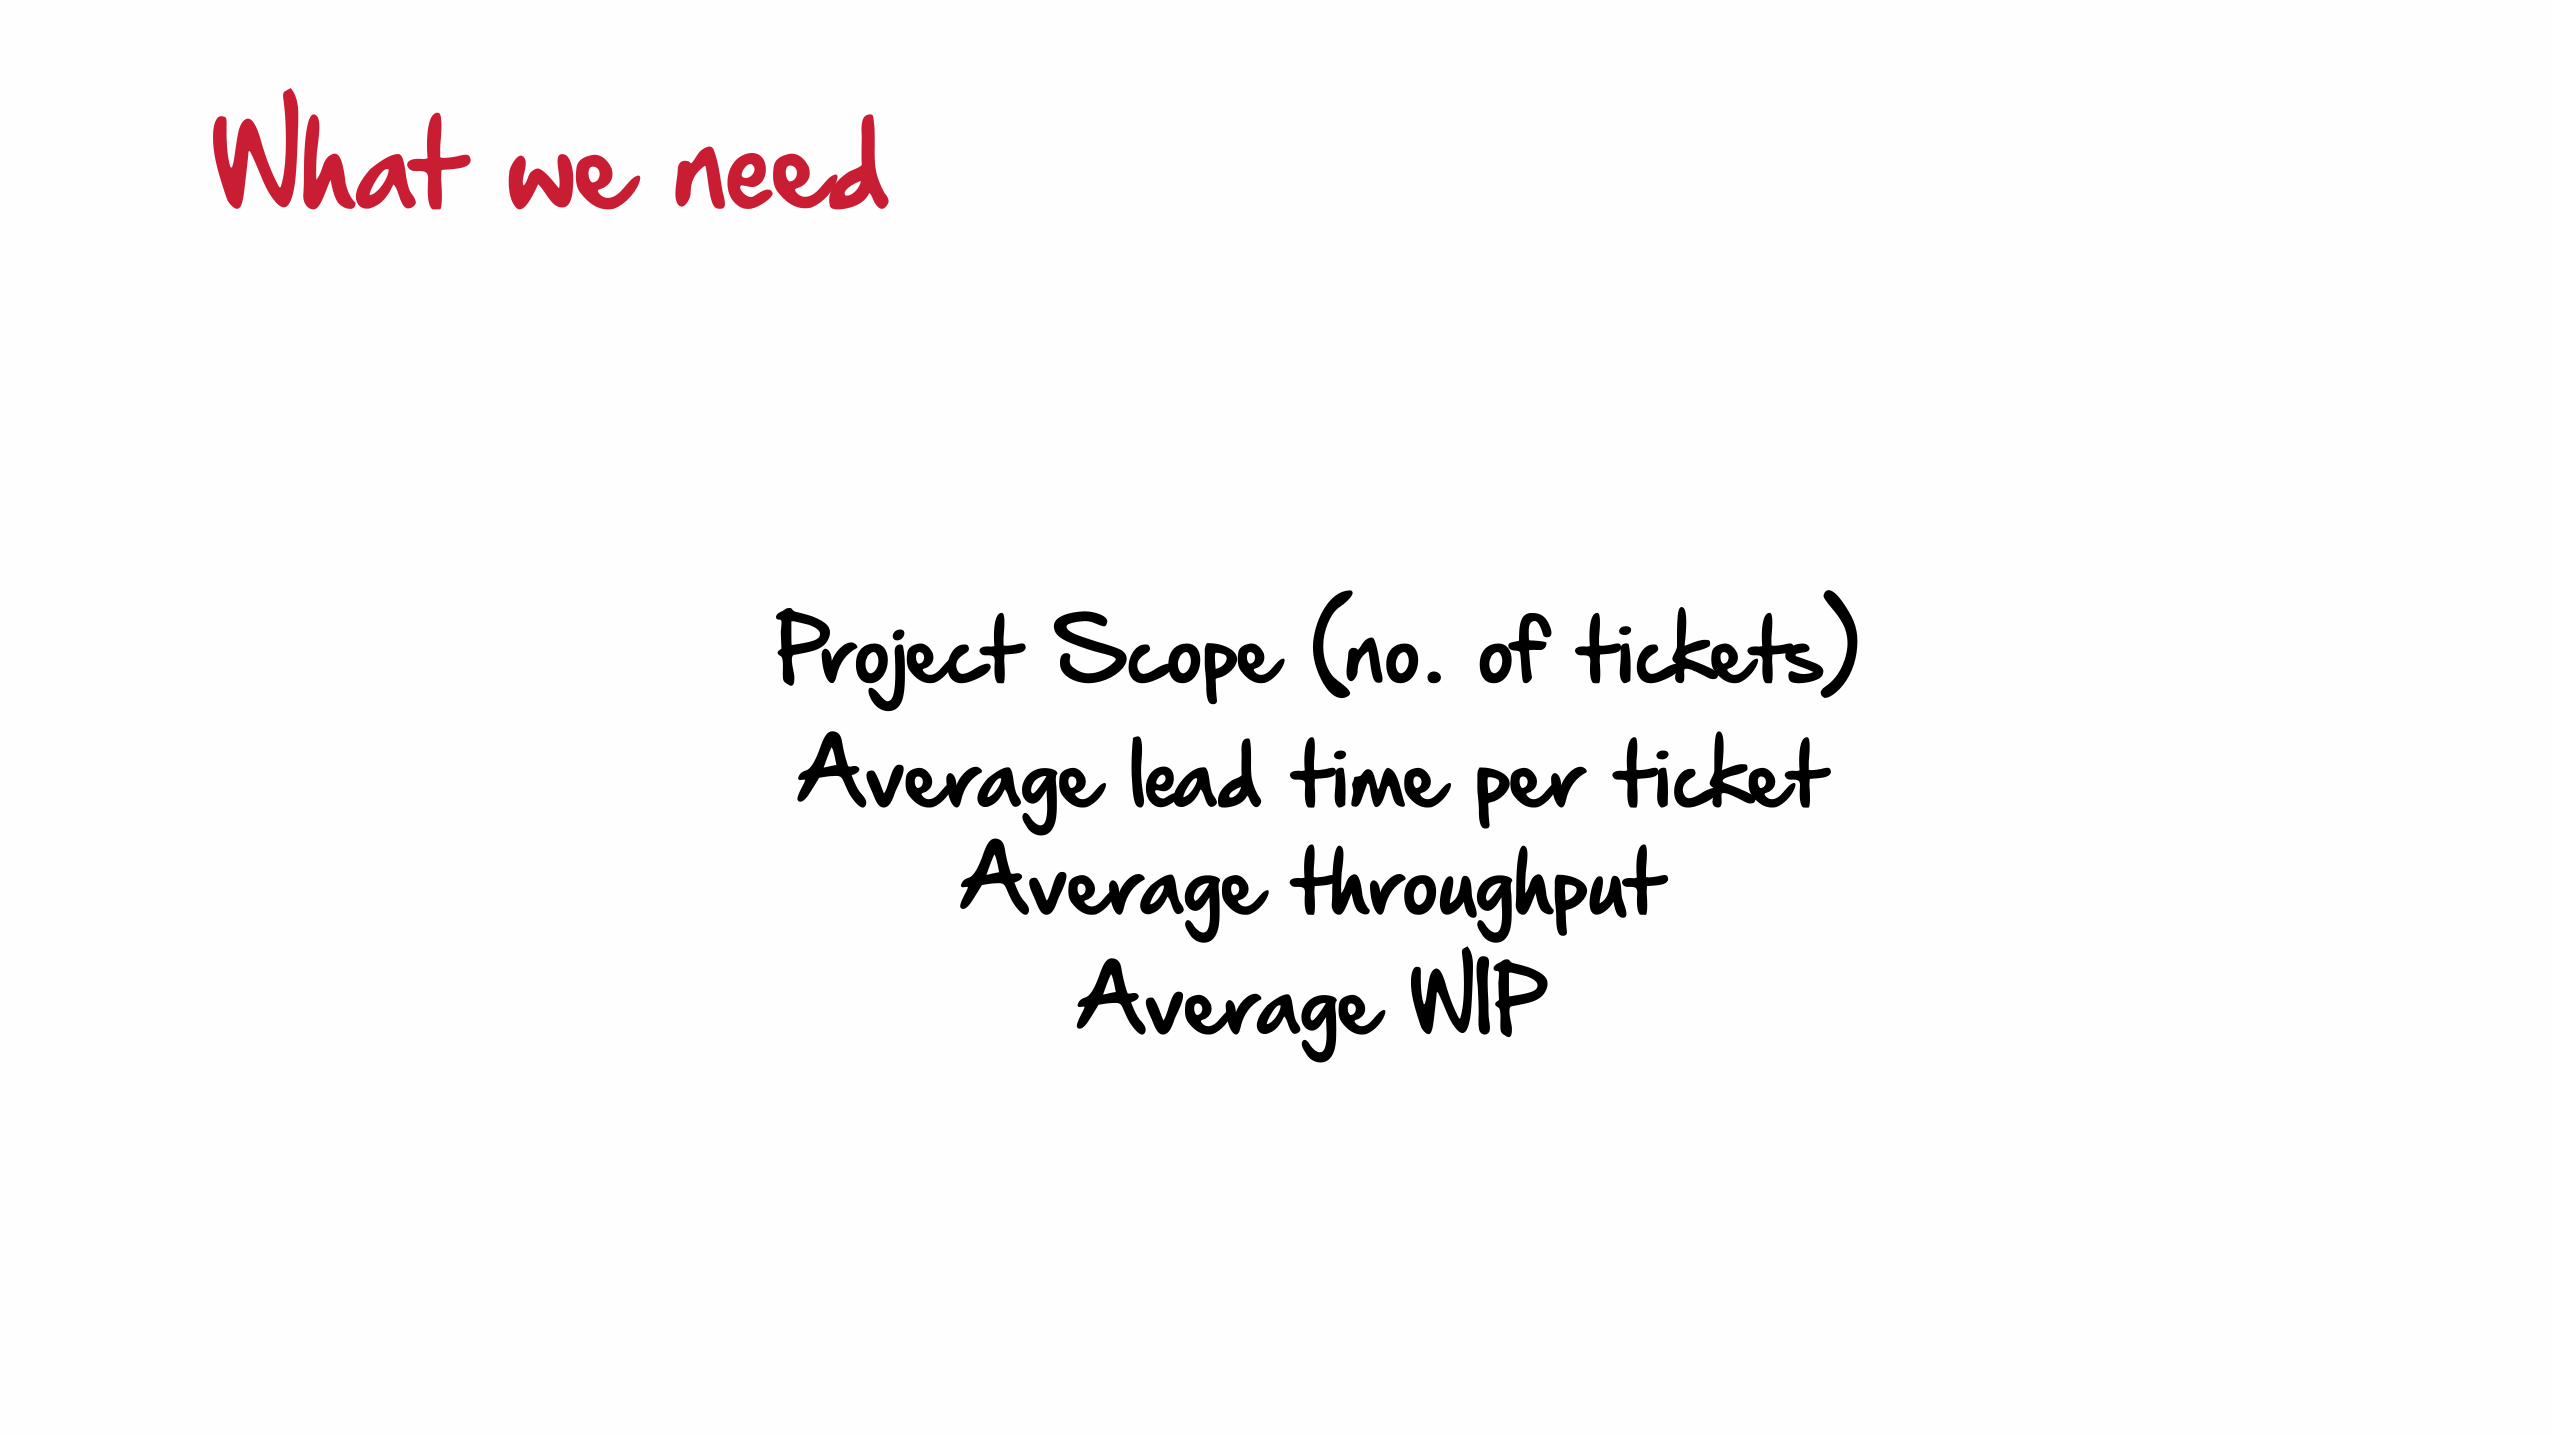
Average lead time per ticket
Average WIP
Project Scope (no. of tickets)
Average throughput
What we need
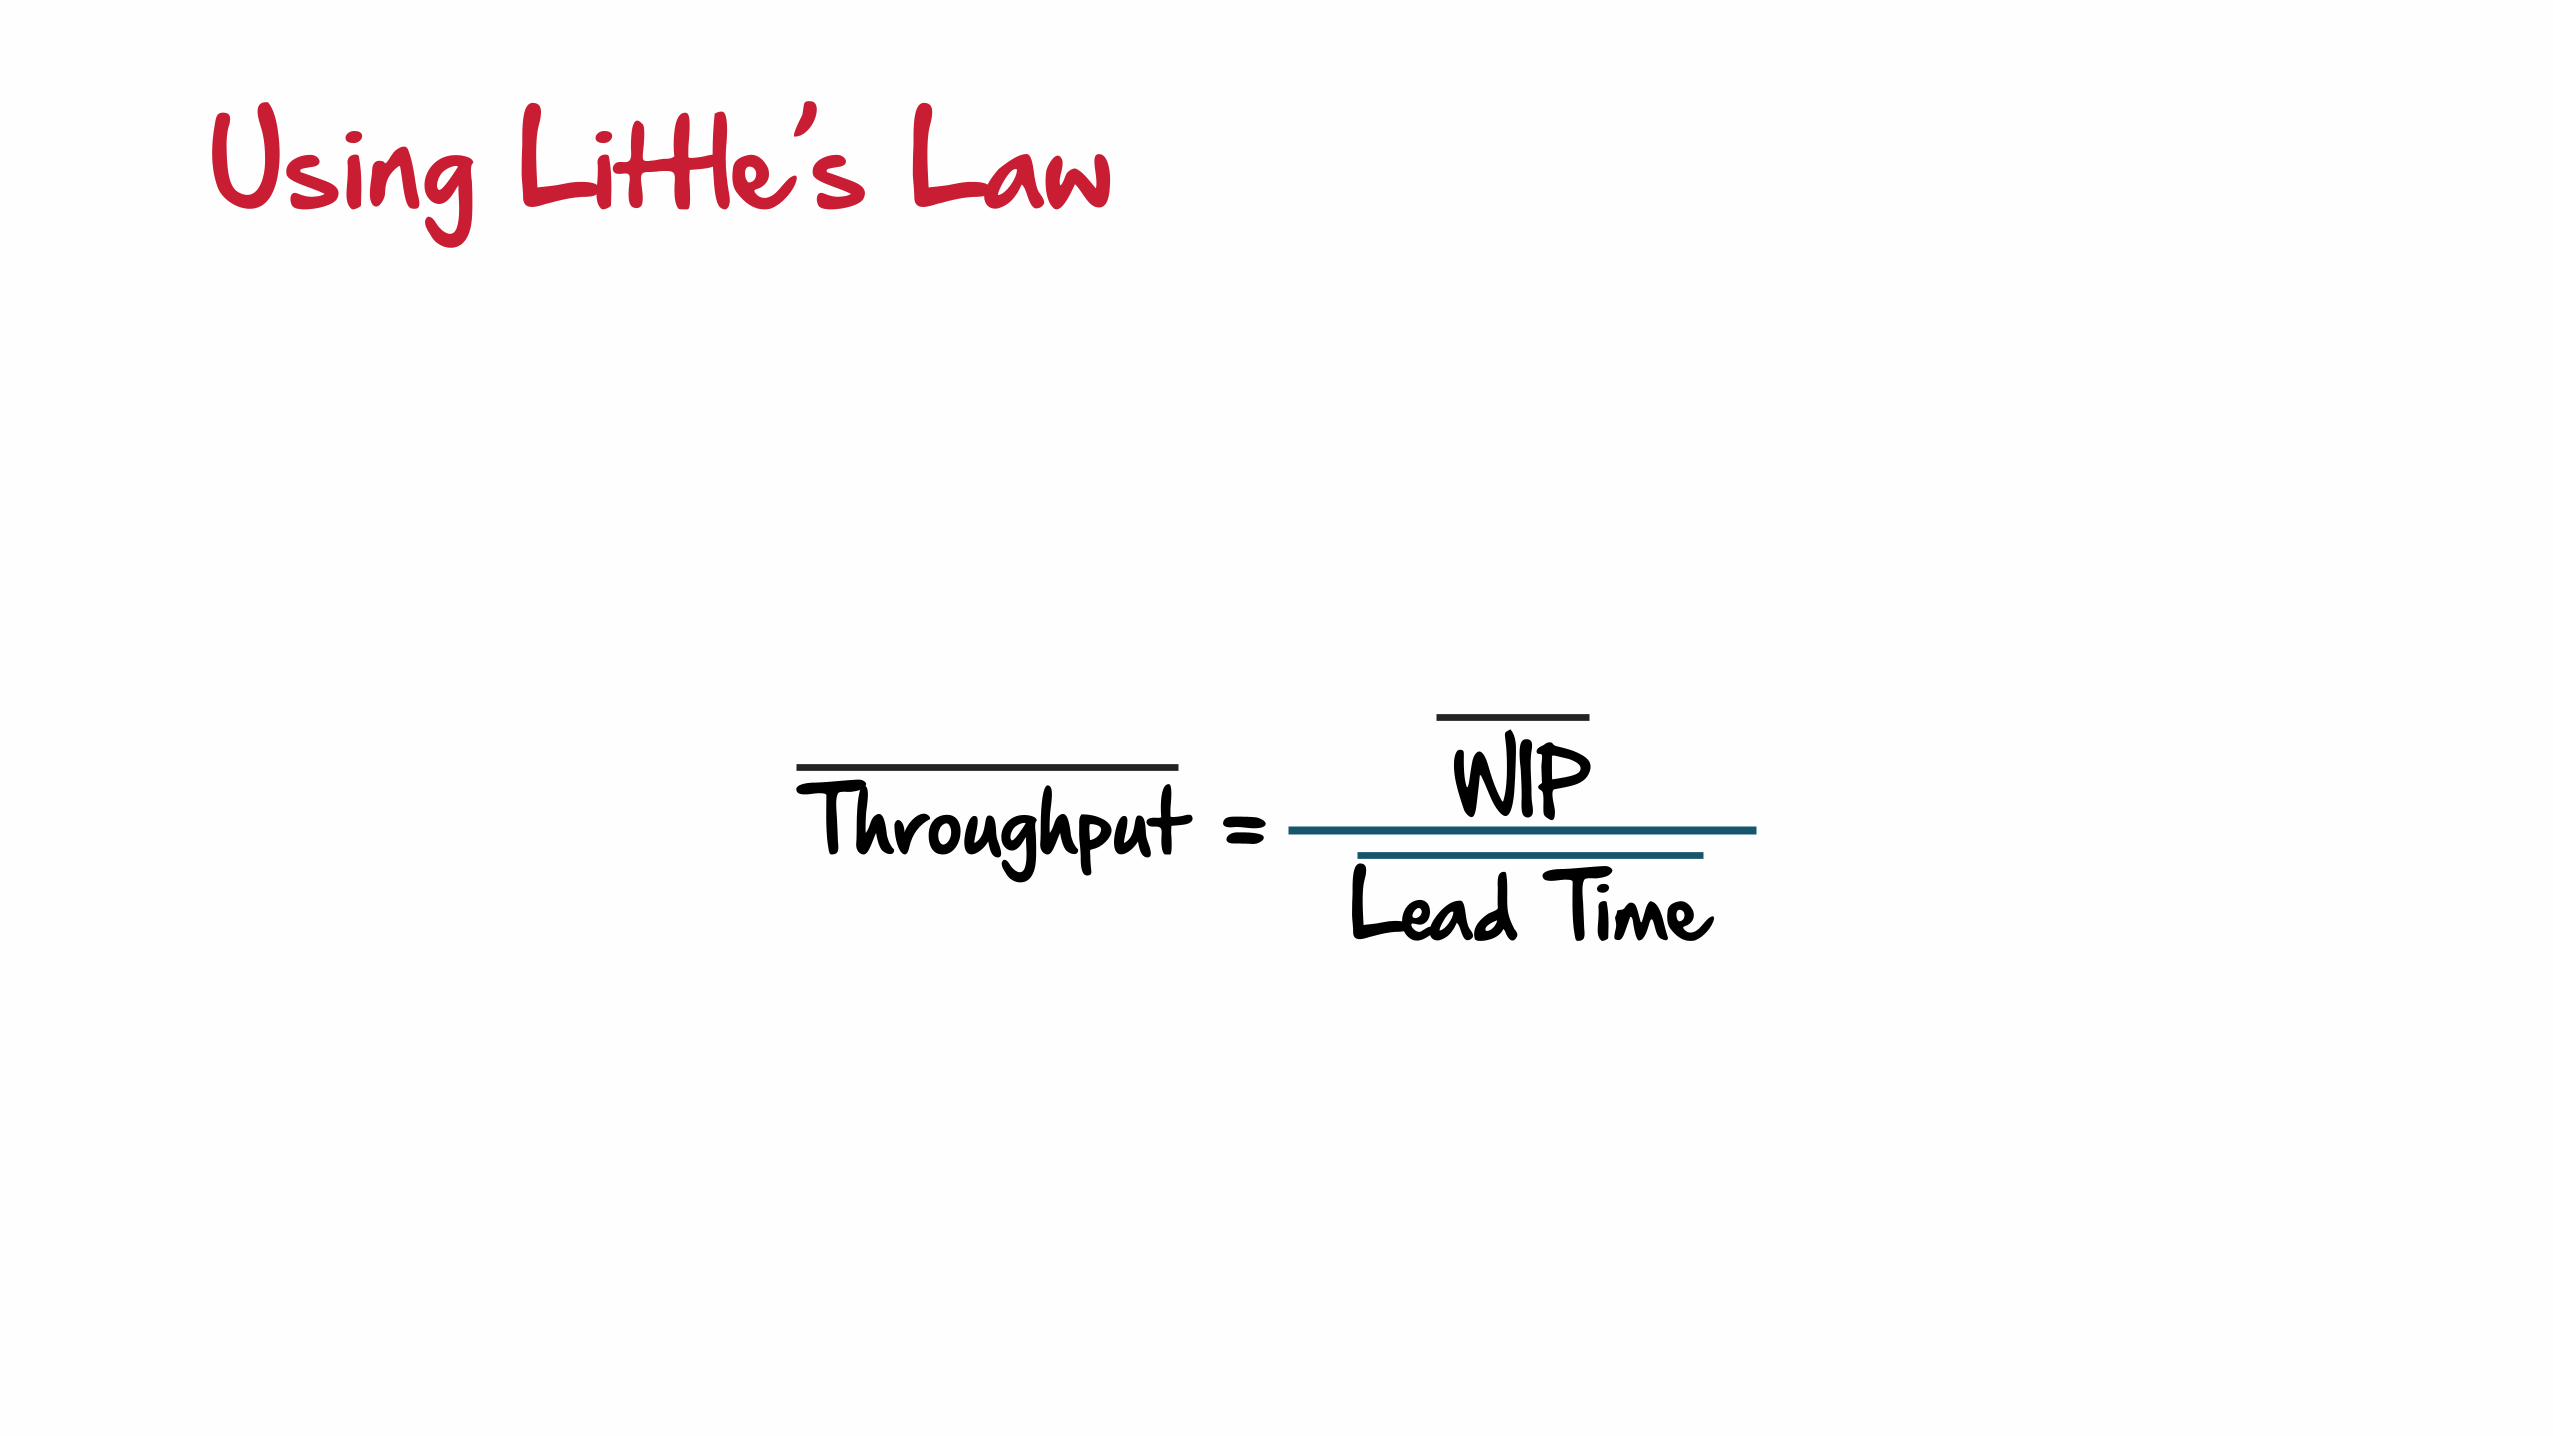
Using Little’s Law
WIPLead Time
Throughput =
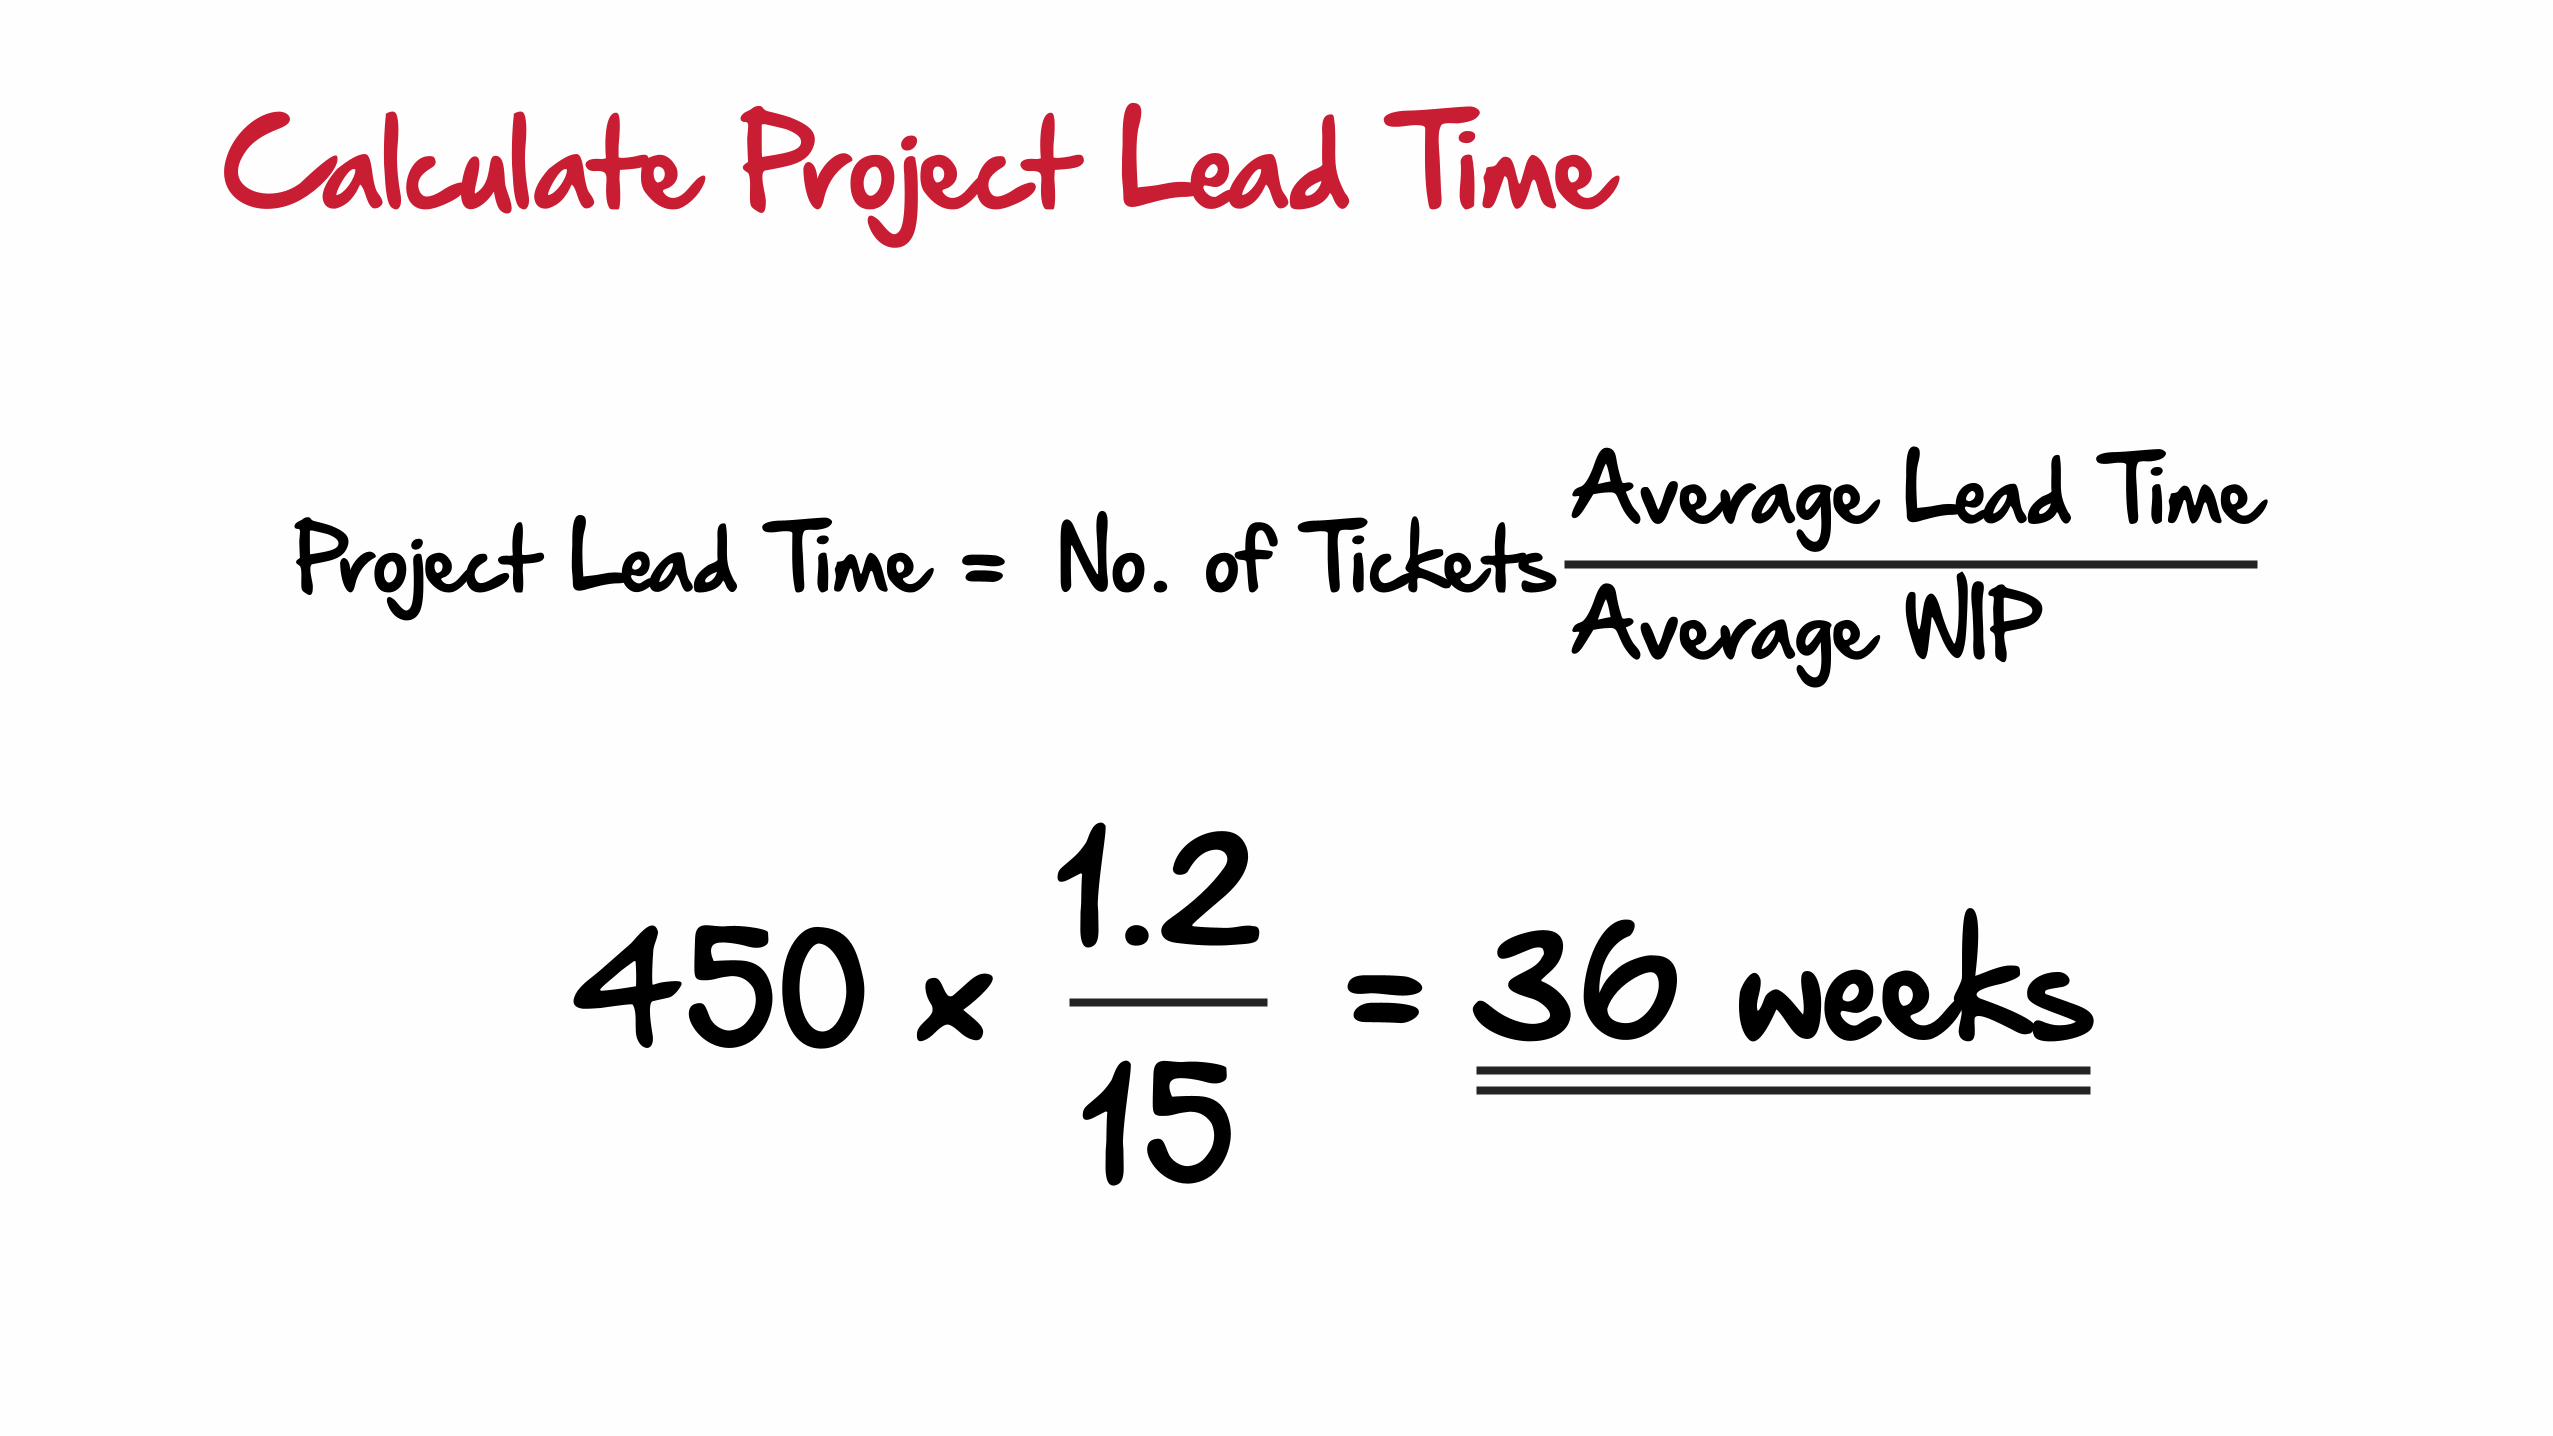
Project Lead Time = No. of TicketsAverage Lead TimeAverage WIP
x 450 1.2 15
= 36 weeks
Calculate Project Lead Time
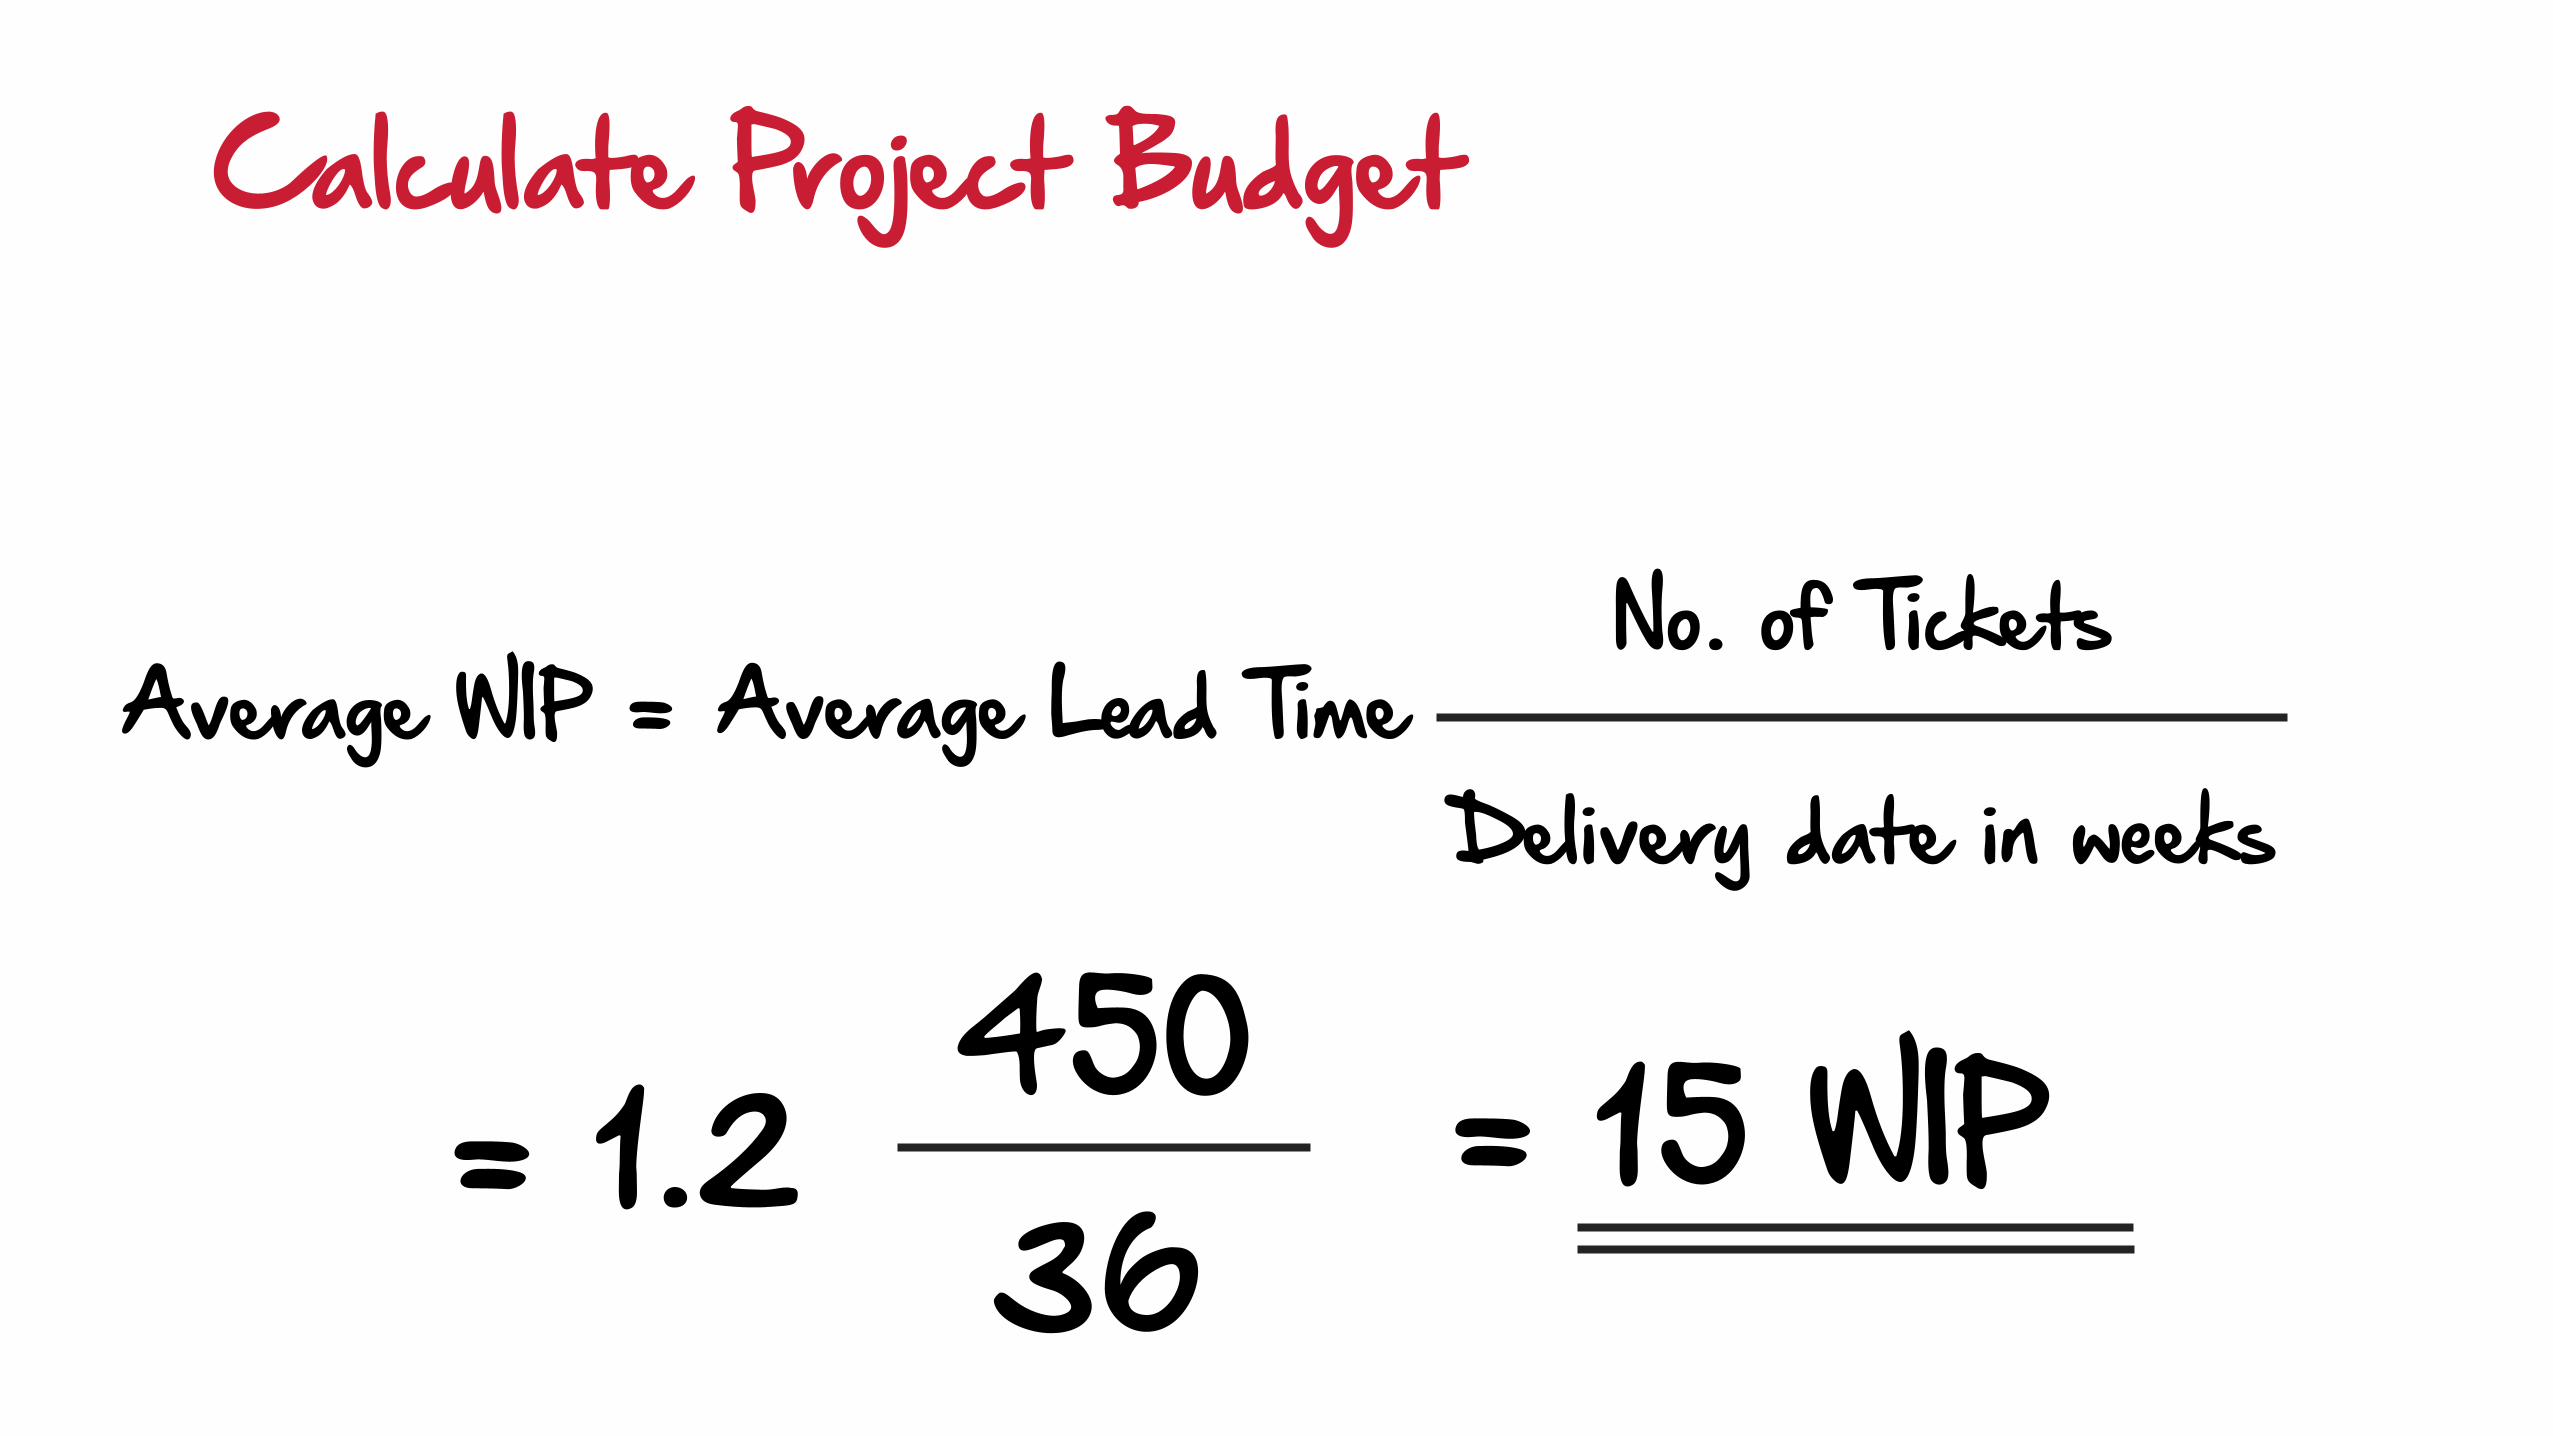
Calculate Project Budget
Average WIP = Average Lead TimeNo. of Tickets
Delivery date in weeks
= 1.2 450 36
= 15 WIP
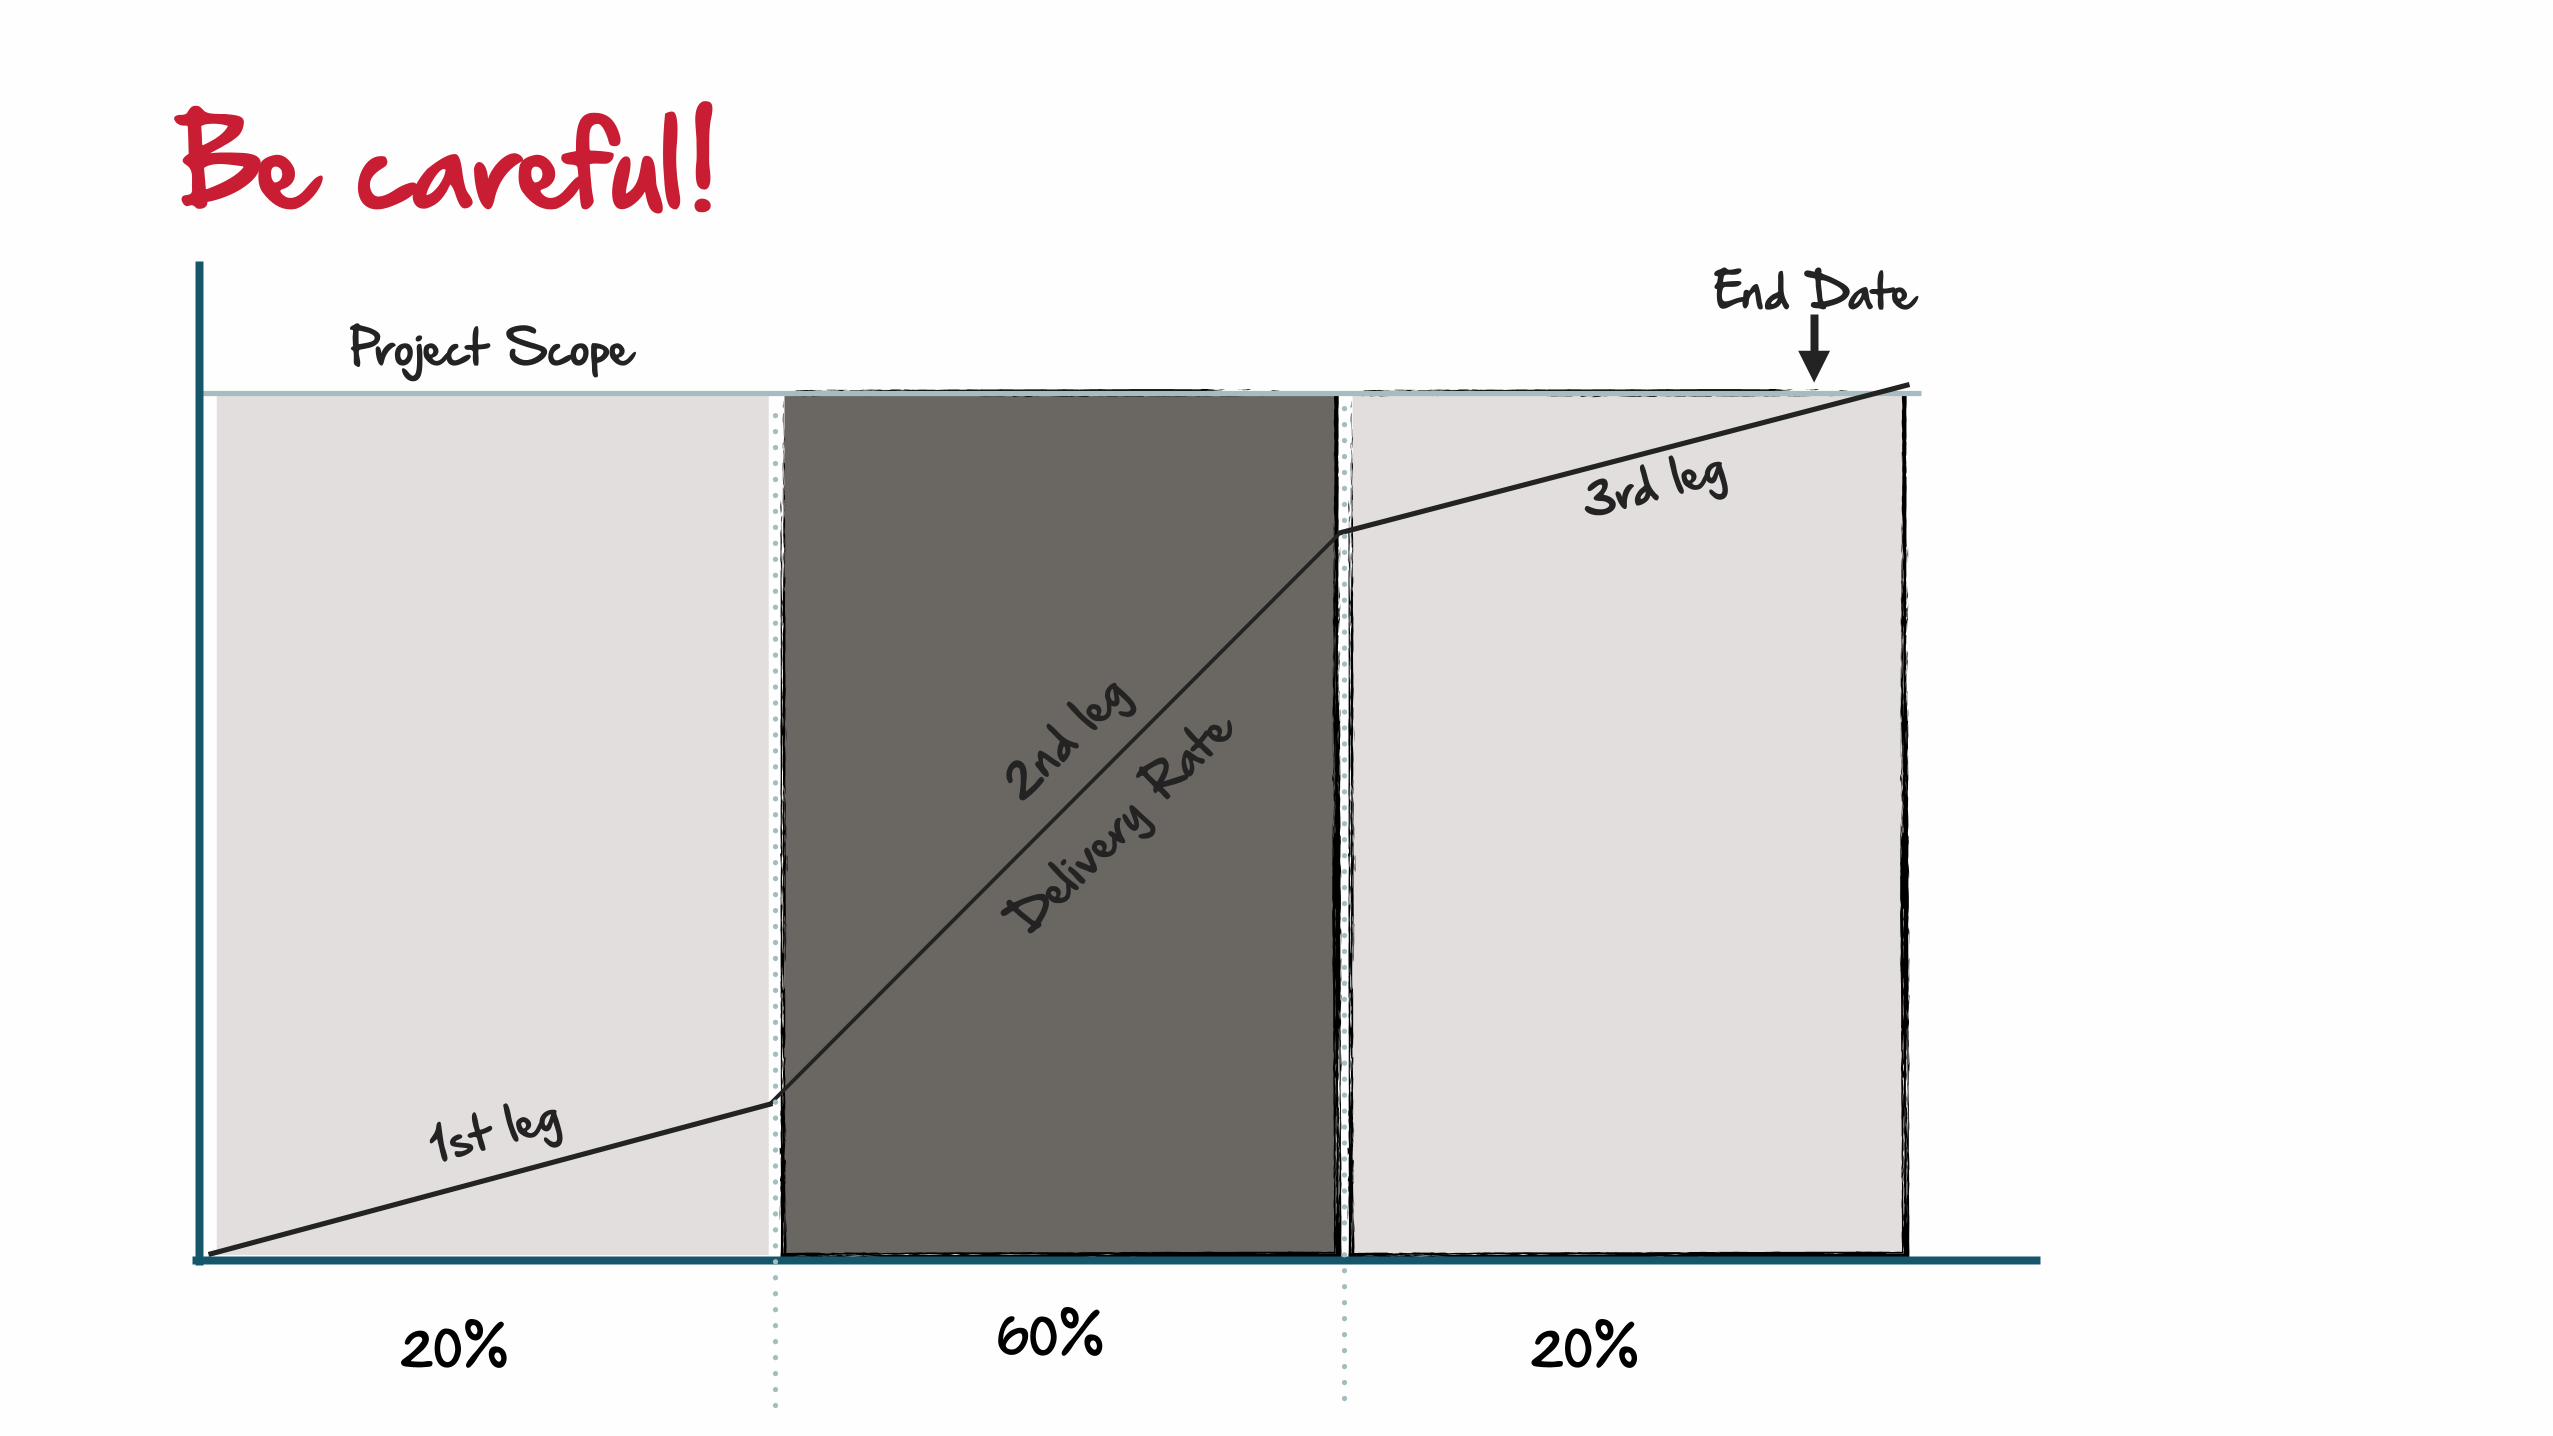
Be careful!
20% 20%60%
Project ScopeEnd Date
2nd le
g
1st leg
3rd leg
Delivery
Rate

Metrics can help you to better understand your
demand and capability
Metrics can help you calculate Service Level Expectations (SLEs)

Metrics can help you forecast your projects

Metrics to secure survival
Sustainability
Service-Oriented
Survivability
Kanban’s 3 Agendas
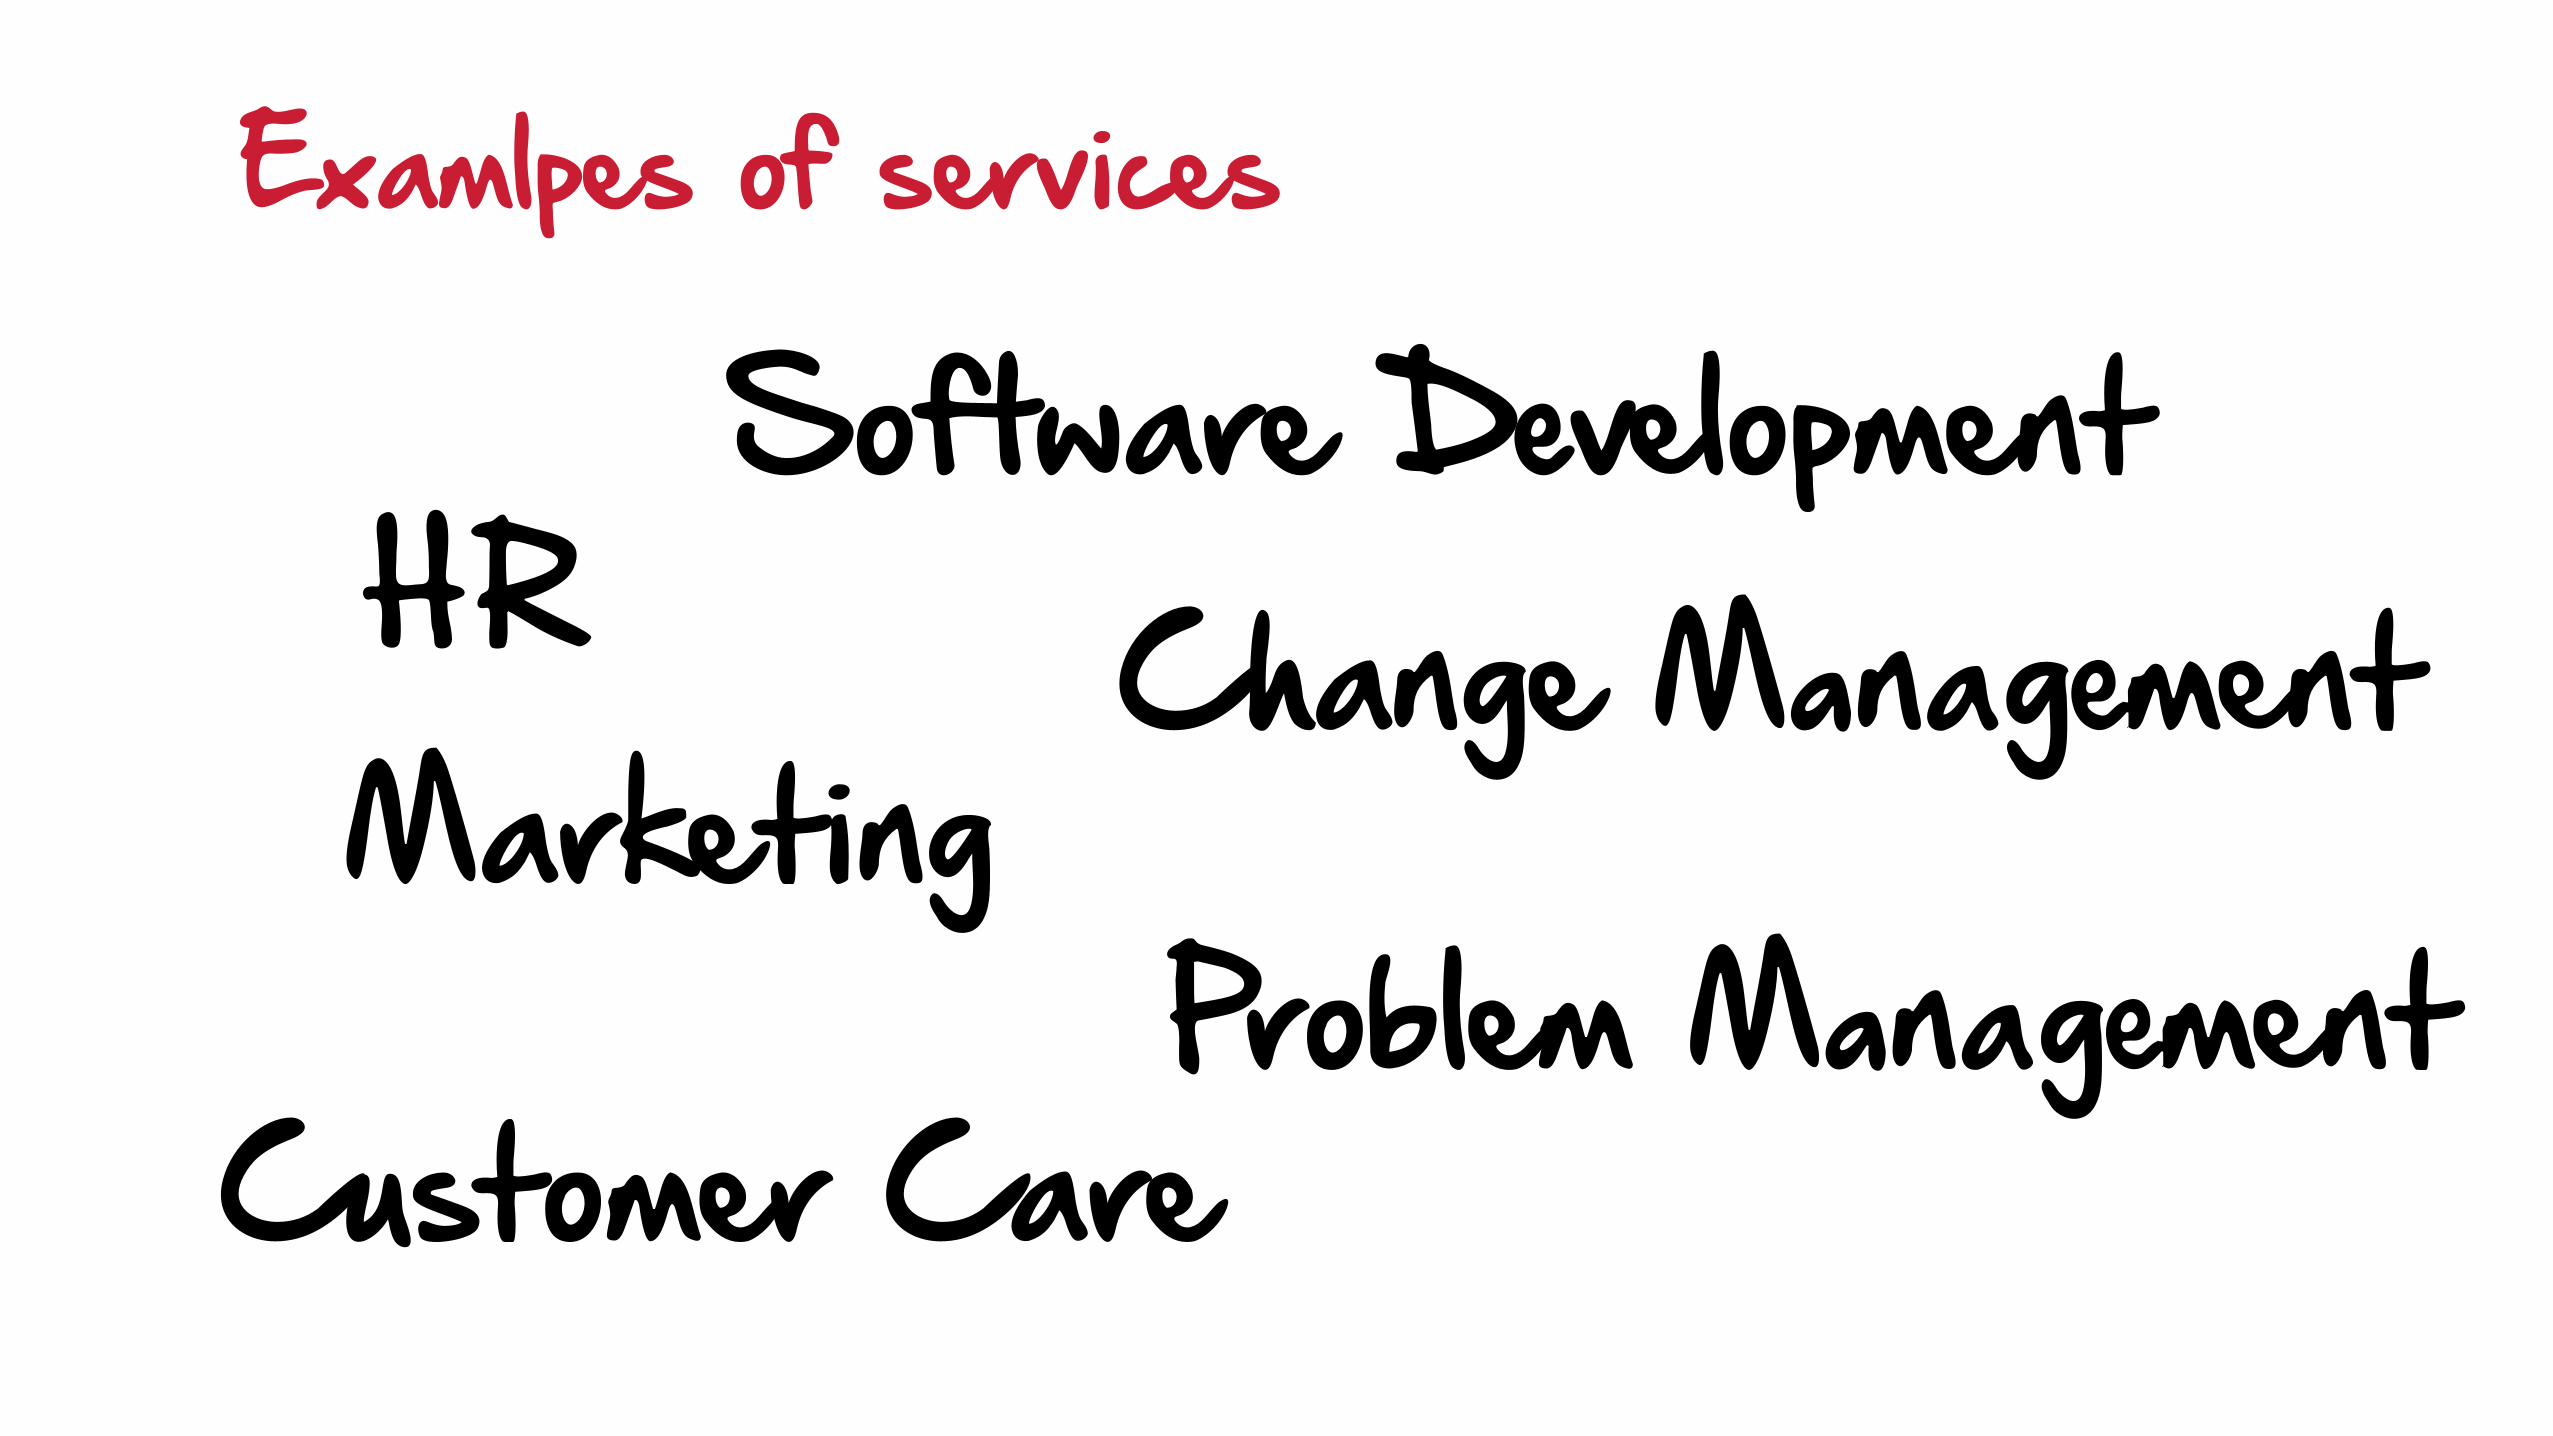
Examlpes of services
HRMarketing
Customer Care
Software DevelopmentChange Management
Problem Management
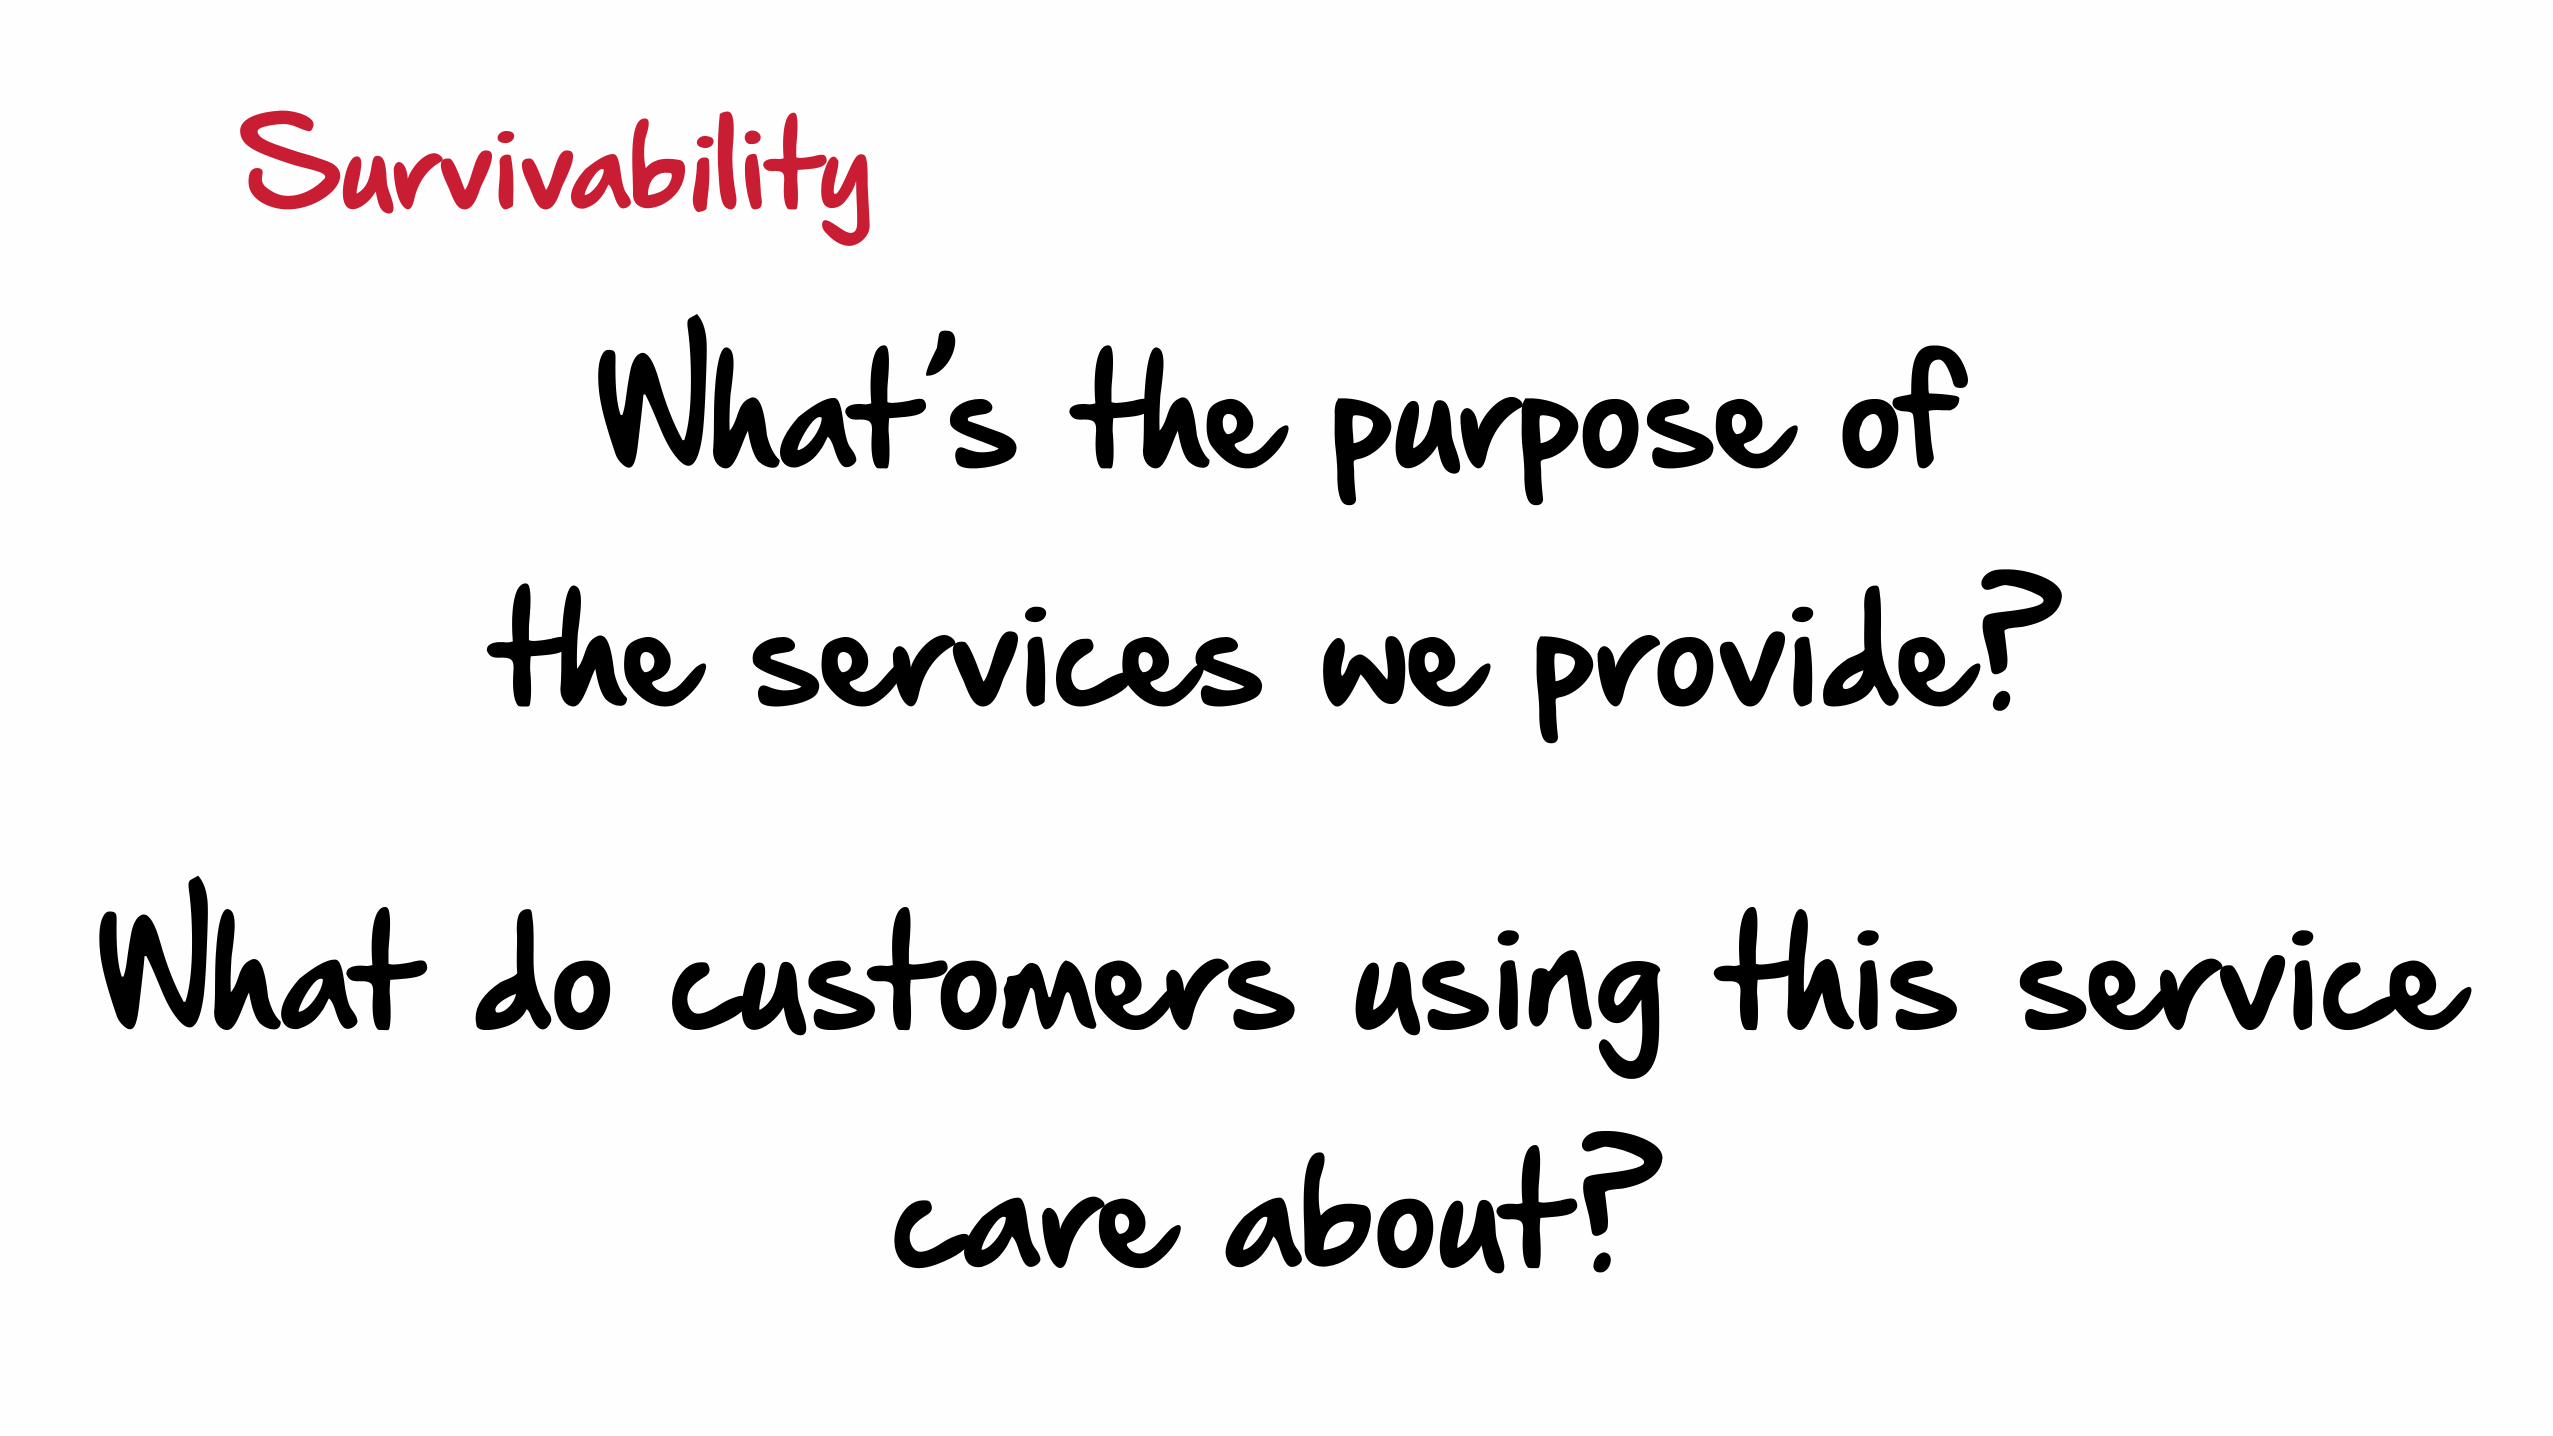
Survivability
What’s the purpose of the services we provide?
What do customers using this service care about?

What do customers using this service care about?
Make these your fitness criteria!
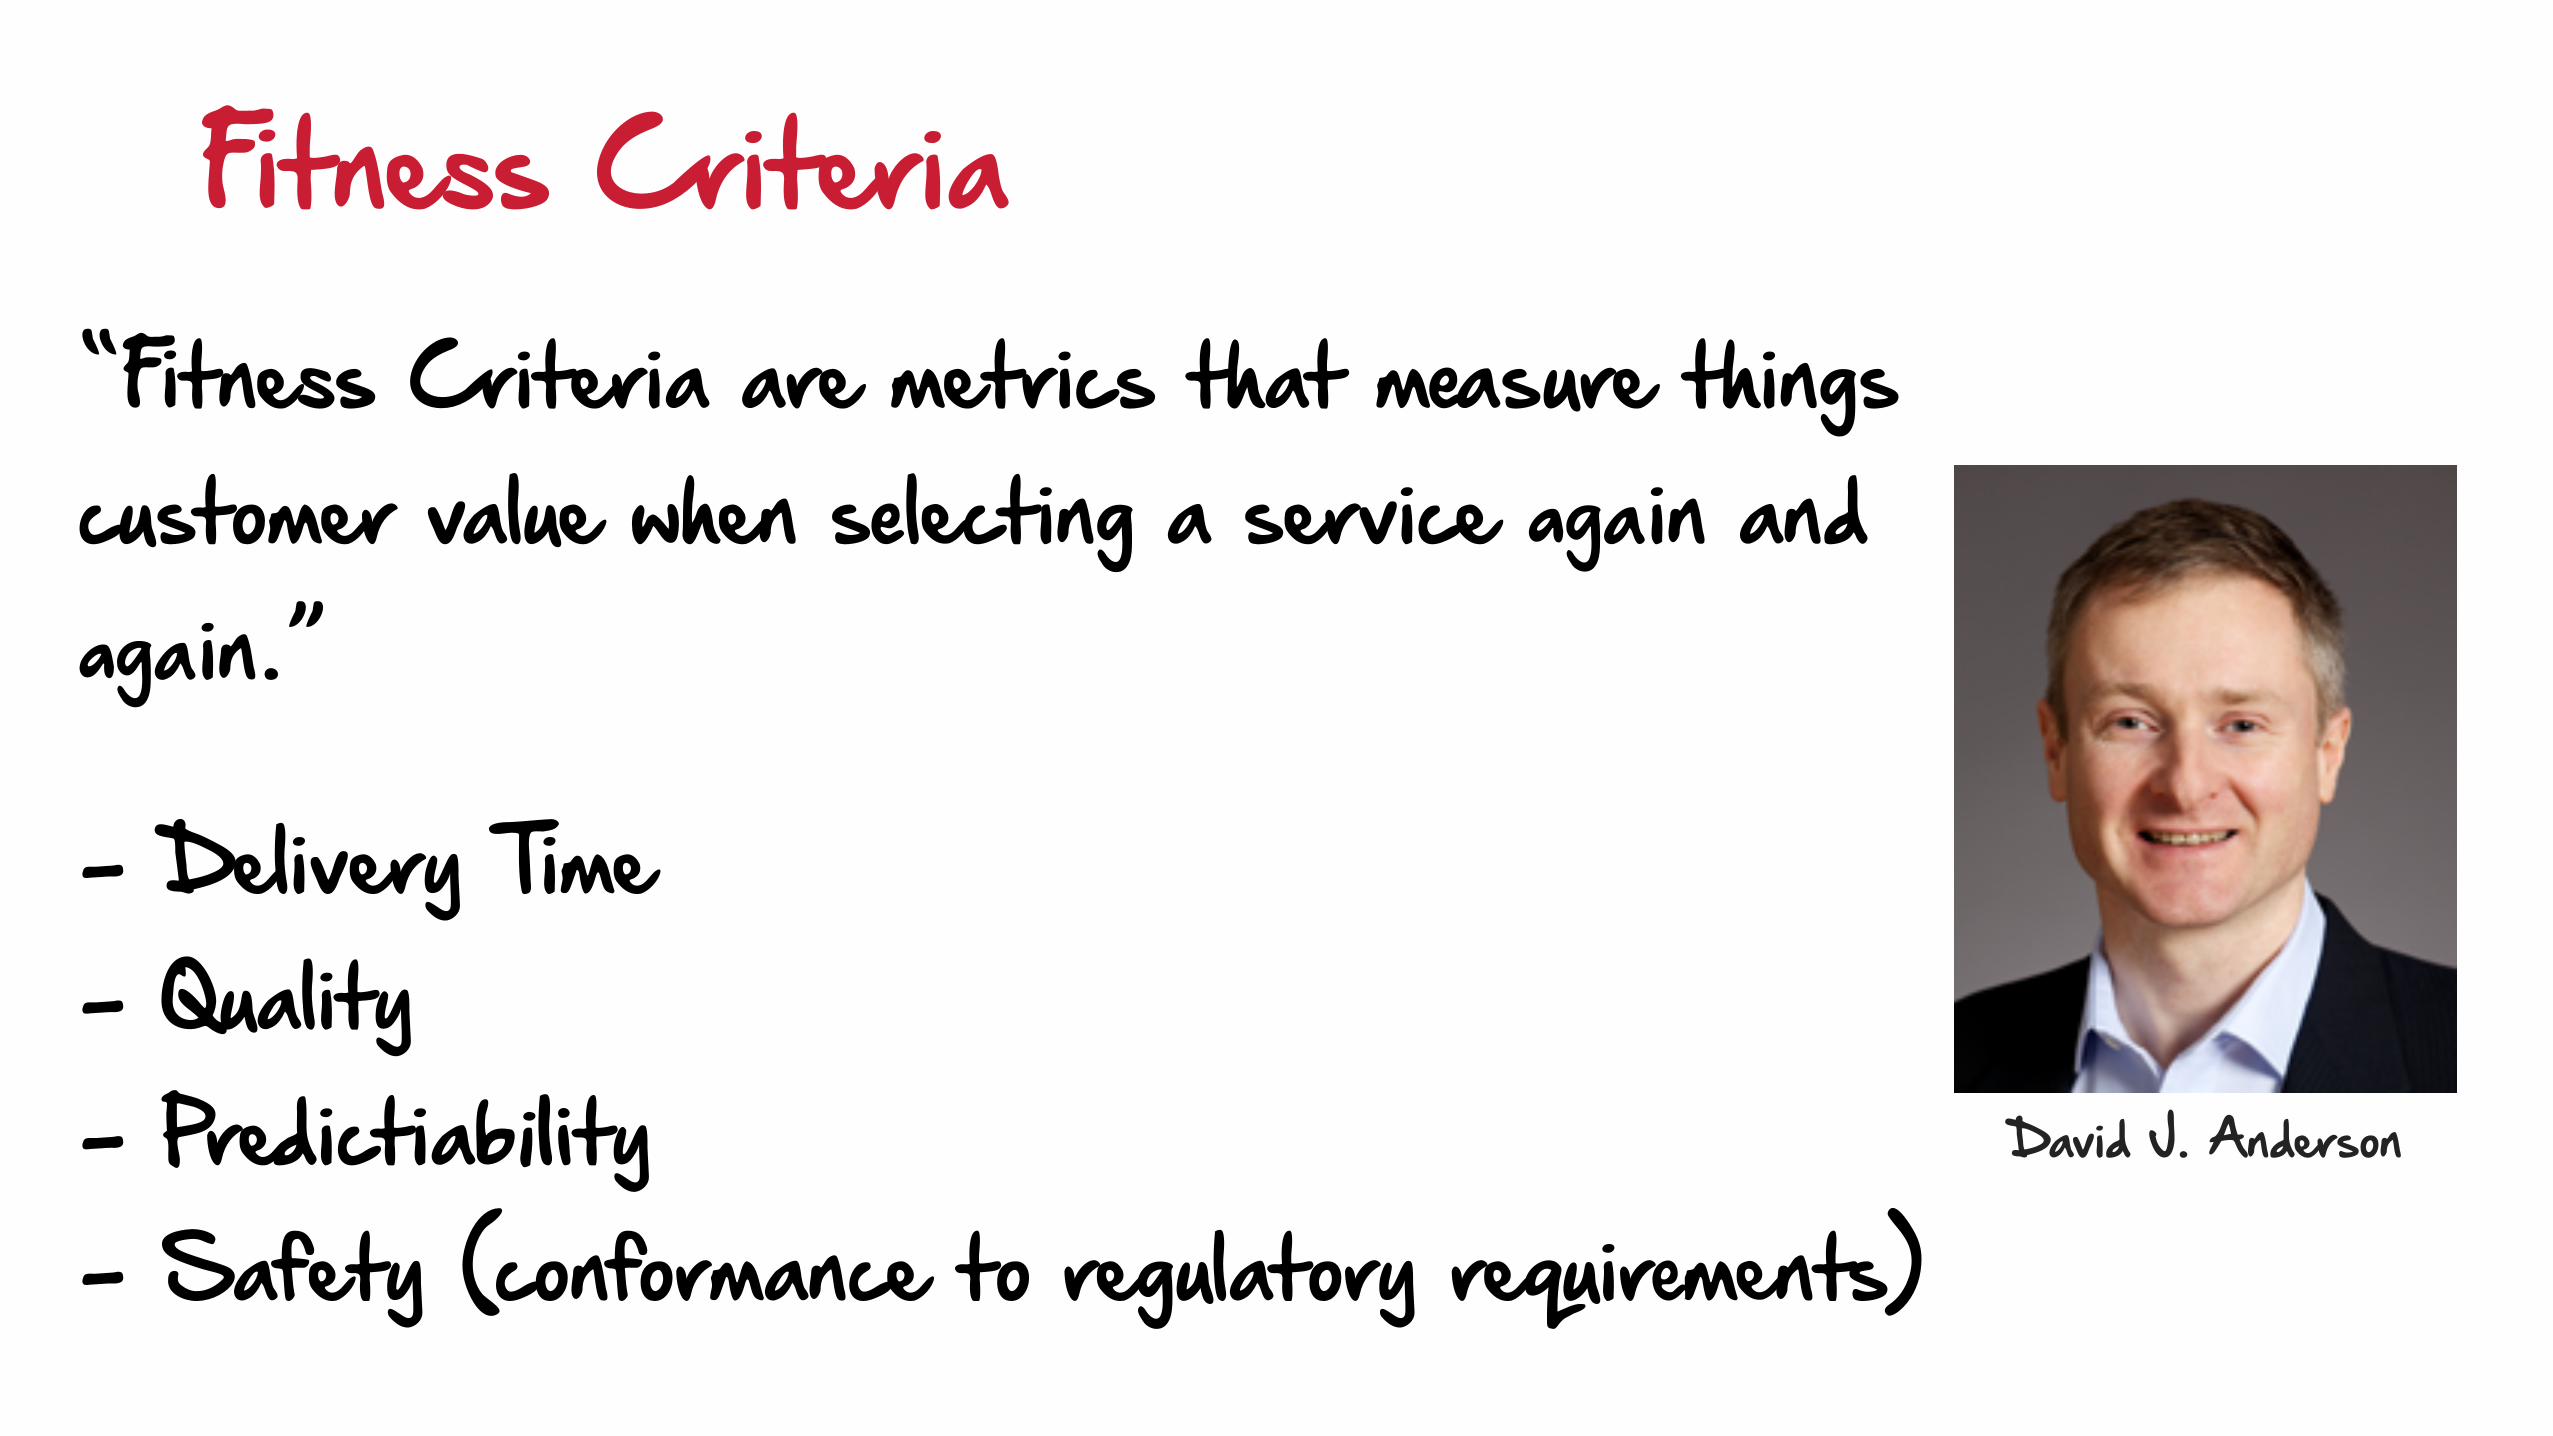
Fitness Criteria“Fitness Criteria are metrics that measure thingscustomer value when selecting a service again and again.”
- Delivery Time- Quality- Predictiability- Safety (conformance to regulatory requirements)
David J. Anderson

Make it your core metric you always measure!
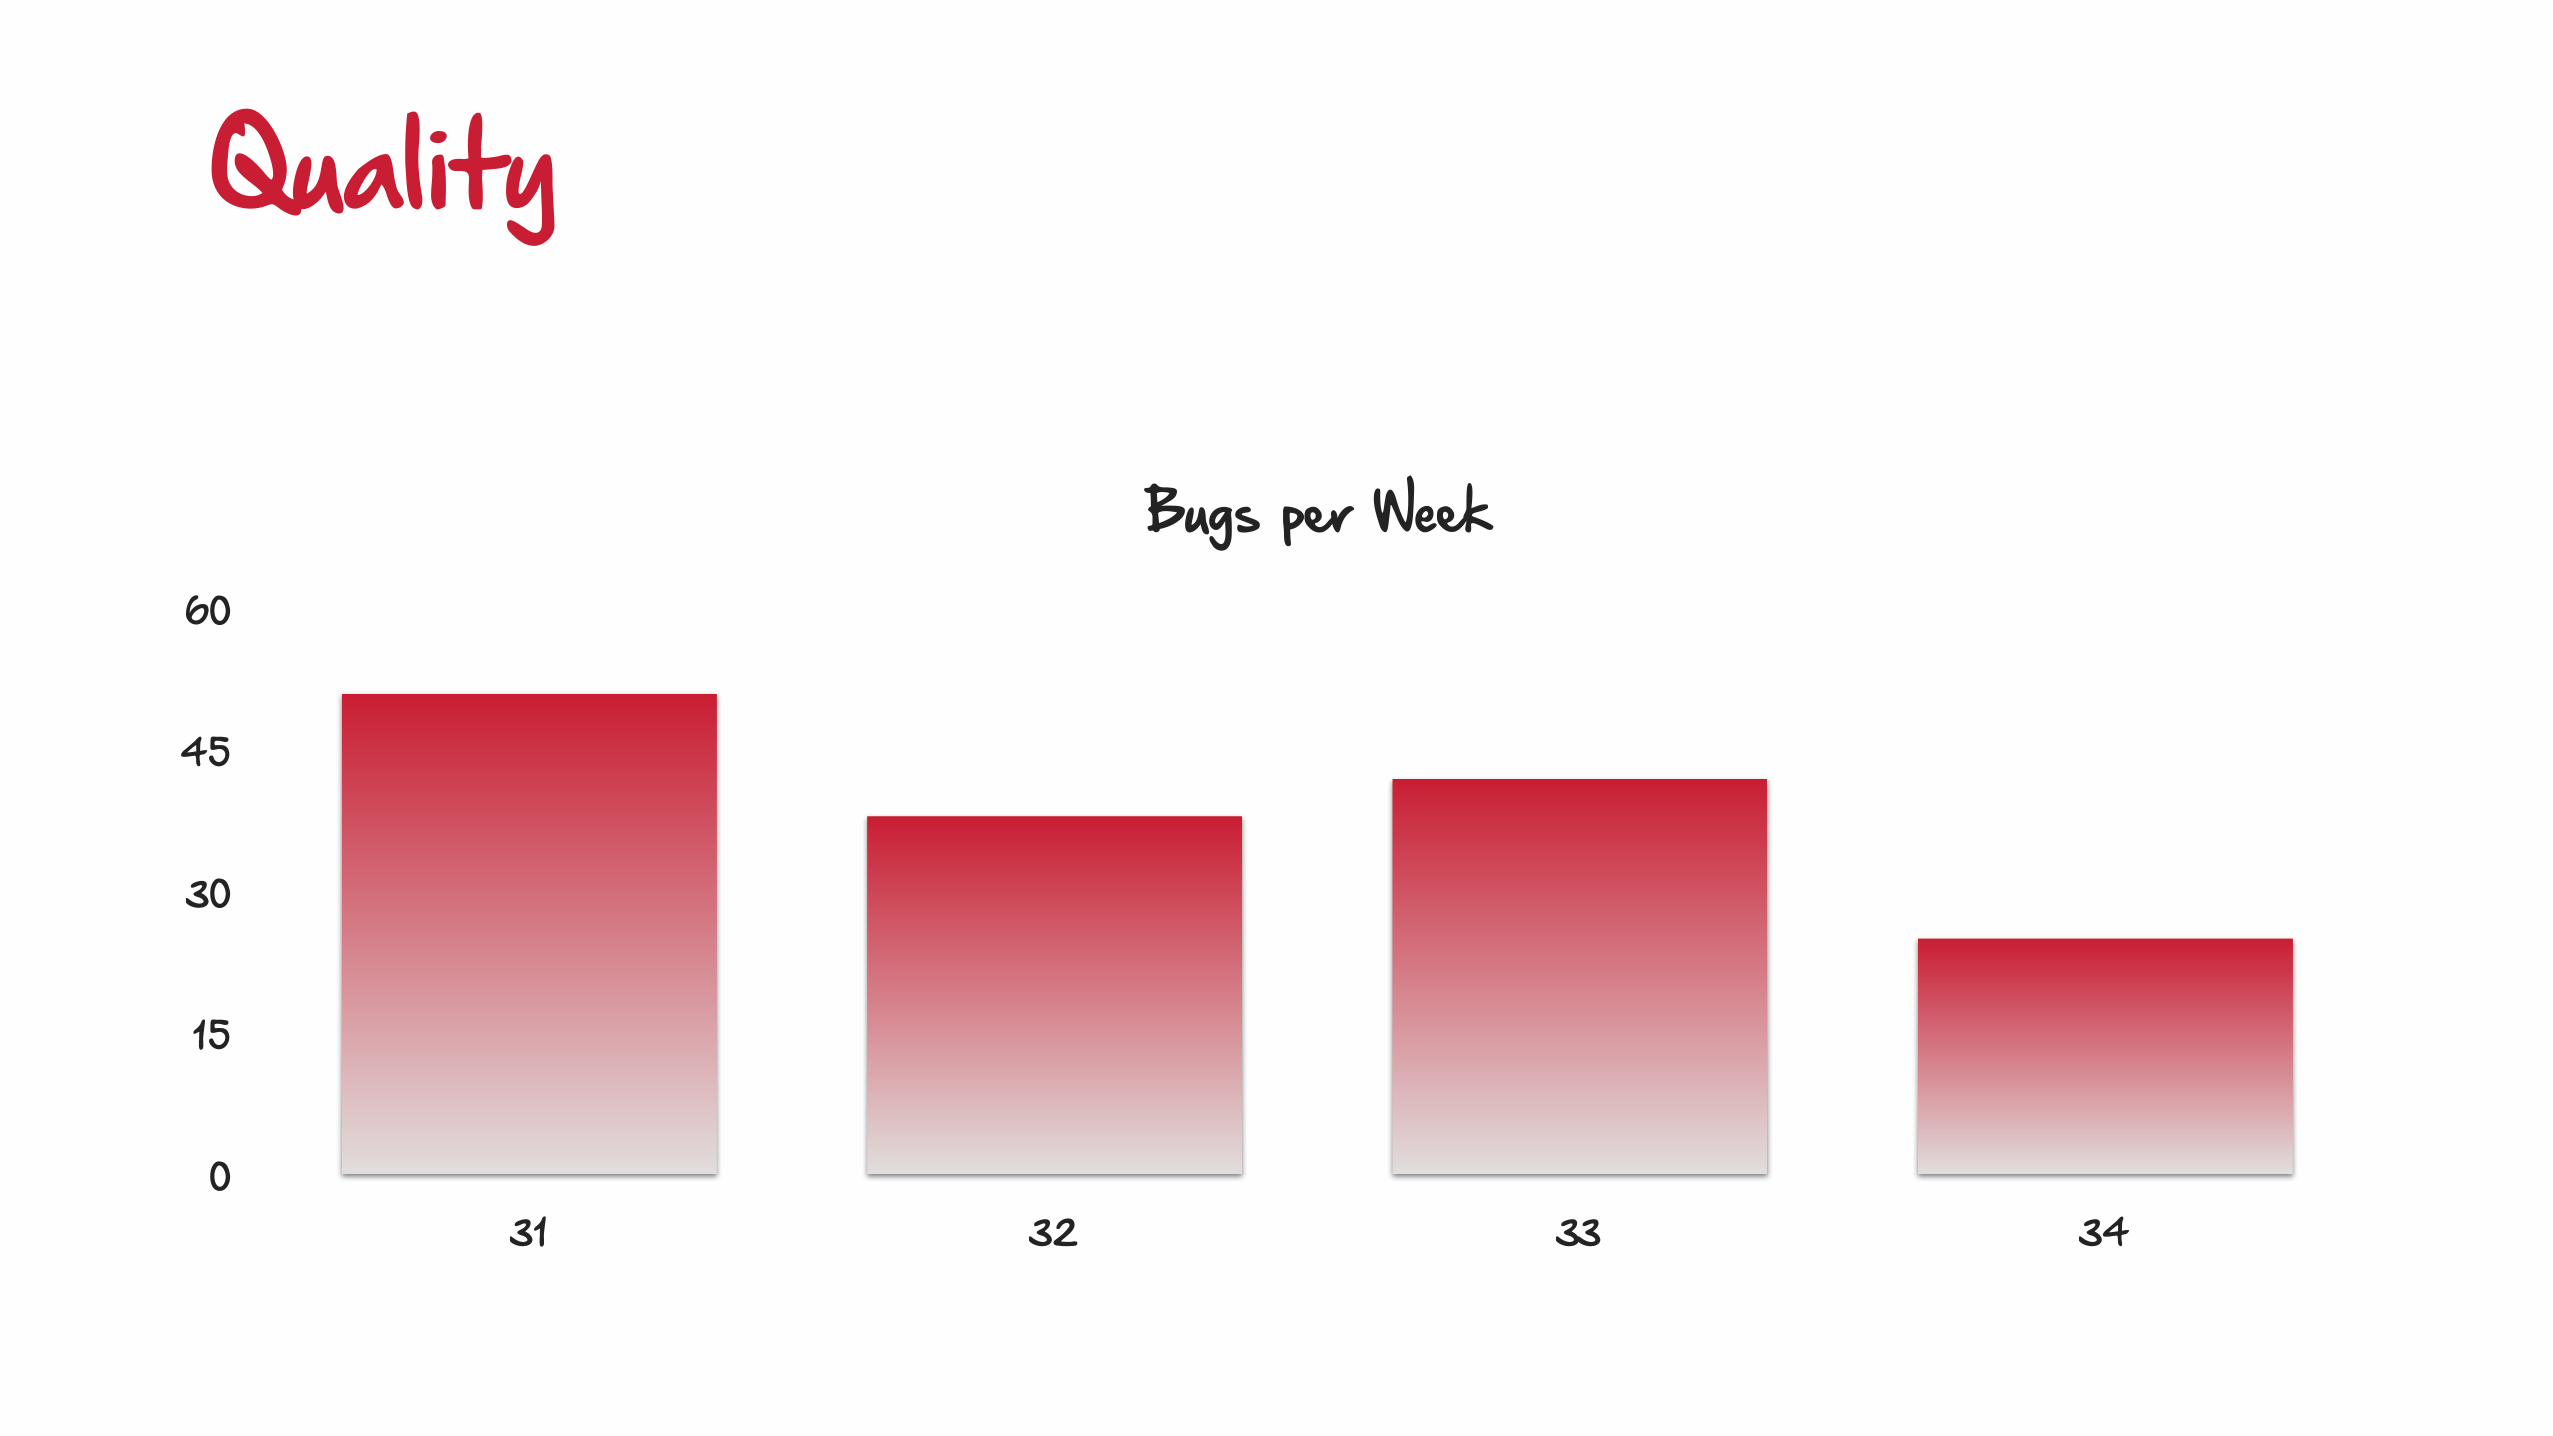
Quality
Bugs per Week
0
15
30
45
60
31 32 33 34
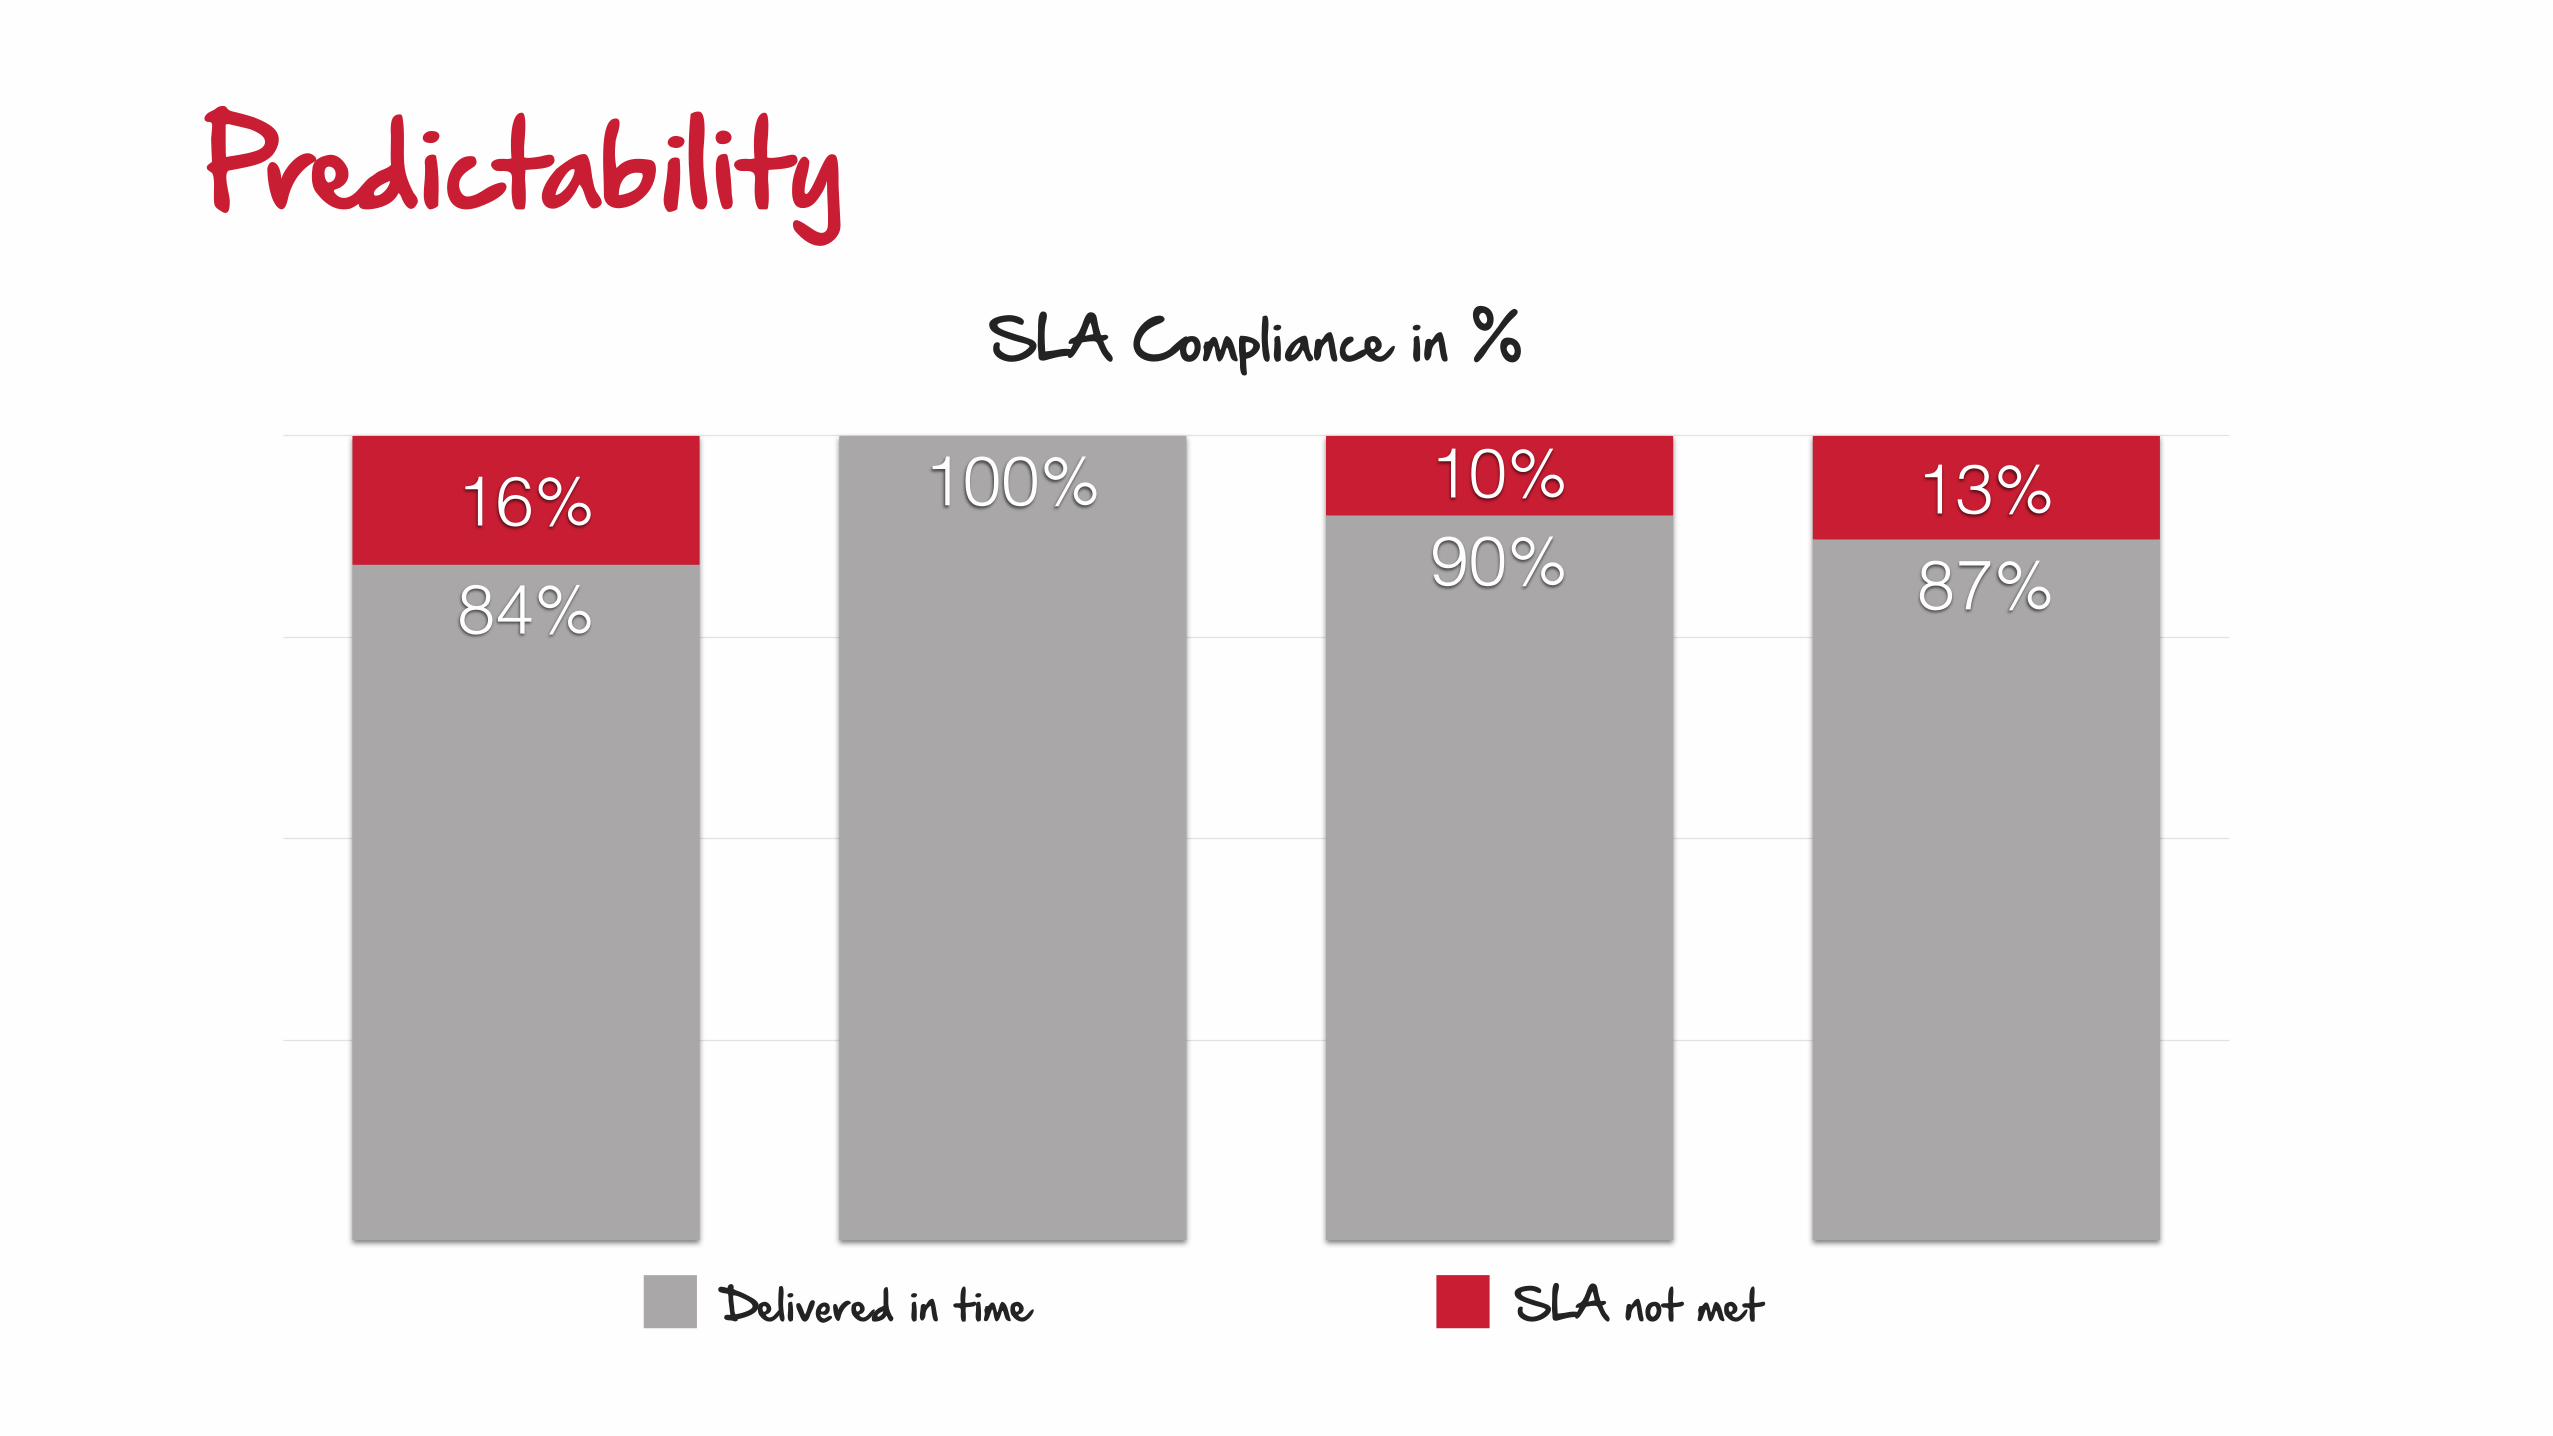
PredictabilitySLA Compliance in %
0
25
50
75
100
April May June July
13%10%16%87%90%
100%
84%
Delivered in time SLA not met
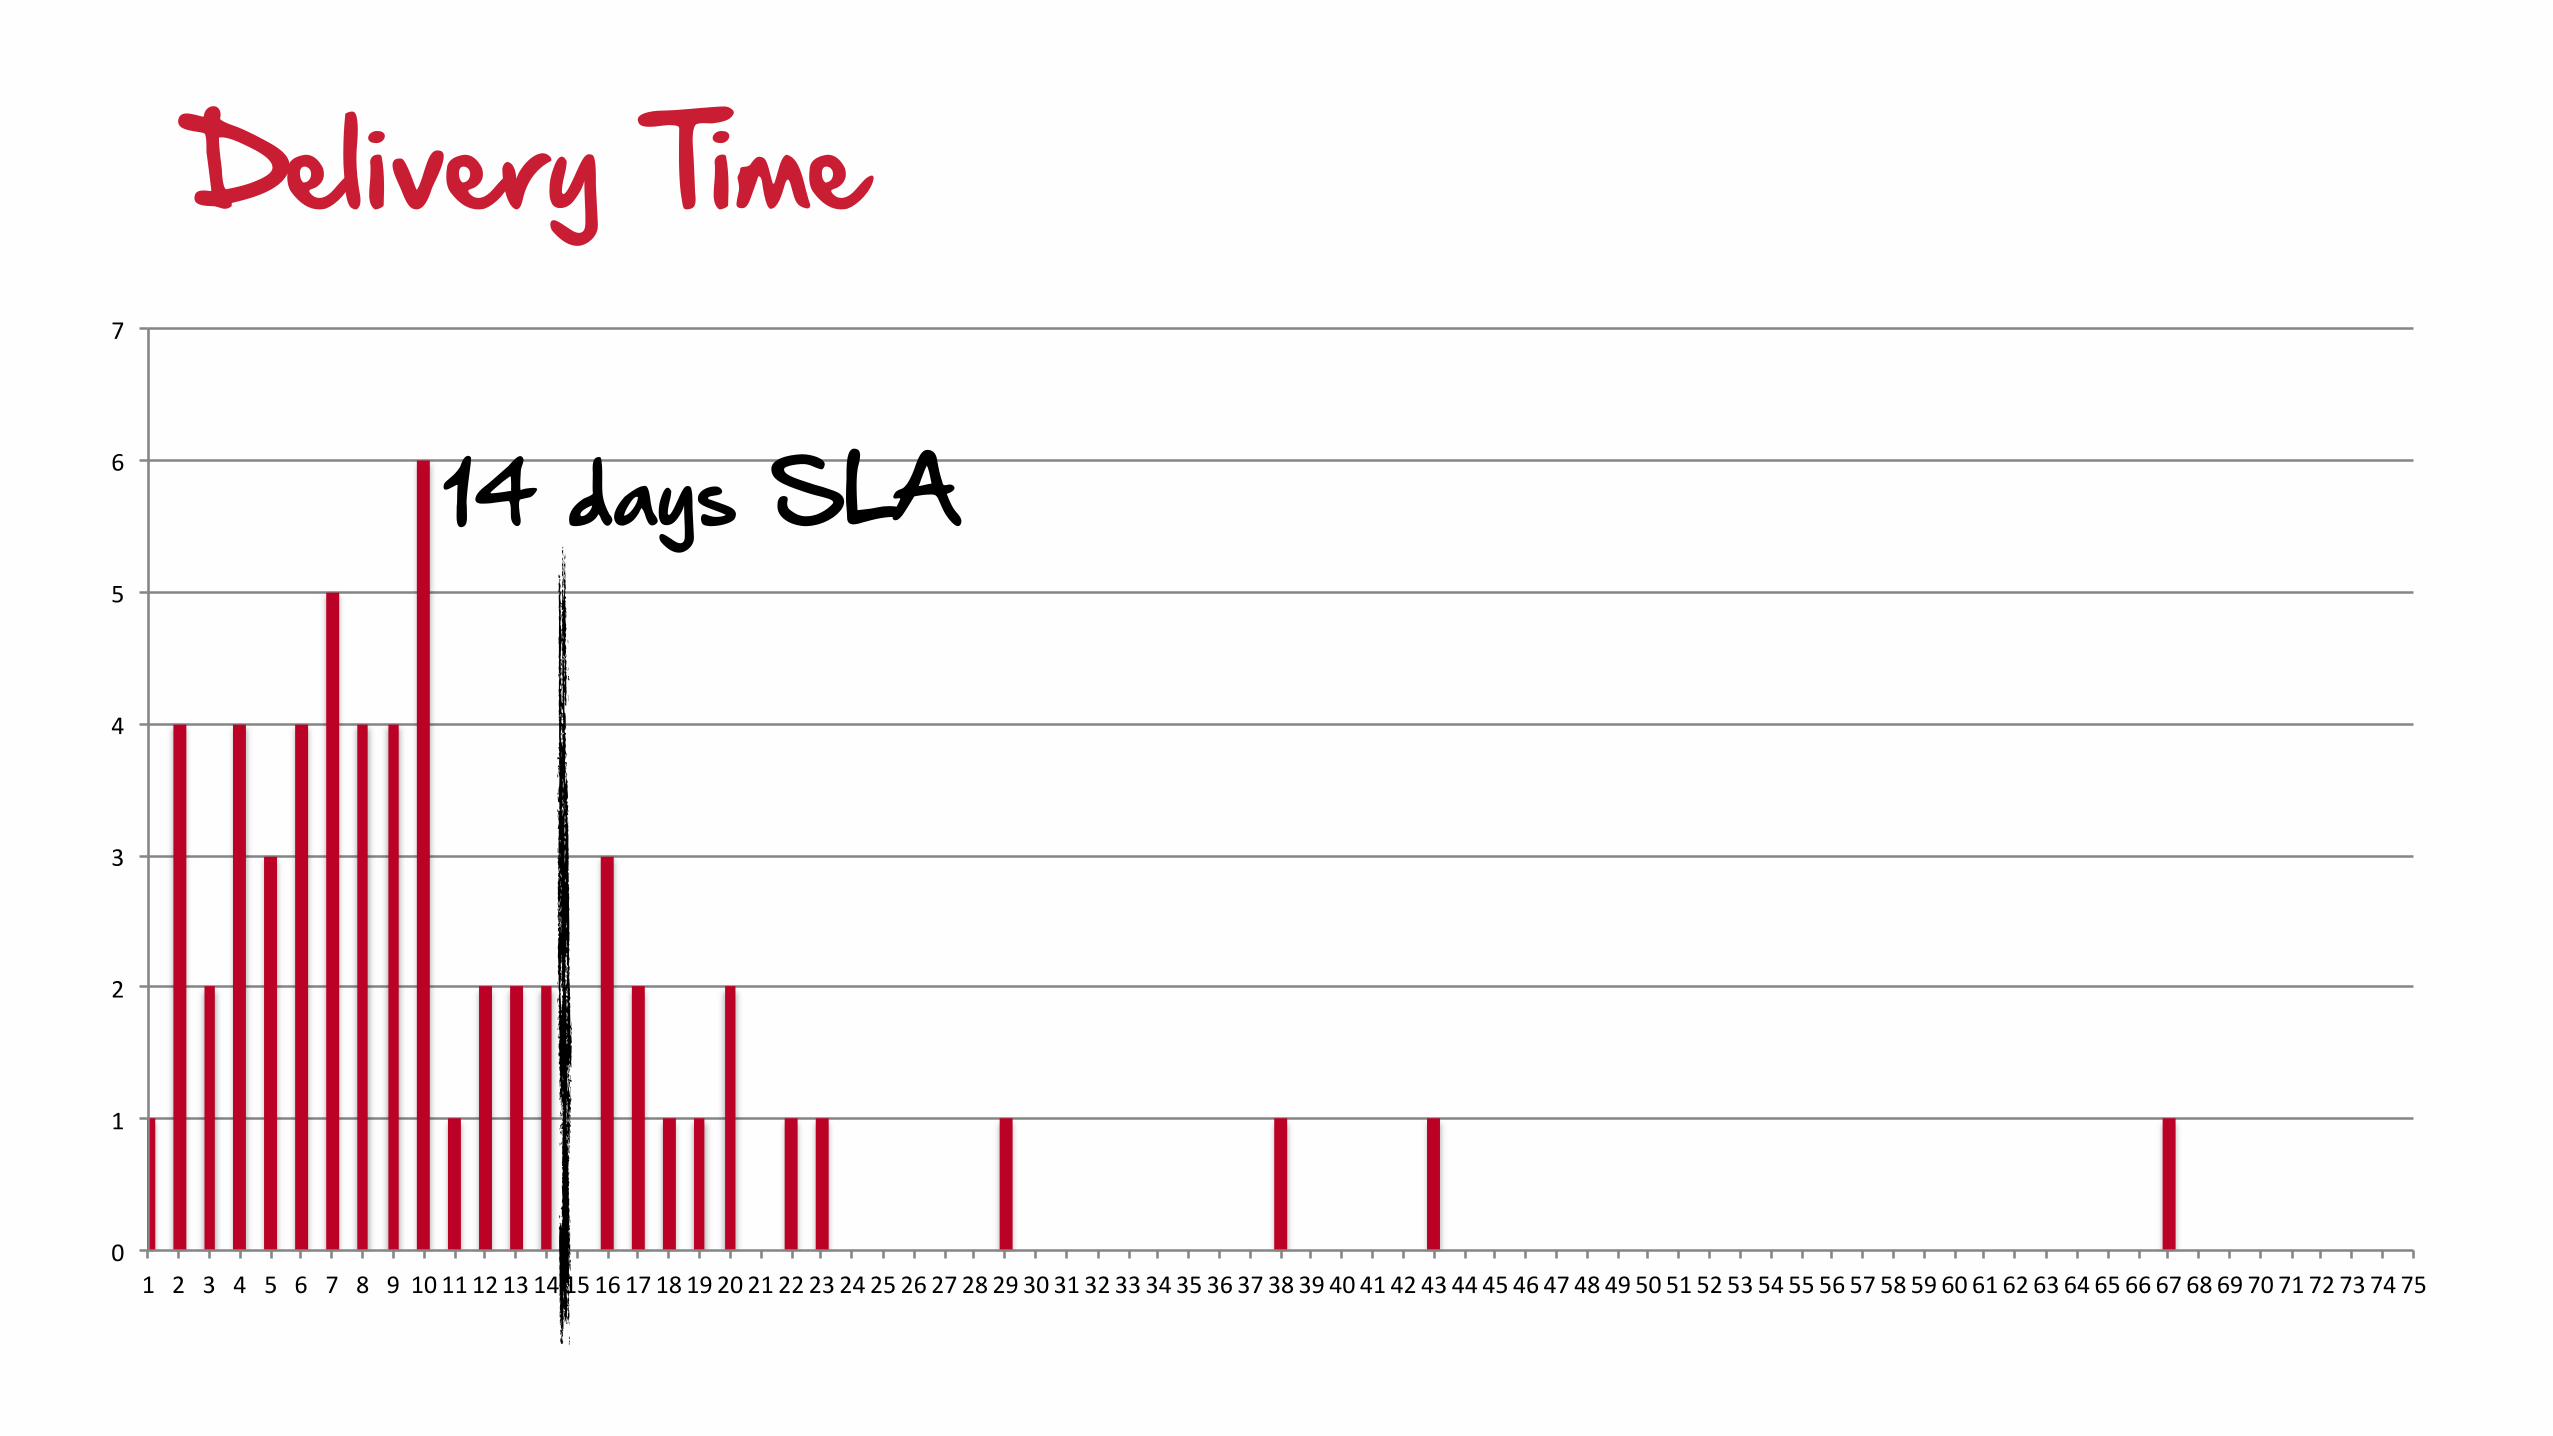
Delivery Time
0"
1"
2"
3"
4"
5"
6"
7"
1" 2" 3" 4" 5" 6" 7" 8" 9" 10"11"12"13"14"15"16"17"18"19"20"21"22"23"24"25"26"27"28"29"30"31"32"33"34"35"36"37"38"39"40"41"42"43"44"45"46"47"48"49"50"51"52"53"54"55"56"57"58"59"60"61"62"63"64"65"66"67"68"69"70"71"72"73"74"75"
14 days SLA
Metrics support changes

Metrics for improvements

Metrics for improvements

Metrics for improvements
Metrics can help to distinct between positive and negative changes from
an objective point of view
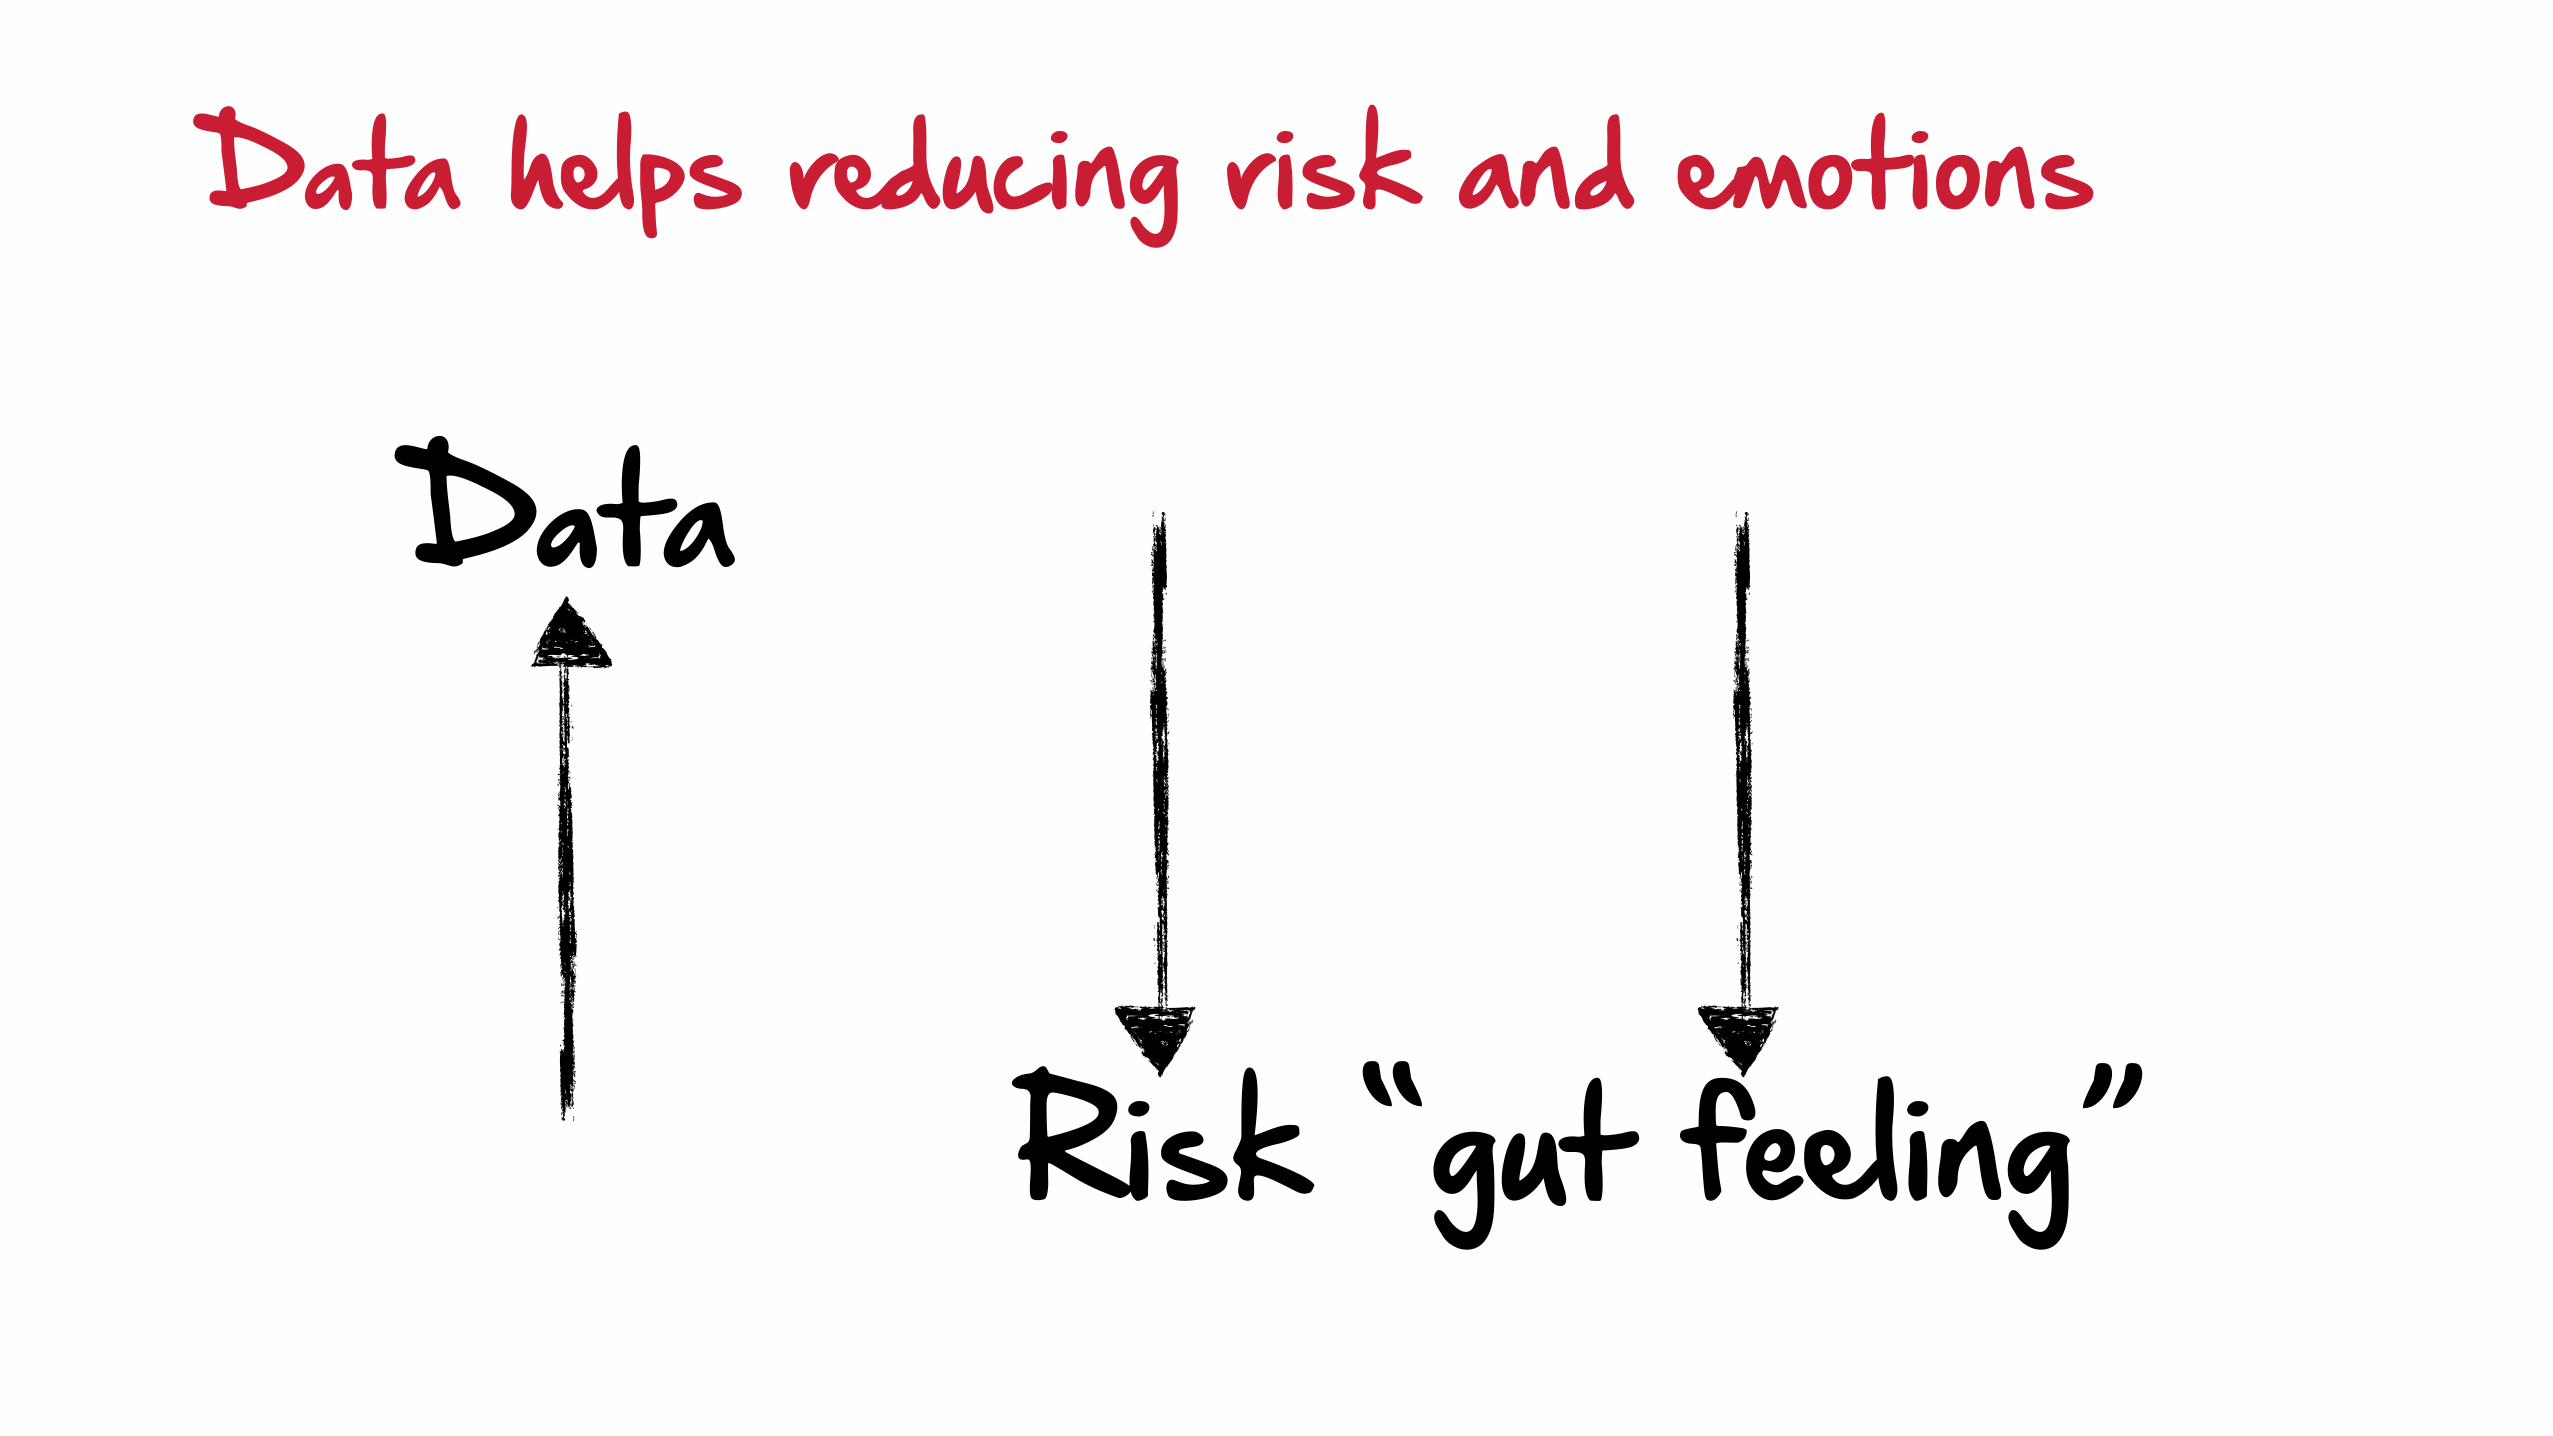
Data helps reducing risk and emotions
“gut feeling”Risk
Data

Troy Magennis at LKCE13’s speaker dinner
"Sometimes, you just have to roll back with your chair to take a second look from the back and make a good guess how the curve will end up."

"We do this only until we have enough data to provide better sample."
Troy Magennis at LKCE13’s speaker dinner
Always support change with measurements!
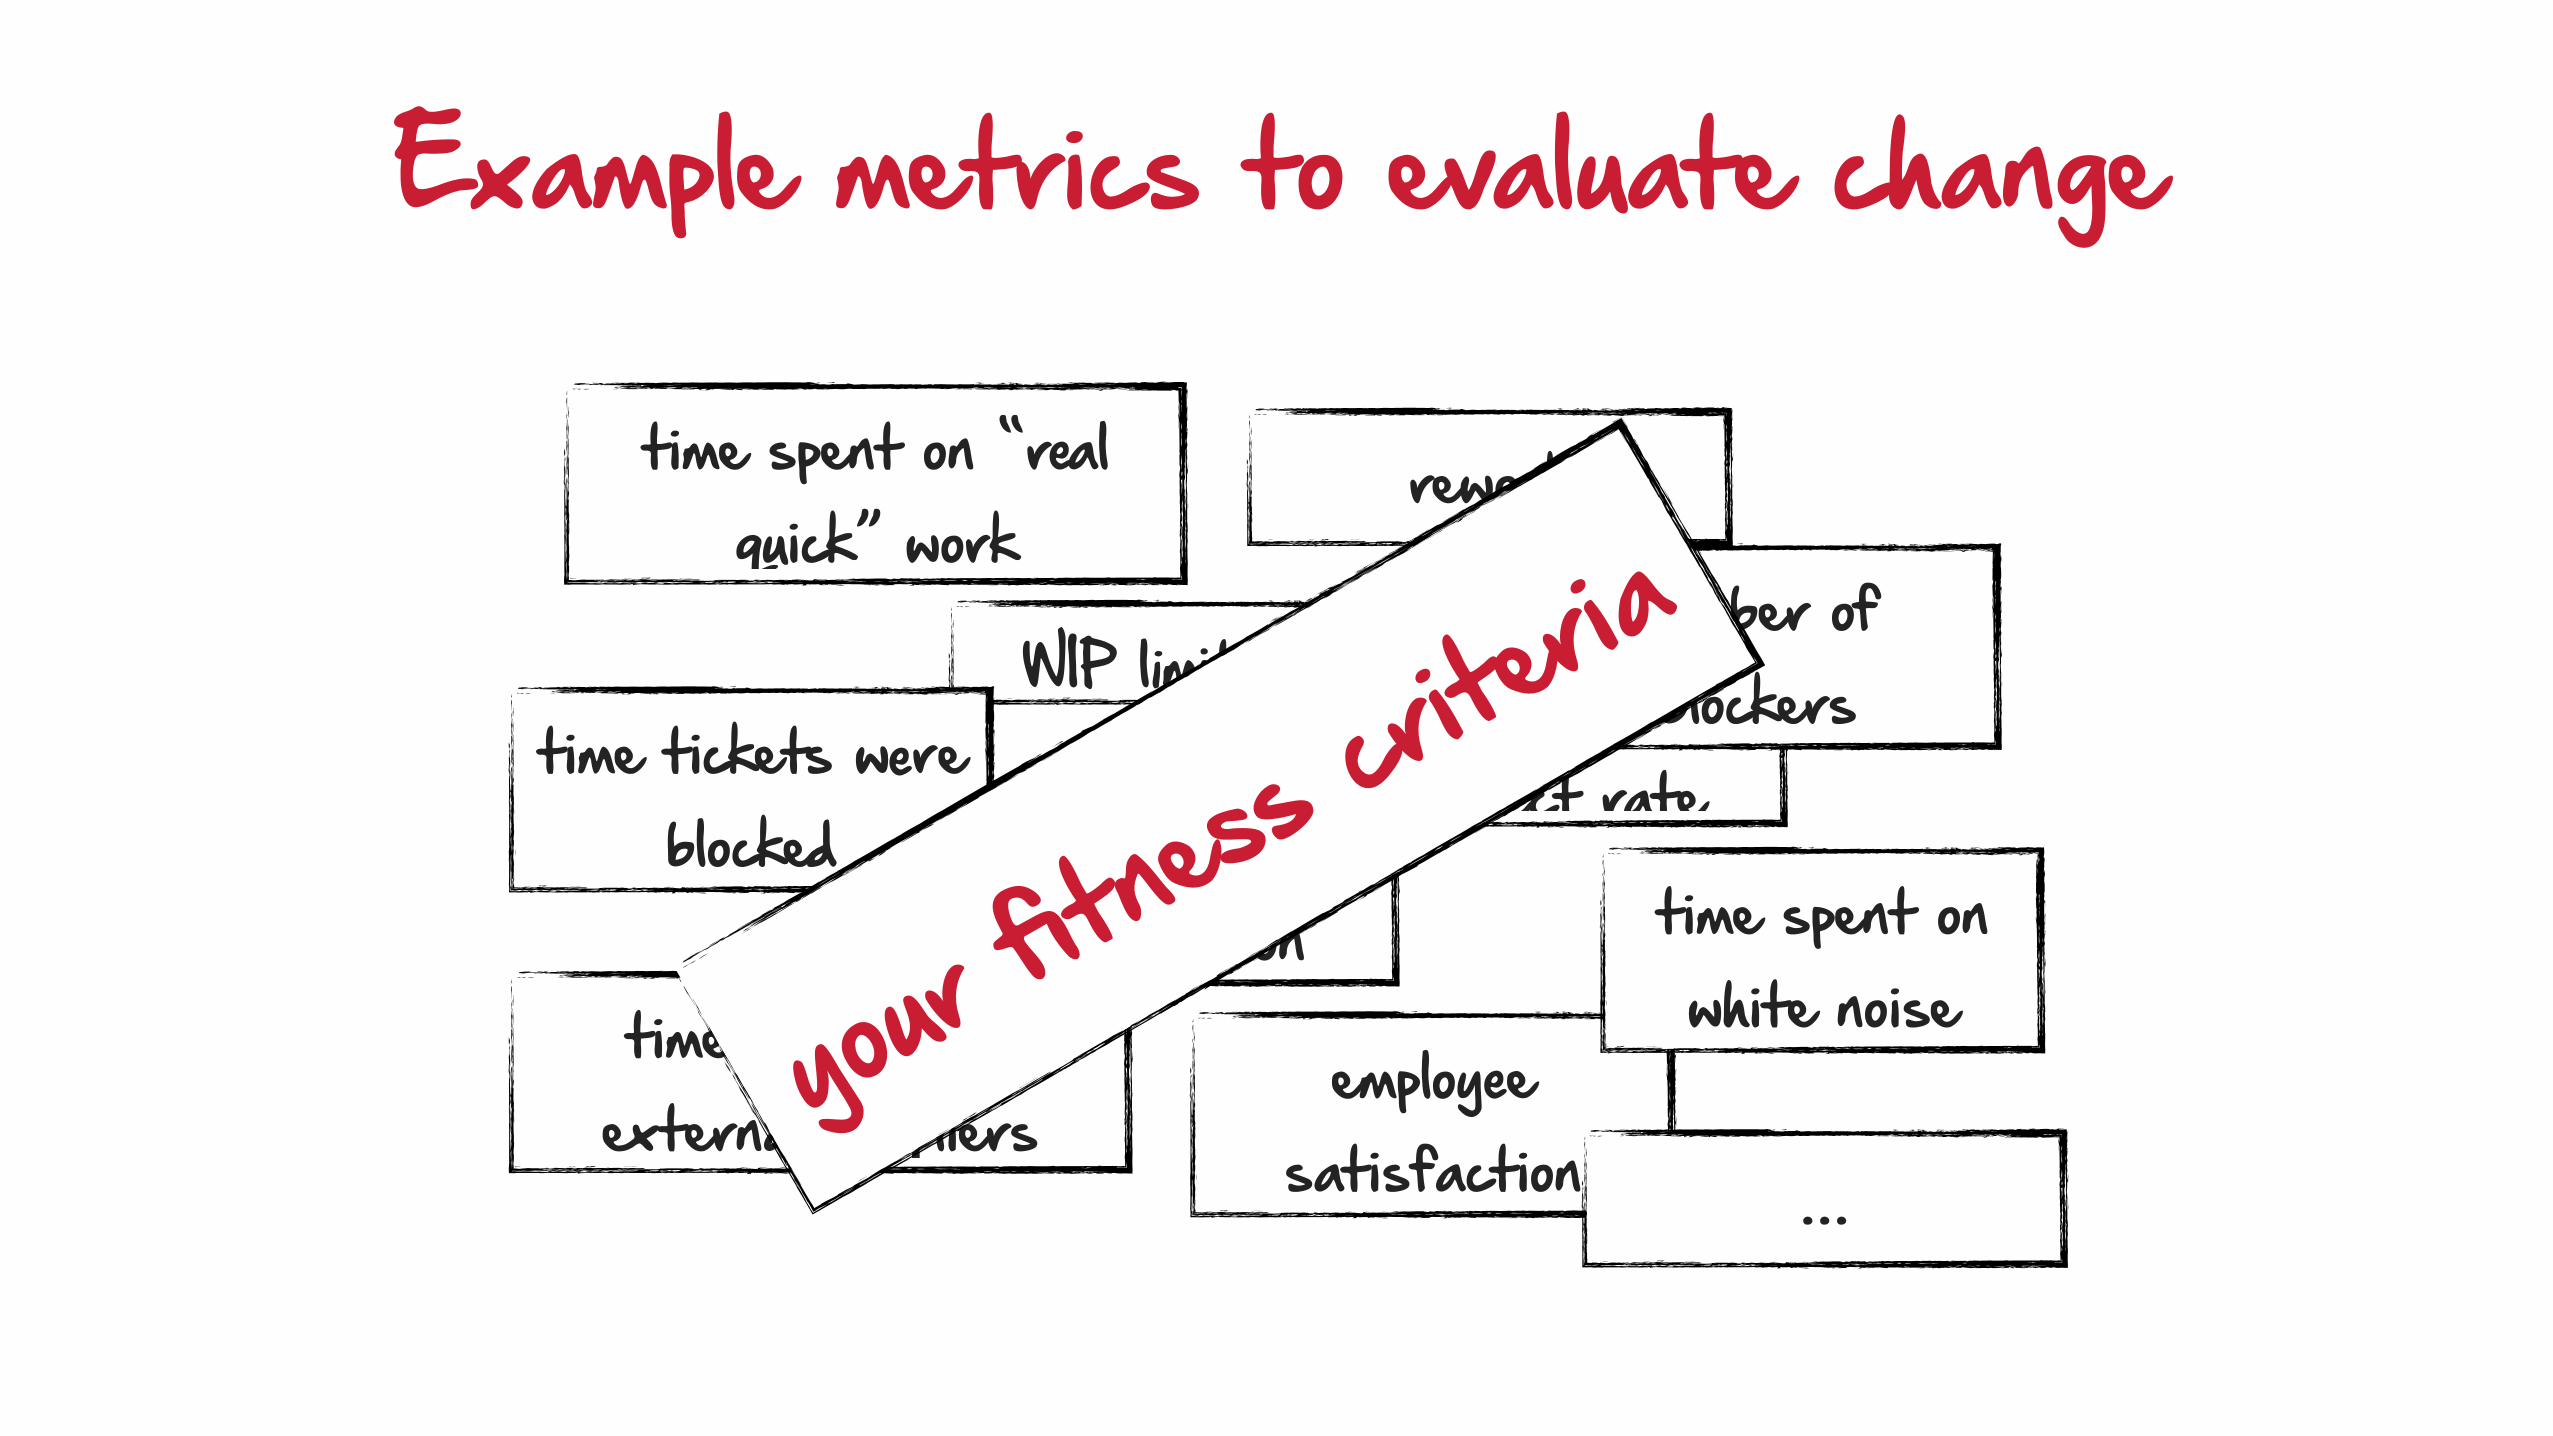
Example metrics to evaluate change
WIP limit breach
defect rate customer
satisfaction
employee satisfaction
number of blockers
time spent on “real quick” work
time tickets were blocked
time waiting for external suppliers
rework
time spent on white noise
…your
fitness crit
eria

Metrics for improvements
Not like that! Keep it simple!
Metrics for improvements
Creator Markus Beyer - Thank you!

Regularly check your metrics, whether they have become obsolete!
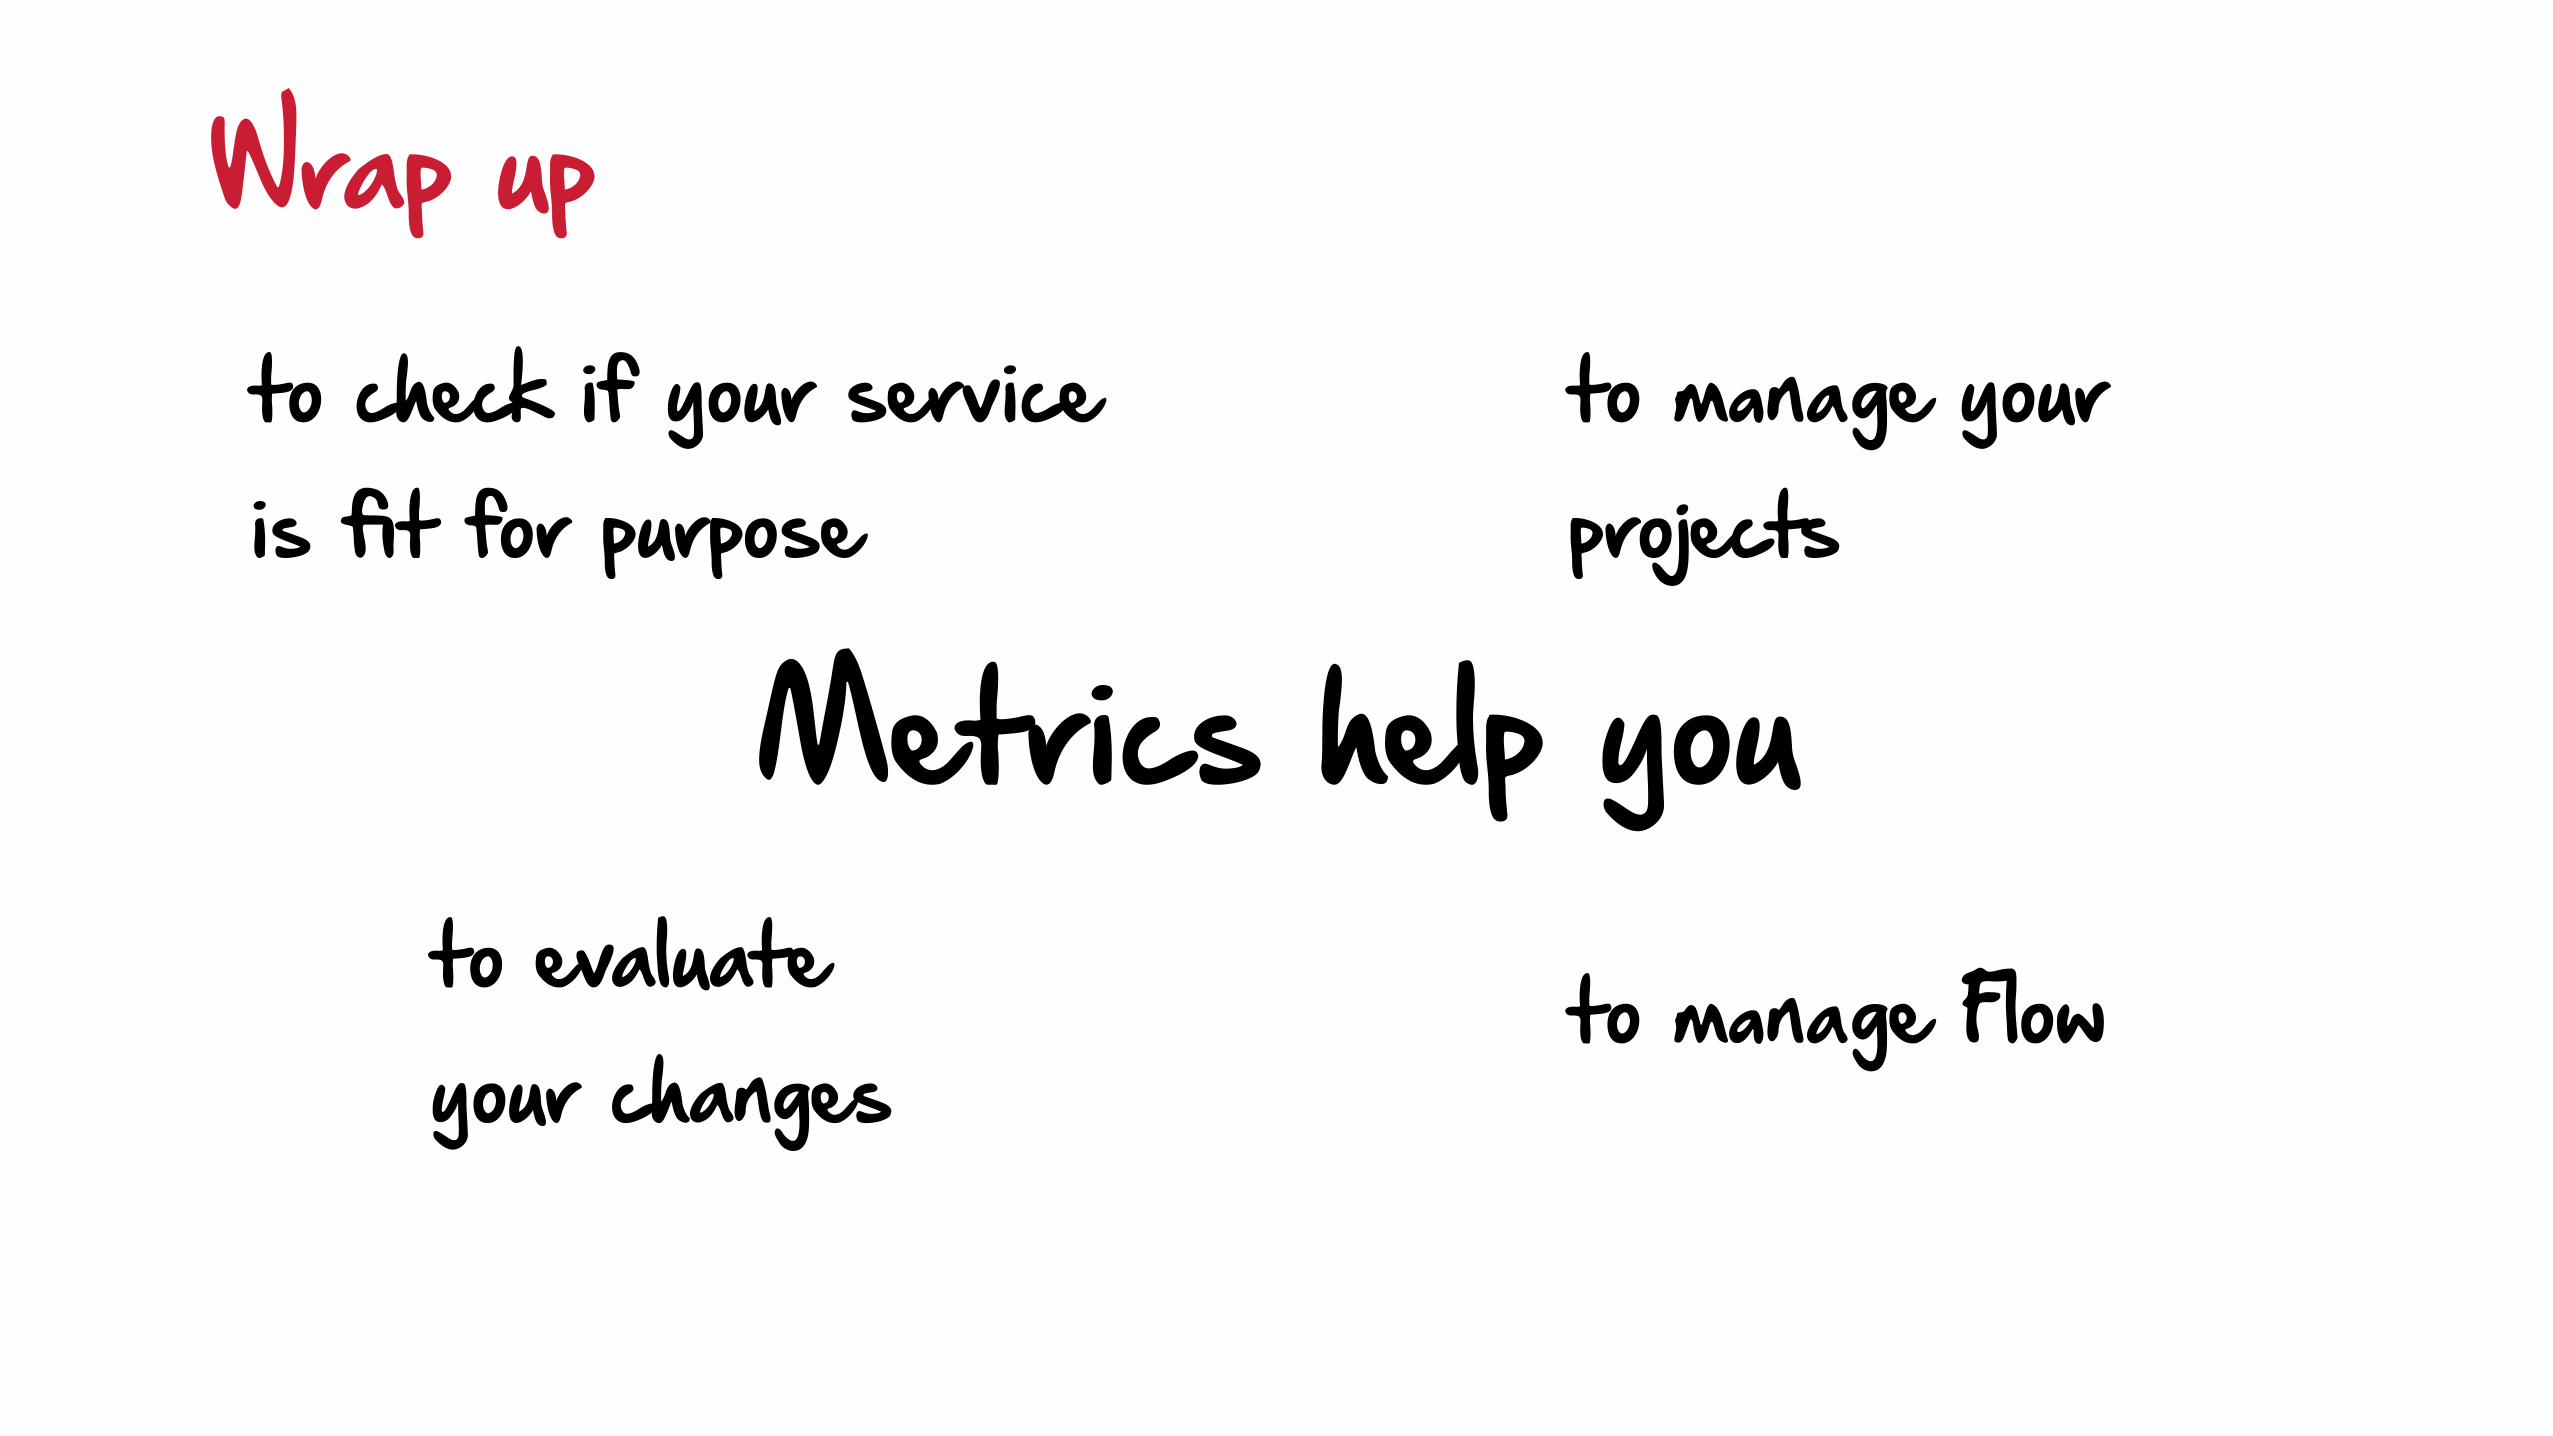
Wrap upto check if your service is fit for purpose
Metrics help youto evaluate your changes
to manage your projects
to manage Flow

Collect data now! It’s easy as 1-2-3!