by rym ayadi, sami ben naceur, barbara casu, and barry quinn · wp/15/100 does basel compliance...
TRANSCRIPT
WP/15/100
Does Basel Compliance Matter for Bank Performance?
by Rym Ayadi, Sami Ben Naceur, Barbara Casu, and Barry Quinn
© 2015 International Monetary Fund WP/15/100
IMF Working Paper
Institute for Capacity Development
Does Basel Compliance Matter for Bank Performance?1
Prepared by Rym Ayadi2, Sami Ben Naceur, Barbara Casu,3 and Barry Quinn4
Authorized for distribution by Oussama Kanaan
May 2015
Abstract
The global financial crisis underscored the importance of regulation and supervision to a well-
functioning banking system that efficiently channels financial resources into investment. In this
paper, we contribute to the ongoing policy debate by assessing whether compliance with
international regulatory standards and protocols enchances bank operating efficiency. We focus
specifically on the adoption of international capital standards and the Basel Core Principles for
Effective Bank Supervision (BCP). The relationship between bank efficiency and regulatory
compliance is investigated using the (Simar and Wilson 2007) double bootstrapping approach
on an international sample of publicly listed banks. Our results indicate that overall BCP
compliance, or indeed compliance with any of its individual chapters, has no association with
bank efficiency.
JEL Classification Numbers: G21, G18, C24
Keywords: BCP, Efficiency, Regulatory Compliance
Author’s E-Mail Address: [email protected] ; [email protected] ; [email protected] ;
1 We are grateful to Mario Catalan (MCM), Pierpaolo Grippa (MCM), Damien Puy (RES), and Natalia Tamirisa
(MCD) for their useful comments and feedback. Cecilia Prado and Kia Penso (both from MCD) provided excellent
editorial assistance.
2 Professor in International Financial Systems and Director of International Research Centre on Cooperative Finance,
HEC Montreal, University of Montreal Canada.
3 Reader in Banking, Cass Business School, University of London, UK.
4 Lecturer Queen's University Management School, Queen’s University, Ireland.
IMF Working Papers describe research in progress by the author(s) and are published to elicit
comments and to encourage debate. The views expressed in IMF Working Papers are those of the
author(s) and do not necessarily represent the views of the IMF, its Executive Board, or IMF
management.
2
Contents Page
I. Introduction ............................................................................................................................3
II. Data & Methodology .............................................................................................................6
A. The Sample ...............................................................................................................7 B. Empirical Set Up and Variable Definitions ...............................................................8 C. Estimating Bank Efficiency ......................................................................................9 D. Definition of Inputs and Outputs ............................................................................12 E. Measuring Bank Compliance ..................................................................................13 F. Enviromental Variables ...........................................................................................13
G. Methodology ...........................................................................................................16 H. Summary Statistics ..................................................................................................17
III. Empirical Results ...............................................................................................................18
A. Efficiency Estimations ............................................................................................18 B. Truncated Regression Results .................................................................................20 C. Regulatory Compliance in Emerging Markets ........................................................22 D. Sensitivity Analysis.................................................................................................22
IV. Conclusions........................................................................................................................23
V. Tables in Body of Text........................................................................................................24
1. Descriptive Statistics ................................................................................................24
2. Bank Efficiency Estimates .......................................................................................25
3a. Truncated regressions.............................................................................................26
3b. Truncated regressions ............................................................................................27
4a. Fractional logit regressions ....................................................................................28
4b. Truncated regressions ............................................................................................29
VI. Appendix............................................................................................................................30
A.1. Full sample ...........................................................................................................30 A.2. Summary statistics for original DEA estimates ...................................................31
A.3. Variable definitions ..............................................................................................32
References ................................................................................................................................36
I. INTRODUCTION
In this paper, we assess whether compliance with international regulatory standards and
protocols affects bank performance. We focus on the adoption of international capital standards
and the Basel Core Principles for Effective Bank Supervision (BCP). These principles, issued in
1997 by the Basel Committee on Bank Supervision, have since become the global standards for
bank regulation, widely adopted by regulators in developed and developing countries. The
severity of the 2007–09 financial crisis has cast doubt on the effectiveness of these global
standards; regulatory reforms are under way in several countries. The initial crisis-induced
assessment of regulatory failure is now giving way to a more complex regulatory dialogue and
detailed evaluation of the principles underlying international regulatory standards as well as the
implications of their adoption, in terms of banks' safety and soundness. In addition, the burden of
compliance with international regulatory standards is becoming increasingly onerous, and
financial institutions worldwide are developing compliance frameworks to enable management
to meet more stringent regulatory standards. As regulators refine and improve their approach and
methodologies, banks must respond to more stringent compliance requirements. This has
implications for risk management and resource allocation, and, ultimately, on bank
performance.5
The goal of this paper is to advance the existing literature by examining the relationship
between the observance of international regulatory standards and the performance the banking
sector. To evaluate bank performance we follow a structural approach, which relies on a model
of the banking firm and a concept of optimization (Hughes and Mester (2014). The traditional
structural approach relies on the economics of cost minimization or profit maximization; bank
technical or operating (in)efficiency is broadly defined as the distance between an actual
production process and the "best practice" or the optimal standard.6 From a theoretical
perspective, scholars’ predictions as to the effects of regulation and supervision on bank
performance are conflicting. The greater part of policy literature on financial regulation has been
5 By the end of 2014, Citigroup had nearly 30,000 employees working on regulatory and compliance issues (an
increase of 33 percent since 2011). This trend is compounded by the fact that compliance staffing is increasing at a
time when the bank has been shrinking assets and staff (The Tell, Wall Street Journal, July 2014). Similarly,
JPMorgan Chase expanded its risk control staff by 30 percent since 2011. In Europe, Deutsche Bank is doubling its
compliance spending and adding at least 500 additional resources (Bloomberg, 9 July 2014). In 2013, HSBC
announced plans to add approximately 3,000 compliance staff. This would bring its total compliance staff to more
than 5,000, almost 2 percent of its global workforce, which has shrunk by over 40,000 in the past two years. (the
Times, 25 September 2013).
6 Traditionally, structural approaches to the evaluation of bank performance have assumed that all banks are equally
efficient at either minimizing costs or maximizing profits, subject to a random error (ε i), which is assumed to be
normally distributed. Alternatively, structural approaches rely on the estimation of a frontier to capture the best
practice, and estimate inefficiency as the difference between the best practice performance and the actual
performance. In this study we follow the latter. There are four main methodologies for estimating the frontier:
stochastic frontier; the distribution-free approach; the thick frontier and data envelopment analysis (see Hughes and
Mester, 2014 for a detailed discussion of the relative merits of the different methodologies).
4
inspired by the broader debate on the role of government in the economy. The two best-known
opposing camps in this field are the public interest and the private interest defenders, who both,
nonetheless, agree on the assumption of market failure. For the public interest camp,
governments regulate banks to ensure better functioning and thus more efficient banks,
ultimately for the benefit of the economy and the society (Feldstein 1972). For the private
interest camp, regulation is a product of an interaction between supply; it is thus the outcome of
private interests who use the coercive power of the state to extract rents at the expense of other
groups (e.g., Stigler 1971).
According to the public interest view, which largely dominated thinking during the 20th
century, regulators have sufficient information and enforcement powers to promote the public
interest. In this setting, well-conceived regulation can exert a positive effect on firm behavior by
fostering competition and encouraging effective governance in the sector. In contrast, according
to the private interest view, efficiency may be distorted because firms are constrained to channel
resources to special-interest groups. This implies that regulation may not play a role in
improving bank efficiency. Kane (1977) suggested that these conflicting views help frame the
complex motivations underlying regulatory policies. He argues that officials are subject to
pressures to respond to both public and private interests, and that the outcome of such an
oscillation depends on incentives. Swings in the approach to regulation reflect the interplay of
industry and political forces and the occurrence of exogenous shocks (crises for example). These
complex interactions may have conflicting effects on the efficiency of the banking system.
Given these unresolved conflicting theoretical views on regulation and, hence, on
supervision, in the aftermath of the 2007–09 financial crisis, at a time when significant
regulatory reforms are under way, it is important to shed more light on the effects of the existing
approach to regulation in general and, ultimately, to propose policy avenues for improvements.
Empirically, it seems that the private interest view is more consistent with the data (for example,
Barth and others, 2008). This stream of research finds that regulatory approaches that support
private sector monitoring of banks and strengthen incentives for market monitoring, improve
bank performance and stability. Barth and others (2013) assess whether bank regulation,
supervision and monitoring enhance or impede bank operating efficiency and find that tighter
restrictions on bank activities are negatively associated with bank efficiency. On the other hand,
greater capital regulation, greater official supervisory power and enhanced market-based
monitoring are positively associated with bank efficiency.
However, there is no evidence that any common set of best practices is universally
appropriate for promoting well-functioning banks. Regulatory structures that will succeed in
some countries may not constitute best practice in other countries that have different institutional
settings. As pointed out by Barth and others (2013), there is no broad cross-country evidence as
to which of the many different regulations and supervisory practices employed around the world
work best. As a consequence, the question of how regulation affects bank performance remains
5
unanswered. Regulators around the world are still grappling with the question of what constitutes
good regulation and which regulatory reforms they should undertake.
In this paper, we contribute to the ongoing policy debate by assessing whether
compliance with international regulatory standards and protocols on supervision enhances banks’
operating efficiency. We focus on regulatory compliance, because it can affect bank performance
through several channels: (i) lending decisions; (ii) asset allocation decisions; (iii) funding
decisions. Regulatory compliance is costly. Ultimately, these costs are borne not by regulators or
banks, but by bank customers, in terms of lower saving rates and higher lending rates. This, in
turn, may lead to an inefficient allocation of resources in the economy. As Haldane (2013)
indicates, if systemic stability can be achieved in other ways, these are deadweight costs to
society. The evidence on the effects of regulatory compliance on bank stability is mixed and
depends on the individual risk or the specific stability measures utilized. Podpiera (2004) finds
some evidence that higher BCP compliance leads to lower non-performing loans (NPLs) and
lower net interest margins (used as a proxy of bank efficiency) on an aggregate basis. Demirgüç-
Kunt and Detragiache (2011), on the other hand, show that compliance with the overall BCP
index, and with its constituent components, is not associated with bank risk, as measured by
banks’ Z-scores.
On the regulators’ side, excessive reliance on systematic adherence to a checklist of
regulations and supervisory practices might hamper regulators’ monitoring efforts and prevent a
deeper understanding of banks’ risk-taking. More specifically, to shed some light on the
aforementioned issues, we aim to answer the following questions: (i) Does compliance with
international regulatory standards affect bank operating efficiency? (ii) By what mechanisms
does regulatory compliance affect bank performance? (iii) To what extent do bank-specific and
country-specific characteristics soften or amplify the impact of regulatory compliance on bank
performance? (iv) Does the impact of regulatory compliance increase with level of development?
Building on the IMF and the World Bank Basel Core Principles for Effective Bank
Supervision (BCP) assessments conducted from 1999 to 2010, we evaluate how compliance with
BCP affects bank performance for a sample of 863 publicly listed banks drawn from a broad
cross-section of countries.7 We focus on publicly listed banks, on the assumption that these
institutions are subject to more stringent regulatory controls and compliance requirements. This
focus should also enhance cross-country comparability because these banks share internationally
7 Only a handful of previous studies have used BCP data; these include: Sundararajan and others (2001); Podpiera
(2004); Das and others (2005); Demirgüç-Kunt and others (2008) and Demirgüç-Kunt and Detragiache (2011).
These studies have used BCP information to study bank soundness and performance; overall they do not find
evidence to support the hypothesis that better compliance leads to a sounder banking system. A recent review of the
FSAP program (IMF 2014) includes an extensive study on standard supervisory assessments and analyzes the link
between standard assessments and financial performance measures. They conclude that while there is no perfect
supervisory approach, the lack of certain key features in a supervisory approach is likely to lead to macro-financial
consequences.
6
adopted accounting standards. Further, we categorize the sample countries by both economic
development and geographic region. Following Demirgüç-Kunt and Detragiache (2011), to
assess the level of bank compliance we use an aggregate BCP compliance score and a
disaggregated approach, to differentiate among various dimensions of regulation and
supervision. To measure bank performance we begin with the estimation of a common global
frontier by means of Data Envelopment Analysis (DEA), a widely used nonparametric
methodology. Unlike previous studies, the present study explicitly accounts for cross-country
heterogeneity in bank efficiency analysis, by adopting a two-stage double bootstrapping
procedure: the first stage produces (bias-corrected) efficiency estimates which are then used in
the second-stage truncated regressions to infer how various (bank-specific and country-specific)
factors influence the (bias-corrected) estimated efficiency (Simar and Wilson 2007). Earlier
studies suggest that the impact of regulation and supervision increases with the level of
development (Barth and others, 2004; Demirgüç-Kunt and others, 2008). To assess whether
regulatory compliance affects banks differently in countries at different levels of development,
we re-run the estimations focusing on a subsample of emerging markets.
Our results indicate that overall BCP compliance—or indeed compliance with any of the
individual chapters—has no association with bank operating efficiency. This result holds after
controlling for bank-specific characteristics, the macroeconomic environment, institutional
quality, and the existing regulatory framework. It adds further evidence to the argument that
compliance per se has little effect on bank efficiency. Conditional on being a good bank (that is,
a bank complying international regulatory and supervisory standards) regulation has no impact
on bank performance. Nevertheless, increasing regulatory constraints may prevent banks from
efficient allocation of resources. When only banks in emerging and developing countries are
considered, a relationship is revealed. The extent of ongoing supervision is negatively associated
with input efficiency. On the other hand, the extent to which supervisors apply international
global standards is positively associated with bank input efficiency. This difference indicates that
in emerging markets, adherence to international standards of best practice may have a positive
effect on bank performance. However, these results need to be treated with caution, because they
may also reflect the inability of assessors to provide a consistent cross-country evaluation of
effective banking regulation.
The remainder of the paper is organized as follows: Section 2 presents methodology and
data; Section 3 contains the results, and Section 4 concludes.
II. DATA AND METHODOLOGY
A. The Sample
The dataset used in this study comprises bank-level data and country-level data; it is
compiled from a number of sources: (a) the IMF and World Bank Basel Core Financial Sector
Assessment Program (FSAP) database, which includes detailed assessment of a country’s
7
compliance with the Basel Core Principles for Effective Bank Supervision (BCP) during 1999–
2010; (b) the Barth and others (2004, 2006, and 2008) surveys on bank regulation, supervision,
and monitoring; (c) the World Bank Economic Indicators database (WDI); and (d) the
Bankscope database provided by Bureau van Dijk and Fitch Ratings.
Bank-level information comprises balance sheet and income statement data for all
publicly quoted commercial banks and bank holding companies. We focus on publicly quoted
banks, on the assumption that these institutions are subject to more stringent regulatory controls
and need to comply with international regulations, such as capital regulation. This focus should
also enhance cross-country comparability, not least because publicly quoted banks follow
international accounting standards to report end-of-year accounting variables (Laeven and
Levine 2008). When constructing the dataset, we exclude banks with missing information on
relevant accounting variables (total assets, loans, other earning assets, deposits, equity capital,
interest and non-interest income, and interest and non-interest expenses). To prevent the
possibility of outliers driving the results, we exclude the top and bottom 1 percent levels, in
terms of bank size (total assets), for all years.8 Finally, we apply data cloud methods to identify
and remove outliers in terms of input/output mix9
(see Section 2.B for more detail on
input/output specification).
We then match the bank-level information with country-level information to investigate
the link between regulatory compliance and bank performance, accounting for cross-country
differences in macroeconomic and institutional factors. Our final cross-sectional sample includes
863 banks across 63 countries over the period 2001–10 (Table A.1).10 Our sample is unbalanced
and it includes countries with vastly different banking systems and economic conditions, with
some countries only represented by a few listed banks, while others have a much higher sample
share. Specifically, U.S. banks account for approximately 35 percent (304 banks) of the sample.
To ensure that our findings are not overly influenced by U.S. banks, we examine results with and
without them.
For the purpose of the analysis, we categorize the 63 countries in our sample both in
terms of both economic development and geographic region, combining information from the
International Monetary Fund (IMF) and the European Bank for Reconstruction and Development
(EBRD). Countries are classified into four categories of economic development: (i) Major
Advanced (countries in the G7 group); (ii) Advanced, (iii) Emerging and Developing; and (iv)
8 This resulted in 10 observations being dropped from our sample.
9 This method allows for the identification of “influential observations” in the application of Data Envelopment
Analysis (see Wilson 1995).
10 The original BCP assessment exercise examines 158 countries, principalities, and monetary unions; but because of
data availability and the incomplete overlap among the four databases, the dataset’s global span is reduced to 63
countries.
8
Transitional. In addition, countries are also classified into 10 geographical regions (Central and
Eastern Europe (EEU); Latin America and the Caribbean (LAM); Middle East and North Africa
(MEA); Newly Independent States of Former Soviet Union (FSU); North America (NAM);
Other Pacific Asia (PAS); Pacific OECD (PAO); South Asia (SAS); Sub-Saharan Africa (AFR);
Western Europe (WEU)).
Because the country-level regulatory data (data source (b)) are collected in three survey
exercises (1999, 2002, and 2005/2006), following Barth and others (2013) we match the data for
the regulatory variables as follows: the 1999 survey data are used for period 2000–01; the 2002
survey data are used for period 2002–04, and 2005/2006 survey data are used for period
2005–10. As each bank is in the sample is assessed at one point in time during the sample period,
the data is cross-sectional.
B. Empirical Set-Up and Definition of Variables
Frontier methodologies for the analysis of firm performance have generated a large
literature since the seminal work of Leibnestein (1966) introduced the concept of x-inefficiency
as the gap between ideal efficiency and actual efficiency. Frontier approaches measure firm
performance relative to ‘best practice’ in the industry. Such measures summarize performance in
a single statistic that controls for differences among firms using a sophisticated multidimensional
framework (Banker & Cummins, 2010). The evaluation of efficiency is based on the assumption
that the production frontier of the fully efficient organization is known. In practice, data is used
to estimate this idealized frontier. Over the last half century, estimations of this best practice
frontier developed along two empirical paths, a parametric and a non-parametric one. In this
study, we follow a non-parametric approach which uses linear programming methods to assign
each observation to its own set of ‘coefficients’ from which inefficient behavior can be assessed.
More specifically, we employ the most well known of these `data-oriented’ methods, Data
Envelopment Analysis (DEA), first introduced by (Charnes, Cooper, & Rhodes, 1978) and later
extended by (Banker, Charnes, & Cooper, 1984). Our methodological approach represents an
extension of the traditional DEA model.
Formally, DEA is a methodology directed to frontiers rather than central tendencies. It
floats a piecewise linear surface to rest on top of the observations rather than fitting a regression
plane through the `middle’ of the data using statistical methods (Cooper, Seiford, & Zhu, 2011).
DEA produces exact in-sample estimates of efficiency; that is a measure of the performance of
an institution relative to the other institutions which are producing the same good or service. This
method is non-stochastic; it assumes that all deviations from the frontier are the result of
inefficiency. This represent a drawback of the approach, as statistical inference about estimates
comparisons are precluded without further simulation techniques such as bootstrapping. To
overcome this problem, we follow a double bootstrapping procedure, as proposed by Simar and
Wilson (2007).
9
Another of the key issues that arises in the use of frontier methods for cross-country
comparisons of bank efficiency is the existence of significant heterogeneity. Several studies have
proposed alternative methodologies to overcome this problem. In this paper, we begin with the
estimation of a common global frontier by means of Data Envelopment Analysis (DEA). In the
next step, to account for cross-country heterogeneity we adopt a form of the two-stage approach
with a double bootstrapping procedure (Simar and Wilson 2007). In this two-stage approach, the
first stage measures efficiency by a DEA estimator and the second stage uses truncated
regression to infer how various (bank-specific and country-specific) factors influence the (bias-
corrected) estimated efficiency. The choice of this methodological approach is driven by the
characteristics of our sample, which includes a large number of countries (and a relatively small
number of banks per country) and therefore presents considerable challenges to accounting for
differences in operating, regulatory, and macroeconomic conditions experienced by banks.11 Our
study is the first cross-country study to apply the double bootstrapping two-stage procedure in a
consistent manner.12
In more detail, our approach can be broken up into three steps. In the first step, we use a
nonparametric input-oriented DEA model to measure bank efficiency.13 However, ignoring the
complex and heterogeneous nature of the sample and simply benchmarking performance on the
basis of a global common frontier would yield biased efficiency estimates. As a consequence, in
the next stage, we apply the double bootstrapping procedure proposed by Simar and Wilson
(2007) to explicitly account for the complex serial correlation in a two-stage DEA efficiency
estimation. In the estimation of DEA technical efficiency scores, this procedure recognizes that
certain bank-specific and environmental variables influence the estimate of the true unobserved
efficiency score and is thus consistent with the second-stage truncated regression analysis (Glass
and others, 2010)
In a second step, the results from a truncated regression of the initial DEA efficiency
estimates on a set of environmental variables are used in a nonparametric bootstrap to generate
11
An alternative methodology that is popular in cross-country studies is the meta-frontier approach (Battese and
others, 2004), which allows for the estimation of technology gap ratios between individual country frontiers and the
overall meta-frontier, which is derived as an envelopment of individual frontiers. For applications of the meta-
frontier approach is banking, see, among others Bos and Schmeidel (2007) and Casu and others (2013). Because our
study is limited to publicly listed companies, it does not include a sufficiently large number of observations per
country to allow the estimation of individual country frontiers as well as a meta-frontier.
12 Some previous studies (Brissimis and others, 2008; Delis and Papanikolaou 2009) have applied the bootstrapping
procedure (more specifically, they have applied algorithm 1 from Simar and Wilson (2007) which improves
inference but does not take into account the bias as detailed in equation (4)). Barth and others (2013) use the
procedure as a robustness test without indication of the extent of its use.
13As a further robustness test, the original (raw) DEA estimates were used to create a subsample that excluded banks
on the frontier (=1). This subsample was then used to re-estimate efficiency. The correlation between efficiency
results of this reduced subsample was found to be statistically similar (a Pearson and Spearman rank correlation
coefficient were significant at the 1 percent level) to the original estimates, a good indication that outliers haven’t
affected the results to a large extent (Casu and Molyneux 2003).

10
biased corrected efficiency estimates. This step adjusts for the influence on the DEA efficiency
estimations of the correlation between observable bank/country level factors and the
inputs/outputs in a bank production process. Finally, in a third step, the bias-corrected DEA
efficiency estimates from step two are used as the dependent variable in a further truncated
regression on the same set of environmental variables, and a parametric bootstrap is used to
provide more efficient estimates of the statistical relationships between the environmental
variables and bank efficiency.
C. Estimating Bank Efficiency
We proceed to evaluate bank operating efficiency as follows. Let us define a production set as
(1)
where
denotes a vector of p inputs and
denotes a vector of q outputs. The
technology or production frontier is defined as
(2)
which is then used to measure the ith
banks’ input technical efficiency, defined as
(3)
the proportion by which input quantities can be reduced without reducing output quantities
(Coelli and others, 2005). 14
When a large cross-country sample is used to build a best-practice frontier, inefficiency
for bank i in country j is measured in terms of distance from this global common frontier. This
implies that any cross-country differences in the initial DEA efficiency scores are entirely
attributed to bank-level managerial decisions regarding the scale and mix of inputs. If this
assumption is not correct, it will result in biased efficiency estimates. In the next two steps,
unlike most cross-country bank efficiency studies, we apply a double bootstrapping procedure
(Simar and Wilson 2007) to account explicitly for the complex serial correlation in a two-stage
DEA efficiency study. This procedure will adjust for the bias in the first stage DEA estimates of
bank efficiency. We will then use these bias-corrected efficiency scores to improve statistical
efficiency in the second-stage truncated regression estimates.
Mathematically this bias can be described as follows:
14
We report efficiency scores based on a variable returns to scale (VRS) assumptions.
11
(4)
where is the true (unobservable) efficiency score for ith
bank, is the nonparametric DEA
estimate of , is the bias of the nonparametric estimate which is strictly negative in
finite samples, and is the error in the nonparametric estimate, which will disappear
asymptotically.15 As can be seen from (4) the true unobserved efficiency scores are generally
downward biased, and nonparametric efficiency estimates that ignore this bias will provide a
more favourable estimate of efficiency. In the context of our study, the bank would appear to be
performing better, in terms of the efficient allocation of its resources, than is actually the case.
Our estimation will implicitly account for this bias. Full details of the process used are described
in Algorithm 2 in Simar and Wilson (2007).
D. Definition of Inputs and Outputs
The inputs and outputs used to estimate efficiency are defined based on an extension of
the intermediation approach (Sealey and Lindley 1977), which does not penalize nontraditional
banking activity and takes into account a bank’s ability to manage risk. We estimate a model that
has three inputs and three outputs.
The inputs are: (i) customer deposits and short-term funding; (ii) total costs (defined as
the sum of interest expenses and noninterest expenses), and (iii) equity capital to adequately
account for the impact of risk (Berger 2007). Hughes and Mester (2010) argue that the
inappropriate treatment of equity capital can bias bank efficiency estimates because banks can
use either capital or deposits to fund loans, and this choice has a direct effect on funding costs.16
As equity capital has a minimum level due to capital adequacy regulation, it should be treated as
a quasi-fixed input; a variable whose control is not at the complete discretion of the
management.17
The three outputs are: (i) loans; (ii) other earning assets; and (iii) noninterest income as a
proxy for off-balance-sheet activities.18
We include the latter output to ensure that we do not
penalize banks that have a substantial share of nontraditional activities (Barth and others, 2013)
15
This is equation 16 in Simar and Wilson (2007).
16 Hughes and Mester (2010) argue that most bank efficiency studies make use of financial statement data and define
costs based on an accounting cash-flow concept rather than economic principles, the former using interest paid on
debt (deposits) and not the cost of equity. This would mean that if a bank chooses to substitute some of its equity
capital for debt its cash-flow costs will rise, making the less-capitalized bank appear more costly than the well-
capitalized bank.
17 In an input-oriented model we would thus treat equity as a negative output, (Bogeoft and Otto 2011).
18 Although other studies have used the value of off-balance-sheet items, this variable has a significant number of
missing values in our sample; thus, we rely on noninterest income as an appropriate proxy.
12
E. Measuring Bank Compliance
The principal variable of interest, BCP compliance, is derived from the IMF and World
Bank Basel Core Financial Sector Assessment Program (FSAP) database.19 Our study extends
the work of Demirgüç-Kunt and Detragiache (2011) by using assessment data covering 1999–
2010,20 which includes a U.S. banking sector assessment. The Basel Core FSAP is an exhaustive
global exercise, capturing the compliance features of banking industries in both developed and
developing economies. The 25 BCP core principles are considered by regulators and by
international organizations to be the best practice to date of compliance with banking regulation
and supervision. These principles were issued in 1997 by the Basel Committee of Banking
Supervision, and have been adopted by most countries in the world. Since 1999, the IMF and the
World Bank have conducted regular assessments to gauge countries' compliance with these
principles, mainly within their joint FSAP. The 25 BCP core principles are organized into seven
chapters, as follows:
- Chapter 1 (BCPch1): Preconditions for effective banking supervision. Six subprinciples
constitute the prerequisite to perform supervisory activities including objectives, responsibilities,
adequate resources, independence, legal infrastructure, and the existence of arrangements of
cooperation between supervisors for sharing information and protecting its confidentiality.
- Chapter 2 (BCPch2): Licensing and structure. Four principles set the powers of supervisors in
terms of their authority to grant banks licenses and to review major acquisitions and investments.
- Chapter 3 (BCPch3): Prudential Regulations and Requirements. Ten principles are in place to
ensure that supervisors set prudent and appropriate minimum capital adequacy requirements for
all banks. These requirements reflect banks’ risks, credit policies, loan provisioning,
concentration, large exposures, risk mitigation policies, risk monitoring, audit, and code of
conduct. These requirements impose a cost for banks, which have to put in place risk
measurement, management, and governance systems to ensure compliance.
- Chapter 4 (BCPch4): Methods of Ongoing Supervision. Five principles impose regular
supervisory visits to banks and contacts with bank management at group and subsidiary levels. In
practice, compliance teams in banks must be kept ready to address supervisory matters when
they arise.
- Chapter 5 (BCPch5): Information Requirements. One principle requires banks to maintain
adequate records to enable supervisors to obtain a true and fair view on the financial conditions.
19
For detailed information on the assessments of the Basel Core Principles, we refer the reader to their founding
documents (Basel Committee on Banking Supervision 1997, 1999, 2006, 2011a, 2011b, 2012).
20 The Demirgüç-Kunt and Detragiache (2011) study uses BCP compliance data covering the period 1999–2007.
13
This principle implies that banks must keep comprehensive internal data on exposures (on- and
off-balance sheets, clients, risks) and share it with supervisors.
- Chapter 6 (BCPch6): Formal Powers of Supervisors. One principle aims to ensure that adequate
corrective supervisory measures are in place for distressed banks.
- Chapter 7 (BCPch7): Cross-Border Banking. Three principles to encourage supervisors to
practice global consolidated supervision over internationally active banks. These principles may
not work in practice because of the lack of exchange of confidential information between
supervisors, and the difficulty of home-host issues, particularly in case of distress.
Following Demirgüç-Kunt and Detragiache (2011), the level of bank compliance is assessed
using an aggregate BCP compliance score and a disaggregated approach, to distinguishing
among various dimensions of regulation and supervision. The variable "BCP compliance"
specifies a measure of compliance for each country in our sample at one point in time. Bank-
level and country-level information are matched with the year of assessment to produce a cross-
sectional sample. More specifically, to assess the compliance rate with each of the 25 principles,
a four-point scale is used: (i) noncompliant; (ii) materially noncompliant; (iii) largely compliant,
and (iv) compliant. Numerical values are assigned to each of the grades (from 0 for
noncompliant to 3 for compliant). An overall index of compliance is computed based on the sum
of the seven regulatory dimensions (BCP score). Seven indexes of compliance are then
calculated based on the individual dimensions of regulation. All indices are normalized to take
values in the interval [0, 1]. This normalization also has the intuitively appealing property of a
percentage interpretation on initial analysis.
F. Environmental Variables
Bank efficiency is normally expressed as a function of both internal and external
contextual variables. Internal factors are usually related to bank management and are defined
from a bank’s financial statements and thus specific to its individual character. External factors
describe the regulatory, macroeconomic, and financial development conditions that are likely to
affect a bank’s performance. The contextual variables used in this study are chosen to best fit the
primary purpose of the analysis and include both bank-specific and country-specific variables.
The bank-specific variables include log of total assets (logta), loans to assets ratio (lta),
book value equity to assets (eqta) and return on equity (roe). Bank size, lending behaviour,
capitalization, and risk profile are considered key determinants of bank performance.
It has long been established in applied bank efficiency studies that bank size (logta) can
significantly affect bank performance. Banks enjoy economies of scale as they grow larger. One
of the reasons put forward in the literature is that larger banks can better diversify risk
(particularly credit and liquidity risk), which should reduce the relative costs of risk
management. This in turn should allow banks to conserve equity capital, reserves, and liquid
14
assets. Further, the spread of overhead costs (especially those associated with information
technology) can also bring about larger efficiencies of scale in banking production (Hughes and
Mester 2013). Although large banks can experience scale diseconomies and there might be costs
associated with diversification, we expect an overall positive relationship between size and
efficiency.
A bank’s production process is underpinned by its ability to improve information
asymmetries between borrowers and lenders. This implies that a measure of relative lending
behaviour such as loans to assets (lta) can be an important determinant of bank performance.
Furthermore, as banks make choices about their capital structure and the amount of risk to
assume, capitalization decisions have a direct impact on performance. We model this potential
impact by including equity to assets (eqta). We expect higher levels of capital to be related to a
reduction in a bank overall risk, and posit a positive relationship between the equity to assets
ratio and bank performance. Finally, we also control for performance differences resulting from
a manager’s ability to optimize the risk-return tradeoff, by including a bank's return on equity
(roe). Although no consistent picture emerges in the literature as to the relationship between risk
and bank efficiency, a bank risk-taking profile is an important determinant of performance.
Moving to the external country-specific characteristics, these are a vector of the
macroeconomic conditions and financial conditions in the banking industry of each country in
the sample. The business and economic cycle fluctuations are modelled using annual growth in
GDP (gdpg) and annual rate of inflation (inf) measured as the percentage change in the consumer
price index. Favorable economic conditions will stimulate an improvement in the supply and
demand for banking services, and will consequently have a positive effect on bank efficiency
(Lozano-Vivas and Pasiouras 2010). Furthermore, high inflation can affect bank performance in
a number of ways: it might encourage banks to compete through excessive branch networks, thus
affecting cost (Kasman and Yildirim 2006), or it might have a beneficial effect on bank margins
(Demirgüç-Kunt and others 2004).
The level of financial intermediation is controlled by including the ratio of private sector
banks’ claims to GDP (PrCrGDP) as in Barth and others (2004). A higher ratio indicates
increased loan activity, which is likely to improve bank efficiency. Higher efficiency resulting
from high intermediation activity may be the effect of a bank’s risk preferences; recall that our
model takes this into consideration by including equity capital as both a quasi-fixed input and in
ratio form (eqta) as an environmental variable.
Lastly, we control for bank sector concentration using the ratio of the assets held by the
three largest banks as a proportion of all bank assets of the country (conc). Higher concentration
15
is thought to have a negative impact on bank efficiency because market power allows managers
to relax their efforts to improve performance (Berger and Hannan 1998).21
The primary purpose of our study is to investigate whether BCP compliance plays a role
in bank performance; therefore, it is vital to appropriately model the regulatory conditions within
which each bank operates. We include six key features of banking regulation, which were first
defined in Barth and others (2004, 2006). RESTR is a measure of the level of restriction placed
on a bank’s activity. Barth and others (2004) argue that allowing banks to be involved in a range
of activities may encourage the rise of larger, more complex entities that are more difficult to
regulate. Reduced competition and efficiency may result, because banks may systemically fail to
manage their diverse set of financial activities beyond the traditional model, lowering
profitability (Barth and others, 2003).
COMP measures the level of regulation in place that would reduce competition (this
includes entry requirements, limitations of foreign bank entry/ownership, and the fraction of new
applications for banking licenses that are denied). As mentioned above, limited competition is
likely to induce appropriating management behavior that may have a detrimental effect on bank
efficiency. CAPRQ measures capital risk management restrictions. Pasiouras and others (2009)
argue that capital requirements can affect bank efficiency and productivity in three ways. First,
binding regulatory capital requirements reduce aggregate lending and affect loan quality, which
in turn will affect efficiency. Second, stricter capital requirements influence a bank’s asset
portfolio mix, resulting in different portfolio returns; this will affect input-oriented bank
efficiency, because these returns will require the management of different resources. Finally, as
mentioned earlier, differing capital standards will influence a bank’s decisions on the mix of
deposits and equity, which entail different costs.
PRMON is a variable measuring the degree of private sector monitoring. This is a proxy
for the third pillar of Basel II and can be related to the private monitoring hypothesis, which
argues that supervisory power can incorporate business corruption and/or political motivation
which, if increased, would affect bank lending integrity and compromise efficient credit
allocation.22 Many economists support a greater reliance on private sector monitoring to promote
better-functioning banks, although the quality of private monitoring largely depends on the
quality of information disclosure. Although we expect the effect to be country-specific, we
expect a positive link between the degree of private market monitoring and bank efficiency.
21
It has also been argued that higher concentration could be the result of efficiency in the production process
(Lozano-Vivas and Pasiouras 2010).
22 The antithesis is the official supervision hypothesis, which suggests that supervision can prevent systemic failures
by direct oversight, regulation, and disciplinary action against banks.
16
DEPSEC is a measure of the amount of security in place for depositors, in terms of
deposit insurance schemes. Research suggests that increased levels of deposit insurance will
exacerbate moral hazard issues and reduce the incentives for private monitoring. In terms of the
effect on bank efficiency, higher levels of security for depositors would reduce banks' incentives
to efficiently allocate resources to the most productive opportunities, thereby resulting in a
negative effect on efficiency.
CORPGOV is a measure of the level of effective corporate governance; it is derived from
the External Governance Index. Better external governance is expected to enhance the private
monitoring and disciplining of banks and thus boost banking efficiency.
Finally we control for differences in economic development of the countries in our
sample. Countries are classified into four categories (Major Advanced, Advanced, Emerging and
Developing, and Transitional) by development status. There may also be large regional
differences, so countries are also defined into 10 regions (Central and Eastern Europe (EEU),
Latin America and the Caribbean (LAM), Middle East and North Africa (MEA), Newly
Independent States of the former Soviet Union (FSU), North America (NAM), Other Pacific
Asia (PAS), Pacific OECD (PAO), South Asia (SAS), Sub-Saharan Africa (AFR), Western
Europe (WEU)) and which are used to capture regional differences.
G. Methodology
The relationship between bank efficiency and regulatory compliance is evaluated using
the following baseline specification:
(1)
where i indexes bank i, j indexes country j, 23 is the efficiency score of bank i in country j,
estimated by means of Data Envelopment Analysis and bias-corrected, as discussed in Section C.
BCPIndexj is the overall compliance index for country j, as discussed in Section E. The
remaining environmental variables are included to capture observable cross-country and bank-
characteristic differences. These have been discussed in Section F; Table A.3 presents the details
of how variables were constructed.
More specifically, Rj is a vector of bank regulatory condition indicators (described in
Barth, Caprio, and Levine (2006)) for country j; MFj is a vector of macroeconomic and financial
condition variables for country i; Bi,j is a vector of bank-specific characteristics for each bank i in
23
Depending on the steps of our analysis this variable will differ. In the second step of our approach this would be
the original DEA score estimated in the first step. In the third step of our approach this would be the bias-corrected
efficiency estimate from the second step.
17
country j, and Ij is a vector of dummy variables controlling for regional or economic
development differences. The error terms and are assumed to be random noise elements
of the dependent variable .
We estimate the model using a truncated regression in the double bootstrap procedure, as
detailed in Section C.
In a second step, we decompose our main variable of interest, BCP, into the seven
component chapters using the following disaggregated model:24
(2)
where BCPchj is an index of compliance, calculated based on the individual dimensions of
regulation: BCPch1 is Preconditions for Effective Banking Supervision; BCPch2 is Licensing and
Structure; BCPch3 is Prudential Regulations and Requirements; BCPch4 is Methods of OnGoing
Supervision; BCPch5 is Information Requirements; BCPch6 is Formal Powers of Supervisors,
and BCPch7 is Cross-Border Banking. The remaining variables are defined as in equation (1).
H. Summary Statistics
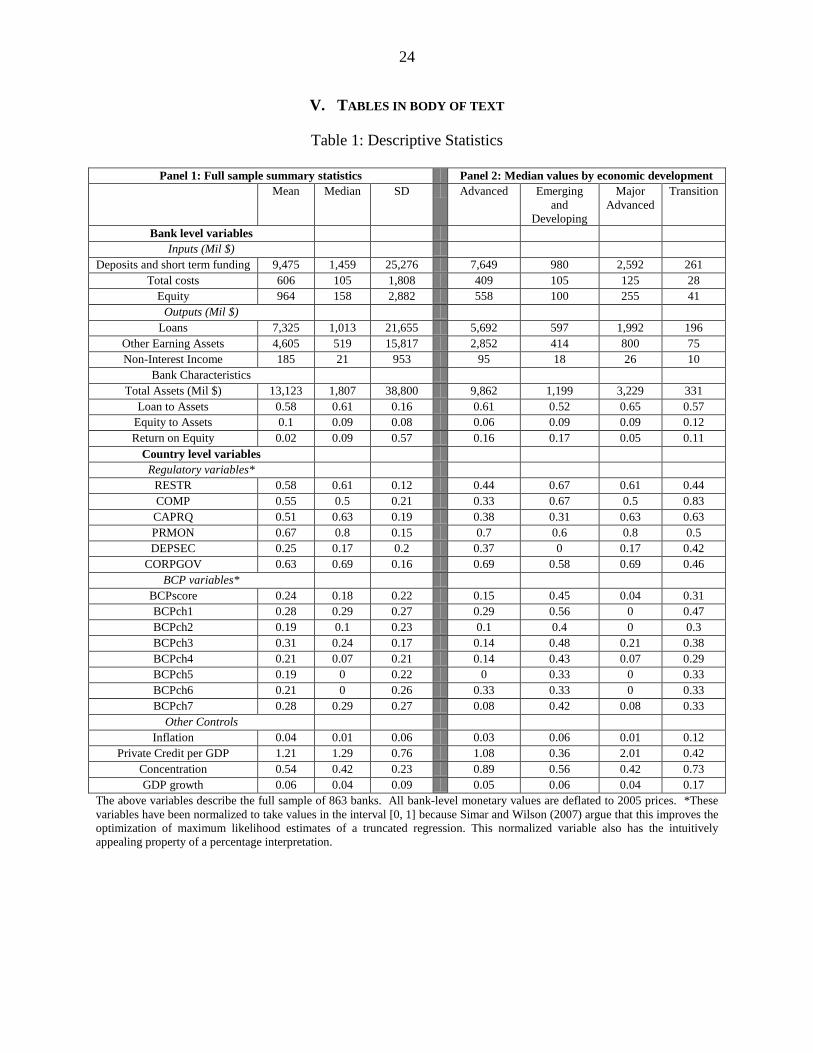
Table 1 presents summary statistics of the full sample. Panel 1 describes the mean and
standard deviation of each variable, while panel 2 provides an exposition of the median values
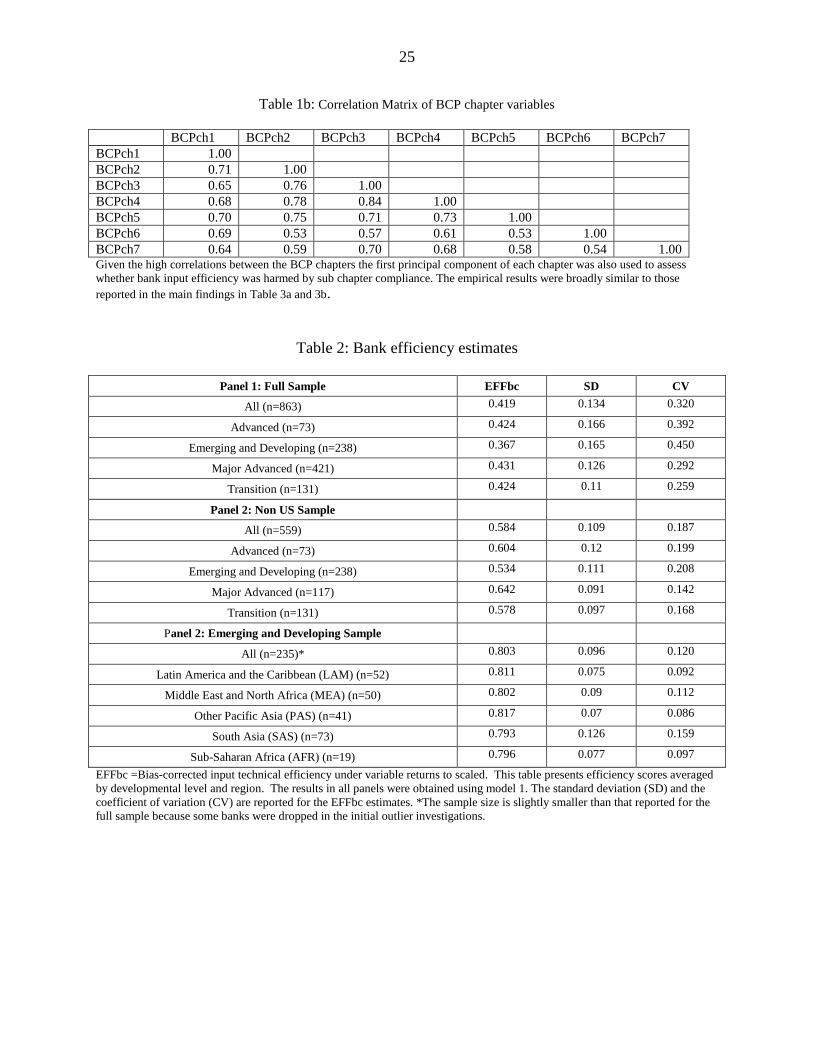
categorized by economic development. Table 1b presents the correlation matrix of the BCP
chapters. A few salient features emerge.
[Table 1: Descriptive Statistics]
Bank-level variables in panel 1 illustrate a host of differences between the 63 nations in
our cross-country survey, indicative of variations in banking industry sophistication. The median
values suggest that the sample is positively skewed, with a small number of large banks.
Furthermore, there is a high degree of full-sample heterogeneity, with values varying widely
about their means according to standard deviation figures.
From panel 1 the full-sample mean of the overall BCP compliance index (BCPscore) is
0.22, a much lower value than in the Demirgüç-Kunt and Detragiache (2011) study. This
24 Given the high correlations between the BCP chapters, we used Principal Component Analysis (PCA) and the
first principal component of each chapter was also used to assess whether bank input efficiency was harmed by sub
chapter compliance. The empirical results were broadly similar to those reported in the main findings in Table 3a
and 3b.
18
difference is likely owing to the inclusion of the U.S. banking sector, which dominates the
sample and performed poorly in their 2010 BCP compliance assessment.
From panel 2 a number of interesting sample features emerge. First, overall compliance
with the BCP appears to be higher in emerging and developing countries (45 percent), suggesting
that these countries adhere more closely to BCP because their banking industries are nascent. A
closer look at the regulatory control variables of emerging market and developing countries also
suggests that these banking industries have many more restrictions placed on their activities
(RESTR = 0.67), lack competition (COMP=0.67), and have no security in place for depositors
(DEPSEC=0). All these characteristics would suggest a greater sensitivity to BCP compliance of
banks in developing countries.
III. EMPIRICAL RESULTS
This section presents the results of our empirical analysis. First we present the bias-
corrected efficiency estimates. We then present the results of the truncated regression analysis to
infer how various (bank-specific and country-specific) factors influence the (bias-corrected)
estimated efficiency.
A. Efficiency Estimations
We begin our empirical investigation with the estimation of (bias-corrected) efficiency
scores. Table 2 presents summary statistics for the bias-corrected DEA estimates. These include
the coefficient of variation (CV, the standard deviation scaled by the mean).25 This is a scale-free
measure of dispersion that represents a comparative measure of efficiency volatility, with lower
values indicative of more stable bank performance.
The results are presented in three panels, one for each of the groupings mentioned above.
In panels 1 and 2 estimates are disaggregated by level of economic development, while in panel
3 the disaggregation is by geographical region.
Firstly, the overall mean bias-corrected input technical efficiency is 0.419 (the equivalent
mean for the Non-U.S. bank sample and the emerging market and developing countries bank
sample are 0.584 and 0.803 respectively). This mean value implies that a typical bank could
improve its input efficiency by 58 percent; or, if the average bank were producing on the frontier
rather than at its current location, only 42 percent of inputs being used would be required to
produce the output set.
25
The coefficient of variation is also known as the relative standard error; the standard error of an estimate (in this
instance the mean) divided by the estimate itself.
19
This global average is lower than in recent studies (Lozano-Vivas and Pasiouras 2010;
Pasiouras 2008) that used DEA methods and similar samples. This difference is perhaps
attributed to our explicit treatment of sample heterogeneity in the efficiency estimates.
As discussed above, nonparametric efficiency estimates using an unbalanced sample are
inherently biased and will provide a more favorable picture of bank efficiency if this bias is
ignored. A comparison of the overall mean raw efficiency26 (0.537) and its bias-corrected
counterpart (0.419) suggests that, on average, this estimated bias is 0.12. The comparative
estimate of average bias in the non-U.S. and emerging market and developing country bank
samples is 0.07 and 0.03 respectively.27 The bias-corrected efficiency estimates thus reveal that
the performance of banks is generally more inefficient than the raw, uncorrected DEA estimates
suggest.
[Table 2: Bank efficiency estimates]
Second, there are some trends evident when moving from advanced to less advanced
economies. In panel 1, mean efficiency scores exhibit little difference across major advanced and
advanced country banks, while banks located in emerging market, developing, and transition
countries are, on average, less efficient. Panel 2 results for the non-U.S. sample provide a much
clearer picture of this trend. The most efficient banks are located in the major advanced countries
(mean=0.642) while the least efficient banks are located in the emerging market and developing
countries (mean=0.534).
Third, there appears to be an increase in the dispersion of bank efficiency estimates as we
move from the most developed to the least developed countries. Panels 1 and 2 show some
differences in the coefficient of variation across developmental levels, with major advanced
country banks exhibiting the most stability in efficiency estimates (lower CV figure) while
emerging market and developing country banks experience the most volatility in efficiency
estimates (higher CV figure). This trend is most pronounced in the non-U.S. sample, where the
coefficient of variation of the emerging and developing country banks (0.208) is nearly 30
percent higher than the corresponding figure for major advanced country banks (0.142).
The latter findings suggest that bank efficiency in emerging markets and developing
countries is much more volatile. This increased volatility would suggest the necessity for tighter
26
The summary statistics of these original (raw) DEA estimates are presented in Table A.2 of the appendix.
27 To provide a complete picture of the bias, these averages should be assessed in conjunction with their standard
deviations. The standard deviation of the bias estimates for the full, non-U.S., and emerging market and developing
country bank samples are 0.14, 0.12, and 0.15 respectively. The latter suggests that while the average bias in the
emerging and developing sample is smaller there is much more variability about this mean value. This increased
variability is likely the result of much greater heterogeneity across banks in this subsample.
20
compliance with a set of effective banking supervision principles, and indicates the need for a
more detailed analysis of these banks. Results from this analysis are summarized in panel 3:
they suggest that a typical emerging market and developing country bank has a bias-corrected
efficiency of 0.80328 when benchmarked against best-practice peers of this subsample. This
suggests that, on average, a bank producing on this emerging market and developing country
bank frontier, instead of at its current location, would only need 80 percent of its inputs to
produce the same amount of outputs. Overall there is little discernible difference across regions
for banks located in emerging market and developing countries.29
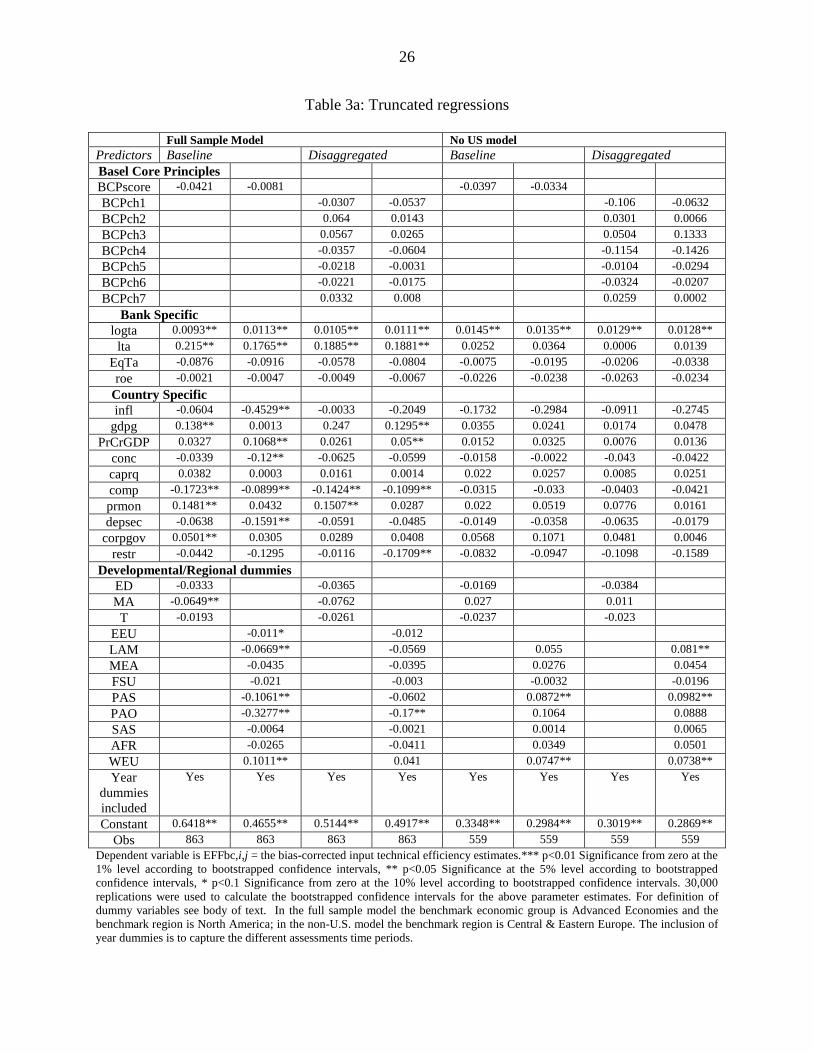
B. Truncated Regression Results
The main aim of this study is to provide consistent estimation of the relationship between
bank efficiency and BCP compliance, given the heterogeneous nature of the sample. Using the
approach described in Section II (G), we adopt two model specifications to provide a
commentary on whether overall BCP compliance or compliance with any of its component
chapters influence bank efficiency. Following Simar and Wilson (2007), we use a truncated
regression model to investigate how producer-specific and country-level variables influence bank
efficiency, with parameters being estimated by maximum likelihood. The authors’ Algorithm 2 is
used to obtain the bootstrapped confidence intervals for these estimates. Specifically, the
confidence intervals are constructed via the second part of the Simar and Wilson (2007)
Algorithm 2 double bootstrapping procedure, using 30,000 replications. Tables 3a and 3b present
the parameter estimates of the 1230 regressions produced when the three groupings described
above are used.
Effects of BCP compliance
None of the regression results provide robust statistical evidence to suggest that overall
BCP compliance or compliance with any of the individual chapters has a positive influence on
bias-corrected bank efficiency. This adds further support to the argument that BCP compliance
has no impact on the operational performance of individual banks, and may also reflect the
28
This is the average distance of a typical bank from a global frontier built using a sample of only the emerging
market and developing country banks.
29 When regional comparisons are considered, no obvious trends emerge. Banks located in PAS countries (This
category includes 15 Indonesian banks, 10 Thai banks, and 19 Philippine banks) are, on average, more efficient than
those in other regions, with a mean bias-corrected technical efficiency of 0.817. Furthermore, these banks
experience more stability in their efficiency levels, with a lower coefficient of variation. At the other extreme, banks
located in SAS countries (This category includes 38 Indian banks, 23 Bangladeshi banks, and 14 Sri Lankan banks)
are, on average, the least efficient in all the regions, with a mean bias-corrected efficiency of 0.793.
30 There are 12 regressions because each grouping is assessed using both models with two different sets of dummies:
economic development dummies and regional dummies.
21
inability of assessors to provide a consistent cross-country evaluation of effective banking
regulation (Demirgüç-Kunt and Detragiache 2011).
[Tables 3a & 3b: Truncated regressions]
Effects of bank characteristics
From Tables 3a and 3b, it is clear that bank-specific variables play an important role in
explaining the variability of bias-corrected bank input efficiency. Typically, larger, more actively
lending banks (that is, banks with higher loan-to-asset ratios) are more efficient; this finding
persists across the two subsamples.
Effects of economic and financial conditions
Across the groupings analyzed, no consistent relationships between bias-corrected input
bank efficiency and economic/financial conditions emerge. The full sample assessment suggests
that banks in countries with higher relative economic growth (illustrated by GDP growth) are
typically more efficient. Moreover, higher levels of financial intermediation (illustrated by the
ratio of private sector banks’ claims to GDP - PrCrGDP) are positively associated with bank
efficiency. These finding are consistent with previous studies (Lozano-Vivas and Pasiouras
2010; Pasiouras 2008) and suggest that favorable macroeconomic conditions will positively
affect the supply and demand of banking services, improving bank efficiency.
The results provide some evidence to suggest that concentration in the banking industry
has a detrimental effect on bank efficiency, as indicated by the negative association between
bank concentration (CONC) and bias-corrected bank input efficiency, from model 1 results using
the regional dummies.
Regulatory effects
Similarly, there is little evidence of pattern when regulatory effects across the three
groupings are considered. The full sample results provide some evidence to suggest that
regulation which enhances private monitoring (PRMON) also increases bank efficiency, while
regulation which stifles competition negatively affects bank efficiency. These findings add
support to the private monitoring hypothesis; regulation that requires a bank to provide accurate
and timely information to the public allows private agents to overcome information and
transaction costs, enabling them to monitor banks more effectively. The latter finding is
consistent with the recent finding that tighter restrictions on bank activities have a negative effect
on bank efficiency (Barth and others 2013).

22
Furthermore, there is some evidence to suggest that corporate governance has a positive
influence on bank efficiency, while increased depositor protection and restrictions on activity
have a negative impact.
C. Regulatory Compliance in Emerging Markets
Because of the significant differences between emerging markets and advanced
economies, in this part of the analysis we focus on a sample of emerging market and developing
economies. Differences in the level of institutional development, law and order, contract
enforcement, and corruption, for example, may affect both the level of compliance and the
efficiency of banking institutions. We therefore examine whether the impact of regulatory
compliance on bank efficiency is conditioned by the level of development. A higher level of
compliance would provide a secure environment for stable industry growth, and thus improve
banking efficiency; however, regulatory compliance with international standards is costly and
could negatively affect bank resource allocation.
To this end, we re-estimate the (bias-corrected) efficiency scores on our subsample of
banks from emerging market and developing economies, and then proceed with the two-stage
analysis. The results are reported in Table 3b. Although the results on the aggregate BCP index
do not support the hypothesis of an association between regulatory compliance and bank
efficiency, when we explore the relationship between efficiency and compliance with the
different chapters or group of principles, we find some evidence of a negative relation. In
particular, for banks in emerging countries, compliance with Chapter 4 (Methods of Ongoing
Supervision) has a negative and significant impact on the bias-corrected efficiency measures.
Specifically, this chapter relates to the effectiveness of the existing supervisory framework and
ability of supervisors to carry out their duties. Against a background of (potentially) increased
supervisory scrutiny required to meet international standards, banks are likely to face more
substantive compliance costs, such as investments in accounting systems, risk management
systems, equipment, and training. This in turn can distort their business objectives, lowering
investment and decreasing lending, and resulting in lower efficiency.
On the other hand, the extent to which supervisors apply international global standards is
positively associated with bank input efficiency (Chapter 7). This latter result may indicate that
in emerging markets, adherence to international standards of best practice has a positive effect on
bank performance.
D. Sensitivity Analysis
For the purpose of robustness we re-estimate the models in Tables 4a and 4b using the
Papke and Wooldridge (1996) fractional logit regression approach, as described in McDonald
(2009). He argues that DEA efficiency is the outcome of a fractional logit process (taking values
between zero and one) rather than a latent variable from a truncated process, as described by
23
Simar and Wilson (2007). Using the raw uncorrected DEA estimates, Table 3 reports the
parameters that were estimated using quasi-maximum likelihood methods.
Overall, the results seem to corroborate the key findings reported in Table 2.
Specifically, we continue to find no evidence of any beneficial relationship between bank
efficiency and compliance with the BCPs.
[Tables 4a and 4b: Fractional logit regressions]
IV. CONCLUSIONS
This paper contributes to the ongoing debate over the impact of regulation and
supervision on bank performance. Using World Bank Basel Core Principles for Effective Bank
Supervision (BCP) assessments conducted from 1999 to 2010, we evaluate how compliance with
BCP affects bank performance for a sample of 863 publicly listed banks drawn from a broad
cross-section of countries.
Our results indicate that overall BCP compliance, or indeed compliance with any of its
individual chapters, has no association with bank efficiency. This result holds after controlling
for bank-specific characteristics, the macroeconomic environment, institutional quality, and the
existing regulatory framework, and adds further support to the argument that although
compliance has little effect on bank efficiency, increasing regulatory constraints may prevent
banks from efficiently allocating resources. When only banks in emerging market and
developing countries are considered, we find some evidence of a negative relation with specific
chapters that relate to the effectiveness of the existing supervisory framework and the ability of
supervisors to carry out their duties. However, these results need to be treated with caution,
because they may also reflect the inability of assessors to provide a consistent cross-country
evaluation of effective banking regulation.
One limitation of this type of analysis is that compliance with the Basel Core Principles
for Effective Bank Supervision (BCP) is measured at a particular point in time and does not
allow for taking into account the evolution of each country's banking system in compliance with
international regulatory standards. However, a small number of countries in the sample have
been surveyed twice. By focusing on these countries, it would be possible to assess the impact of
the changes in compliance scores, both for those countries whose bank performance has moved
closer to international standards and for those countries which have underperformed.
24
V. TABLES IN BODY OF TEXT
Table 1: Descriptive Statistics
Panel 1: Full sample summary statistics Panel 2: Median values by economic development
Mean Median SD Advanced Emerging
and
Developing
Major
Advanced
Transition
Bank level variables
Inputs (Mil $)
Deposits and short term funding 9,475 1,459 25,276 7,649 980 2,592 261
Total costs 606 105 1,808 409 105 125 28
Equity 964 158 2,882 558 100 255 41
Outputs (Mil $)
Loans 7,325 1,013 21,655 5,692 597 1,992 196
Other Earning Assets 4,605 519 15,817 2,852 414 800 75
Non-Interest Income 185 21 953 95 18 26 10
Bank Characteristics
Total Assets (Mil $) 13,123 1,807 38,800 9,862 1,199 3,229 331
Loan to Assets 0.58 0.61 0.16 0.61 0.52 0.65 0.57
Equity to Assets 0.1 0.09 0.08 0.06 0.09 0.09 0.12
Return on Equity 0.02 0.09 0.57 0.16 0.17 0.05 0.11
Country level variables
Regulatory variables*
RESTR 0.58 0.61 0.12 0.44 0.67 0.61 0.44
COMP 0.55 0.5 0.21 0.33 0.67 0.5 0.83
CAPRQ 0.51 0.63 0.19 0.38 0.31 0.63 0.63
PRMON 0.67 0.8 0.15 0.7 0.6 0.8 0.5
DEPSEC 0.25 0.17 0.2 0.37 0 0.17 0.42
CORPGOV 0.63 0.69 0.16 0.69 0.58 0.69 0.46
BCP variables*
BCPscore 0.24 0.18 0.22 0.15 0.45 0.04 0.31
BCPch1 0.28 0.29 0.27 0.29 0.56 0 0.47
BCPch2 0.19 0.1 0.23 0.1 0.4 0 0.3
BCPch3 0.31 0.24 0.17 0.14 0.48 0.21 0.38
BCPch4 0.21 0.07 0.21 0.14 0.43 0.07 0.29
BCPch5 0.19 0 0.22 0 0.33 0 0.33
BCPch6 0.21 0 0.26 0.33 0.33 0 0.33
BCPch7 0.28 0.29 0.27 0.08 0.42 0.08 0.33
Other Controls
Inflation 0.04 0.01 0.06 0.03 0.06 0.01 0.12
Private Credit per GDP 1.21 1.29 0.76 1.08 0.36 2.01 0.42
Concentration 0.54 0.42 0.23 0.89 0.56 0.42 0.73
GDP growth 0.06 0.04 0.09 0.05 0.06 0.04 0.17
The above variables describe the full sample of 863 banks. All bank-level monetary values are deflated to 2005 prices. *These
variables have been normalized to take values in the interval [0, 1] because Simar and Wilson (2007) argue that this improves the
optimization of maximum likelihood estimates of a truncated regression. This normalized variable also has the intuitively
appealing property of a percentage interpretation.
25
Table 1b: Correlation Matrix of BCP chapter variables
BCPch1 BCPch2 BCPch3 BCPch4 BCPch5 BCPch6 BCPch7
BCPch1 1.00
BCPch2 0.71 1.00
BCPch3 0.65 0.76 1.00
BCPch4 0.68 0.78 0.84 1.00
BCPch5 0.70 0.75 0.71 0.73 1.00
BCPch6 0.69 0.53 0.57 0.61 0.53 1.00
BCPch7 0.64 0.59 0.70 0.68 0.58 0.54 1.00 Given the high correlations between the BCP chapters the first principal component of each chapter was also used to assess
whether bank input efficiency was harmed by sub chapter compliance. The empirical results were broadly similar to those
reported in the main findings in Table 3a and 3b.
Table 2: Bank efficiency estimates
Panel 1: Full Sample EFFbc SD CV
All (n=863) 0.419 0.134 0.320
Advanced (n=73) 0.424 0.166 0.392
Emerging and Developing (n=238) 0.367 0.165 0.450
Major Advanced (n=421) 0.431 0.126 0.292
Transition (n=131) 0.424 0.11 0.259
Panel 2: Non US Sample
All (n=559) 0.584 0.109 0.187
Advanced (n=73) 0.604 0.12 0.199
Emerging and Developing (n=238) 0.534 0.111 0.208
Major Advanced (n=117) 0.642 0.091 0.142
Transition (n=131) 0.578 0.097 0.168
Panel 2: Emerging and Developing Sample
All (n=235)* 0.803 0.096 0.120
Latin America and the Caribbean (LAM) (n=52) 0.811 0.075 0.092
Middle East and North Africa (MEA) (n=50) 0.802 0.09 0.112
Other Pacific Asia (PAS) (n=41) 0.817 0.07 0.086
South Asia (SAS) (n=73) 0.793 0.126 0.159
Sub-Saharan Africa (AFR) (n=19) 0.796 0.077 0.097
EFFbc =Bias-corrected input technical efficiency under variable returns to scaled. This table presents efficiency scores averaged
by developmental level and region. The results in all panels were obtained using model 1. The standard deviation (SD) and the
coefficient of variation (CV) are reported for the EFFbc estimates. *The sample size is slightly smaller than that reported for the
full sample because some banks were dropped in the initial outlier investigations.
26
Table 3a: Truncated regressions
Full Sample Model No US model
Predictors Baseline Disaggregated Baseline Disaggregated
Basel Core Principles
BCPscore -0.0421 -0.0081 -0.0397 -0.0334
BCPch1 -0.0307 -0.0537 -0.106 -0.0632
BCPch2 0.064 0.0143 0.0301 0.0066
BCPch3 0.0567 0.0265 0.0504 0.1333
BCPch4 -0.0357 -0.0604 -0.1154 -0.1426
BCPch5 -0.0218 -0.0031 -0.0104 -0.0294
BCPch6 -0.0221 -0.0175 -0.0324 -0.0207
BCPch7 0.0332 0.008 0.0259 0.0002
Bank Specific
logta 0.0093** 0.0113** 0.0105** 0.0111** 0.0145** 0.0135** 0.0129** 0.0128**
lta 0.215** 0.1765** 0.1885** 0.1881** 0.0252 0.0364 0.0006 0.0139
EqTa -0.0876 -0.0916 -0.0578 -0.0804 -0.0075 -0.0195 -0.0206 -0.0338
roe -0.0021 -0.0047 -0.0049 -0.0067 -0.0226 -0.0238 -0.0263 -0.0234
Country Specific
infl -0.0604 -0.4529** -0.0033 -0.2049 -0.1732 -0.2984 -0.0911 -0.2745
gdpg 0.138** 0.0013 0.247 0.1295** 0.0355 0.0241 0.0174 0.0478
PrCrGDP 0.0327 0.1068** 0.0261 0.05** 0.0152 0.0325 0.0076 0.0136
conc -0.0339 -0.12** -0.0625 -0.0599 -0.0158 -0.0022 -0.043 -0.0422
caprq 0.0382 0.0003 0.0161 0.0014 0.022 0.0257 0.0085 0.0251
comp -0.1723** -0.0899** -0.1424** -0.1099** -0.0315 -0.033 -0.0403 -0.0421
prmon 0.1481** 0.0432 0.1507** 0.0287 0.022 0.0519 0.0776 0.0161
depsec -0.0638 -0.1591** -0.0591 -0.0485 -0.0149 -0.0358 -0.0635 -0.0179
corpgov 0.0501** 0.0305 0.0289 0.0408 0.0568 0.1071 0.0481 0.0046
restr -0.0442 -0.1295 -0.0116 -0.1709** -0.0832 -0.0947 -0.1098 -0.1589
Developmental/Regional dummies
ED -0.0333 -0.0365 -0.0169 -0.0384
MA -0.0649** -0.0762 0.027 0.011
T -0.0193 -0.0261 -0.0237 -0.023
EEU -0.011* -0.012
LAM -0.0669** -0.0569 0.055 0.081**
MEA -0.0435 -0.0395 0.0276 0.0454
FSU -0.021 -0.003 -0.0032 -0.0196
PAS -0.1061** -0.0602 0.0872** 0.0982**
PAO -0.3277** -0.17** 0.1064 0.0888
SAS -0.0064 -0.0021 0.0014 0.0065
AFR -0.0265 -0.0411 0.0349 0.0501
WEU 0.1011** 0.041 0.0747** 0.0738**
Year
dummies
included
Yes Yes Yes Yes Yes Yes Yes Yes
Constant 0.6418** 0.4655** 0.5144** 0.4917** 0.3348** 0.2984** 0.3019** 0.2869**
Obs 863 863 863 863 559 559 559 559
Dependent variable is EFFbc,i,j = the bias-corrected input technical efficiency estimates.*** p<0.01 Significance from zero at the
1% level according to bootstrapped confidence intervals, ** p<0.05 Significance at the 5% level according to bootstrapped
confidence intervals, * p<0.1 Significance from zero at the 10% level according to bootstrapped confidence intervals. 30,000
replications were used to calculate the bootstrapped confidence intervals for the above parameter estimates. For definition of
dummy variables see body of text. In the full sample model the benchmark economic group is Advanced Economies and the
benchmark region is North America; in the non-U.S. model the benchmark region is Central & Eastern Europe. The inclusion of
year dummies is to capture the different assessments time periods.
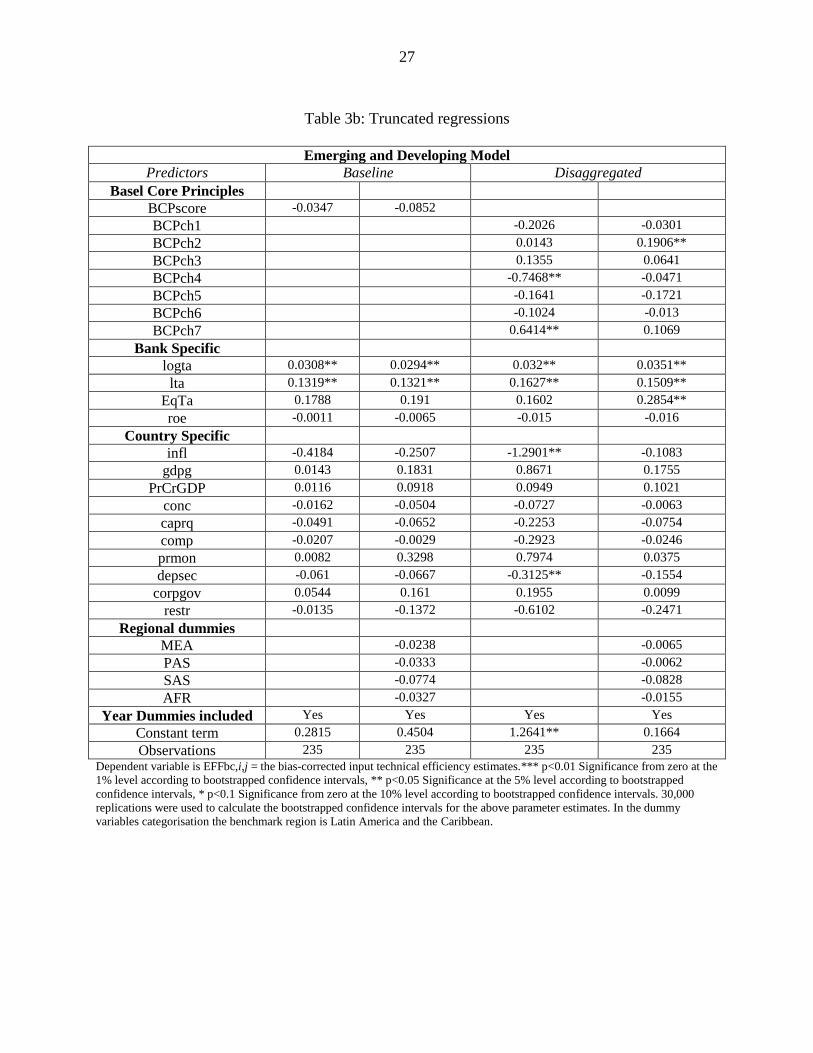
27
Table 3b: Truncated regressions
Emerging and Developing Model
Predictors Baseline Disaggregated
Basel Core Principles
BCPscore -0.0347 -0.0852
BCPch1 -0.2026 -0.0301
BCPch2 0.0143 0.1906**
BCPch3 0.1355 0.0641
BCPch4 -0.7468** -0.0471
BCPch5 -0.1641 -0.1721
BCPch6 -0.1024 -0.013
BCPch7 0.6414** 0.1069
Bank Specific
logta 0.0308** 0.0294** 0.032** 0.0351**
lta 0.1319** 0.1321** 0.1627** 0.1509**
EqTa 0.1788 0.191 0.1602 0.2854**
roe -0.0011 -0.0065 -0.015 -0.016
Country Specific
infl -0.4184 -0.2507 -1.2901** -0.1083
gdpg 0.0143 0.1831 0.8671 0.1755
PrCrGDP 0.0116 0.0918 0.0949 0.1021
conc -0.0162 -0.0504 -0.0727 -0.0063
caprq -0.0491 -0.0652 -0.2253 -0.0754
comp -0.0207 -0.0029 -0.2923 -0.0246
prmon 0.0082 0.3298 0.7974 0.0375
depsec -0.061 -0.0667 -0.3125** -0.1554
corpgov 0.0544 0.161 0.1955 0.0099
restr -0.0135 -0.1372 -0.6102 -0.2471
Regional dummies
MEA -0.0238 -0.0065
PAS -0.0333 -0.0062
SAS -0.0774 -0.0828
AFR -0.0327 -0.0155
Year Dummies included Yes Yes Yes Yes
Constant term 0.2815 0.4504 1.2641** 0.1664
Observations 235 235 235 235
Dependent variable is EFFbc,i,j = the bias-corrected input technical efficiency estimates.*** p<0.01 Significance from zero at the
1% level according to bootstrapped confidence intervals, ** p<0.05 Significance at the 5% level according to bootstrapped
confidence intervals, * p<0.1 Significance from zero at the 10% level according to bootstrapped confidence intervals. 30,000
replications were used to calculate the bootstrapped confidence intervals for the above parameter estimates. In the dummy
variables categorisation the benchmark region is Latin America and the Caribbean.
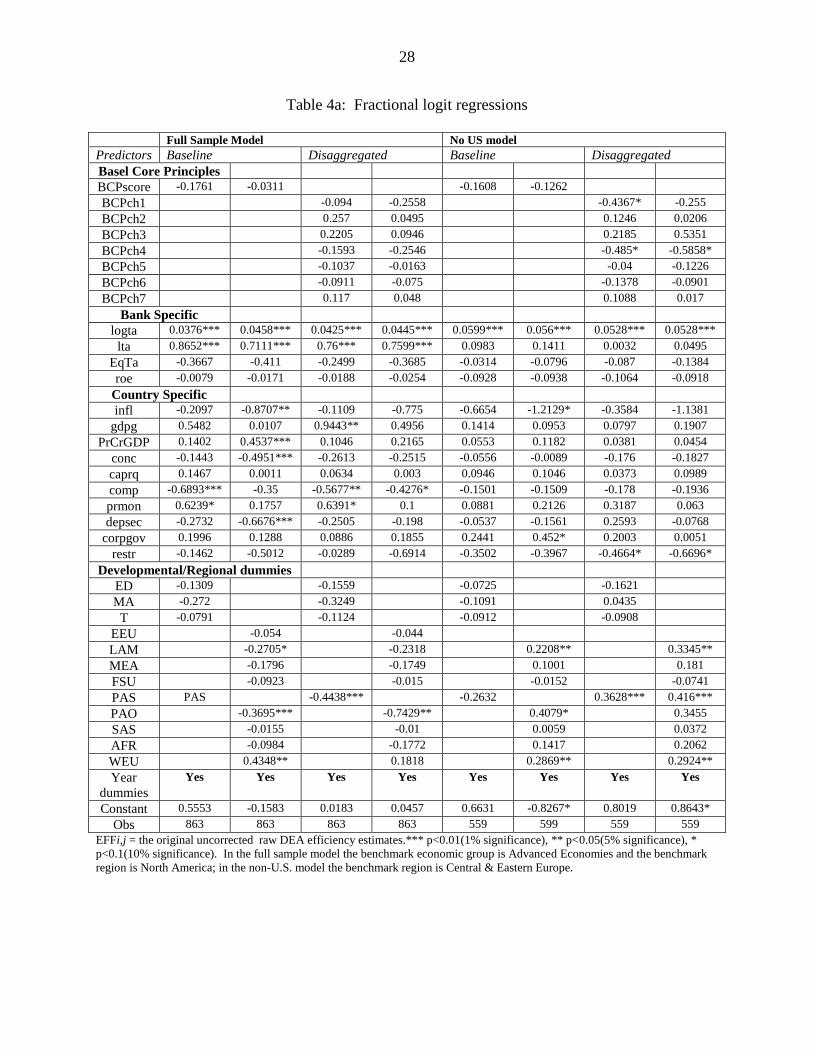
28
Table 4a: Fractional logit regressions
Full Sample Model No US model
Predictors Baseline Disaggregated Baseline Disaggregated
Basel Core Principles
BCPscore -0.1761 -0.0311 -0.1608 -0.1262
BCPch1 -0.094 -0.2558 -0.4367* -0.255
BCPch2 0.257 0.0495 0.1246 0.0206
BCPch3 0.2205 0.0946 0.2185 0.5351
BCPch4 -0.1593 -0.2546 -0.485* -0.5858*
BCPch5 -0.1037 -0.0163 -0.04 -0.1226
BCPch6 -0.0911 -0.075 -0.1378 -0.0901
BCPch7 0.117 0.048 0.1088 0.017
Bank Specific
logta 0.0376*** 0.0458*** 0.0425*** 0.0445*** 0.0599*** 0.056*** 0.0528*** 0.0528***
lta 0.8652*** 0.7111*** 0.76*** 0.7599*** 0.0983 0.1411 0.0032 0.0495
EqTa -0.3667 -0.411 -0.2499 -0.3685 -0.0314 -0.0796 -0.087 -0.1384
roe -0.0079 -0.0171 -0.0188 -0.0254 -0.0928 -0.0938 -0.1064 -0.0918
Country Specific
infl -0.2097 -0.8707** -0.1109 -0.775 -0.6654 -1.2129* -0.3584 -1.1381
gdpg 0.5482 0.0107 0.9443** 0.4956 0.1414 0.0953 0.0797 0.1907
PrCrGDP 0.1402 0.4537*** 0.1046 0.2165 0.0553 0.1182 0.0381 0.0454
conc -0.1443 -0.4951*** -0.2613 -0.2515 -0.0556 -0.0089 -0.176 -0.1827
caprq 0.1467 0.0011 0.0634 0.003 0.0946 0.1046 0.0373 0.0989
comp -0.6893*** -0.35 -0.5677** -0.4276* -0.1501 -0.1509 -0.178 -0.1936
prmon 0.6239* 0.1757 0.6391* 0.1 0.0881 0.2126 0.3187 0.063
depsec -0.2732 -0.6676*** -0.2505 -0.198 -0.0537 -0.1561 0.2593 -0.0768
corpgov 0.1996 0.1288 0.0886 0.1855 0.2441 0.452* 0.2003 0.0051
restr -0.1462 -0.5012 -0.0289 -0.6914 -0.3502 -0.3967 -0.4664* -0.6696*
Developmental/Regional dummies
ED -0.1309 -0.1559 -0.0725 -0.1621
MA -0.272 -0.3249 -0.1091 0.0435
T -0.0791 -0.1124 -0.0912 -0.0908
EEU -0.054 -0.044
LAM -0.2705* -0.2318 0.2208** 0.3345**
MEA -0.1796 -0.1749 0.1001 0.181
FSU -0.0923 -0.015 -0.0152 -0.0741
PAS PAS -0.4438*** -0.2632 0.3628*** 0.416***
PAO -0.3695*** -0.7429** 0.4079* 0.3455
SAS -0.0155 -0.01 0.0059 0.0372
AFR -0.0984 -0.1772 0.1417 0.2062
WEU 0.4348** 0.1818 0.2869** 0.2924**
Year
dummies
Yes Yes Yes Yes Yes Yes Yes Yes
Constant 0.5553 -0.1583 0.0183 0.0457 0.6631 -0.8267* 0.8019 0.8643*
Obs 863 863 863 863 559 599 559 559
EFFi,j = the original uncorrected raw DEA efficiency estimates.*** p<0.01(1% significance), ** p<0.05(5% significance), *
p<0.1(10% significance). In the full sample model the benchmark economic group is Advanced Economies and the benchmark
region is North America; in the non-U.S. model the benchmark region is Central & Eastern Europe.
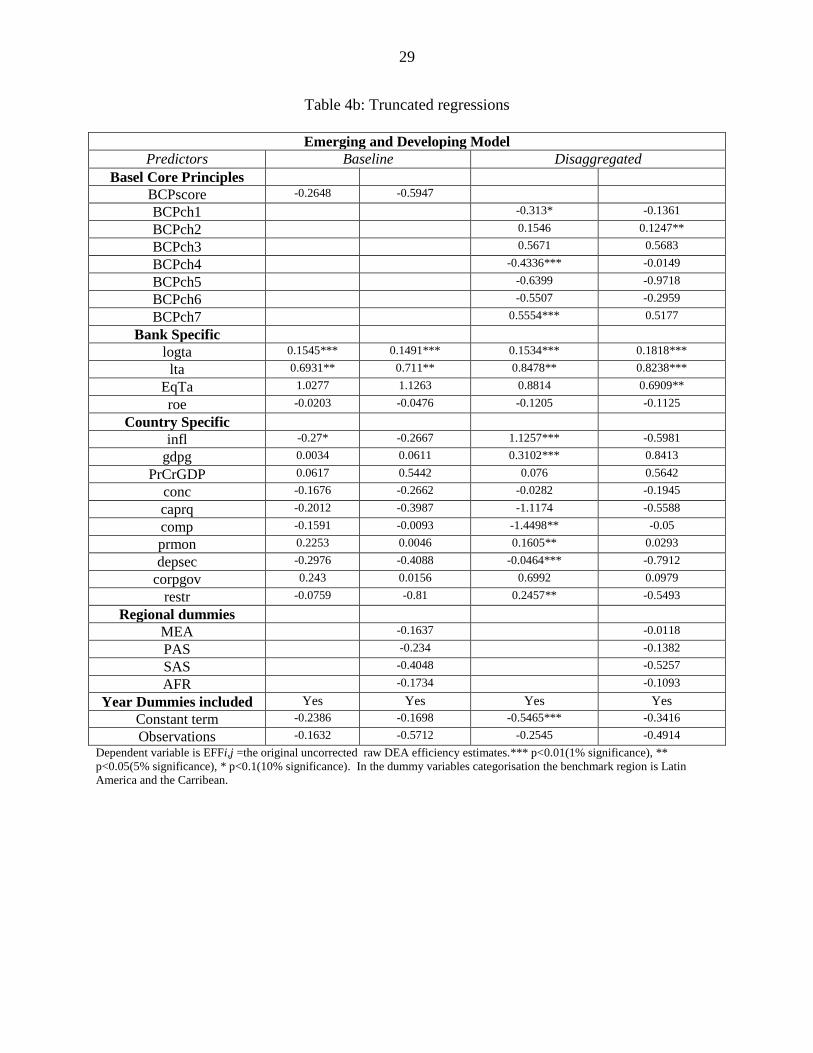
29
Table 4b: Truncated regressions
Emerging and Developing Model
Predictors Baseline Disaggregated
Basel Core Principles
BCPscore -0.2648 -0.5947
BCPch1 -0.313* -0.1361
BCPch2 0.1546 0.1247**
BCPch3 0.5671 0.5683
BCPch4 -0.4336*** -0.0149
BCPch5 -0.6399 -0.9718
BCPch6 -0.5507 -0.2959
BCPch7 0.5554*** 0.5177
Bank Specific
logta 0.1545*** 0.1491*** 0.1534*** 0.1818***
lta 0.6931** 0.711** 0.8478** 0.8238***
EqTa 1.0277 1.1263 0.8814 0.6909**
roe -0.0203 -0.0476 -0.1205 -0.1125
Country Specific
infl -0.27* -0.2667 1.1257*** -0.5981
gdpg 0.0034 0.0611 0.3102*** 0.8413
PrCrGDP 0.0617 0.5442 0.076 0.5642
conc -0.1676 -0.2662 -0.0282 -0.1945
caprq -0.2012 -0.3987 -1.1174 -0.5588
comp -0.1591 -0.0093 -1.4498** -0.05
prmon 0.2253 0.0046 0.1605** 0.0293
depsec -0.2976 -0.4088 -0.0464*** -0.7912
corpgov 0.243 0.0156 0.6992 0.0979
restr -0.0759 -0.81 0.2457** -0.5493
Regional dummies
MEA -0.1637 -0.0118
PAS -0.234 -0.1382
SAS -0.4048 -0.5257
AFR -0.1734 -0.1093
Year Dummies included Yes Yes Yes Yes
Constant term -0.2386 -0.1698 -0.5465*** -0.3416
Observations -0.1632 -0.5712 -0.2545 -0.4914
Dependent variable is EFFi,j =the original uncorrected raw DEA efficiency estimates.*** p<0.01(1% significance), **
p<0.05(5% significance), * p<0.1(10% significance). In the dummy variables categorisation the benchmark region is Latin
America and the Carribean.
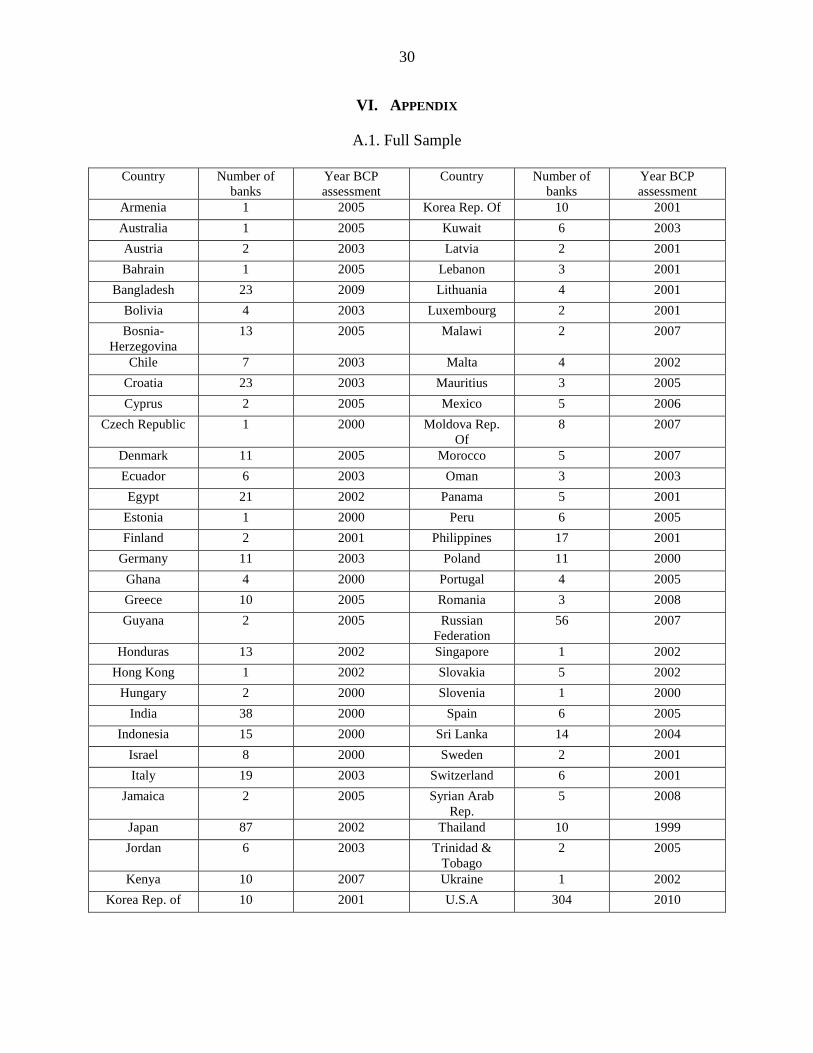
30
VI. APPENDIX
A.1. Full Sample
Country Number of
banks
Year BCP
assessment
Country Number of
banks
Year BCP
assessment
Armenia 1 2005 Korea Rep. Of 10 2001
Australia 1 2005 Kuwait 6 2003
Austria 2 2003 Latvia 2 2001
Bahrain 1 2005 Lebanon 3 2001
Bangladesh 23 2009 Lithuania 4 2001
Bolivia 4 2003 Luxembourg 2 2001
Bosnia-
Herzegovina
13 2005 Malawi 2 2007
Chile 7 2003 Malta 4 2002
Croatia 23 2003 Mauritius 3 2005
Cyprus 2 2005 Mexico 5 2006
Czech Republic 1 2000 Moldova Rep.
Of
8 2007
Denmark 11 2005 Morocco 5 2007
Ecuador 6 2003 Oman 3 2003
Egypt 21 2002 Panama 5 2001
Estonia 1 2000 Peru 6 2005
Finland 2 2001 Philippines 17 2001
Germany 11 2003 Poland 11 2000
Ghana 4 2000 Portugal 4 2005
Greece 10 2005 Romania 3 2008
Guyana 2 2005 Russian
Federation
56 2007
Honduras 13 2002 Singapore 1 2002
Hong Kong 1 2002 Slovakia 5 2002
Hungary 2 2000 Slovenia 1 2000
India 38 2000 Spain 6 2005
Indonesia 15 2000 Sri Lanka 14 2004
Israel 8 2000 Sweden 2 2001
Italy 19 2003 Switzerland 6 2001
Jamaica 2 2005 Syrian Arab
Rep.
5 2008
Japan 87 2002 Thailand 10 1999
Jordan 6 2003 Trinidad &
Tobago
2 2005
Kenya 10 2007 Ukraine 1 2002
Korea Rep. of 10 2001 U.S.A 304 2010
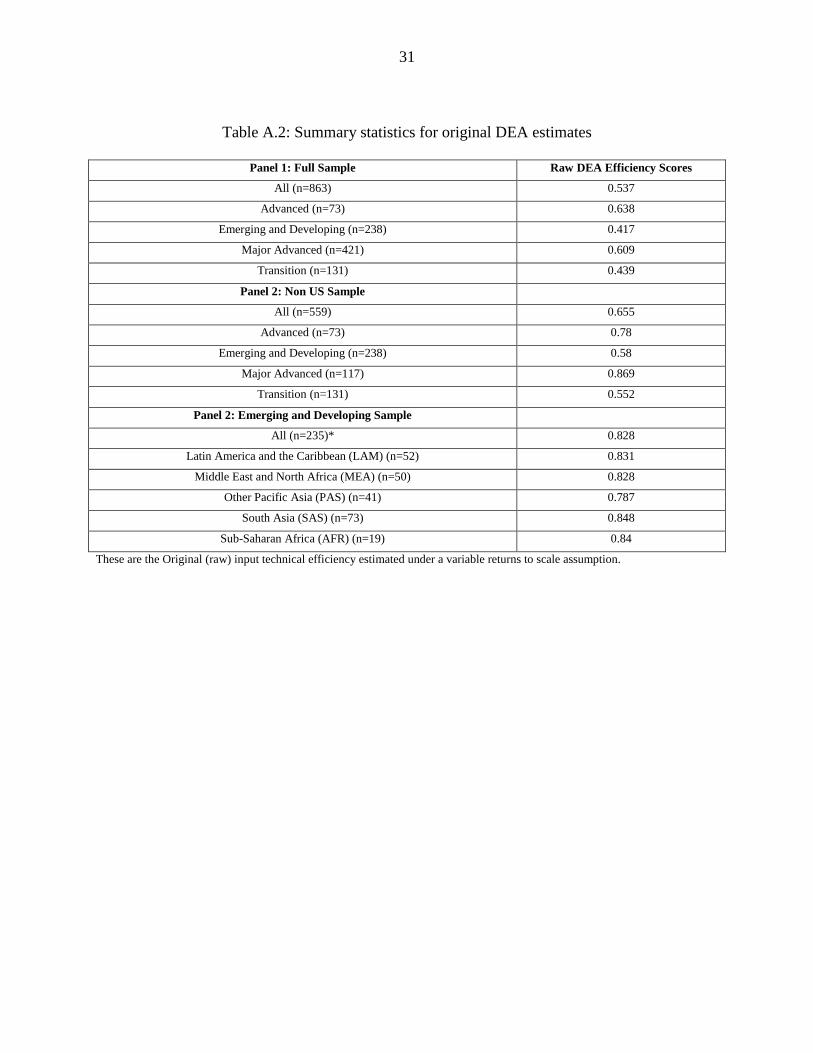
31
Table A.2: Summary statistics for original DEA estimates
Panel 1: Full Sample Raw DEA Efficiency Scores
All (n=863) 0.537
Advanced (n=73) 0.638
Emerging and Developing (n=238) 0.417
Major Advanced (n=421) 0.609
Transition (n=131) 0.439
Panel 2: Non US Sample
All (n=559) 0.655
Advanced (n=73) 0.78
Emerging and Developing (n=238) 0.58
Major Advanced (n=117) 0.869
Transition (n=131) 0.552
Panel 2: Emerging and Developing Sample
All (n=235)* 0.828
Latin America and the Caribbean (LAM) (n=52) 0.831
Middle East and North Africa (MEA) (n=50) 0.828
Other Pacific Asia (PAS) (n=41) 0.787
South Asia (SAS) (n=73) 0.848
Sub-Saharan Africa (AFR) (n=19) 0.84
These are the Original (raw) input technical efficiency estimated under a variable returns to scale assumption.

Table A.3: Variable definitions
Variables Definition Original Source
Financial Intermediation Model
Bank outputs
Loans Total loans (mil USD) Bankscope
Other earning assets Total other earning assets (mil USD) Bankscope
Non-interest income Total noninterest income and other fee-based income (mil USD). This measure accounts for
nontraditional banking activities in the financial intermediation process.
Bankscope
Bank inputs
Customer deposits and short term
funding
Total customer deposits and short-term funding (mil USD) Bankscope
Total costs Total of interest and noninterest expenses (mil USD) Bankscope
Equity Capital Total Equity (mil USD). This measure is used to adequately capture the impact of risk in the financial
intermediation process.
Bankscope
Other Variables
Dependent variables in regression models
EFFraw,i,j Original (raw) DEA input technical efficiency estimates. These scores are calculated in the first step of
our analysis before the application of the Simar and Wilson (2007) double bootstrapping procedure.
Authors’ calculation
EFFbc,i,j Bias-corrected DEA input technical efficiency estimates. These scores result from the application of the
first bootstrap of the Simar and Wilson (2007) double bootstrapping procedure on the raw DEA
estimates.
Authors’ calculation
Macroeconomic and financial conditions variables
Infl An annual rate of inflation measured as the percentage change in the consumer price index. World Bank Indicators (WDI)
Gdpg A measure of the economic conditions under which a bank operates. It is defined as the real annual
growth in GDP.
World Bank Indicators (WDI)
PrCrGDP A ratio of private sector credit to gross domestic product that measures the level of financial
development.
World Bank Indicators (WDI)
Conc A measure of market concentration, which is calculated as the ratio of the assets of three largest banks to
the assets of all publicly traded banks.
Thorsten Beck, Aslı Demirgüç-
Kunt and Ross Levine, (2000), "A
New Database on Financial
Development and
Structure," World Bank Economic
Review 14, 597-605. (Dataset
updated April 2013)
Regulatory conditions variables
Caprq Measures whether capital requirements reflect certain risk elements and deducts certain market value
losses from capital adequacy. It is an index that is the normalised sum of the answers to the following
questions (yes=1, no=0). (1) Is the minimum required capital asset ratio risk-weighted in line with Basle
guidelines? (2) Does the ratio vary as a function of individual credit risk? (3) Does the ratio vary with
market risk? (4) Before minimum capital adequacy is determined, which of the following are deducted
from the book value of capital: (a) market value of loan losses not realised in accounting books? (b)
Unrealised losses in securities portfolios? (c) Unrealised foreign exchange losses? It takes values
(Barth, Caprio, and Levine 2006)
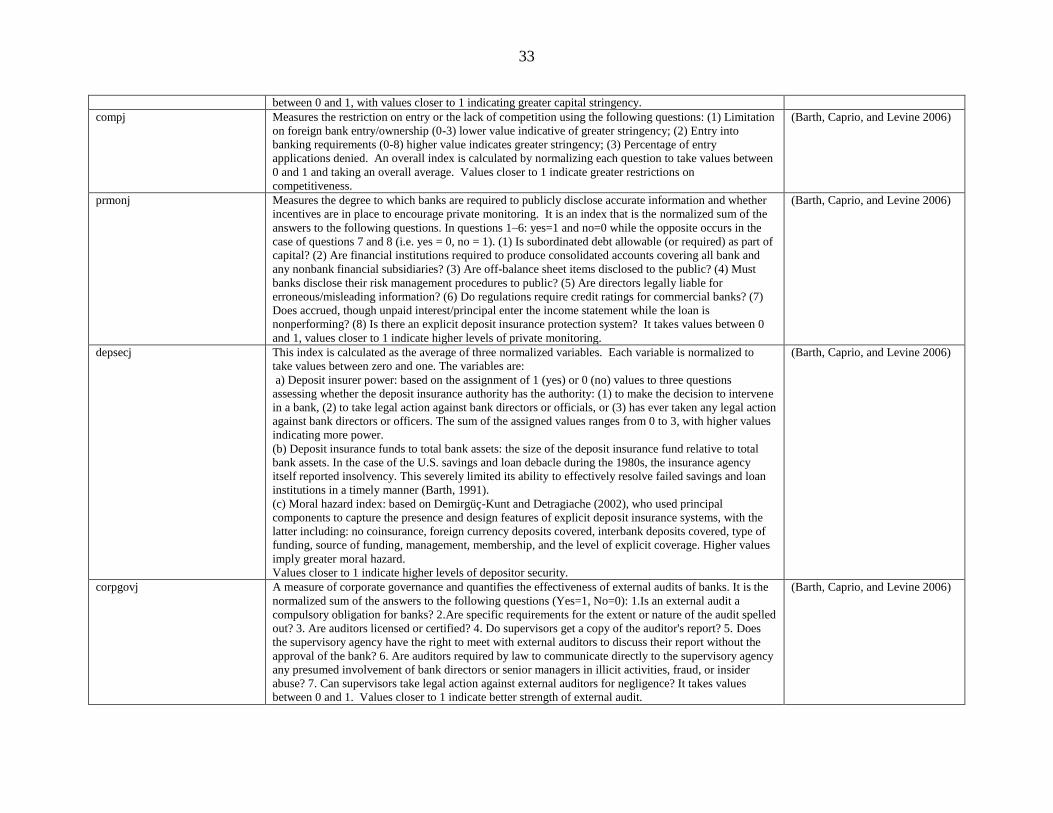
33
between 0 and 1, with values closer to 1 indicating greater capital stringency.
compj Measures the restriction on entry or the lack of competition using the following questions: (1) Limitation
on foreign bank entry/ownership (0-3) lower value indicative of greater stringency; (2) Entry into
banking requirements (0-8) higher value indicates greater stringency; (3) Percentage of entry
applications denied. An overall index is calculated by normalizing each question to take values between
0 and 1 and taking an overall average. Values closer to 1 indicate greater restrictions on
competitiveness.
(Barth, Caprio, and Levine 2006)
prmonj Measures the degree to which banks are required to publicly disclose accurate information and whether
incentives are in place to encourage private monitoring. It is an index that is the normalized sum of the
answers to the following questions. In questions 1–6: yes=1 and no=0 while the opposite occurs in the
case of questions 7 and 8 (i.e. yes = 0, no = 1). (1) Is subordinated debt allowable (or required) as part of
capital? (2) Are financial institutions required to produce consolidated accounts covering all bank and
any nonbank financial subsidiaries? (3) Are off-balance sheet items disclosed to the public? (4) Must
banks disclose their risk management procedures to public? (5) Are directors legally liable for
erroneous/misleading information? (6) Do regulations require credit ratings for commercial banks? (7)
Does accrued, though unpaid interest/principal enter the income statement while the loan is
nonperforming? (8) Is there an explicit deposit insurance protection system? It takes values between 0
and 1, values closer to 1 indicate higher levels of private monitoring.
(Barth, Caprio, and Levine 2006)
depsecj This index is calculated as the average of three normalized variables. Each variable is normalized to
take values between zero and one. The variables are:
a) Deposit insurer power: based on the assignment of 1 (yes) or 0 (no) values to three questions
assessing whether the deposit insurance authority has the authority: (1) to make the decision to intervene
in a bank, (2) to take legal action against bank directors or officials, or (3) has ever taken any legal action
against bank directors or officers. The sum of the assigned values ranges from 0 to 3, with higher values
indicating more power.
(b) Deposit insurance funds to total bank assets: the size of the deposit insurance fund relative to total
bank assets. In the case of the U.S. savings and loan debacle during the 1980s, the insurance agency
itself reported insolvency. This severely limited its ability to effectively resolve failed savings and loan
institutions in a timely manner (Barth, 1991).
(c) Moral hazard index: based on Demirgüç-Kunt and Detragiache (2002), who used principal
components to capture the presence and design features of explicit deposit insurance systems, with the
latter including: no coinsurance, foreign currency deposits covered, interbank deposits covered, type of
funding, source of funding, management, membership, and the level of explicit coverage. Higher values
imply greater moral hazard.
Values closer to 1 indicate higher levels of depositor security.
(Barth, Caprio, and Levine 2006)
corpgovj A measure of corporate governance and quantifies the effectiveness of external audits of banks. It is the
normalized sum of the answers to the following questions (Yes=1, No=0): 1.Is an external audit a
compulsory obligation for banks? 2.Are specific requirements for the extent or nature of the audit spelled
out? 3. Are auditors licensed or certified? 4. Do supervisors get a copy of the auditor's report? 5. Does
the supervisory agency have the right to meet with external auditors to discuss their report without the
approval of the bank? 6. Are auditors required by law to communicate directly to the supervisory agency
any presumed involvement of bank directors or senior managers in illicit activities, fraud, or insider
abuse? 7. Can supervisors take legal action against external auditors for negligence? It takes values
between 0 and 1. Values closer to 1 indicate better strength of external audit.
(Barth, Caprio, and Levine 2006)

34
restrj This measures the extent to which a bank can participate in: (1) securities activities; (2) insurance
activities; (3) real estate activities; (4) bank ownership of nonfinancial firms ; (5) Nonfinancial firms
owning banks; and (6) Nonbank financial firms owning banks. These activities can be; unrestricted=1:
full range of activities can be conducted directly in the bank; permitted=2: full range of activities can be
conducted but some must be done within subsidiaries; restricted=3: less than full range of activities can
be conducted in the bank or subsidiaries; and prohibited=4: the activities cannot be conducted in the
bank or subsidiaries. Summing all values and normalizing the result to be between 0 and 1 creates an
overall index. Values closer to 1 indicate greater restrictiveness.
(Barth, Caprio, and Levine 2006)
BCP compliance variables Twenty-five individual compliance rates based on each of the BCPs are used in the constructions of the
below variables. Each rate is based on a four-point scale: noncompliant=0; materially noncompliant=1;
largely compliant=3; and compliant=4. These 25 are categorized into seven chapters which represent
different regulatory dimensions of supervision. The first seven variables below represent each of these
chapters.
BCPCh1 (Chapter 1) Measures the extent to which the preconditions for effective banking supervision have been met. This
index is a normalized sum of the rates of compliance with sub-principles of principle 1: 1(1): There
should be clear responsibilities and objectives set by legislation for each supervisory agency; 1(2): Each
supervisory agency should possess adequate resources to meet the objective set, provided on terms that
do not undermine the autonomy, integrity and independence of supervisory agency; 1(3): A suitable
framework of banking laws, setting bank minimum standard, including provisions related to
authorization of banking establishments and their supervision; 1(4): The legal framework should provide
power to address compliance with laws as well as safety and soundness concerns; 1(5): The legal
framework should provide protection of supervisors for actions taken in good faith in the course of
performing supervisory duties; and 1(6): There should be arrangements of interagency cooperation,
including with foreign supervisors, for sharing information and protecting the confidentiality of such
information. This index takes values between 0 and 1, with values closer to 1 indicative of better
adherence to these preconditions.
IMF/World Bank Basel Core
Financial Sector Assessment
Program (FSAP) database.
BCPCh2 (Chapter 2) A measure of the power of supervisors to grant banks licences and review major financial transactions.
This index is a normalized sum of the compliance rates of principles 2-5; 2: Definition of permissible
activities; 3: Right to set licensing criteria and reject applications for establishments that do not meet the
standard sets; 4: Authority to review and reject proposals for significant ownership changes; and 5:
Authority to establish criteria for reviewing major acquisitions or investments. This index takes values
between 0 and 1, with values closer to 1 indicative of greater power of supervisors to licence and
influence structure.
IMF/World Bank Basel Core
Financial Sector Assessment
Program (FSAP) database.
BCPCh3 (Chapter 3) Measures the prudence and appropriateness of the minimum capital adequacy requirements that
supervisors set. This index is the normalized sum of the rates of compliance with principles 6–15: 6:
Prudent and appropriate risk-adjusted capital adequacy ratios must be set; 7: Supervisors should evaluate
banks’ credit policies; 8: Banks should adhere to adequate loan evaluation and loan-loss provisioning
policies; 9: Supervisors should set limits to restrict large exposures, and concentration in bank portfolios
should be identifiable; 10: Supervisors must have in place requirements to mitigate the risks associated
with related lending; 11: Policies must be in place to identify, monitor, and control country risks, and to
maintain reserves against such risks; 12: Systems must be in place to accurately measure, monitor, and
adequately control markets risks, and supervisors should have powers to impose limits or capital charge
on such exposures; 13: Banks must have in place a comprehensive risk management process to identify,
measure, monitor, and control all other material risks and, if needed, hold capital against such risks; 14:
IMF/World Bank Basel Core
Financial Sector Assessment
Program (FSAP) database.

35
Banks should have internal control and audit systems in place; and 15: Adequate policies, practices, and
procedures should be in place to promote high ethical and professional standards and prevent the bank
being used by criminal elements. This index takes values between 0 and 1, with values closer to 1
indicating a greater compliance cost for banks of adherence to the minimum capital requirements.
BCPCh4 (Chapter 4) This measures the extent of the ongoing supervision. This index is calculated as the normalized sum of
the rates of compliance rates with principles 16–20: 16: An effective supervisory system should consist
of on-site and off-site supervision; 17: Supervisors should have regular contact with bank management;
18: Supervisors must have a means of collecting, reviewing, and analysing prudential reports and
statistics returns from banks on a solo and consolidated basis; 19: Supervisors must have a means of
independent validation of supervisory information, either through on-site examinations or use of external
auditors; and 20: Supervisors must have the ability to supervise banking groups on a consolidated basis.
This index takes values between 0 and 1, with values closer to 1 indicative of higher levels of on-going
supervision.
IMF/World Bank Basel Core
Financial Sector Assessment
Program (FSAP) database.
BCPCh5 (Chapter 5) A measure of the required extent of a bank’s internal financial records. This variable is the normalized
compliance rate for principle 21: Each bank must maintain adequate records that enable the supervisor to
obtain a true and fair view of the financial condition of the bank, and must publish on a regular basis
financial statements that fairly reflect its condition. This variable takes values between 0 and 1, with
values closer to 1 indicative of the increased information requirements placed on banks by supervisors.
IMF/World Bank Basel Core
Financial Sector Assessment
Program (FSAP) database.
BCPCh6 (Chapter 6) A measure of the formal powers of supervisors, calculated as the normalized compliance rate of
principle 22: Adequate supervisory measures must be in place to bring about corrective action when
banks fail to meet prudential requirements when there are regulatory violations, or when depositors are
threatened in any other way. This should include the ability to revoke the banking license or recommend
its revocation. This variable takes values between 0 and 1, with values closer to 1 indicative of greater
supervisory powers.
IMF/World Bank Basel Core
Financial Sector Assessment
Program (FSAP) database.
BCPCh7 (Chapter 7) Measures the extent to which supervisors apply global consolidated supervision over internationally
active banks. This index is calculated as the normalized sum of the compliance rates of principles 23-25:
23: Supervisors must practice global consolidated supervision over internationally active banks,
adequately monitor, and apply prudential norms to all aspects of the business conducted by these banks;
24: Consolidated supervision should include establishing contact and information exchange with the
various supervisors involved, primarily host country supervisory authorities; 25: Supervisors must
require the local operations of foreign banks to be conducted at the same standards as required of
domestic institutions, and must have powers to share information needed by the home country
supervisors of those banks. This index takes values between 0 and 1, with values closer to 1 indicative
of increased practice of global consolidated supervision.
IMF/World Bank Basel Core
Financial Sector Assessment
Program (FSAP) database.
BCPScore Finally, following (Demirgüç-Kunt and Detragiache 2011), an overall index is created by taking the
mean value of all seven chapter indices above. This index takes values between 0 and 1, with values
closer to 1 indicative of increased overall compliance with the BCPs.
IMF/World Bank Basel Core
Financial Sector Assessment
Program (FSAP) database.
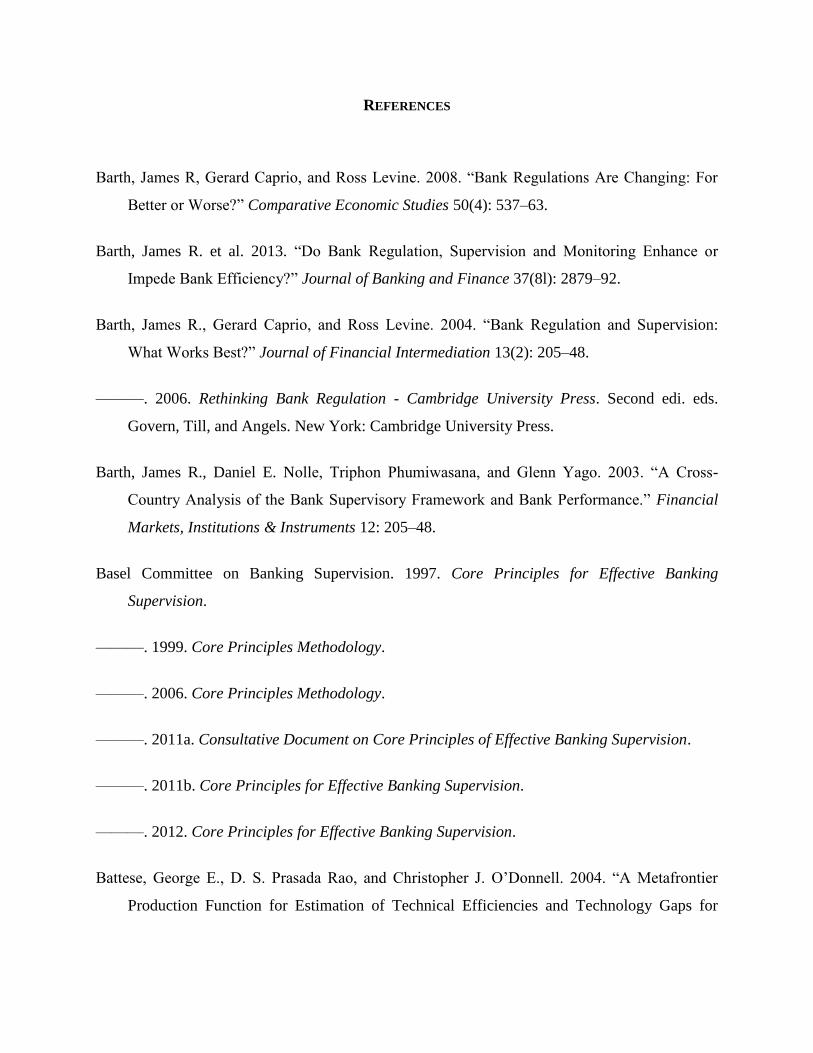
REFERENCES
Barth, James R, Gerard Caprio, and Ross Levine. 2008. “Bank Regulations Are Changing: For
Better or Worse?” Comparative Economic Studies 50(4): 537–63.
Barth, James R. et al. 2013. “Do Bank Regulation, Supervision and Monitoring Enhance or
Impede Bank Efficiency?” Journal of Banking and Finance 37(8l): 2879–92.
Barth, James R., Gerard Caprio, and Ross Levine. 2004. “Bank Regulation and Supervision:
What Works Best?” Journal of Financial Intermediation 13(2): 205–48.
———. 2006. Rethinking Bank Regulation - Cambridge University Press. Second edi. eds.
Govern, Till, and Angels. New York: Cambridge University Press.
Barth, James R., Daniel E. Nolle, Triphon Phumiwasana, and Glenn Yago. 2003. “A Cross-
Country Analysis of the Bank Supervisory Framework and Bank Performance.” Financial
Markets, Institutions & Instruments 12: 205–48.
Basel Committee on Banking Supervision. 1997. Core Principles for Effective Banking
Supervision.
———. 1999. Core Principles Methodology.
———. 2006. Core Principles Methodology.
———. 2011a. Consultative Document on Core Principles of Effective Banking Supervision.
———. 2011b. Core Principles for Effective Banking Supervision.
———. 2012. Core Principles for Effective Banking Supervision.
Battese, George E., D. S. Prasada Rao, and Christopher J. O’Donnell. 2004. “A Metafrontier
Production Function for Estimation of Technical Efficiencies and Technology Gaps for
37
Firms Operating under Different Technologies.” In Journal of Productivity Analysis, , 91–
103.
Berger, Allen N. 2007. “International Comparisons of Banking Efficiency.” Financial Markets,
Institutions & Instruments 16(3): 119–44.
Berger, Allen N., and Timothy H. Hannan. 1998. “The Efficiency Cost Of Market Power In The
Banking Industry: A Test Of The ‘Quiet Life’ And Related Hypotheses.” The Review of
Economics and Statistics 80(3): 454–65.
Bogeoft, P., and L. Otto. 2011. Benchmarking with DEA, SFA, and R. New York: Springer.
Bos, J.W.B., and H. Schmeidel. 2007. “Is There a Single Frontier in a Single European Banking
Market ?” Journal of Banking & Finance 31: 2081–2012.
Brissimis, Sophocles N., Manthos D. Delis, and Nikolaos I. Papanikolaou. 2008. “Exploring the
Nexus between Banking Sector Reform and Performance: Evidence from Newly Acceded
EU Countries.” Journal of Banking & Finance 32(12): 2674–83.
Casu, Barbara, Alessandra Ferrari, and Tianshu Zhao. 2013. “Regulatory Reform and
Productivity Change in Indian Banking.” The Review of Economics and Statistics 95(3):
1066–77.
Casu, Barbara, and Philip Molyneux. 2003. “A Comparative Study of Efficiency in European
Banking.” Applied Economics 35(17): 1865–76.
Coelli, T.J., D.S.P Rao, C.J. O’Donnell, and G.E. Battese. 2005. An Introduction to Efficiency
and Productivity Analysis. 2nd ed. New: Springer.
Das, U.S., P. Iossifov, R Podpiera, and D. Rozkhov. 2005. “Quality of Financial Policies and
Financial System Stress.” IMF working paper 05/173.
Delis, Manthos D., and Nikolaos I. Papanikolaou. 2009. “Determinants of Bank Efficiency:
Evidence from a Semi-Parametric Methodology.” Managerial Finance 35(3): 260–75.
38
Demirgüç-Kunt, Asli, and Enrica Detragiache. 2011. “Basel Core Principles and Bank
Soundness: Does Compliance Matter?” Journal of Financial Stability 7(4): 179–90.
Demirgüç-Kunt, Asli, Enrica Detragiache, and Thierry Tressel. 2008. “Banking on the
Principles: Compliance with Basel Core Principles and Bank Soundness.” Journal of
Financial Intermediation 17(4): 511–42.
Demirgüç-Kunt, Asli, Luc Laeven, and Ross Levine. 2004. “Regulations, Market Structure,
Institutions, and the Cost of Financial Intermediation.” Journal of Money, Credit and
Banking 36: 593–622.
Feldstein, Martin S. 1972. “Equity and Efficiency in Public Sector Pricing: The Optimal Two-
Part Tariff.” The Quarterly Journal of Economics 86: pp. 175–187.
Glass, J. Colin, Donal G. McKillop, and Syamarlah Rasaratnam. 2010. “Irish Credit Unions:
Investigating Performance Determinants and the Opportunity Cost of Regulatory
Compliance.” Journal of Banking & Finance 34(1): 67–76.
Haldane, Andrew. 2013. Constraining Discretion in Bank Regulation. London.
Hughes, Joseph P., and Loretta J. Mester. 2010. “Efficiency in Banking: Theory, Practice and
Evidence.” In The Oxford Handbook of Banking, eds. Alan Berger, Phil Molyneux, and
John Wilson. Oxford Handbooks.
———. 2013. FRB of Philadelphia Working Paper No. 13-13 Who Said Large Banks Don’t
Experience Scale Economies? Evidence from a Risk-Return-Driven Cost Function.
———. 2014. “Measuring the Performance of Banks, Theory, Practice, Evidence, and Some
Policy Implications.” In Handbook of Banking, eds. John O.S. Wilson, Philip Molyneux,
and Allen N. Berger. Oxford University Press, 247–71.
IMF. 2014. Review Of The Financial Sector Assessment Program: Further Adaptation To The
Post Crisis Era Review Of The Financial Sector Assessment Program — Further
Adaptation To The Post-Crisis Era.
39
Kane, Edward J. 1977. “Good Intentions and Unintended Evil: The Case Against Selective
Credit Allocation.” Journal of Money, Credit and Banking 9: 55–69.
Kasman, Adnan, and Canan Yildirim. 2006. “Cost and Profit Efficiencies in Transition Banking:
The Case of New EU Members.” Applied Economics 38(9): 1079–90.
Laeven, Luc, and Ross Levine. 2008. Bank Governance, Regulation, and Risk Taking.
Lozano-Vivas, Ana, and Fotios Pasiouras. 2010. “The Impact of Non-Traditional Activities on
the Estimation of Bank Efficiency: International Evidence.” Journal of Banking and
Finance 34: 1436–49.
McDonald, John. 2009. “Using Least Squares and Tobit in Second Stage DEA Efficiency
Analyses.” European Journal of Operational Research 197(2): 792–98.
Papke, Leslie E, and Jeffrey M Wooldridge. 1996. “Econometric Methods for Fractional
Response Variables with an Application to 401 ( K ) Plan Participation Rates.” Journal of
Applied Econometrics 11(February): 619–32.
Pasiouras, Fotios. 2008. “International Evidence on the Impact of Regulations and Supervision
on Banks’ Technical Efficiency: An Application of Two-Stage Data Envelopment
Analysis.” Review of Quantitative Finance and Accounting 30(2): 187–223.
Pasiouras, Fotios, Sailesh Tanna, and Constantin Zopounidis. 2009. “The Impact of Banking
Regulations on Banks’ Cost and Profit Efficiency: Cross-Country Evidence.” International
Review of Financial Analysis 18(5): 294–302.
Podpiera, R. 2004. “Does Compliance with Basel Core Principles Bring Measurable Benefits ?”
IMF working paper 04/024 53(2): 306–26.
Sealey, C. W., and James T. Lindley. 1977. “Inputs, Outputs, and a Theory of Production and
Cost at Depository Financial Institutions.” The Journal of Finance 32(4): 1251–66.
40
Simar, Leopold, and Paul W. Wilson. 2007. “Estimation and Inference in Two-Stage, Semi-
Parametric Models of Production Processes.” Journal of Econometrics 136(1): 31–64.
Stigler, George J. 1971. “The Theory of Economic Regulation.” The Bell Journal of Economics
and Management Science 2: 3–21.
Sundararajan, V., D. Marston, and R. Basu. 2001. The Case of Basel Core Principles.
Washington.
Wilson, Paul W. 1995. “Detecting Influential Observations in Data Envelopment Analysis.”
Journal of Productivity Analysis 6(1): 27–45.