breadtalk group limitedbreadtalk.listedcompany.com/newsroom/20160803_182530_5da_l7kl… ·...
TRANSCRIPT
Financial Results
Second Quarter 2016
Bakery Food Atrium Restaurant
BreadTalk Group Limited
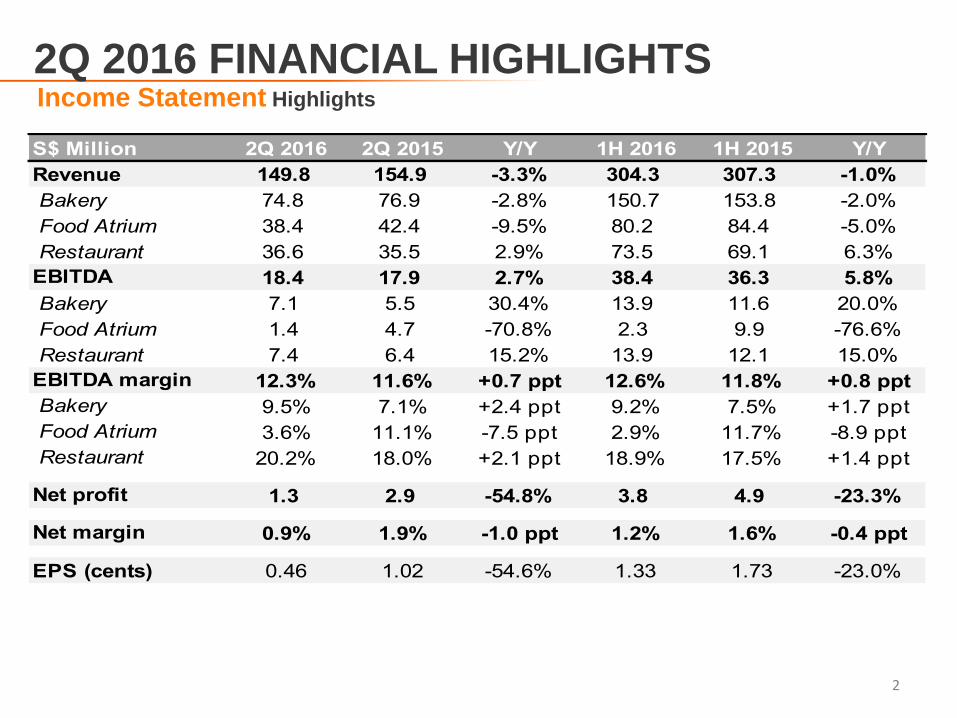
2Q 2016 FINANCIAL HIGHLIGHTS Income Statement Highlights
2
S$ Million 2Q 2016 2Q 2015 Y/Y 1H 2016 1H 2015 Y/Y
Revenue 149.8 154.9 -3.3% 304.3 307.3 -1.0%
Bakery 74.8 76.9 -2.8% 150.7 153.8 -2.0%
Food Atrium 38.4 42.4 -9.5% 80.2 84.4 -5.0%
Restaurant 36.6 35.5 2.9% 73.5 69.1 6.3%
EBITDA 18.4 17.9 2.7% 38.4 36.3 5.8%
Bakery 7.1 5.5 30.4% 13.9 11.6 20.0%
Food Atrium 1.4 4.7 -70.8% 2.3 9.9 -76.6%
Restaurant 7.4 6.4 15.2% 13.9 12.1 15.0%
EBITDA margin 12.3% 11.6% +0.7 ppt 12.6% 11.8% +0.8 ppt
Bakery 9.5% 7.1% +2.4 ppt 9.2% 7.5% +1.7 ppt
Food Atrium 3.6% 11.1% -7.5 ppt 2.9% 11.7% -8.9 ppt
Restaurant 20.2% 18.0% +2.1 ppt 18.9% 17.5% +1.4 ppt
Net profit 1.3 2.9 -54.8% 3.8 4.9 -23.3%
Net margin 0.9% 1.9% -1.0 ppt 1.2% 1.6% -0.4 ppt
EPS (cents) 0.46 1.02 -54.6% 1.33 1.73 -23.0%
3
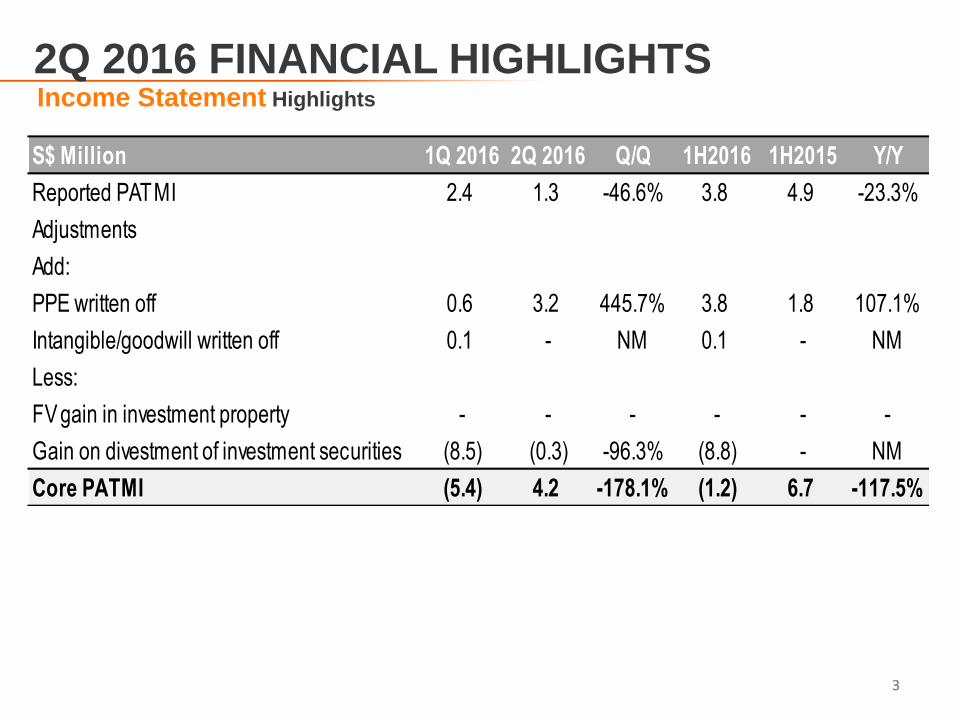
2Q 2016 FINANCIAL HIGHLIGHTS Income Statement Highlights
3
S$ Million 1Q 2016 2Q 2016 Q/Q 1H2016 1H2015 Y/Y
Reported PATMI 2.4 1.3 -46.6% 3.8 4.9 -23.3%
Adjustments
Add:
PPE written off 0.6 3.2 445.7% 3.8 1.8 107.1%
Intangible/goodwill written off 0.1 - NM 0.1 - NM
Less:
FV gain in investment property - - - - - -
Gain on divestment of investment securities (8.5) (0.3) -96.3% (8.8) - NM
Core PATMI (5.4) 4.2 -178.1% (1.2) 6.7 -117.5%
4
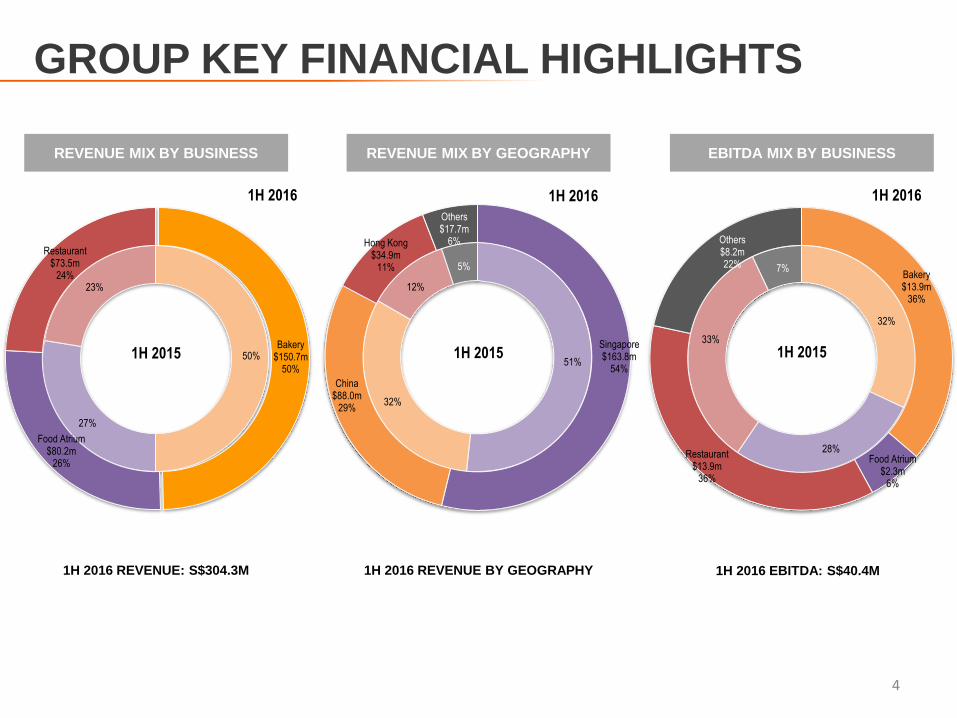
GROUP KEY FINANCIAL HIGHLIGHTS
1H 2016 REVENUE: S$304.3M 1H 2016 REVENUE BY GEOGRAPHY 1H 2016 EBITDA: S$40.4M
EBITDA MIX BY BUSINESS REVENUE MIX BY GEOGRAPHY REVENUE MIX BY BUSINESS
50%
27%
23%
Bakery $150.7m
50%
Food Atrium $80.2m
26%
Restaurant $73.5m
24%
1H 2015
1H 2016
51%
32%
12%
5%
Singapore $163.8m
54%
China $88.0m
29%
Hong Kong $34.9m
11%
Others $17.7m
6%
1H 2015
1H 2016
32%
28%
33%
7% Bakery $13.9m
36%
Food Atrium $2.3m
6%
Restaurant $13.9m
36%
Others $8.2m 22%
1H 2016
1H 2015
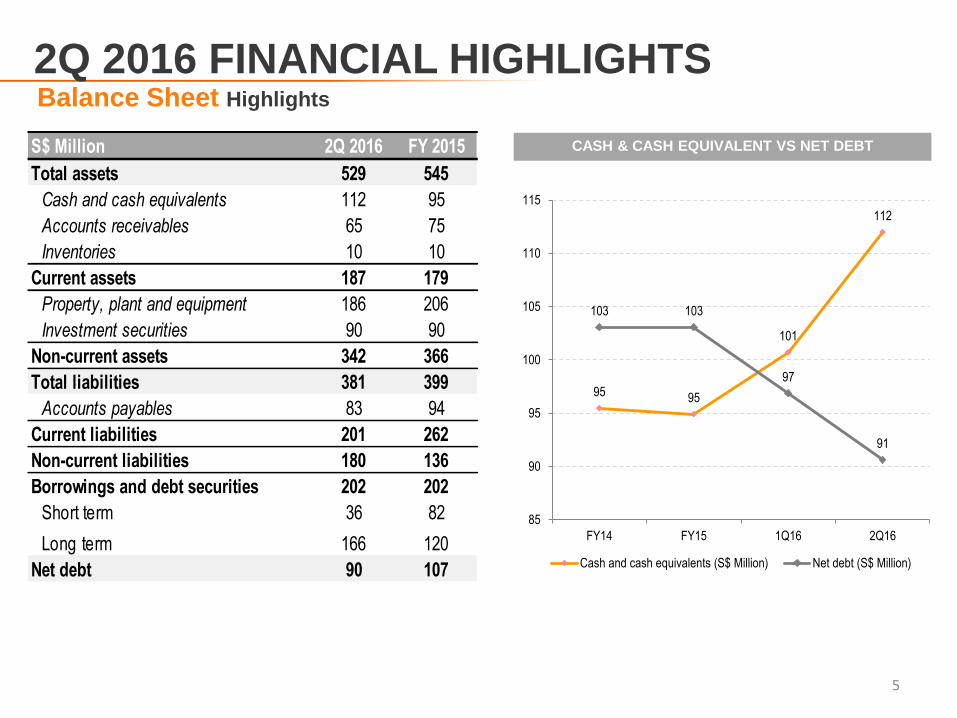
2Q 2016 FINANCIAL HIGHLIGHTS Balance Sheet Highlights
5
CASH & CASH EQUIVALENT VS NET DEBT
95 95
101
112
103 103
97
91
85
90
95
100
105
110
115
FY14 FY15 1Q16 2Q16
Cash and cash equivalents (S$ Million) Net debt (S$ Million)
S$ Million 2Q 2016 FY 2015
Total assets 529 545
Cash and cash equivalents 112 95
Accounts receivables 65 75
Inventories 10 10
Current assets 187 179
Property, plant and equipment 186 206
Investment securities 90 90
Non-current assets 342 366
Total liabilities 381 399
Accounts payables 83 94
Current liabilities 201 262
Non-current liabilities 180 136
Borrowings and debt securities 202 202
Short term 36 82
Long term 166 120
Net debt 90 107
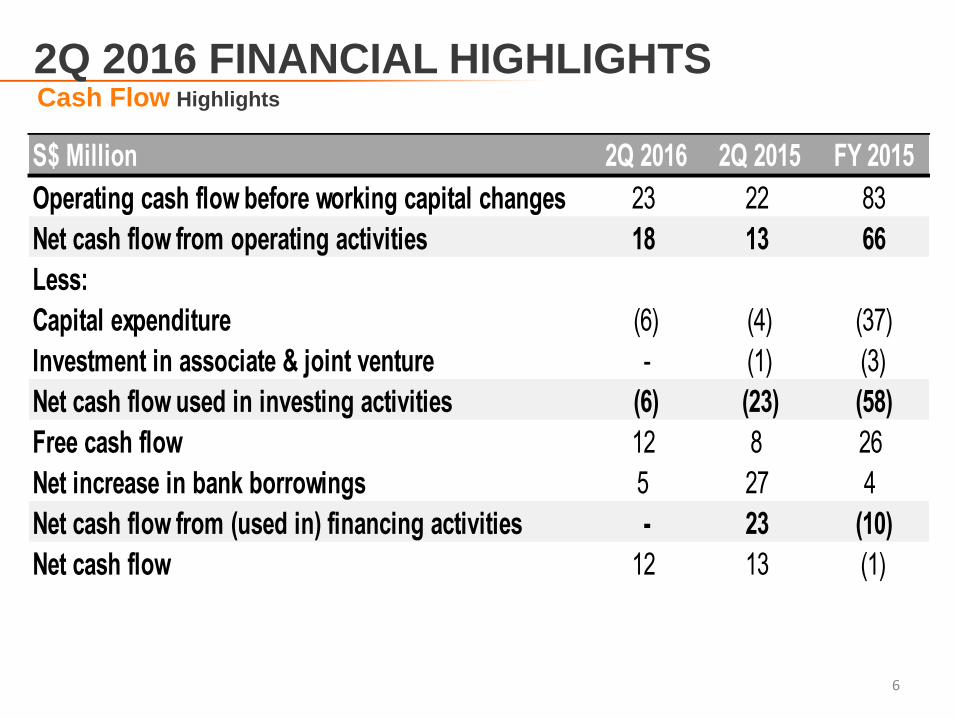
2Q 2016 FINANCIAL HIGHLIGHTS Cash Flow Highlights
6
S$ Million 2Q 2016 2Q 2015 FY 2015
Operating cash flow before working capital changes 23 22 83
Net cash flow from operating activities 18 13 66
Less:
Capital expenditure (6) (4) (37)
Investment in associate & joint venture - (1) (3)
Net cash flow used in investing activities (6) (23) (58)
Free cash flow 12 8 26
Net increase in bank borrowings 5 27 4
Net cash flow from (used in) financing activities - 23 (10)
Net cash flow 12 13 (1)

7
2Q 2016 FINANCIAL HIGHLIGHTS Financial Ratios
1H 2016 1H 2015 FY 2015
Trade Receivables Turnover (days) - Franchisee 81 65 93
Trade Receivables Turnover (days) - Non franchisee 2 2 2
Total Receivables Turnover (days) 7 7 8
Inventory Turnover (days) 25 26 24
Trade Payables Turnover (days) 28 29 27
Cash Conversion Cycle (days) 3 3 4
Net Debt/Shareholder's Equity 0.71x 1.24x 0.83x
Net Debt/EBITDA 2.23x 3.59x 1.38x
EBITDA/Interest expense 13.15x 14.72x 14.56x
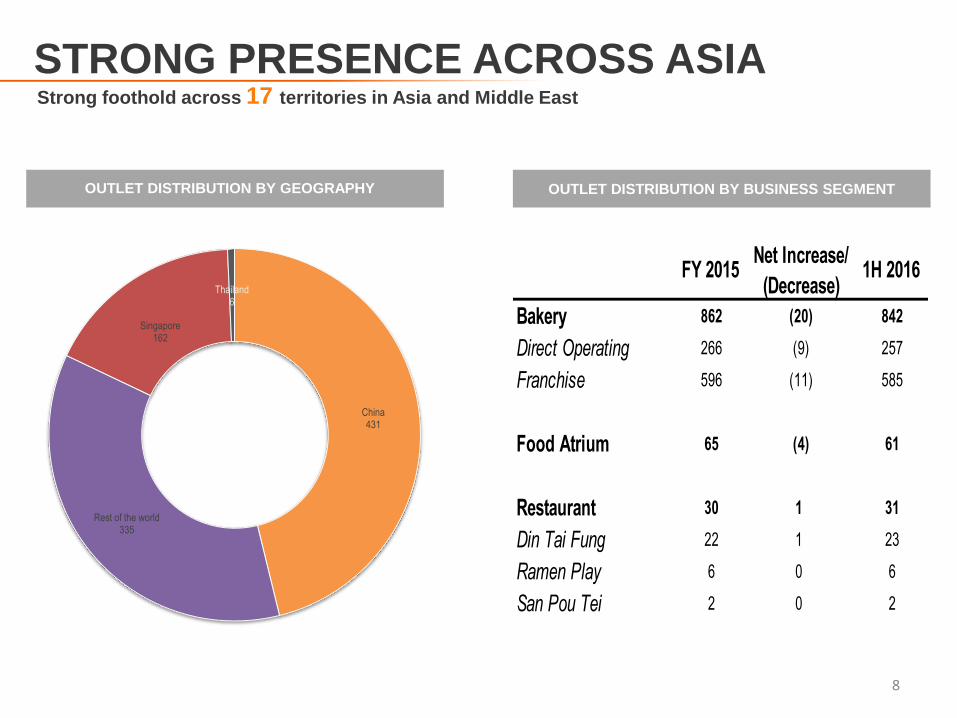
STRONG PRESENCE ACROSS ASIA Strong foothold across 17 territories in Asia and Middle East
8
OUTLET DISTRIBUTION BY GEOGRAPHY OUTLET DISTRIBUTION BY BUSINESS SEGMENT
China 431
Rest of the world 335
Singapore 162
Thailand 6
Bakery 862 (20) 842
Direct Operating 266 (9) 257
Franchise 596 (11) 585
Food Atrium 65 (4) 61
Restaurant 30 1 31
Din Tai Fung 22 1 23
Ramen Play 6 0 6
San Pou Tei 2 0 2
FY 2015Net Increase/
(Decrease)1H 2016
*Including SEA are Malaysia, Thailand, Philippines, Indonesia, Vietnam and Cambodia #Including International are Kuwait, Sri Lanka, Bahrain, Oman, Saudi Arabia and Qatar
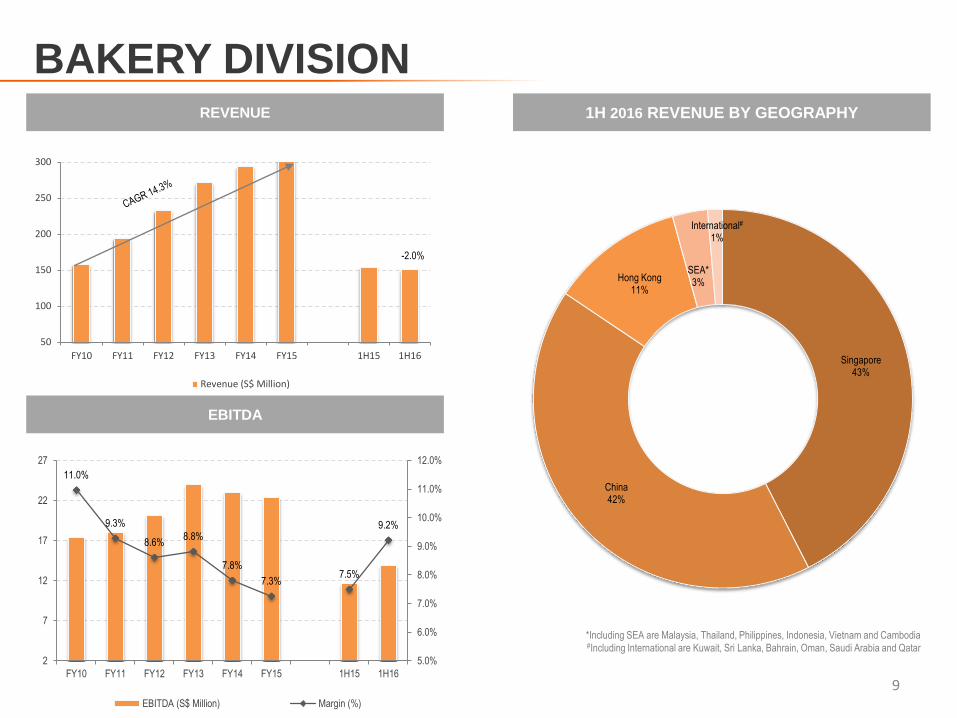
BAKERY DIVISION
9
REVENUE 1H 2016 REVENUE BY GEOGRAPHY
EBITDA
11.0%
9.3%
8.6% 8.8%
7.8%
7.3% 7.5%
9.2%
5.0%
6.0%
7.0%
8.0%
9.0%
10.0%
11.0%
12.0%
2
7
12
17
22
27
FY10 FY11 FY12 FY13 FY14 FY15 1H15 1H16
EBITDA (S$ Million) Margin (%)
50
100
150
200
250
300
FY10 FY11 FY12 FY13 FY14 FY15 1H15 1H16
Revenue (S$ Million)
-2.0%
Singapore 43%
China 42%
Hong Kong 11%
SEA* 3%
International# 1%
BAKERY DIVISION
10
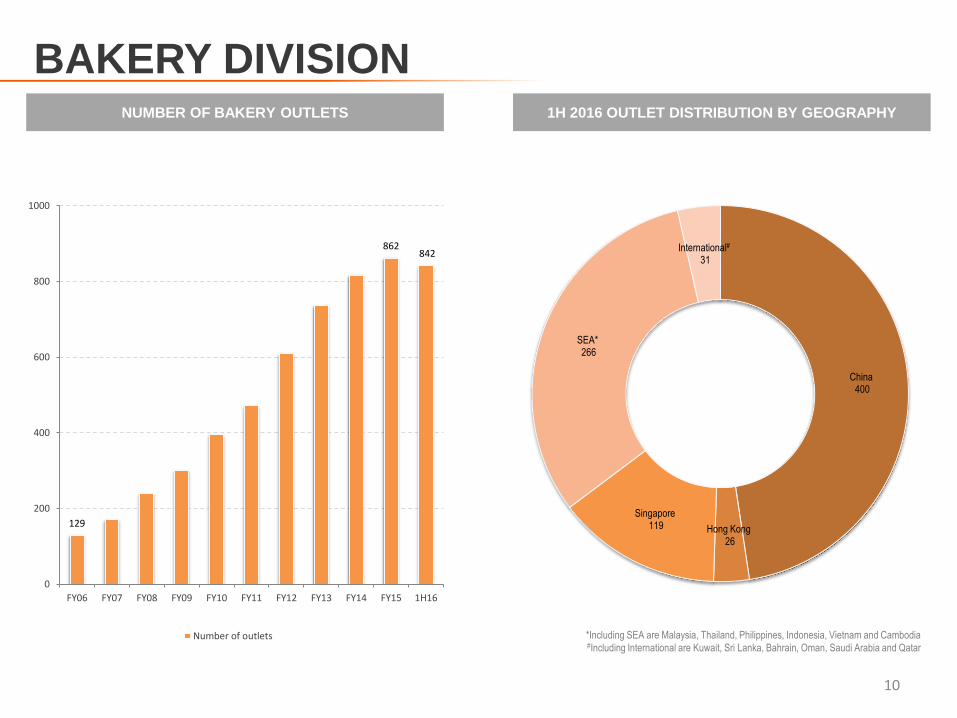
*Including SEA are Malaysia, Thailand, Philippines, Indonesia, Vietnam and Cambodia #Including International are Kuwait, Sri Lanka, Bahrain, Oman, Saudi Arabia and Qatar
NUMBER OF BAKERY OUTLETS 1H 2016 OUTLET DISTRIBUTION BY GEOGRAPHY
129
862 842
0
200
400
600
800
1000
FY06 FY07 FY08 FY09 FY10 FY11 FY12 FY13 FY14 FY15 1H16
Number of outlets
China 400
Hong Kong 26
Singapore 119
SEA* 266
International# 31
FOOD ATRIUM DIVISION
11
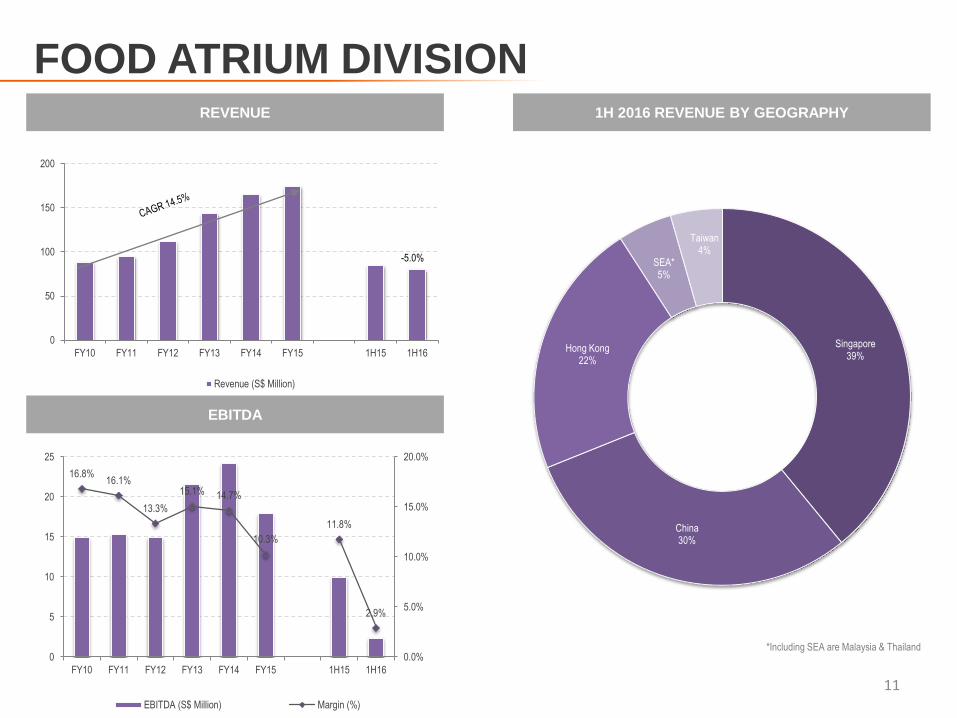
REVENUE 1H 2016 REVENUE BY GEOGRAPHY
EBITDA
0
50
100
150
200
FY10 FY11 FY12 FY13 FY14 FY15 1H15 1H16
Revenue (S$ Million)
-5.0%
Singapore 39%
China 30%
Hong Kong 22%
SEA* 5%
Taiwan 4%
*Including SEA are Malaysia & Thailand
16.8% 16.1%
13.3%
15.1% 14.7%
10.3%
11.8%
2.9%
0.0%
5.0%
10.0%
15.0%
20.0%
0
5
10
15
20
25
FY10 FY11 FY12 FY13 FY14 FY15 1H15 1H16
EBITDA (S$ Million) Margin (%)
FOOD ATRIUM DIVISION
12
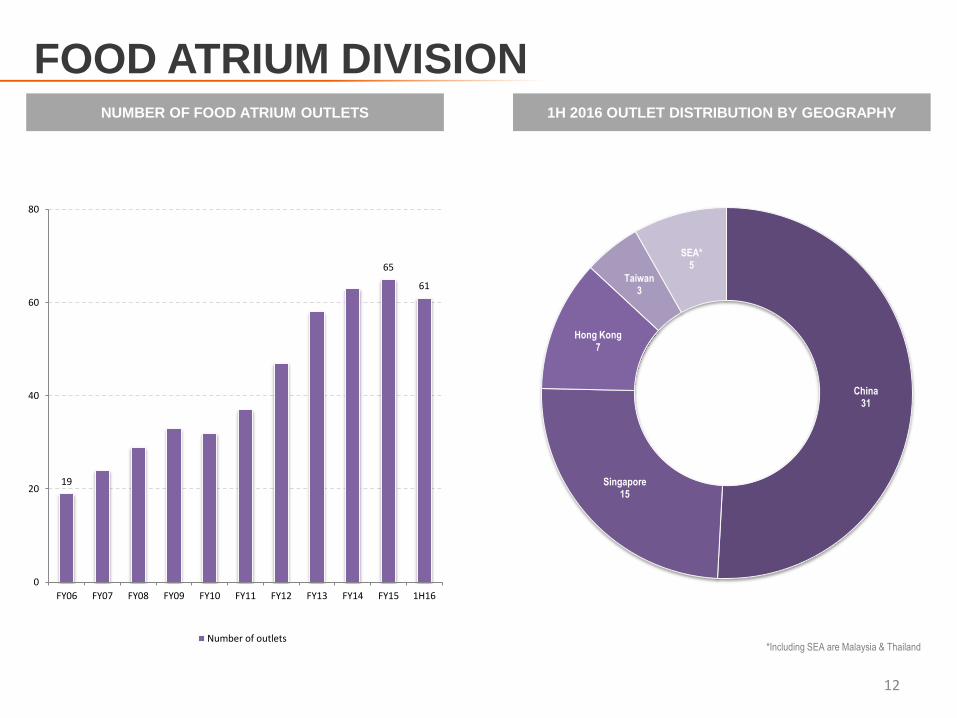
NUMBER OF FOOD ATRIUM OUTLETS 1H 2016 OUTLET DISTRIBUTION BY GEOGRAPHY
19
65
61
0
20
40
60
80
FY06 FY07 FY08 FY09 FY10 FY11 FY12 FY13 FY14 FY15 1H16
Number of outlets
China 31
Singapore 15
Hong Kong 7
Taiwan 3
SEA* 5
*Including SEA are Malaysia & Thailand
RESTAURANT DIVISION
13
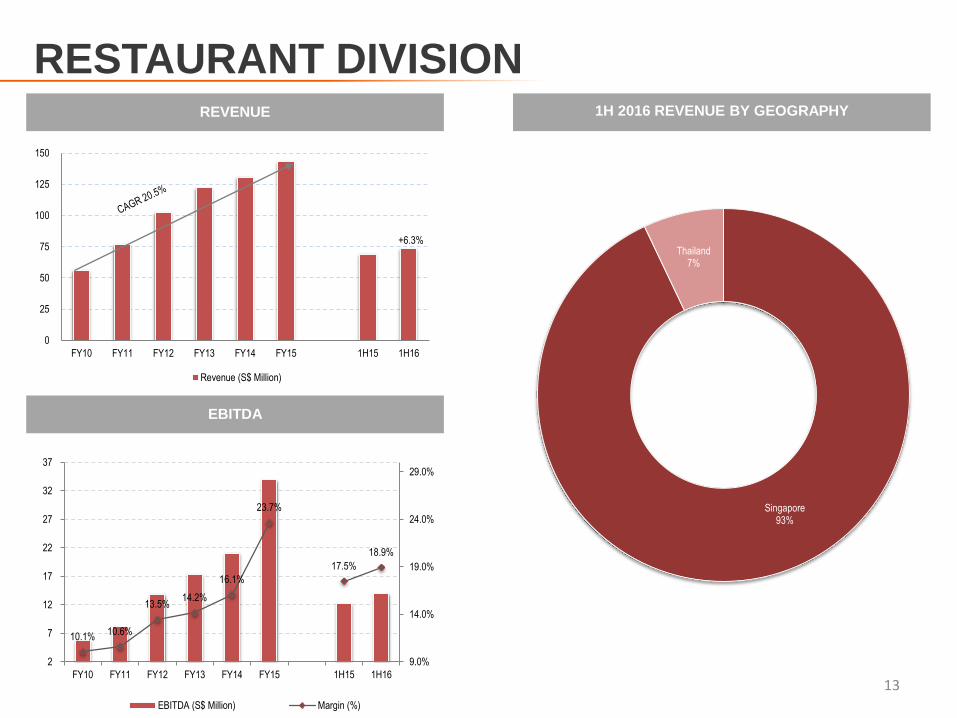
REVENUE 1H 2016 REVENUE BY GEOGRAPHY
EBITDA
0
25
50
75
100
125
150
FY10 FY11 FY12 FY13 FY14 FY15 1H15 1H16
Revenue (S$ Million)
+6.3%
10.1% 10.6%
13.5% 14.2%
16.1%
23.7%
17.5%
18.9%
9.0%
14.0%
19.0%
24.0%
29.0%
2
7
12
17
22
27
32
37
FY10 FY11 FY12 FY13 FY14 FY15 1H15 1H16
EBITDA (S$ Million) Margin (%)
Singapore 93%
Thailand 7%
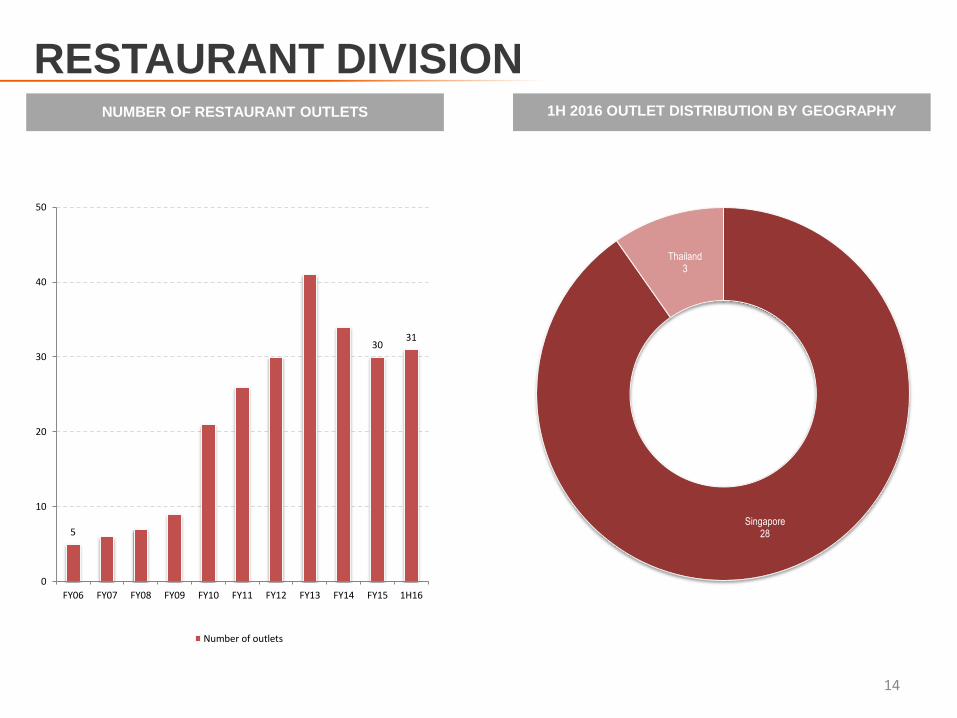
RESTAURANT DIVISION
14
NUMBER OF RESTAURANT OUTLETS 1H 2016 OUTLET DISTRIBUTION BY GEOGRAPHY
5
30 31
0
10
20
30
40
50
FY06 FY07 FY08 FY09 FY10 FY11 FY12 FY13 FY14 FY15 1H16
Number of outlets
Singapore 28
Thailand 3
CONTACT US
15
Mr. Chan Ying Jian Group Chief Financial Officer
Ms. Agnes Kang Investor Relations
Tel - (65) 6285 6116
Email - [email protected]