bisnode interim report january-march 2011
DESCRIPTION
Bisnode interim report January-March 2011TRANSCRIPT

2011 2010 2010/11 2010n Jan-Mar Jan-Mar Apr-Mar Jan-Dec
e 1,052 1,162 4,341 4,451
e growth, % -9.5 -6.6 -2.5 -6.1
ng profit (EBITA) 116 139 512 536
ng margin (EBITA), % 11.0 12.0 11.8 12.0
ng profit (EBITA) excl. cap. gains 116 139 522 545
ng margin (EBITA) excl. cap. gains, % 11.0 12.0 12.0 12.2
ow from operating activities 152 150 466 464
SEK millioRevenu
Revenu
Operati
Operati
Operati
Operati
Cash fl
Revenue
0
200
400
600
800
1,000
1,200
1,400
Q1-10
Q2-10
Q3-10
Q4-10
Q1-11
0
800
1,600
2,400
3,200
4,000
4,800
5,600
SEK m
Quarter LTM
Operating profit (EBITA)
0
30
60
90
120
150
180
210
Q1-10
Q2-10
Q3-10
Q4-10
Q1-11
0
100
200
300
400
500
600
700
SEK m
Quarter LTM
Revenue of SEK 1,052 million (1,162) Operating profit, EBITA of SEK 116 million (139) Operating margin, EBITA of 11.0 per cent (12.0) Cash flow from operating activities of SEK 152 million (150)
Organic growth of -1.5 per cent Cautious market demand in Marketing Solutions and, as expected,
lower SPAR-related sales Sustained growth in Credit Solutions and Software and Applications Strong cash flow from operating activities Market position in Central Europe strengthened through acquisitions
in Croatia, Poland, the Czech Republic and Slovakia Agreement signed to acquire Lindorff Decision and Lindorff Match in
Norway.
Acquisition of Lindorff Match Divestiture of operating unit in the Netherlands Acquisition of remaining minority shares in Business Check
Q1 Interim report January-March 2011
January-March
Key events “The upturn in Marketing Solutions in the second half of 2010 has been replaced by a more cautious market demand during the first quarter of 2011. Business Information Solutions shows a stable performance but we are now starting to see the anticipated effects of the Swedish Tax Agency’s takeover of SPAR (Swedish Population and Address Register) through somewhat lower revenue in the segment’s SPAR-related business.
In spite of challenges in certain market segments, we succeeded in achieving a strong cash flow from operating activities, sustained growth in both Credit Solutions and Software and Applications, and improved EBITA-margin in Product Information.
In the past quarter we significantly advanced our position in Central Europe through acquisitions in Croatia, Poland, the Czech Republic and Slovakia. We have also signed an agreement to acquire Lindorff Match and Lindorff Decision in Norway. Following the Norwegian acquisitions, Bisnode will be Norway’s foremost provider of credit and market information solutions. A market-leading position provides the conditions for growth, economies of scale and higher profitability, and is one of the most important components of our growth strategy.”
Johan Wall, President and CEO
Events after the balance sheet date
Key figures
January-March 2011, Bisnode Business Information Group AB. CIN 556681-5725 1 (12)

Business overview
Adjusted for foreign exchange effects, organic growth reached -1.5 per cent for the quarter due to a combination of weak demand in Marketing Solutions and lower SPAR-related sales. Operating margin was 11.0 per cent, compared to 12.0 per cent in the same period of last year.
Adjusted for foreign exchange effects, Region Nordic reported organic growth of -3 per cent for the quarter. This negative growth is mainly attributable to weak demand in Marketing Solutions. In addition, the Swedish Tax Agency’s takeover of SPAR led to somewhat lower SPAR-related sales, as anticipated.
Bisnode’s Norwegian operations remained weak with organic growth of -4 per cent. The downward trend is most evident for the companies in Marketing Solutions. During the period, Bisnode signed an agreement to acquire the market and credit information companies Lindorff Match and Lindorff Decision and made a decision to implement additional restructuring measures.
Market development in Denmark is cautious and organic growth for the quarter was -2 per cent. Finland in contrast, showed strong performance with organic growth of 12 per cent, adjusted for foreign exchange effects. In Finland the integration of recent years’ acquisitions has gone smoothly and resulted in significant synergies with existing operations, which are now becoming visible in the form of higher operating margins.
2011 2010 2011 2010 2011 2010SEK million Jan-Mar Jan-Mar Jan-Mar Jan-Mar Jan-Mar Jan-MarRegion Nordic 500 525 84 106 16.9 20.2Region DACH 199 215 12 6 5.9 2.7Region BeNeFra 146 179 -3 -8 -2.4 -4.4Region Central Europe 50 51 12 13 24.6 26.4Business Area Product Information 99 115 20 25 20.2 21.2Business Area Software & Applications 83 105 15 16 18.1 14.9Central functions -24 -18 n/a n/aInternal eliminations -26 -29 n/a n/aTotal 1,052 1,162 116 139 11.0 12.0
2010/11 2010 2010/11 2010 2010/11 2010SEK million Apr-Mar Jan-Dec Apr-Mar Jan-Dec Apr-Mar Jan-DecRegion Nordic 1,963 1,988 349 371 17.8 18.7Region DACH 844 860 110 104 13.1 12.1Region BeNeFra 708 741 35 30 4.9 4.1Region Central Europe 181 182 22 23 12.1 12.7Business Area Product Information 421 437 66 71 15.7 16.2Business Area Software & Applications 338 360 45 46 13.4 12.8Central functions -115 -109 n/a n/aInternal eliminations -114 -117 0 n/a n/aTotal 4,341 4,451 512 536 11.8 12.0
Operating profit (EBITA)
Revenue Operating profit (EBITA) Operating margin (EBITA), %
Operating margin (EBITA), %Revenue
Region DACH had a good quarter with organic growth of just over 1 per cent, adjusted for foreign exchange effects. Operating profit improved over the year-earlier period thanks to the completed cost-cutting measures and positive development for the ongoing credit information initiatives in Germany. Austria and Switzerland delivered continued positive performance with regard to both growth and operating profit.
Region BeNeFra, which consists solely of Marketing Solutions companies, posted organic growth of -9 per cent, adjusted for foreign exchange effects. Revenue in the Netherlands decreased organically by 10 per cent compared to the same quarter of last year, but thanks to the restructuring measures carried out in 2010 these operations showed improvement in earnings, albeit from a low level. The business-to-business integration project in Belgium and the integration of Directinet in France, which was acquired at the beginning of 2010, have taken longer and cost more than anticipated.
Region Central Europe achieved organic growth of 4 per cent, adjusted for foreign exchange effects. The high operating margin for the quarter is explained by a seasonal effect in which a significant share of annual profit is generated in the first quarter. During the period, the region was reinforced through acquisitions. The acquisition of Poslovna Domena, the market-leading supplier of digital business information solutions in Croatia, was completed at the beginning of January
January-March 2011, Bisnode Business Information Group AB. CIN 556681-5725 2 (12)

and in March four companies were acquired from Creditinfo SCHUFA with operations in Poland the Czech Republic and Slovakia. The latter are consolidated as of 31 March and have not affected the period’s earnings.
Nordic46%
DACH19%
BeNeFra14%
Central Europe5%
Product Information9%
Softw are and Applications
7%
The Product Information business area reported zero organic growth in the first quarter but significantly improved EBITA margin, adjusted for a capital gain of SEK 7 million in the comparison period arising on the sale of a property. The lower revenue in absolute figures compared to the same period of last year is explained by operations sold during 2010.
The drop in revenue and operating profit in the Software and Applications business area compared to the first quarter of last year is explained by the fact that the comparison period includes companies that were sold in the first half of 2010. The remaining operations in the business area showed very strong development and achieved organic growth of 14 per cent together with improved operating margins. The rise in demand is most significant for consulting-related services, which grew organically by over 20%. The ongoing expansion of the business area’s CRM system to Norway and Finland is proceeding according to plan but is not expected to contribute with a positive operating profit in 2011. Credit Solutions
34%
Marketing Solutions31%
Business Information Solutions
19%
Product Information9%
Softw are and Applications
7%
Central functions include costs for the Group’s joint units, such as the accounting and finance, corporate communications and CIO functions. Added to this are costs for the Group’s three competence centres. The strategy process that was started in the previous year continued during the first quarter and resulted in higher costs.
Revenue by region January-March 2011
Revenue by market segment January-March 2011
January-March 2011, Bisnode Business Information Group AB. CIN 556681-5725 3 (12)
Market overview
The market for digital business information is rapidly developing and evolving with a steadily growing volume of information, new technologies and new laws and rules for the use of information. According to industry analysts, the market is expected to show long-term growth of 3-5 per cent annually. Bisnode’s experience is that demand varies between different market segments and that the information market is late in the business cycle, and therefore recovers later than general economy.
Millions of business decisions are made daily by decision-makers who are increasingly demanding fast and reliable information. Bisnode delivers solutions that help decision-makers to minimise risks, maximise sales and make better business decisions. Bisnode divides its market into three main segments: Marketing Solutions, Credit Solutions and Business Information Solutions.
Marketing Solutions offers marketing- and sales-related products and solutions that help companies to identify new customers and to retain and develop their existing customer relationships in both the business-to-business and business-to-consumer markets. One increasingly important area of this segment is management and enhancement of customer databases, in line with an anticipated trend in which resale prices for pure information will fall and value added services and long-term customer relationships will become more critical to maintain profitability. Another important part of the offering is designed to meet the rising need for web-based solutions that are integrated with more traditional DM services.
Credit Solutions offers a wide range of solutions for credit and risk management, including financial information and credit assessments of both businesses and consumers. Demand for credit information tends to increase in periods of heightened financial uncertainty when companies want to ensure the payment and delivery capacity of their customers and suppliers. This tendency was manifested in powerful sales growth in the first half of 2009. Growth in Credit Solutions has slowed somewhat in pace with stabilisation in the economy, although overall demand remains strong. Due to continued high pressure for pure information and a rising number of players in the low-price segment, Bisnode is working actively enhance its competitiveness by developing a more segmented product offering.
Business Information Solutions provides decision-makers and specialists with customised business information. The offering ranges from general financial and legal information about companies, properties and individuals to media monitoring services. The growing volume of people information, driven by social media and user-generated content, is creating new business opportunities for Bisnode. Business Information Solutions has shown stable growth with high profitability, since the same information is reused in multiple products and market segments. Because many of the services are based on publicly sourced information, good access to this information is vital for growth opportunities.
The Swedish market for people information is in transition. In 2009 the Swedish Tax Agency took over responsibility for SPAR (Coordinated Population and Address Register), which was previously handled by Bisnode through its subsidiary Infodata, and the Swedish Tax Agency introduced its first own SPAR services on the market in January 2011. The services handled by Infodata will remain on the market during 2011 but will cease entirely thereafter. Infodata will thus lose its exclusive right to distribution of SPAR information. For more than 20 years, Infodata has distributed this information on a wholesale basis both within the Group and to external customers. Due to this exclusivity, the historical profitability of SPAR sales has been very high. The Bisnode Group’s directly related SPAR revenue in 2010 amounted to around SEK 300 million. However, the management’s assessment is that the Group’s other operations will compensate for the decrease in SPAR sales.
In addition to the Group’s main market segments, services and solutions are also offered in Product Information and Software and Applications. Product Information, with a large share of advertising-financed services, offers advertising space in business magazines, catalogues and online services, primarily to suppliers of industrial components. Software and Applications offers IT-related consulting services and software for improved business support processes.
January-March 2011, Bisnode Business Information Group AB. CIN 556681-5725 4 (12)

Revenue and profit, January-March
Revenue for the first quarter fell by 9.5 per cent to SEK 1,052 million, compared to SEK 1,162 million in the same period of last year. Organic growth was -7.4 per cent. Adjusted for foreign exchange effects, organic growth was -1.5 per cent.
Operating profit (EBITA) was SEK 116 million (139), equal to an operating margin of 11.0 per cent (12.0).
Operating profit (EBIT) was SEK 80 million (112). Amortisation and impairment of intangible assets attributable to acquisitions amounted to SEK 36 million, compared to SEK 27 million in the same quarter of last year. Goodwill impairment losses of SEK 15 million attributable to the Software and Applications business area were recognised during the period.
Net financial items for the quarter totalled SEK -54 million, compared to SEK -14 million in the same quarter of last year. The decrease in net financial items is explained by high unrealised foreign exchange gains from the Group’s long-term borrowing in the comparison period.
Income tax for the quarter is reported at SEK -12 million (-28), equal to an average tax rate of 45 per cent (28). The high average tax rate is mainly due to the goodwill impairment loss recognised during the period. Adjusted for goodwill impairment, the average tax rate was 28 per cent.
Profit for the period was SEK 14 million (70) and earnings per share (basic and diluted) amounted to SEK 0.1 (0.5).
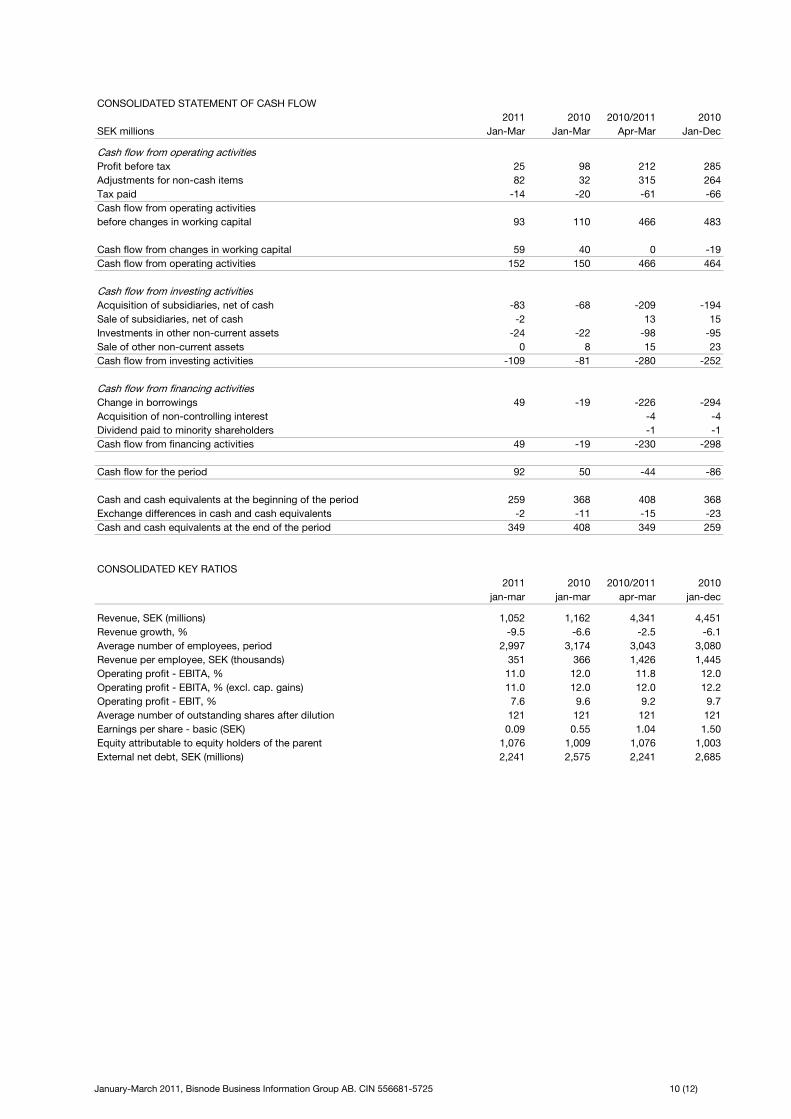
Cash flow and capital expenditure Cash flow from operating activities remains stable and amounted to SEK 152 million (150) for the first quarter. The somewhat lower cash flow compared to the year-earlier period was offset by lower working capital than in the previous year.
The period’s capital expenditure on non-current assets amounted to SEK 24 million (22), and included investments of SEK 12 million (12) in intangible assets and SEK 12 million (10) in tangible assets. As a percentage of revenue, investments in tangible and intangible assets reached 2.3 per cent (1.9).
Capital expenditure in the subsidiaries amounted to SEK 83 million (68).
Financial position Consolidated net debt fell by SEK 48 million to SEK 2,241 million, compared to SEK 2,289 million at 31 December 2010, mainly as a result of continued stable cash flow from operating activities. Furthermore, the higher Swedish krona rate reduced the Group’s long-term borrowing, which is denominated partly in EUR, by around SEK 6 million during the period.
Cash and cash equivalents amounted to SEK 349 million, compared to SEK 259 million at 31 December 2010. In addition, the Group has total granted bank overdraft facilities of SEK 400 million, of which SEK 150 million had been utilised on the balance sheet date.
Acquisitions and divestitures At the beginning of January Bisnode completed the acquisition of Poslovna Domena in Croatia. Poslovna Domena offers digital business information solutions based on Croatia’s most complete dataset of company and people information. The company has 15 employees and annual revenue of approximately SEK 9 million. In addition, Bisnode acquired 51 per cent of the shares in Vendemore Nordic AB, which helps companies to optimise their online marketing. The company has 10 employees and reported annual revenue of SEK 9 million in 2010.
At the end of March 2011 Bisnode acquired four companies from Creditinfo SCHUFA with operations in Poland, the Czech Republic and Slovakia. The acquired companies offer credit and business information solutions and had combined revenue of around SEK 45 million in 2010. The total number of employees is 85.
At the end of February Bisnode acquired the credit information company Lindorff Decision and 90.1 per cent of the market information company Lindorff Match in Norway. Together the two companies have 37 employees and reported annual revenue of around SEK 115 million in 2010. The combined operating profit was around SEK 26 million. The acquisitions were not completed during the period pending approval from the relevant competition authorities.
Personal The number of employees at 31 March 2011 was 3,077 (2,974 at 31 December 2010). The effect of acquired companies was an increase of 110 employees.
The average number of employees during the quarter was 2,997, compared to 3,174 in the same period of last year.
January-March 2011, Bisnode Business Information Group AB. CIN 556681-5725 5 (12)

Events after the balance sheet date In line with Bisnode’s strategy to focus on its core operations, a business unit with 14 employees active in Marketing Solutions in the Netherlands was sold at the beginning of April.
After the balance sheet date, the Group acquired the remaining minority holding of 49 per cent in the group company Business Check i Sverige AB and completed the acquisition of Lindorff Match.
A General Meeting on May 4 elected a new Board of Directs for the Parent Company Bisnode Business Information Group AB. Håkan Ramsin was re-elected as Chairman of the Board. For more information about the new Board members, please visit www.bisnode.com.
No other significant events have taken place after the balance sheet date.
Information about the Parent Company The Parent Company reported an operating profit of SEK -2.9 million (0). Profit after financial items was SEK -23.2 (-11.7). The Parent Company made no investments during the period.
Risks and uncertainties All business operations involve risks. Bisnode works continuously to identify, measure and manage these risks. Bisnode is exposed to three main categories of risk: external-related risks, operating risks and financial risks.
A detailed description of Bisnode’s significant risks and uncertainties is provided in the annual report for 2009 under the heading “Risks and uncertainties” in the Directors’ report, page 27. Financial risk management is described in detail in Note 3, “Financial risk management”, on pages 40-41. No significant changes have arisen after the publication of the annual report.
Accounting policies This interim report is presented in accordance with the Swedish Annual Accounts Act and IAS 34, Interim Financial Reporting. No new standards, amendments or interpretations of existing standards with a significant effect on the interim report are effective as of 1 January 2011.
Stockholm, 9 May 2011
The Board of Directors
This report has not been reviewed by the company’s independent auditors.
January-March 2011, Bisnode Business Information Group AB. CIN 556681-5725 6 (12)

Contact
JOHAN WALL
President and CEO
Telephone: +46 8-558 059 31
Mobile: +46 705-54 18 00
E-mail: [email protected]
FREDRIK ÅKERMAN
Chief Financial Officer
Telephone: +46 8-558 059 35
Mobile: +46 704-15 23 65
E-mail: [email protected]
Financial calendar Interim report January-June 2011 August 2011
Interim report January-September 2011 November 2011
Year-end report 2011 February 2012
Interim report January-March 2012 May 2012
More information For more information about Bisnode, please visit www.bisnode.com
Financial statistics: www.bisnode.com/statistics
Press room and subscription service: www.bisnode.com/news
January-March 2011, Bisnode Business Information Group AB. CIN 556681-5725 7 (12)

Financial information
CONSOLIDATED INCOME STATEMENT2011
SEK millions Jan-Mar
Revenue 1,052Own work capitalised 3Other operating income 5Total operating income 1,059
Goods and services -232Personnel costs -502Depreciation, amortisation and impairment losses -65Other expenses -180Total operating expenses -979
Operating profit 80
Financial incomeFinancial expenses -62Net foreign exchange gains/losses on financial activities 6Net financial items -54
Profit before tax 25
Income tax expense -12Profit for the period 14
Attributable to:Equity holders of the parent 10Non-controlling interest
Derivation of operating profit - EBITA
Operating profit 80
Depreciation/amortisation of surplus values attributable to acquisitions 36
Operating profit - EBITA 116
CONSOLIDATED STATEMENT OF COMPREHENSIVE INCOME2011
SEK millions Jan-Mar Jan-Mar Apr-Mar Jan-Dec
Profit/loss for the period 14 70 138 194
Other comprehensive incom
2010 2010/2011 2010Jan-Mar Apr-Mar Jan-Dec
1,162 4,341 4,4515 13 16
19 32 461,186 4,386 4,513
-270 -935 -973-548 -2,014 -2,060
-64 -238 -237-192 -796 -808
-1,074 -3,984 -4,079
112 402 434
2 2 9 9-64 -249 -25149 50 93
-14 -190 -149
98 212 285
-28 -74 -9170 138 194
66 125 1813 5 12 14
112 402 434
27 111 102
139 512 536
2010 2010/2011 2010
eCash flow hedges 27 2 87 61Cash flow hedges, transferred to the income statement -1 -1 -5 -5Translation differences -20 -143 -193 -316Tax attributable to items in other comprehensive income -7 0 -9 -2Total other comprehensive income -1 -143 -120 -261
Total comprehensive income for the period 13 -72 18 -67
Attributable to:
Equity holders of the parent 9 -76 14 -78
Non-controlling interest 3 4 3 10
January-March 2011, Bisnode Business Information Group AB. CIN 556681-5725 8 (12)

CONSOLIDATED STATEMENT OF FINANCIAL POSITION
SEK millions 31/03/2011 31/03/2010 31/12/2010
ASSETSNon-current assetsGoodwill 4,577 4,703 4,530Other intangible assets 635 797 652Property, plant and equipment 280 342 285Other non-current assets 148 135 154Total non-current assets 5,640 5,978 5,621
Current assetsInventories 7 6 6Other current assets 789 896 895Cash and cash equivalents 349 408 259Total current assets 1,144 1,310 1,161TOTAL ASSETS 6,784 7,288 6,781
EQUITYEquity attributable to equity holders of the parent 1,013 1,009 1,003Non-controlling interest 50 68 47Total equity 1,063 1,078 1,050
LIABILITIESNon-current liabilitiesBorrowings 3,145 3,490 3,204Other non-current liabilities 537 657 509Total non-current liabilities 3,682 4,147 3,713
Current liabilitiesBorrowings 469 327 347Derivative financial instruments 47 134 74Other current liabilities 1,522 1,603 1,596Total current liabilities 2,039 2,063 2,018Total liabilities 5,721 6,210 5,731TOTAL EQUITY AND LIABILITIES 6,784 7,288 6,781
CONSOLIDATED STATEMENT OF CHANGES IN EQUITY
Other Retained earn. Non-Share capital incl. profit for controlling Total
SEK millions capital contr. Reserves the year Total interest equityBalance at 1 January 2010 482 1,763 54 -1,214 1,085 65 1,150
Total comprehensive income -142 66 -76 4 -72
Balance at 31 March 2010 482 1,763 -88 -1,149 1,009 68 1,078
Other Retained earn. Non-Share capital incl. profit for controlling Total
SEK millions capital contr. Reserves the year Total interest equityBalance at 1 January 2011 482 1,763 -205 -1,037 1,003 47 1,050
Total comprehensive income -1 10 9 3 13
Acquisition and divestment ofnon-controlling interest 0 0 0 0
Balance at 31 March 2011 482 1,763 -206 -1,026 1,013 50 1,063
Equity attributable to equity holders of the parent
Equity attributable to equity holders of the parent
January-March 2011, Bisnode Business Information Group AB. CIN 556681-5725 9 (12)
January-March 2011, Bisnode Business Information Group AB. CIN 556681-5725 10 (12)
CONSOLIDATED STATEMENT OF CASH FLOW2011 2010 2010/2011 2010
SEK millions Jan-Mar Jan-Mar Apr-Mar Jan-Dec
Cash flow from operating activitiesProfit before tax 25 98 212 285Adjustments for non-cash items 82 32 315 264Tax paid -14 -20 -61 -66Cash flow from operating activitiesbefore changes in working capital 93 110 466 483
Cash flow from changes in working capital 59 40 0 -19Cash flow from operating activities 152 150 466 464
Cash flow from investing activitiesAcquisition of subsidiaries, net of cash -83 -68 -209 -194Sale of subsidiaries, net of cash -2 13 15Investments in other non-current assets -24 -22 -98 -95Sale of other non-current assets 0 8 15 23Cash flow from investing activities -109 -81 -280 -252
Cash flow from financing activitiesChange in borrowings 49 -19 -226 -294Acquisition of non-controlling interest -4 -4Dividend paid to minority shareholders -1 -1Cash flow from financing activities 49 -19 -230 -298
Cash flow for the period 92 50 -44 -86
Cash and cash equivalents at the beginning of the period 259 368 408 368Exchange differences in cash and cash equivalents -2 -11 -15 -23Cash and cash equivalents at the end of the period 349 408 349 259
CONSOLIDATED KEY RATIOS2011 2010 2010/2011 2010
jan-mar jan-mar apr-mar jan-dec
Revenue, SEK (millions) 1,052 1,162 4,341 4,451Revenue growth, % -9.5 -6.6 -2.5 -6.1Average number of employees, period 2,997 3,174 3,043 3,080Revenue per employee, SEK (thousands) 351 366 1,426 1,445Operating profit - EBITA, % 11.0 12.0 11.8 12.0Operating profit - EBITA, % (excl. cap. gains) 11.0 12.0 12.0 12.2Operating profit - EBIT, % 7.6 9.6 9.2 9.7Average number of outstanding shares after dilution 121 121 121 121Earnings per share - basic (SEK) 0.09 0.55 1.04 1.50Equity attributable to equity holders of the parent 1,076 1,009 1,076 1,003External net debt, SEK (millions) 2,241 2,575 2,241 2,685

PARENT COMPANY INCOME STATEMENT2011 2010 2011 2010
SEK millions Jan-Mar Jan-Mar Apr-Mar Jan-Dec
Revenue 0.6 1.5 0.8Total operating income 0.6 0.0 1.5 0.8
Personnel costs -2.6 -11.5 -8.9Other external expenses -0.9 0.0 -19.5 -18.7Total operating expenses -3.5 0.0 -31.1 -27.6
Operating profit/loss -2.9 0.0 -29.6 -26.8
Result from financial itemsResult from participations in Group companies 192.9 192.9Other interest income and similiar items 0.2 0.2 0.1Interest expenses and similiar items -24.6 -23.3 -93.9 -92.6Net foreign exchange gains/losses on financial activities 1.2 11.6 15.2 25.6Total profit/loss from financial items -23.2 -11.7 114.5 126.0
Profit/loss after financial items -26.1 -11.7 84.9 99.2
Tax on profit/loss for the period 4.6 4.6
Profit/loss for the period -26.1 -11.7 89.5 103.8
PARENT COMPANY STATEMENT OF FINANCIAL POSITION
SEK millions 31/03/2011 31/03/2010 31/12/2010
Financial assets 1,878 1,907 1,911Current receivables 581 358 581Cash and cash equivalents 56 45 58TOTAL ASSETS 2,515 2,310 2,550
Total equity 1,239 1,149 1,265Provisions 16 0 16Non-current liabilities 1,253 1,160 1,229Current liabilities 7 0 41TOTAL EQUITY AND LIABILITIES 2,515 2,310 2,550
Definitions Average number of employees The average number of full-time employees during the period.
Earnings per share Profit attributable to owners of the Parent Company divided by the average number of shares outstanding.
Net debt Interest-bearing provisions and liabilities (excluding loans from shareholders) less cash and cash equivalents and other interest-bearing receivables.
Operating margin Operating profit, EBIT, EBITA, or EBITDA as a percentage of revenue.
Operating profit, EBITA Profit before tax, financial items and amortisation/impairment of intangible assets arising from business combinations.
Operating profit, EBITA excluding capital gains Operating profit, EBITA adjusted for capital gains and losses from sale of subsidiaries, associates or other share holdings.
Operating profit, EBITDA Profit before tax, financial items and depreciation, amortisation and impairment losses.
Revenue per employee Revenue divided by the average number of employees.
The figures in this interim report have been rounded off, while the calculations have been made without rounding off. As a result, the figures in certain tables and key ratios may appear not to add up correctly.
January-March 2011, Bisnode Business Information Group AB. CIN 556681-5725 11 (12)

January-March 2011, Bisnode Business Information Group AB. CIN 556681-5725 12 (12)
About Bisnode Bisnode offers a complete range of online services for market, credit and product information in Europe. The Group is organised in four geographical regions and two business areas.
Bisnode has 3,000 employees in 17 European countries and is owned 70 per cent by Ratos and 30 per cent by Bonnier.
Data about companies and consumers is collected from multiple sources.
The data is enhanced through harmonisation, standardisation and verification.
The data is packaged and customised into products and services.
Business model
Financial targets Bisnode’s targets for the Group’s long-term financial development are:
Annual revenue growth, including acquisitions and divestitures, of 10 per cent over a business cycle.
An operating margin, EBITA of a least 15 per cent over a business cycle.
Bisnode sells products under different brands and creates customised local services to fulfil the needs of a diverse customer base.
Vision & Mission Bisnode’s vision is to be the leading provider of digital business information in Europe.
Bisnode’s mission is to help customers maximise their sales, minimise their business risks and make better business decisions.
Mailing address: Bisnode, S168 SE-105 99 Stockholm, Sweden Visiting address: Sveavägen 168 Stockholm, Sweden Tel: +46 8 558 059 00 Fax: +46 8 558 059 95 E-mail: [email protected] Web: www.bisnode.com