valmet's interim review, january–march 2018 · valmet’s interim review, january–march...
TRANSCRIPT

Valmet’s Interim Review, January–March 2018 | 1
Valmet’s Interim Review January 1 – March 31, 2018
Orders received continued on a good level in Paper –
Comparable EBITA was low
Figures in brackets, unless otherwise stated, refer to the comparison period, i.e. the same period of the
previous year. The comparison period figures have been restated following the adoption of IFRS 15 as of
January 1, 2018.
January–March 2018: Second-best quarter in more than three years in orders
received
• Orders received decreased 11 percent to EUR 890 million (EUR 1,005 million). - Orders received increased in the Automation business line, remained at the previous year’s
level in the Services business line and decreased in the Pulp and Energy, and Paper business lines.
- Orders received increased in South America, China and North America, and decreased in EMEA (Europe, Middle East and Africa) and Asia-Pacific.
• Net sales increased 13 percent to EUR 732 million (EUR 645 million). - Net sales increased in Paper, and Pulp and Energy business lines and remained at the previous
year’s level in the Automation and Services business lines.
• Comparable earnings before interest, taxes and amortization (Comparable EBITA) were EUR 22 million (EUR 34 million), and the corresponding Comparable EBITA margin was 3.0 percent (5.3%).
- Profitability decreased due to a loss of EUR 15 million recognized in a project in the Pulp and Energy business line.
• Earnings per share were EUR 0.05 (EUR 0.12).
• Items affecting comparability amounted to EUR -3 million (EUR 3 million).
• Cash flow provided by operating activities was EUR 19 million (EUR 94 million).
Guidance for 2018 unchanged Valmet reiterates its guidance presented on March 21, 2018, in which Valmet estimates that net sales in
2018 will remain at the same level as in 2017 (EUR 3,058 million) and Comparable EBITA in 2018 will
increase in comparison with 2017 (EUR 218 million).
Short-term outlook
General economic outlook
The global economic upswing has become broader and stronger. At 3.8 percent, global growth in 2017 was
the fastest since 2011, and growth is expected to tick up to 3.9 percent in both 2018 and 2019. For most
countries, current favorable growth rates will not last, and global growth is projected to soften beyond the
next couple of years. Downside concerns include a possibly sharp tightening of financial conditions, waning
popular support for global economic integration, growing trade tensions and risks of a shift toward
protectionist policies, and geopolitical strains. Most advanced economies are poised to return to growth
rates well below precrisis averages, held back by aging populations and lackluster productivity.
(International Monetary Fund, April 17, 2018)
Valmet’s Interim Review, January–March 2018 | 2
Short-term market outlook
Valmet reiterates the good short-term market outlook for services, board and paper, tissue and
automation, the satisfactory short-term market outlook for energy, and the weak short-term market
outlook for pulp.
President and CEO Pasi Laine: Orders received at a high level but profitability
low “Valmet’s orders received amounted to EUR 890 million in the first quarter of 2018, making it the second-
best quarter in more than three years. This shows that the high customer activity in 2017 has continued in
the beginning of 2018. The activity in Board and Paper has continued at a high level. Orders received
increased in the Automation business line and remained at the previous years’ level in the Services business
line.
Despite the slow start to the year in terms of profitability, we keep our financial guidance unchanged. We
estimate that Valmet’s net sales in 2018 will remain at the same level as in 2017, and Comparable EBITA in
2018 will increase in comparison with 2017.”
Key figures1
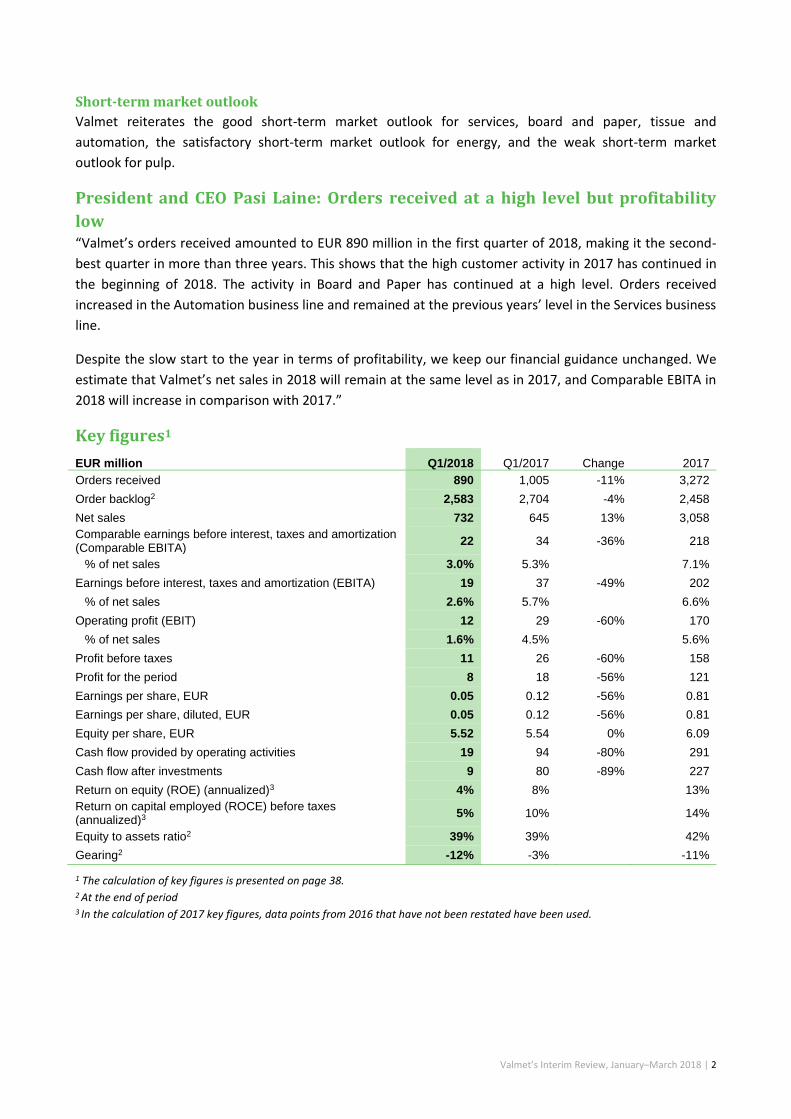
EUR million Q1/2018 Q1/2017 Change 2017
Orders received 890 1,005 -11% 3,272
Order backlog2 2,583 2,704 -4% 2,458
Net sales 732 645 13% 3,058
Comparable earnings before interest, taxes and amortization (Comparable EBITA)
22 34 -36% 218
% of net sales 3.0% 5.3% 7.1%
Earnings before interest, taxes and amortization (EBITA) 19 37 -49% 202
% of net sales 2.6% 5.7% 6.6%
Operating profit (EBIT) 12 29 -60% 170
% of net sales 1.6% 4.5% 5.6%
Profit before taxes 11 26 -60% 158
Profit for the period 8 18 -56% 121
Earnings per share, EUR 0.05 0.12 -56% 0.81
Earnings per share, diluted, EUR 0.05 0.12 -56% 0.81
Equity per share, EUR 5.52 5.54 0% 6.09
Cash flow provided by operating activities 19 94 -80% 291
Cash flow after investments 9 80 -89% 227
Return on equity (ROE) (annualized)3 4% 8% 13%
Return on capital employed (ROCE) before taxes (annualized)3 5% 10% 14%
Equity to assets ratio2 39% 39% 42%
Gearing2 -12% -3% -11%
1 The calculation of key figures is presented on page 38. 2 At the end of period 3 In the calculation of 2017 key figures, data points from 2016 that have not been restated have been used.
Valmet’s Interim Review, January–March 2018 | 3
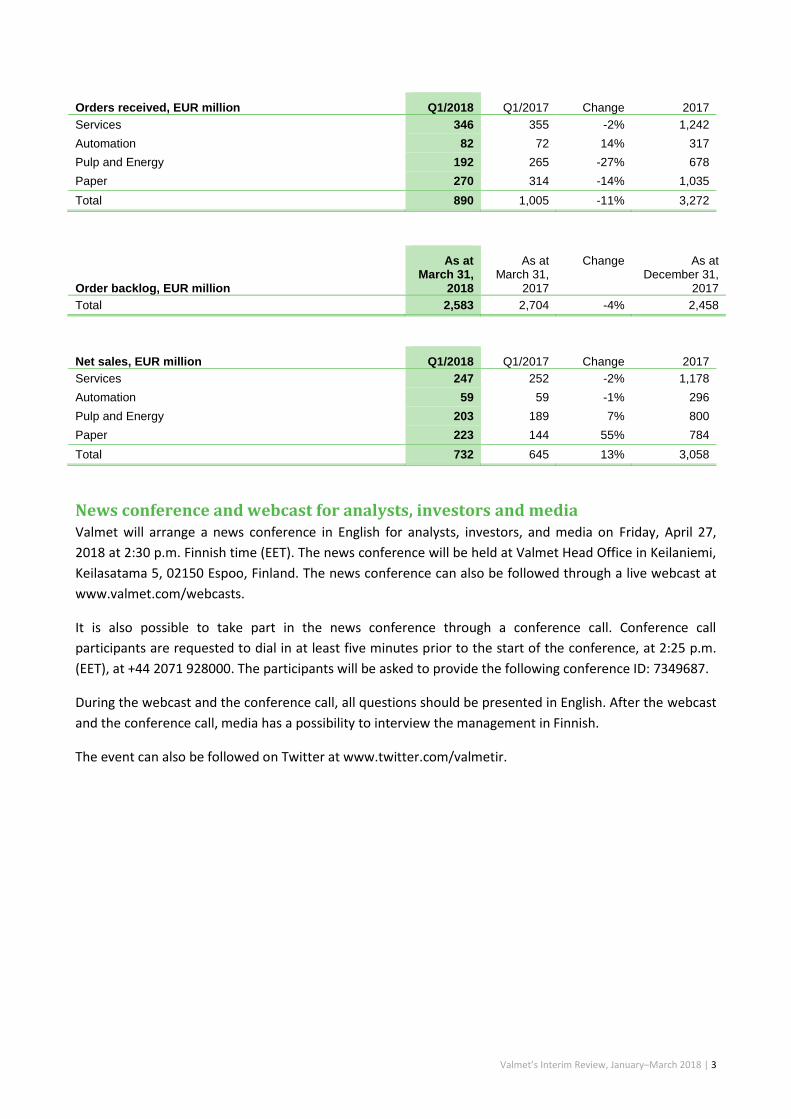
Orders received, EUR million Q1/2018 Q1/2017 Change 2017
Services 346 355 -2% 1,242
Automation 82 72 14% 317
Pulp and Energy 192 265 -27% 678
Paper 270 314 -14% 1,035
Total 890 1,005 -11% 3,272
Order backlog, EUR million
As at March 31,
2018
As at March 31,
2017
Change As at December 31,
2017
Total 2,583 2,704 -4% 2,458
Net sales, EUR million Q1/2018 Q1/2017 Change 2017
Services 247 252 -2% 1,178
Automation 59 59 -1% 296
Pulp and Energy 203 189 7% 800
Paper 223 144 55% 784
Total 732 645 13% 3,058
News conference and webcast for analysts, investors and media Valmet will arrange a news conference in English for analysts, investors, and media on Friday, April 27,
2018 at 2:30 p.m. Finnish time (EET). The news conference will be held at Valmet Head Office in Keilaniemi,
Keilasatama 5, 02150 Espoo, Finland. The news conference can also be followed through a live webcast at
www.valmet.com/webcasts.
It is also possible to take part in the news conference through a conference call. Conference call
participants are requested to dial in at least five minutes prior to the start of the conference, at 2:25 p.m.
(EET), at +44 2071 928000. The participants will be asked to provide the following conference ID: 7349687.
During the webcast and the conference call, all questions should be presented in English. After the webcast
and the conference call, media has a possibility to interview the management in Finnish.
The event can also be followed on Twitter at www.twitter.com/valmetir.
Valmet’s Interim Review, January–March 2018 | 4
Valmet’s Interim Review January 1 – March 31, 2018
Orders received increased 14 percent in the Automation business line
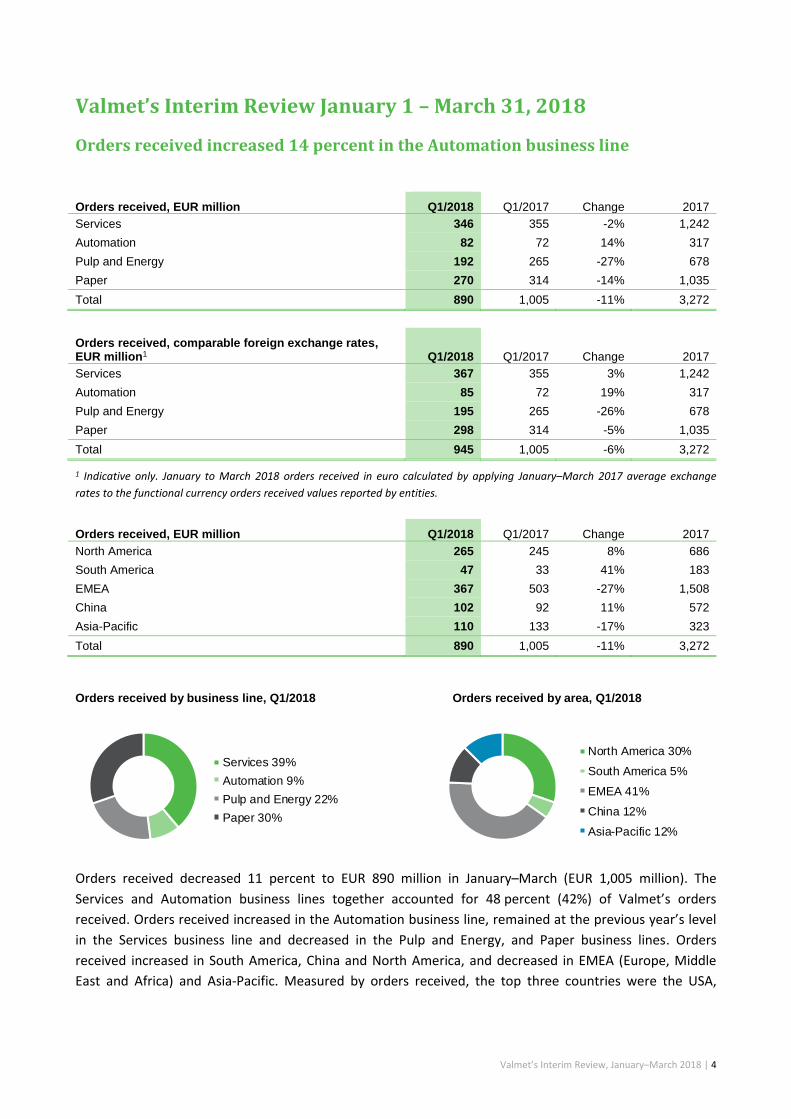
Orders received, EUR million Q1/2018 Q1/2017 Change 2017
Services 346 355 -2% 1,242
Automation 82 72 14% 317
Pulp and Energy 192 265 -27% 678
Paper 270 314 -14% 1,035
Total 890 1,005 -11% 3,272
Orders received, comparable foreign exchange rates, EUR million1 Q1/2018 Q1/2017 Change 2017
Services 367 355 3% 1,242
Automation 85 72 19% 317
Pulp and Energy 195 265 -26% 678
Paper 298 314 -5% 1,035
Total 945 1,005 -6% 3,272
1 Indicative only. January to March 2018 orders received in euro calculated by applying January–March 2017 average exchange
rates to the functional currency orders received values reported by entities.
Orders received, EUR million Q1/2018 Q1/2017 Change 2017
North America 265 245 8% 686
South America 47 33 41% 183
EMEA 367 503 -27% 1,508
China 102 92 11% 572
Asia-Pacific 110 133 -17% 323
Total 890 1,005 -11% 3,272
Orders received by business line, Q1/2018 Orders received by area, Q1/2018
Orders received decreased 11 percent to EUR 890 million in January–March (EUR 1,005 million). The
Services and Automation business lines together accounted for 48 percent (42%) of Valmet’s orders
received. Orders received increased in the Automation business line, remained at the previous year’s level
in the Services business line and decreased in the Pulp and Energy, and Paper business lines. Orders
received increased in South America, China and North America, and decreased in EMEA (Europe, Middle
East and Africa) and Asia-Pacific. Measured by orders received, the top three countries were the USA,
Services 39%
Automation 9%
Pulp and Energy 22%
Paper 30%
North America 30%
South America 5%
EMEA 41%
China 12%
Asia-Pacific 12%
Valmet’s Interim Review, January–March 2018 | 5
Finland and China, which together accounted for 54 percent of total orders received. The emerging markets
accounted for 33 percent (38%) of orders received.
Changes in foreign exchange rates compared to the exchange rates for the corresponding period in 2017
decreased orders received by approximately EUR 55 million in January–March.
During January–March, Valmet received among others an order for a multifuel boiler and a flue gas
treatment plant to Finland, valued at around EUR 70 million, an order for a containerboard machine with
related automation system to China, an order for a linerboard production line to the USA, as well as an
order for a multifuel boiler and auxiliary process equipment to Turkey.
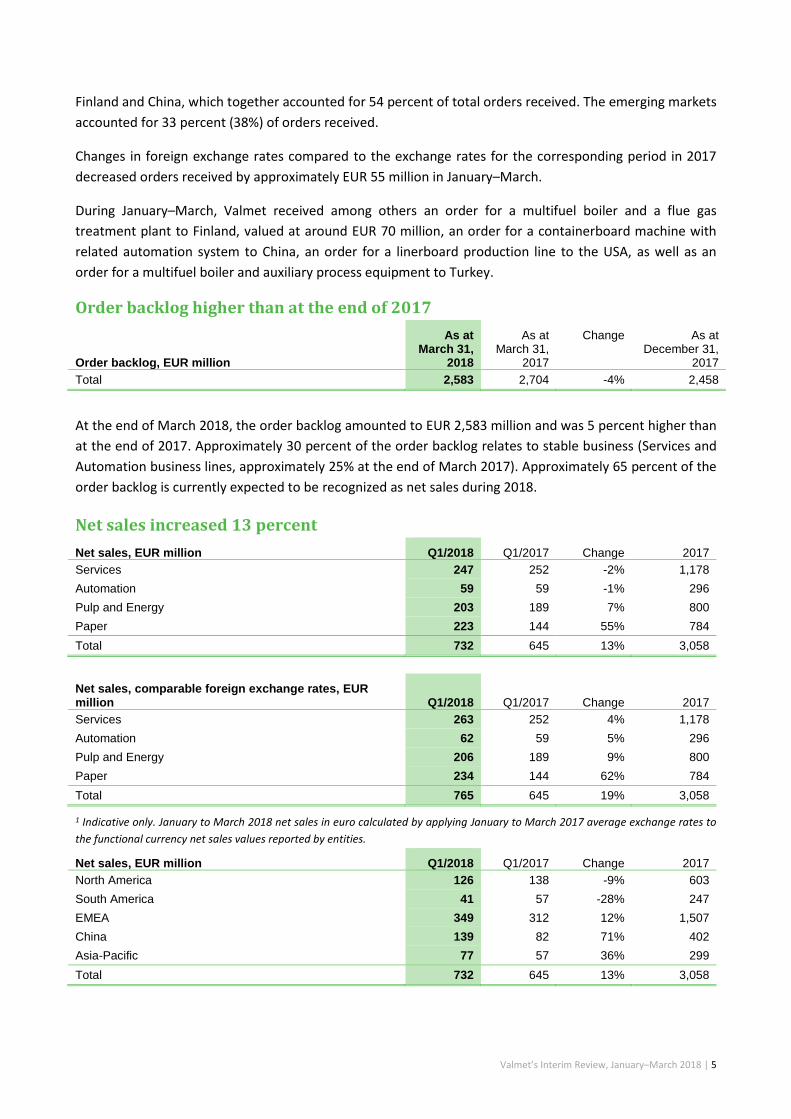
Order backlog higher than at the end of 2017
Order backlog, EUR million
As at March 31,
2018
As at March 31,
2017
Change As at December 31,
2017
Total 2,583 2,704 -4% 2,458
At the end of March 2018, the order backlog amounted to EUR 2,583 million and was 5 percent higher than
at the end of 2017. Approximately 30 percent of the order backlog relates to stable business (Services and
Automation business lines, approximately 25% at the end of March 2017). Approximately 65 percent of the
order backlog is currently expected to be recognized as net sales during 2018.
Net sales increased 13 percent
Net sales, EUR million Q1/2018 Q1/2017 Change 2017
Services 247 252 -2% 1,178
Automation 59 59 -1% 296
Pulp and Energy 203 189 7% 800
Paper 223 144 55% 784
Total 732 645 13% 3,058
Net sales, comparable foreign exchange rates, EUR million Q1/2018 Q1/2017 Change 2017
Services 263 252 4% 1,178
Automation 62 59 5% 296
Pulp and Energy 206 189 9% 800
Paper 234 144 62% 784
Total 765 645 19% 3,058
1 Indicative only. January to March 2018 net sales in euro calculated by applying January to March 2017 average exchange rates to
the functional currency net sales values reported by entities.
Net sales, EUR million Q1/2018 Q1/2017 Change 2017
North America 126 138 -9% 603
South America 41 57 -28% 247
EMEA 349 312 12% 1,507
China 139 82 71% 402
Asia-Pacific 77 57 36% 299
Total 732 645 13% 3,058
Valmet’s Interim Review, January–March 2018 | 6
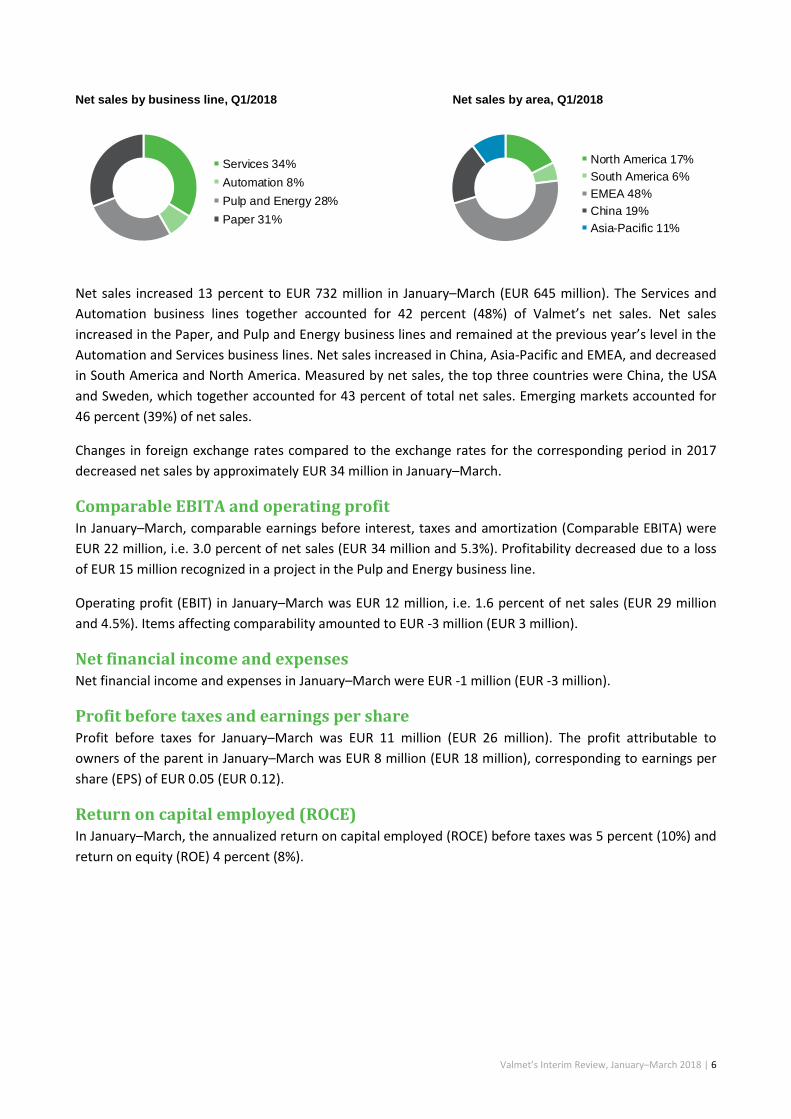
Net sales by business line, Q1/2018 Net sales by area, Q1/2018
Net sales increased 13 percent to EUR 732 million in January–March (EUR 645 million). The Services and
Automation business lines together accounted for 42 percent (48%) of Valmet’s net sales. Net sales
increased in the Paper, and Pulp and Energy business lines and remained at the previous year’s level in the
Automation and Services business lines. Net sales increased in China, Asia-Pacific and EMEA, and decreased
in South America and North America. Measured by net sales, the top three countries were China, the USA
and Sweden, which together accounted for 43 percent of total net sales. Emerging markets accounted for
46 percent (39%) of net sales.
Changes in foreign exchange rates compared to the exchange rates for the corresponding period in 2017
decreased net sales by approximately EUR 34 million in January–March.
Comparable EBITA and operating profit In January–March, comparable earnings before interest, taxes and amortization (Comparable EBITA) were
EUR 22 million, i.e. 3.0 percent of net sales (EUR 34 million and 5.3%). Profitability decreased due to a loss
of EUR 15 million recognized in a project in the Pulp and Energy business line.
Operating profit (EBIT) in January–March was EUR 12 million, i.e. 1.6 percent of net sales (EUR 29 million
and 4.5%). Items affecting comparability amounted to EUR -3 million (EUR 3 million).
Net financial income and expenses Net financial income and expenses in January–March were EUR -1 million (EUR -3 million).
Profit before taxes and earnings per share Profit before taxes for January–March was EUR 11 million (EUR 26 million). The profit attributable to
owners of the parent in January–March was EUR 8 million (EUR 18 million), corresponding to earnings per
share (EPS) of EUR 0.05 (EUR 0.12).
Return on capital employed (ROCE) In January–March, the annualized return on capital employed (ROCE) before taxes was 5 percent (10%) and
return on equity (ROE) 4 percent (8%).
Services 34%
Automation 8%
Pulp and Energy 28%
Paper 31%
North America 17%
South America 6%
EMEA 48%
China 19%
Asia-Pacific 11%
Valmet’s Interim Review, January–March 2018 | 7
Business lines
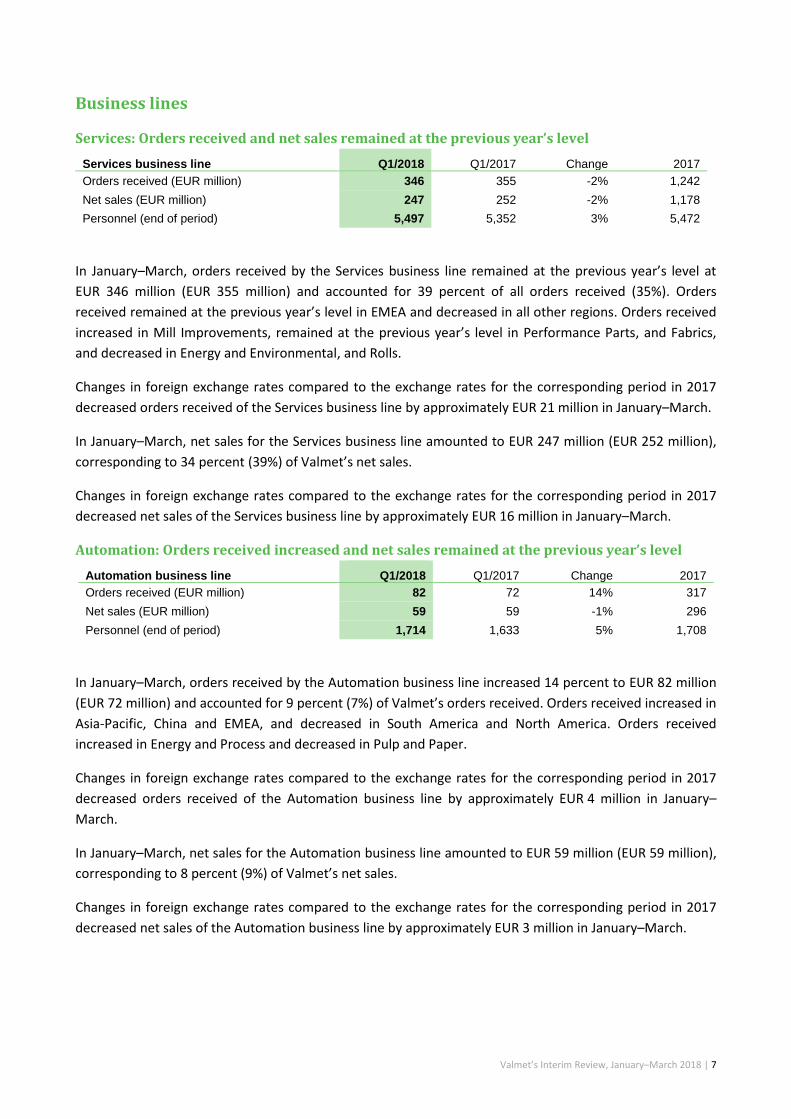
Services: Orders received and net sales remained at the previous year’s level
Services business line Q1/2018 Q1/2017 Change 2017
Orders received (EUR million) 346 355 -2% 1,242
Net sales (EUR million) 247 252 -2% 1,178
Personnel (end of period) 5,497 5,352 3% 5,472
In January–March, orders received by the Services business line remained at the previous year’s level at
EUR 346 million (EUR 355 million) and accounted for 39 percent of all orders received (35%). Orders
received remained at the previous year’s level in EMEA and decreased in all other regions. Orders received
increased in Mill Improvements, remained at the previous year’s level in Performance Parts, and Fabrics,
and decreased in Energy and Environmental, and Rolls.
Changes in foreign exchange rates compared to the exchange rates for the corresponding period in 2017
decreased orders received of the Services business line by approximately EUR 21 million in January–March.
In January–March, net sales for the Services business line amounted to EUR 247 million (EUR 252 million),
corresponding to 34 percent (39%) of Valmet’s net sales.
Changes in foreign exchange rates compared to the exchange rates for the corresponding period in 2017
decreased net sales of the Services business line by approximately EUR 16 million in January–March.
Automation: Orders received increased and net sales remained at the previous year’s level
Automation business line Q1/2018 Q1/2017 Change 2017
Orders received (EUR million) 82 72 14% 317
Net sales (EUR million) 59 59 -1% 296
Personnel (end of period) 1,714 1,633 5% 1,708
In January–March, orders received by the Automation business line increased 14 percent to EUR 82 million
(EUR 72 million) and accounted for 9 percent (7%) of Valmet’s orders received. Orders received increased in
Asia-Pacific, China and EMEA, and decreased in South America and North America. Orders received
increased in Energy and Process and decreased in Pulp and Paper.
Changes in foreign exchange rates compared to the exchange rates for the corresponding period in 2017
decreased orders received of the Automation business line by approximately EUR 4 million in January–
March.
In January–March, net sales for the Automation business line amounted to EUR 59 million (EUR 59 million),
corresponding to 8 percent (9%) of Valmet’s net sales.
Changes in foreign exchange rates compared to the exchange rates for the corresponding period in 2017
decreased net sales of the Automation business line by approximately EUR 3 million in January–March.
Valmet’s Interim Review, January–March 2018 | 8
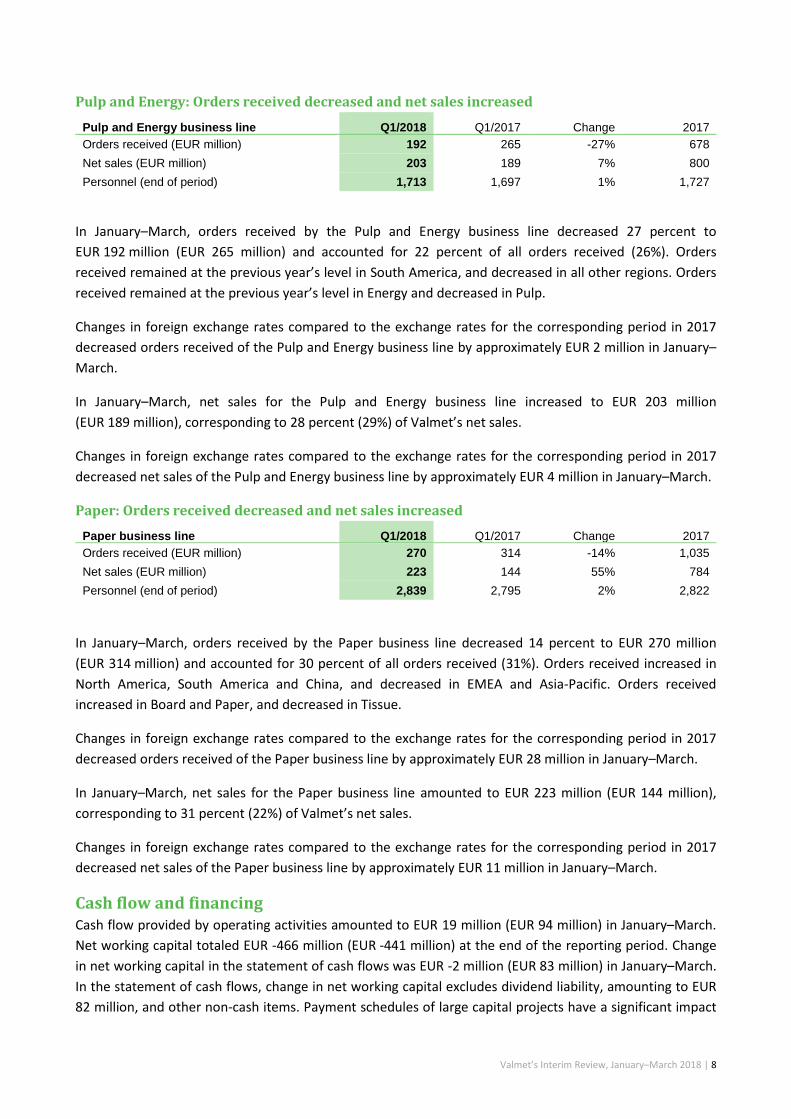
Pulp and Energy: Orders received decreased and net sales increased
Pulp and Energy business line Q1/2018 Q1/2017 Change 2017
Orders received (EUR million) 192 265 -27% 678
Net sales (EUR million) 203 189 7% 800
Personnel (end of period) 1,713 1,697 1% 1,727
In January–March, orders received by the Pulp and Energy business line decreased 27 percent to
EUR 192 million (EUR 265 million) and accounted for 22 percent of all orders received (26%). Orders
received remained at the previous year’s level in South America, and decreased in all other regions. Orders
received remained at the previous year’s level in Energy and decreased in Pulp.
Changes in foreign exchange rates compared to the exchange rates for the corresponding period in 2017
decreased orders received of the Pulp and Energy business line by approximately EUR 2 million in January–
March.
In January–March, net sales for the Pulp and Energy business line increased to EUR 203 million
(EUR 189 million), corresponding to 28 percent (29%) of Valmet’s net sales.
Changes in foreign exchange rates compared to the exchange rates for the corresponding period in 2017
decreased net sales of the Pulp and Energy business line by approximately EUR 4 million in January–March.
Paper: Orders received decreased and net sales increased
Paper business line Q1/2018 Q1/2017 Change 2017
Orders received (EUR million) 270 314 -14% 1,035
Net sales (EUR million) 223 144 55% 784
Personnel (end of period) 2,839 2,795 2% 2,822
In January–March, orders received by the Paper business line decreased 14 percent to EUR 270 million
(EUR 314 million) and accounted for 30 percent of all orders received (31%). Orders received increased in
North America, South America and China, and decreased in EMEA and Asia-Pacific. Orders received
increased in Board and Paper, and decreased in Tissue.
Changes in foreign exchange rates compared to the exchange rates for the corresponding period in 2017
decreased orders received of the Paper business line by approximately EUR 28 million in January–March.
In January–March, net sales for the Paper business line amounted to EUR 223 million (EUR 144 million),
corresponding to 31 percent (22%) of Valmet’s net sales.
Changes in foreign exchange rates compared to the exchange rates for the corresponding period in 2017
decreased net sales of the Paper business line by approximately EUR 11 million in January–March.
Cash flow and financing Cash flow provided by operating activities amounted to EUR 19 million (EUR 94 million) in January–March.
Net working capital totaled EUR -466 million (EUR -441 million) at the end of the reporting period. Change
in net working capital in the statement of cash flows was EUR -2 million (EUR 83 million) in January–March.
In the statement of cash flows, change in net working capital excludes dividend liability, amounting to EUR
82 million, and other non-cash items. Payment schedules of large capital projects have a significant impact
Valmet’s Interim Review, January–March 2018 | 9
on net working capital development. Cash flow after investments totaled EUR 9 million (EUR 80 million) in
January–March.
At the end of March, gearing was -12 percent (-3%) and equity to assets ratio was 39 percent (39%).
Interest-bearing liabilities amounted to EUR 201 million (EUR 277 million), and net interest-bearing
liabilities totaled EUR -102 million (EUR -27 million) at the end of the reporting period. The average
maturity for Valmet’s non-current debt was 4.0 years, and average interest rate was 1.3 percent at the end
of March.
Valmet’s liquidity was strong at the end of the reporting period, with cash and cash equivalents amounting
to EUR 277 million (EUR 274 million) and interest-bearing current financial assets totaling EUR 10 million
(EUR 13 million). Valmet’s liquidity was additionally secured by a committed revolving credit facility worth
of EUR 200 million, which matures in 2023 with a 1-year extension option, and an uncommitted commercial
paper program worth of EUR 200 million. In March 2018 Valmet signed a 5-year EUR 45 million loan
agreement with the European Investment Bank. All of the above facilities were undrawn at the end of the
reporting period.
After the reporting period, on April 5, 2018, Valmet paid out dividends of EUR 82 million.
Capital expenditure Gross capital expenditure in January–March totaled EUR 16 million (EUR 14 million), of which maintenance
investments were EUR 10 million (EUR 9 million).
Acquisitions and disposals
Acquisitions
Valmet made no acquisitions during January–March 2018.
Disposals
Valmet made no disposals during January–March 2018.
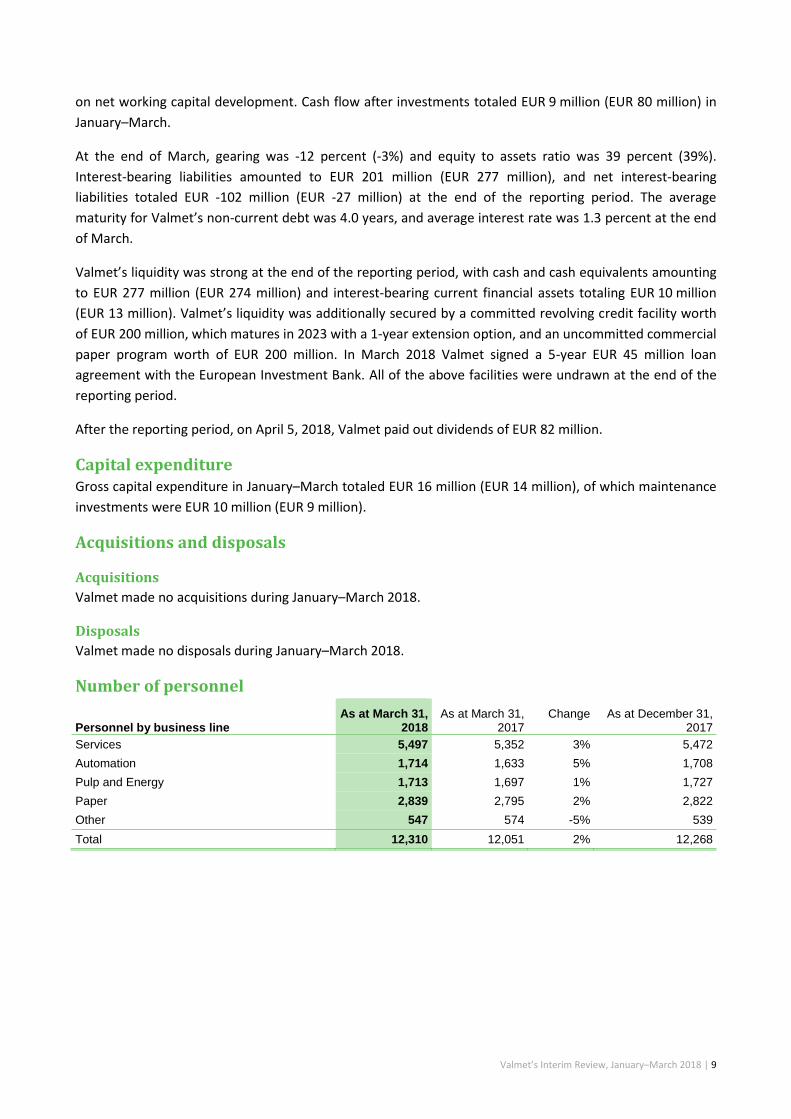
Number of personnel
Personnel by business line As at March 31,
2018 As at March 31,
2017 Change As at December 31,
2017
Services 5,497 5,352 3% 5,472
Automation 1,714 1,633 5% 1,708
Pulp and Energy 1,713 1,697 1% 1,727
Paper 2,839 2,795 2% 2,822
Other 547 574 -5% 539
Total 12,310 12,051 2% 12,268
Valmet’s Interim Review, January–March 2018 | 10
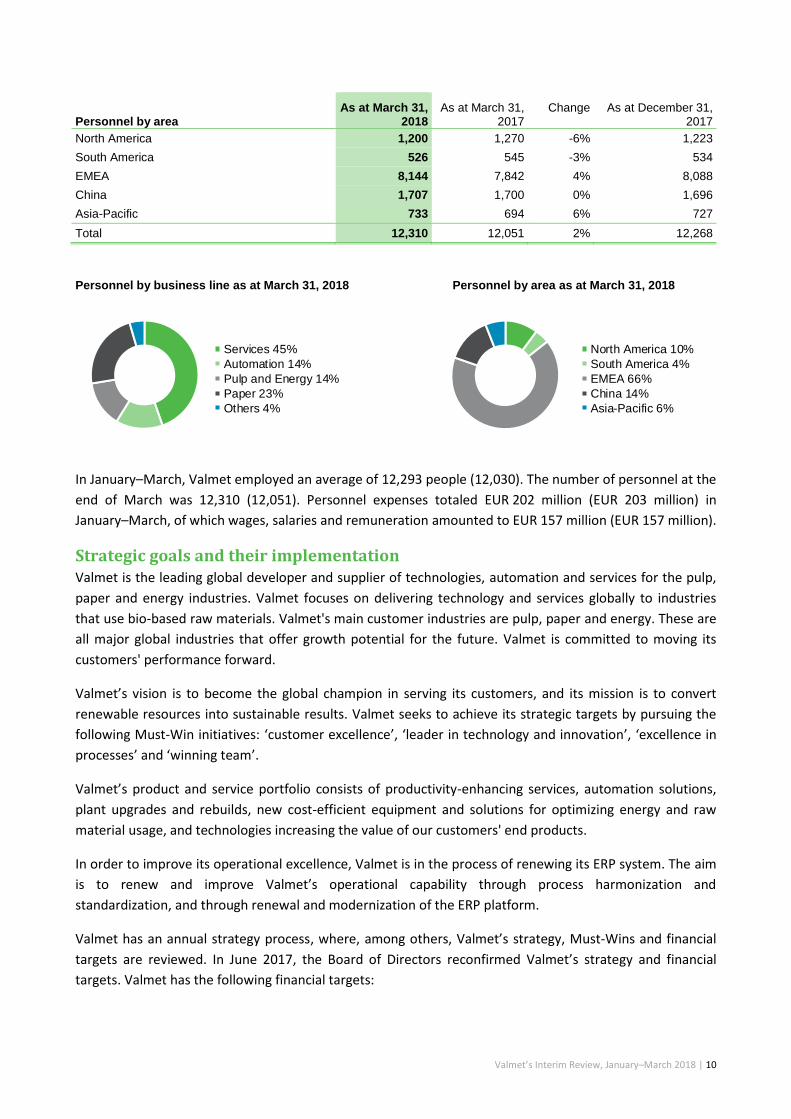
Personnel by area As at March 31,
2018 As at March 31,
2017 Change As at December 31,
2017
North America 1,200 1,270 -6% 1,223
South America 526 545 -3% 534
EMEA 8,144 7,842 4% 8,088
China 1,707 1,700 0% 1,696
Asia-Pacific 733 694 6% 727
Total 12,310 12,051 2% 12,268
Personnel by business line as at March 31, 2018 Personnel by area as at March 31, 2018
In January–March, Valmet employed an average of 12,293 people (12,030). The number of personnel at the
end of March was 12,310 (12,051). Personnel expenses totaled EUR 202 million (EUR 203 million) in
January–March, of which wages, salaries and remuneration amounted to EUR 157 million (EUR 157 million).
Strategic goals and their implementation Valmet is the leading global developer and supplier of technologies, automation and services for the pulp,
paper and energy industries. Valmet focuses on delivering technology and services globally to industries
that use bio-based raw materials. Valmet's main customer industries are pulp, paper and energy. These are
all major global industries that offer growth potential for the future. Valmet is committed to moving its
customers' performance forward.
Valmet’s vision is to become the global champion in serving its customers, and its mission is to convert
renewable resources into sustainable results. Valmet seeks to achieve its strategic targets by pursuing the
following Must-Win initiatives: ‘customer excellence’, ‘leader in technology and innovation’, ‘excellence in
processes’ and ‘winning team’.
Valmet’s product and service portfolio consists of productivity-enhancing services, automation solutions,
plant upgrades and rebuilds, new cost-efficient equipment and solutions for optimizing energy and raw
material usage, and technologies increasing the value of our customers' end products.
In order to improve its operational excellence, Valmet is in the process of renewing its ERP system. The aim
is to renew and improve Valmet’s operational capability through process harmonization and
standardization, and through renewal and modernization of the ERP platform.
Valmet has an annual strategy process, where, among others, Valmet’s strategy, Must-Wins and financial
targets are reviewed. In June 2017, the Board of Directors reconfirmed Valmet’s strategy and financial
targets. Valmet has the following financial targets:
Services 44%
Automation 14%
Pulp and Energy 14%
Paper 23%
Others 5%
Services 45%
Automation 14%
Pulp and Energy 14%
Paper 23%
Others 4%
North America 10%
South America 4%
EMEA 66%
China 14%
Asia-Pacific 6%
Valmet’s Interim Review, January–March 2018 | 11
Financial targets
• Net sales for stable business to grow over two times the market growth
• Net sales for capital business to exceed market growth
• Comparable EBITA: 8–10%
• Comparable return on capital employed (pre-tax), ROCE: 15–20%
• Dividend payout at least 50% of net profit
Stable business means Services and Automation business lines. Capital business means Paper, and Pulp and Energy business lines.
Continued focus on improving profitability Valmet continues to focus on improving profitability through various actions in e.g. sales process
management, project management and project execution, in procurement and quality, as well as in
technology and R&D.
To improve sales process management, Valmet is focusing on key account management and analyzing the
customers’ share of wallet. Valmet is targeting market share improvement at key customers and adding
focus on sales training. Valmet has also launched ‘Valmet Way to Serve’ – a shift towards more unified and
customer oriented services.
Valmet is continuously improving its project management and project execution by training personnel and
implementing a Valmet-wide project execution model. By focusing on improving project management and
execution, Valmet is targeting continuous improvement of gross profit.
Valmet has set a long-term savings target for procurement. In order to decrease procurement costs, Valmet
is increasingly focusing on design-to-cost and adding supplier involvement through supplier relationship
management. Valmet has also set a target for quality cost savings and is adding focus on root cause analysis
of quality deviations. Valmet is continuing to adopt the Lean principles and methodology.
Valmet is constantly focusing on new technologies and R&D to improve product cost competitiveness and
performance. Additionally, the renewal of Valmet’s ERP system will increase efficiency once implemented.
Progress in sustainability In January–March, Valmet progressed with the actions defined in its Sustainability360˚ agenda. Valmet
continued to further strengthen its sustainable supply chain by conducting 8 supplier sustainability audits
globally. Valmet has the target to conduct at least 50 supplier sustainability audits every year.
Valmet’s total recordable incident frequency rate (TRIF) for own employees continued to decrease and was
5.2 at the end of March (5.8 at the end of March 2017). Valmet’s lost time incident frequency (LTIF) for own
employees was 2.4 at the end of March (2.3 at the end of March 2017). Valmet’s collaborating for
contractor safety program continues, and a workshop was held for site service contractors in Tampere,
Finland in January.
The Annual Review discussions were conducted during the first quarter, covering 99 percent of all white-
collar employees. The process introduced a new employee role for Valmet, which highlights behaviors that
drive performance, boost engagement and support development from the perspective of an individual.
A new company-wide e-learning about sustainability was launched in February as a mandatory course for
all white-collar employees. The e-learning covers the basic principles of sustainability at Valmet, and
Valmet’s Interim Review, January–March 2018 | 12
contains supplementary modules for procurement, R&D and sales functions. By the end of March, 23
percent of Valmet´s white-collar employees had completed the course.
In February, Valmet received a Silver Class medal in RobecoSAM's annual Sustainability Yearbook 2018 for
its excellent sustainability performance. Valmet was also reconfirmed as a constituent of the Ethibel
Sustainability Index Europe (ESI), which includes the 200 best-performing European stock listed companies
in the field of corporate social responsibility. These achievements further strengthen Valmet’s position as
one of the global sustainability leaders.
Lawsuits and claims Several lawsuits, claims and disputes based on various grounds are pending against Valmet in various
countries, including product liability lawsuits and claims as well as legal disputes related to Valmet’s
deliveries. Valmet is also a plaintiff in several lawsuits.
Valmet announced by stock exchange release on September 16, 2016 that Suzano Papel e Celulose S.A. has
filed a request for arbitration against Valmet Celulose, Papel e Energia Ltda, Valmet AB and Valmet
Technologies Oy, subsidiaries of Valmet Oyj, claiming approximately EUR 80 million. The arbitration relates
to separate Equipment Sales Agreements for the Suzano Imperatriz pulp mill project in Brazil. Valmet
disputes the claims brought by Suzano and has also actively pursued claims of its own against Suzano for
breach by Suzano of its obligations under the Agreements.
Valmet announced by stock exchange release on December 22, 2016 that it has received a reassessment
decision from the Finnish tax authority for Valmet Technologies Inc. The reassessment decision is a result of
a tax audit carried out in the company, concerning tax years 2010–2012. During the first quarter 2017
Valmet paid additional taxes, late payment interests and penalties in total of EUR 19 million related to the
reassessment decision. Valmet considers the Finnish tax authority's decision unfounded and has appealed
of the decision.
Valmet’s management does not expect to the best of its present understanding that the outcome of these
lawsuits, claims and disputes will have a material adverse effect on Valmet in view of the grounds currently
presented for them, provisions made, insurance coverage in force and the extent of Valmet’s total business
activities.
Corporate Governance and Remuneration Statements Valmet has prepared a separate Corporate Governance Statement and a Remuneration Statement for
2017, which comply with the recommendations of the Finnish Corporate Governance Code for listed
companies. The statements also cover other central areas of corporate governance. The statements have
been published on Valmet’s website, separately from the Report of the Board of Directors, at
www.valmet.com/governance.
Valmet’s Interim Review, January–March 2018 | 13
Shares and shareholders
Share capital, number of shares and shareholders
As at March 31,
2018 As at March 31,
2017
Share capital, EUR 100,000,000 100,000,000
Number of shares 149,864,619 149,864,619
Treasury shares 246,799 399
Shares outstanding 149,617,820 149,864,220
Market capitalization, EUR million1 2,436 2,184
Number of shareholders 45,807 45,271
1 Excluding treasury shares
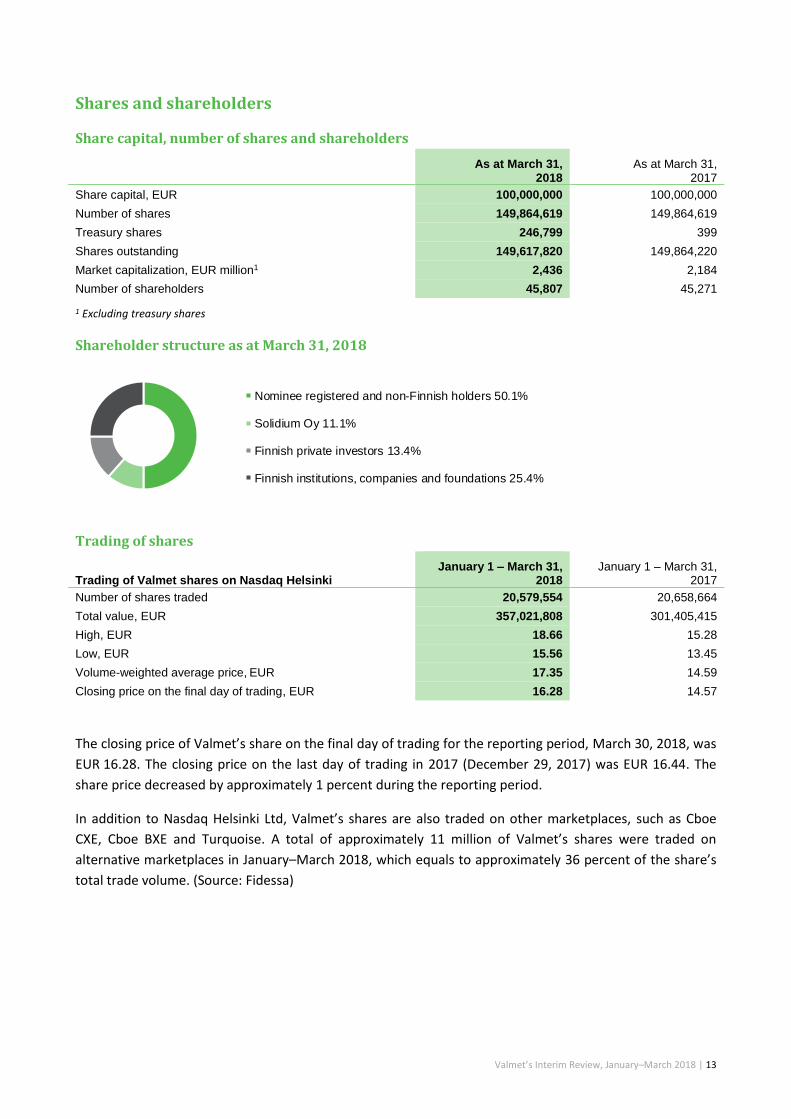
Shareholder structure as at March 31, 2018
Trading of shares
Trading of Valmet shares on Nasdaq Helsinki January 1 – March 31,
2018 January 1 – March 31,
2017
Number of shares traded 20,579,554 20,658,664
Total value, EUR 357,021,808 301,405,415
High, EUR 18.66 15.28
Low, EUR 15.56 13.45
Volume-weighted average price, EUR 17.35 14.59
Closing price on the final day of trading, EUR 16.28 14.57
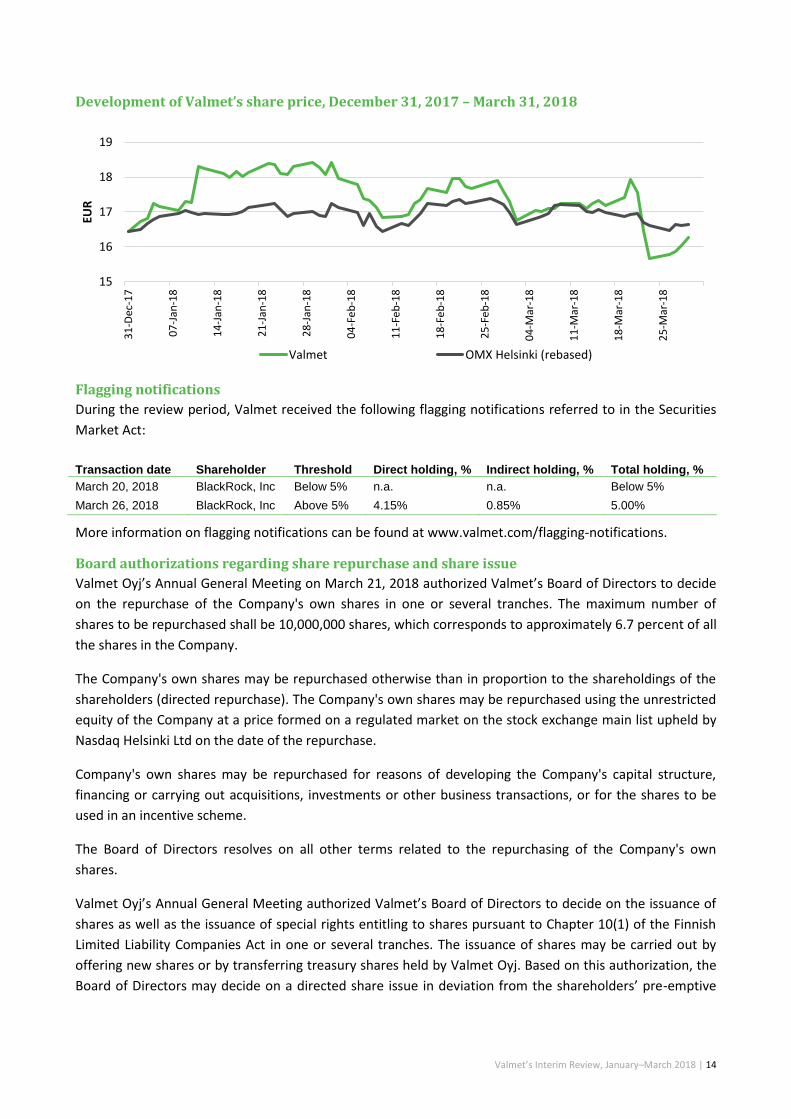
The closing price of Valmet’s share on the final day of trading for the reporting period, March 30, 2018, was
EUR 16.28. The closing price on the last day of trading in 2017 (December 29, 2017) was EUR 16.44. The
share price decreased by approximately 1 percent during the reporting period.
In addition to Nasdaq Helsinki Ltd, Valmet’s shares are also traded on other marketplaces, such as Cboe
CXE, Cboe BXE and Turquoise. A total of approximately 11 million of Valmet’s shares were traded on
alternative marketplaces in January–March 2018, which equals to approximately 36 percent of the share’s
total trade volume. (Source: Fidessa)
Nominee registered and non-Finnish holders 50.1%
Solidium Oy 11.1%
Finnish private investors 13.4%
Finnish institutions, companies and foundations 25.4%
Valmet’s Interim Review, January–March 2018 | 14
Development of Valmet’s share price, December 31, 2017 – March 31, 2018
Flagging notifications
During the review period, Valmet received the following flagging notifications referred to in the Securities
Market Act:
Transaction date Shareholder Threshold Direct holding, % Indirect holding, % Total holding, %
March 20, 2018 BlackRock, Inc Below 5% n.a. n.a. Below 5%
March 26, 2018 BlackRock, Inc Above 5% 4.15% 0.85% 5.00%
More information on flagging notifications can be found at www.valmet.com/flagging-notifications.
Board authorizations regarding share repurchase and share issue
Valmet Oyj’s Annual General Meeting on March 21, 2018 authorized Valmet’s Board of Directors to decide
on the repurchase of the Company's own shares in one or several tranches. The maximum number of
shares to be repurchased shall be 10,000,000 shares, which corresponds to approximately 6.7 percent of all
the shares in the Company.
The Company's own shares may be repurchased otherwise than in proportion to the shareholdings of the
shareholders (directed repurchase). The Company's own shares may be repurchased using the unrestricted
equity of the Company at a price formed on a regulated market on the stock exchange main list upheld by
Nasdaq Helsinki Ltd on the date of the repurchase.
Company's own shares may be repurchased for reasons of developing the Company's capital structure,
financing or carrying out acquisitions, investments or other business transactions, or for the shares to be
used in an incentive scheme.
The Board of Directors resolves on all other terms related to the repurchasing of the Company's own
shares.
Valmet Oyj’s Annual General Meeting authorized Valmet’s Board of Directors to decide on the issuance of
shares as well as the issuance of special rights entitling to shares pursuant to Chapter 10(1) of the Finnish
Limited Liability Companies Act in one or several tranches. The issuance of shares may be carried out by
offering new shares or by transferring treasury shares held by Valmet Oyj. Based on this authorization, the
Board of Directors may decide on a directed share issue in deviation from the shareholders’ pre-emptive
15
16
17
18
193
1-D
ec-1
7
07
-Jan
-18
14
-Jan
-18
21
-Jan
-18
28
-Jan
-18
04
-Fe
b-1
8
11
-Fe
b-1
8
18
-Fe
b-1
8
25
-Fe
b-1
8
04
-Mar
-18
11
-Mar
-18
18
-Mar
-18
25
-Mar
-18
EUR
Valmet OMX Helsinki (rebased)
Valmet’s Interim Review, January–March 2018 | 15
rights, and on the granting of special rights subject to the conditions mentioned in the Finnish Limited
Liability Companies Act.
The maximum number of new shares which may be issued by the Board of Directors based on this
authorization shall be 15,000,000 shares, which corresponds to approximately 10.0 percent of all the shares
in Valmet Oyj. The maximum number of treasury shares which may be issued shall be 10,000,000 shares,
which corresponds to approximately 6.7 percent of all the shares in the Company.
The Board of Directors is furthermore authorized to issue special rights pursuant to Chapter 10(1) of the
Finnish Limited Liability Companies Act entitling their holder to receive new shares or treasury shares for
consideration. The maximum number of shares which may be issued based on the special rights shall be
15,000,000 shares, which corresponds to approximately 10 percent of all the shares in Company. This
number of shares shall be included in the aggregate numbers of shares mentioned in the previous
paragraph.
The new shares and treasury shares may be issued for consideration or without consideration.
The Board of Directors of Valmet Oyj was also authorized to resolve on issuing treasury shares to the
Company without consideration. The maximum number of shares which may be issued to Valmet Oyj shall
be 10,000,000 shares when combined with the number of shares repurchased based on an authorization.
Such number corresponds to approximately 6.7 percent of all shares in the Company. The treasury shares
issued to the Company shall not be taken into account in the limits set out in the preceding paragraphs.
The Board of Directors may resolve on all other terms of the issuance of shares and special rights entitling
to shares pursuant to Chapter 10(1) of the Finnish Limited Liability Companies Act. The Company may use
this authorization, for example, for reasons of developing the Company’s capital structure, in financing or
carrying out acquisitions, investments or other business transactions, or for the shares to be used in
incentive schemes.
The authorizations shall remain in force until the next Annual General Meeting, and they cancel the
authorizations granted in the Annual General Meeting of March 23, 2017. As at March 31, 2018, Valmet’s
Board of Directors had not used any of the authorizations.
Share-based incentive plans Valmet’s share-based incentive plans are part of the remuneration program for Valmet’s key personnel.
The purpose of the plans is to align the goals of shareholders and management to increase the value of the
Company, to ensure commitment of management, and to offer them a competitive, ownership-based
reward scheme. Any shares to be potentially awarded are, or have been, acquired through public trading,
and therefore the incentive plans have no diluting effect on the share value.
During the reporting period, Valmet had an agreement with a third-party service provider concerning the
administration of the share-based incentive programs for key personnel. On March 31, 2018, the number of
shares held within the administration plan was 21,327. In addition, the Company held 246,799 treasury
shares related to the share-based incentive programs.
Long-term incentive plan 2015–2017
The Board of Directors of Valmet Oyj approved in December 2014 a share-based incentive plan for Valmet’s
key employees. The Plan included three performance periods, which were the calendar years 2015, 2016
Valmet’s Interim Review, January–March 2018 | 16
and 2017. The Board of Directors decided on the performance criteria and targets in the beginning of each
discretionary period. The Plan was directed to approximately 80 key employees (including Executive Team
members). The rewards of the plan were paid partly as Company shares and partly in cash.
Long-term incentive plan 2018–2020
The Board of Directors of Valmet Oyj approved in December 2017 a new long-term share-based incentive
plan for Valmet's key employees. The plan includes three performance periods, which are the calendar
years 2018, 2019 and 2020. Valmet's Board of Directors shall decide on the performance criteria and
targets in the beginning of each discretionary period. The plan is directed to a total of approximately 120
participants, of which 80 are key employees in management positions (including Executive Team
members), and 40 are management talents, which is a new target group in Valmet's share based incentive
plan.
The Board of Directors of Valmet Oyj approved in December 2017 a share ownership recommendation for
Valmet's Executive Team members. All members of the Executive Team are recommended to own and hold
an amount of Company shares equaling to their gross annual base salary (100 percent ownership
recommendation).
More information about share-based incentive plans can be found in Valmet’s Remuneration Statement,
which is available at www.valmet.com/governance.
Resolutions of Valmet’s Annual General Meeting The Annual General Meeting of Valmet Oyj was held in Helsinki on March 21, 2018. The Annual General
Meeting adopted the Financial Statements for 2017 and discharged the members of the Board of Directors
and the President and CEO from liability for the 2017 financial year. The Annual General Meeting approved
the Board of Directors' proposals concerning authorizing the Board to decide on repurchasing company
shares and to resolve on the issuance of shares and the issuance of special rights entitling to shares.
Performance period 2015 2016 2017
Incentive based on EBITA % and Services orders received growth %
Comparable EBITA % and orders received growth % of the stable business (Services and Automation business lines)
Comparable EBITA % and orders received growth % of the stable business (Services and Automation business lines)
Reward payment Was paid in spring 2016 Was paid in spring 2017 Was paid in spring 2018
Total gross number of shares earned (including the matching share rewards)
540,035 556,049 390,820
As part of the share-based incentive program, members of Valmet Executive Team had the possibility to receive a matching share reward for each performance period, provided that the Executive Team member owned or acquired Valmet shares up to a number determined by the Board of Directors by the end of each performance period.
Performance period 2018
Incentive based on Comparable EBITA % and orders received growth % of the stable business (Services and Automation business lines)
Reward payment Will be paid partly in Valmet shares and partly in cash in 2019
Total number of shares Approximate maximum of 509,162
Valmet’s Interim Review, January–March 2018 | 17
The Annual General Meeting confirmed the number of Board members as seven and appointed Bo Risberg
as Chairman of Valmet Oyj's Board and Aaro Cantell as Vice Chairman. Monika Maurer and Pekka
Kemppainen were appointed as new members of the Board. Rogério Ziviani, Tarja Tyni and Eriikka
Söderström will continue as members of the Board. The term of office of the members of the Board of
Directors expires at the close of the Annual General Meeting 2019.
PricewaterhouseCoopers Oy, authorized public accountants, was appointed as the company's auditor for a
term expiring at the end of the next Annual General Meeting.
Valmet published a stock exchange release on March 21, 2018 concerning the resolutions of the Annual
General Meeting and the organizing meeting of the Board of Directors. The stock exchange release and an
introduction of the new Board members can be viewed on Valmet’s website at www.valmet.com/agm.
In compliance with the resolution of the Annual General Meeting on March 21, 2018, Valmet paid out
dividends of EUR 82 million for 2017, corresponding to EUR 0.55 per share, on April 5, 2018.
Risks and business uncertainties Valmet’s operations are affected by various strategic, financial, operational and hazard risks. Valmet takes
measures to exploit emerging opportunities and to limit the adverse effects of potential threats. The
assessment of risks related to sustainable development holds an important role in risk management. If such
threats materialized, they could have material adverse effects on Valmet’s business, financial situation and
operating result, or on the value of shares and other securities.
The objective of Valmet’s risk management is to ensure the implementation of an effective and successful
strategy for achieving both long- and short-term goals. The task of Valmet’s management is to regulate risk
appetite.
In assessing risks, Valmet takes into consideration the probability of the risks and their estimated impact on
net sales and financial results. Valmet’s management estimates that the company’s overall risk level is
currently manageable in proportion to the scope of its operations and the practical measures available for
managing these risks.
Financial uncertainty in the global economy, coupled with fluctuations in exchange rates and tightening
financial market regulations, may have an adverse effect on the availability of financing from banks and
capital markets and could reduce the investment appetite of Valmet’s customers. Valmet estimates that
the high proportion of business derived from stable business (Services and Automation) and the
geographical diversification will reduce the possible negative effects that market uncertainties may have.
If global economic growth weakens, it might have adverse effects on new projects under negotiation or on
projects in the order backlog. Some projects may be postponed, suspended, or canceled. In the case of
long-term delivery projects, initial customer advance payments are typically 10–30 percent of the value of
the project, and customers make progress payments as a project is implemented. This significantly
decreases the risks and financing requirements related to Valmet’s projects. Valmet continually assesses its
customers’ creditworthiness and their ability to meet their obligations. As a rule, Valmet does not finance
customer projects. If economic growth slows down significantly, the markets for Valmet’s products may
shrink, which may lead to, for example, tougher price competition.
Valmet’s Interim Review, January–March 2018 | 18
Changes and uncertainty in future regulation and legislation can also critically affect especially the energy
business.
Large fluctuations in energy prices can affect the global economy. These fluctuations can also affect Valmet
and its customers, especially in the energy business.
Changes in labor costs and the prices of raw materials and components can affect Valmet’s profitability.
Wage inflation is continuing, but Valmet’s goal is to offset this at least partly through increased productivity
and strict price discipline. It is possible, however, that tough competition in some product categories will
make it difficult to pass on cost increases to product prices. On the other hand, some of Valmet’s customers
are raw material producers and their ability to operate and invest may be enhanced by strengthening
commodity prices and hampered by declining commodity prices.
To ensure a high level of quality in both production and services, it is important to sustain a high level of
competence and talent availability. This includes, for example, maintaining efficient recruitment programs,
utilization of existing talent and sharing knowledge globally.
Through acquisitions Valmet may become exposed to risks associated with new markets and business
environments. The actual acquisition process also includes risks. Other risks associated with acquisitions
include, but are not limited to, integration of the acquired business, increased financial risk exposure,
retention of key personnel and achieving the targets set for the acquired business.
Management of project business risks important
An important part of Valmet’s business consists of project business. Pulp business projects in particular are
large, thus project-specific risk management is crucial. Key risks related to projects are project cost
estimation, scheduling, project risk management, quality and performance risks, and materials
management risks. Risk analysis shall, as a minimum, take place for all significant project quotations. The
work concerning threat and opportunity assessment continues during the execution phase of the project.
Risk management is based on careful planning and on continuous, systematic monitoring and evaluation.
Project risks are managed by improving and continuously developing project management processes and
the related systems.
There may be changes in the competitive situation of Valmet’s individual businesses, such as the
emergence of new, cost-effective players in the markets. Valmet can safeguard its market position by
developing its products and services, through good customer service and local presence.
Availability of financing crucial
Securing the continuity of Valmet’s operations requires that sufficient funding is available under all
circumstances. Valmet estimates that its liquid cash assets and committed credit limits are sufficient to
secure its immediate liquidity and to ensure the flexibility of financing. The average maturity for Valmet’s
non-current debt is 4.0 years. Loan facilities include customary covenants and Valmet is in clear compliance
with the covenants at the balance sheet date.
Net working capital and capital expenditure levels have a key impact on the adequacy of Valmet’s
financing. Valmet estimates that it is well-positioned to keep capital expenditure at the level of total
depreciation.
Valmet’s Interim Review, January–March 2018 | 19
Of the financial risks that affect Valmet’s profit, currency exchange rate risks are among the most
substantial. Exchange rate changes can affect Valmet’s business, although the wide geographical scope of
the company’s operations reduces the impact of any individual currency. Economic insecurity typically
increases exchange rate fluctuations. Valmet hedges its currency exposures linked to firm delivery and
purchase agreements.
Changes in legislation and the way authorities interpret regulation, for example regarding taxation, can also
have an impact on Valmet’s financials.
At the end of March 2018, Valmet had EUR 610 million (EUR 623 million) of goodwill on its statement of
financial position. Valmet assesses the value of its goodwill for impairment annually, or more frequently if
facts and circumstances indicate that a risk of impairment exists. Valmet has not identified any indications
of impairment during the reporting period. The principles used for impairment testing are presented in the
Financial Statements.
Events after the reporting period There were no subsequent events after the review period that required recognition or disclosure.
Guidance for 2018 unchanged Valmet reiterates its guidance presented on March 21, 2018, in which Valmet estimates that net sales in
2018 will remain at the same level as in 2017 (EUR 3,058 million) and Comparable EBITA in 2018 will
increase in comparison with 2017 (EUR 218 million).
Short-term outlook
General economic outlook
The global economic upswing has become broader and stronger. At 3.8 percent, global growth in 2017 was
the fastest since 2011, and growth is expected to tick up to 3.9 percent in both 2018 and 2019. For most
countries, current favorable growth rates will not last, and global growth is projected to soften beyond the
next couple of years. Downside concerns include a possibly sharp tightening of financial conditions, waning
popular support for global economic integration, growing trade tensions and risks of a shift toward
protectionist policies, and geopolitical strains. Most advanced economies are poised to return to growth
rates well below precrisis averages, held back by aging populations and lackluster productivity.
(International Monetary Fund, April 17, 2018)
Short-term market outlook
Valmet reiterates the good short-term market outlook for services, board and paper, tissue and
automation, the satisfactory short-term market outlook for energy, and the weak short-term market
outlook for pulp.
In Espoo on April 27, 2018
Valmet’s Board of Directors
Unaudited Condensed Consolidated Interim Financial Statements
Valmet’s Interim Review, January–March 2018 | 20
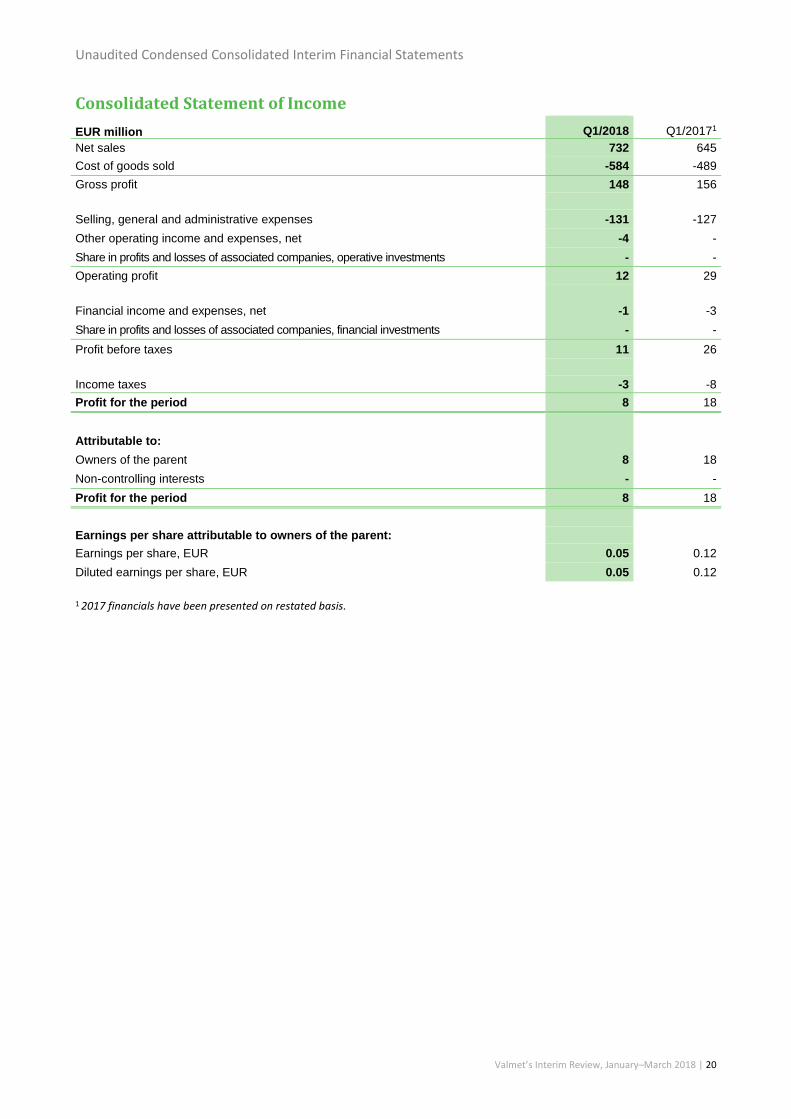
Consolidated Statement of Income
EUR million Q1/2018 Q1/20171
Net sales 732 645
Cost of goods sold -584 -489
Gross profit 148 156
Selling, general and administrative expenses -131 -127
Other operating income and expenses, net -4 -
Share in profits and losses of associated companies, operative investments - -
Operating profit 12 29
Financial income and expenses, net -1 -3
Share in profits and losses of associated companies, financial investments - -
Profit before taxes 11 26
Income taxes -3 -8
Profit for the period 8 18
Attributable to:
Owners of the parent 8 18
Non-controlling interests - -
Profit for the period 8 18
Earnings per share attributable to owners of the parent:
Earnings per share, EUR 0.05 0.12
Diluted earnings per share, EUR 0.05 0.12
1 2017 financials have been presented on restated basis.
Unaudited Condensed Consolidated Interim Financial Statements
Valmet’s Interim Review, January–March 2018 | 21
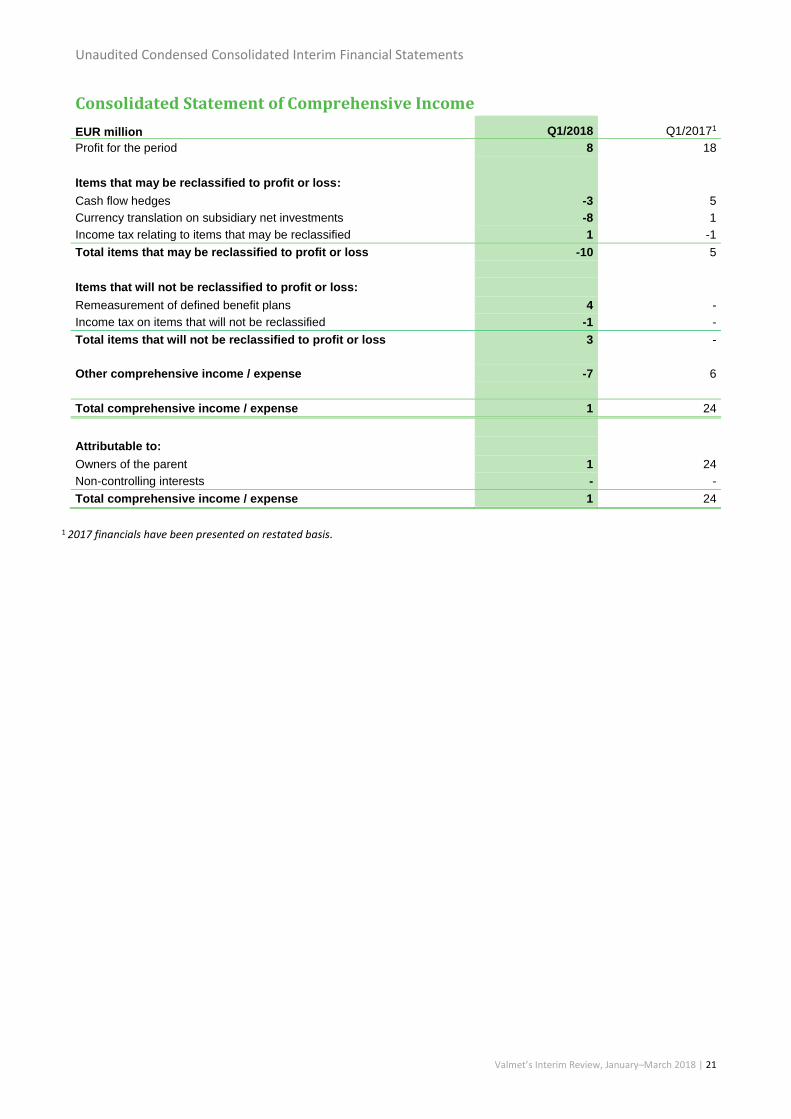
Consolidated Statement of Comprehensive Income
EUR million Q1/2018 Q1/20171
Profit for the period 8 18
Items that may be reclassified to profit or loss:
Cash flow hedges -3 5
Currency translation on subsidiary net investments -8 1
Income tax relating to items that may be reclassified 1 -1
Total items that may be reclassified to profit or loss -10 5
Items that will not be reclassified to profit or loss:
Remeasurement of defined benefit plans 4 -
Income tax on items that will not be reclassified -1 -
Total items that will not be reclassified to profit or loss 3 -
Other comprehensive income / expense -7 6
Total comprehensive income / expense 1 24
Attributable to:
Owners of the parent 1 24
Non-controlling interests - -
Total comprehensive income / expense 1 24
1 2017 financials have been presented on restated basis.
Unaudited Condensed Consolidated Interim Financial Statements
Valmet’s Interim Review, January–March 2018 | 22
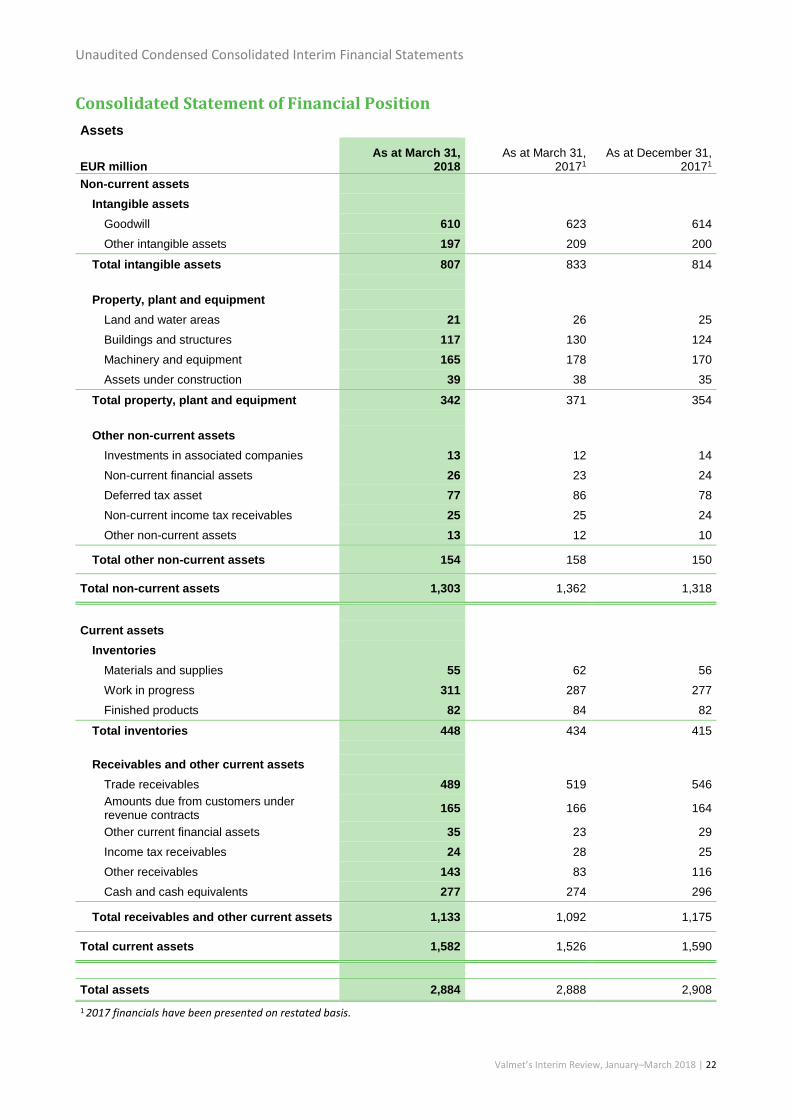
Consolidated Statement of Financial Position
Assets
EUR million As at March 31,
2018 As at March 31,
20171 As at December 31,
20171
Non-current assets
Intangible assets
Goodwill 610 623 614
Other intangible assets 197 209 200
Total intangible assets 807 833 814
Property, plant and equipment
Land and water areas 21 26 25
Buildings and structures 117 130 124
Machinery and equipment 165 178 170
Assets under construction 39 38 35
Total property, plant and equipment 342 371 354
Other non-current assets
Investments in associated companies 13 12 14
Non-current financial assets 26 23 24
Deferred tax asset 77 86 78
Non-current income tax receivables 25 25 24
Other non-current assets 13 12 10
Total other non-current assets 154 158 150
Total non-current assets 1,303 1,362 1,318
Current assets
Inventories
Materials and supplies 55 62 56
Work in progress 311 287 277
Finished products 82 84 82
Total inventories 448 434 415
Receivables and other current assets
Trade receivables 489 519 546
Amounts due from customers under revenue contracts
165 166 164
Other current financial assets 35 23 29
Income tax receivables 24 28 25
Other receivables 143 83 116
Cash and cash equivalents 277 274 296
Total receivables and other current assets 1,133 1,092 1,175
Total current assets 1,582 1,526 1,590
Total assets 2,884 2,888 2,908
1 2017 financials have been presented on restated basis.
Unaudited Condensed Consolidated Interim Financial Statements
Valmet’s Interim Review, January–March 2018 | 23
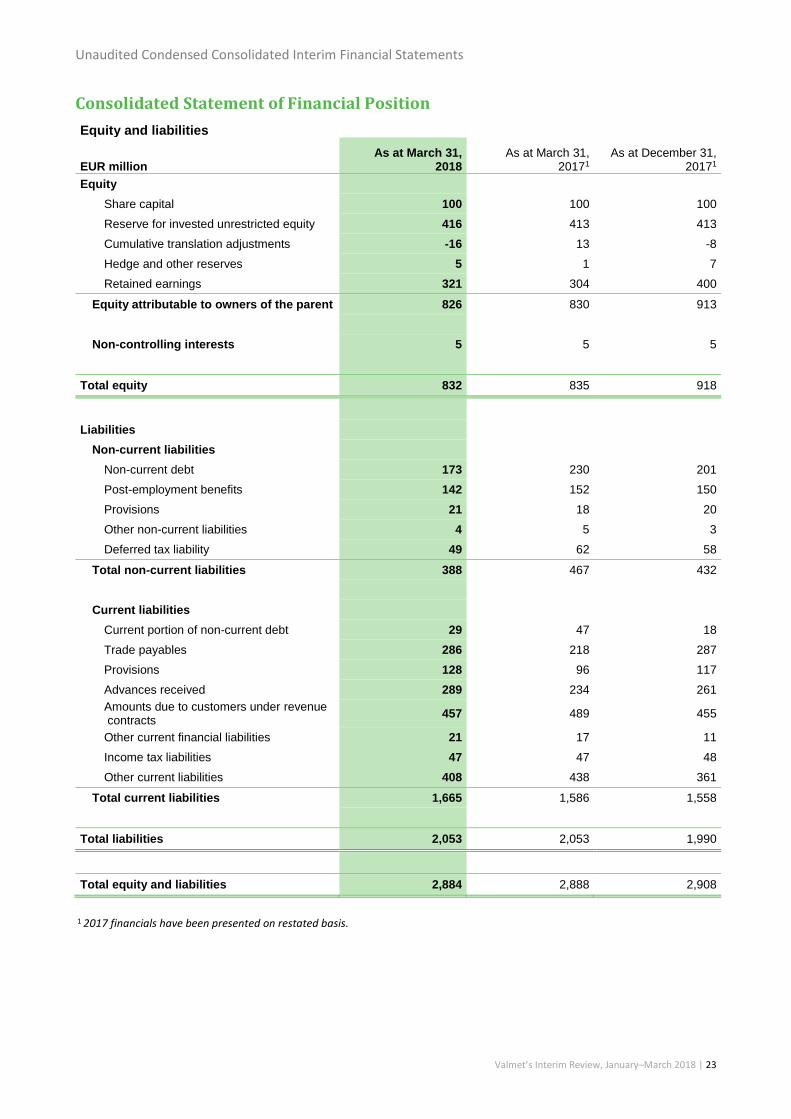
Consolidated Statement of Financial Position
Equity and liabilities
EUR million As at March 31,
2018 As at March 31,
20171 As at December 31,
20171
Equity
Share capital 100 100 100
Reserve for invested unrestricted equity 416 413 413
Cumulative translation adjustments -16 13 -8
Hedge and other reserves 5 1 7
Retained earnings 321 304 400
Equity attributable to owners of the parent 826 830 913
Non-controlling interests 5 5 5
Total equity 832 835 918
Liabilities
Non-current liabilities
Non-current debt 173 230 201
Post-employment benefits 142 152 150
Provisions 21 18 20
Other non-current liabilities 4 5 3
Deferred tax liability 49 62 58
Total non-current liabilities 388 467 432
Current liabilities
Current portion of non-current debt 29 47 18
Trade payables 286 218 287
Provisions 128 96 117
Advances received 289 234 261
Amounts due to customers under revenue contracts
457 489 455
Other current financial liabilities 21 17 11
Income tax liabilities 47 47 48
Other current liabilities 408 438 361
Total current liabilities 1,665 1,586 1,558
Total liabilities 2,053 2,053 1,990
Total equity and liabilities 2,884 2,888 2,908
1 2017 financials have been presented on restated basis.
Unaudited Condensed Consolidated Interim Financial Statements
Valmet’s Interim Review, January–March 2018 | 24
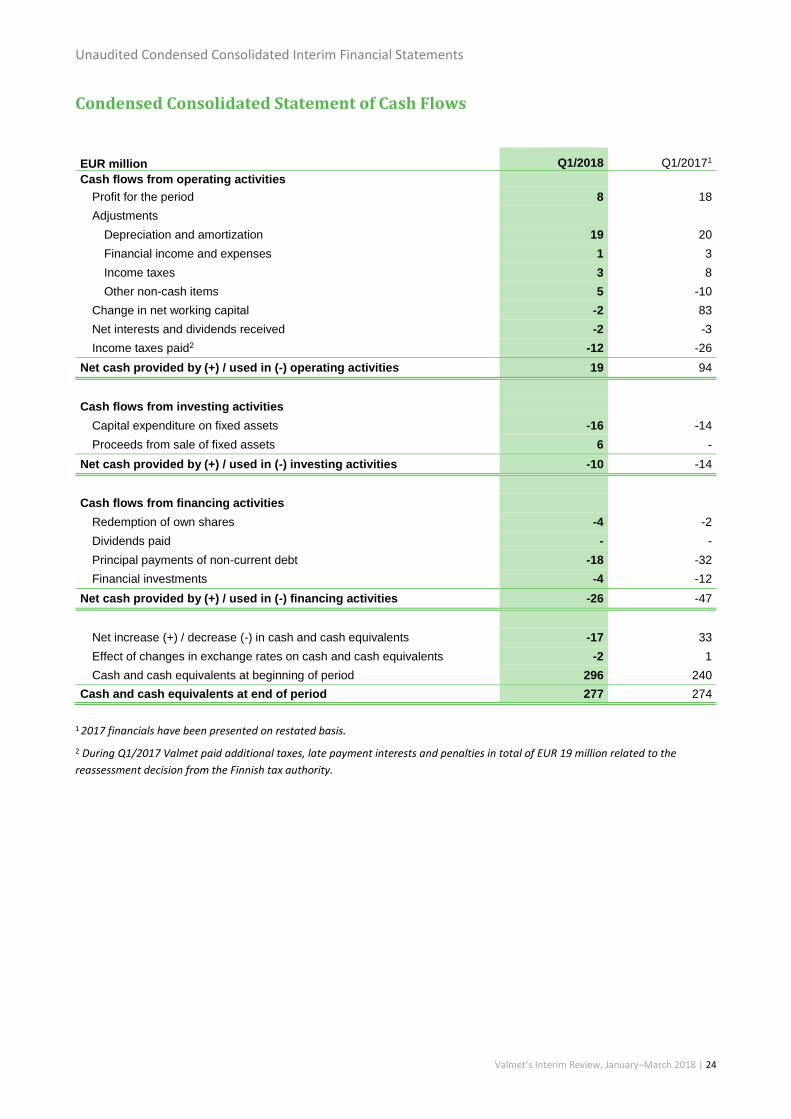
Condensed Consolidated Statement of Cash Flows
EUR million Q1/2018 Q1/20171
Cash flows from operating activities
Profit for the period 8 18
Adjustments
Depreciation and amortization 19 20
Financial income and expenses 1 3
Income taxes 3 8
Other non-cash items 5 -10
Change in net working capital -2 83
Net interests and dividends received -2 -3
Income taxes paid2 -12 -26
Net cash provided by (+) / used in (-) operating activities 19 94
Cash flows from investing activities
Capital expenditure on fixed assets -16 -14
Proceeds from sale of fixed assets 6 -
Net cash provided by (+) / used in (-) investing activities -10 -14
Cash flows from financing activities
Redemption of own shares -4 -2
Dividends paid - -
Principal payments of non-current debt -18 -32
Financial investments -4 -12
Net cash provided by (+) / used in (-) financing activities -26 -47
Net increase (+) / decrease (-) in cash and cash equivalents -17 33
Effect of changes in exchange rates on cash and cash equivalents -2 1
Cash and cash equivalents at beginning of period 296 240
Cash and cash equivalents at end of period 277 274
1 2017 financials have been presented on restated basis.
2 During Q1/2017 Valmet paid additional taxes, late payment interests and penalties in total of EUR 19 million related to the
reassessment decision from the Finnish tax authority.
Unaudited Condensed Consolidated Interim Financial Statements
Valmet’s Interim Review, January–March 2018 | 25
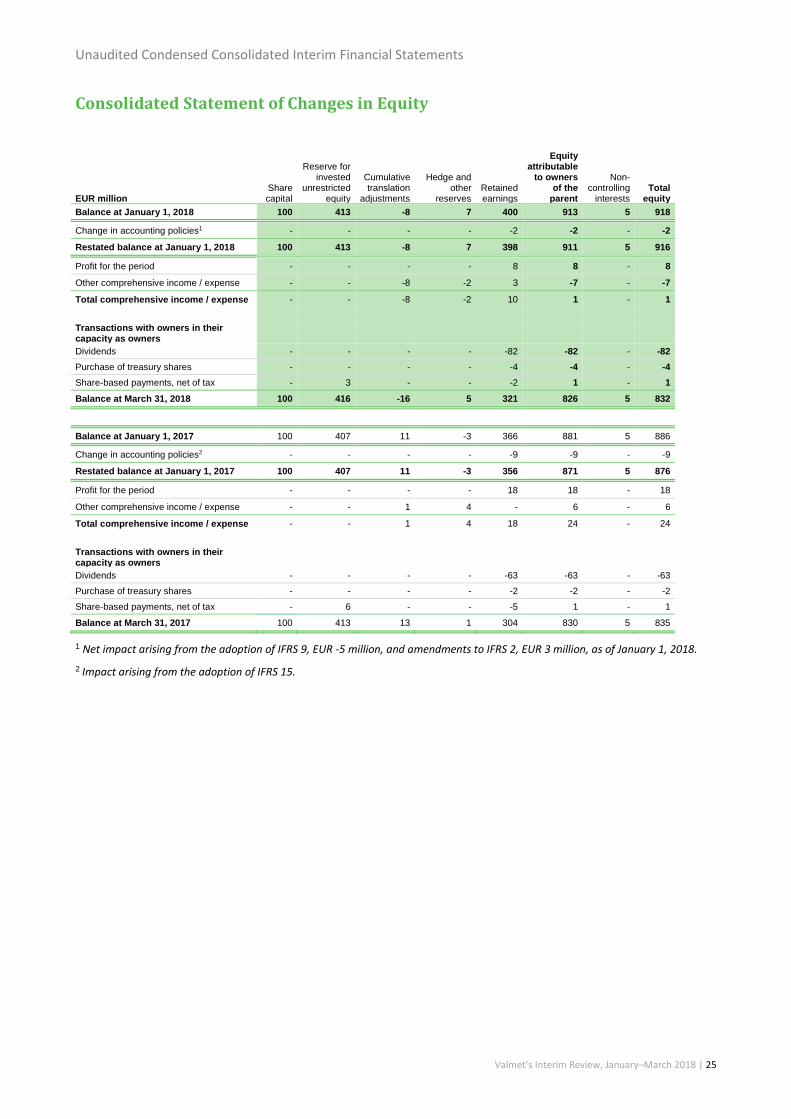
Consolidated Statement of Changes in Equity
EUR million Share capital
Reserve for invested
unrestricted equity
Cumulative translation
adjustments
Hedge and other
reserves Retained earnings
Equity attributable
to owners of the
parent
Non-controlling
interests Total
equity
Balance at January 1, 2018 100 413 -8 7 400 913 5 918
Change in accounting policies1 - - - - -2 -2 - -2
Restated balance at January 1, 2018 100 413 -8 7 398 911 5 916
Profit for the period - - - - 8 8 - 8
Other comprehensive income / expense - - -8 -2 3 -7 - -7
Total comprehensive income / expense - - -8 -2 10 1 - 1
Transactions with owners in their capacity as owners
Dividends - - - - -82 -82 - -82
Purchase of treasury shares - - - - -4 -4 - -4
Share-based payments, net of tax - 3 - - -2 1 - 1
Balance at March 31, 2018 100 416 -16 5 321 826 5 832
Balance at January 1, 2017 100 407 11 -3 366 881 5 886
Change in accounting policies2 - - - - -9 -9 - -9
Restated balance at January 1, 2017 100 407 11 -3 356 871 5 876
Profit for the period - - - - 18 18 - 18
Other comprehensive income / expense - - 1 4 - 6 - 6
Total comprehensive income / expense - - 1 4 18 24 - 24
Transactions with owners in their capacity as owners
Dividends - - - - -63 -63 - -63
Purchase of treasury shares - - - - -2 -2 - -2
Share-based payments, net of tax - 6 - - -5 1 - 1
Balance at March 31, 2017 100 413 13 1 304 830 5 835
1 Net impact arising from the adoption of IFRS 9, EUR -5 million, and amendments to IFRS 2, EUR 3 million, as of January 1, 2018.
2 Impact arising from the adoption of IFRS 15.
Unaudited Condensed Consolidated Interim Financial Statements
Valmet’s Interim Review, January–March 2018 | 26
Accounting policies
General information
Valmet Oyj (the “Company” or the “parent company”) and its subsidiaries (together “Valmet”, “Valmet
Group” or the “Group”) form a global developer and supplier of process technologies, automation and
services for the pulp, paper and energy industries.
Valmet Oyj is domiciled in Helsinki, and its registered address is Keilasatama 5, 02150 Espoo, Finland. The
Company’s shares are listed on Nasdaq Helsinki Ltd.
These Condensed Consolidated Interim Financial Statements were approved for issue on April 27, 2018.
Basis of presentation
These Condensed Consolidated Interim Financial Statements for the three months ended March 31, 2018
have been prepared in accordance with IAS 34 – Interim financial reporting, and in conformity with IFRS as
adopted by the European Union. The financials for the comparative periods are presented on restated
basis. The financial information presented in these Condensed Consolidated Interim Financial Statements
has not been audited. The Condensed Consolidated Interim Financial Statements should be read in
conjunction with the Group’s Annual Consolidated Financial Statements for the year ended December 31,
2017, which have been prepared in accordance with IFRS.
Several new or amended accounting standards have become applicable for the current reporting period,
including IFRS 15 – Revenue from Contracts with Customers, IFRS 9 – Financial Instruments and
amendments to IFRS 2 – Share-based Payment.
The amendments to IFRS 2 clarified the effect of vesting conditions on the measurement of cash-settled
share-based payment transactions, the classification of share-based payment transactions with net
settlement feature, and accounting for modifications in the terms and conditions of share-based payment
arrangements that result in changes in classification of related transactions from cash-settled to equity-
settled. In majority of jurisdictions where key employees participating into the Group’s long-term incentive
plans reside, Valmet has an obligation to withhold an amount for the key employee’s tax obligations
associated with the share-based payment rewards, and transfer that amount directly to the tax authorities
on the key employee’s behalf. Consequently, following adoption of the amendments to IFRS 2, EUR 3
million was reclassified from Other current liabilities to Equity in relation to share-based payment
transactions that carry a net settlement feature. The amended measurement guidance applies only to
share-based payment transactions that were unvested as at January 1, 2018, there is no adjustment to
prior periods. The change in the measurement of the cash-settled share-based payment transactions does
not have a material impact on compensation expense recognized in the current reporting period.
Accounting policies revised to consider the requirements of IFRS 15 and IFRS 9 have been provided in the
disclosure notes presented in subsequent pages. Description and quantification of the impact of the
changes in accounting policies related to adoption of the IFRS 15 are presented in the Stock exchange
release published on March 21, 2018.
In addition to the above standards, IFRIC 22 – Foreign Currency Transactions and Advance Considerations
became effective as of January 1, 2018. The interpretation clarifies which exchange rate to use in reporting
of foreign currency transactions (such as revenue transactions) when payment is made or received in
advance. The requirements of IFRIC 22 do not have a material impact on the results or financial position of
the Valmet Group.
Unaudited Condensed Consolidated Interim Financial Statements
Valmet’s Interim Review, January–March 2018 | 27
Except for the adoption for the new standards, the accounting policies applied in the preparation of these
Condensed Consolidated Interim Financial Statements are consistent with those followed in the
preparation of the Group’s Annual Consolidated Financial Statements for the year ended December 31,
2017.
In the Condensed Consolidated Interim Financial Statements, the figures are presented in million euros
subject to rounding, which may cause some rounding inaccuracies in aggregate column and row totals.
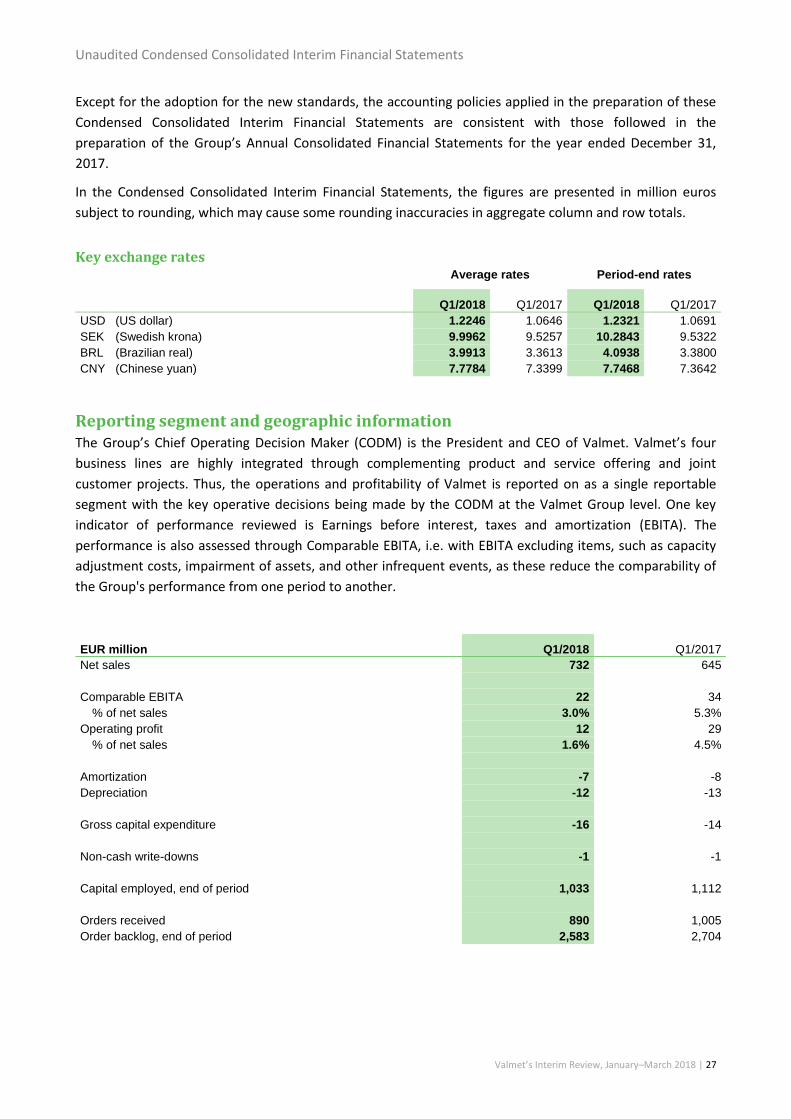
Key exchange rates
Average rates Period-end rates
Q1/2018 Q1/2017 Q1/2018 Q1/2017
USD (US dollar) 1.2246 1.0646 1.2321 1.0691
SEK (Swedish krona) 9.9962 9.5257 10.2843 9.5322
BRL (Brazilian real) 3.9913 3.3613 4.0938 3.3800
CNY (Chinese yuan) 7.7784 7.3399 7.7468 7.3642
Reporting segment and geographic information The Group’s Chief Operating Decision Maker (CODM) is the President and CEO of Valmet. Valmet’s four
business lines are highly integrated through complementing product and service offering and joint
customer projects. Thus, the operations and profitability of Valmet is reported on as a single reportable
segment with the key operative decisions being made by the CODM at the Valmet Group level. One key
indicator of performance reviewed is Earnings before interest, taxes and amortization (EBITA). The
performance is also assessed through Comparable EBITA, i.e. with EBITA excluding items, such as capacity
adjustment costs, impairment of assets, and other infrequent events, as these reduce the comparability of
the Group's performance from one period to another.
EUR million Q1/2018 Q1/2017
Net sales 732 645
Comparable EBITA 22 34
% of net sales 3.0% 5.3%
Operating profit 12 29
% of net sales 1.6% 4.5%
Amortization -7 -8
Depreciation -12 -13
Gross capital expenditure -16 -14
Non-cash write-downs -1 -1
Capital employed, end of period 1,033 1,112
Orders received 890 1,005
Order backlog, end of period 2,583 2,704
Unaudited Condensed Consolidated Interim Financial Statements
Valmet’s Interim Review, January–March 2018 | 28
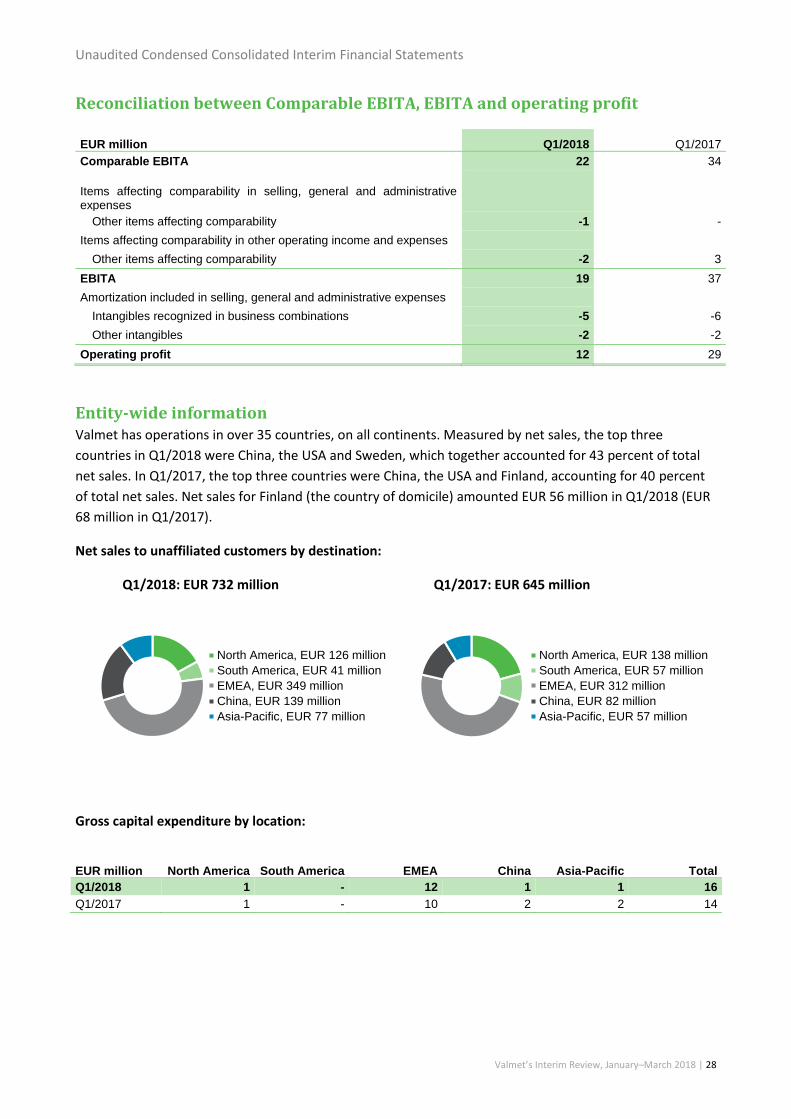
Reconciliation between Comparable EBITA, EBITA and operating profit
EUR million Q1/2018 Q1/2017
Comparable EBITA 22 34
Items affecting comparability in selling, general and administrative expenses
Other items affecting comparability -1 -
Items affecting comparability in other operating income and expenses
Other items affecting comparability -2 3
EBITA 19 37
Amortization included in selling, general and administrative expenses
Intangibles recognized in business combinations -5 -6
Other intangibles -2 -2
Operating profit 12 29
Entity-wide information Valmet has operations in over 35 countries, on all continents. Measured by net sales, the top three
countries in Q1/2018 were China, the USA and Sweden, which together accounted for 43 percent of total
net sales. In Q1/2017, the top three countries were China, the USA and Finland, accounting for 40 percent
of total net sales. Net sales for Finland (the country of domicile) amounted EUR 56 million in Q1/2018 (EUR
68 million in Q1/2017).
Net sales to unaffiliated customers by destination:
Q1/2018: EUR 732 million Q1/2017: EUR 645 million
Gross capital expenditure by location:
EUR million North America South America EMEA China Asia-Pacific Total
Q1/2018 1 - 12 1 1 16
Q1/2017 1 - 10 2 2 14
North America, EUR 126 million
South America, EUR 41 million
EMEA, EUR 349 million
China, EUR 139 million
Asia-Pacific, EUR 77 million
North America, EUR 138 million
South America, EUR 57 million
EMEA, EUR 312 million
China, EUR 82 million
Asia-Pacific, EUR 57 million
Unaudited Condensed Consolidated Interim Financial Statements
Valmet’s Interim Review, January–March 2018 | 29
Revenue Valmet delivers process automation, machinery, equipment and services for the pulp, paper, energy and
other industries. On the capital business side, the Group’s revenue arises from projects, the scope of which
ranges from delivery of complete mill facilities on a turnkey basis to single section machine rebuilds that
may or may not include process automation solutions. Service business revenue includes revenue from
short-term and long-term maintenance contracts, smaller improvement and modification contracts,
rebuilds, as well as sale of spare parts and consumables. Capital and service business revenue largely arises
from the same customers with service offering being focused on maintaining installed base of equipment
and automation solutions.
Revenue is recognized to depict the transfer of promised goods or services to the customers in an amount
that reflects the consideration to which management expects to be entitled to in exchange for those goods
or services. The timing and method as well as unit of revenue recognition are determined in accordance
with the five-step model of IFRS 15 as follows:
Step 1: Identification of the contract(s) with a customer
Step 2: Identification of the performance obligations in the contract
Step 3: Determination of the transaction price attached to the contract
Step 4: Allocation of the transaction price to the performance obligations identified in the contract
Step 5: Recognition of revenue when (or as) the entity satisfies a performance obligation
In long-term capital projects involving delivery of both equipment and services, one or more performance
obligations are identified. The identification of performance obligations depends on the scope of the
project and terms of the contract, and largely follows the level at which quotes are being requested by the
customers on capital projects.
In short-term service contracts that involve delivery of a combination of equipment and services,
depending on the scope of the contract and terms attached thereto, one or more performance obligations
are identified. When scope of the contract involves services provided at the customer site, such as
installation, maintenance, technical support or mechanical audits, these are typically considered a separate
performance obligation from delivery of significant equipment and services provided off-site. On the other
hand, when services in the scope of the contract are performed at Valmet premises only, such as workshop
services, material and services typically cannot be identified separately, and consistently only one
performance obligation is identified.
In long-term service contracts where Valmet’s activities are largely performed at the customer’s site,
depending on the contract and terms attached thereto, one or more performance obligations are
identified. When the scope of the contract involves various service elements that are sold separately on a
stand-alone basis, these elements would typically be determined to consist of performance obligations on
their own.
Revenue is recognized when a customer obtains control of a good or service. A customer obtains control
when it has the ability to direct the use of and obtain the benefits from the good or service, either over
time or at a point in time.
When Valmet determines that control on goods or services is transferred over time, this is typically based
on either that customer simultaneously receives and consumes benefits as Valmet performs, or that
Unaudited Condensed Consolidated Interim Financial Statements
Valmet’s Interim Review, January–March 2018 | 30
Valmet’s performance creates an asset with no alternative use throughout the duration of a contract and
Valmet has enforceable right to payment for performance completed to date.
Deliverables within Valmet’s product offering that have the characteristics of the first criterion include mill
maintenance services or other field services provided under long-term contracts, in which the receipt and
simultaneous consumption by the customer of the benefits of Valmet’s performance can be readily
identified. Deliverables with the characteristics of the second criterion include capital projects where the
scope of the contract involves design and construction of an asset according to customer specifications. The
assets created in these projects do not have alternative use because the design is based on specific
customer needs. When revenue is recognized over time, progress toward complete satisfaction of the
performance obligation is measured using the cost-to-cost method. The cost-to-cost method is estimated
to result in a revenue profile that best depicts the transfer of control on the deliverables to the customer.
Recognition of revenue at a point in time is applicable, among others, in contracts where services are
performed at Valmet’s premises, and deliveries of spare parts and components.
Valmet’s contracts often involve elements of variable consideration, such as penalties, liquidated damages
or performance bonus arrangements. Variable consideration is estimated by using either the expected
value or the most likely amount -method, depending on the type of variable element and related
contractual terms and conditions. Amount of variable consideration is included in transaction price only to
the extent that it is highly probable that a significant reversal of revenue does not occur later. Transaction
prices are reassessed at each reporting date.
Variable elements are generally allocated proportionately to all performance obligations in the contract, or
when terms of the variable payments relate to satisfying a specific performance obligation and allocated
amount depict the consideration to which Valmet expects to be entitled in exchange for transferring
related goods or services, variable consideration is allocated to that specific performance obligation, but
not all performance obligations in the contract.
Valmet provides its customers with standard payment terms. If extended payment terms exceeding one
year are offered to customers, the invoiced amount is discounted to its present value and interest income
is recognized over the credit term.
Valmet does not have significant customer arrangements that do not meet the criteria set out in the IFRS
15 for a contract.
When Valmet incurs costs in fulfilling its contractual obligations, these are expensed as incurred, unless
costs can be capitalized as inventory. The latter is typically the case in performance obligations for which
revenue is recognized at a point in time. Costs to obtain a contract that are expected to be recovered are
capitalized when amortization period is over a year. Otherwise, these costs are expensed as incurred.
Critical accounting estimates and judgments
For performance obligations satisfied over time, Valmet uses cost-to-cost method to recognize revenue as
it best depicts the transfer of control to the customer as Valmet performs. Under cost-to-cost measure of
progress, the extent of progress towards complete satisfaction of performance obligation is measured
based on the ratio of costs incurred to date to the total estimated costs at completion of the performance
obligation. Revenues, including estimated profits, are recorded proportionally as costs are incurred.
Management regularly reviews the progress of and execution on performance obligations. As part of the
Unaudited Condensed Consolidated Interim Financial Statements
Valmet’s Interim Review, January–March 2018 | 31
process, management reviews information including, but not limited to, key contractual obligations
outstanding, project schedule, identified risks and opportunities, as well as changes in estimates of
revenues and costs. A projected loss on a customer contract is recognized through profit or loss when it
becomes known.
Valmet regularly enters into contracts where the consideration includes one or more variable elements.
Variable consideration is estimated by using either the expected value or the most likely amount -method,
depending on the type of the arrangement. In making judgements about variable consideration, Valmet
considers historical, current and forecast information. Impact of changes in estimates is recognized in
revenue in the period when the estimate is updated.
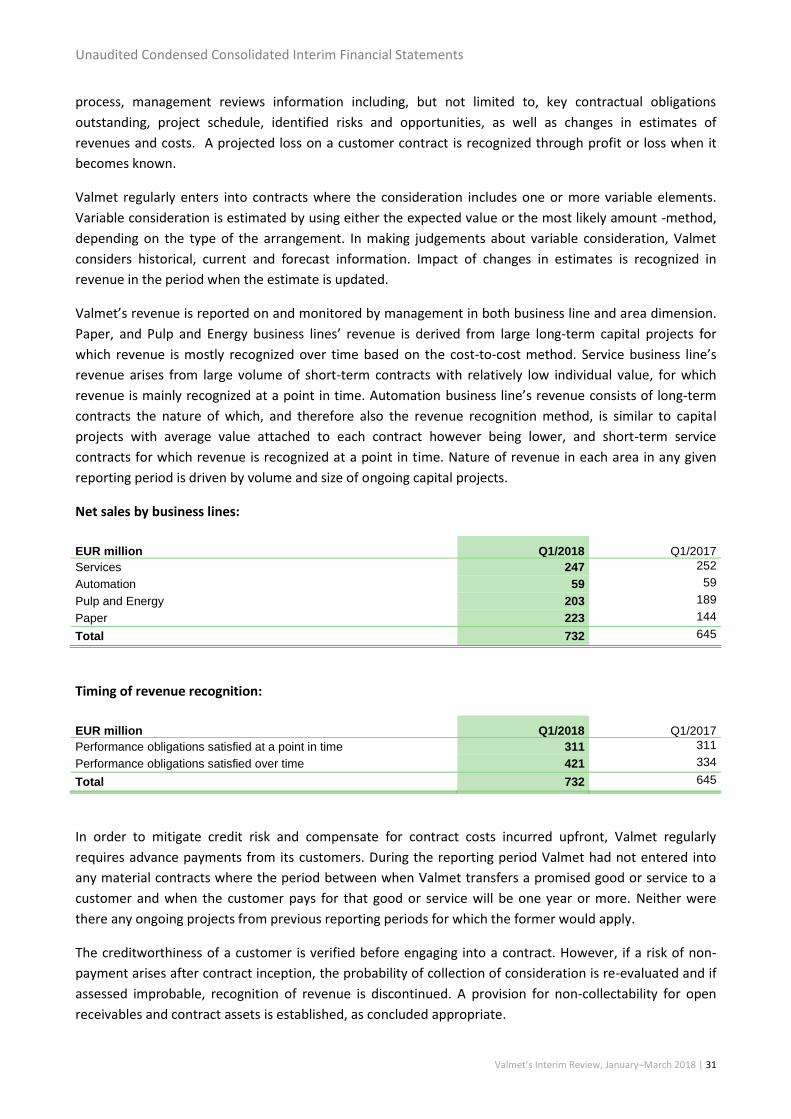
Valmet’s revenue is reported on and monitored by management in both business line and area dimension.
Paper, and Pulp and Energy business lines’ revenue is derived from large long-term capital projects for
which revenue is mostly recognized over time based on the cost-to-cost method. Service business line’s
revenue arises from large volume of short-term contracts with relatively low individual value, for which
revenue is mainly recognized at a point in time. Automation business line’s revenue consists of long-term
contracts the nature of which, and therefore also the revenue recognition method, is similar to capital
projects with average value attached to each contract however being lower, and short-term service
contracts for which revenue is recognized at a point in time. Nature of revenue in each area in any given
reporting period is driven by volume and size of ongoing capital projects.
Net sales by business lines:
EUR million Q1/2018 Q1/2017
Services 247 252
Automation 59 59
Pulp and Energy 203 189
Paper 223 144
Total 732 645
Timing of revenue recognition:
EUR million Q1/2018 Q1/2017
Performance obligations satisfied at a point in time 311 311
Performance obligations satisfied over time 421 334
Total 732 645
In order to mitigate credit risk and compensate for contract costs incurred upfront, Valmet regularly
requires advance payments from its customers. During the reporting period Valmet had not entered into
any material contracts where the period between when Valmet transfers a promised good or service to a
customer and when the customer pays for that good or service will be one year or more. Neither were
there any ongoing projects from previous reporting periods for which the former would apply.
The creditworthiness of a customer is verified before engaging into a contract. However, if a risk of non-
payment arises after contract inception, the probability of collection of consideration is re-evaluated and if
assessed improbable, recognition of revenue is discontinued. A provision for non-collectability for open
receivables and contract assets is established, as concluded appropriate.
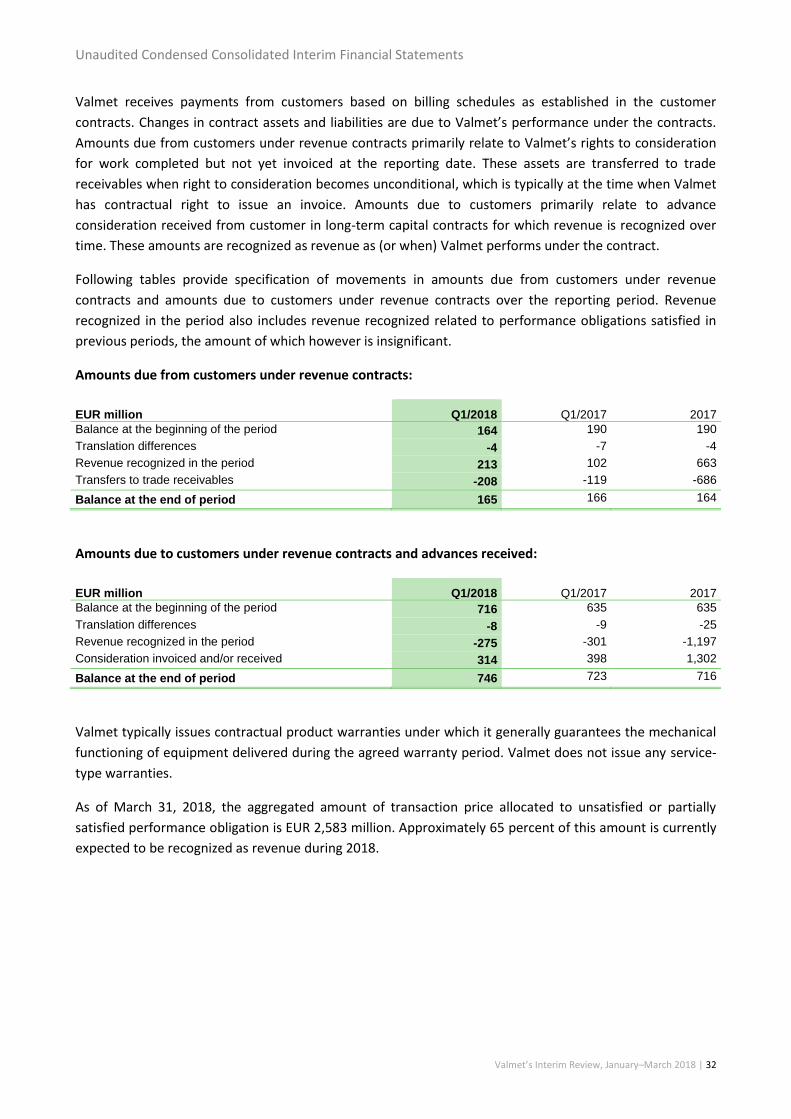
Unaudited Condensed Consolidated Interim Financial Statements
Valmet’s Interim Review, January–March 2018 | 32
Valmet receives payments from customers based on billing schedules as established in the customer
contracts. Changes in contract assets and liabilities are due to Valmet’s performance under the contracts.
Amounts due from customers under revenue contracts primarily relate to Valmet’s rights to consideration
for work completed but not yet invoiced at the reporting date. These assets are transferred to trade
receivables when right to consideration becomes unconditional, which is typically at the time when Valmet
has contractual right to issue an invoice. Amounts due to customers primarily relate to advance
consideration received from customer in long-term capital contracts for which revenue is recognized over
time. These amounts are recognized as revenue as (or when) Valmet performs under the contract.
Following tables provide specification of movements in amounts due from customers under revenue
contracts and amounts due to customers under revenue contracts over the reporting period. Revenue
recognized in the period also includes revenue recognized related to performance obligations satisfied in
previous periods, the amount of which however is insignificant.
Amounts due from customers under revenue contracts:
EUR million Q1/2018 Q1/2017 2017
Balance at the beginning of the period 164 190 190
Translation differences -4 -7 -4
Revenue recognized in the period 213 102 663
Transfers to trade receivables -208 -119 -686
Balance at the end of period 165 166 164
Amounts due to customers under revenue contracts and advances received:
EUR million Q1/2018 Q1/2017 2017
Balance at the beginning of the period 716 635 635
Translation differences -8 -9 -25
Revenue recognized in the period -275 -301 -1,197
Consideration invoiced and/or received 314 398 1,302
Balance at the end of period 746 723 716
Valmet typically issues contractual product warranties under which it generally guarantees the mechanical
functioning of equipment delivered during the agreed warranty period. Valmet does not issue any service-
type warranties.
As of March 31, 2018, the aggregated amount of transaction price allocated to unsatisfied or partially
satisfied performance obligation is EUR 2,583 million. Approximately 65 percent of this amount is currently
expected to be recognized as revenue during 2018.
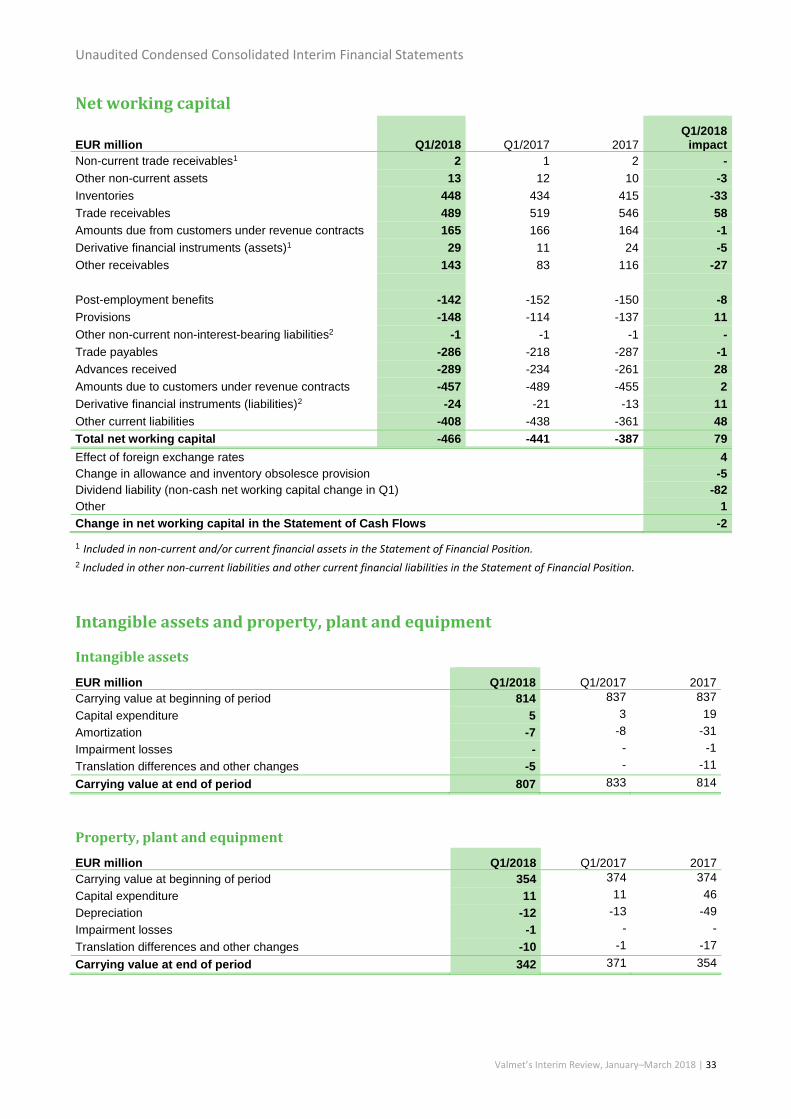
Unaudited Condensed Consolidated Interim Financial Statements
Valmet’s Interim Review, January–March 2018 | 33
Net working capital
EUR million Q1/2018 Q1/2017 2017 Q1/2018
impact
Non-current trade receivables1 2 1 2 -
Other non-current assets 13 12 10 -3
Inventories 448 434 415 -33
Trade receivables 489 519 546 58
Amounts due from customers under revenue contracts 165 166 164 -1
Derivative financial instruments (assets)1 29 11 24 -5
Other receivables 143 83 116 -27
Post-employment benefits -142 -152 -150 -8
Provisions -148 -114 -137 11
Other non-current non-interest-bearing liabilities2 -1 -1 -1 -
Trade payables -286 -218 -287 -1
Advances received -289 -234 -261 28
Amounts due to customers under revenue contracts -457 -489 -455 2
Derivative financial instruments (liabilities)2 -24 -21 -13 11
Other current liabilities -408 -438 -361 48
Total net working capital -466 -441 -387 79
Effect of foreign exchange rates 4
Change in allowance and inventory obsolesce provision -5
Dividend liability (non-cash net working capital change in Q1) -82
Other 1
Change in net working capital in the Statement of Cash Flows -2
1 Included in non-current and/or current financial assets in the Statement of Financial Position. 2 Included in other non-current liabilities and other current financial liabilities in the Statement of Financial Position.
Intangible assets and property, plant and equipment
Intangible assets
EUR million Q1/2018 Q1/2017 2017
Carrying value at beginning of period 814 837 837
Capital expenditure 5 3 19
Amortization -7 -8 -31
Impairment losses - - -1
Translation differences and other changes -5 - -11
Carrying value at end of period 807 833 814
Property, plant and equipment
EUR million Q1/2018 Q1/2017 2017
Carrying value at beginning of period 354 374 374
Capital expenditure 11 11 46
Depreciation -12 -13 -49
Impairment losses -1 - -
Translation differences and other changes -10 -1 -17
Carrying value at end of period 342 371 354
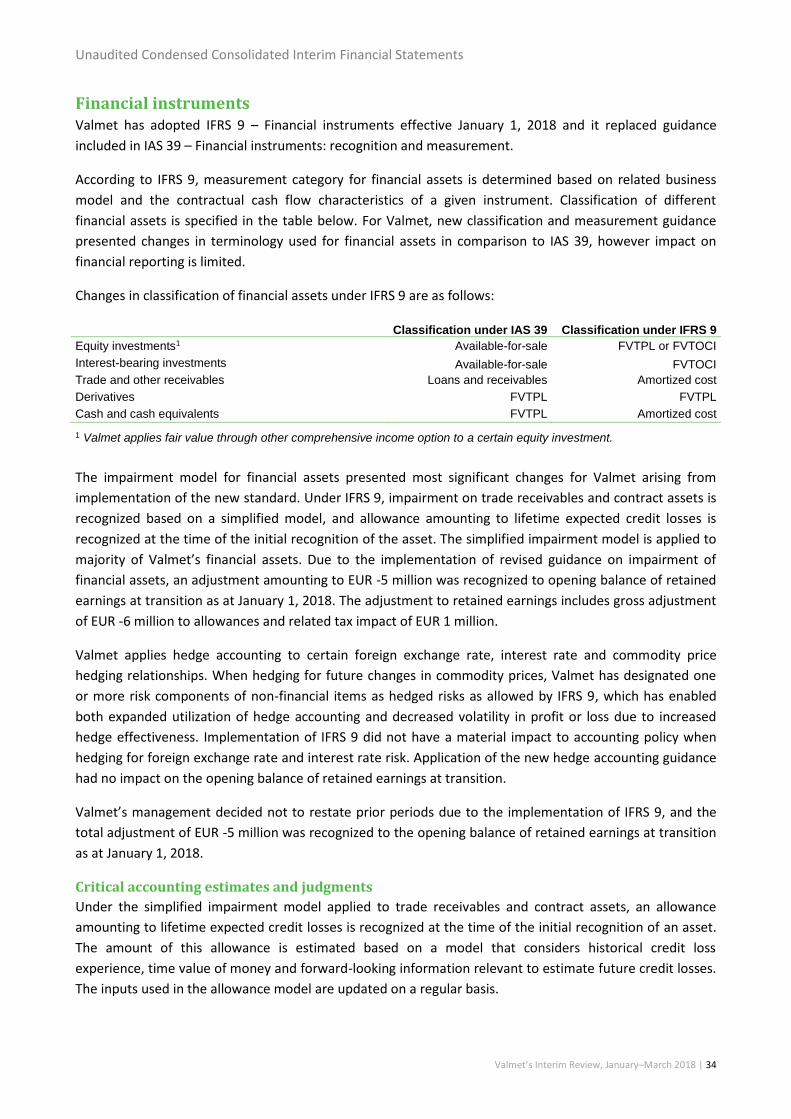
Unaudited Condensed Consolidated Interim Financial Statements
Valmet’s Interim Review, January–March 2018 | 34
Financial instruments Valmet has adopted IFRS 9 – Financial instruments effective January 1, 2018 and it replaced guidance
included in IAS 39 – Financial instruments: recognition and measurement.
According to IFRS 9, measurement category for financial assets is determined based on related business
model and the contractual cash flow characteristics of a given instrument. Classification of different
financial assets is specified in the table below. For Valmet, new classification and measurement guidance
presented changes in terminology used for financial assets in comparison to IAS 39, however impact on
financial reporting is limited.
Changes in classification of financial assets under IFRS 9 are as follows:
Classification under IAS 39 Classification under IFRS 9
Equity investments1 Available-for-sale FVTPL or FVTOCI
Interest-bearing investments Available-for-sale FVTOCI
Trade and other receivables Loans and receivables Amortized cost
Derivatives FVTPL FVTPL
Cash and cash equivalents FVTPL Amortized cost
1 Valmet applies fair value through other comprehensive income option to a certain equity investment.
The impairment model for financial assets presented most significant changes for Valmet arising from
implementation of the new standard. Under IFRS 9, impairment on trade receivables and contract assets is
recognized based on a simplified model, and allowance amounting to lifetime expected credit losses is
recognized at the time of the initial recognition of the asset. The simplified impairment model is applied to
majority of Valmet’s financial assets. Due to the implementation of revised guidance on impairment of
financial assets, an adjustment amounting to EUR -5 million was recognized to opening balance of retained
earnings at transition as at January 1, 2018. The adjustment to retained earnings includes gross adjustment
of EUR -6 million to allowances and related tax impact of EUR 1 million.
Valmet applies hedge accounting to certain foreign exchange rate, interest rate and commodity price
hedging relationships. When hedging for future changes in commodity prices, Valmet has designated one
or more risk components of non-financial items as hedged risks as allowed by IFRS 9, which has enabled
both expanded utilization of hedge accounting and decreased volatility in profit or loss due to increased
hedge effectiveness. Implementation of IFRS 9 did not have a material impact to accounting policy when
hedging for foreign exchange rate and interest rate risk. Application of the new hedge accounting guidance
had no impact on the opening balance of retained earnings at transition.
Valmet’s management decided not to restate prior periods due to the implementation of IFRS 9, and the
total adjustment of EUR -5 million was recognized to the opening balance of retained earnings at transition
as at January 1, 2018.
Critical accounting estimates and judgments
Under the simplified impairment model applied to trade receivables and contract assets, an allowance
amounting to lifetime expected credit losses is recognized at the time of the initial recognition of an asset.
The amount of this allowance is estimated based on a model that considers historical credit loss
experience, time value of money and forward-looking information relevant to estimate future credit losses.
The inputs used in the allowance model are updated on a regular basis.
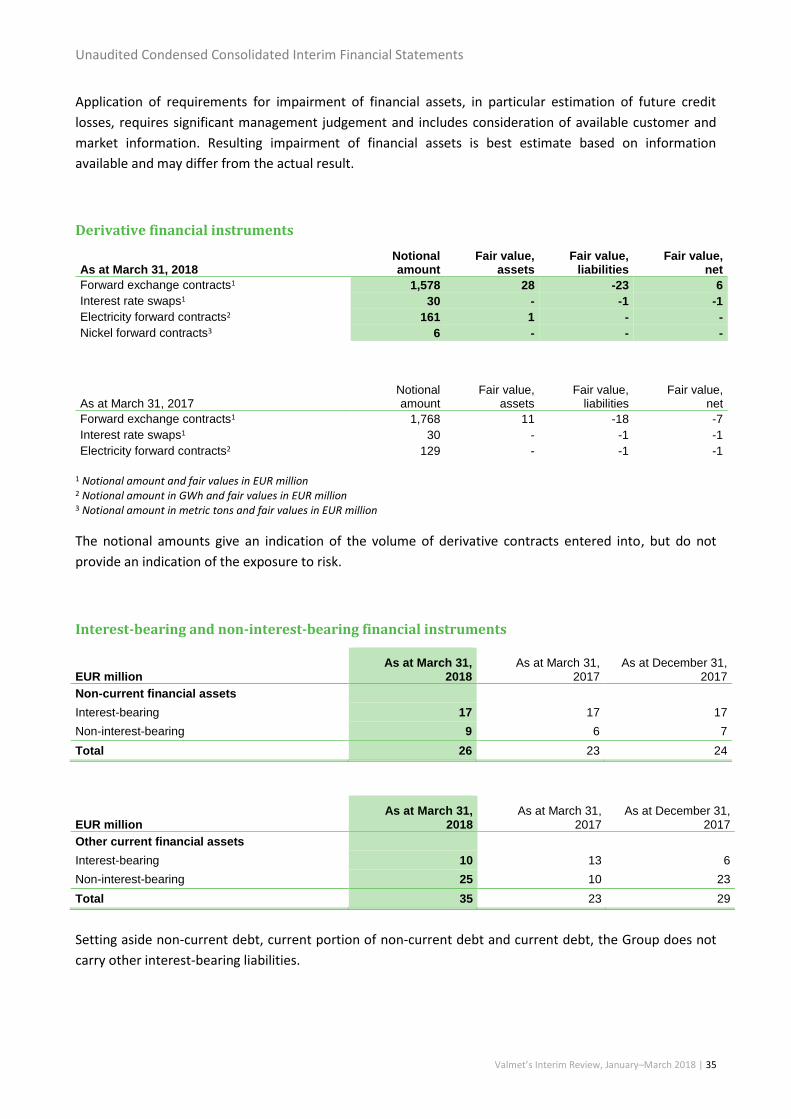
Unaudited Condensed Consolidated Interim Financial Statements
Valmet’s Interim Review, January–March 2018 | 35
Application of requirements for impairment of financial assets, in particular estimation of future credit
losses, requires significant management judgement and includes consideration of available customer and
market information. Resulting impairment of financial assets is best estimate based on information
available and may differ from the actual result.
Derivative financial instruments
As at March 31, 2018
Notional amount
Fair value, assets
Fair value, liabilities
Fair value, net
Forward exchange contracts1 1,578 28 -23 6
Interest rate swaps1 30 - -1 -1
Electricity forward contracts2 161 1 - -
Nickel forward contracts3 6 - - -
As at March 31, 2017
Notional amount
Fair value, assets
Fair value, liabilities
Fair value, net
Forward exchange contracts1 1,768 11 -18 -7
Interest rate swaps1 30 - -1 -1
Electricity forward contracts2 129 - -1 -1
1 Notional amount and fair values in EUR million 2 Notional amount in GWh and fair values in EUR million 3 Notional amount in metric tons and fair values in EUR million
The notional amounts give an indication of the volume of derivative contracts entered into, but do not
provide an indication of the exposure to risk.
Interest-bearing and non-interest-bearing financial instruments
EUR million As at March 31,
2018 As at March 31,
2017 As at December 31,
2017
Non-current financial assets
Interest-bearing 17 17 17
Non-interest-bearing 9 6 7
Total 26 23 24
EUR million As at March 31,
2018 As at March 31,
2017 As at December 31,
2017
Other current financial assets
Interest-bearing 10 13 6
Non-interest-bearing 25 10 23
Total 35 23 29
Setting aside non-current debt, current portion of non-current debt and current debt, the Group does not
carry other interest-bearing liabilities.
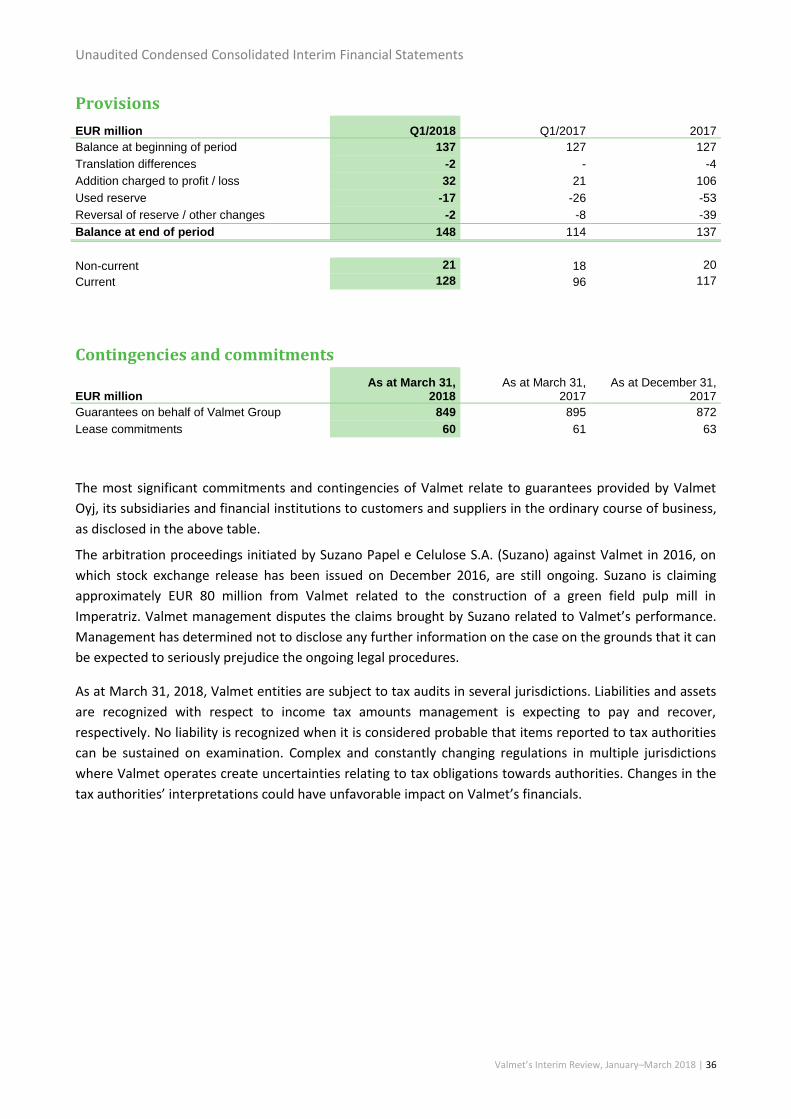
Unaudited Condensed Consolidated Interim Financial Statements
Valmet’s Interim Review, January–March 2018 | 36
Provisions
EUR million Q1/2018 Q1/2017 2017
Balance at beginning of period 137 127 127
Translation differences -2 - -4
Addition charged to profit / loss 32 21 106
Used reserve -17 -26 -53
Reversal of reserve / other changes -2 -8 -39
Balance at end of period 148 114 137
Non-current 21 18 20
Current 128 96 117
Contingencies and commitments
EUR million As at March 31,
2018 As at March 31,
2017 As at December 31,
2017
Guarantees on behalf of Valmet Group 849 895 872
Lease commitments 60 61 63
The most significant commitments and contingencies of Valmet relate to guarantees provided by Valmet
Oyj, its subsidiaries and financial institutions to customers and suppliers in the ordinary course of business,
as disclosed in the above table.
The arbitration proceedings initiated by Suzano Papel e Celulose S.A. (Suzano) against Valmet in 2016, on
which stock exchange release has been issued on December 2016, are still ongoing. Suzano is claiming
approximately EUR 80 million from Valmet related to the construction of a green field pulp mill in
Imperatriz. Valmet management disputes the claims brought by Suzano related to Valmet’s performance.
Management has determined not to disclose any further information on the case on the grounds that it can
be expected to seriously prejudice the ongoing legal procedures.
As at March 31, 2018, Valmet entities are subject to tax audits in several jurisdictions. Liabilities and assets
are recognized with respect to income tax amounts management is expecting to pay and recover,
respectively. No liability is recognized when it is considered probable that items reported to tax authorities
can be sustained on examination. Complex and constantly changing regulations in multiple jurisdictions
where Valmet operates create uncertainties relating to tax obligations towards authorities. Changes in the
tax authorities’ interpretations could have unfavorable impact on Valmet’s financials.
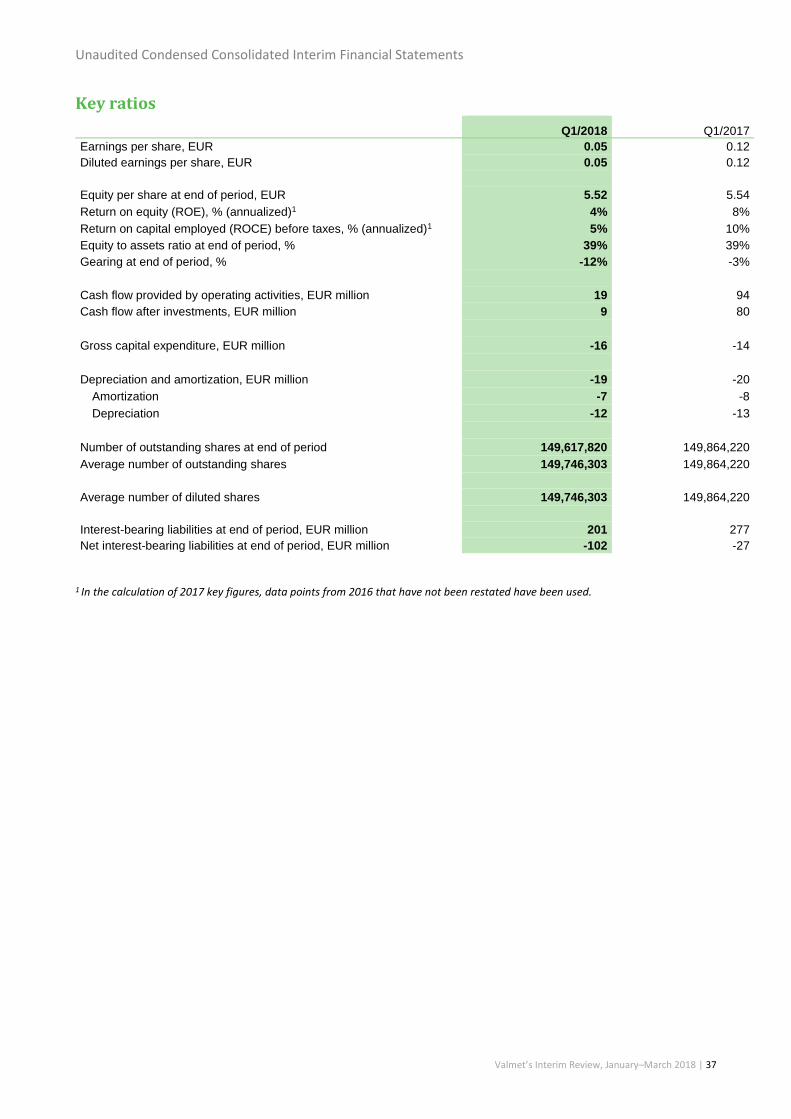
Unaudited Condensed Consolidated Interim Financial Statements
Valmet’s Interim Review, January–March 2018 | 37
Key ratios
Q1/2018 Q1/2017
Earnings per share, EUR 0.05 0.12
Diluted earnings per share, EUR 0.05 0.12
Equity per share at end of period, EUR 5.52 5.54
Return on equity (ROE), % (annualized)1 4% 8%
Return on capital employed (ROCE) before taxes, % (annualized)1 5% 10%
Equity to assets ratio at end of period, % 39% 39%
Gearing at end of period, % -12% -3%
Cash flow provided by operating activities, EUR million 19 94
Cash flow after investments, EUR million 9 80
Gross capital expenditure, EUR million -16 -14
Depreciation and amortization, EUR million -19 -20
Amortization -7 -8
Depreciation -12 -13
Number of outstanding shares at end of period 149,617,820 149,864,220
Average number of outstanding shares 149,746,303 149,864,220
Average number of diluted shares 149,746,303 149,864,220
Interest-bearing liabilities at end of period, EUR million 201 277
Net interest-bearing liabilities at end of period, EUR million -102 -27
1 In the calculation of 2017 key figures, data points from 2016 that have not been restated have been used.
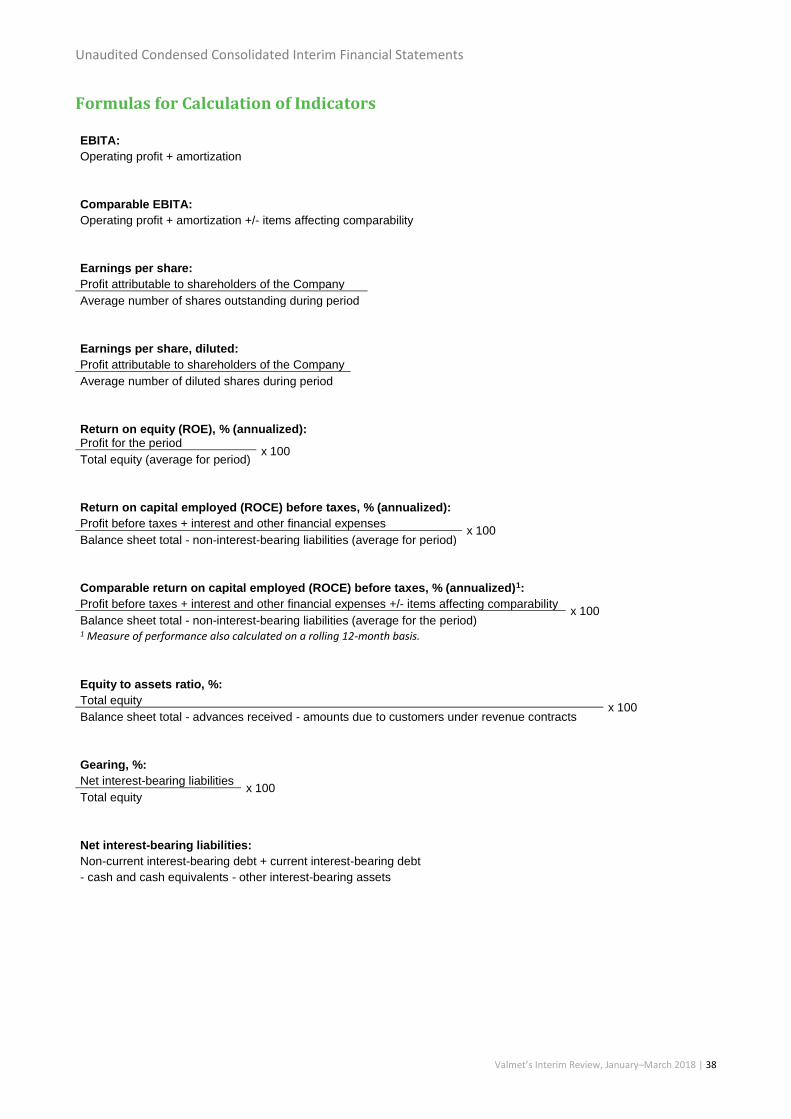
Unaudited Condensed Consolidated Interim Financial Statements
Valmet’s Interim Review, January–March 2018 | 38
Formulas for Calculation of Indicators
EBITA: Operating profit + amortization
Comparable EBITA: Operating profit + amortization +/- items affecting comparability
Earnings per share: Profit attributable to shareholders of the Company
Average number of shares outstanding during period
Earnings per share, diluted: Profit attributable to shareholders of the Company
Average number of diluted shares during period
Return on equity (ROE), % (annualized): Profit for the period
x 100 Total equity (average for period)
Return on capital employed (ROCE) before taxes, % (annualized): Profit before taxes + interest and other financial expenses
x 100 Balance sheet total - non-interest-bearing liabilities (average for period)
Comparable return on capital employed (ROCE) before taxes, % (annualized)1:
Profit before taxes + interest and other financial expenses +/- items affecting comparability x 100
Balance sheet total - non-interest-bearing liabilities (average for the period) 1 Measure of performance also calculated on a rolling 12-month basis.
Equity to assets ratio, %: Total equity
x 100 Balance sheet total - advances received - amounts due to customers under revenue contracts
Gearing, %: Net interest-bearing liabilities
x 100 Total equity
Net interest-bearing liabilities: Non-current interest-bearing debt + current interest-bearing debt
- cash and cash equivalents - other interest-bearing assets
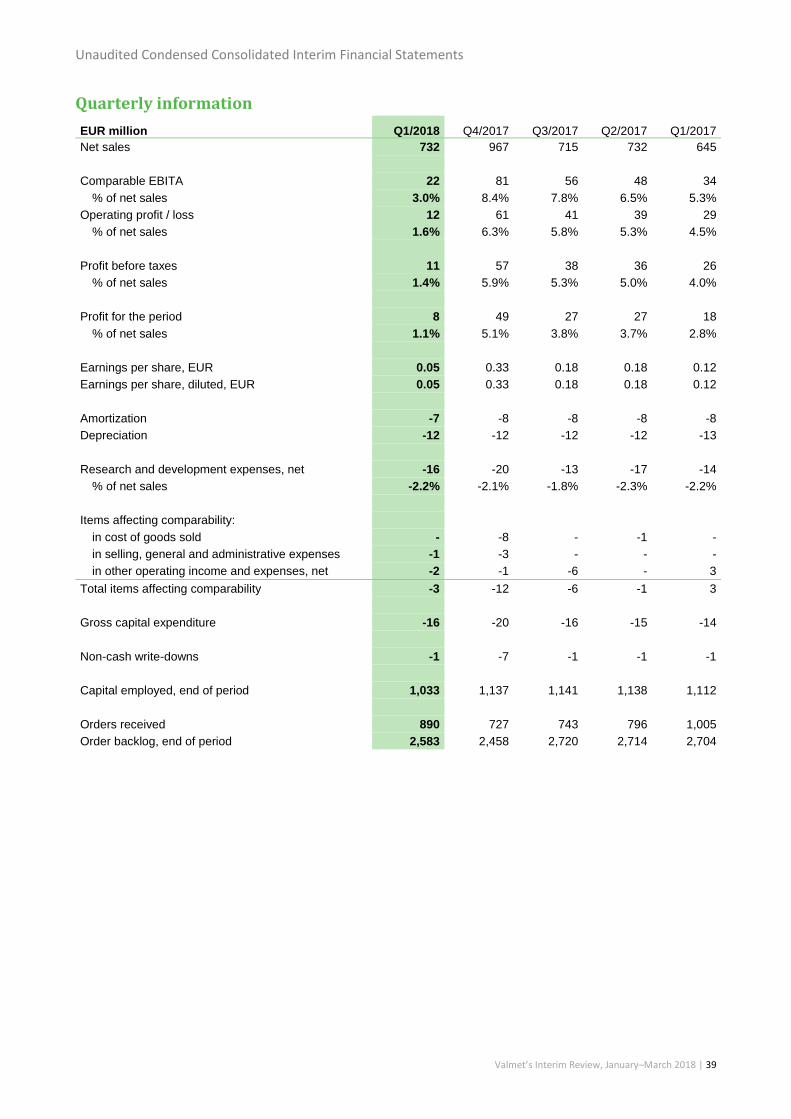
Unaudited Condensed Consolidated Interim Financial Statements
Valmet’s Interim Review, January–March 2018 | 39
Quarterly information
EUR million Q1/2018 Q4/2017 Q3/2017 Q2/2017 Q1/2017
Net sales 732 967 715 732 645
Comparable EBITA 22 81 56 48 34
% of net sales 3.0% 8.4% 7.8% 6.5% 5.3%
Operating profit / loss 12 61 41 39 29
% of net sales 1.6% 6.3% 5.8% 5.3% 4.5%
Profit before taxes 11 57 38 36 26
% of net sales 1.4% 5.9% 5.3% 5.0% 4.0%
Profit for the period 8 49 27 27 18
% of net sales 1.1% 5.1% 3.8% 3.7% 2.8%
Earnings per share, EUR 0.05 0.33 0.18 0.18 0.12
Earnings per share, diluted, EUR 0.05 0.33 0.18 0.18 0.12
Amortization -7 -8 -8 -8 -8
Depreciation -12 -12 -12 -12 -13
Research and development expenses, net -16 -20 -13 -17 -14
% of net sales -2.2% -2.1% -1.8% -2.3% -2.2%
Items affecting comparability:
in cost of goods sold - -8 - -1 -
in selling, general and administrative expenses -1 -3 - - -
in other operating income and expenses, net -2 -1 -6 - 3
Total items affecting comparability -3 -12 -6 -1 3
Gross capital expenditure -16 -20 -16 -15 -14
Non-cash write-downs -1 -7 -1 -1 -1
Capital employed, end of period 1,033 1,137 1,141 1,138 1,112
Orders received 890 727 743 796 1,005
Order backlog, end of period 2,583 2,458 2,720 2,714 2,704
Unaudited Condensed Consolidated Interim Financial Statements
Valmet’s Interim Review, January–March 2018 | 40