biophysics copyright © 2020 force-induced gene up-regulation … · biophysics force-induced gene...
TRANSCRIPT
Sun et al., Sci. Adv. 2020; 6 : eaay9095 1 April 2020
S C I E N C E A D V A N C E S | R E S E A R C H A R T I C L E
1 of 13
B I O P H Y S I C S
Force-induced gene up-regulation does not follow the weak power law but depends on H3K9 demethylationJian Sun1*, Junwei Chen1,2*, Erfan Mohagheghian1, Ning Wang1†
Mechanical forces play important roles in development, physiology, and diseases, but how force is transduced into gene transcription remains elusive. Here, we show that transcription of transgene DHFR or endogenous genes egr-1 and Cav1 is rapidly up-regulated in response to cyclic forces applied via integrins at low frequencies but not at 100 Hz. Gene up-regulation does not follow the weak power law with force frequency. Force-induced transcription up-regulation at the nuclear interior is associated with demethylation of histone H3 lysine-9 trimethylation (H3K9me3), whereas no transcription up-regulation near the nuclear periphery is associated with H3K9me3 that inhibits Pol II recruitment to the promoter site. H3K9me3 demethylation induces Pol II recruitment and increases force-induced transcription of egr-1 and Cav1 at the nuclear interior and activates mechano-nonresponsive gene FKBP5 near the nuclear periphery, whereas H3K9me3 hypermethylation has opposite effects. Our findings demonstrate that rapid up-regulation of endogenous mechanoresponsive genes depends on H3K9me3 demethylation.
INTRODUCTIONPhysical forces and mechanical properties of the extracellular matrix (ECM) play critical roles in cell and tissue functions (1–4), including stem cell fate (5, 6), cell proliferation and differentiation (7–9), protein synthesis (10), and gene expression (11). Although it has been shown that stiffness of living cells follows a weak power-law relationship with force frequency (12), how gene expression changes with force dynamics is elusive. The structural connections from the ECM to the cell surface and to the nucleus (3) have been discovered over the last two decades: matrix proteins to integrin-mediated adhesions, to actomyosin filaments, to KASH domain proteins and SUN proteins [the LINC (linker of nucleoskeleton and cytoskeleton) complex], and to nuclear lamins. Increasing evidence demonstrates that nuclear mechanotransduction plays a critical role in physiology and diseases (13), and this process is associated with alterations of nuclear transport (14, 15), unfolding (16, 17) or modifications (18, 19) of nuclear proteins, and/or changes of chromatin organization and nuclear mechanics (20–22). However, it has been unclear whether the nuclear mechano-transduction is downstream of the cytoplasmic mechanotransduction and signaling cascades, which would require time to affect the nuclear processes or a direct nuclear mechanotransduction event. Recently a published report demonstrates that these cytoskeletal and nuclear structures form force transmission pathways from the cell surface into the nucleus to deform chromatin directly to induce rapid activation of transgene DHFR by force (23). However, it remains unknown if endogenous mechanoresponsive genes can be directly activated by force (13) and what is the underlying mechanism of the rapid transcription up-regulation by force. Histone H3 lysine-9 (H3K9) trimethylation (H3K9me3) is associated with gene repression at the heterochromatin (24). However, how force-induced gene expression
is related to H3K9me3 is not clear. In this study, we set out to address these fundamental questions.
Here, we report that rapid transcription up-regulation disappears at high force frequency, and gene response to force frequency does not follow the weak power law of rheology in living cells. We find that endogenous mechanoresponsive genes egr-1 (early growth response-1) and Cav1 (caveolin-1) are rapidly activated by force. We show that H3K9me3 at the nuclear periphery inhibits RNA polymerase II (Pol II) recruitment to the promoter site of genes and, thus, blocks force- induced transcription activation near the nuclear periphery. In contrast, transcription up-regulation by force that is observed at the nuclear interior depends on demethylation of H3K9me3. Down-regulation of H3K9me3 increases force-induced transcription of mechanoresponsive genes and activates a mechano-nonresponsive gene FKBP5 (FKBP prolyl isomerase 5) at the nuclear periphery.
RESULTSTranscription up-regulation diminishes with force frequencyLiving cells in the human body experience forces of various frequencies (e.g., breathing, heartbeats, walking, running, jumping, and singing), typically ranging from 0.2 to hundreds of Hz. To determine the impact of force frequency on gene transcription, we applied sinusoidal stresses at different frequencies at a given peak amplitude using MTC (magnetic twisting cytometry) via RGD (Arg-Gly-Asp)–coated magnetic beads (25) on the CHO (Chinese hamster ovary) cell surface (Fig. 1A). These CHO cells are from DG44 DHFR 10 subclone with a double knockout of the endogenous DHFR, a known housekeeping gene that is essential for synthesis of thymidine (25). Bacterial artificial chromosome (BAC) was inserted together with mouse DHFR gene and with 256-mer Lac operator (LacO) repeats in the same chromatin domain of the CHO cell. These DHFR 10 subclone CHO cells were stably transfected with enhanced green fluorescent protein (EGFP)–dimer Lac repressor (GFP-LacI) that binds to LacO with high affinity (25). The relative changes in distances between GFP-LacI spots in the same chromatin under force were used to calculate chromatin stretching and chromatin strains (23). These CHO cells that expressed
1Department of Mechanical Science and Engineering, The Grainger College of Engineering, University of Illinois at Urbana-Champaign, Urbana, IL 61801, USA. 2Laboratory for Cellular Biomechanics and Regenerative Medicine, Department of Biomedical Engineering, College of Life Science and Technology, Huazhong University of Science and Technology, Wuhan, Hubei 430074, China.*These authors contributed equally to this work.†Corresponding author. Email: [email protected]
Copyright © 2020 The Authors, some rights reserved; exclusive licensee American Association for the Advancement of Science. No claim to original U.S. Government Works. Distributed under a Creative Commons Attribution NonCommercial License 4.0 (CC BY-NC).
on May 27, 2020
http://advances.sciencemag.org/
Dow
nloaded from

Sun et al., Sci. Adv. 2020; 6 : eaay9095 1 April 2020
S C I E N C E A D V A N C E S | R E S E A R C H A R T I C L E
2 of 13
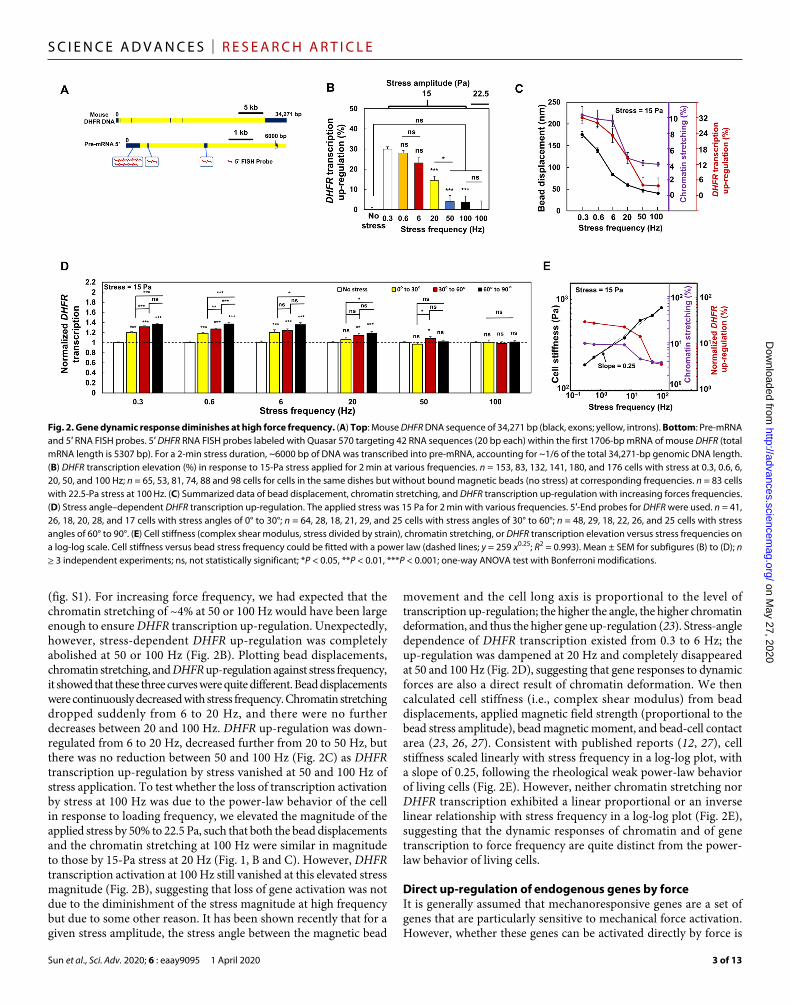
mouse DHFR transgenes exhibited normal growth patterns and synthesized similar amounts of DHFR proteins as the endogenous CHO DHFR gene (25). As the force frequency (f ) increased, the magnetic bead displacements became smaller (Fig. 1B), suggesting that the cell became stiffer. There was little change in chromatin stretching when stress frequency was raised from 0.3 to 6 Hz (Fig. 1C). At 20 Hz of stress, chromatin stretching was reduced to 4.8% (by ~50% from 0.3 Hz) (Fig. 1C). Increasing the stress frequency further from 20 to 50 Hz and to 100 Hz did not reduce the chromatin stretching (4.2% at 50 Hz and 4.0% at 100 Hz) (Fig. 1C). Similar to the waveform patterns of the magnetic bead displacements at 100 Hz, chromatin displacements exhibited sinusoidal waveforms and peaked at 40 to 60 nm within 2 to 3 ms (Fig. 1D), suggesting that the chromatin deformation was directly caused by the external bead stress and not caused by spontaneous chromatin movements that were only a couple of nanometers at this time scale. However, different from the bead displacements, the chromatin deformation did not decrease from 20 to 100 Hz (Fig. 1C). To assay DHFR transcription activation rapidly,
we designed 5′-end mRNA fluorescence in situ hybridization (FISH) probes that were able to bind to the first 1700 base pairs (bp) of newly synthesized mRNAs (Fig. 2A). This way, one could detect partial transcripts of DHFR as early as a few seconds after stress without waiting for completion of the whole mRNA transcription that would take ~10 min. It is important to note that these FISH experiments only assess the newly synthesized partial transcripts of mRNA near the GFP spots inside the nucleus, and therefore, the changes from the FISH are much smaller in magnitude than and are very different from those by qPCR (quantitative polymerase chain reaction) experiments, which access all mRNAs in the whole cells. At 20 Hz, DHFR transcription up-regulation was reduced by ~50% from that at 0.3 Hz (Fig. 2B). This was expected, since chromatin stretching was decreased by ~50% when compared with at 0.3 Hz of stress. To determine how long transcription remained up-regulated after the force application, we assayed DHFR transcription levels at various times after stress release. We found that DHFR stayed up-regulated for 30 min and returned to the baseline level 60 min after 0.3-Hz stress application
Fig. 1. Dynamics of bead displacement and chromatin deformation with increasing force frequency. (A) Left: Bright-field image of a DHFR-deficient Chinese hamster ovary (CHO) cell labeled with LacI-GFP spots in the same chromatin domain stably transfected with BAC Lac operator (LacO) mouse DHFR transgenes. An RGD (Arg-Gly-Asp)–coated magnetized ferromagnetic bead (bottom, the black dot with a white arrow) was bound to the cell surface via integrins. Right: The magnetic bead was magnetized along the x axis with a 1000-Pa pulse (<1 ms), and a sinusoidal twisting field was applied along the z axis to rotate the bead to apply rotational stresses to the cell. The cell’s long axis was along the y axis or at an angle (0° to 90°) (defined as stress angle) to the x axis. Changes in green fluorescent protein (GFP) spots distances were used for quantification of chromatin deformation. Scale bar, 10 m. (B) Displacements of center of magnetic beads on the cell surface by a 15-Pa sinusoidal stress at various frequencies; n = 60 cells for each frequency; n = 31 cells for 22.5-Pa bead stress at 100 Hz. (C) Chromatin stretching in response to 15-Pa stress at different frequencies. n = 55, 27, 31, 31, 46, and 43 cells for 0.3, 0.6, 6, 20, 50, and 100 Hz, respectively. n = 78 cells for 22.5-Pa stress at 100 Hz. (D) Representative original data of displacements of beads and GFP spots with stress application at 100 Hz. The nonperfect sinusoidal waves of the GFP curves are likely due to the baseline noises of GFP spot spontaneous movements that are 2.3 ± 2.0 nm. Mean ± SEM for subfigures (B and C); n ≥ 3 independent experiments; ns, not statistically significant; *P < 0.05, **P < 0.01, ***P < 0.001; one-way analysis of variance (ANOVA) test with Bonferroni modifications.
on May 27, 2020
http://advances.sciencemag.org/
Dow
nloaded from
Sun et al., Sci. Adv. 2020; 6 : eaay9095 1 April 2020
S C I E N C E A D V A N C E S | R E S E A R C H A R T I C L E
3 of 13
(fig. S1). For increasing force frequency, we had expected that the chromatin stretching of ~4% at 50 or 100 Hz would have been large enough to ensure DHFR transcription up-regulation. Unexpectedly, however, stress-dependent DHFR up-regulation was completely abolished at 50 or 100 Hz (Fig. 2B). Plotting bead displacements, chromatin stretching, and DHFR up-regulation against stress frequency, it showed that these three curves were quite different. Bead displacements were continuously decreased with stress frequency. Chromatin stretching dropped suddenly from 6 to 20 Hz, and there were no further decreases between 20 and 100 Hz. DHFR up-regulation was down- regulated from 6 to 20 Hz, decreased further from 20 to 50 Hz, but there was no reduction between 50 and 100 Hz (Fig. 2C) as DHFR transcription up-regulation by stress vanished at 50 and 100 Hz of stress application. To test whether the loss of transcription activation by stress at 100 Hz was due to the power-law behavior of the cell in response to loading frequency, we elevated the magnitude of the applied stress by 50% to 22.5 Pa, such that both the bead displacements and the chromatin stretching at 100 Hz were similar in magnitude to those by 15-Pa stress at 20 Hz (Fig. 1, B and C). However, DHFR transcription activation at 100 Hz still vanished at this elevated stress magnitude (Fig. 2B), suggesting that loss of gene activation was not due to the diminishment of the stress magnitude at high frequency but due to some other reason. It has been shown recently that for a given stress amplitude, the stress angle between the magnetic bead
movement and the cell long axis is proportional to the level of transcription up-regulation; the higher the angle, the higher chromatin deformation, and thus the higher gene up-regulation (23). Stress-angle dependence of DHFR transcription existed from 0.3 to 6 Hz; the up-regulation was dampened at 20 Hz and completely disappeared at 50 and 100 Hz (Fig. 2D), suggesting that gene responses to dynamic forces are also a direct result of chromatin deformation. We then calculated cell stiffness (i.e., complex shear modulus) from bead displacements, applied magnetic field strength (proportional to the bead stress amplitude), bead magnetic moment, and bead-cell contact area (23, 26, 27). Consistent with published reports (12, 27), cell stiffness scaled linearly with stress frequency in a log-log plot, with a slope of 0.25, following the rheological weak power-law behavior of living cells (Fig. 2E). However, neither chromatin stretching nor DHFR transcription exhibited a linear proportional or an inverse linear relationship with stress frequency in a log-log plot (Fig. 2E), suggesting that the dynamic responses of chromatin and of gene transcription to force frequency are quite distinct from the power- law behavior of living cells.
Direct up-regulation of endogenous genes by forceIt is generally assumed that mechanoresponsive genes are a set of genes that are particularly sensitive to mechanical force activation. However, whether these genes can be activated directly by force is
Fig. 2. Gene dynamic response diminishes at high force frequency. (A) Top: Mouse DHFR DNA sequence of 34,271 bp (black, exons; yellow, introns). Bottom: Pre-mRNA and 5′ RNA FISH probes. 5′ DHFR RNA FISH probes labeled with Quasar 570 targeting 42 RNA sequences (20 bp each) within the first 1706-bp mRNA of mouse DHFR (total mRNA length is 5307 bp). For a 2-min stress duration, ~6000 bp of DNA was transcribed into pre-mRNA, accounting for ~1/6 of the total 34,271-bp genomic DNA length. (B) DHFR transcription elevation (%) in response to 15-Pa stress applied for 2 min at various frequencies. n = 153, 83, 132, 141, 180, and 176 cells with stress at 0.3, 0.6, 6, 20, 50, and 100 Hz; n = 65, 53, 81, 74, 88 and 98 cells for cells in the same dishes but without bound magnetic beads (no stress) at corresponding frequencies. n = 83 cells with 22.5-Pa stress at 100 Hz. (C) Summarized data of bead displacement, chromatin stretching, and DHFR transcription up-regulation with increasing forces frequencies. (D) Stress angle–dependent DHFR transcription up-regulation. The applied stress was 15 Pa for 2 min with various frequencies. 5′-End probes for DHFR were used. n = 41, 26, 18, 20, 28, and 17 cells with stress angles of 0° to 30°; n = 64, 28, 18, 21, 29, and 25 cells with stress angles of 30° to 60°; n = 48, 29, 18, 22, 26, and 25 cells with stress angles of 60° to 90°. (E) Cell stiffness (complex shear modulus, stress divided by strain), chromatin stretching, or DHFR transcription elevation versus stress frequencies on a log-log scale. Cell stiffness versus bead stress frequency could be fitted with a power law (dashed lines; y = 259 x0.25; R2 = 0.993). Mean ± SEM for subfigures (B) to (D); n ≥ 3 independent experiments; ns, not statistically significant; *P < 0.05, **P < 0.01, ***P < 0.001; one-way ANOVA test with Bonferroni modifications.
on May 27, 2020
http://advances.sciencemag.org/
Dow
nloaded from

Sun et al., Sci. Adv. 2020; 6 : eaay9095 1 April 2020
S C I E N C E A D V A N C E S | R E S E A R C H A R T I C L E
4 of 13
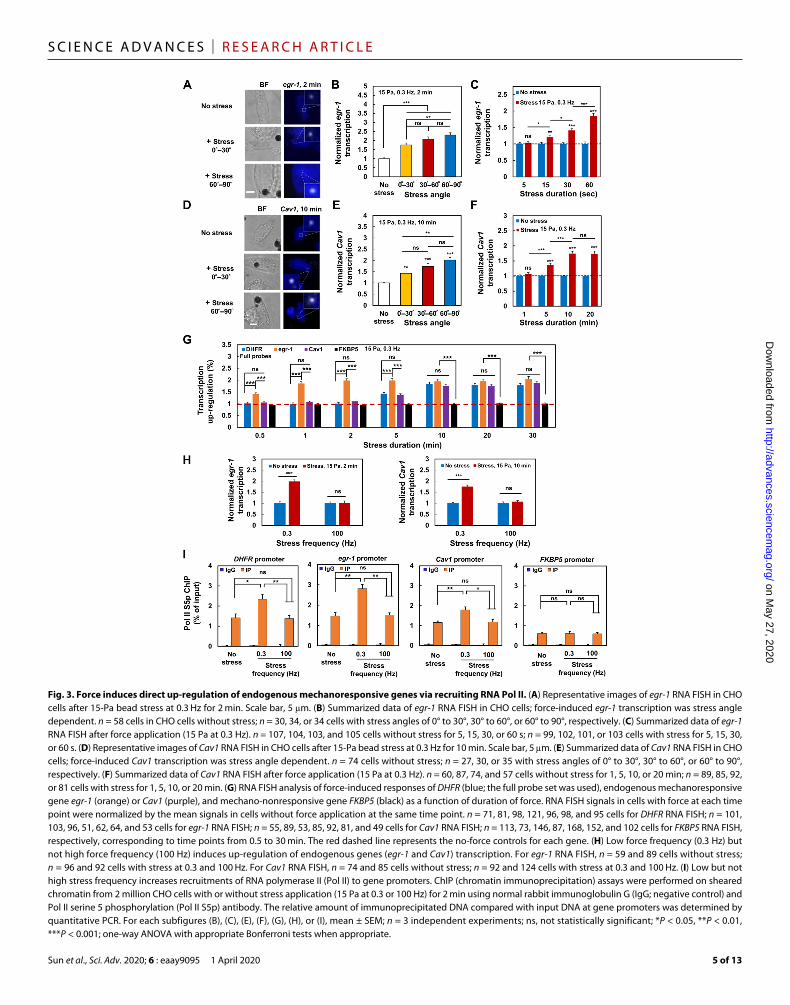
unknown. We examined this idea by comparing endogenous mechanoresponsive gene (28) egr-1 with the transgene DHFR in the same CHO cells. Similar to responses from DHFR, there was stress angle–dependent activation of egr-1 for the fixed amplitude, frequency, and duration of stress (Fig. 3, A and B), suggesting that egr-1 up-regulation is not a result of the cell membrane or cytoplasmic biochemical activities that should not depend on stress angles. egr-1 transcription up-regulation processes were detected as early as 15 s after force application (Fig. 3C), similar to the rapid up-regulation response observed for DHFR (23). egr-1 from another cell type (B16-F1 melanoma cells) was also up-regulated as rapidly as 15 s after stress application in a stress angle–dependent manner (fig. S2), suggesting that rapid egr-1 up-regulation by force is not limited to CHO cells. There was no additional increase in egr-1 up-regulation after 1 min of stress, whereas DHFR up-regulation continued to increase 10 min after force application (fig. S3). At first glance, one would conclude that the response of egr-1 was faster and, thus, was more prone to force activation than DHFR. However, since egr-1 (the gene was ~3 kb long) was ~10 times shorter than DHFR, and so it took only ~1 min to finish one egr-1 transcript; at 2 min, there were already two egr-1 transcripts being completely transcribed. On the other hand, DHFR gene was ~34 kb long, and it would take ~11 min to complete one DHFR transcript. Therefore, the apparent difference in up-regulation between egr-1 and DHFR in response to force would be likely due to differences in gene size. To test this idea, we examined the force response of another mechanoresponsive gene (29), Cav1, that is ~30 kb long, similar in size as DHFR. There was no up-regulation of Cav1 transcription within 1 min of force application (Fig. 3, D to F). Similar to egr-1, there was stress angle–dependent up-regulation of Cav1 (Fig. 3E). Cav1 transcription was significantly up-regulated only after ~5 min of force application (Fig. 3F). Using mRNA FISH probes for the whole sequences (but not the 5′-probe used in fig. S3) of DHFR, like those whole-sequence probes used for egr-1 or Cav1, we compared the temporal force responses of the endogenous mechanoresponsive genes egr-1 and Cav1 with transgene DHFR. Cav1 and DHFR were up-regulated to a similar extent after 5 min, and up-regulations of all three genes were similar at 10 min of force application (Fig. 3G). These results suggest that the endogenous genes are similar to the transgene DHFR in dynamic response to force stimulation. Similar to DHFR, up-regulation of egr-1 or Cav1 at 0.3 Hz was abolished at 100 Hz of force (Fig. 3H). ChIP (chromatin immuno-precipitation) assays revealed that RNA Pol II serine 5 phosphorylation (Pol II S5p), a measure of accumulation or recruitment, to the promoter sites of DHFR, egr-1, or Cav1 was elevated at 0.3 Hz but not at 100 Hz of force (Fig. 3I); in contrast, Pol II recruitments to the promoter site of a mechano-nonresponsive gene (30), FKBP5, did not change either at the low or at the high force frequency (Fig. 3I). In addition, the immunofluorescence staining of Pol II serine 2 phosphorylation (Pol II S2p), a measure of Pol II elongation, at the vicinity of DHFR was stronger as soon as 5 s after force application at 0.3 Hz but not at 100 Hz (fig. S4), consistent with the previous finding that Pol II S5p (Pol II recruitment) was increased less than 5 s after force at 0.3 Hz (23). These results suggest that lack of up-regulation from DHFR, egr-1, or Cav1 at 100 Hz is likely due to the fact that chromatin stretching and unstretching dynamics was too fast (<5 ms for a stretching cycle at 100 Hz) to recruit Pol II to the promoter site.
Demethylation of H3K9 is necessary for force-induced gene up-regulationNext, we investigated what might control force-induced transcription up-regulation. The genes (DHFR, egr-1, and Cav1) that were responsive
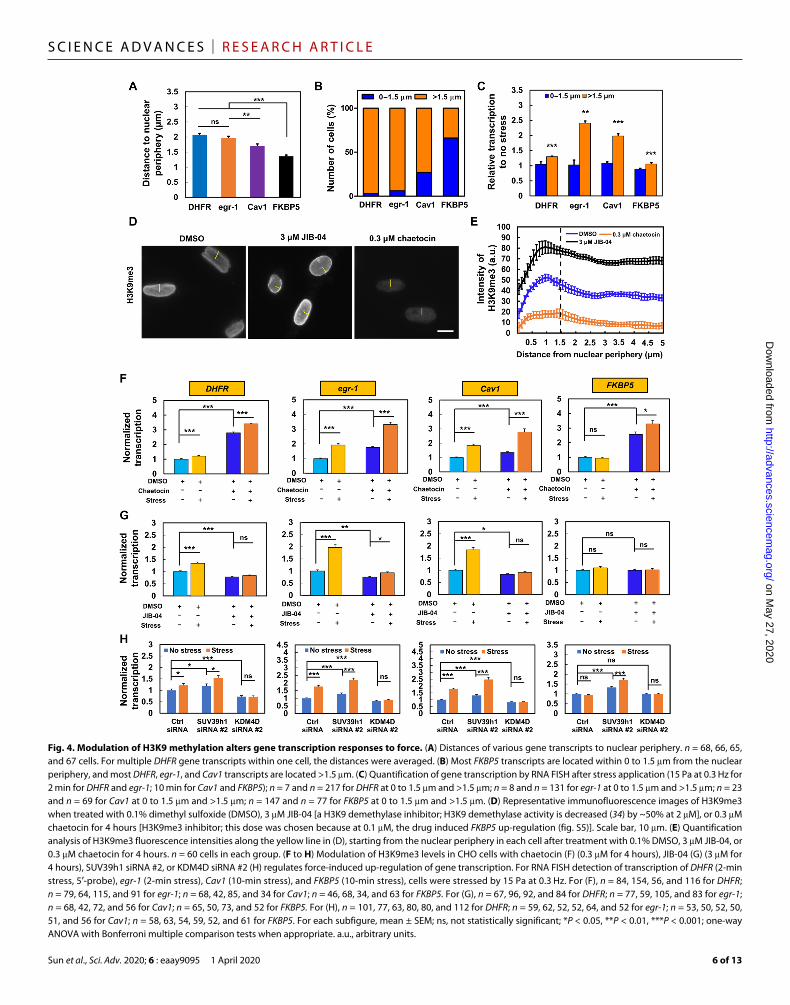
to force located farther away from the nuclear periphery than the gene (FKBP5) that was nonresponsive (Fig. 4A). The majority (>75% of the cells) of the mechanoresponsive genes are located at distances greater than 1.5 m, whereas the mechano-nonresponsive gene FKBP5 is mostly (~75% of the cells) located at distances less than 1.5 m from the nuclear periphery (Fig. 4B). Segregating force- induced transcription of various genes as a function of their distances to the nuclear periphery, we found that all four genes failed to up-regulate in response to force whenever their locations were <1.5 m from the nuclear periphery, and all (including FKBP5) were induced to up-regulate by force whenever their locations were >1.5 m from the nuclear periphery (Fig. 4C). Furthermore, H3K9me3, which strongly correlated with gene repression regions in the chromosome (26), was relatively high at <1.5 m and relatively low at >1.5 m from the nuclear periphery (Fig. 4, D and E). Treating the cells with chaetocin, an inhibitor of H3K9me3 methyltransferase (31) SUV39h1, substantially inhibited H3K9me3, and treating the cells with JIB-04, a H3K9 demethylase inhibitor (32), greatly increased H3K9me3 (Fig. 4E and fig. S5). As expected from inhibition of H3K9me3, chaetocin treatment alone elevated transcription of all four genes; application of force in the presence of chaetocin further increased force-induced transcription up-regulation of DHFR, egr-1, Cav1, and even the known mechano-nonresponsive gene FKBP5 (Fig. 4F). These results suggest that when H3K9me3 is down-regulated, the genes that are near the nuclear periphery can also be activated by force. In contrast, when H3K9me3 levels of all four genes were up-regulated by JIB-04 alone, transcription was inhibited for DHFR, egr-1, and Cav1, but not for FKBP5 since its H3K9me3 levels were already high (Fig. 4G); application of force in the presence of JIB-04 had no stimulatory effects on DHFR, Cav1, or FKBP5, and only modestly increased egr-1 transcription in comparison to JIB-04 treatment alone (Fig. 4G), suggesting that hypermethylation of H3K9me3 by JIB-04 could completely block force-induced gene up-regulation except for egr-1. The effects of chaetocin or JIB-04 on DHFR or egr-1 with or without force were confirmed using a different assay (nuclear run-on) (fig. S6). The data of the pharmacological treatments were supported by the results of small interfering RNA (siRNA) to SUV39h1 to inhibit H3K9me3 that enhanced force-induced transcription up-regulation and by the results of siRNA to KDM4D (lysine-specific demethylase 4D) to elevate H3K9me3 that inhibited force-induced up-regulation of DHFR, egr-1, or Cav1 (Fig. 4H and fig. S7). Together, these findings suggest that demethylation of H3K9me3 is necessary for force-induced transcription up-regulation.
To assess the potential role of other chromatin modifications, we used reagents to specifically alter H3K9 dimethylation (me2), H3K4me3, or H3K9 acetylation (H3K9ac) baseline levels. We found that in sharp contrast to the major effects of H3K9me3 modification on transcription baseline levels in the absence of force, for the DHFR gene, lowering H3K9me2 modestly increased its baseline levels, but increasing H3K4me3 or elevating H3K9ac did not have any effect on DHFR baseline levels; for the FKBP5 gene, decreasing H3K9me2 only slightly increased baseline levels; and modifications of H3K4me3 or H3K9ac had no effects on FKBP5 baseline levels in the absence of force (fig. S8). These results suggest that H3K9me3 levels play a dominant role in regulating baseline transcription levels.
Demethylation of H3K9me3 recruits Pol II to promoter sitesNext, we asked why demethylation of H3K9me3 is required for force-induced transcription up-regulation in the genes that we have
on May 27, 2020
http://advances.sciencemag.org/
Dow
nloaded from
Sun et al., Sci. Adv. 2020; 6 : eaay9095 1 April 2020
S C I E N C E A D V A N C E S | R E S E A R C H A R T I C L E
5 of 13
Fig. 3. Force induces direct up-regulation of endogenous mechanoresponsive genes via recruiting RNA Pol II. (A) Representative images of egr-1 RNA FISH in CHO cells after 15-Pa bead stress at 0.3 Hz for 2 min. Scale bar, 5 m. (B) Summarized data of egr-1 RNA FISH in CHO cells; force-induced egr-1 transcription was stress angle dependent. n = 58 cells in CHO cells without stress; n = 30, 34, or 34 cells with stress angles of 0° to 30°, 30° to 60°, or 60° to 90°, respectively. (C) Summarized data of egr-1 RNA FISH after force application (15 Pa at 0.3 Hz). n = 107, 104, 103, and 105 cells without stress for 5, 15, 30, or 60 s; n = 99, 102, 101, or 103 cells with stress for 5, 15, 30, or 60 s. (D) Representative images of Cav1 RNA FISH in CHO cells after 15-Pa bead stress at 0.3 Hz for 10 min. Scale bar, 5 m. (E) Summarized data of Cav1 RNA FISH in CHO cells; force-induced Cav1 transcription was stress angle dependent. n = 74 cells without stress; n = 27, 30, or 35 with stress angles of 0° to 30°, 30° to 60°, or 60° to 90°, respectively. (F) Summarized data of Cav1 RNA FISH after force application (15 Pa at 0.3 Hz). n = 60, 87, 74, and 57 cells without stress for 1, 5, 10, or 20 min; n = 89, 85, 92, or 81 cells with stress for 1, 5, 10, or 20 min. (G) RNA FISH analysis of force-induced responses of DHFR (blue; the full probe set was used), endogenous mechanoresponsive gene egr-1 (orange) or Cav1 (purple), and mechano-nonresponsive gene FKBP5 (black) as a function of duration of force. RNA FISH signals in cells with force at each time point were normalized by the mean signals in cells without force application at the same time point. n = 71, 81, 98, 121, 96, 98, and 95 cells for DHFR RNA FISH; n = 101, 103, 96, 51, 62, 64, and 53 cells for egr-1 RNA FISH; n = 55, 89, 53, 85, 92, 81, and 49 cells for Cav1 RNA FISH; n = 113, 73, 146, 87, 168, 152, and 102 cells for FKBP5 RNA FISH, respectively, corresponding to time points from 0.5 to 30 min. The red dashed line represents the no-force controls for each gene. (H) Low force frequency (0.3 Hz) but not high force frequency (100 Hz) induces up-regulation of endogenous genes (egr-1 and Cav1) transcription. For egr-1 RNA FISH, n = 59 and 89 cells without stress; n = 96 and 92 cells with stress at 0.3 and 100 Hz. For Cav1 RNA FISH, n = 74 and 85 cells without stress; n = 92 and 124 cells with stress at 0.3 and 100 Hz. (I) Low but not high stress frequency increases recruitments of RNA polymerase II (Pol II) to gene promoters. ChIP (chromatin immunoprecipitation) assays were performed on sheared chromatin from 2 million CHO cells with or without stress application (15 Pa at 0.3 or 100 Hz) for 2 min using normal rabbit immunoglobulin G (IgG; negative control) and Pol II serine 5 phosphorylation (Pol II S5p) antibody. The relative amount of immunoprecipitated DNA compared with input DNA at gene promoters was determined by quantitative PCR. For each subfigures (B), (C), (E), (F), (G), (H), or (I), mean ± SEM; n = 3 independent experiments; ns, not statistically significant; *P < 0.05, **P < 0.01, ***P < 0.001; one-way ANOVA with appropriate Bonferroni tests when appropriate.
on May 27, 2020
http://advances.sciencemag.org/
Dow
nloaded from
Sun et al., Sci. Adv. 2020; 6 : eaay9095 1 April 2020
S C I E N C E A D V A N C E S | R E S E A R C H A R T I C L E
6 of 13
Fig. 4. Modulation of H3K9 methylation alters gene transcription responses to force. (A) Distances of various gene transcripts to nuclear periphery. n = 68, 66, 65, and 67 cells. For multiple DHFR gene transcripts within one cell, the distances were averaged. (B) Most FKBP5 transcripts are located within 0 to 1.5 m from the nuclear periphery, and most DHFR, egr-1, and Cav1 transcripts are located >1.5 m. (C) Quantification of gene transcription by RNA FISH after stress application (15 Pa at 0.3 Hz for 2 min for DHFR and egr-1; 10 min for Cav1 and FKBP5); n = 7 and n = 217 for DHFR at 0 to 1.5 m and >1.5 m; n = 8 and n = 131 for egr-1 at 0 to 1.5 m and >1.5 m; n = 23 and n = 69 for Cav1 at 0 to 1.5 m and >1.5 m; n = 147 and n = 77 for FKBP5 at 0 to 1.5 m and >1.5 m. (D) Representative immunofluorescence images of H3K9me3 when treated with 0.1% dimethyl sulfoxide (DMSO), 3 M JIB-04 [a H3K9 demethylase inhibitor; H3K9 demethylase activity is decreased (34) by ~50% at 2 M], or 0.3 M chaetocin for 4 hours [H3K9me3 inhibitor; this dose was chosen because at 0.1 M, the drug induced FKBP5 up-regulation (fig. S5)]. Scale bar, 10 m. (E) Quantification analysis of H3K9me3 fluorescence intensities along the yellow line in (D), starting from the nuclear periphery in each cell after treatment with 0.1% DMSO, 3 M JIB-04, or 0.3 M chaetocin for 4 hours. n = 60 cells in each group. (F to H) Modulation of H3K9me3 levels in CHO cells with chaetocin (F) (0.3 M for 4 hours), JIB-04 (G) (3 M for 4 hours), SUV39h1 siRNA #2, or KDM4D siRNA #2 (H) regulates force-induced up-regulation of gene transcription. For RNA FISH detection of transcription of DHFR (2-min stress, 5′-probe), egr-1 (2-min stress), Cav1 (10-min stress), and FKBP5 (10-min stress), cells were stressed by 15 Pa at 0.3 Hz. For (F), n = 84, 154, 56, and 116 for DHFR; n = 79, 64, 115, and 91 for egr-1; n = 68, 42, 85, and 34 for Cav1; n = 46, 68, 34, and 63 for FKBP5. For (G), n = 67, 96, 92, and 84 for DHFR; n = 77, 59, 105, and 83 for egr-1; n = 68, 42, 72, and 56 for Cav1; n = 65, 50, 73, and 52 for FKBP5. For (H), n = 101, 77, 63, 80, 80, and 112 for DHFR; n = 59, 62, 52, 52, 64, and 52 for egr-1; n = 53, 50, 52, 50, 51, and 56 for Cav1; n = 58, 63, 54, 59, 52, and 61 for FKBP5. For each subfigure, mean ± SEM; ns, not statistically significant; *P < 0.05, **P < 0.01, ***P < 0.001; one-way ANOVA with Bonferroni multiple comparison tests when appropriate. a.u., arbitrary units.
on May 27, 2020
http://advances.sciencemag.org/
Dow
nloaded from

Sun et al., Sci. Adv. 2020; 6 : eaay9095 1 April 2020
S C I E N C E A D V A N C E S | R E S E A R C H A R T I C L E
7 of 13
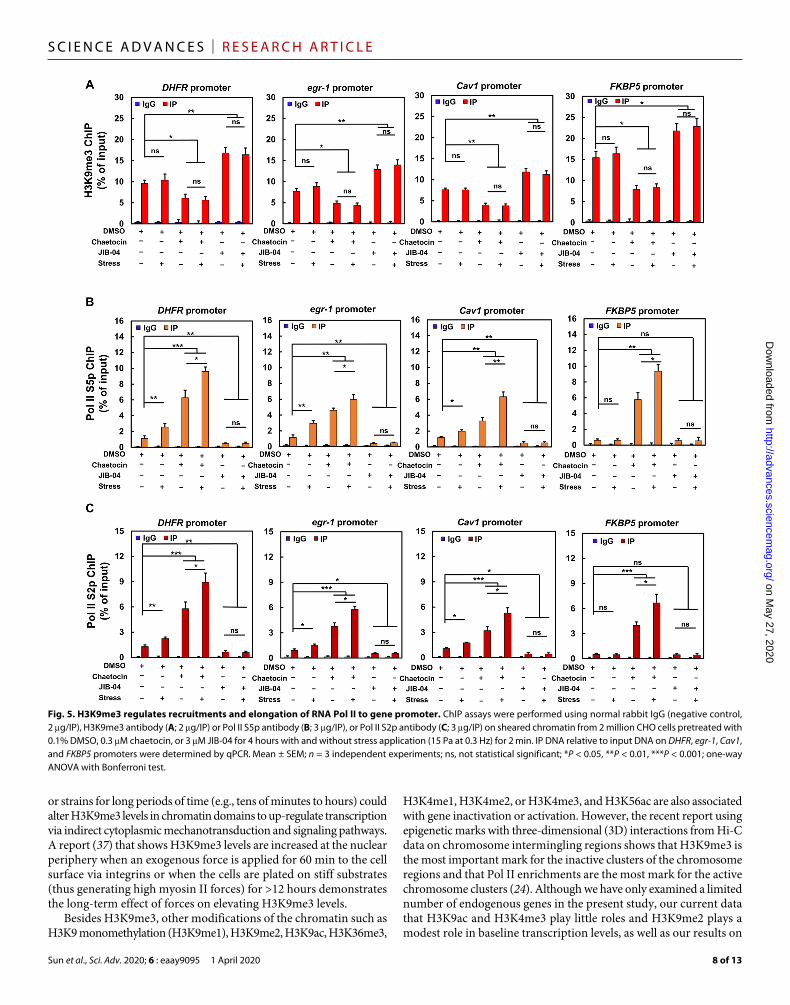
examined. Application of force at 0.3 Hz for 2 min alone did not alter levels of H3K9me3 at the promoter sites of all four genes (Fig. 5A). However, force alone increased Pol II recruitment (i.e., Pol II S5p) for DHFR, egr-1, and Cav1, but not FKBP5 (Fig. 5B), likely due to the fact that the baseline H3K9me3 levels were low for the first three genes that were located at the nuclear interior and the baseline H3K9me3 level was high for FKBP5 near the nuclear periphery (Fig. 5A). Down-regulation of H3K9me3 by inhibition of SUV39h1 with chaetocin decreased H3K9me3 levels at the promoter sites (Fig. 5A). Chaetocin treatment alone increased Pol II recruitment at the promoter sites of all genes (Fig. 5B). Application of force for 2 min in the presence of chaetocin further up-regulated Pol II recruitment to the promoter site (Fig. 5B). In contrast, up-regulation of H3K9me3 by inhibition of H3K9me3 demethylases with JIB-04 increased H3K9me3 levels at the promoter site (Fig. 5A). JIB-04 treatment alone decreased Pol II recruitments at the promoter sites of DHFR, egr-1, and Cav1, but not FKBP5, since it was already low (Fig. 5B). Application of force for 2 min in the presence of JIB-04 did not up-regulate Pol II recruitment to the promoter sites of all four genes (Fig. 5B). Similar results were found for Pol II serine 2 phosphorylation (Pol II S2p), a measure of Pol II elongation, in the presence of force alone, demethylation of H3K9me3 with chaetocin, or hypermethylation of H3K9me3 with JIB-04 (Fig. 5C). All these results suggest that demethylation of H3K9me3 is required for force- induced Pol II recruitment and elongation to rapidly up-regulate gene transcription.
It is possible that genes such as DHFR, egr-1, and Cav1 are responsive to force because they experience greater deformation (13) at the nuclear interior than FKBP5 at the nuclear periphery. We find that chromatin domains at distances >1.5 m from the nuclear periphery endure more than twice as much stretching than those at <1.5 m (fig. S9A). Demethylation of H3K9me3 with chaetocin increased chromatin stretching, and hypermethylation of H3K9me3 with JIB-04 decreased chromatin stretching (fig. S9B). However, in response to force, the chromatin domain of the DHFR gene in the nuclear interior that was H3K9me3 hypermethylated still experienced ~7% stretching (fig. S9B). We lowered the stress by half to 7.5 Pa and found that it produced ~5% chromatin stretching at the nuclear center, which was the same level of chromatin stretching as that by a 15-Pa stress at the nuclear periphery (fig. S10A). The DHFR transcription could still be activated at the nuclear center but not at the nuclear periphery (fig. S10B). Since the magnitude of chromatin stretching was the same at both places, the logical interpretation of these results is that it is the H3K9me3 levels (high at the periphery and low at the center) that control the gene activation. This finding supports the conclusion that force-induced direct gene up-regulation depends on H3K9me3 demethylation, although we cannot rule out the possibility that higher forces applied to other genes might elicit a different outcome.
This magnitude of stretching should have been sufficient to unpack chromatin domains to initiate transcription, suggesting that demethylation of H3K9me3 is required (for Pol II recruitment to the promoter site) to initiate force-induced transcription via chromatin stretching.
DISCUSSIONA fundamental question in cell biology is how transcription of various genes is regulated by force. A published report reveals that
heterochromatin domains at the nuclear membrane that consist of highly packed and entangled semiflexible 5- to 24-nm chromatins (33) are transcriptionally silent. The poorly transcribed heterochromatin domains (34) are associated with H3K9me3. It is known that euchromatin domains that consist of unpacked and untangled chromatins are, in general, transcriptionally active. However, it is not clear whether it is the transcription that drives chromatin unpacking or the chromatin unpacking that drives transcription. Recently, we have demonstrated that rapid transcription up-regulation of the transgene DHFR is a result of chromatin stretching via local forces applied to integrins (23), but whether mechanoresponsive endogenous genes can be directly activated by force remains unknown. In this report, we have demonstrated that mechanoresponsive endogenous genes egr-1 and Cav1 are directly activated by force at the cell surface. This finding is remarkable because although endogenous genes egr-1 and Cav1 are generally considered mechanosensitive genes, there has been no evidence that these genes respond directly to force. For example, the Cav1 protein is known to be important in enabling cell sensing of mechanical force (29), but there has been no evidence that the Cav1 gene itself is directly up-regulated under force. Therefore, our current study provides the first evidence that endogenous genes Cav1 and egr-1 are directly up-regulated by force. Furthermore, force-induced transcription up-regulation occurs at low but not at high (100 Hz) force frequency. H3K9me3 inhibits Pol II recruitments to the promoter sites of the genes and, thus, blocks force-induced gene up-regulation. Demethylation of H3K9 via pharmacological reagents or via siRNA increases force-induced up-regulation of mechano-responsive genes (DHFR, egr-1, and Cav1) and even activates force- induced transcription of mechano-nonresponsive gene FKBP5.
In this study, we reveal that high force frequency (>50 Hz) does not induce rapid transcription, although the chromatin is being stretched to sufficient extents to allow for transcription. Over the last two decades, studies on the rheological responses of living cells demonstrate that living cells exhibit a gradual stiffening response to increasing force frequencies [i.e., the weak power law (12, 27)]. However, it has remained unclear what the impact of elevating force frequency on gene transcription is. Here, we show that rapid transcription does not follow the weak power law behavior, nor it is inversely proportional to the force frequency. We show that when the force frequency is at 100 Hz, RNA Pol IIs are not enriched to the promoter sites of the genes, likely due to the fact that the duration to stretch and to unstretch the chromatin is too short (<5 ms at 100 Hz). These results suggest that rheological behaviors and dynamic gene responses to force are very distinct responses of living cells and there does not appear to be a correlation between the two responses.
Since heterochromatin domains at the nuclear membrane are packed chromatins and, thus, experience less deformation under force than euchromatin at the nuclear interior (35), it is possible that those genes at the nuclear interior are mechanoresponsive because they experience greater deformation than the genes at the nuclear periphery. Our results are consistent with this notion and are in line with a recent finding that hypermethylation of H3K9me2/3 results in an increase in mitotic chromosome stiffness (36). However, hypermethylation at H3K9me3 still experiences enough stretching that should have been sufficient to unpack chromatin domains to initiate transcription. This result suggests that demethylation of H3K9me3 is required (for Pol II recruitment to the promoter site) to initiate force-induced chromatin stretching–mediated transcription. This interpretation does not rule out the possibility that large forces
on May 27, 2020
http://advances.sciencemag.org/
Dow
nloaded from
Sun et al., Sci. Adv. 2020; 6 : eaay9095 1 April 2020
S C I E N C E A D V A N C E S | R E S E A R C H A R T I C L E
8 of 13
or strains for long periods of time (e.g., tens of minutes to hours) could alter H3K9me3 levels in chromatin domains to up-regulate transcription via indirect cytoplasmic mechanotransduction and signaling pathways. A report (37) that shows H3K9me3 levels are increased at the nuclear periphery when an exogenous force is applied for 60 min to the cell surface via integrins or when the cells are plated on stiff substrates (thus generating high myosin II forces) for >12 hours demonstrates the long-term effect of forces on elevating H3K9me3 levels.
Besides H3K9me3, other modifications of the chromatin such as H3K9 monomethylation (H3K9me1), H3K9me2, H3K9ac, H3K36me3,
H3K4me1, H3K4me2, or H3K4me3, and H3K56ac are also associated with gene inactivation or activation. However, the recent report using epigenetic marks with three-dimensional (3D) interactions from Hi-C data on chromosome intermingling regions shows that H3K9me3 is the most important mark for the inactive clusters of the chromosome regions and that Pol II enrichments are the most mark for the active chromosome clusters (24). Although we have only examined a limited number of endogenous genes in the present study, our current data that H3K9ac and H3K4me3 play little roles and H3K9me2 plays a modest role in baseline transcription levels, as well as our results on
Fig. 5. H3K9me3 regulates recruitments and elongation of RNA Pol II to gene promoter. ChIP assays were performed using normal rabbit IgG (negative control, 2 g/IP), H3K9me3 antibody (A; 2 g/IP) or Pol II S5p antibody (B; 3 g/IP), or Pol II S2p antibody (C; 3 g/IP) on sheared chromatin from 2 million CHO cells pretreated with 0.1% DMSO, 0.3 M chaetocin, or 3 M JIB-04 for 4 hours with and without stress application (15 Pa at 0.3 Hz) for 2 min. IP DNA relative to input DNA on DHFR, egr-1, Cav1, and FKBP5 promoters were determined by qPCR. Mean ± SEM; n = 3 independent experiments; ns, not statistical significant; *P < 0.05, **P < 0.01, ***P < 0.001; one-way ANOVA with Bonferroni test.
on May 27, 2020
http://advances.sciencemag.org/
Dow
nloaded from

Sun et al., Sci. Adv. 2020; 6 : eaay9095 1 April 2020
S C I E N C E A D V A N C E S | R E S E A R C H A R T I C L E
9 of 13
the four genes are consistent with the finding of H3K9me3 as the dominant mark for inactive genes and the finding of Pol II enrichments or recruitments as the mark for active genes (24). One possibility is that mechanosensitivity of transcription simply requires a threshold level of basal transcription and that high methylation levels of H3K9me3 inhibit mechanosensitivity simply because transcription is very low. This is likely since H3K9me3 generally leads to condensed and packed chromatin that is inaccessible to transcription, making the basal transcription level very low. While our results do not rule out the roles of other marks of chromatin modifications in force-induced gene regulation, the finding that down-regulation of H3K9me3 can increase mechanoresponsive genes’ responses to force and even activates a mechano-nonresponsive gene FKBP5 highlights the essential role of H3K9me3 in transcription activation by force.
Mechanoresponsive genes are a set of genes that are generally assumed to be inclined for transcriptional activation by mechanical forces. In the present study, we reveal, however, that the mechano-responsive gene egr-1, just like the housekeeping gene DHFR, is activated within 15 s after force application. The observed higher up-regulation of egr-1 than that of DHFR by force at early times is simply due to the fact that egr-1 is a much smaller gene and its transcript is complete within ~1 min of force application. After 10-min force application, the up-regulation of egr-1 or Cav1 is similar to that of DHFR, suggesting that both mechanoresponsive endogenous genes egr-1 and Cav1 and housekeeping gene DHFR are equally prone to transcription activation by force. The possibility that other mechano-responsive genes might be more inclined to activation by force than some genes cannot be ruled out. Nevertheless, our current findings suggest that sufficient chromatin stretching by a local force of physiologic magnitudes with enough duration will elicit transcription up-regulation as long as the machinery for transcription (such as H3K9me3 demethylation–mediated Pol II recruitments to the promoter site) of a particular gene is ready. For the endogenous genes egr-1 and Cav1, we are not able to measure their stretching directly like the transgene DHFR. The challenge is that whenever one introduces some marks in the chromatin domain that contain an endogenous gene, it is likely to perturb the system such that it is no longer an intact endogenous gene. We have shown that histone 2B-GFP strains in these CHO cells are similar in magnitude as the transgene DHFR (23), suggesting that these endogenous genes are also stretched directly by force. The fact that egr-1 can be up-regulated as early as 15 s after force application and that both egr-1 and Cav1 exhibit stress angle–dependent up-regulation strongly suggests that both genes are directly stretched by the dynamic force.
One question is that when the chromatin is stretched under force, whether B-DNA or the packed chromatin domains are stretched. Each BAC size length of 187 kb (a total of 10 BAC insertions and, thus, 10 GFP spots in each cell) in the DHFR D10 subclone spans a distance of ~63.6 m of B-form DNA, and so the total length of the extended BAC DNA would be 636 m long. However, the mea-sured total GFP spots’ contour length is only 0.65 to 1.41 m in CHO cells (25), representing ~500-fold compaction, which is 10-fold greater than that for extended 30-nm chromatin fibers. In other words, the chromatin domains of the DHFR gene are densely packed in these living CHO cells, similar to other endogenous genes in DNA packing ratios at interphase. When we observe that the distance between two GFP spots on the same chromatin domain is increased in response to force, because the chromatin domains are stretched by only tens of nanometers to hundreds of nanometers (23), it is not
the B-form DNA that is stretched or elongated; rather, it is likely that the packed chromatin domains become partially unpacked to expose the promoter sites for Pol II to initiate transcription.
In the present study, we have applied a shear stress of 15 to 22 Pa at the cell surface via the magnetic bead, relatively small but physiologic amplitudes, and observed gene up-regulation. It is known that when large forces or large deformations are applied to living cells, which can occur when the cells migrate through a small pore, the chromatin distorts and DNA is damaged (38); lamin A/C can harness perinuclear actin fibers to form caps that protect the nuclear shape from damage (39). It is likely that certain sets of genes are activated and/or up-regulated by the large deformations or strains imposed on the cells. It will be interesting to examine in the future how the high degrees of chromatin stretching and/or compression, the rate of mechanical deformations, and the duration of the strains might affect gene expression patterns and nuclear structural and functional alterations.
In summary, we reveal that demethylation of H3K9me3 mediates Pol II recruitment and plays a critical role in force-induced rapid transcription up-regulation of genes whose response to force frequency does not follow the weak power law of rheology in living cells.
MATERIALS AND METHODSCell culture and reagentsThymidine- and hypoxanthine-free Ham's F12 medium with 10% dialyzed fetal bovine serum (Cell Media Facility, The School of Chemical Sciences, University of Illinois at Urbana-Champaign) was used to culture CHO DHFR D10 subclone cells (25) (the endogenous DHFR was doubly deleted) that contain BAC mouse DHFR transgenes and stably express EGFP-dimer lac repressor. Melanoma B16-F1 cells were purchased from the American Type Culture Collection and cultured in Dulbecco's modified Eagle's medium supplemented with 10% fetal bovine serum (Gibco). Cells were passaged every 2 to 4 days by using TrypLE (Thermo Fisher Scientific) and were randomly allocated to each experimental group. We constantly monitored for mycoplasma contamination using 4′,6-diamidino-2-phenylindole (DAPI) staining and visual inspection by imaging during the experiments.
Magnetic twisting cytometryCells attached to the glass-bottomed petri dish were incubated with RGD-coated magnetic beads (~4 m in diameter) for 15 min at 37°C, followed by the wash with cell media once that removed most unbound magnetic beads (23). The specificity of the bead binding was described before, and the bead binding alone without the application of stress (i.e., the magnetic field) did not cause any change in transcription (23). The petri dish with cells was placed inside the chamber surrounded by coils for magnetic twisting cytometry measurements. RGD-coated magnetic beads bound to the cell surface were magnetized at the y direction by a strong magnetizing pulse (~1000 G, <1 ms). A twisting field in the z direction was then applied with controlled magnitudes (0 to 75 G, corresponding to 0- to 22.5-Pa stress, calcu-lated from the bead magnetic moment and bead-cell contact area) (25, 28) and frequency (0.3 to 100 Hz).
RNA FISH and data analysisOn the basis of the Stellaris Probe Designer (Biosearch Technologies Inc., Petaluma, CA), custom-made RNA FISH probe sets conjugated with different dyes were designed against both the first ~1700 bp and the full length of mouse DHFR mRNA (www.ncbi.nlm.nih.gov/
on May 27, 2020
http://advances.sciencemag.org/
Dow
nloaded from
Sun et al., Sci. Adv. 2020; 6 : eaay9095 1 April 2020
S C I E N C E A D V A N C E S | R E S E A R C H A R T I C L E
10 of 13
nuccore/NM_010049.3), the full length of Chinese hamster egr-1 mRNA (www.ncbi.nlm.nih.gov/nuccore/XM_016975642.1), the full length of mouse egr-1 mRNA (www.ncbi.nlm.nih.gov/nuccore/NM_007913.5), the full length of Chinese hamster Cav1 mRNA (www.ncbi.nlm.nih.gov/nuccore/XM_007641504), and the full length of Chinese hamster FKBP5 mRNA (www.ncbi.nlm.nih.gov/nuccore/XM_003508613) were shown below.
The 5′-end mouse DHFR RNA FISH probe set was labeled with Quasar 570 dye: tctgcgggaagcctaagatc, gggaggcaaacggttctaag, ctcttctgcacactgcaatg, cgcgcattctatttgtgtag, catcctatttgtgcagctaa, catcctatttgtgcagctaa, gtcaagtttggcgcgaaatc, cagccttcacgctaggattg, gatggcagcggggataaaat, tgcagttcaatggtcgaacc, atattttgggacacggcgac, agtacttgaactcgttcctg, agaggttgtggtcattcttt, agattctgtttaccttccac, aggttttcctacccataatc, ggtcgattcttctcaggaat, agtcttaaggcatcatccaa, tgccaattccggttgttcaa, tccaaaccatgtctacttta, taaacagaactgcctccgac, ctggttgattcatggcttcc, ccttgtcacaaagagtctga, gtcactttcaaattcctgca, ttccccaaatcaatttctgg, gggtattctgggagaagttt, ctttcttctcgtagacttca, ttaggaggggagcagagaac, agtcccatggtcttataaaa, ctcatagatctaaagccagc, accttgttagattactggga, gacatttcttaaggcacttt, gcactgagacctttatagca, cacttgaggtctcatgggag, cacagtaccctgtgcatatg, tacatcactggggtctcttg, tacttttatgagcccacaca, ctttggacttacctgcctag, ctctgctgtttaaaacctgt, ttctttatagtctgagttcc, agctttgctgcaagtgtgat, gattttctgtctgagtgagc, ttacataatcttccacctgc, gcagacaatttcagtgtttc.
Full mouse DHFR RNA FISH probe set was labeled with Quasar 670 dye (only used for Fig. 3G): gggaggcaaacggttctaag, cgcgcattctatttgtgtag, gtcaagtttggcgcgaaatc, gataaaatcctaccagcctt, gacgatgcagttcaatggtc, tccggttgttcaataagtct, accatgtctactttacttgc, taaacagaactgcctccgac, ctttcttctcgtagacttca, ttaggaggggagcagagaac, attatataggggctagggtt, accttgttagattactggga, tagctcctacttttatgagc, gctctgctgtttaaaacctg, gcagtatccattctcaattc, ttctctgacctgatgatctg, actaatttacaaggccaggc, atggacaccacactcacaag, agctctgaacagaccatttc, agcttacagacacaaggctg, ctgtgtttataccctgtatt, ctaggttttcagagtgcttt, ctactactgctgctttgtta, agtcatgggttctaaggaca, caatgcttcctagttggatt, catcaccagggagaaaagct, tgtcgtagccagatgacaag, gctcccaaaacaacacatct, gggcacccttaaaagtaact, acactggtggacaatgctta, ttcatctctttgttcatggt, tctagtgtacctggtcaatt, caaatgtctgttaaccccag, cattgtataacacacctcct, ctgccagggttacaaacata, ttgcaaata-cactgccagtc, aatgctctataccctcattt, gcaagaaagcgctattgctt, tagctctgggagatgt-caac, ttttggcatgtatgaggtgt, acgacaatttccttgtgtct, ccttgaactaggtttcttgt, gggttgtcaatgggaatctg, cagtgtggaacatcgtgcaa, tttatgttagcagcttggga, cacaatgctttggtggaagc, atcatgtctccttttcagta, cctcgccttctaacacaaaa.
Chinese hamster egr-1 RNA FISH probe set was labeled with Quasar 670 dye: aagagcaaatcactgggcga, atcgccttctcattattcag, tgtaggtgatgggaggcaac, acaaagtgttgccactgttg, ctaggctgaaaaggggttca, aaatgggactgctgtcgttg, cagtgttgggagtgggaaag, gctttggggctcaggaaaaa, ggatcatgggaacctggaag, ctgttgttgtgggaacagat, tggagtaagtgaaggctgct, ggcgaaggctttaatagtgg, taagagcctttaagtcctgg, gatgagttgggattggtagg, caggcataaggacgttcgtg, aaaacggcgatcgcaggatt, attcgacactggaacggctt, tgcgactaaagttgcgcatg, cggatgtgagtggtaaggtg, ttctcccacaaatgtcacag, cgttcatcacttctggcaaa, aagtggattttggtatgcct, cacttttgtctgctttcttg, gaaagcaggtggaacggagg, aaagcccagttgaagtgctg, tggagaaaaggtggctgtca, tggctctgacttaagaggag, aaaggactgttggccaacag, aataggaatggggaggcagg, tttcaggcagctgaagtcaa, agttctttggatagaggtga, attaatccaatacccatgca, aggcatacgatggagacgat, gtagcactgaagggagcaag, aaacccgtttttttgccaac, caaagatacagggcagggtt, atcttcacatcaagggtacc, tcacagcagccatcacaaaa, tgctctggttaatacctagg, ggttaacggaacactctgac, atgtgagagtacagtcgagc, ttttaaccaaagggacgggc, gcaaggcgtgtcacacaaaa, acaattgcacatgtcaagcc, actacaacattccaactcct, gccaaacaagtcactttgtt, agcgcattcaatgtgtttat, tatacaccacatatcccatg.
Mouse egr-1 RNA FISH probe set was labeled with Quasar 570 dye: agaactgatgttgggtggtg, agcggagacatcaattgcat, gagtgaggaaaggagccgaa,
aaaggactctgtggtcaggt, atcgccttctcattattcag, agtcgtttggctgggataac, tataggtgatgggaggcaac, acaaagtgttgccactgttg, ctaggctgaaaaggggttca, tgaagaggtcggaggattgg, gagtagatgggactgctgtc, gttgggagtaggaaaggtgg, ggggctcaggaaaaatgtca, atcatgggaacctggaaacc, cctgttgttgtggaaacaga, tggatagtggagtgagcgaa, tgagtggcgaaggctttaat, tgatgagctgggattggtag, caagcatatgggcgttcatg, gagaaaagcggcgatcgcag, atatggcgggtaagctcatc, ttacgcatgcagattcgaca, aaggtggtcactacgactga, aaacttcctcccacaaatgt, aatggattttggtatgcctc, cacttttgtctgctttcttg, gaaagcaggtggaacggagg, gtcgctgtcatgtctgaaag, atttcaattgtcctgggaga, tgtgcttttatgtctttcct, ccttc-tactcgtgagtagaa, gcagctgaagtcaaagggaa, gtcctttggatagaggtgaa, gatttatccaataccatgca, atggcacagatgctgtacaa, gaggatcatcattggtttgc, tcacagcagagtcatcacaa, tgtgagagttacagtcgagc, ttgaaaccaaagggacgggc, gcaaggcgtgtcacacaaaa, tcacatctgcgcatgtcaag, ttaaggctaaggtgagcgtg, attctggagaccgaaagctc, tccaactcctgaatagatgt, ctactcagtaggtaaccaca, gccaaacaggttactttgtt, ggcaatagagcgcattcaat, aggatacacaccacatatcc.
Chinese hamster Cav1 RNA FISH probe set was labeled with Quasar 670 dye: tttgcgcacagaaaactcca, ggctaacttcaaccctgaag, tcagaagt-cagcctgttgtc, tgggaacggtgtagagatgt, tgttgttgggcttgtagatg, gtacacttgcttct-cattca, cgtcatcgttgagatgcttg, ttctgcaatcacgtcttcaa, atcaaaactgtgtgtccctt, taaagctggctttccagatg, gccgaagatggtagacaaca, aagtaaatgccccagatgag, ccagatgtgcaggaaagaga, caggaagctcttgatgcatg, aggtgtggacatagatggaa, agcttcaaagagtgggtcac, tattgctgaatatcttgcca, gcagtagctcaaaagagaca, gaaagggtagcaatgggttt, aatgggcagatgaggttgtt, ttctgtggtatcaccatttt, at-taactcttgagatggccg, ccactagattgtgactgtta, aggtctccaacttgatagtg, gct-gctggcataatgaaagt, accagtatagagaactagca, aggttctgtatgtcagagtc, gcta-catgacaaagcacaga, cccatttgtctgctttaaat, actaaactgtcccagcaatc, agctgagaatgcagtacagc, ctttggcagtctcattttgg, tagaagggatcatgcttgca, cagactattccaagtgcgat, agtgatgcttgtattagtcc, acattacctcaagcttttgt, cctagaacttactccagcaa, gaaattcctcagtttgggtt, aatagcttttggctgtctca, gctttaatatgagtggggga, aggtagcaggttcatagtta, catgccagtgtctgtttaaa, ccaagtgagtctctttctat, cagactgaattgcagaacca, aacagacatgtcttgggacc, catgagactgagcatctagg, accttttgaaccagcaactg, tctttataggacatgcagca.
Chinese hamster FKBP5 RNA FISH probe set was labeled with Quasar 670 dye: ccttcatcagtagtcattgt, gttttctccattgttactgg, tatcttctccttgttcaacc, cctctatcttttttggtagt, cccactcttttgacaatctt, actttgt-caccaatcatcgg, tggctcatttctatcacgac, ctttgccaaggctaaacaca, aatgtc-ccaggctttgataa, ccataagcatactctggttt, gagagttgcattggagggaa, atc-caggagttcaatctcaa, cttcaaataagtcctctcct, tgattcttcggataatgcca, ttcgtttggattggagtagc, tgcaatcaaacatccttcca, ttctccttcaccaacaatga, ta-aaacacactgctcttccc, aaaaccgtatcgtggtccaa, aatgccaaatttaggcttcc, tactgaatcacagcctgcat, ttgactccttgtctgatagg, cagcaggaaggattcagagg, acatggccaggtttaggaag, tactctctgagcttcaggta, ctgtacaagcctttctcatt, aactcgttcataagcagctg, acactttctcaaagtcacct, ttattctgagggttaaccgc, ttctggcacatggagatctg, cttggtgaacatattggcgt, ctacagtcttcttgctcatt, cgagttcattaggactctct, ccttacactagacactgttc, cagggtggttattttgggaa, catcaagggatgctgtgtag, actgaagcgcagatggagag, aggaaagcagagatggttcc, ctcattttgggcttgtgttc, aagtgacctctgagactctg, agagtctgagaagggaacct, ctgggtgtgacggaaagtta, ctgatgagggtgttggagta, gggaaagctaacccggaaac, caagccactcaatgagttca, tactttaaagcgggggacag, caggtctaggacaagagcaa, cttagttggatgtggacgtt.
Cells were fixed with 3.7% paraformaldehyde (Electron Microscopy Sciences) at room temperature for 10 min, washed twice with phosphate- buffered saline (PBS), and permeabilized with 70% ethanol at 4°C for 8 hours for DHFR RNA FISH and 24 hours for egr-1 and Cav1 RNA FISH. Cells were then washed with wash buffer containing 2× SSC (Sigma), 10% deionized formamide (Thermo Fisher Scientific) for 5 min at room temperature followed by hybridization with RNA FISH probes conjugated with specific dyes (Biosearch Technologies Inc.) at 37°C for 12 hours. After being immersed in wash buffer at
on May 27, 2020
http://advances.sciencemag.org/
Dow
nloaded from
Sun et al., Sci. Adv. 2020; 6 : eaay9095 1 April 2020
S C I E N C E A D V A N C E S | R E S E A R C H A R T I C L E
11 of 13
37°C for 30 min and another 30 min in wash buffer with DAPI (Thermo Fisher Scientific) for nucleus staining, cells were washed with 2× SSC buffer for 5 min at room temperature and were ready for imaging. The data analysis for RNA FISH was similar to the previously reported one (23). Briefly, the averaged background was subtracted from the images using ImageJ, and the integrated density of fluorescent areas selected by the “freehand sections” tool was quantified as the gene expression level.
siRNA transfectionCells were transfected with siRNAs to SUV39h1 or KDM4D by using RiboCellin siRNA delivery reagent (Bulldog Bio) according to the manufacturer's protocol. All custom siRNAs were designed by Invitrogen BLOCK-iT RNAi Designer (Thermo Fisher Scientific) and were synthesized by Sigma. The siRNA sequences are as follows: GCTGGTGTTGGACTCTTAA for SUV39h1 siRNA #1; CATTTTCAG-TATATATTTTAC for SUV39h1 siRNA #2; CAAAACAAAA-CAAAAAACAAA for KDM4D siRNA #1; and CCAAATTGCAA-CATAATGATA for KDM4D siRNA #2. The depletion efficiency was quantified with Western blotting (fig. S8).
Microscopy and live cell imagingFor tracing the GFP spots inside the cell nucleus, immunofluo-rescence of H3K9me3, and RNA FISH imaging, an inverted Leica microscope (DMIRE2) was used with a 63× oil objective [numerical aperture (NA), 1.32], filter sets for Quasar 570 and 670, DAPI, and GFP (Chroma Technology Corp., Vermont). Glass-bottomed petri dishes (GBD00001-200, Cell E&G, San Diego, CA) were coated with collagen type I (16 g ml−1, Thermo Fisher Scientific) at 37°C for at least 1 hour, and cells were seeded and cultured overnight for adhesion. Live cells were imaged in Hank's balanced salt solution (HBSS). A Leica SP8 confocal microscope with a 63× oil objective (NA, 1.40) was used to visualize immunofluorescence of Pol II S2p.
For imaging the beads and GFP spots under high-frequency stress, the heterodyning approach was used (40). Briefly, images were captured every 55 ms (one cycle +1/10 of a cycle, 5-ms exposure time) for 20-Hz stress, 42 ms (two cycles +1/10 of a cycle, 2-ms exposure time) for 50-Hz stress, and 61 ms (six cycles +1/10 of a cycle, 1-ms exposure time) for 100 Hz stress. Since the exposure time for GFP spots is too short to be recognized or analyzed by the MATLAB code, 40 images corresponding to the same stress were overplayed after the background was subtracted.
When we quantified chromatin displacements, we only referred to X-Y plane displacements. We acknowledge that this is an underestimate of the 3D displacement field that includes displacements in the Z direction. However, all our cells were highly polarized and spread, and after application of the bead stress, most of the GFP spots of the chromatin domains did not move out of the view field, suggesting that the displacements in the Z direction are small relative to those in the X-Y plane. For the few GFP spots that moved out of the focal plane, since we were not able to track them, we did not collect those data. In addition, we only measured the x-y distances to the nuclear periphery and did not take into account the z axis. Therefore, our measurements were an underestimate of the actual distances. However, since the z height of the cell nucleus was relative low because the cells were very spread, the distance in the z direction would be much smaller than the x-y distances. Nevertheless it is still possible that the z axis could affect H3K9me3.
Immunofluorescence and Western blottingCells were fixed with 3.7% paraformaldehyde at room temperature for 15 min, washed twice with PBS, and permeabilized with 0.3% Triton X-100 (Sigma) for 15 min. After another PBS wash, cells were treated with normal donkey serum (Jackson ImmunoResearch Laboratories Inc., West Grove, PA) diluted to 5% (v/v) in PBS for 4 hours at room temperature followed by overnight incubation with primary antibodies diluted (1:100, v/v, if not specified) with 1% BSA in PBS at 4°C. Primary antibodies include rabbit monoclonal anti-histone H3 (tri-methyl K9) antibodies (Abcam, ab176916, 1:2000 diluted) and rabbit polyclonal anti-RNA Pol II CTD repeat YSPTSPS (phospho-S2) (Abcam, ab5095). Cells were washed with PBS three times for 5 min each and incubated with the secondary antibody [donkey anti-rabbit immunoglobulin G (IgG) H&L (Heavy & Light chains), Alexa Fluor 555, Abcam, ab150062] diluted with PBS (1:200 v/v) at room temperature for 1 hour. For Western blotting, we used histone H3 (tri- methyl K9) rabbit monoclonal antibody (1:1000, Abcam, ab176916), KDM4D rabbit polyclonal antibody (1:200, Abcam, ab93694), SUV39h1 rabbit monoclonal antibody (1:1000, Cell Signaling, #8729), glyceraldehyde- 3-phosphate dehydrogenase rabbit poly-clonal antibody (1:1000, Sigma, G9545), and goat anti-rabbit IgG (horseradish peroxidase linked, 1: 1000, Cell Signaling, #7074).
Chromatin IPChIP was carried out using a commercial kit from Cell Signaling (#56383). CHO cells were seeded onto collagen I–coated petri dishes (35 mm in diameter from Corning, 20 dishes for each condition that makes a total of ~2 × 10⁷ cells). After cells reached ~90% confluency, cells were incubated with serum-free media that contain RGD-coated magnetic beads (Spherotech, CFM-40-10; diameter, 4.0 to 4.9 m) at 37°C for 30 min. There was, on average, ~1 bead per cell. Cells were washed twice with HBSS, stressed with 15 Pa at 0.3 Hz or 100 Hz for 2 min, and fixed with 1% formaldehyde for 15 min at room temperature followed by glycine treatment for 5 min that quenches the formaldehyde. Cells without any stress application were also fixed as the control. After washing twice with ice cold PBS, cells were scraped into cold PBS with protease inhibitor cocktail (PIC), pelleted with centrifuge, and treated with 1 ml of ice-cold ChIP sonication cell lysis buffer plus PIC twice, 10 min each. Cells were further treated with 1 ml of ice-cold ChIP sonication nuclear lysis buffer for 20 min and sonicated with Covaris M220 for 40 min (peak power, 75; duty factor, 5; cycles, 200).
For each IP, 100 l of chromatin (~7 g, DNA concentration determined by Qubit dsDNA HS assay kit) was diluted into 400 l of 1× ChIP buffer with PIC. Ten microliters of sample of the diluted chromatin was chosen as the 2% input sample. Three micrograms of Pol II S5p antibody (Abcam, ab5131), 3 g of Pol II S2p antibody (Abcam, ab5095), or 2 g H3K9me3 antibody (Abcam, ab176916) was added to each diluted chromatin solution. Normal rabbit IgG antibody (2 g, Cell Signaling, #2729) was used as the negative control. The IP samples were incubated at 4°C overnight with rotation. Protein G magnetic beads (30 l) were added to each IP reaction and incubated for 2 hours at 4°C with rotation. Protein G magnetic beads in each IP were pelleted by placing the tubes in a magnetic separation rack and washed with low-salt solution three times and high-salt solution once (5 min each at 4°C with rotation). Chromatin was eluted from the antibody/protein G magnetic beads for 30 min at 65°C with gentle vortexing (1200 rpm) by using a thermomixer from Eppendorf. Reverse cross-links were achieved by adding 6 l
on May 27, 2020
http://advances.sciencemag.org/
Dow
nloaded from
Sun et al., Sci. Adv. 2020; 6 : eaay9095 1 April 2020
S C I E N C E A D V A N C E S | R E S E A R C H A R T I C L E
12 of 13
of 5 M NaCl and 2 l of proteinase K with incubation for 2 hours at 65°C. DNA was purified by using spin columns.
For ChIP-qPCR experiments, qPCR was conducted using SsoAdvanced Universal SYBR Green Supermix (Bio-Rad, #1725271) on CFX Connect Real-Time PCR Detection System (Bio-Rad). qPCR primers were designed and manufactured by Sigma. The primer se-quences are listed below as follows: mouse DHFR promoter primer set, ACCTGTATCGGGAAGGTTGGA (forward) and AGTCAC-CCCCAACAGCCTTT (reverse); CHO egr-1 promoter primer set, ACAGCTCCCGGGTCTTATGT (forward) and CAAAA-CAAACGCTCTGCGCT (reverse); CHO Cav1 promoter primer set, ATATCTTTCTGGGCAGGCGT (forward) and GATCAAATC-CGGGCATTGGG (reverse); CHO FKBP5 promoter primer set, TCCAGTGCTTTGATCATCTGT (forward) and GCTTGGGAACTT-GTGTGAAGC (reverse); mouse DHFR nonpromoter primer set, TTTTCCAGATACCCAGGCGT (forward) and TAGGAGGGGAG-CAGAGAACT (reverse); CHO egr-1 nonpromoter primer set, CCA ACTCATCAAACCCAGCC (forward) and CAGGCATAAG-GACGTTCGTG (reverse).
Histone quantificationTo evaluate the drug (UNC0638 and trichostatin A from Sigma, KDM5-C70 from Xcess Biosciences) effect on histone modifica-tions, commercial kits (EpiQuick global tri-methyl histone H3K9 quantification kit, EpiQuik global di-methyl histone H3K9 quanti-fication kit, EpiQuik global tri-methyl histone H3K4 quantification kit, EpiQuik global acetyl histone H3K9 quantification kit, and EpiQuik total histone H3 quantification kit) of ELISA (enzyme- linked immunosorbent assay) assays from Epigentek Group Inc. were used to quantify the levels of H3K9me3, H3K9me2, H3K4me3, and H3K9ac relative to histone H3, respectively. Briefly, for each condition, histone was extracted from 5 million CHO cells using EpiQuik total histone extraction kit from the same company. H3K9me3, as an example, was captured from the strip wells precoated with an anti-H3K9me3 antibody. The captured H3K9me3 was detected with a labeled detection antibody, followed by a color development reagent. The absolute amount of H3K9me3 was obtained by comparing its absorbance at 450 nm to the standard control.
Nuclear run-on assayThe nuclear run-on assay was conducted following a published protocol (41). One million cells were stressed with RGD-coated magnetic beads at 15 Pa and 0.3 Hz for 2 min at room temperature. Then, cells were immediately washed once with ice-cold PBS, treated with trypsin-EDTA, pelleted by centrifugation at 400g for 4 min at 4°C, and lysed on ice for 5 min by NP-40 lysis buffer (10 mM tris-HCl, pH 7.4, 10 mM NaCl, 3 mM MgCl2, and 0.5% NP-40). The nuclei were collected and washed once with the lysis buffer. For nuclear run-on transcription, nuclei were resuspended in the transcription buffer (10 mM tris-HCl, pH 8.3, 2.5 mM MgCl2, 150 mM KCl, and 2 mM DTT) plus 100 U of RNaseOUT, 0.5 mM Br-UTP (bromouridine 5´-triphosphate), 0.5 mM UTP, 1 mM ATP (adenosine 5′-triphosphate), 1 mM CTP (cytidine 5′-triphosphate), and 1 mM GTP (guanosine 5′-triphosphate) at 30°C for 30 min. The nuclear RNA was extracted using the MEGAclear transcription clean-up kit (Invitrogen) according to the manufacturer’s instructions, followed by the removal of genomic DNA contamination with the TURBO DNA-free kit (Invitrogen). Labeled nascent transcripts were purified by IP using protein G Dynabeads (Invitrogen) and anti–-BrdU (5-bromo-2′-
deoxyuridine) monoclonal antibody IIB5 (Santa Cruz Biotechnology). After the RNA extraction, reverse transcription with high-capacity cDNA reverse transcription kit (Applied Biosystems) and qPCR were used to determine the transcript levels. The primers for qPCR are listed: CHO egr-1 primer set, CACGAACGTCCTTATGCCTG (forward) and CCCACAAATGTCACAGGCAA (reverse); mouse DHFR primer set, TTCCACACCACAGGCATTTG (forward) ACT-TAGTTGGTGGTAGGCCC (reverse).
Statistical analysisTwo-tailed Student’s t test was performed. For multiple comparisons, one-way analysis of variance (ANOVA) with Bonferroni correction was used.
SUPPLEMENTARY MATERIALSSupplementary material for this article is available at http://advances.sciencemag.org/cgi/content/full/6/14/eaay9095/DC1
View/request a protocol for this paper from Bio-protocol.
REFERENCES AND NOTES 1. D. E. Discher, D. J. Mooney, P. W. Zandstra, Growth factors, matrices, and forces combine
and control stem cells. Science 324, 1673–1677 (2009). 2. C. Hahn, M. A. Schwartz, Mechanotransduction in vascular physiology and atherogenesis.
Nat. Rev. Mol. Cell Biol. 10, 53–62 (2009). 3. N. Wang, J. D. Tytell, D. E. Ingber, Mechanotransduction at a distance: Mechanically
coupling the extracellular matrix with the nucleus. Nat. Rev. Mol. Cell Biol. 10, 75–82 (2009). 4. M. A. Wozniak, C. S. Chen, Mechanotransduction in development: A growing role
for contractility. Nat. Rev. Mol. Cell Biol. 10, 34–43 (2009). 5. A. J. Engler, S. Sen, H. L. Sweeney, D. E. Discher, Matrix elasticity directs stem cell lineage
specification. Cell 126, 677–689 (2006). 6. F. Chowdhury, S. Na, D. Li, Y.-C. Poh, T. S. Tanaka, F. Wang, N. Wang, Material properties
of the cell dictate stress-induced spreading and differentiation in embryonic stem cells. Nat. Mater. 9, 82–88 (2009).
7. C. S. Chen, M. Mrksich, S. Huang, G. M. Whitesides, D. E. Ingber, Geometric control of cell life and death. Science 276, 1425–1428 (1997).
8. W. A. Lam, L. Cao, V. Umesh, A. J. Keung, S. Sen, S. Kumar, Extracellular matrix rigidity modulates neuroblastoma cell differentiation and N-myc expression. Mol. Cancer 9, 35 (2010).
9. M. Saxena, S. Liu, B. Yang, C. Hajal, R. Changede, J. Hu, H. Wolfenson, J. Hone, M. P. Sheetz, EGFR and HER2 activate rigidity sensing only on rigid matrices. Nat. Mater. 16, 775–781 (2017).
10. V. Kolpakov, M. D. Rekhter, D. Gordon, W. H. Wang, T. J. Kulik, Effect of mechanical forces on growth and matrix protein synthesis in the in vitro pulmonary artery: Analysis of the role of individual cell types. Circ. Res. 77, 823–831 (1995).
11. J. Chen, B. Fabry, E. L. Schiffrin, N. Wang, Twisting integrin receptors increases endothelin-1 gene expression in endothelial cells. Am. J. Physiol. Cell Physiol. 280, C1475–C1484 (2001).
12. B. Fabry, G. N. Maksym, J. P. Butler, M. Glogauer, D. Navajas, J. J. Fredberg, Scaling the microrheology of living cells. Phys. Rev. Lett. 87, 148102 (2001).
13. M. Maurer, J. Lammerding, The driving force: Nuclear mechanotransduction in cellular function, fate, and disease. Annu. Rev. Biomed. Eng. 21, 443–468 (2019).
14. N. Itano, S.-i. Okamoto, D. Zhang, S. A. Lipton, E. Ruoslahti, Cell spreading controls endoplasmic and nuclear calcium: A physical gene regulation pathway from the cell surface to the nucleus. Proc. Natl. Acad. Sci. U.S.A. 100, 5181–5186 (2003).
15. A. Elosegui-Artola, I. Andreu, A. E. M. Beedle, A. Lezamiz, M. Uroz, A. J. Kosmalska, R. Oria, J. Z. Kechagia, P. Rico-Lastres, A. L. Le Roux, C. M. Shanahan, X. Trepat, D. Navajas, S. Garcia-Manyes, P. Roca-Cusachs, Force triggers YAP nuclear entry by regulating transport across nuclear pores. Cell 171, 1397–1410.e14 (2017).
16. J. Swift, I. L. Ivanovska, A. Buxboim, T. Harada, P. C. Dave, P. Dingal, J. Pinter, J. D. Pajerowski, K. R. Spinler, J.-W. Shin, M. Tewari, F. Rehfeldt, D. W. Speicher, D. E. Discher, Nuclear lamin-A scales with tissue stiffness and enhances matrix-directed differentiation. Science 341, 1240104 (2013).
17. T. O. Ihalainen, L. Aires, F. A. Herzog, R. Schwartlander, J. Moeller, V. Vogel, Differential basal-to apical accessibility of Lamin A/C epitopes in the nuclear lamina regulated by changes in cytoskeletal tension. Nat. Mater. 14, 1252–1261 (2015).
18. A. Buxboim, J. Swift, J. Irianto, K. R. Spinler, P. C. Dingal, A. Athirasala, Y.-R. Kao, S. Cho, T. Harada, J.-W. Shin, D. E. Discher, Matrix elasticity regulates lamin-A, C phosphorylation and turnover with feedback to actomyosin. Curr. Biol. 24, 1909–1917 (2014).
on May 27, 2020
http://advances.sciencemag.org/
Dow
nloaded from
Sun et al., Sci. Adv. 2020; 6 : eaay9095 1 April 2020
S C I E N C E A D V A N C E S | R E S E A R C H A R T I C L E
13 of 13
19. C. Guilluy, L. D. Osborne, L. Van Landeghem, L. Sharek, R. Superfine, R. Garcia-Mata, K. Burridge, Isolated nuclei adapt to force and reveal a mechanotransduction pathway in the nucleus. Nat. Cell Biol. 16, 376–381 (2014).
20. N. Jain, K. V. Iyer, A. Kumar, G. V. Shivashankar, Cell geometric constraints induce modular gene-expression patterns via redistribution of HDAC3 regulated by actomyosin contractility. Proc. Natl. Acad. Sci. U.S.A. 110, 11349–11354 (2013).
21. H. Q. Le, S. Ghatak, C.-Y. C. Yeung, F. Tellkamp, C. Günschmann, C. Dieterich, A. Yeroslaviz, B. Habermann, A. Pombo, C. M. Niessen, S. A. Wickström, Mechanical regulation of transcription controls Polycomb-mediated gene silencing during lineage commitment. Nat. Cell Biol. 18, 864–875 (2016).
22. D.-H. Kim, J. Hah, D. Wirtz, Mechanics of the cell nucleus. Adv. Exp. Med. Biol. 1092, 41–55 (2018).
23. A. Tajik, Y. Zhang, F. Wei, J. Sun, Q. Jia, W. Zhou, R. Singh, N. Khanna, A. S. Belmont, N. Wang, Transcription upregulation via force-induced direct stretching of chromatin. Nat. Mater. 15, 1287–1296 (2016).
24. A. Belyaeva, S. Venkatachalapathy, M. Nagarajan, G. V. Shivashankar, C. Uhler, Network analysis identifies chromosome intermingling regions as regulatory hotspots for transcription. Proc. Natl. Acad. Sci. U.S.A. 114, 13714–13719 (2017).
25. Y. Hu, I. Kireev, M. Plutz, N. Ashourian, A. S. Belmont, Large-scale chromatin structure of inducible genes: Transcription on a condensed, linear template. J. Cell Biol. 185, 87–100 (2009).
26. S. M. Mijailovich, M. Kojic, M. Zivkovic, B. Fabry, J. J. Fredberg, A finite element model of cell deformation during magnetic bead twisting. J. Appl. Physiol. 93, 1429–1436 (2002).
27. F. Chowdhury, S. Na, O. Collin, B. Tay, F. Li, T. Tanaka, D. E. Leckband, N. Wang, Is cell rheology governed by nonequilibrium-to-equilibrium transition of noncovalent bonds? Biophys. J. 95, 5719–5727 (2008).
28. M. Cupesi, J. Yoshioka, J. Gannon, A. Kudinova, C. L. Stewart, J. Lammerding, Attenuated hypertrophic response to pressure overload in a lamin A/C haploinsufficiency mouse. J. Mol. Cell. Cardiol. 48, 1290–1297 (2010).
29. J. Yu, S. Bergaya, T. Murata, I. F. Alp, M. P. Bauer, M. I. Lin, M. Drab, T. V. Kurzchalia, R. V. Stan, W. C. Sessa, Direct evidence for the role of caveolin-1 and caveolae in mechanotransduction and remodeling of blood vessels. J. Clin. Invest. 116, 1284–1291 (2006).
30. K. Lei, L. Chen, B. J. Cryar, R. Hua, S. R. Sooranna, J. J. Brosens, P. R. Bennett, M. R. Johnson, Uterine stretch and progesterone action. J. Clin. Endocrinol. Metab. 96, E1013–E1024 (2011).
31. D. Greiner, T. Bonaldi, R. Eskeland, E. Roemer, A. Imhof, Identification of a specific inhibitor of the histone methyltransferase SU(VAR)3-9. Nat. Chem. Biol. 1, 143–145 (2005).
32. L. Wang, J. Chang, D. Varghese, M. Dellinger, S. Kumar, A. M. Best, J. Ruiz, R. Bruick, S. Peña-Llopis, J. Xu, D. J. Babinski, D. E. Frantz, R. A. Brekken, A. M. Quinn, A. Simeonov, J. Easmon, E. D. Martinez, A small molecule modulates Jumonji histone demethylase activity and selectively inhibits cancer growth. Nat. Commun. 4, 2035 (2013).
33. H. D. Ou, S. Phan, T. J. Deerinck, A. Thor, M. H. Ellisman, C. C. O'Shea, ChromEMT: Visualizing 3D chromatin structure and compaction in interphase and mitotic cells. Science 357, eaag0025 (2017).
34. J. C. Rice, C. D. Allis, Histone methylation versus histone acetylation: New insights into epigenetic regulation. Curr. Opin. Cell Biol. 13, 263–273 (2001).
35. K. V. Iyer, S. Pulford, A. Mogilner, G. V. Shivashankar, Mechanical activation of cells induces chromatin remodeling preceding MKL nuclear transport. Biophys. J. 103, 1416–1428 (2012).
36. R. Biggs, P. Z. Liu, A. D. Stephens, J. F. Marko, Effects of altering histone posttranslational modifications on mitotic chromosome structure and mechanics. Mol. Biol. Cell 30, 820–827 (2019).
37. Y. Tan, A. Tajik, J. Chen, Q. Jia, F. Chowdhury, L. Wang, J. Chen, S. Zhang, Y. Hong, H. Yi, D. C. Wu, Y. Zhang, F. Wei, Y.-C. Poh, J. Seong, R. Singh, L.-J. Lin, S. Doğanay, Y. Li, H. Jia, T. Ha, Y. Wang, B. Huang, N. Wang, Matrix softness regulates plasticity of tumour-repopulating cells via H3K9 demethylation and Sox2 expression. Nat. Commun. 5, 4619 (2014).
38. Y. Xia, I. L. Ivanovska, K. Zhu, L. Smith, J. Irianto, C. R. Pfeifer, C. M. Alvey, J. Ji, D. Liu, S. Cho, R. R. Bennett, A. J. Liu, R. A. Greenberg, D. E. Discher, Nuclear rupture at sites of high curvature compromises retention of DNA repair factors. J. Cell Biol. 217, 3796–3808 (2018).
39. J.-K. Kim, A. Louhghalam, G. Lee, B. W. Schafer, D. Wirtz, D.-H. Kim, Nuclear lamin A/C harnesses the perinuclear apical actin cables to protect nuclear morphology. Nat. Commun. 8, 2123 (2017).
40. S. Hu, L. Eberhard, J. Chen, J. C. Love, J. P. Butler, J. J. Fredberg, G. M. Whitesides, N. Wang, Mechanical anisotropy of adherent cells probed by a three-dimensional magnetic twisting device. Am. J. Physiol. Cell Physiol. 287, C1184–C1191 (2004).
41. T. C. Roberts, J. R. Hart, M. U. Kaikkonen, M. S. Weinberg, P. K. Vogt, K. V. Morris, Quantification of nascent transcription by bromouridine immunocapture nuclear run-on RT-qPCR. Nat. Protoc. 10, 1198–1211 (2015).
Acknowledgments: We thank A. Belmont for providing CHO DG44 cells that contain DHFR BAC transgenes. We thank F. Wei and Y. Zhang for assistance. Funding: This work was supported by NIH grant R01 GM072744 (to N.W.) and by the National Natural Science Foundation of China (11902121) (to J.C.) and Program for Huazhong University of Science and Technology Academic Frontier Youth Team (2018QYTD01) (to J.C.). N.W. acknowledges the support from the Leonard C and Mary Lou Hoeft Endowed Professorship in Engineering at UIUC. Author contributions: N.W. conceived the project. N.W., J.S., and J.C. designed the project. J.S., J.C., and E.M. performed experiments and analyses. N.W., J.S., and J.C. wrote the manuscript with inputs from E.M. Competing interests: The authors declare that they have no competing interests. Data and materials availability: All data needed to evaluate the conclusions in the paper are present in the paper and/or the Supplementary Materials. Additional data related to this paper may be requested from the authors; specifically, the code written in C language that controls the waveform of the magnetic field, and the MATLAB code that obtains the position list of GFP spots at different time points are fully available upon request.
Submitted 28 July 2019Accepted 8 January 2020Published 1 April 202010.1126/sciadv.aay9095
Citation: J. Sun, J. Chen, E. Mohagheghian, N. Wang, Force-induced gene up-regulation does not follow the weak power law but depends on H3K9 demethylation. Sci. Adv. 6, eaay9095 (2020).
on May 27, 2020
http://advances.sciencemag.org/
Dow
nloaded from
demethylationForce-induced gene up-regulation does not follow the weak power law but depends on H3K9
Jian Sun, Junwei Chen, Erfan Mohagheghian and Ning Wang
DOI: 10.1126/sciadv.aay9095 (14), eaay9095.6Sci Adv
ARTICLE TOOLS http://advances.sciencemag.org/content/6/14/eaay9095
MATERIALSSUPPLEMENTARY http://advances.sciencemag.org/content/suppl/2020/03/30/6.14.eaay9095.DC1
REFERENCES
http://advances.sciencemag.org/content/6/14/eaay9095#BIBLThis article cites 41 articles, 10 of which you can access for free
PERMISSIONS http://www.sciencemag.org/help/reprints-and-permissions
Terms of ServiceUse of this article is subject to the
is a registered trademark of AAAS.Science AdvancesYork Avenue NW, Washington, DC 20005. The title (ISSN 2375-2548) is published by the American Association for the Advancement of Science, 1200 NewScience Advances
License 4.0 (CC BY-NC).Science. No claim to original U.S. Government Works. Distributed under a Creative Commons Attribution NonCommercial Copyright © 2020 The Authors, some rights reserved; exclusive licensee American Association for the Advancement of
on May 27, 2020
http://advances.sciencemag.org/
Dow
nloaded from