complexity in gene promoters and gene expression · complexity in gene promoters and gene...
TRANSCRIPT

Complexity in gene promoters and gene expression
Manju BansalMolecular Biophysics UnitIndian Institute of Science
Bangalore
AvH Kolleg2-5 Feb 20111

--Lehninger 5th Ed
2

DNA facts:
Deoxyribose - Nucleic Acid
Base composition:
Erwin Chargaff
(A)=(T), (G)=(C)
X-ray pattern:
Rosalind Franklin
Structure:
James Watson & Francis Crick
- base pairing between
A-T and G-C
- double helical model with
10 units per turn.
3

Central Dogma II: Genomic DNA carries all signals in its nucleotide (ATGC) sequence
Genomic DNA not only carries genetic information which is passed on to progeny.
But…
also carries signals or ‘punctuation marks’ for precise functioning of many processes like transcription, replication and translation etc
4

Precise, predictive model of transcription initiation and termination: ability to predict where and when transcription will occur in a genome
Precise, predictive model of RNA splicing/alternative splicing: ability to predict the splicing pattern of any primary transcript in any tissue
Precise, quantitative models of signal transduction pathways: ability to predict cellular responses to external stimuli
Determining effective protein:DNA, protein:RNA and protein:protein recognition code
Accurate ab initio protein structure predictionRational design of small molecule inhibitors of proteins Mechanistic understanding of protein evolution: understanding exactly how new
protein functions evolve Mechanistic understanding of speciation: molecular details of how speciation
occurs Continued development of effective gene ontologies - systematic ways to
describe the functions of any gene or protein
Education: development of appropriate bioinformatics curricula for secondary, undergraduate and graduate education
TOP TEN FUTURE CHALLENGES FOR GENOMICS: 2001
5
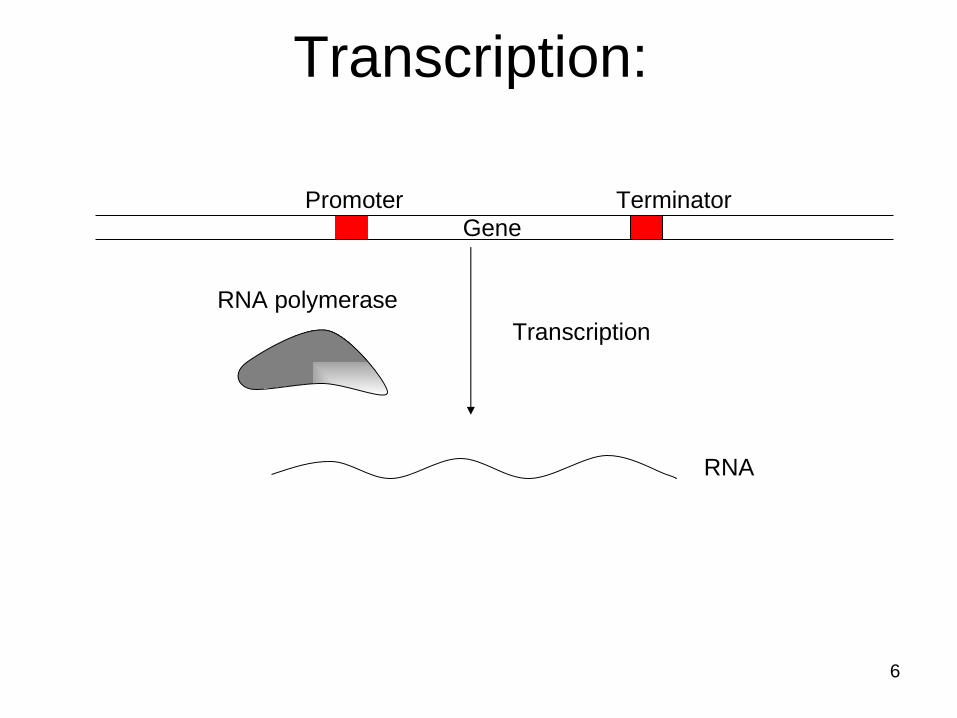
Transcription:
Transcription
Promoter TerminatorGene
RNA polymerase
RNA
6

7
Simple illustration of prokaryotic transcription unit
TSS – Transcription start site
TLS – Translation start site
Gene
5' 3'
TSS
+1-10-35 TLS
Promoter
7

Transcription
8

B A Z
5’
5’
5’
9

Prokaryotic promoter
Consensus sequence is not present in majority of prokaryotic promoters.
Sequence motifs encompassing 6-10 nucleotides are degenerate; Probability of finding similar sequences in regions other than promoters are quite high.
Harley and Reynolds (1987) Nucleic Acids Res. 15(5): 2343-2361. 1010

The genome sequence contains many sequences similar to the identified regulatory motifs
• The sequence motifs comprise only 6-10 bp and are degenerate, the probability of finding similar sequences in regions other than promoters is quite high.
• E coli genome size : 4639221 bp
• -10 like sequences in E. coli :
326746 (2 mismatches), 35762 (1 mismatch)
OR• E. coli has -10 like sequence every
14th bp (2 mismatches), 130th bp (1 mistmatch)
11

Does it indicate that there are other signals which help in positioning RNA
polymerase?
Criteria for searching signals
• Relevant to transcription
• We should be able to predict based on sequence
12

Drawback of sequence based methods : High false positives.
Experimental evidences suggested that promoter sequences
indeed have distinct structural features
Stability
Bendability
Curvature
Comprehensive analysis of promoter sequences showed they
are less stable, highly curved and less bendable.
Among these, lower stability is found to be the most ubiquitous
physicochemical property of promoter regions.
Sequence dependent structural properties
1313

DNA STABILITY
• One important step in transcription is the formation of open complex which involves strand separation of DNA near the transcription start site (-10 to TSS)
• This region is now considered to extend from -80 to +20
14

15
Stability calculation for DNA molecule
Stability of a double stranded DNA molecule can be expressed in terms of the
free energy of its constituent base paired dinucleotides.
Free energy over long continuous stretch of DNA sequence calculated by
dividing the sequence into overlapping windows of 15 base pairs (or 14
dinucleotide steps).
SantaLucia J (1998) Proc. Natl. Acad. Sci. USA 95(4):1460-1465.
Energy values corresponding to
the 10 unique dinucleotide
sequences - unified parameters
obtained from melting studies on
108 oligonucleotides.
5’ ATGCGTGCATGACGTACGATGCGATCAGTGACGTACGT 3’
Average stability is assigned to central position
Average stability is assigned to central position
15
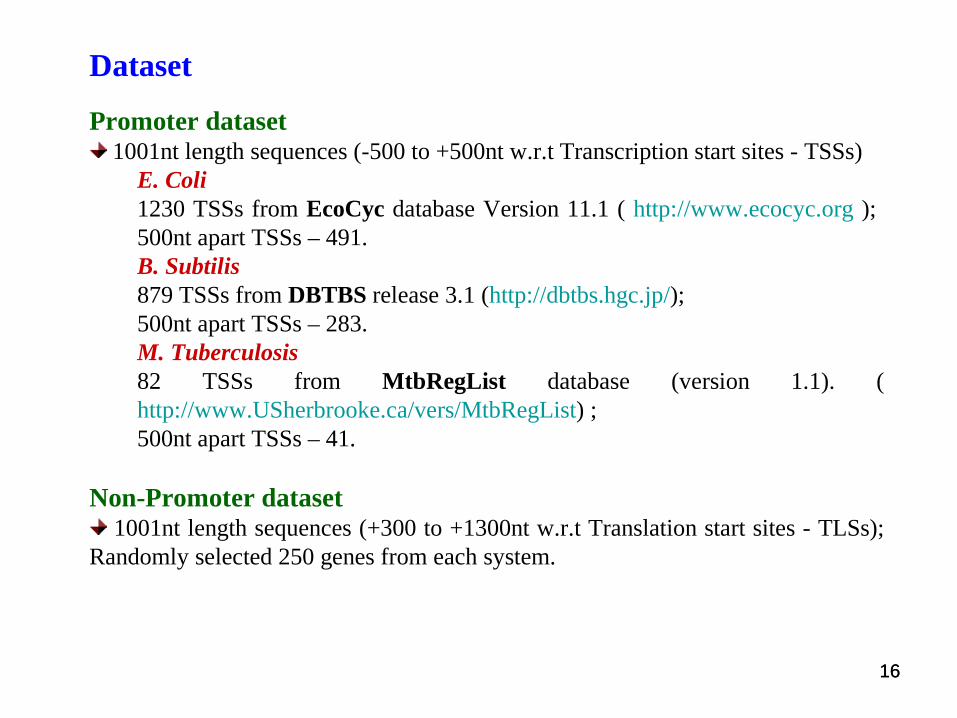
Promoter dataset 1001nt length sequences (-500 to +500nt w.r.t Transcription start sites - TSSs)
E. Coli1230 TSSs from EcoCyc database Version 11.1 ( http://www.ecocyc.org ); 500nt apart TSSs – 491.B. Subtilis879 TSSs from DBTBS release 3.1 (http://dbtbs.hgc.jp/); 500nt apart TSSs – 283.M. Tuberculosis82 TSSs from MtbRegList database (version 1.1). (http://www.USherbrooke.ca/vers/MtbRegList) ; 500nt apart TSSs – 41.
Non-Promoter dataset 1001nt length sequences (+300 to +1300nt w.r.t Translation start sites - TLSs);
Randomly selected 250 genes from each system.
Dataset
1616

Nucleotide distribution in the vicinity of TSS
E. Coli
491 Sequences
%GC : 50.8
B. Subtilis
283 Sequences
%GC : 44.3
M. Tuberculosis
40 sequences
%GC : 65.6
Irrespective of the GC-content of the genome AT-richness is seen in the vicinity of TSS compared to its flanking sequence.
1717

A representative free energy profile
18

E. Coli B. Subtilis M. Tuberculosis
Average free energy (Stability) profile
Red line – 1001nt length promoter sequence (-500 to +500nt w.r.t TSS)
Blue line – shuffled sequence (-500 to -100nt, -80 to +20 nt and +100 to +500nt region w.r.t TSS)
Green line – 1001nt length non-promoter sequence (+300 to +1300 w.r.t TLS)
Average free energy (AFE) profile showed low
stability peak at TSS.
Core promoter region shuffled sequence is less stable
than downstream shuffled sequence.
Low stability peak is very narrow for M.tb
1919

DNA stability profile in E. coli promoters
Transcription start site
mRNA
Less stable
Morestable
upstream
downstream
20

Average free energy profile for protein coding gene promoter sequences from 913 microbial genomes
E – average free energy over -80 to +20nt region w.r.t TLS
REav – average free energy over +100 to +500nt region w.r.t TLS.
When the GC content of the genomic fragments increases, the absolute values of both E and REav become larger, indicating higher stability.
21

TSS-TLS based threshold values
AFE values from TSS data and TLS data are similar
E and D are the condition applied (threshold) for any stretch of DNA to be a promoter.2222

E1(n+50)
E2(n+50)DE(n+50)
• Difference in stability between neighboring regions is used to identify prokaryotic promoter regions (Kanhere and Bansal, BMC Bioinformatics (2005).
A scoring function has been devised to assess Free Energy difference DE(n+50) between two 100nt long regions, corresponding to every nucleotide position ‘n’
Promoter prediction methodology
2323

Comparison of structure based promoter prediction methods at diverse E. coli genomic region (Rangannan and Bansal, Mol Biosyst 2009)
A) genomic region from 9000bp to 15300bp
B) genomic region from 3483400bp to 3487000bp
24(100nt and 50nt window has been used in E1 calculation)
2424

25
PromBase – A high quality annotated database with predicted promoter regions in 913 microbial genomes, based on relative stability of DNA.Rangannan and Bansal (2010) Bioinformatics.
Available at : http://nucleix.mbu.iisc.ernet.in/prombase/

Parameters for assessing quality of predictions
26

Quality assessment of whole genome promoter prediction for 913 microbial genomes using AFE criteria
%Recall for the genomes with high %GC has been increased with out much change in the
%Precision.
On an average 72% recall and 56% precision has been achieved with high F score (62%).
Importantly 69.2% (σ = 17.41) ecall has been obtained for RNA genes in 913 microbial
genomes27

(a) In this simple eukaryotic transcriptional unit, a simple core promoter (TATA), an upstream activator sequence (UAS), and a silencer element are spaced within100–200 base pairs of the TATA box that is typically found in unicellular eukaryotes. (b) In this metazoan transcriptional control module, a complex arrangement of multiple clustered enhancer modules are interspersed with silencer and insulator elements, which can be located 10–50 kilobases either upstream or downstream of a composite core promoter containing a TATA box (TATA), initiator sequences (INRs), and downstream promoter elements (DPEs). From: Berretta and Morillon (2009) EMBO Reports 10, 973-982
A simple eukaryotic promoter and an extensively diversified metazoan regulatory module.
28

29
(a) Arabidopsis genome (b) Rice genome
(c) Comparison of Arabidopsis and Rice
Average Free Energy profile in the vicinity of TSS
NOTE: The AFE values for upstream, downstream and full length shuffled sequences are shown as dashed (--) lines

30
Predictions correspond to peaks in AFE profiles with constant difference between upstream and downstream regions (chromosome 1)

31
Gene type No. of genes Recall Precision
Arabidopsis
Protein-coding genes 20094 0.92 0.33
Protein-coding genes –TLSa 8195 0.96 0.51
ncRNA genes 1263 0.93 0.77
Rice
Protein-coding genes 23057 0.92 0.24
ncRNA genes 1527 0.95 0.90
NPC transcripts 1152 0.96 0.47
PromPredict performance on Arabidopsis and Rice genomes
Protein coding genes True Positive (TP) region : -500bp to +100bp w.r.t TSS
ncRNA genes True Positive (TP) region : -1000bp to 0 w.r.t RNA start site
Protein coding genes (with TLS information) True Positive (TP) region : -1000bp to 0 w.r.t RNA start site
a: Protein coding genes with only TLS information
NPC: Non-protein coding

32
Region Arabidopsis Rice
5'UTR 7.3% 6.6%
3'UTR 14.3% 9.1%
Introns 71.7% 78.4%
First Intron 20.4% 21.0%
CDS 6.7% 5.9%
Percentage distribution of FP predictions in coding and non-coding regions of transcripts
FP prediction distribution
Arabidopsis Rice
The percentage frequency distribution of FPpred from each score category found in various regions of the transcript.
Majority of the predictions within the transcripts lie in the intronic region for each category
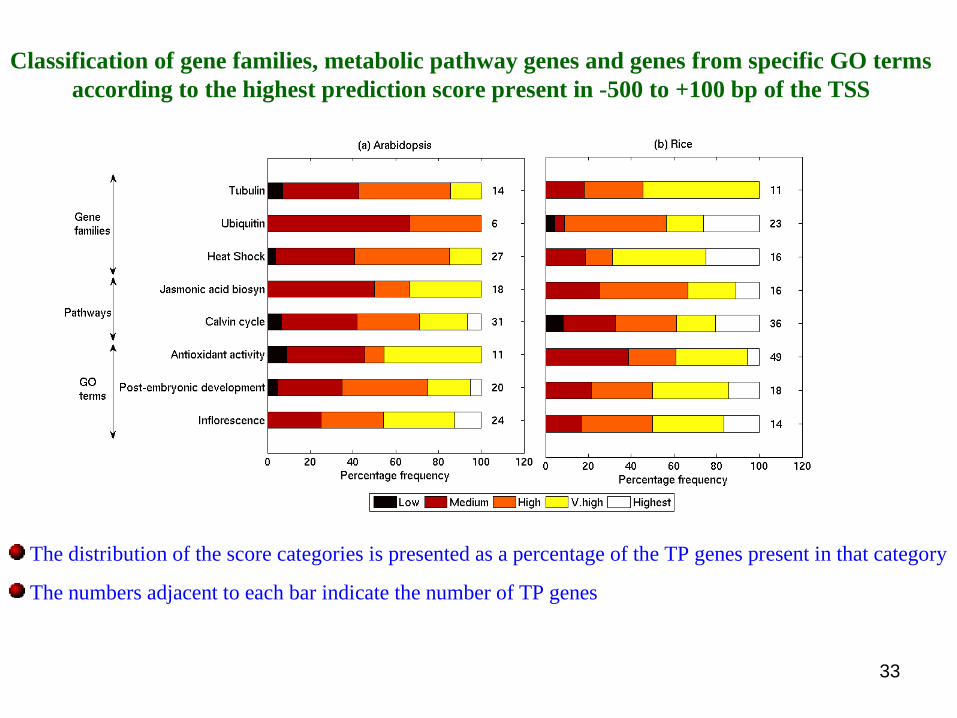
Classification of gene families, metabolic pathway genes and genes from specific GO terms according to the highest prediction score present in -500 to +100 bp of the TSS
The distribution of the score categories is presented as a percentage of the TP genes present in that category
The numbers adjacent to each bar indicate the number of TP genes
33
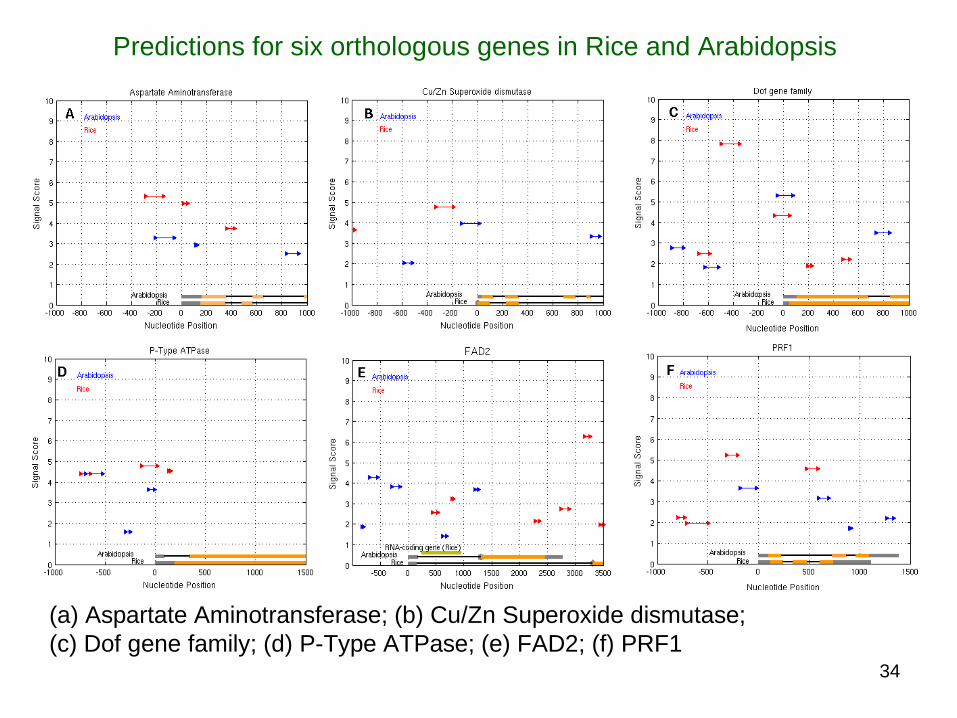
(a) Aspartate Aminotransferase; (b) Cu/Zn Superoxide dismutase; (c) Dof gene family; (d) P-Type ATPase; (e) FAD2; (f) PRF1
Predictions for six orthologous genes in Rice and Arabidopsis
34

Relative orientation of non-coding RNA and mRNA transcription. PARs (CUTs and SUTs) and PROMPTs can be transcribed from the gene promoter region —from the 5' NDR in particular—and from intergenic regions in either sense or antisense orientation. 5'NDR, 5' nucleosome-depleted region; CUT, cryptic unstable transcript; Isw2, imitation switch 2; ncRNA, non-coding RNA; PAR, promoter-asssociated ncRNA; PROMPT, promoter upstream transcript; Set2, SET-domain-containing 2; Spt6/16, suppressor of Ty1 6/16.
From: Berretta and Morillon (2009) EMBO Reports 10, 973-982
35

36

Possible mechanisms for the regulation of genome expression by non-coding transcription.
(A) Bidirectional PARs and mRNAs might originate from different pre-initiation complexes (PICs) and compete for the same pool of transcription factors to initiate transcription. Binding of TBP or other factors might be responsible for directing the balance towards mRNA synthesis.
(B) The transcriptional interference mechanism, in which transcription factors (TFs) are displaced from the mRNA promoter by the upstream cryptic transcription, is shown. The SRG1 cryptic non-coding RNA (ncRNA) interferes with the promoter of the downstream SER3 gene through this mechanism.
CUT, cryptic unstable transcript; H3, histone H3; HMT, histone methyl transferase; IMD2, inosine monophosphate dehydrogenase 2; K, lysine; PAR, promoter-associated non-coding RNA; Rpd3S, reduced potassium dependency 3 small; SER3, serine requiring 3; Set1/2, SET-domain-comtaining 1/2; SRG1, SER3 regulatory gene; TBP, TATA binding protein.
37

• (C) Model for start site selection. The CUT and the mRNA have the same promoter but originate from different transcription start sites and compete for the same pool of PIC factors. An example of this type of regulation occurs at the IMD2 locus.
• (D) Transcription-induced chromatin modifications, in which cryptic transcription modifies promoter proximal chromatin to attenuate gene expression. The GAL10–GAL1 locus is regulated through this mechanism; cryptic transcription that originates upstream from the GAL10–GAL1 promoter induces the methylation of H3K4 and/or H3K36 by the HMTs Set1 and Set2, respectively, and tethers the Rpd3S histone deacetylase complex to attenuate gene expression of the GAL locus.
38

39
Conclusion
PromPredict performs quite well in predicting regulatory regions in bacterial as well as plant genomes, though the program has been trained on prokaryotes.
Free energy difference criterion used in this program, seems to be a general property found in the vicinity of TSS. Hence PromPredict is also expected to perform well for other plants and eukaryotes.
PromPredict is based on stability or GC-content of genomic sequences, therefore complementing the program with a CpG island and perhaps G-quadruplex motif predictor could be beneficial.
Difficult task for all PPPs – no clarity on correlation of promoters with gene expression level.
However recent results on Pervasive Transcription indicate that many FPs are True transcription inititiation sites.

40
Ack: Aditi, Vetriselvi, Czuee, Sushmita, Rajasekaran Dept of Biotech, India & Monsanto Co, USA
41
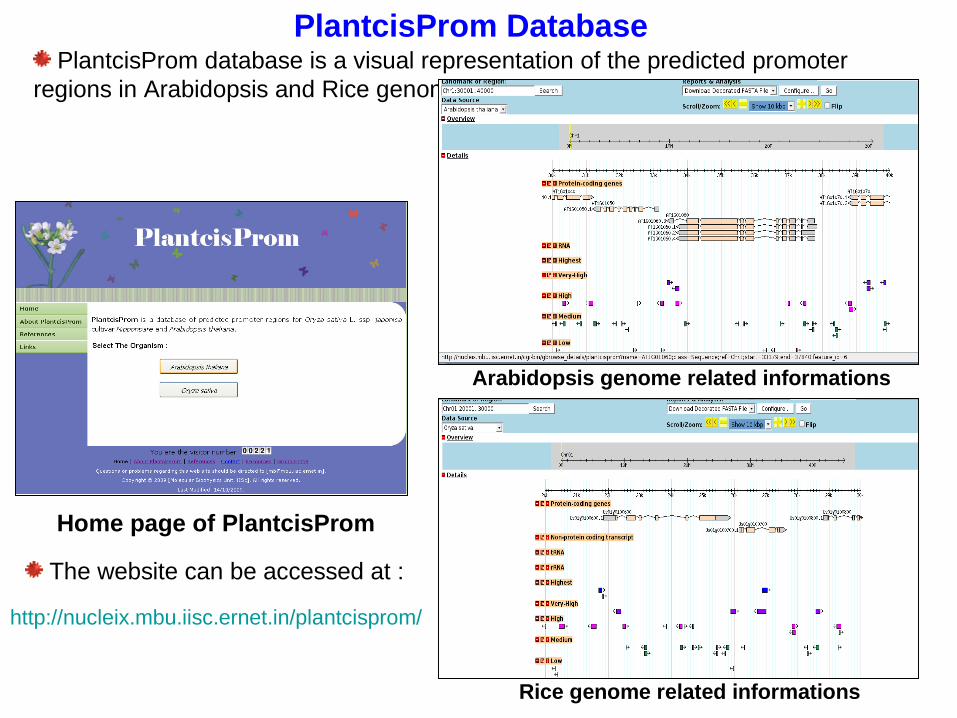
PlantcisProm Database PlantcisProm database is a visual representation of the predicted promoter
regions in Arabidopsis and Rice genomes.
Home page of PlantcisProm
Arabidopsis genome related informations
Rice genome related informations
The website can be accessed at :
http://nucleix.mbu.iisc.ernet.in/plantcisprom/

Bendability profile using trinucleotide models
Nucleosomal positioning preference
42
Red line – 1001nt length promoter sequence (-500 to +500nt w.r.t TSS)
Blue line – shuffled sequence (-500 to -100nt, -80 to +20 nt and +100 to +500nt region w.r.t TSS)
Green line – 1001nt length non-promoter sequence (+300 to +1300 w.r.t TLS)
E. Coli : 491 B. Subtilis : 283 M. Tuberculosis : 40
Nucleosomal positioning preference profile reproduced
same bendability profile as seen for DNase I sensitivity
trinucleotide model.
E. Coli B. Subtilis
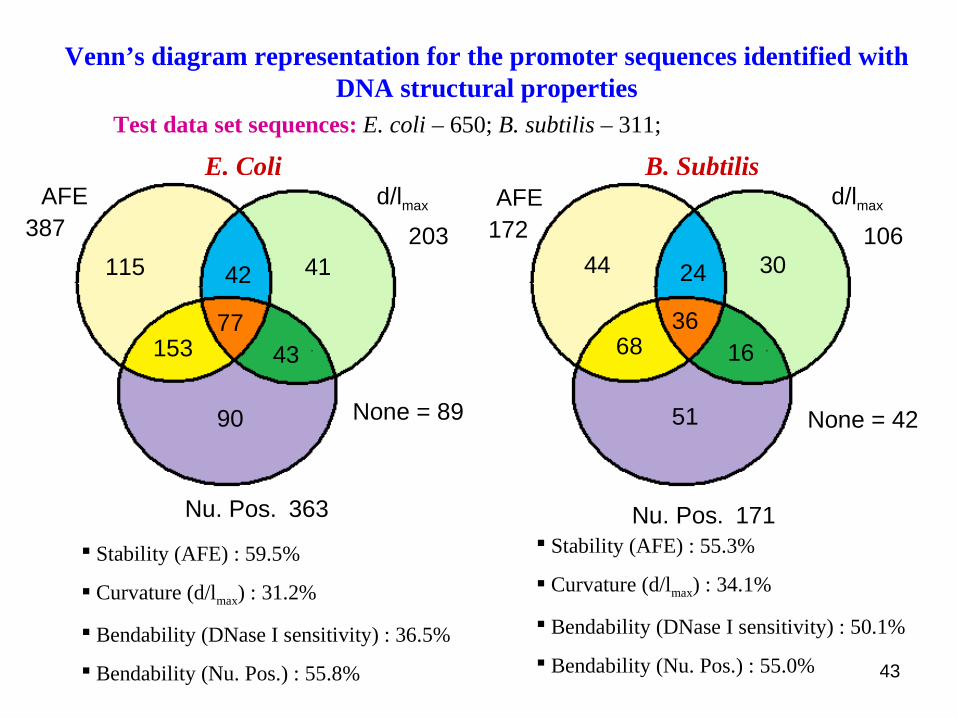
Test data set sequences: E. coli – 650; B. subtilis – 311;
Venn’s diagram representation for the promoter sequences identified with DNA structural properties
Stability (AFE) : 59.5%
Curvature (d/lmax) : 31.2%
Bendability (DNase I sensitivity) : 36.5%
Bendability (Nu. Pos.) : 55.8%
Stability (AFE) : 55.3%
Curvature (d/lmax) : 34.1%
Bendability (DNase I sensitivity) : 50.1%
Bendability (Nu. Pos.) : 55.0% 43
115 4142
153 4377
90
AFE d/lmax
Nu. Pos.
None = 89
387
363
20344 3024
68 1636
51
AFE d/lmax
Nu. Pos.
None = 42
172
171
106

Predictions for orthologous genes
The signal score and position (relative to the TSS) of predictions for Arabidopsis (blue) and Rice (red) orthologous genes
The predictions in both orientations are shown (a) Aspartate Aminotransferase; (b) Cu/Zn Superoxide dismutase; (c) Dof gene family; (d) P-Type ATPase;
(e) FAD2; (f) PRF1 44

Models for cis- or trans-mediated RNA-dependent regulation of gene expression. (A) Regulation in cis: when Rrp6 is delocalized or absent, the antisense CUT is stabilized
and recruits HDACs, which are responsible for promoter regulation and silencing. (B) Regulation in trans: the CUT, which is transcribed from a distant locus and stabilized, induces the recruitment of the HMT Set1, thereby inhibiting gene transcription. The RTL
noncoding RNA regulates the TY1 locus in this manner. HDAC, histone deacetylase complex; HMT, histone methyl transferase; PHO84,
phosphate metabolism 84; Rrp6, ribosomal RNA processing 6; RTL, antisense of LTR; Set1, SET-domain-containing 1; TY1, transposon in yeast 1.
45

A map of protein-protein interactions involving calmodulin.Protein-protein interactions are both numerous and incredibly complex,and they can be mapped using the Database of Interacting Proteins (DIP).This image depicts a DIP map for the protein calmodulin. The interactionswith the most confidence are drawn with wider connecting lines. This diagram highlights one level of complexity involved in understanding the downstream effects of gene regulation and expression.
46