biomarkers of nutrition status: recent advances with...
TRANSCRIPT

Biomarkers of nutrition status: recent
advances with metabolomics
Claudine MANACH
Human Nutrition Unit,
INRA Clermont-Ferrand, France
Organised by
The ILSI Europe Nutrition and Mental Performance Task Force

THE PURPOSE OF NUTRITIONAL ASSESSMENT
• Identify population groups who do not have adequate nutrition for
preventing diseases or for optimal performance
• Develop nutrition programs for at risk populations and monitor their
impact
2
Study health
effects of dietary
patterns, foods,
nutrients
?
? Characterize
dietary patterns
of individuals
Assess exposure
to nutrients and
non-nutrients

THE CHALLENGE OF NUTRITIONAL ASSESSMENT
• Still a huge challenge in the post-genomic era:
- Heterogeneity and variability of food choices
- Limited knowledge of the composition of foods beyond the
~60 essential nutrients & best-known food bioactives
• Methods must be accurate, sensitive and applicable to
many populations
• Existing methods:
3
1- Anthropometric methods
2- Clinical examination
3- Questionnaires
4- Biomarkers

• BMI, Hip/waist ratio…
4
1-ANTHROPOMETRIC METHODS
Indicator of adequacy of energy intakes Correlation with diet quality?

• Physical signs associated to severe vitamin or mineral deficiencies
5
2-CLINICAL EXAMINATION
Not for mild deficiencies
Vit D deficiency (Rickets) Vit C deficiency (Scurvy) Iron deficiency (Anemia)
Vit A deficiency (Xeropthalmia)

• Today dietary assessment mainly relies on questionnaire instruments
- Food Frequency Questionnaires
(10-300 foods)
- 24hr recalls
- Food records
• New tools (web-based; digital camera)
6
3- QUESTIONNAIRES
Which food consumed How much How often
Tucker et al., Annu. Rev. Nutr. 2013. 33:349–71

• Recall errors, Misreporting, Difficulty to assess portion size
(literacy problems, desire to reduce the inconvenience of reporting, desire
to be perceived as compliant to a socially acceptable behaviour…)
• Inappropriate for some populations (children, obese people, elderly with cognitive impairment…)
Attenuation of associations with health outcomes
7
3- QUESTIONNAIRES: LIMITATIONS

• Targeted analysis in biofluids (blood, serum, urine, saliva) or tissues (hair, nail, skin, erythrocytes, adipose tissue)
8
4- BIOMARKERS
• Some biomarkers are nutrients or bioactives
and reflect their status or exposure
• Some are used as surrogate biomarkers of
food intake
List of commonly used biomarkers
Doubly labeled water
Urinary nitrogen
Urinary sodium
Urinary sucrose and fructose
Fatty acids (erythrocytes, adip tissue)
Plasma Vitamin C
Plasma carotenoids
Plasma alkylresorcinols
Urine Methylhistidine
TMAO
Urine polyphenols
Total energy expenditure
Protein intake
Sodium intake
Sugar intake
Dietary fats, fatty acids
F&V
F&V
Whole grain wheat and rye
Meat
Fish
Red wine, citrus, tea, soy, olive oil…
Jenab et al., Hum Gen 2009; Perez-Jimenez et al., AJCN 2010; Hedrick et al., Nutr J 2012

• Previous knowledge of a specific compound of the food
• Bioavailability and method of analysis of the specific compound
•
Specificity?
High dependence on factors affecting the biomarker concentration
(food matrix, interindividual variation in absorption and metabolism,
smoking, condition of sampling and storage, analytical method…)
• New biomarkers needed to cover a larger spectrum of foods
9
HYPOTHESIS-DRIVEN APPROACH FOR BIOMARKER
DISCOVERY
One food or food group One compound

• Metabolic profiling of
plasma/urine samples of
consumers and non-consumers
of a given diet/food/nutrient (cohort or intervention studies)
• Comparison with
multivariate statistics
10
METABOLOMICS: A DATA-DRIVEN APPROACH FOR BIOMARKER
DISCOVERY
Food metabolome = All metabolites
that directly derive from digestion and
metabolism of food chemicals

11
WORKFLOW FOR FOOD METABOLOME ANALYSES
3 Identification of discriminating ions
Spectral data (MS/MS,…) Databases, Librairies of spectra Analysis of standards
High Resolution Mass spectrometry or NMR analysis
1 Multivariate statistics (PCA, PLS-DA…)
2
Visualization
Discriminating ions
X samples N groups
Non-targeted method: Detection of as many
compounds as possible
Group 2 Group 1
Plasma, urine, saliva, etc…
HMDB In-house librairies
Pre-processing

• Controlled intervention study with orange juice
12
DISCOVERY OF BIOMARKERS OF FOOD INTAKE
12 volunteers – 4 weeks
500 ml/d Orange juice / Control drink
Usual diet, Cross-over design
24h urine D30; LC-ESI+-Qtof
105 significant ions
Score plot PLSDA
Nootkatone-diol
Limonene-diol Proline betaine
Pujos-Guillot et al., J Proteome Res, 2013
Hesperetin gluc Naringenin gluc
HCA heatmap
m/z 312.21
m/z 144.06 CO
group
OJ
group
m/z 232.09
CO OJ
02
00
04
00
06
00
0
Ion 144
CO OJ
02
00
04
00
06
00
08
00
01
00
00
12
00
0
Ion 312
CO OJ
05
00
10
00
15
00
20
00
25
00
30
00
Ion 303
CO OJ
02
00
40
06
00
80
01
00
01
20
0
Ion 273
CO OJ
01
00
20
03
00
40
05
00
Ion 144.06
CO OJ
05
00
10
00
15
00
Ion 347
CO OJ
05
00
10
00
15
00
Ion 235
CO OJ
05
01
00
15
02
00
25
03
00
Ion 232
CO OR CO OR CO OR
CO OR CO OR CO OR
CO OR CO OR

13
BIOMARKER VALIDATION: PROLINE BETAINE AS AN EXAMPLE
Heinzmann et al., 2010, Lloyd et al., 2011&2013, Pujos-Guillot et al., 2013, May et al., 2013, Andersen et al., 2014
Heinzmann et al., 2010; de Zwart et al., 2003; Slow et al., 2005
Found almost exclusively in citrus fruits, with dominance in orange
Associated with citrus intake in 3 acute studies,
3 medium-term interventions , 3 cohort studies
Detected with NMR, LC-QTof, FIE-MS
In morning spot urines, 24hr urine & post-prandial
urine kinetics
250 ml orange juice challenge
Heinzmann et al., AJCN 2010
Pharmacokinetics data
Training set n=220
Validation set n=279
« Excellent biomarker »
ROC curve
Heinzmann et al., AJCN 2010
Validation in INTERMAP-UK cohort

• Acute or medium-term
intervention studies (4 days-12 weeks; 4-61 subjects)
• >90% used urine samples (Spots, 24hr urines, or kinetics)
• NMR (8 studies), LC-MS (18
studies) or GC-MS (4 studies),
multiplatform analyses (5
studies)
14
DISCOVERY OF BIOMARKERS OF FOOD INTAKE
Citrus, Apple,
Raspberry, Aronia,
Strawberry,
Tomato, Soy,
Cruciferous
vegetables,
Beetroot,
Almonds, Nuts
Cocoa drink
Coffee
Red wine
Grape juice
Black tea, Green
tea
Whole rye grain
Milk, Cheese
Salmon, Cod
21 foods studied
145 candidate biomarkers (75%= phytochemical metabolites)
Scalbert et al., AJCN 2014, 99(6):1286-1308
To be validated

15
Six 24h recalls (1994-2002)
+FFQ 2007-2009
Matched on: Sex Age class (10 ans) Sampling season BMI in 2 classes
Selection of low and high consumers for 20 plant foods or food groups
Correlations between consumptions
Distribution of food consumption
SU.VI.MAX2 sub-cohort (210 M & F; 55-70 y) Coll. S. Hercberg, P. Galan, M. Touvier UREN, Inserm/INRA/CNAM/Paris 13
Comparison of urine metabolomes of low and high consumers
UPLC-ESI-Qtof-MS (pos&neg)
Biobank (One morning spot urine)
PhenoMeNEp project
METABOLOMICS FOR DISCOVERY OF PLANT FOOD INTAKE
BIOMARKERS

16
METABOLOMICS FOR DISCOVERY OF PLANT FOOD INTAKE
BIOMARKERS
Good discrimination for most foods,
especially those consumed frequently
& rich in phytochemicals
High consumers
Low consumers
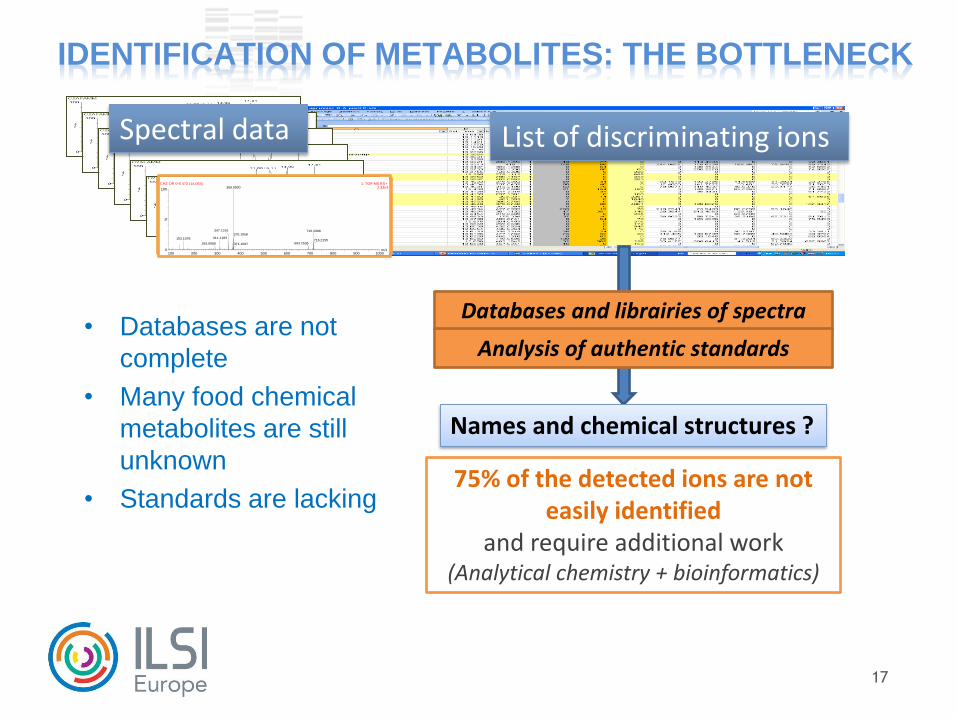
• Databases are not
complete
• Many food chemical
metabolites are still
unknown
• Standards are lacking
17
IDENTIFICATION OF METABOLITES: THE BOTTLENECK
List of discriminating ions Spectral data
m/z100 200 300 400 500 600 700 800 900 1000
%
0
100
CHZ OR 0-6 473 (14.063) 1: TOF MS ES+ 2.33e3369.0930
347.1316
311.1183153.1078
293.0958
715.2088370.1058
693.2535371.1097
716.2155
Names and chemical structures ?
Databases and librairies of spectra
Analysis of authentic standards
75% of the detected ions are not easily identified
and require additional work (Analytical chemistry + bioinformatics)

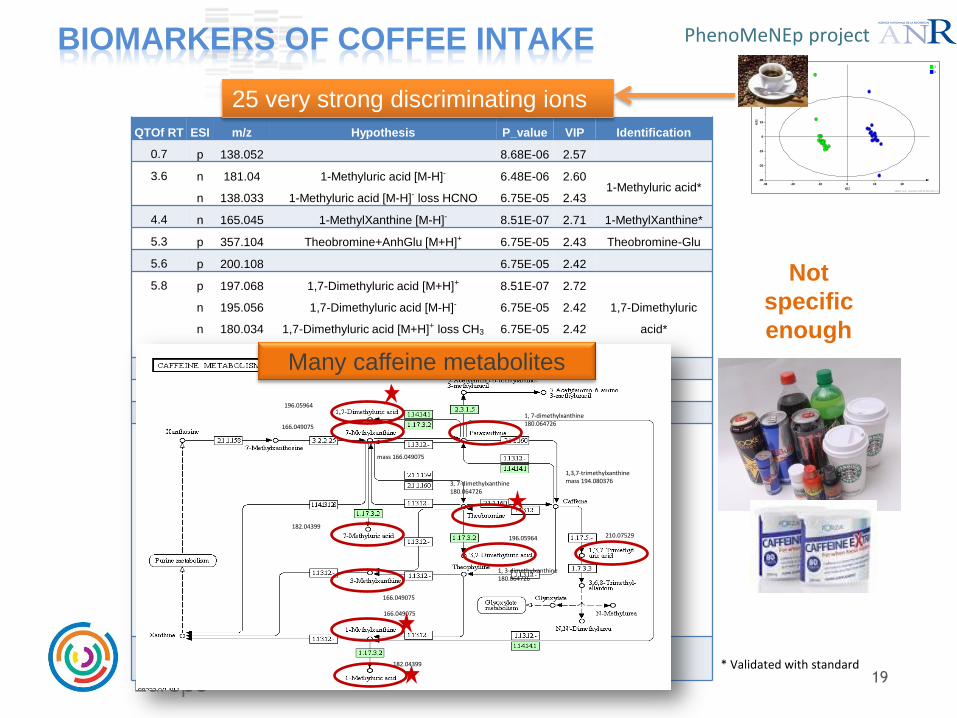
BIOMARKERS OF COFFEE INTAKE
• Coffee contains various bioactives implicated with
human health and well-being
• Uncertainties on the effect of coffee on diabetes,
cardiovascular diseases, neurodegenerative diseases,
cancer…
…maybe due to inaccuracy of dietary assessment
• Different methods of preparation: Poor comparability
across studies
• No specific biomarker available
19
BIOMARKERS OF COFFEE INTAKE
QTOf RT ESI m/z Hypothesis P_value VIP Identification
0.7 p 138.052 8.68E-06 2.57
3.6 n
n
181.04
138.033
1-Methyluric acid [M-H]-
1-Methyluric acid [M-H]- loss HCNO
6.48E-06
6.75E-05
2.60
2.43 1-Methyluric acid*
4.4 n 165.045 1-MethylXanthine [M-H]- 8.51E-07 2.71 1-MethylXanthine*
5.3 p 357.104 Theobromine+AnhGlu [M+H]+ 6.75E-05 2.43 Theobromine-Glu
5.6 p 200.108 6.75E-05 2.42
5.8 p
n
n
p
197.068
195.056
180.034
198.071
1,7-Dimethyluric acid [M+H]+
1,7-Dimethyluric acid [M-H]-
1,7-Dimethyluric acid [M+H]+ loss CH3
1,7-Dimethyluric acid [M+H]+ isotope M+1
8.51E-07
6.75E-05
6.75E-05
6.75E-05
2.72
2.42
2.42
2.42
1,7-Dimethyluric
acid*
5.8 p 292.158 6.75E-05 2.41
7.4 p 243.135 1.02E-04 2.38
8.4 p 211.146 1.61E-07 2.81
11.3 n
p
p
p
p
p
p
p
p
495.226
520.225
519.221
321.194
322.202
285.187
303.195
257.191
479.199
7.49E-09
8.53E-09
2.95E-08
1.61E-07
6.50E-07
5.90E-07
8.32E-06
1.58E-04
1.77E-04
2.98
2.96
2.90
2.82
2.78
2.75
2.58
2.34
2.33
11.4 p
p
329.186
527.193
2.29E-06
7.60E-05
2.66
2.40
Not
specific
enough
* Validated with standard
1,3,7-trimethylxanthine mass 194.080376
1, 7-dimethylxanthine 180.064726
3, 7-dimethylxanthine 180.064726
mass 166.049075
166.049075
166.049075
166.049075
196.05964
182.04399
182.04399
196.05964 210.07529
1, 3-dimethylxanthine 180.064726
Many caffeine metabolites
25 very strong discriminating ions
PhenoMeNEp project

BIOMARKERS OF COFFEE INTAKE
QTOf RT ESI m/z Hypothesis P_value VIP Identification
0.7 p 138.052 Trigonelline [M+H]+ 8.68E-06 2.57 Trigonelline*
3.6 n
n
181.04
138.033
1-Methyluric acid [M-H]-
1-Methyluric acid [M-H]- loss HCNO
6.48E-06
6.75E-05
2.60
2.43 1-Methyluric acid*
4.4 n 165.045 1-MethylXanthine [M-H]- 8.51E-07 2.71 1-MethylXanthine*
5.3 p 357.104 Theobromine+AnhGlu [M+H]+ 6.75E-05 2.43 Theobromine-Glu
5.6 p 200.108 Unknown 1 6.75E-05 2.42
5.8 p
n
n
p
197.068
195.056
180.034
198.071
1,7-Dimethyluric acid [M+H]+
1,7-Dimethyluric acid [M-H]-
1,7-Dimethyluric acid [M+H]+ loss CH3
1,7-Dimethyluric acid [M+H]+ isotope M+1
8.51E-07
6.75E-05
6.75E-05
6.75E-05
2.72
2.42
2.42
2.42
1,7-Dimethyluric
acid*
5.8 p 292.158 Unknown 2 6.75E-05 2.41
7.4 p 243.135 Unknown 3 1.02E-04 2.38
8.4 p 211.146 Cyclo(leucyl-prolyl) [M+H]+ 1.61E-07 2.81 Cyclo(isoleucyl-
prolyl)*
11.3 n
p
p
p
p
p
p
p
p
495.226
520.225
519.221
321.194
322.202
285.187
303.195
257.191
479.199
Actractyligenin-AnhGlu [M-H]-
Actractyligenin-AnhGlu [M+Na]+ isotope
M+1
Actractyligenin-AnhGlu [M+Na]+
Actractyligenin [M+H]+
Actractyligenin [M+H]+ isotope M+1
Actractyligenin [M+H]+ loss 2H2O)
Actractyligenin [M+H]+ loss H2O)
Actractyligenin [M+H]+ loss 2H2O and CO
Actractyligenin-AnhGlu [M+H]+ loss H2O
7.49E-09
8.53E-09
2.95E-08
1.61E-07
6.50E-07
5.90E-07
8.32E-06
1.58E-04
1.77E-04
2.98
2.96
2.90
2.82
2.78
2.75
2.58
2.34
2.33
Actractyligenin-Glu
11.4 p
p
329.186
527.193
Kawheol oxide [M+H]+
Kawheol oxide-AnhGlu [M+Na]+
2.29E-06
7.60E-05
2.66
2.40 Kawheol oxide-Glu
Diterpene metabolite
alkaloid
diketopiperazine alkaloid
* Validated with standard
Rothwell et al., Plos One 2014, 9:e93474

21
BIOMARKERS PERFORMANCE (ROC CURVES)
AUC : 0.9-1 : excellent
0.8-0.9 : good
0.7-0.8 : fair
0.6-0.7 : poor
0.5-0.6 : fail
Atractyligenine glucuronide
Cyclo- (Isoleucyl-prolyl) Trigonelline
AUC: 0.979 AUC: 0.968 AUC: 0.937
Caffeine
AUC: 0.808 AUC: 0.796
Hippuric acid
Rothwell et al., Plos One 2014, 9:e93474

22
BIOMARKERS PERFORMANCE (ROC CURVES)
Cyclo(isoleucyl-prolyl)
1-Methylxanthine
Trigonelline
RO
C C
UR
VE
A
UC
Atractyligenin glucuronide
• Combination of markers
increases performance
• Metabolomics provides
multiple biomarkers
Rothwell et al., Plos One 2014, 9:e93474
• Validation required
(quantitative analysis in
other studies)

23
DATA SHARING FOR BIOMARKER VALIDATION
PhenoMeNEp project
IARC, UCD Dublin Univ Barcelona, Univ Copenhagen, Univ Glasgow, …..
Candidate biomarkers
identified in Study A
Correlation with coffee
intake in all available
studies? Raw data Metadata
• Common data repository with metabolic profiles and food intake data

• Consensus on most needed biomarkers
• Develop databases and bioinformatic tools for identification of
unknowns
• Sharing data and resources (SOPs, chemical standards, samples, raw
data…)
• Databasing biomarkers with a new validation scoring system
24
1ST INTERNATIONAL WORSHOP ON THE FOOD METABOLOME
AND BIOMARKERS FOR DIETARY EXPOSURE (GLASGOW 2013)
Define common objectives and priorities
AJCN 2014, 99(6):1286-1308

• An online database for dietary phytochemicals and their human
metabolites
25
PHYTOHUB
(www.phytohub.eu)
Dietary sources
Known metabolites
Predicted metabolites
Spectral data
Physico-chemical data
Links to other databases
1,000 dietary phytochemicals

26
TOWARDS THE USE OF METABOLIC PROFILES FOR NUTRITIONAL
ASSESSMENT
Cohort studies
Socio-economic data,
Anthropometric data
Dietary habits (FFQ), Lifestyle,
Genotype, Gut microbiota,
Biological and Medical data,
Other phenotypic data…
Food metabolome
profiles
Biobank
samples
Standardized Food Metabolome profiling
(Biomarkers + known bioactives+ others) Diet-Health associations
New food bioactives
Adequacy of dietary behaviour?
Detailed information Actual internal exposures of individuals

27
CONCLUSION
• Nutritional exposures are more complex than what has been
covered so far: many non-nutrients to consider
• The Food metabolome contains a wealth of information that
we are just starting to explore with MS-based metabolomics
• Profiling of urine or plasma metabolomes in interventions or
cohorts studies is efficient to discover new candidate
biomarkers of food intake (data-driven approach)
• International collaboration is essential to move forward
(validation)
• Beyond biomarker discovery, food metabolome profiling in
biofluids may become a new method for nutritional
assessment

ACKNOWLEDGMENTS
Edmonton, Canada
Yoann FILLATRE Joe ROTHWELL Mercedes QUINTANA Bruno CHABANAS Christine MORAND André MAZUR
JRU1019- Human Nutrition Unit Serge HERCBERG Pilar GALAN Mathilde TOUVIER Leopold FEZEU
UREN, Inserm/INRA/CNAM/Paris 13
Estelle PUJOS-GUILLOT Charlotte JOLY Bernard LYAN Jean-François MARTIN Frank GIACOMONI
Craig KNOX Roman EISNER
Citrus department of Florida
French National Agency for
Research
Post-doctoral grant
Fundings

THANK YOU FOR YOUR ATTENTION