biology and ecology
TRANSCRIPT
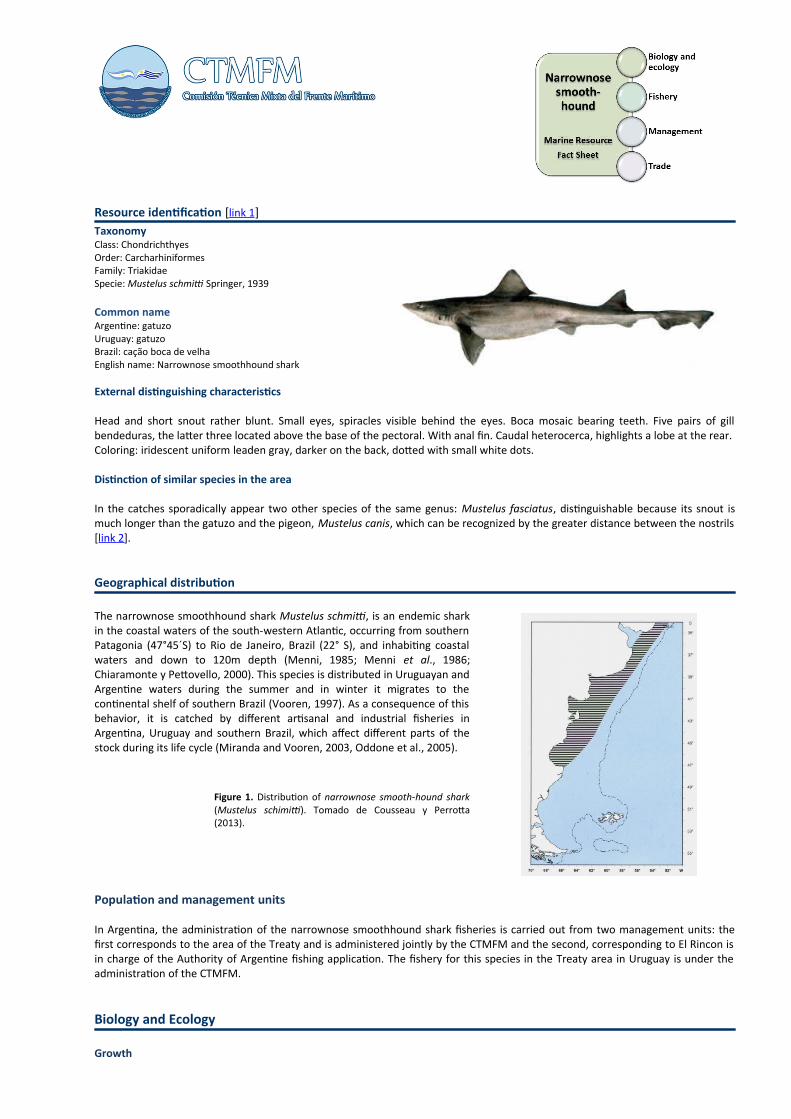
Resource identification [link 1]TaxonomyClass: ChondrichthyesOrder: CarcharhiniformesFamily: TriakidaeSpecie: Mustelus schmitti Springer, 1939
Common nameArgentine: gatuzoUruguay: gatuzoBrazil: cação boca de velhaEnglish name: Narrownose smoothhound shark
External distinguishing characteristics
Head and short snout rather blunt. Small eyes, spiracles visible behind the eyes. Boca mosaic bearing teeth. Five pairs of gillbendeduras, the latter three located above the base of the pectoral. With anal fin. Caudal heterocerca, highlights a lobe at the rear.Coloring: iridescent uniform leaden gray, darker on the back, dotted with small white dots.
Distinction of similar species in the area
In the catches sporadically appear two other species of the same genus: Mustelus fasciatus, distinguishable because its snout ismuch longer than the gatuzo and the pigeon, Mustelus canis, which can be recognized by the greater distance between the nostrils[link 2].
Geographical distribution
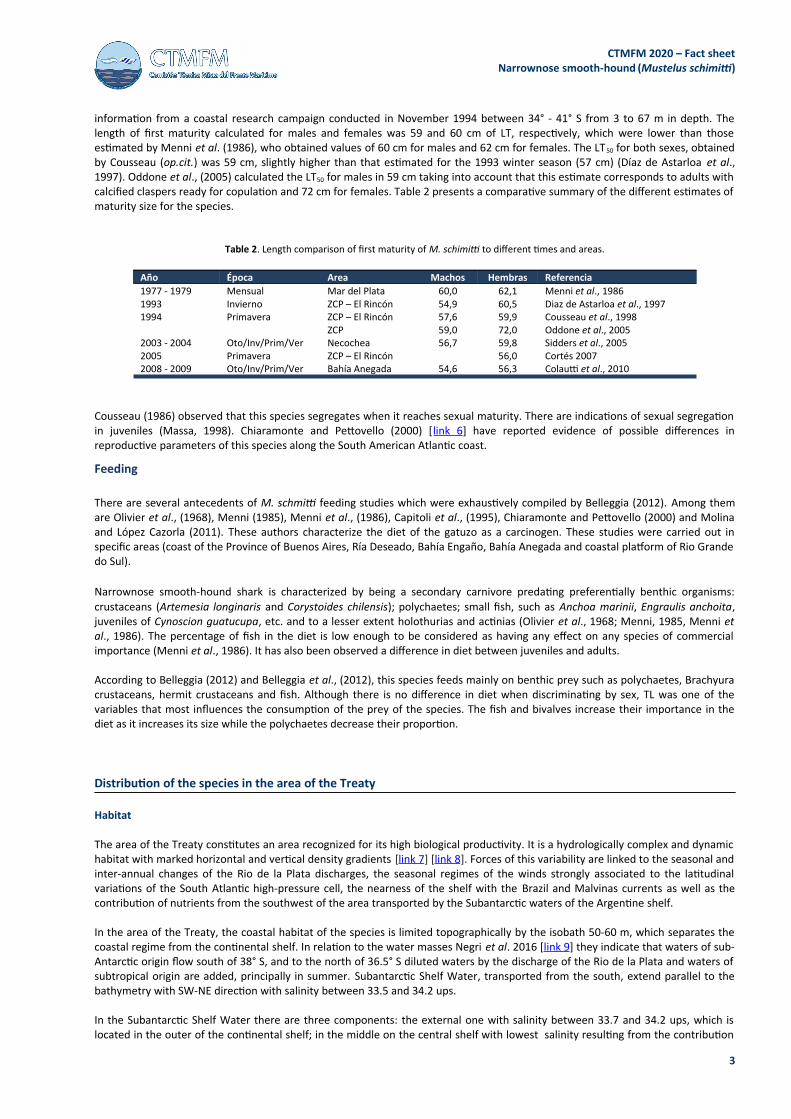
The narrownose smoothhound shark Mustelus schmitti, is an endemic sharkin the coastal waters of the south-western Atlantic, occurring from southernPatagonia (47°45´S) to Rio de Janeiro, Brazil (22° S), and inhabiting coastalwaters and down to 120m depth (Menni, 1985; Menni et al., 1986;Chiaramonte y Pettovello, 2000). This species is distributed in Uruguayan andArgentine waters during the summer and in winter it migrates to thecontinental shelf of southern Brazil (Vooren, 1997). As a consequence of thisbehavior, it is catched by different artisanal and industrial fisheries inArgentina, Uruguay and southern Brazil, which affect different parts of thestock during its life cycle (Miranda and Vooren, 2003, Oddone et al., 2005).
Figure 1. Distribution of narrownose smooth-hound shark(Mustelus schimitti). Tomado de Cousseau y Perrotta(2013).
Population and management units
In Argentina, the administration of the narrownose smoothhound shark fisheries is carried out from two management units: thefirst corresponds to the area of the Treaty and is administered jointly by the CTMFM and the second, corresponding to El Rincon isin charge of the Authority of Argentine fishing application. The fishery for this species in the Treaty area in Uruguay is under theadministration of the CTMFM.
Biology and Ecology
Growth

CTMFM 2020 – Fact sheetNarrownose smooth-hound (Mustelus schimitti)
The growth parameters for this species were estimated through the analysis of vertebrae deposition ring readings from specimenscollected in research surveys (Hozbor et al., 2010), landing samples in the south of Buenos Aires Province (Molina et al., 2010) andthe San Matías Gulf (Bernasconi, 2019).
Estimates of sexual maturity range from 4 years (LT50%: 55 cm) (Hozbor et al., 2010), 5.60 years (LT50%: 66.99 cm) Bernasconi,2019) and 6.79 years (LT50%: 54.6 cm) (Molina et al., 2017) in males and between 4.6 (LT50%: 56 cm) (Hozbor et al., 2010), 5.58years (LT50%: 66.89 cm ) and 7.61 years (LT50%: 56.3 cm LT) in females (Molina et al., 2017).
Recently, Cortés (2007) calculated the intrinsic population growth rate (r) using a matrix model structured by size stages. He dividedthe population into 4 size stages taking into account the life history of the species: 1) hatchlings (LT < 37 cm: were separated fromjuveniles because they would remain in defined breeding areas); 2) juveniles (37 to 56 cm LT: individuals that did not reach LT 50); 3)small pregnant adult females (56 to 75 cm LT); 4) large pregnant adult females (LT > 75 cm). The author determined an r-value of0.175 when the M. schmitti population is not subjected to exploitation, resulting in an average growth in the number of individualsof 19.1% per year. Cortés concluded that these estimated r-values indicate that this species could withstand higher levels ofexploitation than other coastal sharks distributed between 34° 30`S - 42° S.
Mortality
The natural mortality rate (M) values for M. schimitti were estimated by Cortés (op.cit.) using several methodologies, includingPauly (1980), Jensen (1996) and Chen and Watanabe (1989). The results obtained are presented in Table 1.
Table 1. Instantaneous rate of natural mortality of Mustelus schmitti between 34° 30 and 42° S.
Metodología M
Pauly (1980)
Estimación de M a partir de los parámetros decrecimiento de von Bertalanffy y latemperatura media del ambiente (16°C).
0,320
Jensen (1996)
Se utilizaron tres ecuación que estiman M apartir de la edad de madurez y del parámetroK de von Bertalanffy.
0,412
0,165
0,176
Chen y Watanabe (1989)
Estimación de M a partir de los parámetros decrecimiento de von Bertalanffy. Este métodopermite realizar estimaciones de M porestadios, para lo cual se promediaron las M delas edades que componen cada estadio
Neonatos 0,405
Hembras juveniles 0,271
Hembras adultas chicas 0,184
Hembras adultas grandes 0,139
Reproduction
This species is considered as viviparous (ovoviviparous) of non placental type with compartments formation. This species presentsan annual sexual cycle. Females have partitioned into chambers the uterus an embryo finding each, inside the uterus a certainamount of liquid probably plays a role of nutrition shown. It has been observed that the yolk sac is reabsorbed in the early stages ofgestation (Menni et al., 1986 [link 3], Menni 1985).
The birth of the young occurs from the end of November until the end of December. Afterwards, they are fertilized and thegestation is recommenced, which takes between eleven and twelve months. Oddone et al., (2005) [link 4] observed a maximum TLof 26 cm of the offspring at birth in the ZCP. Similar values (24 - 28 cm) were recorded by Figueiredo (1977) and Chiaramonte andPettovello (2000) for southern Brazil and Argentina respectively. The number of embryos varies between 1 and 13 per femalealthough the most frequent is 4. This is directly related to the size of the females, as the size decreases the number of embryos islower (Menni et al., 1986, Cousseau et al., 1998, Oddone et al., 2005). Oddone (op.cit.) observed that this size varied from 1 to 10in spring and from 2 to 9 in autumn, with embryos that oscillated between 9 and 26 cm and 7 to 26 cm LT, respectively. The meanTL of the embryos was significantly higher in the spring (22 cm).
The size at maturity of M.schimtti was estimated by several authors in its distribution area between 34° 30' - 42° S. Among them, acomparative analysis by time and area in different years carried out by Cousseau et al., (1998) [link 5]. The authors examined
2
CTMFM 2020 – Fact sheetNarrownose smooth-hound (Mustelus schimitti)
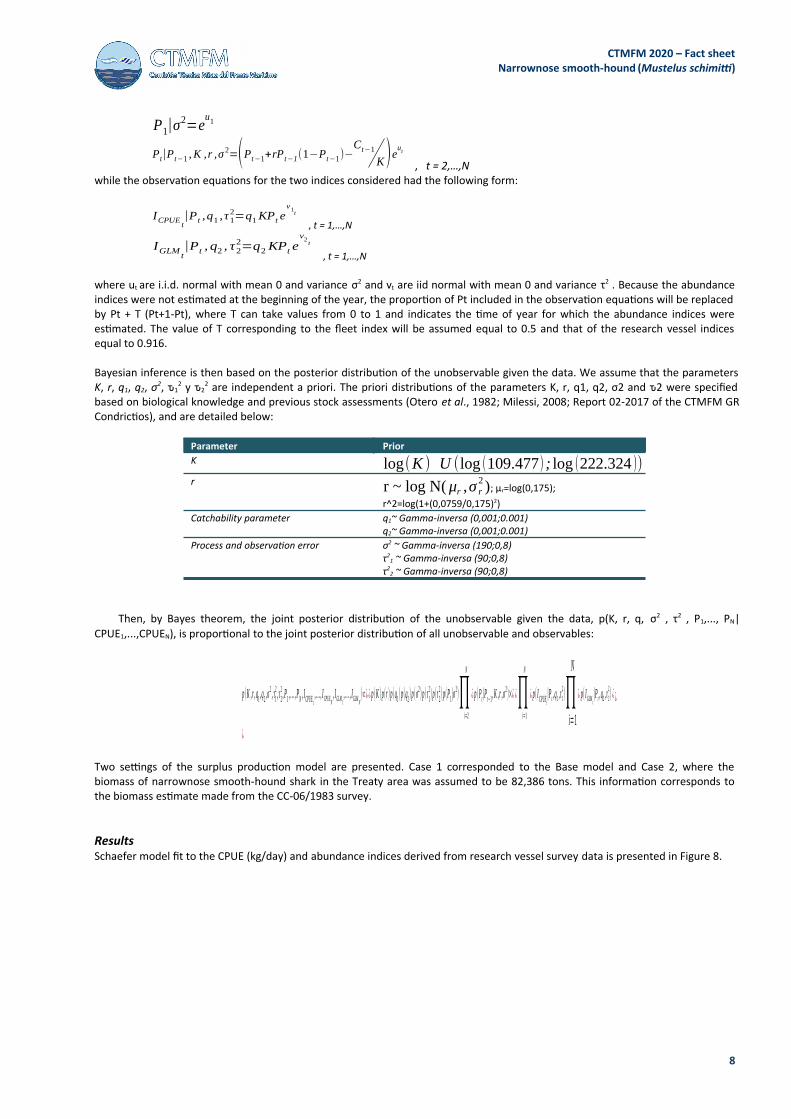
information from a coastal research campaign conducted in November 1994 between 34° - 41° S from 3 to 67 m in depth. Thelength of first maturity calculated for males and females was 59 and 60 cm of LT, respectively, which were lower than thoseestimated by Menni et al. (1986), who obtained values of 60 cm for males and 62 cm for females. The LT50 for both sexes, obtainedby Cousseau (op.cit.) was 59 cm, slightly higher than that estimated for the 1993 winter season (57 cm) (Díaz de Astarloa et al.,1997). Oddone et al., (2005) calculated the LT50 for males in 59 cm taking into account that this estimate corresponds to adults withcalcified claspers ready for copulation and 72 cm for females. Table 2 presents a comparative summary of the different estimates ofmaturity size for the species.
Table 2. Length comparison of first maturity of M. schimitti to different times and areas.
Año Época Area Machos Hembras Referencia1977 - 1979 Mensual Mar del Plata 60,0 62,1 Menni et al., 19861993 Invierno ZCP – El Rincón 54,9 60,5 Diaz de Astarloa et al., 19971994 Primavera ZCP – El Rincón 57,6 59,9 Cousseau et al., 1998
ZCP 59,0 72,0 Oddone et al., 20052003 - 2004 Oto/Inv/Prim/Ver Necochea 56,7 59,8 Sidders et al., 20052005 Primavera ZCP – El Rincón 56,0 Cortés 20072008 - 2009 Oto/Inv/Prim/Ver Bahía Anegada 54,6 56,3 Colautti et al., 2010
Cousseau (1986) observed that this species segregates when it reaches sexual maturity. There are indications of sexual segregationin juveniles (Massa, 1998). Chiaramonte and Pettovello (2000) [link 6] have reported evidence of possible differences inreproductive parameters of this species along the South American Atlantic coast.
Feeding
There are several antecedents of M. schmitti feeding studies which were exhaustively compiled by Belleggia (2012). Among themare Olivier et al., (1968), Menni (1985), Menni et al., (1986), Capitoli et al., (1995), Chiaramonte and Pettovello (2000) and Molinaand López Cazorla (2011). These authors characterize the diet of the gatuzo as a carcinogen. These studies were carried out inspecific areas (coast of the Province of Buenos Aires, Ría Deseado, Bahía Engaño, Bahía Anegada and coastal platform of Rio Grandedo Sul).
Narrownose smooth-hound shark is characterized by being a secondary carnivore predating preferentially benthic organisms:crustaceans (Artemesia longinaris and Corystoides chilensis); polychaetes; small fish, such as Anchoa marinii, Engraulis anchoita,juveniles of Cynoscion guatucupa, etc. and to a lesser extent holothurias and actinias (Olivier et al., 1968; Menni, 1985, Menni etal., 1986). The percentage of fish in the diet is low enough to be considered as having any effect on any species of commercialimportance (Menni et al., 1986). It has also been observed a difference in diet between juveniles and adults.
According to Belleggia (2012) and Belleggia et al., (2012), this species feeds mainly on benthic prey such as polychaetes, Brachyuracrustaceans, hermit crustaceans and fish. Although there is no difference in diet when discriminating by sex, TL was one of thevariables that most influences the consumption of the prey of the species. The fish and bivalves increase their importance in thediet as it increases its size while the polychaetes decrease their proportion.
Distribution of the species in the area of the Treaty
Habitat
The area of the Treaty constitutes an area recognized for its high biological productivity. It is a hydrologically complex and dynamichabitat with marked horizontal and vertical density gradients [link 7] [link 8]. Forces of this variability are linked to the seasonal andinter-annual changes of the Rio de la Plata discharges, the seasonal regimes of the winds strongly associated to the latitudinalvariations of the South Atlantic high-pressure cell, the nearness of the shelf with the Brazil and Malvinas currents as well as thecontribution of nutrients from the southwest of the area transported by the Subantarctic waters of the Argentine shelf.
In the area of the Treaty, the coastal habitat of the species is limited topographically by the isobath 50-60 m, which separates thecoastal regime from the continental shelf. In relation to the water masses Negri et al. 2016 [link 9] they indicate that waters of sub-Antarctic origin flow south of 38° S, and to the north of 36.5° S diluted waters by the discharge of the Rio de la Plata and waters ofsubtropical origin are added, principally in summer. Subantarctic Shelf Water, transported from the south, extend parallel to thebathymetry with SW-NE direction with salinity between 33.5 and 34.2 ups.
In the Subantarctic Shelf Water there are three components: the external one with salinity between 33.7 and 34.2 ups, which islocated in the outer of the continental shelf; in the middle on the central shelf with lowest salinity resulting from the contribution
3

CTMFM 2020 – Fact sheetNarrownose smooth-hound (Mustelus schimitti)
of diluted waters by continental runoff in the south of the continent; and the coastal one with relatively high salinity values (S> 33.8ups), coming from the east of El Rincon and originating in the interior of the Golfo San Matías due to the effect of restrictedcirculation and the predominance of evaporation over local precipitation. The Subtropical waters present are the Tropical Waterand the South Atlantic Central Water, transported to the south by the Brazil current, which predominate during the summer andautumn. The Rio de la Plata water is mixed with continental shelf waters, forming a low - salinity layer over the Subantarctic andSubtropical Water, induces a high vertical stratification, isolating the deep layer.
The topography, together with the contributions of continental water and the modifications due to the exchange with theatmosphere, generate a complex ecological and oceanographic system. In the Rio de la Plata, the Barra del Indio constitutes ageomorphological barrier that divides the area internal and external. The internal corresponds with the river discharge and theexternal to a mixohaline regime where the intrusion of shelf water along the bottom, in the form of a salt wedge, generates a two-layered structure with a strong vertical stratification that decreased towards the outside of the Rio de la Plata. The interfacesbetween the mentioned regimes originate two salinity fronts, the bottom one as the boundary between the fluvial regime and themixohaline, and the surface one as the boundary between the mixohaline regime and the shelf waters.
The entrance to the platform of the diluted water of the Rio de la Plata and its seasonal variation influences the shelf ecosystemmodifying the physical-chemical properties of the area, the concentration of nutrients and the biological productivity. Thedistribution of surface salinity varies seasonally and is forced by winds and continental discharge. In autumn-winter the winds arecontinental and fresh water discharge reaches maximum values. In that period, there is a drift of water coming from the dischargeof the Rio de la Plata in the northeast direction along the Uruguay coast. In spring summer, they show an extension in south-easterly direction, towards the Argentina coast, as a consequence of the oceanic winds and a minimum in the continentaldischarge. There are also areas whose waters are locally modified by continental contributions, which promote the formation offronts in the coastal littoral, of importance due to their biological implications.
Areas of concentration and size structure
Cousseau (1986) and Cousseau et al. (1998) identified between December and March two concentrations of juveniles ofnarrownose smooth-hound shark in shallow waters, one in the north, in front of Cabo San Antonio (36° 20'S) and the other in ElRincón (39° and 41° S). The Uruguay coastal is characterized by the presence of adults to the north, outside the area of influence ofthe Río de la Plata and its presence decreases to the south at greater depth. In the intermediate region, between Necochea andMar Chiquita, medium-sized adults (66 cm approximately) were found in both autumn and spring research vesell (Cousseau 1986,Massa et al., 2004).
During the winter the species is concentrated in the area near the 50 m isobath. Díaz de Astarloa et al., (1997) determined thatjuveniles predominate in winter in El Rincon and ZCP, while in late spring (November - December) both sexes gather in the coastalarea to reproduce. During the rest of the year they tend to form small groups with dominance of males or females. Massa et al.,(2004) conclude that the length distribution and the sex ratio of the species in the different areas respond to the reproductivemovements: the adults arrive at the coast in the late spring, mainly to the two concentration areas already mentioned. Then theadults migrate to deeper areas and the juveniles remain in coastal areas. This behavior was also observed by Cousseau (1986).
The abundance of neonates (40 cm TL) it is observed that decrease from shallow coastal waters to deeper marine waters. Juvenilesare associated with middle conditions, while adults with salty and deeper sea waters with an increasing size (Cortés et al., 2011)[link 10]. The adult stage also presents different environmental associations related to size, mainly associated with depth andtemperature. Larger adults were associated with the deeper coastal waters during winter, which coincides with the period (autumnwinter) of greatest abundance in the waters of the outer platform (between 50 and 130 m deep) (Fig. 2). The observedpredominance of neonates and juveniles in coastal waters, and larger individuals in waters of the outer shelf (Oddone et al., 2005),indicates that the size class distribution patterns of M. schmitti seem to be associated with ontogenetic movements from breedingareas to deeper waters through development. Although adults show a general spatial pattern related to body size, there is evidenceof sexual segregation (Cousseau 1986).
4

CTMFM 2020 – Fact sheetNarrownose smooth-hound (Mustelus schimitti)
El Rincón
Río de la Plata
Proporción de machos
Frec
uenc
ia r
elati
va
Clase de longitud total
INVIERNO
El Rincón
Río de la Plata
Proporción de machos
Frec
uenc
ia r
elati
va
Clase de longitud total
PRIMAVERA
Figure 2. Abundance distribution by sex and TL and proportion of Mustelus schmitti in Rio de la Plata and El Rincon during winter and spring. Thesolid lines represent the females and the dashed lines represent the males. The bars represent the proportion of males for each length class.Modified by Cortés et al., (2011).
Oddone et al., (2005, 2007) [link 11] with information from coastal research survey carried out in spring and summer in the ZCPobserved that, in the spring, both sexes occurred at depths of less than 50 m in the whole area. The mature females were locatednorth of 35° 30'S while the males were in the whole area (Figure 3). The summer campaign showed a discontinuous distribution ofthe species throughout the study area that resulted in a spatial segregation of two groups with predominance of immature femalesin both. Mature females were identified only north of 35° 30'S while mature males predominated to a large extent in both groups(Figure 3).
Machos Hembras
Primavera
Verano
Figure 3. Distribution and density of males (▲) (A) and females (○) (B) of Mustelus schmitti in the ZCP (spring and summer). Immature and matureindividuals are represented by empty and complete symbols, respectively. The sizes of the symbol correspond with densities of 500, up to 3,000and more than 3,000 number of individuals/mn2. Modified Oddone et al., (2007).
Fishery
The narrownose smooth-hound shark (Mustelus schmitti), along with the angular angel shark (Squatina guggenheim) and the rays(family Rajidae) are the most exploited chondrichthyan in the area of the Treaty of the Rio de la Plata and its Maritime Front. Fromthe coast to the 50 m isobath they are captured mainly by the Argentine industrial fleet as part of the multispecific demersal fisheryknown as "variado costero" and by the Uruguayan fleet (Category B) (Fig. 4). At depths greater than 50 m, chondrichthyans mostexploited are skates, captured mainly by the fleets of both countries targeting Argentine hake (Merluccius hubbsi).
5

CTMFM 2020 – Fact sheetNarrownose smooth-hound (Mustelus schimitti)
Montevideo
Pta. del
Este
BuenosAires
Mar delPlata
Quequén
FaroQuerandi
50° O51° O52° O53° O54° O55° O56° O57° O58° O59° O60° O
33° S
34° S
35° S
36° S
37° S
38° S
39° S
40° S
41° S
R.Costero
R.Altura
Figure 4. Fishing quadrant in the study area.
This specie is the most landed shark in Argentine ports. Inhabits the South West Atlantic waters up to 47° 45'S, in coastal areas upto 120 m deep. The Argentine fishery of narrownose smooth-hound shark registers important landings the decade of 1960 (> 8,000t), surpassing in 1973 the 9,000 and reaching in 1988 a peak of 13,500 t. Between 1992 and 1999, the total Argentine landings,which include catches made in the ZCP, adjacent coastal areas and EEZs south of 39 ° S, reached values very close to or exceeded10,000 t.
In the ZCP, the maximum landing value in Argentina corresponded to 2008, where it exceeded 4,500 tons. In subsequent years,there has been a sustained decrease until reaching the value of 1,585 tons in 2017 (Figure 5). Subsequently, the catch rises slightlyin the order of 1,700 tons in 2019. As regards the Uruguayan fleet, in 2000 and 2001 the maximum values were recorded (1,000tons), decreasing progressively until reaching the minimum in 2019 with 152 tons. In the ZCP, the fishing of narrownose smooth-hound shark is carried out throughout the year without a clear seasonality (Figure 6).
Figura 5. Catch of narrownose smooth-hound shark in the area of the Treaty landed by Argentina and Uruguay.
Figure 6. Monthly variation in narrownose smooth-hound shark landings from the ZCP between 2010 and 2019.
Relative abundance indices
In order to have abundance index of Mustelus schmitti, a compilation of previously estimated indices was carried out based on datafrom the fishery statistics and research vessel surveys in the coastal region (depths less than 50 m) of the area of the Treaty, thosethat are in different degree of development (Figure 7).
6

CTMFM 2020 – Fact sheetNarrownose smooth-hound (Mustelus schimitti)
Índi
ce fl
ota
arge
ntina
0
0.1
0.2
0.3
0.4
0.5
0.6
0.7
1992 1995 1998 2001 2004 2007 2010 2013 2016 2019
CPU
E (t
/dia
)Indice flota argentina Period 1992 - 2019.
Data from vessels with a length between18 and 25 m.
Índi
ces
cam
paña
s
1994
19981999
20032005
2013
2019
0
0.5
1
1.5
2
2.5
3
IGLM
(t/m
n2)
Indice Campañas estandarizado
Abundance indice derived from INIDEP research vessel surveys.
Estimate from a Delta model with a stratified sampling design (IGLM),
1992
1993
19941995
20012002
20062007
20082011
20122015
2016
20170
1
2
3
4
5
6
IGLM
(t/m
n2)
Indice Campañas nomimal
Abundance indice derived from DINARA research vessel surveys.
Mean density average (INOM).
Figure 7. Abundance indices applied to M. schmitti stock assessment in the Treaty area.
Status of fishery resource
Surplus production model
The surplus production model (Schaefer, 1954) was used to determine indicators of stock productivity. The parameters of themodel, its uncertainty and the performance indicators of the management strategy were estimated with Bayesian methods.
Bayesian nonlinear state–space model
The Bayesian statistics require the use of a likelihood function L(data|θi), the probability of obtaining data under theassumption that they are generated by a model containing parameters θi as in frequentist statistics. The key aspect of Bayesiananalysis is the use of prior probabilities p(θi). Prior probabilities allow for introducing information from expert judgment and fromformer data, prior to obtaining the actual set of data, and for characterizing uncertainty in the unknowns with the use of probabilitydistributions for them. The prior distribution is updated by the data in Bayes theorem in order to compute the posterior probability,probability that a given state of nature i is true conditioned on the data P(θi|data). A state of nature is one potential realisation ofthe set of all possible values for θi.
P (θ|datos )αP (datos|θ)P (θ)
The incorporating uncertainty in the natural variability underlying the annual biomass dynamics transitions (process error) anduncertainty in the observed abundance indices due to measurement and sampling error (observation error) is possible calculateusing a state–space model (Meyer and Millar, 1999). State–space models relate times series observations {CPUEt} to unobserved“states” {Bt} through a stochastic observation model for CPUEt given Bt. The states are assumed to follow a stochastic transitionmodel. We assumed lognormal error structures and used a reparametrization (Pt = Bt/K) by expressing the annual biomass as aproportion of carrying capacity as in Millar and Meyer (1999a) to speed mixing (i.e., sampling over the support of the posteriordistribution) of the Gibbs sampler. The model was fit by abundance indice derived from research vessel surveys and CPUE data. Thestate equations are rewritten as:
7
CTMFM 2020 – Fact sheetNarrownose smooth-hound (Mustelus schimitti)
P1|σ2=e
u1
Pt|Pt−1 , K ,r ,σ2=(Pt−1+rP t−1(1−Pt−1)−
Ct−1
K)eut , t = 2,…,Nwhile the observation equations for the two indices considered had the following form:
ICPUEt|P t ,q1 , τ1
2=q1KPt ev1t
, t = 1,…,N
IGLMt|Pt , q2 , τ2
2=q2KPt ev2t
, t = 1,…,N
where ut are i.i.d. normal with mean 0 and variance σ2 and vt are iid normal with mean 0 and variance τ2 . Because the abundanceindices were not estimated at the beginning of the year, the proportion of Pt included in the observation equations will be replacedby Pt + T (Pt+1-Pt), where T can take values from 0 to 1 and indicates the time of year for which the abundance indices wereestimated. The value of T corresponding to the fleet index will be assumed equal to 0.5 and that of the research vessel indicesequal to 0.916.
Bayesian inference is then based on the posterior distribution of the unobservable given the data. We assume that the parametersK, r, q1, q2, σ2, ԏ1
2 y ԏ22 are independent a priori. The priori distributions of the parameters K, r, q1, q2, σ2 and ԏ2 were specified
based on biological knowledge and previous stock assessments (Otero et al., 1982; Milessi, 2008; Report 02-2017 of the CTMFM GRCondrictios), and are detailed below:
Parameter PriorK log(K ) U (log (109.477) ; log (222.324 ))r r ~ log N( μr ,σ r
2 ); μr=log(0,175); r^2=log(1+(0,0759/0,175)2)
Catchability parameter q1~ Gamma-inversa (0,001;0.001)q2~ Gamma-inversa (0,001;0.001)
Process and observation error σ2 ~ Gamma-inversa (190;0,8)τ2
1 ~ Gamma-inversa (90;0,8)τ2
2 ~ Gamma-inversa (90;0,8)
Then, by Bayes theorem, the joint posterior distribution of the unobservable given the data, p(K, r, q, σ2 , τ2 , P1,..., PN|CPUE1,...,CPUEN), is proportional to the joint posterior distribution of all unobservable and observables:
p (K ,r , q1 ,q2 ,σ2 , τ1
2 , τ 22 , P1 , . . . , PN , ICPUE 1 , . . . , ICPUEN , IGLM1 , . . . , IGLM N
)∝¿ ¿ p (K ) p (r ) p (q1 ) p (q2 ) p (σ2 ) p (τ1
2) p (τ 22 ) p (P1|σ
2)∏ ¿
i=2
N
p (Pt|Pt−1 , K ,r ,σ2)׿ ¿∏ ¿
i=1
N
p ( ICPUE t|P t ,q1 , τ12 )∏ ¿
i=1
N
p( IGLM t|Pt ,q2 , τ2
2 ) ¿
¿
¿
Two settings of the surplus production model are presented. Case 1 corresponded to the Base model and Case 2, where thebiomass of narrownose smooth-hound shark in the Treaty area was assumed to be 82,386 tons. This information corresponds tothe biomass estimate made from the CC-06/1983 survey.
ResultsSchaefer model fit to the CPUE (kg/day) and abundance indices derived from research vessel survey data is presented in Figure 8.
8

CTMFM 2020 – Fact sheetNarrownose smooth-hound (Mustelus schimitti)
-Figura 8. Catch-per-unit-effort (CPUE) indices of abundance CPUE (Kg/day), abundance indices (IGLM kg/mn2) and INOM (kg/mn2) observed (crosses)and predicted (solid line).
Starting in 2004, the total biomass estimated by the model would be below the RBP, while the catch fell in 2015 below the MSY(Figure 9). Table 3 shows the model parameter estimates and the resource productivity indicators.
Table 3. Parameter estimated Surplus Model: K carrying capacity, r rate of growth. MSY: Maximum sustainable yield, CR2020: replacement yield,stock biomass giving MSY (BMSY), B2019, biomass estimated to 2019, B2019/BMSY: ratio of final-year biomass to biomass at MSY, B2019/K: ratio of final-year biomass to carrying capacity, FMSY fishing mortality rate at MSY.
Case 1 Case 2r 0.076 0,124K 152.824 150.014
MSY 2.949 4.705CR 2020 1.865 2.275B0 153.473 83.003B2020 30721 21.416BRMS 76.412 75.007B0/K 1.003 0.553B2020/K 0.200 0.142B2019/BMSY 0.428 0.301FMSY 0.038 0.062F2019 0.066 0.093F2019/FMSY 1.749 1.552
0
2000
4000
6000
8000
10000
12000
0
20000
40000
60000
80000
100000
120000
140000
160000
180000
1983 1988 1993 1998 2003 2008 2013 2018
Capt
ura
dese
mba
rcad
a (t
)
Biom
asa
Tota
l (t)
Captura
BT Caso 1
BT Caso 2
Figure 9. Trends of total biomass and catch (tons).
9

CTMFM 2020 – Fact sheetNarrownose smooth-hound (Mustelus schimitti)
The Kobe plot indicated that the biomass of narrownose smooth-hound shark would be at a sub-optimal level of biomass and thatthe fishing mortality rate would be higher than the optimum for the two cases analyzed (Figure 10). The analysis of the situation forthe year 2019 showed that the risk of biomass being below the PBRL is 77% and 99% for case 1 and 2 respectively (Figure 10).
Figure 10. Kobe plot. Trend and current status of the Mustelus schimitti.
Biomass projectionsProjections at constant catch indicated that in Case 1 the risk condition associated with the PBRL would be reached with an annualcatch of 700 tons (Figure 11). For Case 2, the catch level to reach the risk condition associated with PBRO was 375 tons, while thecatch value that would allow meeting the condition associated with PBRL was 1,100 tons (Figure 11).
Figure 11. Projections of the total biomass carried out in constant catch scenarios
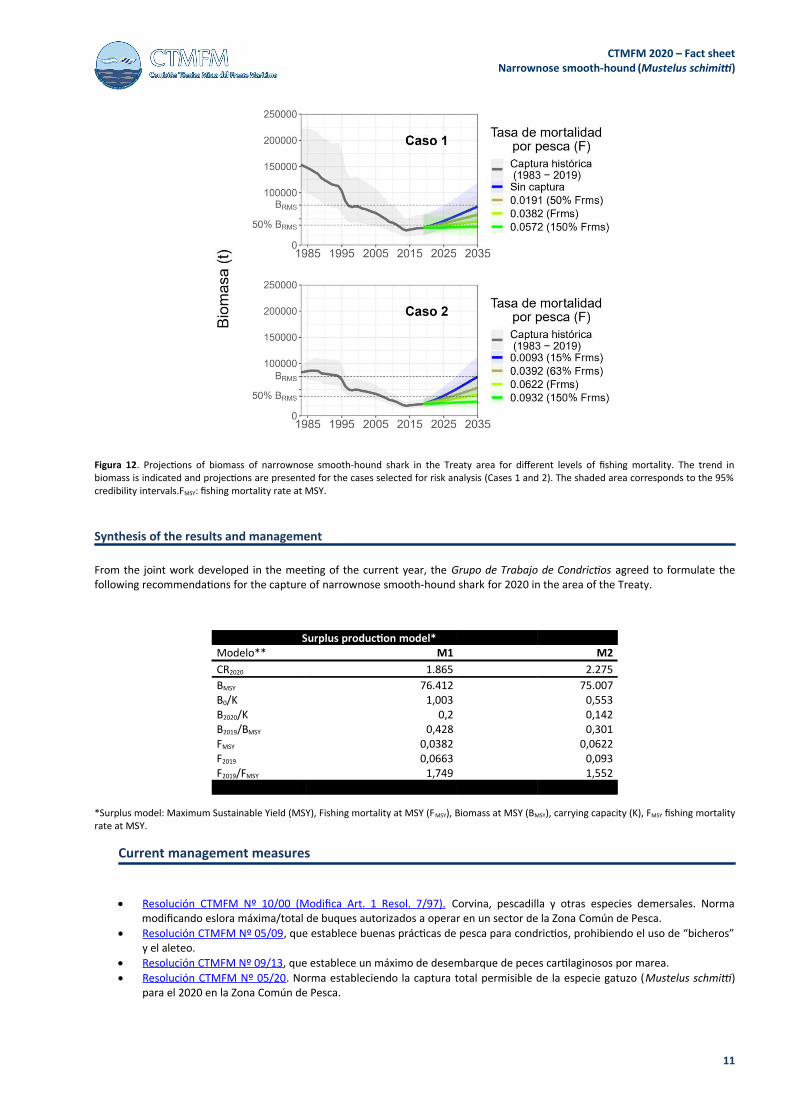
Projections with different constant fishing mortality rates (F) indicated that for Case 1 it is not possible to reach the risk statusassociated with PBRO, in the long term, even without fishing mortality. Recovery of biomass to meet the risk condition associatedwith PBRO would be achieved by applying an F equivalent to 50% of MSY (Figure 12). In case 2, the condition associated to PBROwould be achieved with a fishing mortality rate of 15% of F MSY, while that associated to PBRL would be reached with an F equivalentto 63% of FMSY (Figure 12).
10
CTMFM 2020 – Fact sheetNarrownose smooth-hound (Mustelus schimitti)
Figura 12. Projections of biomass of narrownose smooth-hound shark in the Treaty area for different levels of fishing mortality. The trend inbiomass is indicated and projections are presented for the cases selected for risk analysis (Cases 1 and 2). The shaded area corresponds to the 95%credibility intervals.FMSY: fishing mortality rate at MSY.
Synthesis of the results and management
From the joint work developed in the meeting of the current year, the Grupo de Trabajo de Condrictios agreed to formulate thefollowing recommendations for the capture of narrownose smooth-hound shark for 2020 in the area of the Treaty.
Surplus production model*Modelo** M1 M2CR2020 1.865 2.275BMSY 76.412 75.007B0/K 1,003 0,553B2020/K 0,2 0,142B2019/BMSY 0,428 0,301FMSY 0,0382 0,0622F2019 0,0663 0,093F2019/FMSY 1,749 1,552
*Surplus model: Maximum Sustainable Yield (MSY), Fishing mortality at MSY (FMSY), Biomass at MSY (BMSY), carrying capacity (K), FMSY fishing mortalityrate at MSY.
Current management measures
Resolución CTMFM Nº 10/00 (Modifica Art. 1 Resol. 7/97). Corvina, pescadilla y otras especies demersales. Normamodificando eslora máxima/total de buques autorizados a operar en un sector de la Zona Común de Pesca.
Resolución CTMFM Nº 05/09 , que establece buenas prácticas de pesca para condrictios, prohibiendo el uso de “bicheros”y el aleteo.
Resolución CTMFM Nº 09/13 , que establece un máximo de desembarque de peces cartilaginosos por marea. Resolución CTMFM Nº 05/20 . Norma estableciendo la captura total permisible de la especie gatuzo (Mustelus schmitti)
para el 2020 en la Zona Común de Pesca.
11

CTMFM 2020 – Fact sheetNarrownose smooth-hound (Mustelus schimitti)
Trade
Argentine exports of narrownose smooth-hound shark in the 2013-2019 periods have averaged 139 tons with a maximum of 206tons in 2014 and a minimum of 75 tons in 2018. The percentage of this specie in the total of exports of fishery products did notexceed 0.05% in the period considered (Fig. 14). In 2019 the export of this species will increase to 114 tons.
The average price per ton of the Argentine exports of narrownose smooth-hound shark decreased between 2013 and 2017,reaching in those years values, expressed in US dollars (USD) FOB, of 5,051 and 4,439, respectively. In 2018, although it increased to6,747, this indicator decreased in 2019 to 4,678. In 2013, exports value was USD 959,000, equivalent to 0.04% of total exports offishery products, while in 2019 the narrownose smooth-hound shark exports (USD 545,000) contributed 0.03% to total exports.
0
50000
100000
150000
200000
250000
300000
2013 2014 2015 2016 2017 2018 2019
Volu
men
tota
l exp
orta
do (t
)
Gatuzo Otros pecesCrustaceos MoluscosOtros productos pesqueros
Figure13. Narrownose smooth-hound shark. Contribution to total volume (tons) of fishery products exported by Argentina between 2011 and 2019.
The main destinations of the Argentine exports of narrownose smooth-hound shark in 2019 were China RAE Hong Kong, Thailand,Indonesia and Italy, which together account for almost 89% of the total exported (Fig. 14). The export volumes, price anddestination of each of these products vary as indicated in the report prepared by the Dirección de Economía Pesquera de la SSPyAof Argentina. Thus, for example, the dry fin narrownose smooth-hound shark was exported mainly to China RAE Hong Kong (29tons at an average price of USD 5,270) while frozen meat was exported to Singapore (13 tons, average price USD 943).
China RAE Hong Kong
29 t
Tailandia14 t
Singapur35 t
Italia26 t
Brasil9 t
Malasia4 t
Figure 15. Main export destinations in 2019 of Argentina. Narrownose smooth-hound shark
References
12
CTMFM 2020 – Fact sheetNarrownose smooth-hound (Mustelus schimitti)
Belleggia, M. 2012. Ecología Trófica del gatuzo, Mustelus schmitti (Springer1939), en el Mar Argentino. Tesis Doctoral. Facultad de Ciencias Exactas yNaturales. Universidad Nacional de Mar del Plata. 228 p.
Belleggia, M., D.E. Figueroa y F. Sánchez. 2012. The feeding ecology of Mustelus schmitti in the southwestern Atlantic: geographic variations anddietary shifts. Environ Biol Fish. Vol 95, Issue 1: 99–114.
Capitoli R.R., M.L. Ruffino y C.M. Vooren. 1995. Alimentação do tubarão Mustelus schmitti Springer na plataforma costeira do estado do Rio Grandedo Sul, Brasil. Atlántica 17: 109–122.
Chiaramonte G.E. y A.D. Pettovello. 2000. The biology of Mustelus schmitti in southern Patagonia, Argentina. Journal of Fish Biology 57: 930–942.
Cortés F 2007. Sustentabilidad de la explotación del gatuzo Mustelus schmitti, en el ecosistema costero bonaerense (34 - 42°S). Tesis deLicenciatura, Universidad Nacional de Mar del Plata, Argentina, 37 pp.
Cortés F., A.J. Jaureguizar, R.C. Menni y R. A. Guerrero.2011. Ontogenetic habitat preferences of the narrownose smooth-hound shark, Mustelus
schmitti, in two Southwestern Atlantic coastal areas. Hydrobiologia, 661:445–456
Cousseau, M.B. 1986. Estudios biológicos sobre peces costeros con datos de dos campañas de investigación realizadas en 1981. VI. El gatuzo(Mustelus schmitti). Publ.Com.Téc.Mix.Fr.Mar., 1 (1): 60-65.
Cousseau, M.B., C.R. Carozza y G.J. Macchi. 1998. Abundancia, reproducción y distribución de tallas del gatuzo ( Mustelus schmitti). En: Resultadosde una Campaña de Evaluación de Recursos Demersales Costeros de la Provincia de Buenos Aires y del Litoral Uruguayo (Lasta C.A. ed.).INIDEP Informe Técnico Nº 21, 103-115.
Cousseau, M.B. y R.G. Perrotta. 2013. Peces marinos de Argentina: biología, distribución, pesca. Mar del Plata, Instituto Nacional de Investigación yDesarrollo Pesquero INIDEP. 193 pp.
Díaz de Astarloa, J.M., C.R. Carozza, R.A. Guerrero, A.G. Baldoni y M.B. Cousseau. 1997. Algunas características biológicas de peces capturados enuna campaña costera invernal en 1993, en el área comprendida entre 34ºS y 42°S (Atlántico Sudoccidental) y su relación con las condicionesambientales. INIDEP Informe Técnico Nº 14, 35p.
Figueiredo J.L. 1977. Manual de peixes marinhos do Sudeste do Brasil. Introdução: caçoes, raias e quimeras. São Paulo: Museu de Zoologia daUniversidade de São Paulo, 1977. 104 p.
Hozbor N.M., Saez M. y Massa A.M. 2010. Edad y crecimiento de Mustelus schmitti (gatuzo),en la región costera bonaerense y uruguaya. Informe de Investigación INIDEP Nº 49, 15 p.
Massa, A.M. 1998. Estructura poblacional del gatuzo (Mustelus schmitti) en la costa bonaerense y uruguaya asociado a condiciones ambientales.Tesis de Licenciatura. Universidad Nacional de Mar del Plata.
Massa A.M., C.A. Lasta y C.R. Carozza. 2004. Estado actual y explotación del gatuzo Mustelus schmitti. En: Sánchez R & Bezzi S (eds) El Mar Argentinoy sus recursos pesqueros. Tomo IV. Los peces marinos de interés pesquero. Caracterización biológica y evaluación del estado de explotación,INIDEP, Mar del Plata, pp 67-83.
Menni R.C. 1985. Distribución y biología de Squalus acanthias, Mustelus schmitti y Galeorhinus vitaminicus en el mar argentino en Agosto-Septiembre de 1978 (Chondrichthyes). Revista Museo de la Plata (Nueva Serie) Sección Zoología 13: 151-182.
Menni R.C., M.B. Cousseau y A.E. Gosztonyi. 1986. Sobre la biología de los tiburones costeros de la Provincia de Buenos Aires. Anales de la SociedadCientífica Argentina 213: 3-26.
Miranda, L.V., C.M. Vooren. 2003. Captura e esforço da pesca de Elasmobrânquios demersais no sul do Brasil nos anos de 1975 a 1997. FrenteMarítimo, 19 Sec. B: 217-231.
Molina J.M. y A.L. Cazorla. 2011. Trophic ecology of Mustelus schmitti (Springer, 1939) in a nursery area of northern Patagonia. Journal of SeaResearch 65: 381-389.
Molina J.M., Blasina G.E.y Lopez Cazorla A.C. 2017. Age and growth of the highlyexploited narrownose smooth-hound (Mustelus schmitti) (Pisces: Elasmobranchii). FisheryBulletin 115: 365-379.
Negri, R.M., Molinari, G., Carignan, M., Ortega, L. Ruiz, G.M., Cozzolino, E., Cucchi-Colleoni, A.D., Lutz, V., Costagliola, M., García, A., Izzo, S.,Jurquiza, V., Salomone, A., Odizzio, M., La Torre, S., Sanabria, M., Hozbor, M-V., PeressuttiS. R., Méndez, S., Silva, R., Martínez, A., Cepeda, G.,Viñas, M.D., Diaz, M.V., Pájaro, M., Mattera B., Montoya, N., Berghoff, C., Leonarduzzi, E. 2016. Ambiente y Plancton en la Zona Común dePesca Argentino-Uruguaya en un escenario de cambio climático (marzo, 2014). Frente Marítimo, 24: 251-316.
Oddone M.C., L. Paesch y W. Norbis. 2005. Reproductive biology and seasonal distribution of Mustelus schmitti (Elasmobranchii, Triakidae) in theRio de la Plata oceanic front, SW Atlantic. Journal of the Marine Biological Association of the United Kingdom 85: 1193-1198.
Oddone M.C., L. Paesch, W. Norbis y G. Velasco. 2007. Population structure, distribution and abundance patterns of the Patagonian smoothhoundMustelus schmitti Springer, 1939 (Chondrichthyes, Elasmobranchii, Triakidae) in the rio de La Plata and inner continental shelf, sw Atlanticocean (34°30'-39°30'S). Brazilian Journal of Oceanography 55:167-177.
Olivier R.S., R. Bastida y M.R. Torti. 1968. Sobre el ecosistema de las aguas litorales de Mar del Plata. Niveles tróficos y cadenas alimentariaspelágicos demersales y bentónicos-demersales. Servicio de Hidrografía Naval H 1025: 1-45.
Pérez M., M. Braccini y M.B. Cousseau. 2020. Marcación y recaptura de gatuzo (Mustelus schmitti) en el Ecosistema Costero Bonaerense(Argentina). Marine and Fishery Sciences (33) 1: 5-36.
Vooren, C. M. Demersal elasmobranchs. In: SEELIGER, U., ODEBRECHT, C.; CASTELLO, J. P. (Ed.). Subtropical convergence environment: the coastand the sea in the Southwestern Atlantic. Berlim: Springer, 1997. p. 41-146.
13