2.3 soil biology and ecology - traces
TRANSCRIPT

2.3 Soil Biology andEcology
Introduction 3
Instructor’s Lecture Outline 5
Detailed Lecture Outline for Students 9
Demonstration 1: Organic Matter Decomposition in Litter Bags 21
Instructor’s Demonstration Outline 21
Step-by-Step Instructions for Students 23
Demonstration 2: Soil Respiration 25
Instructor’s Demonstration Outline 25
Step-by-Step Instructions for Students 27
Demonstration 3: Earthworm Populations 31
Instructor’s Demonstration Outline 31
Step-by-Step Instructions for Students 33
Demonstration 4: Soil Arthropods 35
Instructor’s Demonstration Outline 36
Hands-On Exercise: Carbon and Nitrogen Mineralization 37
Assessment Questions and Key 41
Resources 43

Soil Biology and Ecology2 | Unit 2.3
Appendices
1. Major Organic Components of Typical Decomposer Food Sources 45
2. Litter Bag Data Sheet 46
3. Litter Bag Data Sheet Example 47
4. Respiration Data Worksheet 48
5. Earthworm Data Worksheet 49
6. Arthropod Data Worksheet 50

Soil Biology and Ecology Unit 2.3 | 3
Introduction
UNIT OVERVIEW
This unit introduces students to thebiological properties and ecosystemprocesses of agricultural soils.Students will review the constituentsof soils and the physicalcharacteristics and soil ecosystemprocesses that can be managed toimprove soil quality.Demonstrations and exercises willintroduce students to techniquesused to assess soils and informdecisions about soil managementwith the goal of maintaining cropproductivity and soil health incertified organic farming andgardening systems.
Introduction: Soil Biology and Ecology
MODES OF INSTRUCTION
> LECTURE (1 LECTURE, 1.5 HOURS)
Class lecture outline covers the basic biology and ecosys-tem processes of soils, focusing on ways to improve soilquality for organic farming and gardening systems.
> DEMONSTRATION 1: ORGANIC MATTER DECOMPOSITION(1.5 HOURS)
This exercise demonstrates how to assess the capacity ofdifferent soils to decompose organic matter. Discussionquestions ask students to reflect on what environmentaland management factors might have influenced the testresults and what the results suggest about nutrient cyclingrates and the quality/health of the soils tested.
> DEMONSTRATION 2: SOIL RESPIRATION (1 HOUR)
The demonstration outline covers the use of Draeger gasdetection tubes for measuring carbon dioxide levelsliberated from soils as an indicator of soil biologicalactivity and soil quality/health.
> DEMONSTRATION 3: EARTHWORM POPULATION(1 HOUR)
The demonstration covers the preparations, material usedto sample soil for the presence and abundance of earth-worm types. Discussion questions ask students to considerthe presence and abundance of certain earthworm types asindicators of soil quality/health.
> DEMONSTRATION 4: SOIL ARTHROPOD (1 HOUR)
The demonstration covers the preparation and materialsused to collect and identify soil arthropods. Discussionquestions ask students to consider the presence anddiversity of soil arthropods as indicators of soil quality/health.
> HANDS-ON EXERCISE: CARBON AND NITROGENMINERALIZATION (0.5 HOUR)
The demonstration covers the preparations and materialsused in estimating how much mineral N (nitrate andammonium) is liberated from organic matter inputs. Thisexercise simplifies the complex processes of the soil foodweb that occur during decomposition, as organic matter isconverted into nutrient forms that plants can use.
> ASSESSMENT QUESTIONS (1 HOUR)
Assessment questions reinforce key unit concepts andskills.

Soil Biology and Ecology4 | Unit 2.3
Introduction
LEARNING OBJECTIVES
CONCEPTS
• Soil quality/soil health
• Mineralization/immobilization
• Autotrophic/heterotrophic food webs
• Functional groups of soil biota
• Rhizosphere ecology
• Management effects on soil ecosystems
SKILLS
• How to assess soils for biological activitythrough measuring the rate of decomposition ofcellulose
• How to assess soil biological activity throughmeasuring soil respiration
• How to assess soil biological activity throughearthworm census
• How to assess the soil ecosystem structurethrough a soil arthropod census
• How to estimate the amount of mineral N(nitrate and ammonium) that is coming fromorganic matter inputs

Soil Biology and Ecology Unit 2.3 | 5
Instructor’s Lecture Outline
Lecture Outline: Soil Biology and Ecology
for the instructor
A. Pre-Assessment Questions 1. What is soil?
2. What forms of life exist in soil ecosystems?
3. How would you define a “healthy” agricultural soil?
4. What is a food web?
5. Can you describe a decomposer food web that may exist in the soil?
6. What might be some negative effects of the long-term practice of monoculturecropping and the use of synthetic chemical fertilizers and pest control agents on thesoil ecosystem?
B. Review: What Is Soil? (should be a review in part; see Unit 2.2)1. Soil components
a) Mineralb) Organic matterc) Water and aird) Biota
2. Soil structure vs. soil texture (definitions, examples)a) Soil texture, a native characteristicb) Soil structure, a manageable characteristic
C. What Is a Healthy/Quality Soil?1. Is soil merely a solid medium that holds nutrients for plant growth?
2. Soil health and soil quality generally synonymous
3. Definition: “Capacity of a soil to function, within land use and ecosystem boundaries,to sustain biological productivity, maintain environmental quality, and promote plant,animal, and human health.” (For a more detailed definition, see Unit 1.1, ManagingSoil Fertility.)
4. Assessment of soil quality/soil health
5. Protection of soil quality as a national priority
D. Nutrient Cycling and Decomposition1. Mineralize/immobilize
2. Organic matter: Includes all organic substances in or on the soila) Living organisms: Includes plant roots and all soil biota (<5%)b) Fresh and decomposing organic residues (40–60%)c) Resistant (recalcitrant) fraction: Humus, resistant to further decomposition
(33–50%)

Soil Biology and Ecology6 | Unit 2.3
Instructor’s Lecture Outline
d) See appendix 1, Major Organic Components of Typical Decomposer Food Sources,for a comparison of the components of some typical decomposer food sources
e) Physical factors influence decompositionf) Limiting factorsg) Plant secondary compounds may inhibit decomposition (polyphenols, tannins)
3. Nitrogen cyclea) Proteins —> amino acids —> ammonium —> nitrateb) Ammonification aerobic or anaerobicc) Nitrification aerobicd) Net mineralization > C:N 20-30 < net immobilization
4. Carbon and nitrogen mineralization exercise (handout)
E. Soil Food Webs1. Soil food web ecology
2. Heterotrophic vs. autotrophic food websa) Autotrophic food webs —> begin with C fixation by plantsb) Heterotrophic food webs —> release nutrients required by all plantsc) Energy loss = 80–90% at each step in the food chaind) Food web structuree) Ways that soil animals interact with soil microorganismsf) Unique food web for each ecosystem, determined by:
F. Soil Biota1. Characteristics
2. Habitats
3. Functional classificationa) Microorganismsb) Microfaunac) Mesofaunad) Macrofaunae) Megafauna
G. Rhizosphere Ecology1. Definitions
a) Rhizosphere (R) = the narrow zone of soil subject to the influence of living roots, asmanifested by the leakage or exudation of substances that promote or inhibitmicrobial activity
b) Rhizoplane (r)= the actual root surface, which provides a highly favorable nutrientbase for many species of bacteria and fungi
c) Edaphosphere (S) = soil beyond root influenced) Rhizosphere effect = soil microorganisms and fauna stimulated
i. —> R/S ratio generally increasese) Rhizosphere succession = the sequence of changes in the area surrounding a
growing root

Soil Biology and Ecology Unit 2.3 | 7
2. Rootsa) Root environmentb) Root formc) Root structured) Nutritione) Exudatesf) Variationsg) Management effects
3. Soil organismsa) Bacteriab) Fungic) Protozoansd) Nematodese) Microarthropodsf) Rhizosphere successiong) Examples
H. Management Effects on Soil Ecosystems1. No-tillage or reduced-tillage cropping systems
a) Organic litter is retained on the soil surfaceb) Physical disturbance is minimizedc) Surface soil stays cooler and moisterd) More surface organic matter is available as food substratee) Ratio of fungi to bacteria increases over timef) Earthworms and arthropods become more plentiful
2. Rotationsa) Monocultures and clean cultivationb) Complex rotationsc) Multiculture
3. Biocidesa) Effects varyb) High levels of pesticide use generally reduce food web complexityc) Predator-release phenomenond) Earthworms
4. Food web structuresa) Fungi/bacteria ratiob) Dominant microbe influences other trophic levels
5. Assessment of fertility needsa) Measures of available nitrogen

Soil Biology and Ecology8 | Unit 2.3

Soil Biology and Ecology Unit 2.3 | 9
Students’ Lecture Outline
Detailed Lecture Outline: Soil Biology and Ecology
for students
A. Pre-Assessment Questions1. What is soil?
2. What forms of life exist in soil ecosystems?
3. How would you define a “healthy” agricultural soil?
4. What is a food web?
5. Can you describe a decomposer food web that may exist in the soil?
6. What might be some negative effects of the long-term practice of monoculture croppingand the use of synthetic chemical fertilizers and pest control agents on the soilecosystem?
B. What Is Soil?1. Soil components
a) Mineral
i. Derived from parent material
b) Soil organic matter
c) Water and air
i. 1/2 soil volume = pore space
ii. Importance of gas diffusion: When diffusion is slow, as with saturated soil, respirationbyproducts accumulate and inhibit aerobic processes
iii. CO2 about 1% in dry soil, up to 10% in saturated soil
d) Biota: Smallest life forms are inseparable from soil organic matter
2. Soil structure vs. soil texture
a) Soil texture, a native characteristic
i. Soil texture: The relative percentage of and silt and clay particles
ii. Surface area/volume effects (e.g., influences CEC, pore space, water holding capacity,aggregate formation)
iii. The bricks, boards, and mortar (the physical materials) that make up soil
b) Soil structure, a manageable characteristic
i. Soil structure: The arrangement of soil particles. The “architecture” of soil.
ii. Determines movement of gases and water in soil
iii. Creates small habitat spaces
iv. Water stability: Aggregates that retain shape when wetted maintain a more stablesoil structure
v. Influences soil tilth
C. What Is a Healthy Soil?1. Question: Is soil merely a solid medium that holds nutrients for plant growth or does soil
serve other functions?
2. Soil health and soil quality generally synonymous

Soil Biology and Ecology10 | Unit 2.3
Students’ Lecture Outline
3. Definition: “Capacity of a soil to function, within land use and ecosystem boundaries, tosustain biological productivity, maintain environmental quality, and promote plant,animal, and human health.” (For a more detailed definition, see Unit 1.1, Managing SoilFertility.)
a) Soil recognized as essential component of biosphere
b) Soil is required for significant production of food and fiber
c) Soil contributes to maintaining and enhancing air and water quality
d) Soil filters and chemically alters water
e) Definition must be broad enough to encompass the many functions of soil
4. Assessment of soil quality/soil health
a) Analogy to monitoring human health
b) Indicators needed to identify problems and to monitor the effects of management
c) Requires a holistic approach
d) Should include physical, chemical, and biological attributes of soil
e) Indicators must be measurable by as many people as possible
f ) Definition and assessment of soil quality complicated by the fact that soil is not(typically) directly consumed by animals and humans, as are air and water
g) Basic data set of soil quality indicators
i. Soil texture
ii. Rooting depth
iii. Water infiltration
iv. Bulk density
v. Water holding capacity
vi. Soil organic matter
vii. pH
viii. Electrical conductivity
ix. Extractable N, P, and K
x. Microbial biomass C and N
xi. Potentially mineralizable N
xii. Soil respiration
xiii. Water content
xiv. Soil temperature
5. Protection of soil quality as a national priority
a) National Research Council recommendation (1993)
b) “Protecting soil quality, like protecting air and water quality, should be a fundamentalgoal of national environmental policy”
D. Nutrient Cycling and Decomposition1. Mineralization/immobilization
a) Soil nutrients occur as parts of:
i. Inorganic compounds: Some of these are available to plants
ii. Organic compounds: Are part of living organisms and decaying organic matter.These nutrients are stored and temporarily unavailable.
b) Soil organisms are constantly transforming nutrients between these 2 forms
c) Mineralization: Soil organisms excrete inorganic waste compounds that may adhere toCEC sites and/or dissolve in soil water (soil solution) for possible uptake by crop plants.Net mineralization must be greater than net immobilization for nutrients to beavailable to crop plants.

Soil Biology and Ecology Unit 2.3 | 11
Students’ Lecture Outline
d) Immobilization: Soil organisms consume inorganic compounds to construct livingtissues. These nutrients are temporarily stored and unavailable for plant uptake.
2. Soil organic matter (SOM): Includes all organic substances in or on the soil
a) Living organisms—includes plant roots and all soil biota (< 5% of SOM)
i. Cellulose, the major carbohydrate structural building block for plants, is the mostabundant compound on earth
ii. Lignin second largest input into SOM
b) Fresh and decomposing organic residues (40–60% of SOM)
i. Easily decomposable (active, labile) fraction: Quantity changes quickly in responseto management changes and is the organic matter fraction from which the majorityof plant nutrients are liberated
ii. Moderately decomposable fraction: Physically and/or chemically more complexthan labile OM. Decomposition slower and therefore fewer nutrients liberated in agiven season.
c) Resistant (recalcitrant) fraction: Humus, resistant to further decomposition (33–50% ofSOM). Has greater influence on the structure/physical properties of soils.
d) See appendix 1, Major Organic Components of Typical Decomposer Food Sources
e) Physical factors influencing decomposition
i. Particle size: High surface area/volume = more rapid decomposition
ii. Surface properties (waxes, pubescence) often decrease rate of decomposition
f ) Limiting factors in decomposition of SOM
i. Decomposers tend to concentrate the nutrients that are in short supply
ii. Micronutrients are not usually a limiting factor
g) Plant secondary compounds may inhibit decomposition (such as polyphenols, tanninsfound in many woody perennials)
3. Nitrogen cycle
a) Proteins —> amino acids —> ammonium (form of N useable by some plants) —>nitrate (form of N useable by most plants)
b) Ammonification (aerobic or anaerobic): The biochemical process whereby ammoniacalnitrogen is released from nitrogen-containing organic compounds
c) Nitrification (aerobic): The biochemical oxidation/ change of ammonium to nitrate
i. Inhibited by low oxygen or low temperatures
ii. Ammonium build-up in cold, wet soils
d) If C:N < 20–30:1 = net mineralization. If C:N > 20–30:1 = net immobilization
4. See Hands-On Exercise, Carbon and Nitrogen Mineralization
E. Soil Food Webs1. Soil food web ecology
a) Trace the path of energy or nutrients passing from one organism to the next
2. Heterotrophic vs. autotrophic food webs
a) Autotrophic food webs —> begin with C fixation by plants. Energy for most life isderived from sunlight that has been transformed by photosynthetic plants into organiccompounds.
b) Heterotrophic food webs —> release nutrients required by all plants
i. The decomposition food web begins with waste-products from autotrophic foodwebs

Soil Biology and Ecology12 | Unit 2.3
Students’ Lecture Outline
c) Energy loss = 80–90% at each step in the food chain
d) Food web structure and properties
i. Resilience = speed of recovery after disturbance
ii. Resilience decreases with increasing number of trophic levels due to increasingcomplexity—takes longer to reestablish complex food web relationships
iii. Disturbance selects for shorter food chains: In farmed soils, disturbance can bechemical (pesticides, fertilizers) or physical (cultivation, organic matterincorporation, removal of surface organic layer)
iv. Relate to timing of agricultural inputs and other disturbances
v. Fungi/bacteria biomass ratio characteristic
• Productive agricultural soils ratio 1:1 or less (higher in no-till) = bacterial-dominated food webs
• Deciduous forest, 5:1 to 10:1
• Coniferous forest, 100:1 to 1000:1
e) Ways that soil animals interact with soil microorganisms
i. Shredding of organic matter (comminution)—“can openers”
ii. Spreading to new habitats and new food resources (dissemination)
iii. Grazing: Stimulate growth, control populations
iv. Predation: Similar effects as grazing
v. Soil structure changes (burrowing, mixing, defecating, crumb formation)
f ) Unique food web for each ecosystem, determined by:
i. Climate
ii. Soil/parent material
iii. Vegetation
iv. Land management practices
F. Soil Biota1. Characteristics
a) Diversity of organisms in soil can rival that of coral reef ecosystems
b) Characterized by small size and indistinct morphologies (unlike coral reef )
c) Due to cryptic environment, visual cues are less important—bright colors and patternsof coral reef organisms are lacking in soil organisms
d) Biomass comparisons
e) Abundance
2. Habitats
a) Habitats within soil ecosystems are unevenly distributed
b) Habitats are concentrated at organic matter sites
i. Root zone (rhizosphere)
• Succession of organisms as root grows
• Some root exudates and root hairs may fuel microorganisms
ii. Litter
iii. Surface of soil aggregates
iv. Incorporated organic matter

Soil Biology and Ecology Unit 2.3 | 13
Students’ Lecture Outline
3. Functional classification
a) Microorganisms
i. Colonial growth forms (cells about 1/25,000 inch wide)
• Bacteria and yeast
• Adapted to high surface area (SA)/volume
• Colonize surfaces, crevices, pores
• Teaspoon of soil contains 100 million to 1 billion bacteria
• Biomass equivalent to 2 cows per acre
• Many functions (N fixers, nitrifiers, denitrifiers, decomposers, pathogens, promoteaggregation)
ii. Mycelial growth forms (hypha length from a few cells to many yards)
• Fungi and actinomycetes
• Penetrate organic matter
• Translocation of nutrients
• Decomposers, mutualists, pathogens, nematode-trapping fungi
iii. Algae
b) Microfauna
i. Protozoans (1/5000 inch to 1/50 inch wide)
• Small animals (acellular) living in water films
• Feed on bacteria, other microorganisms, detritus
• Encystment: Distinctive response to drying out
• Inhabit transitory environments
- Colpoda divide once or twice per day at 12oC
• Several distinct types
- Ciliates have fringe of small hairs used for locomotion
- Amoebae have an amorphous body shape
- Flagellates have a whip-like tail for locomotion
ii. Nematodes (1/500 inch in diameter, 1/20 inch in length)
• Global distribution
• “If all the matter in the universe were swept away, our world would still be dimlyrecognizable, and if as disembodied spirits, we would investigate it, we should find itsmountains, hills, vales, rivers, lakes and oceans represented by a thin film ofnematodes.” –Nathan Cobb, 1914
• Soil abundance = million/m2
• Outer cuticle protects; resistant to toxins
• Include microbivores, omnivores, predators, some parasites (10%)
• Abundant at sites with high organic matter concentration
iii. Rotifers, Tardigrades
iv. No comminution, i.e., they don’t shred organic matter into smaller pieces
c) Mesofauna
i. Potworms (Enchytraeida)
• Small annelids (related to earthworms), 1mm to 5 cm long
• Tolerate pH < 4
• Thousands/m2 in high organic matter soil
• No burrows
• Feed on hyphae, microorganisms, feces
Soil Biology and Ecology14 | Unit 2.3
Students’ Lecture Outline
ii. Collembolans (springtails)
iii. Mites (acari)
iv. Insect larvae
v. Regulate microorganisms by grazing (feeding)
vi. Minor comminution
vii. 500 to 200,000 per square meter, far less biomass than microfauna
d) Macrofauna
i. Earthworms
• 3 ecological types (anecic, endogeic, epigeic)
• Vermisphere concept
• Obtain a portion of their nutrition from microbes living on organic residues theyingest
• 7,000+ species
• Stimulate microbial activity through effects on SOM, microbial inoculation ontosubstrates, soil structure, etc.
• Mix and aggregate soil
• Increase water infiltration
• Provide channels for root penetration deep into soil
• Bury and shred organic matter
• Abundance decreases after disturbance (tillage, chemicals)
ii. Millipedes, isopods, mollusks, insects
iii. Shred and incorporate plant remains (may become pests by feeding on living plantsif insufficient organic residues present)
iv. Alter soil structure
e) Megafauna
i. Large invertebrates, vertebrates
G. Rhizosphere Ecology1. Definitions
a) Rhizosphere (R): The narrow zone of soil subject to the influence of living roots, asmanifested by the leakage or exudation of substances that promote or inhibitmicrobial activity
b) Rhizoplane (r): The actual root surface, which provides a highly favorable nutrient basefor many species of bacteria and fungi
c) Edaphosphere (S): Soil beyond root influence
d) Rhizosphere Effect: Soil microorganisms and fauna stimulated
i. R/S ratio generally greater than 1 (i.e., more biota in R than in S)
e) Rhizosphere succession: The sequence of changes in the composition and densities ofsoil microbes and fauna in the area surrounding a growing root (see below)
2. Roots
a) Root environment
i. Determined by above-ground processes (products of photosynthesis aretranslocated to roots)
ii. Exudates, sloughed hairs, and cells feed soil organisms
iii. Bicarbonate formation as a result of influences on pH
iv. Type and amount of exudates vary with species, age, soil
v. Oxygen decreases, CO2 increases in root zone over time due to plant and R organism
respiration

Soil Biology and Ecology Unit 2.3 | 15
Students’ Lecture Outline
b) Root form
i. Fibrous roots
• Most monocots
• Primary root replaced by series of adventitious roots
ii. Tap roots
• Most monocots and gymnosperms
• Tap root persists and forms many lateral branches
• Generally deeper than fibrous roots
iii. Root depth
• Species specific, modified by environment
c) Root structure
i. Root cap
• Live cells produced by meristem
• Protects root, like a bud scale
• Constantly replaced (5–6 day turn over)
• Responds to gravity
ii. Meristematic zone: 2 mm zone where most cell division happens
iii. Zone of elongation: Rapid growth, cells from meristem
iv. Mucilage
• Covers root from tip to beginning of root hair zone
• Source is part microbial, part root cap
• Possible functions: Nutrient uptake, protection, prevent drying, fill spacesbetween root and soil, food for microbes
v. Root hair (differentiation) zone
• Root hairs have life span of days to weeks
• Do not become roots
• Are an outgrowth of epidermal cell
• Rye plants can produce over 100 million per day
• None in redwood trees, firs, some pines
• Food sources that support rhizosphere microbes
vi. Lateral roots
• Originate from the vascular bundle inside cortex
• Cortex and epidermis are ruptured by new lateral root
• Bacteria colonize these emergence sites
d) Root nutrition
i. Maximum nutrient uptake occurs behind meristem (elongation and root hair zones)
ii. Water and nutrients are withdrawn from narrow band around roots
iii. Replenished from surrounding soil by mass flow
iv. If mass flow is slow (e.g., POD), depletion zone created resulting in lack of some
nutrients
e) If uptake is slow certain ions may accumulate—all ions in solution move towards rootduring mass flow; those not used by plant will accumulate around root

Soil Biology and Ecology16 | Unit 2.3
f ) Root exudates
i. Amounts
• 20–50% more C enters the soil from exudates, sloughed cells, and root hairs thanis present as fibrous roots at end of growing season = substantial contribution toSOM
• Amount of exudates increased by:
– wetting, after a drying spell
– physical or chemical injury (i.e., mowing, grazing of perennial grass cover crop)
– abrasion, phytotoxic residues, osmotic stress
ii. Types
• Carbohydrates and amino acids: Most-researched compounds
– 10 sugars, glucose and fructose most common
– 25 amino acids
• Also organic acids, fatty acids, sterols, enzymes, volatile compounds, and growthfactors
• Difficult to separate plant and microbe sources
iii. Exudates released from meristem zone
• Nematodes and zoospores congregate there
iv. Foliar sprays may move into roots (depends on molecular weight)
• Herbicides, antibiotics may also move into roots
• Streptomycin moved from Coleus leaves to roots in 24 hrs
• Bacteria suppressed by the streptomycin
g) Variations in root exudates
i. R effect increases with age
ii. Decreases with senescence
iii. Annual crop plants have greater R effect than trees
iv. Legume R effect stronger than non-legume
v. R effect may be strongest at flowering
vi. Stronger in sandy soils than in heavier soils
vii. Highest R effect in dune and desert soils
h) Management effects
i. Synthetic fertilizers
• Sometimes no effect
• Sometimes increase R/S indirectly through stimulation of plant growth
ii. Organic manures
• Same indirect positive effect on R/S
• Also can decrease ratio since edaphic (non-R) microbes are also stimulated byorganic matter input
• After 4 weeks of decomposition, R/S generally increases
3. Soil organisms
a) Bacteria
i. Most responsive to plant exudates
ii. 2 to 20 fold increase in bacterial populations over non-root soil
iii. Pseudomonas most consistently abundant in rhizosphere
iv. Also Agrobacterium (biocontrol agent) and Achromobacter
Students’ Lecture Outline

Soil Biology and Ecology Unit 2.3 | 17
Students’ Lecture Outline
v. Azotobacter, non-symbiotic nitrogen fixer
• If inoculated on seed can persist in rhizosphere
vi. Rhizobium, Nitrosomonas, and Nitrobacter common in R
b) Fungi
i. Average increase 10 to 20 fold in R of crop plants
ii. Fusarium is a dominant genera of R fungi
iii. Mycorrhizae can provide physical and chemical suppression of pathogens
c) Protozoans
i. Mainly bacteria grazers, so increases expected in R
ii. Example: In a wheat field, bacteria R/S was 23:1, protozoan R/S was 2:1
iii. Some large amoebae may provide biocontrol of some fungi
d) Nematodes
i. Root substances stimulate egg hatching of some parasites
ii. Host and non-host plants may stimulate hatching
iii. E.g., some crucifers and chenopods evoke Heterodera hatching, but don’t supportroot invasion by larvae. Some plants will cause eggs of parasitic nematodes to hatch,but they are not susceptible to attack by the parasite. Therefore the plant stayshealthy, and the nematodes fail to thrive.
iv. Nematodes tend to congregate around elongation zone
v. Degree of attraction proportional to root growth rate
vi. Some root exudates repel nematodes
e) Microarthropods
i. Some grazers consistently more abundant around roots
f ) Rhizosphere succession
i. Root tip releases labile carbon
ii. Rapid increase of microbes and nutrient immobilization
iii. Grazers increase, tracking microbe increases
iv. Root hair zone, water, and carbon decrease
v. Microbes decrease, grazers cause net mineralization
vi. Further along, grazers encyst or migrate
g) Examples
i. Wheat monoculture in Washington state
• Develops take-all disease, yields down
• In some fields yields increase after a few years
• Pseudomonas fluorescens isolated from R of resistant fields
• Seeds treated with the bacteria, planted in diseased fields
• Biocontrol and 20% yield increase resulted
ii. Beets in Idaho and California
• P. fluorescens isolated from R of field grown beets
• Seed treatment
• Over 3 years 13% increase in root weight
• Strains used inhibited R. solani, Pythium, Erwinia, and others
iii. Cotton
• P. fluorescens isolated from cotton R
• Produces a potent antibiotic
• Protects cotton seedlings from infection by R. solani
• Used as a seed treatment

Soil Biology and Ecology18 | Unit 2.3
iv. Fruit trees and shrubs (nursery grown)
• Crown gall caused by Agrobacterium tumefaciens
• A. radiobacter is virtually indistinguishable, except that it produces a highlyspecific antibody
• Young plants dipped in cell suspension of A. radiobacter
• Roots protected by rapidly growing A. radiobacter
• It may also compete for infection binding sites, thus excluding pathogenphysically as well as chemically
H. Management Effects on Soil Ecosystems1. No-tillage or reduced-tillage cropping systems
a) Organic litter is retained on the soil surface
b) Physical disturbance is minimized
c) Surface soil stays cooler and moister
d) More surface organic matter available as food substrate
e) Ratio of fungi to bacteria increases over time
f) Earthworms and arthropods become more plentiful
g) Effects on nutrient cycling
h) Effects on soil physical properties
2. Rotations
a) Monocultures and clean cultivation
i. Create little habitat for soil organisms, leading to less abundant and diverse soilecosystems
ii. Consistent plant hosts may serve to develop populations of pathogenic organisms.Uninterrupted plant-host cycle.
b) Complex rotations
i. Greater variety of food sources (roots, root exudates, and residues)
ii. Likely to be greater diversity of soil organisms. Interrupted plant-host cycle.
c) Multiculture
i. Growing more than one crop in one field
ii. More closely mimics natural ecosystem
iii. Likely to support even greater diversity of soil organisms, especially invertebrates
iv. Interrupted plant-host cycle
3. Biocides
a) Effects vary depending on
i. Type of chemical
ii. Species in question
iii. Concentration and other exposure factors
b) High levels of pesticide use generally reduce food web complexity
i. Methyl bromide and other fumigants are extreme examples
ii. Eliminate most organisms
iii. Some bacteria quickly return
iv. Other organisms only slowly return
Students’ Lecture Outline

Soil Biology and Ecology Unit 2.3 | 19
Students’ Lecture Outline
c) Predator-release phenomenon
i. In cases where biocides selectively eliminate predators, lower trophic levels maybecome more abundant
ii. Destabilizing effect on food webs
• Overgrazing on food sources resulting in depletion of food sources
• Population explosion, followed by crash, resulting in...
• Immobilization of nutrients, followed by rapid mineralization at a rate that is notnecessarily compatible with crop needs. May result in leeching of water-solublenutrients.
d) Earthworms
i. Most strongly effected (negatively) by fungicides and fumigants
ii. Herbicides
• Don’t seem to be directly toxic
• Indirect negative effect through elimination of vegetation
4. Food web structures
a) Fungi/bacteria ratio
b) Dominant microbe influences other trophic levels
5. Assessment of fertility needs (also see Unit 1.1, Managing Soil Fertility)
a) Measures of available nitrogen
i. Conventional cropping systems
• Most N provided by additions of fertilizer
• Measurements of nitrate reflect accurately what is available to plants
• Key management decisions are when to apply fertilizer
ii. Cropping systems based on organic matter management
• Soil food web becomes primary source of N
• Soil analysis may indicate “inadequate” levels of N at any given time becausemuch of soil N is immobilized
• Cumulative release of mineral N over growing season may match amounts seenin conventional system
• Managing the timing of mineralization (through tillage, OM quality [e.g., C:Nratio], incorporation of OM/fertilizers, irrigation) by soil food web becomes morecritical
• If managed well, less risk of nutrient loss through leaching or volatilization

Soil Biology and Ecology20 | Unit 2.3

Soil Biology and Ecology Unit 2.3 | 21
Instructor’s Demonstration 1 Outline
Demonstration 1: Organic Matter Decompositionin Litter Bags
for the instructor
OVERVIEW
To demonstrate the capacity ofdifferent soils to decompose organicmatter, this exercise requires you tobury cellulose disks (Whatman filterpaper) in a variety of locations. Thisshould be done at least two weeksprior to the class to allowdecomposition to proceed before thedisks are retrieved on the day of theclass. To accelerate decomposition,filter paper disks can be dipped in abucket of water with some fishemulsion added just before burial.
MATERIALS NEEDED
• Whatman filter paper discs
• Plastic mesh bags*
• Flags to mark burial sites
• Flat shovel
• Litter Bag Data worksheets (see appendix 2)
• Pencils
*for plastic mesh bags, you may use pond and pool nettingobtained from a local feed and seed supply. It is a 3/8-inchpolypropylene mesh. Cut mesh into 6-inch x 12-inchpieces, fold in half, then fold the edges over and staple theedges shut. Other sources are the mesh bags that bulbs aresold in, garlic or onion bags, or the mesh bags that im-ported rice noodles are packed in. The smaller the meshsize, the smaller the organisms that will be excluded fromthe bag. This phenomenon can be exploited by comparingdecomposition rates of organic matter buried in bags withdifferent mesh sizes. Organic matter in bags with very finemesh will be decomposed primarily by microflora andmicrofauna. Organic matter in larger mesh bags will alsobe decomposed by larger fauna.
PREPARATION
1. Place litter bags in soil at least two weeks prior to class.Place them vertically in soil, and place them all at thesame depth. For a 10 cm disc, 0 to 10 cm is aconvenient depth.
2. Flag the site, and make a note of location, or a map. Aminimum of 3 bags should be placed in each habitat.Possible habitats include raised garden beds, cultivatedfields, fallow fields, orchards, compost piles,vermicompost bins, soil surface (not buried), weedyborders.
3. Bags should be retrieved very gently, as the paper islikely to be very fragile. (If too rapid decompositionmakes this demonstration difficult, an alternativematerial to use is a 50/50 cotton/polyester material.Even if the cotton is entirely degraded, the polyestermatrix will remain intact. Strips would have to beweighed before and after burial to determine mass loss.)

Soil Biology and Ecology22 | Unit 2.3
Instructor’s Demonstration 1
4. Have students collect the bags and returnthem to a central location.
5. Ask students to observe the soil habitat thateach bag is in. Suggest they note things likesoil moisture, presence of any soil animals,vegetative cover and shading, knowledge ofprior cultivation, and anything else theythink may be important in explaining theirresults.
6. Gently brush soil from discs. Ask students tovisually estimate percentage of the discremaining.
7. Record results and calculate averages foreach habitat selected. A sample form isprovided (see appendix 2, Litter Bag DataSheet) for recording data. Appendix 3provides an example of what a filled-outdata sheet might look like.
PREPARATION TIME
1 hour to make 24 bags, 1 hour to bury 24bags (allow additional time for gatheringmaterials)
DEMONSTRATION TIME
1.5 hours
DISCUSSION QUESTIONS
1. After retrieving the litter bags, ask studentsto offer hypotheses about why the disksdecompose more rapidly in some habitatsthan others.
2. What environmental factors might haveinfluenced the results?
3. What management factors might haveinfluenced the results?
4. Can you see any signs of biological activityon the disks (e.g., fungal mycelia, soilanimals, invertebrate feces, comminution)?
5. What do the results suggest about nutrientcycling rates in the soils tested?
6. Can these observations for cellulosedecomposition rates be extrapolated to othertypes of organic matter?
7. What are the limitations of this method?
VARIATIONS
If possible, pair the litter bag demonstrationwith other methods of assessing biologicalactivity, such as:
• Carbon dioxide evolution (seeDemonstration 2, Soil Respiration)
• Earthworm density (see Demonstration 3,Earthworm Populations)
• Tullgren funnel extractions ofmicroarthropods (see Demonstration 4, SoilArthropods)
• Microbial biomass measurements

Soil Biology and Ecology Unit 2.3 | 23
Step-by-Step Instructions, Demonstration 1
Demonstration 1: Organic Matter Decompositionin Litter Bags
step-by-step instructions for students
INTRODUCTION
The decomposition of organic matter isan important soil process for organi-cally managed farms and gardens.Organic matter includes a vast array ofcompounds that can be biologicallydecomposed at various rates, depend-ing on their physical and chemicalcomplexity. Environmental factors suchas temperature and moisture alsodetermine decomposition rate.
We can use discs of filter paper torepresent a uniform piece of cellulose-rich organic matter. If discs are placed inthe soil for a set period and then re-trieved, we can learn something aboutthe capacity of various soils to decom-pose cellulose. By placing the discs inplastic mesh bags prior to putting themin soil, we can make it easier to retrievethe discs intact. Decomposition can beestimated by a visual estimate of per-centage surface area remaining. A morequantitative method is to rinse and drythe discs, then weigh them to estimatemass loss (original mass must also beknown).
MATERIALS NEEDED
Assemble materials as per instructor’s outline
PREPARATION
Litter bags are placed in soil at least two weeks prior to class.They are placed vertically in soil, all at the same depth. For a10 cm disc, 0 to 10 cm is a convenient depth.
Bags should be retrieved very gently, as the paper is likely tobe very fragile. When you retrieve the bags, make sure toobserve the soil habitat that each bag is in. Note things likesoil moisture, presence of any soil animals, vegetative coverand shading, and anything else you think may be importantin explaining the results.
Gently brush soil from discs. Visually estimate percentage ofthe disc remaining. Record results and calculate averages foreach habitat selected, using the data sheet supplied.
DISCUSSION QUESTIONS
1. After retrieving the litter bags, discuss your hypothesesabout why the disks decompose more rapidly in somehabitats than others.
2. What environmental factors might have influenced theresults?
3. What management factors might have influenced theresults?
4. Can you see any signs of biological activity on the disks(e.g., fungal mycelia, soil animals, invertebrate feces,comminution)?
5. What do the results suggest about nutrient cycling rates inthe soils tested?
6. Can these observations for cellulose decomposition ratesbe extrapolated to other types of organic matter?
7. What are the limitations of this method?

Soil Biology and Ecology24 | Unit 2.3

Soil Biology and Ecology Unit 2.3 | 25
Instructor’s Demonstration 2 Outline
Demonstration 2: Soil Respiration
for the instructor
OVERVIEW
This demonstration uses Draeger gasdetection tubes to measure carbondioxide. See sources of supply at theend of this outline.
MATERIALS
• 6-inch diameter ring*
• Lid with rubber stoppers
• Hand sledge and wood block
• Soil thermometer
• 2 sections of plastic tubing
• 2 needles
• Draeger tubes
• 140 cc syringe
• Stopwatch or timer
• Soil Respiration Data worksheets(appendix 4)
• Pencils
*possible sources are sections of 6-inchirrigation pipe, PVC pipe with one endtapered, or coffee cans with bottomremoved
PREPARATION
Microbial activity is greatest when the soil is moist (at ornear field capacity). If the soil is dry, a second respirationmeasurement should be made at a minimum of six hours(preferably 16 to 24 hours later) after the infiltration testor wetting of the soil. If the soil is saturated, soil respira-tion is inhibited, and this test should not be run. If neces-sary to save time, rings can be placed and soils wetted theday before the demonstration. It may be useful to combinethe litter bag and soil respiration measurements, in orderto compare results from two different methods thatmeasure soil biological activity.
Divide class in teams of two or more, and assign each teamto one sample site. Demonstrate the technique first, à laJulia Childs. Have one ring for showing how to place itand take headspace measurements. Have a second ringalready placed and capped from which to collect a CO2
sample. Then send teams out to do their own sampling.
Note: This description of the soil respiration measurementwas taken from the USDA Soil Quality Test Guide, whichyou may want to consult for more details. See Resourcessection.
1. Clear the sampling area of surface residue, etc. If thesite is covered with vegetation, trim it as close to thesoil surface as possible.
2. Using the hand sledge and block of wood, drive the 6-inch diameter ring, beveled edge down, to a depth ofthree inches (line marked on outside of ring). If the soilcontains rock fragments, and the ring cannot beinserted to depth, gently push the ring into the soil untilit hits a rock fragment.
3. Measure the height from the soil surface to the top ofthe ring in centimeters. For a more accuratemeasurement of soil respiration, the chamber head-space should be measured. Inside the ring, take fourmeasurements (evenly spaced) of the height from thesoil surface to the top of the ring, calculate the average,and record on the Soil Respiration Data worksheet.

Soil Biology and Ecology26 | Unit 2.3
Instructor’s Demonstration 2 Outline
4. Cover the ring with the lid and note the time.Wait exactly 30 minutes (to allow CO2 toaccumulate in the chamber). If this is theSECOND respiration measurement, brieflyremove the lid and replace it before timing toallow the release of gases that have built upover the 6–24-hour waiting period.
6. Insert the soil thermometer into the soiladjacent to the ring with lid (about one inchaway from ring and one inch deep). If thethermometer can easily be inserted into therubber stoppers, insert it into one of them toa 1-inch depth into the soil.
7. Assemble the Draeger tube apparatus justbefore the end of the 30-minute wait.Connect a needle to one of the sections oftubing. Break open both ends of a CO2
Draeger tube, either by using the hole at theend of the syringe handle, or by clipping thetube ends with a finger nail clipper. Connectthe Draeger tube to the other end of theneedle’s tubing. The arrow on the side of theDraeger tube should point away from theneedle. With the second piece of tubing,connect the Draeger tube to the syringe.
8. After 30 minutes, insert the Draeger tubeapparatus needle into a stopper. Insert asecond needle into one of the other stopperson the lid to allow air flow into the headspace during the gas sampling. The secondneedle should be inserted just before the headspace is sampled.
9. Over a 15-second span, draw the syringehandle back to the 100 cc reading (1 cc = 1ml). [If the reading is less than 0.5%, takefour additional 100 cc samples of the headspace through the same Draeger tube. To dothis, disconnect the tube from the syringe toremove the air, and reconnect the tube to thesyringe. Take another 100 cc sample.Repeat.]
10. On the Soil Respiration Data worksheet,record the temperature in Celsius at the timeof sampling. On the Draeger tube, read the“n=1” column if 100 cc was sampled or the“n=5” column if 500 cc was sampled. The %CO2 reading should be an estimate of thehighest point that the purple color can beeasily detected. Enter this reading on the SoilRespiration Data worksheet.
11. Remove the thermometer, Draeger apparatusneedle, air flow needle, and the lid from thering. If this is the first respiration measurement,leave the ring in the soil for the infiltrationmeasurement.
CALCULATIONS
Soil Respiration (lb CO2 - C/acre/day) = PF x TF x(%CO2 - 0.035) x 22.91 x H
PF = pressure factor = 1
TF = temperature factor = (soil temperature in Celsius+ 273) ÷ 273
H = inside height of ring = 5.08 cm (2 inches)
Calculations can be done quickly by entering data intoa spreadsheet if a computer is available, or studentscan use hand-held calculators.
PREPARATION TIME
1–2 hours (varies depending on what materials areavailable)
DEMONSTRATION TIME
1–1.5 hours
DISCUSSION QUESTIONS
1. Compare soil respiration results for differentsites. How may management practices on thedifferent sites have influenced results?
2. If measurements were made before and afterwetting soil, compare before and after results.How does soil moisture influence biologicalactivity?
3. Would it be possible to estimate all carbonimports and exports to a soil system? Whatinformation would you need to start to makesuch an estimate?
SOURCES OF SUPPLIES
Fisher Scientific, Pittsburgh, PA(800) 766-7000Draeger tubes, latex tubing, hypodermic needles
Scientific Industries227 Blue Bell Ave. Boulder, CO 80302(303) 443-7087Draeger tubes

Soil Biology and Ecology Unit 2.3 | 27
Step-by-Step Instructions, Demonstration 2
Demonstration 2: Soil Respiration
step-by-step instructions for students
INTRODUCTION
Soil breathes! Soil respiration is anindicator of biological activity (i.e.,microbial and root), or soil life. Thisactivity is as important to the soilecosystem as healthy lungs are to us.However, more activity is not alwaysbetter because in some circumstances itmay indicate an unstable system under-going net carbon loss (i.e., after tillage).
Soil respiration is the production ofcarbon dioxide (CO
2 ) as a result of
biological activity in the soil by microor-ganisms, live roots, andmacroorganisms such as earthworms,nematodes, and insects. Carbon dioxideemitted from soil is a colorless andodorless gas that enters the atmosphereand annually exceeds the amountemitted by all human activities. Theactivity of organisms in the soil isconsidered to be a positive attribute forsoil quality.
Soil respiration is highly variable both spatially and seasonally,and is strongly affected by moisture and temperature condi-tions. Because this variability can complicate interpretations,certain sampling precautions must be taken.
Knowing the history of the sampling site and characteristics ofnearby soils becomes very important when evaluating respira-tion. Soil color may provide some assistance when interpretingrespiration rates. A light colored soil with a high respirationrate may be indicative of a soil being depleted of organicmatter. A relatively darker soil with the same rate could beconsidered healthy. The dark color indicates the presence oforganic matter. Tillage or cultivation can result in loss of soilcarbon (C) and increases in the amount of CO
2 released. The
soil is loosened, which creates better accessibility of oxygennecessary for organic matter decomposition and respiration,resulting in the production of CO
2.
Soil respiration can be limited by moisture, temperature,oxygen, soil reaction (i.e., pH), and the availability of decom-posable organic substrates. Optimum respiration usuallyoccurs at around 60% of water-filled pore space. Soil respira-tion will decrease under saturated or dry conditions. Biologicalactivity doubles for every 18˚F rise in temperature until theoptimum temperature is reached (varies for different organ-isms). Activity declines as temperature rises above optimum.The most efficient soil organic matter decomposers areaerobic; thus, soil respiration rates decline as soil oxygenconcentration decreases. Oxygen is most limiting in soils thatare saturated with water. Greater oxygen flow occurs in well-aggregated soils that have many macropores.
Addition of organic materials will generally increase soilrespiration. Organic matter provides the food or substrate onwhich heterotrophic soil microbes feed. Organic materials withlow carbon to nitrogen (C:N) ratios (e.g. manure, leguminouscover crops) are easily decomposed; thus, the addition of thesematerials to soil will increase soil respiration. Materials withhigh C:N ratios (e.g., compost, sawdust) decompose moreslowly but provide a more stable, long-term supply of organicmaterial than legumes, biosolids, and manures. Soil microbeswill compete with plants for nitrogen when soil is amendedwith products having C:N ratios higher than 25:1.
Agricultural chemicals that directly kill or otherwise impair soilmicroorganisms, such as fungicides and nematocides, reducesoil respiration. Although these chemicals target pathogenic

Soil Biology and Ecology28 | Unit 2.3
organisms, they may also impair the viability ofbeneficial organisms.
Organic matter decomposition provides benefitsand drawbacks. Decomposition of organic matter isthe primary route through which some essentialnutrients (e.g., nitrogen) are released, but organicmatter destruction reduces the benefits thatorganic matter confers to soil physical and chemi-cal properties. The addition of organic materials tothe soil must equal the loss due to decompositionfor the sustainability of the system to be main-tained.
MANAGEMENT FACTORS INFLUENCING SOILRESPIRATION
INCREASES SOIL RESPIRATION
• Adding organic amendments, such as manure,biosolids, and crop residues
• Irrigating to proper moisture content
DECREASES SOIL RESPIRATION
• Removing or burning crop residues
• Continuous tillage without organic matterreplacement
• Agricultural chemicals (e.g., fungicides andnematocides)
MATERIALS
Assemble materials as per instructor’s outline
PREPARATION
Microbial activity is greatest when the soil is moist(at or near field capacity). If the soil is dry, a secondrespiration measurement should be made at aminimum of six hours (preferably 16 to 24 hourslater) after the infiltration test or wetting of the soil.If the soil is saturated, soil respiration is inhibited,and this test should not be run.
1. Clear the sampling area of surface residue, etc. Ifthe site is covered with vegetation, trim it asclose to the soil surface as possible.
2. Using the hand sledge and block of wood, drivethe 6-inch diameter ring, beveled edge down, toa depth of three inches (line marked on outsideof ring). If the soil contains rock fragments, andthe ring can not be inserted to depth, gentlypush the ring into the soil until it hits a rockfragment.
3. Measure the height from the soil surface to thetop of the ring in centimeters (cm). For a moreaccurate measurement of soil respiration, thechamber head-space should be measured.Inside the ring, take four measurements (evenlyspaced) of the height from the soil surface tothe top of the ring, calculate the average, andrecord on the Soil Data worksheet.
4. Cover the ring with the lid and note the time.Wait exactly 30 minutes (to allow CO
2 to
accumulate in the chamber). If this is theSECOND respiration measurement, brieflyremove the lid and replace it before timing toallow the release of gases that have built upover the 6–24-hour waiting period.
5. Insert the soil thermometer into the soiladjacent to the ring with lid (about one inchaway from ring and one inch deep). If thethermometer can easily be inserted into therubber stoppers, insert it into one of them to a 1-inch depth into the soil.
6. Assemble the Draeger tube apparatus justbefore the end of the 30-minute wait. Connect aneedle to one of the sections of tubing. Breakopen both ends of a CO
2 Draeger tube, either by
using the hole at the end of the syringe handle,or by clipping the tube ends with a finger nailclipper. Connect the Draeger tube to the otherend of the needle’s tubing. The arrow on the sideof the Draeger tube should point away from theneedle. With the second piece of tubing,connect the Draeger tube to the syringe.
7. After 30 minutes, insert the Draeger tubeapparatus needle into a stopper. Insert a secondneedle into one of the other stoppers on the lidto allow air flow into the head space during thegas sampling. The second needle should beinserted just before the head space is sampled.
Step-by-Step Instructions, Demonstration 2

Soil Biology and Ecology Unit 2.3 | 29
9. On the Soil Respiration Data worksheet, recordthe temperature in Celsius at the time ofsampling. On the Draeger tube, read the “n=1”column if 100 cc was sampled or the “n=5”column if 500 cc was sampled. The % CO
2
reading should be an estimate of the highestpoint that the purple color can be easilydetected. Enter this reading on the SoilRespiration Data worksheet.
10. Remove the thermometer, Draeger apparatusneedle, air flow needle, and the lid from the ring.If this is the first respiration measurement, leavethe ring in the soil for the infiltrationmeasurement.
(This description of the soil respirationmeasurement was taken from the USDA SoilQuality Test Guide, which you may want to consultfor more details).
CALCULATIONS
Soil Respiration (lb CO2 - C/acre/day) = PF x TF x
(%CO2 - 0.035) x 22.91 x H
PF pressure factor = 1
TF temperature factor = (soil temperature inCelsius + 273) ÷ 273
H inside height of ring = 5.08 cm (2 inches) if notmeasured
INTERPRETATION OF SOIL RESPIRATION VALUES
In general, a higher respiration rate indicates bettersoil quality. Low respiration rate, when soil tem-perature and moisture are favorable for biologicalactivity, would indicate less than desirable organicmatter levels. This value must be interpreted withinthe context of other indicators. For example, a verylow nitrate concentration plus a high respirationrate may indicate a high nitrogen immobilizationrate, possibly due to the addition of crop residuesor other soil amendments that possess wide C:Nratios. Some general guidelines to interpretingrespiration values are presented in Table 1. Theseare only guidelines and should not be applied toevery soil type and management situation.
TABLE 1. GENERAL SOIL RESPIRATION CLASS RATINGS AND SOIL CONDITION AT OPTIMUM SOIL TEMPERATURE ANDMOISTURE CONDITIONS, PRIMARILY FOR AGRICULTURAL LAND USES (Woods End Research, 1997)
SOIL RESPIRATION CLASS SOIL CONDITION
(lbs. CO2-C/ac/day)
0 No soil activity Soil has no biological activity and is virtually sterile.
< 9.5 Very low soil activity Soil is very depleted of available organic matter and has littlebiological activity.
9.5 - 16 Moderately low soil activity Soil is somewhat depleted of available organic matter, andbiological activity is low.
16 - 32 Medium soil activity Soil is approaching or declining from an ideal state ofbiological activity.
32 - 64 Ideal soil activity Soil is in an ideal state of biological activity and has adequateorganic matter and active populations of microorganisms.
> 64 Unusually high soil activity Soil has a very high level of microbial activity and has highlevels of available organic matter, possibly from the additionof large quantities of fresh organic matter or manure.
8. Over a 15-second span, draw the syringe handleback to the 100 cc reading (1 cc = 1 ml). [If thereading is less than 0.5%, take four additional100 cc samples of the head space through thesame Draeger tube. To do this, disconnect thetube from the syringe to remove the air, andreconnect the tube to the syringe. Take another100 cc sample. Repeat.]
Step-by-Step Instructions, Demonstration 2

Soil Biology and Ecology30 | Unit 2.3
A high soil respiration rate, indicative of highbiological activity, can be a good sign of rapiddecomposition of organic residues into nutrientsavailable for plant growth. However, decomposi-tion of the stable organic matter is detrimental tomany physical and chemical processes such asaggregation, cation exchange, and water holdingcapacity. Also, immediately following a tillageoperation, CO
2 evolution can rise dramatically due
to exposure of organic matter to organisms andoxygen. Also, soil respiration can rise dramaticallyafter rainfall. The rise in soil respiration is affectedby the length of time the soil is dry before therainfall event.
Under dry conditions, soil respiration tends to behigher in the crop row than in the interrow. Thehigher respiration rates are attributed to thecontribution from plant roots. Under wet condi-tions, there tends to be no difference in respirationbetween the row and interrow. When the soilinterrow is compacted (wheel track) and the soil iswet, soil respiration tends to be lower than in therow. The lower soil porosity accounts for the lowerrespiration rate under compacted conditions.
Biological activity is a direct reflection of thedegradation of organic matter in the soil. Thisdegradation indicates that two processes areoccurring: (1) loss of soil carbon and (2) turnover ofnutrients. Some optimum soil respiration rate, thatbalances the long-term detrimental aspects of soilcarbon loss and soil nutrient turnover, must bedefined.
DISCUSSION QUESTIONS
1. Compare soil respiration results for differentsites. How may management practices on thedifferent sites have influenced results?
2. If measurements were made before and afterwetting soil, compare before and after results.How does soil moisture influence biologicalactivity?
3. Would it be possible to estimate all carbonimports and exports to a soil system? Whatinformation would you need to start to makesuch an estimate?
Step-by-Step Instructions, Demonstration 2

Soil Biology and Ecology Unit 2.3 | 31
Demonstration 3: Earthworm Populations
for the instructor
OVERVIEW
You have a choice of two methodsfor this demonstration. The shovel-count method will be more tediousfor the students because they willhave to sort through the soil andremove all earthworms. Thevermifuge method may take a littlemore effort at first to gather thematerials needed, but it will makethe students’ work easier.
MATERIALS
SHOVEL-COUNT METHOD
• Shovels
• Earthworm Data worksheets (appendix 5)
• Pencils
VERMIFUGE METHOD
• Sample rings*
• Clippers
• Watering can
• Scoop
• Stirring rod
• Fresh water
• Jars
• Earthworm Data worksheets (appendix5)
• Pencils
• Ground yellow mustard seed (available in bulk fromhealth food stores or from herb companies)**
*Sample rings define the sample area and prevent vermi-fuge from escaping sample area. A simple design is to cutthe top 8–12 inches from a 5-gallon drum and weld on apiece of metal pipe that overhangs each side by 6 inches touse as a handle. The ring is pressed into the soil to 2–3inches depth, and vermifuge is added within the samplering. Sample rings can also be fashioned from sheet metal,housing duct pipes, or large clean paint cans with thebottom cut off.
**60 ml (volume) or 32 grams of yellow mustard powderto 4.5 liters of tap water = 13 ml/1 liter or 7g/liter.4.5 liters of vermifuge is the amount required per samplearea in this demonstration.
Instructor’s Demonstration 3 Outline

Soil Biology and Ecology32 | Unit 2.3
PREPARATION
SHOVEL-COUNT METHOD
For the shovel-count method, very little prepa-ration is required. Identify sample areas, try tocollect a similar soil volume at each location,and record results.
VERMIFUGE METHOD
The vermifuge method requires more prepara-tion. Sample rings must be obtained or made.Other materials must be gathered. To minimizethe amount of time needed for the demonstra-tion, sample rings can be set out the day before.Ideally a minimum of 4 can be set out perhabitat. Select areas with contrasting manage-ment regimes. Possible habitats include or-chard, row crop, fallow, and uncultivated fieldsoils.
To begin the demonstration, gather group atone sample ring to explain technique. Divideclass evenly among the number of sample ringsand have each “ring-team” collect their sample.Have one person in each team do a shovel-count at each site for comparison. Collectresults and derive an average abundance perhabitat. Observe species differences and discussresults.
PROCEDURE
1. Select sample area
2. Place sample rings on the surface of the siteand push them several inches into the soil.
3. Carefully clip vegetation and removed alllitter from inside sample area.
4. Slowly sprinkle 4.5 liters of vermifuge intoeach sample area, distributing it evenly overthe entire surface.
5. After all of the vermifuge solution infiltratesthe soil, wait 10 minutes, and make a secondvermifuge application (4.5 liters).
6. Collect all earthworms that surface inside thesample area.
7. After 10 minutes elapse since infiltration ofthe second vermifuge application, use a handspade to dig through the surface layer of soil(~5 cm deep) and collected any moreearthworms found there.
8. Rinse earthworms in water, drain, and storein containers inside an insulated cooler withice packs (unless samples are to be countedin the field and returned to the sample area).
9. An alternate method that does not require asample ring can be found in the USDA SoilQuality Test Kit Guide, which is available onthe internet (see Resources section).
PREPARATION TIME
For the shovel-count method, 0.5 hour is allthat is needed. For the vermifuge method,several hours or more may needed to gathermaterials.
DEMONSTRATION TIME
1.5–2 hours
DISCUSSION QUESTIONS
1. Most earthworm species found in farmedsoils in the U.S. were not present in thosesoils 400 years ago. Where do you think theycame from?
2. Compare your findings from differenthabitats. Which habitats had the mostearthworms per sample area? Which had thehighest diversity (greatest number ofspecies)? Why?
3. Determine what ecological types ofearthworm were present in each sample area(see Table 2, page 34). How do you thinkthese results were influenced by soilmanagement practices in those areas.Consider factors such as amount and type ofsoil disturbance, organic matter inputs,presence of surface organic layer, etc.
4. How do these findings relate to agriculturalproductivity and sustainability?
5. If you were in charge of managementdecisions for the farm soils that weresampled, would you alter any practices basedon this information? Why?
Instructor’s Demonstration 2 Outline

Soil Biology and Ecology Unit 2.3 | 33
Demonstration 3: Earthworm Populations
step-by-step instructions for students
INTRODUCTION
Earthworms are representative of themany organisms that make up soil foodwebs, and their abundance can be anindicator of soil biological activity.
There are a number of ways to estimate howmany earthworms are living in a particularfield. Perhaps the simplest is the shovel-count: turn over a shovel-full of soil and countthe worms present. Dig down 8 inches to afoot, and count every earthworm you canfind in the shovel-full. Do this in half-a-dozenor more spots in each soil type on your landand come up with an average for each. If youfind 5 to 10 worms per shovel-full, thatrepresents a fairly healthy earthwormcommunity. If this is done at about the sametime each year the results will give someindication of how management practices areaffecting earthworm populations.
Keep in mind that earthworm populationsare very patchily distributed, and theirlocation and abundance are heavily influ-enced by soil moisture, temperature, organicmatter, time of year, and probably severalother variables such as barometric pressure.For these reasons, a sufficient number ofsamples must be collected in order toaccurately characterize earthworm popula-tions in a particular field. Using more stan-dardized sampling methods may also help.
Another method for sampling earthwormsuses a vermifuge, or chemical irritant, whichcauses the earthworms to burrow to the soilsurface, where they can be collected by hand.For many years the standard vermifuge hasbeen a very dilute solution of formalin (about8 ml formalin in 4.5 liters of water). However,recent studies have shown that mustardpowder in water can be equally as effective.
Those interested in developing an even greater depth of under-standing about earthworm ecology and how it interacts withfarming may want to do more than just count numbers ofearthworms present. Earthworms can be classified according tosome simple physical characteristics that are directly related totheir ecological roles in soil. Table 2 (next page) highlights thethree types of earthworms.
Try using Table 2 to determine if you have more than one type ofearthworm in your samples. Most California farm soils haveendogeic earthworms, but epigeic and anecic species are rare.Epigeic species are more likely to be found in fields that have apermanent organic mulch on the surface. They may be addedalong with composts, but are not likely to thrive in the absence ofan organic cover. Anecic species are desirable because of thework they do incorporating organic matter into the soil, mixingsurface and deeper soil horizons, and creating deep channels foraeration, infiltration, and easy root penetration. Anecic earth-worms could be introduced by direct inoculation, but transferringblocks of soil (one cubic foot each) from an area with a largeearthworm population into a farm soil might work better.
Another idea is to set aside a small portion of a farm to bemanaged as an earthworm reservoir. If needed, the soil could belimed to bring it near pH 7, fertilized, irrigated regularly, and acover crop established and cut periodically to provide an organicmulch as food and cover. A population of an anecic species couldbe introduced into this area and built up. Nightcrawlers can bepurchased from bait dealers, who generally get them fromnightcrawler harvesters in the Pacific Northwest.
From this reservoir, blocks could periodically be taken andintroduced into the field. This might be done each year in the fallwhen earthworm activity is increasing. Remember to provide anorganic mulch. The rate of spread would vary with species andconditions in the field. Lumbricus terrestris, the nightcrawler, iscapable of traveling at least 19 meters on the soil surface in thecourse of one evening foray.
Step-by-Step Instructions, Demonstration 2

Soil Biology and Ecology34 | Unit 2.3
MATERIALS NEEDED
Assemble materials as per instructor’s outline
SHOVEL-COUNT METHOD
1. For the shovel-count method, very littlepreparation is required. Identify sample areas,try to collect a similar soil volume at eachlocation, and record results.
VERMIFUGE METHOD
1. Select sample area
2. Place sample rings on the surface of the siteand push them several inches into the soil.
3. Carefully clip vegetation and removed all litterfrom inside sample area.
4. Slowly sprinkle 4.5 liters of vermifuge into eachsample area, distributing it evenly over theentire surface.
5. After all of the vermifuge solution infiltratesthe soil, wait 10 minutes, and make a secondvermifuge application (4.5 liters).
6. Collect all earthworms that surface inside thesample area.
7. After 10 minutes elapse since infiltration of thesecond vermifuge application, use a handspade to dig through the surface layer of soil(~5 cm deep) and collected any moreearthworms found there.
8. Rinse earthworms in water, drain, and store incontainers inside an insulated cooler with icepacks (unless samples are to be counted in thefield and returned to the sample area).
9. An alternate method that does not require asample ring can be found in the USDA SoilQuality Test Kit Guide, which is available in theinternet (see Resources section).
TABLE 2. THREE DIFFERENT TYPES OF EARTHWORMS
Step-by-Step Instructions, Demonstration 3
WHAT THEY WHERE THEY WHAT THEY MEANINGGROUP LOOK LIKE LIVE EAT OF NAME EXAMPLE
Epigeic small; dark red or areas with a lot of large proportion epi = on Lumbricusbrown; fast growing organic matter: of diet is organic Gaia = earth rubella,move quickly forest litter layer; matter Eisenia fetida
manure piles; cool (red worm,compost piles manure worm)
Endogeic small to medium; continous burrows mixture of endo = Allolobophoralight or no pig- in soil; often found buried organic within chlorotica,mentation; slower in root ball; generally matter and Gaia = earth Aporrectodeamoving feed and defecate mineral soil, caliginosa
below ground decaying roots
Anecic large and very build permanent, feed by pulling unknown Aporrectodeamuscular; wedge- vertical burrows that organic matter longashaped tail; color are very deep; from surface Lumbricuson front end, less raised midden of down into terrestrison tail end; slow castings and residue burrow before (night-crawler)growing marks burrow ingesting
entrance

Soil Biology and Ecology Unit 2.3 | 35
Demonstration 4: Soil Arthropods
for the instructor
OVERVIEW
For this short demonstration, bothof these exercises provide a hands-on, show-and-tell of soil arthropods.You should have keys toidentification available, and somefamiliarity with what kinds ofanimals students are likely to find.
MATERIALS
• Cups (plastic drink cups work well)
• Small trowel
• Funnels (steep-sided funnels with no seams work well;inverted polypropylene Erlenmeyer flasks with bottomsremoved are excellent. 500 millileter flasks for 5 x 5centimeter cores, 2000 millileter flasks for compost orlitter samples)
• Light source (4 to 20 watts only—7 watt “Christmas”style lights work well)
• Screen (to place in the bottom of funnel to keep samplematerial in the funnel)
• Jars
• Dissection microscope, hand lenses
• Soil Arthropod Data worksheets (appendix 6)
PREPARATION
PITFALL TRAPPING
Select sample areas in different habitats. Try for a minimum of3 or 4 samples per habitat. Traps can be set 24 to 48 hours inadvance of the demonstration. Traps can also be collectedbefore demonstration if time is at a minimum, although itwould be useful to show students how traps were set.
Bury the cup so that the top edge is flush with the soil surface.To prevent cup from filling with soil during this process, it ishelpful to bury 2 cups together, one inside the other. When youare finished burying them, remove the top cup, and the oneunderneath should be free of soil. Opening may be left open,or covered with a board, leaving enough room between thepitfall and cover for free access by surface roaming creatures.If collected frequently, pitfalls may be left empty, or filledpartly with water, so that live specimens are obtained.
Pitfalls left in place for more than a day or two should have apreservative added. This prevents the creatures from devouringone another. Ethol glycol (antifreeze) is commonly used, as is70% alcohol, or 10% formalin. Each of these possessesattractive properties for certain creatures.
Instructor’s Demonstration 4 Outline

Soil Biology and Ecology36 | Unit 2.3
TULLGREN FUNNELS
Collect samples from various habitats and carefullyplace in funnels. If too much sample material fallsthrough funnel, add more screens, or a piece ofcoarse cheesecloth.
Place a wide-mouth jar containing liquid under thefunnel. Use water if you want to keep animals alive.Use alcohol (70%) with some glycerin added if youwant to preserve specimens. Do not shake ordisturb funnels, in order to keep sample jars as freeof soil as possible. Let samples stand in funnels withno light for 1 day. Turn lights on and leave them onfrom second to seventh day.
Samples can be collected and extracted in advanceof demonstration, although as with pitfall traps, itwould be useful to demonstrate for students howsamples were collected, and how extraction funnelswork.
PROCEDURE
Observe collections under magnification. If livecollections are made, students have the opportunityto observe behavioral adaptations of the animals(e.g., springing springtails, fast-moving predatorslike centipedes, or mesostigmatid mites, slower-moving fungal grazers like oribatid mites andmillipedes). Have simple keys available for helpwith identification. For a quantification exercise,have students count species, or functional groups,and calculate a diversity index for comparinghabitats.
PREPARATION TIME
1 hour or more, depending on which exercisesare followed, and what materials are availableor need to be obtained.
DEMONSTRATION TIME
From just 0.5 hour for a brief show-and-tell,where students observe samples previouslycollected, to 1 to 2 hours if students are in-volved in collecting samples, observing, andquantifying.
DISCUSSION QUESTIONS
1. Can you guess which animals might bepredators? Which ones might be grazers?
2. What effects do each habitat that thesamples were collected from have on the soilorganisms found there? Think about sizes ofcreatures, diversity, food-web interactions,pigmentation, and so on.
3. Which habitats had greatest abundance?Which has greatest diversity? Why?
4. What effects do you think different soilmanagement practices have on soilarthropods? Besides the various effects oforganic matter inputs, think also about theinfluence of physical disturbance.
Instructor’s Demonstration 4 Outline

Soil Biology and Ecology Unit 2.3 | 37
Hands-On Exercise:Carbon and Nitrogen Mineralization
for students
OVERVIEW
A major function of the soil food web isto convert organic matter into forms ofnutrients that plants can use. Thefollowing is an exercise to estimate howmuch mineral N (nitrate and ammo-nium) is coming from organic inputs.This exercise is a simplification of or-ganic matter composition and thecomplex processes that occur duringdecomposition. Use it as a learning aid.
(based on material from the UC Davis SustainableAgriculture Farming Systems project)
SCENARIO
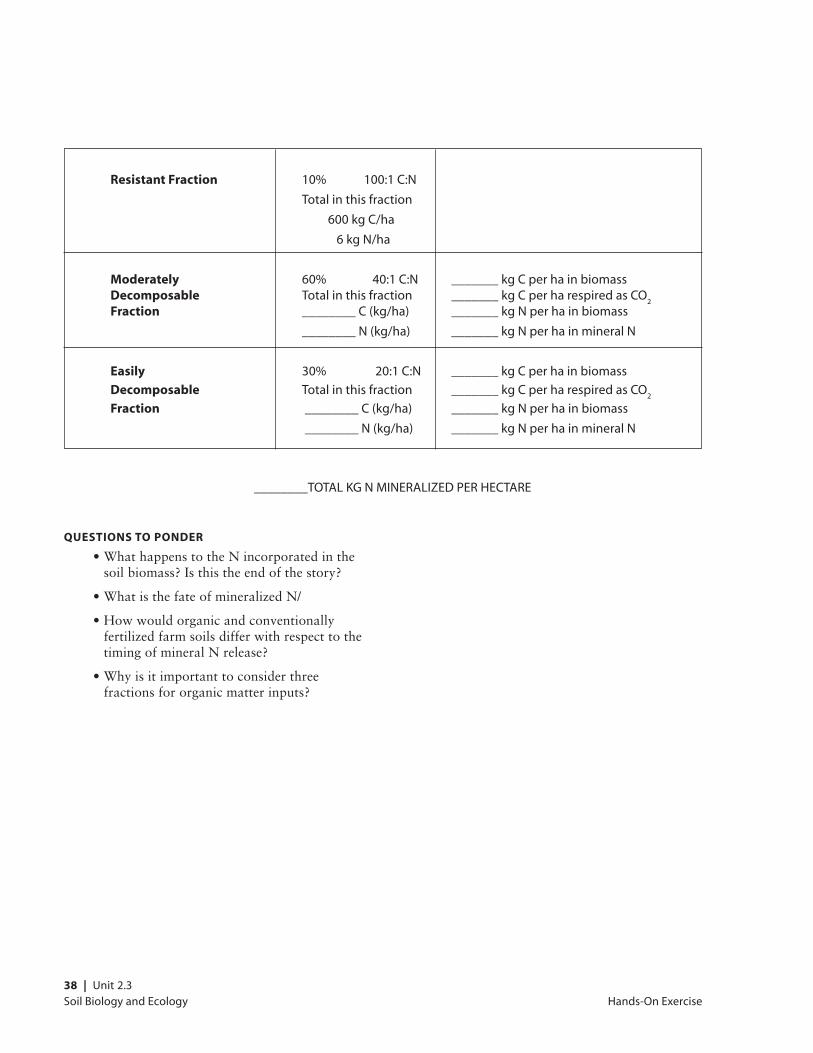
In one year, 12,000kg per hectare* of organicmatter (dry weight) are added to the soil ofan organic farm. These materials includecover crop residues, manure, and cropresidues form the previous year. Overall,carbon (C) accounts for roughly half theweight of the added organic matter.
Ten percent of the organic matter consists ofresistant structural components (e.g., ligninin plant cell walls) that cannot be degradedby soil microorganisms. This fraction has avery high C:N ratio (100:1 or higher). Itbecomes part of the soil organic matter,thereby increasing structure and water-holding capacity of the soil.
Sixty percent of the organic matter consistsof cell components (such as cellulose) thatare moderately decomposable by soilmicroorganisms. The 60% fraction has arelatively high C:N ration of 40:1. Duringdecomposition of this fraction, microbesmust respire 90% of the C (as CO
2) in order to
incorporate 10% of the C into their cells. Similarly, microbesincorporate only 10% of the N from this fraction, so that theremaining 90% is released as mineral N. (Remember that soilmicrobes typically have adequate levels of N, but they are starvedfor C.)
Thirty percent of the organic matter consists of cell tissuecomponents such as sugars, amino acids, and lipids, which areeasily decomposable by soil microorganisms. The C:N ratio ofthis fraction is 20:1. Since microbes are more efficient in utilizingthese compounds, they incorporate 20% of the C and give offonly 80% as CO
2. Microbes also incorporate 20% of the N from
this fraction, while releasing 80% as mineral N.
THE PROBLEM
Your task is to calculate how much nitrogen is mineralized, inorder to determine if the amount of N will be adequate for cropproduction. Fill in the blanks in the chart on the next page withapproximate amounts of C and N. Use the chart to calculate howmuch mineral N is released from the organic matter added overthe course of one year.
*Equivalent to about 5.4 tons per acre
Hands-On Exercise
Soil Biology and Ecology38 | Unit 2.3
Resistant Fraction 10% 100:1 C:N
Total in this fraction
600 kg C/ha
6 kg N/ha
Moderately 60% 40:1 C:N _______ kg C per ha in biomassDecomposable Total in this fraction _______ kg C per ha respired as CO
2
Fraction ________ C (kg/ha) _______ kg N per ha in biomass
________ N (kg/ha) _______ kg N per ha in mineral N
Easily 30% 20:1 C:N _______ kg C per ha in biomass
Decomposable Total in this fraction _______ kg C per ha respired as CO2
Fraction ________ C (kg/ha) _______ kg N per ha in biomass
________ N (kg/ha) _______ kg N per ha in mineral N
________TOTAL KG N MINERALIZED PER HECTARE
QUESTIONS TO PONDER
• What happens to the N incorporated in thesoil biomass? Is this the end of the story?
• What is the fate of mineralized N/
• How would organic and conventionallyfertilized farm soils differ with respect to thetiming of mineral N release?
• Why is it important to consider threefractions for organic matter inputs?
Hands-On Exercise
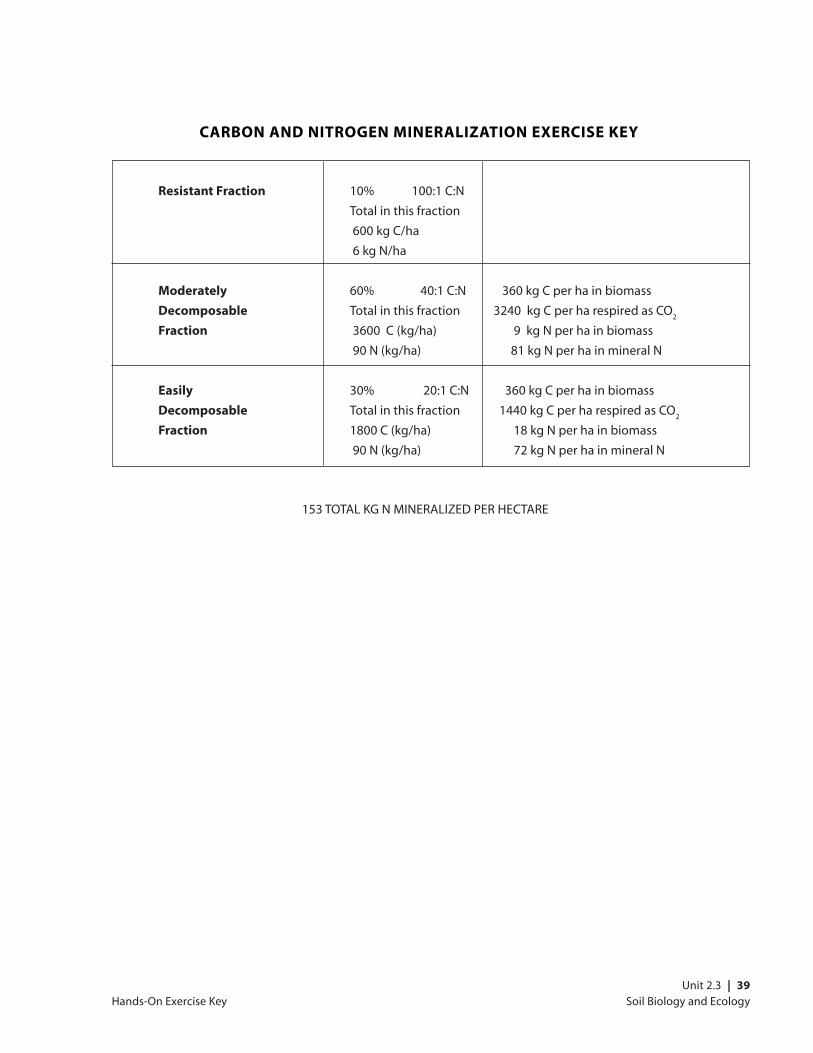
Soil Biology and Ecology Unit 2.3 | 39
Resistant Fraction 10% 100:1 C:N
Total in this fraction
600 kg C/ha
6 kg N/ha
Moderately 60% 40:1 C:N 360 kg C per ha in biomass
Decomposable Total in this fraction 3240 kg C per ha respired as CO2
Fraction 3600 C (kg/ha) 9 kg N per ha in biomass
90 N (kg/ha) 81 kg N per ha in mineral N
Easily 30% 20:1 C:N 360 kg C per ha in biomass
Decomposable Total in this fraction 1440 kg C per ha respired as CO2
Fraction 1800 C (kg/ha) 18 kg N per ha in biomass
90 N (kg/ha) 72 kg N per ha in mineral N
153 TOTAL KG N MINERALIZED PER HECTARE
CARBON AND NITROGEN MINERALIZATION EXERCISE KEY
Hands-On Exercise Key

Soil Biology and Ecology40 | Unit 2.3

Soil Biology and Ecology Unit 2.3 | 41
Assessment Questions
Assessment Questions
1) What is soil?
2) What forms of life exist in soil ecosystems?
3) How would you define a “healthy” agricultural soil?
4) What is a soil food web?
5) What might be some negative effects of the long-term practice of monoculture cropping and theuse of synthetic chemical fertilizer and pest control agents on the soil ecosystem?

Soil Biology and Ecology42 | Unit 2.3
Assessment Questions Key
Assessment Questions Key
1) What is soil?
• An ecological system consisting of inorganicminerals (sand, silt, clay, and nutrients), porespaces, water, gases, organic matter, livingorganisms, and plants
2) What forms of life exist in soil ecosystems?
• Bacteria, fungi, actinomycetes, millipedes,isopods, mollusks, insects, insect larvae,worms and many small vertebrate animalssuch as gophers, ground squirrels, moles, etc.
3) How would you define a “healthy” agriculturalsoil?
• A soil with a set of desirable physical andchemical properties which has the capacity tosustain biological productivity, maintainenvironmental quality, and promote plant,animal, and human health. This would includemany of the following general characteristics:
a) adequate rooting depth for the crop(s) to begrown
b) a 3–5% organic matter content
c) maintains stable soil aggregates
d) allows for rapid water infiltration without soilerosion
e) a low bulk density (good structure withminimal compaction)
f) pH between 6 and 7
g) an extractable nutrient profile within theoptimal range of physiological tolerance forthe crops to be grown
h) good water holing capacity and well-drained
i) high soil biological diversity and activity (soilrespiration)
j) adequate supplies of labile organic matterwith potentially mineralizable nitrogen
k) seasonal soil temperatures from 60–85ºF
4) What is a soil food web?
• The entire assemblage of soil organisms(producers, consumers and decomposers) in asoil ecosystem interacting among and betweentrophic levels
5) What might be some negative effects of thelong-term practice of monoculture croppingand the use of synthetic chemical fertilizer andpest control agents on the soil ecosystem?
• Loss of SOM, reduction in soil aggregation,reduction in nutrient- and water-holdingcapacity, reduction in soil biological diversityand activity, increased pest and diseaseincidence

Soil Biology and Ecology Unit 2.3 | 43
Resources
Resources
PRINT RESOURCES
Coleman, David, and Dak Crossley. 1996. Funda-mentals of Soil Ecology. San Diego, CA: AcademicPress.
The best textbook introduction to the subjectthat I know of. Gives an overview of the basics,and attempts to consider the applications.
Dindal, Daniel, ed. 1990. Soil Biology Guide. NY:Wiley.
A weighty tome, with chapters includingtaxonomic keys and basic biology/ecology onvirtually all organisms found in soils.
Doran, John, and Alice Jones, eds. 1996. Methodsfor Assessing Soil Quality. Special Publication # 49.Madison, WI: Soil Sci. Soc. America.
Soil quality is the current buzzword in soilscience circles. This volume explores theapplication of the idea to sustainableenvironmental management.
Gershuny, Grace, and Joseph Smillie. 1995. TheSoul of Soil: A Guide to Ecological Soil Manage-ment. Davis, CA: AgAccess.
More hands-on and less academic than theabove works, this book is aimed at plantgrowers and has lots of practical information.
Gibbons, Boyd. 1984 (September). Do we treat oursoil like dirt? National Geographic, pp 351-388.
An overview of U.S. soils, from soil biota tobankrupt farmers, done in classic NG style,with lots of great photos and drawings.
Gliessman, Stephen R. 1998. Agroecology: Ecologi-cal Processes in Sustainable Agriculture. Chelsea,MI: Ann Arbor Press.
Provides a brief overview of the mostcommonly used conventional agriculturalpractices and the environmental andagroecological consequences of their use.
Tugel, Arlene, Ann Lewandowski, and Deb Happe-vonArb, eds. 2000. Soil Biology Primer, RevisedEdition. Ankeny, Iowa: Soil and Water Conserva-tion Society.
An excellent overview of soil biology, loadedwith glossy photos and colorful chart. Availablefrom soils.usda.gov/sqi/SoilBiology/soil_biology_primer.htms.
WEB RESOURCES
SOIL QUALITY
Appropriate Technology Transfer for Rural Areas(ATTRA)
www.attra.org/attra-pub/soil-lab.html#Soil%20Healthº
Illinois Soil Quality Initiative (ISQI)
www.aces.uiuc.edu/~asap/resources/isqi/soil-health.html
Life in the Soil
www-crcslm.waite.adelaide.edu.au
Soil and Health Library
www.soilandhealth.org/index.html
Soil Biological Communities
www.blm.gov/nstc/soil/index.html
Soil Ecology Society
vax.wcsu.edu/ses/ses.html
Soil Quality Information Sheets
soils.usda.gov/sqi/sqiinfo.html
Soil Quality Institute—Agronomy Technical Notes
soils.usda.gov/sqi/agronomy.shtml
Soil Quality Institute—NRCS
soils.usda.gov/sqi/
Soil Quality Test Kit
soils.usda.gov/sqi/kit2.html

Soil Biology and Ecology44 | Unit 2.3
The Soil Foodweb: Its Importance in EcosystemHealth, Elaine Ingham
www.rain.org/~sals/ingham.html
The Health of Our Soils: Toward SustainableAgriculture in Canada
sis.agr.gc.ca/cansis/publications/health/intro.html
Soil quality and financial performance of biody-namic and conventional farms in New Zealand.1993. J.P. Reganold, A.S. Palmer, J.C. Lockhart andA.N. Macgregor. Science 260: 344-349.
www.sarep.ucdavis.edu
University of California Sustainable AgricultureResearch and Education Program (UC SAREP)
www.sarep.ucdavis.edu/soil/websites.htm
Resources
SOURCES OF SUPPLIES
Fisher Scientific, Pittsburgh, PA(800) 766-7000
Scientific Industries227 Blue Bell Ave. Boulder, CO 80302(303) 443-7087

Soil Biology and Ecology Unit 2.3 | 45
SIMPLE HEMI-
PROTEINS FATS CARBOS CELLULOSE CELLULOSE LIGNIN ASH
Oak leaf (young) 9 8 22 13 16 21 6
Oak leaf (old) 3 4 15 16 18 30 5
Pine needle 2 24 7 19 16 23 2
Grass leaf 2 2 13 24 33 14 0
Corn stem 1 2 15 18 30 11 8
Wood 0 4 2 22 47 22 1
Horse manure 7 2 5 24 28 14 9
Bacteria 50 to 60 10 to 35 5 to 30 4 to 32 0 0 5 to 15
Fungi 14 to 52 1 to 42 8 to 60 2 to 15 0 0 5 to 12
Earthworm 54 to 72 2 to 17 11 to 17 0 0 0 9 to 23
Arthropods 38 to 50 13 to 26 14 to 31 5 to 9 0 0 0
Steer carcass 39 50 0 0 0 0 11
Appendix 1: Major Organic Components of Typical Decomposer Food Sources
Appendix 1

Soil Biology and Ecology46 | Unit 2.3
Appendix 2: Litter Bag Data Sheet (for Demonstration 1)
Matter Decomposition in Litter Bagsburial date: location:
retrieval date: details:
LITTER BAG % REMAINING AVERAGE PER OTHER # HABITAT (VISUAL ASSESSMENT ) HABITAT OBSERVATIONS
1
2
3
4
5
6
7
8
9
10
11
12
13
14
15
16
17
18
19
20
21
22
23
24
25
26
27
28
29
30
31
32
33
34
Appendix 2

Soil Biology and Ecology Unit 2.3 | 47
Appendix 3: Litter Bag Data Sheet ExampleOrganic Matter Decomposition in Litter Bags Exampleburial date: location:
retrieval date: details:
LITTER BAG % REMAINING AVERAGE PER OTHER # HABITAT (VISUAL ASSESSMENT ) HABITAT OBSERVATIONS
1 compost 5
2 compost 25
3 compost 80
4 compost 90 50.0
5 orchard soil 100
6 orchard soil 100
7 orchard soil 70
8 orchard soil 90 90.0
9 raised garden bed 97
10 raised garden bed 99
11 raised garden bed 72
12 raised garden bed 95 90.8
13 row crop 97
14 row crop 95
15 row crop 94
16 row crop 96 95.5
17 soil surface 100
18 soil surface 100
19 soil surface 100
20 soil surface 99 99.8
Appendix 3

Soil Biology and Ecology48 | Unit 2.3
Appendix 4: Soil Respiration Data Sheet (for Demo. 2)S
oil R
esp
iratio
n (a
t Initia
l Fie
ld W
ate
r Co
nte
nt)
Da
te:
Samp
leR
ing
StartEn
dSo
ilD
raeger
Soil
Draeg
erSo
ilsite
heig
ht
time
time
temp
ºCtu
be
respiriratio
ntu
be
respiratio
n%
CO
2 (n=
1)lb
s C/A
/ day*
%C
O2 (n
=5)
lbs C
/A/d
ay*
10.0
0.0
20.0
0.0
30
.00
.0
40
.00
.0
50
.00
.0
60
.00
.0
70
.00
.0
80
.00
.0
So
il Re
spira
tion
(at le
ast 6
ho
urs a
fter irrig
atio
n o
r soil w
ettin
g)
Da
te:
10
.00
.0
20
.00
.0
30
.00
.0
40
.00
.0
50
.00
.0
60
.00
.0
70
.00
.0
80
.00
.0
* So
il resp
iration
= P
F x ((So
il Tem
p C
+ 2
73
)/27
3) x (C
O2 %
- 0.0
35
) x 22
.91
x Rin
g H
t = lb
s CO
2 -C/acre
/day
PF =
Pre
ssure
Factor =
‘raw’ b
arom
etric p
ressu
re in
inch
es H
g/2
9.9
inch
es.
No
te: Th
is adju
stme
nt is n
ece
ssary at ele
vation
s > 3
,00
0 ft.; o
the
rwise
PF =
1
H =
5.0
8 cm
(if no
t me
asure
d)
Co
nve
rsion
: De
gre
es C
elsiu
s = 5
/9 x (D
eg
ree
s Fahre
nh
eit - 3
2)
No
tes:
Appendix 4

Soil Biology and Ecology Unit 2.3 | 49
Appendix 5: Earthworm Data Sheet (for Demonstration 3)
�
SAMPLE EPIGEIC ENDOGEIC ANECIC TOTAL EARTHWORMS SITE EATHWORMS EARTHWORMS EARTHWORMS EARTHWORMS PER SQ METER
1
2
3
4
5
6
7
8
9
10
11
12
NOTES:
Epigeic:small; dark red or brown color; fast growing; move quickly
Endogeic:small to medium; light or no pigmentation; slower moving
Anecic:large and very muscular; wedge-shaped tail;
color on front end, less on tail end; slow growing
DATE:
Appendix 5

Soil Biology and Ecology50 | Unit 2.3
Appendix 6: Arthropod Data Sheet (for Demonstration 4)
sample site:
isopods
springtails
spiders
mites
earwigs
aphids
beetles
fly larvae
fly adults
ants
wasps
crickets
millipedes
centipedes
slugs & snails
1 2 3 4 5 6 7 8 9 10 11
Appendix 6