the ecology and conservation biology
TRANSCRIPT
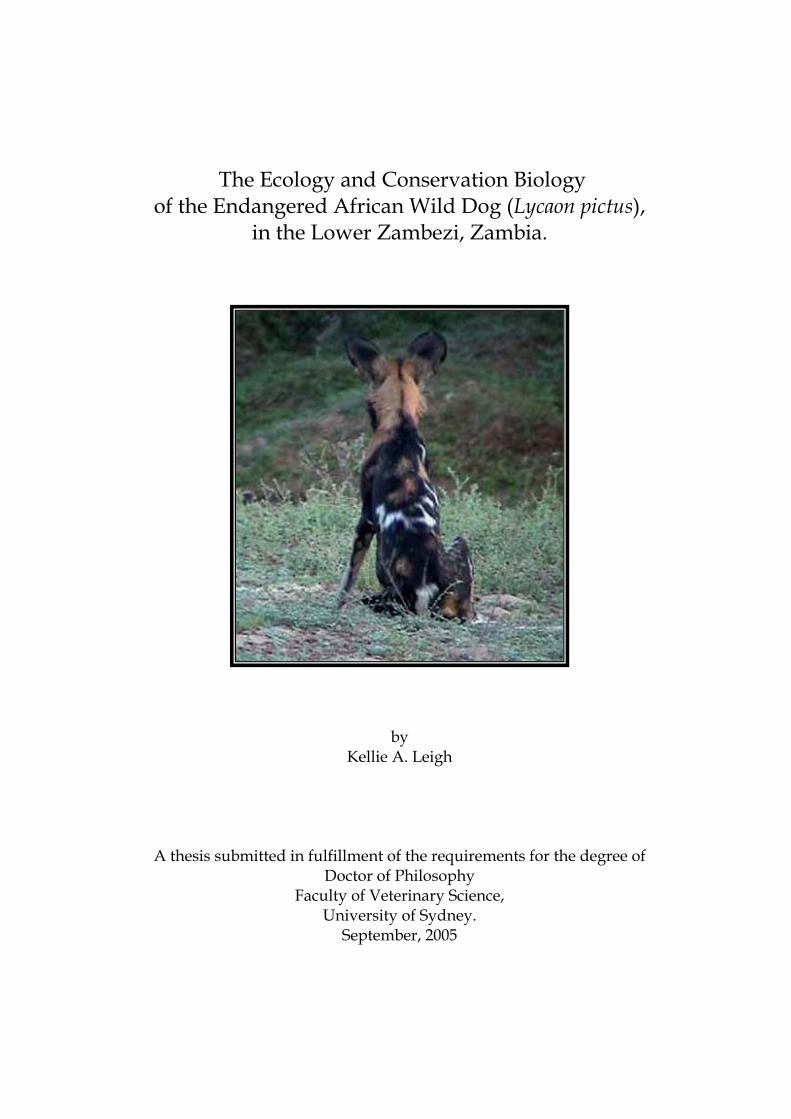
The Ecology and Conservation Biology of the Endangered African Wild Dog (Lycaon pictus),
in the Lower Zambezi, Zambia.
by Kellie A. Leigh
A thesis submitted in fu ments for the degree of lfillment of the requireDoctor of Philosophy
Faculty of Veterinary Science, University of Sydney.
September, 2005

STATEMENT OF RESPONSIBILITY This thesis is my own original work, except where specifically acknowledged.
September, 2005
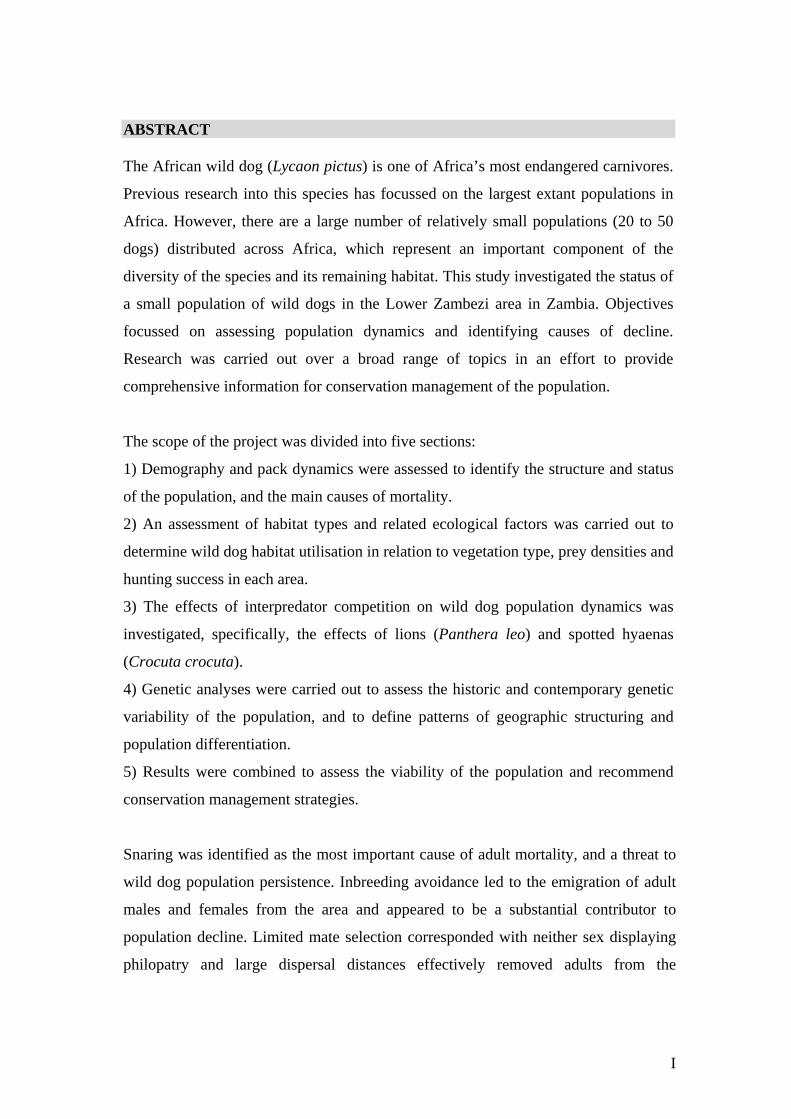
ABSTRACT The African wild dog (Lycaon pictus) is one of Africa’s most endangered carnivores.
Previous research into this species has focussed on the largest extant populations in
Africa. However, there are a large number of relatively small populations (20 to 50
dogs) distributed across Africa, which represent an important component of the
diversity of the species and its remaining habitat. This study investigated the status of
a small population of wild dogs in the Lower Zambezi area in Zambia. Objectives
focussed on assessing population dynamics and identifying causes of decline.
Research was carried out over a broad range of topics in an effort to provide
comprehensive information for conservation management of the population.
The scope of the project was divided into five sections:
1) Demography and pack dynamics were assessed to identify the structure and status
of the population, and the main causes of mortality.
2) An assessment of habitat types and related ecological factors was carried out to
determine wild dog habitat utilisation in relation to vegetation type, prey densities and
hunting success in each area.
3) The effects of interpredator competition on wild dog population dynamics was
investigated, specifically, the effects of lions (Panthera leo) and spotted hyaenas
(Crocuta crocuta).
4) Genetic analyses were carried out to assess the historic and contemporary genetic
variability of the population, and to define patterns of geographic structuring and
population differentiation.
5) Results were combined to assess the viability of the population and recommend
conservation management strategies.
Snaring was identified as the most important cause of adult mortality, and a threat to
wild dog population persistence. Inbreeding avoidance led to the emigration of adult
males and females from the area and appeared to be a substantial contributor to
population decline. Limited mate selection corresponded with neither sex displaying
philopatry and large dispersal distances effectively removed adults from the
I
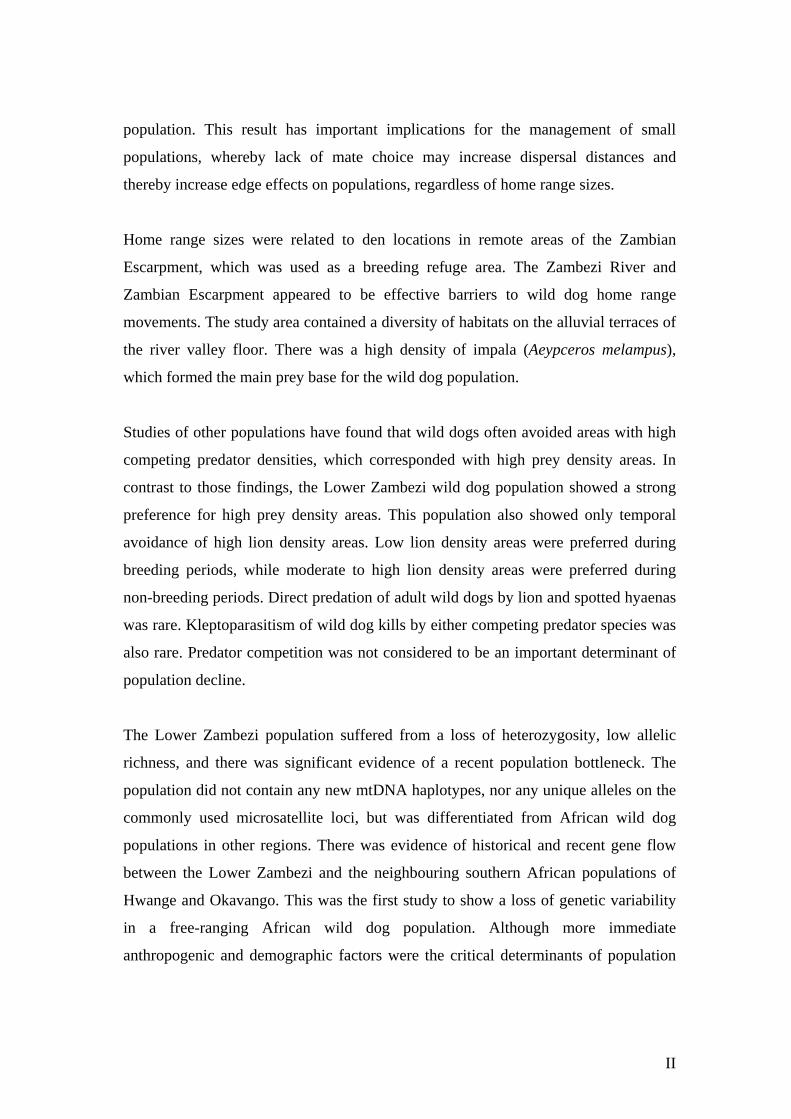
population. This result has important implications for the management of small
populations, whereby lack of mate choice may increase dispersal distances and
thereby increase edge effects on populations, regardless of home range sizes.
Home range sizes were related to den locations in remote areas of the Zambian
Escarpment, which was used as a breeding refuge area. The Zambezi River and
Zambian Escarpment appeared to be effective barriers to wild dog home range
movements. The study area contained a diversity of habitats on the alluvial terraces of
the river valley floor. There was a high density of impala (Aeypceros melampus),
which formed the main prey base for the wild dog population.
Studies of other populations have found that wild dogs often avoided areas with high
competing predator densities, which corresponded with high prey density areas. In
contrast to those findings, the Lower Zambezi wild dog population showed a strong
preference for high prey density areas. This population also showed only temporal
avoidance of high lion density areas. Low lion density areas were preferred during
breeding periods, while moderate to high lion density areas were preferred during
non-breeding periods. Direct predation of adult wild dogs by lion and spotted hyaenas
was rare. Kleptoparasitism of wild dog kills by either competing predator species was
also rare. Predator competition was not considered to be an important determinant of
population decline.
The Lower Zambezi population suffered from a loss of heterozygosity, low allelic
richness, and there was significant evidence of a recent population bottleneck. The
population did not contain any new mtDNA haplotypes, nor any unique alleles on the
commonly used microsatellite loci, but was differentiated from African wild dog
populations in other regions. There was evidence of historical and recent gene flow
between the Lower Zambezi and the neighbouring southern African populations of
Hwange and Okavango. This was the first study to show a loss of genetic variability
in a free-ranging African wild dog population. Although more immediate
anthropogenic and demographic factors were the critical determinants of population
II
decline, the loss of genetic variability has important implications for the conservation
of the remaining small and fragmented wild dog populations in Africa.
Results showed that due to its small size the population is likely to have suffered from
inverse density dependence and Allee effects on dispersal and reproductive success.
Management recommendations focussed on mitigating anthropogenic causes of
mortality, and improving connectivity with a larger, potential source population to
increase the probability of successful dispersal and to restore genetic diversity. The
high density prey base, small home range sizes and low levels of interpredator
competition detected in this study suggest that the area has the capacity to support a
large and potentially viable population of wild dogs if appropriate management
strategies are implemented.
III
ACKNOWLEDGEMENTS
I am grateful to the Zambia Wildlife Authority for granting the permits necessary to
carry out this research. The research was funded by a wide range of generous donors,
who made the project possible. For providing research grants I would like to thank;
Mads Sandau-Jensen and the Danish International Development Agency (DANIDA),
and The Wallace Research Foundation, USA. Several Zoological Parks provided
support for the project, including: Sedgwick County Zoo, Kansas, USA; The
Cincinnati Zoo and Botanical Garden, USA; Zoos Victoria, Melbourne, Australia; and
the Western Plains Zoo, Dubbo, Australia. I would also like to thank the private
individual and corporate donors who provided ongoing support for this project:
Yancey Walker Productions USA, Dwight Hibbard, Arthur Vorys, Afrikeye UK,
Pamela Riley, Neil Hardie, Elefriends Australia, Old Mondoro Camp Zambia,
Kanyemba Lodge Zambia, Chongwe River Lodge Zambia, Conservation Lower
Zambezi Zambia, Airwaves Charters Zambia, Philip and Julia Leonard, and
particularly Julie McIntosh of the Classic Safari Company in Sydney for introducing
me to Zambia and the Lower Zambezi.
Many people provided support for my fieldwork in the remote environment of the
Lower Zambezi National Park. Thank you to the managers and guides of the safari
camps in the study area that assisted with reporting wild dog sightings, and after much
harassment, with the collection of wild dog faecal samples. There was always a race
to collect the faeces before the hyaenas or vultures could get them. Conservation
Lower Zambezi (CLZ) assisted with numerous field activities, including making their
anti-poaching aircraft available for charter for aerial tracking, and donating the use of
their darting equipment for wild dog immobilisations. Thanks go to Ian Stevenson and
Leanne Edwards of CLZ, for their friendship and company, especially those long
nights counting spotted hyaenas, and the den walks through the adrenaline grass.
Special thanks to Ian for assisting with snare removals. Thank you to Riccardo
Garbaccio of Kanyemba Lodge who generously donated assistance with servicing and
IV
maintaining the project vehicle and equipment, and also provided an oasis of fine
Italian food, friendship and mains electricity when it was most needed.
I am grateful to veterinarians Ian and Noeleen Parsons who donated their time to help
with wild dog immobilisations and collaring, provided support and encouragement
throughout the project, and also raised financial support from the Mazabuka
community. Veterinarian Sally Shiel also donated considerable time, assistance and
equipment for wild dog immobilisations and pathology tests, and offered logistical
support in Lusaka, as well the warm hospitality of her family and home.
Many thanks to John Murphy for those high speed aerial tracking sessions through the
window of the Cessna 206, and to Airwaves Charters for transporting everything from
veterinarians through to wild dog necropsy samples. I am grateful to the safari
operators in the South Luangwa and Kafue National Parks who collected wild dog
sightings reports and faecal samples for the project, and to all the camps that agreed to
store faecal samples in their kitchen freezers. Thanks also to the many ZAWA
Wildlife Police Officers for their interest, enthusiasm and support in reporting
sightings, particularly in the more remote areas of the National Park.
There are many people at the University of Sydney whom I would like to thank. My
supervisor Tony English, who not only accepted me as a PhD candidate, but also
supplied endless encouragement, moral support, and understanding of the difficulties
associated with working in a remote environment in Zambia. My co-supervisor
Herman Raadsma provided advice on genetic analyses, feedback on the final thesis
drafts, a sense of humour and a bar-fridge in the office. Kyall Zenger kindly
introduced me to the world of population genetics and the enormous number of
statistical programs involved. Imke Tammen provided advice and extensive training
to familiarise me with genetic laboratory techniques. To everyone in the Shute
Building who offered help and advice in the laboratory, and patiently tolerated me
returning from field work in the bush each year to ask the same questions all over
again, thank you; Natasha Ellis, Julie Cavanagh, Marilyn Jones, Gina Attard, Marie
Wildridge and Luke Chappel. Peter Thomson, Mat Crowther, Scott King and Neil
V
Hardie all provided helpful comments and advice on the statistical analysis used in
this thesis. Thank you also to Eleanor Bruce and David Chapman from Geosciences
who provided advice and assistance with GIS mapping techniques. The Faculty of
Veterinary Science provided scholarships and grants-in-aid in support of this research,
for which I am grateful.
Lastly I would like to thank my family, for encouraging me to follow my dreams,
even though those dreams took me far from family and friends. Thank you for
appreciating the novelty of having a “canine faecal collector” in the family.
VI
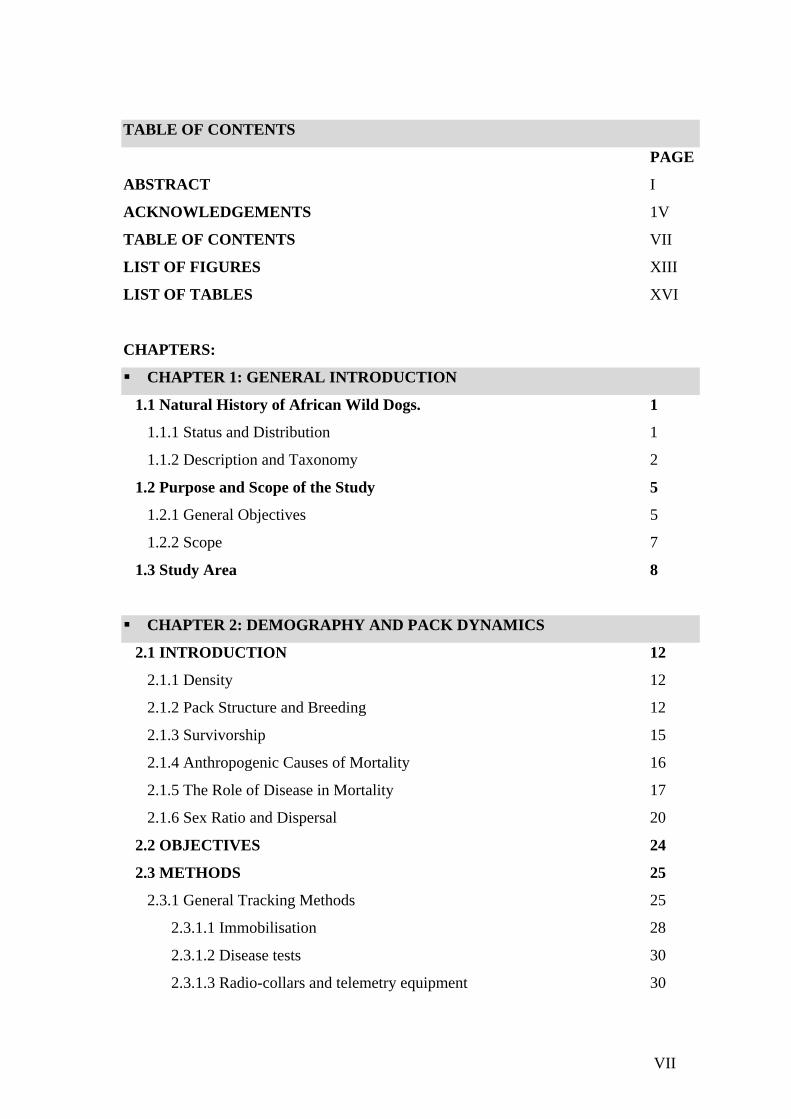
TABLE OF CONTENTS
PAGE
ABSTRACT I
ACKNOWLEDGEMENTS 1V
TABLE OF CONTENTS VII
LIST OF FIGURES XIII
LIST OF TABLES XVI
CHAPTERS:
CHAPTER 1: GENERAL INTRODUCTION
1.1 Natural History of African Wild Dogs. 1
1.1.1 Status and Distribution 1
1.1.2 Description and Taxonomy 2
1.2 Purpose and Scope of the Study 5
1.2.1 General Objectives 5
1.2.2 Scope 7
1.3 Study Area 8
CHAPTER 2: DEMOGRAPHY AND PACK DYNAMICS
2.1 INTRODUCTION 12
2.1.1 Density 12
2.1.2 Pack Structure and Breeding 12
2.1.3 Survivorship 15
2.1.4 Anthropogenic Causes of Mortality 16
2.1.5 The Role of Disease in Mortality 17
2.1.6 Sex Ratio and Dispersal 20
2.2 OBJECTIVES 24
2.3 METHODS 25
2.3.1 General Tracking Methods 25
2.3.1.1 Immobilisation 28
2.3.1.2 Disease tests 30
2.3.1.3 Radio-collars and telemetry equipment 30
VII
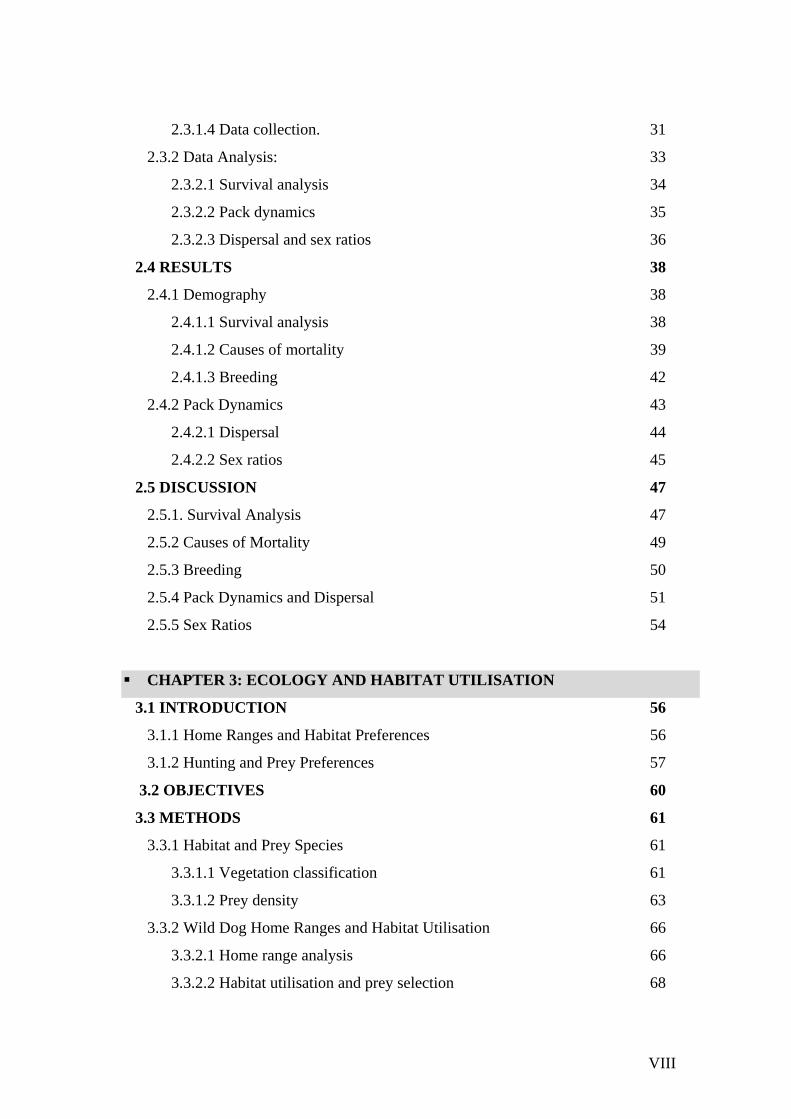
2.3.1.4 Data collection. 31
2.3.2 Data Analysis: 33
2.3.2.1 Survival analysis 34
2.3.2.2 Pack dynamics 35
2.3.2.3 Dispersal and sex ratios 36
2.4 RESULTS 38
2.4.1 Demography 38
2.4.1.1 Survival analysis 38
2.4.1.2 Causes of mortality 39
2.4.1.3 Breeding 42
2.4.2 Pack Dynamics 43
2.4.2.1 Dispersal 44
2.4.2.2 Sex ratios 45
2.5 DISCUSSION 47
2.5.1. Survival Analysis 47
2.5.2 Causes of Mortality 49
2.5.3 Breeding 50
2.5.4 Pack Dynamics and Dispersal 51
2.5.5 Sex Ratios 54
CHAPTER 3: ECOLOGY AND HABITAT UTILISATION
3.1 INTRODUCTION 56
3.1.1 Home Ranges and Habitat Preferences 56
3.1.2 Hunting and Prey Preferences 57
3.2 OBJECTIVES 60
3.3 METHODS 61
3.3.1 Habitat and Prey Species 61
3.3.1.1 Vegetation classification 61
3.3.1.2 Prey density 63
3.3.2 Wild Dog Home Ranges and Habitat Utilisation 66
3.3.2.1 Home range analysis 66
3.3.2.2 Habitat utilisation and prey selection 68
VIII
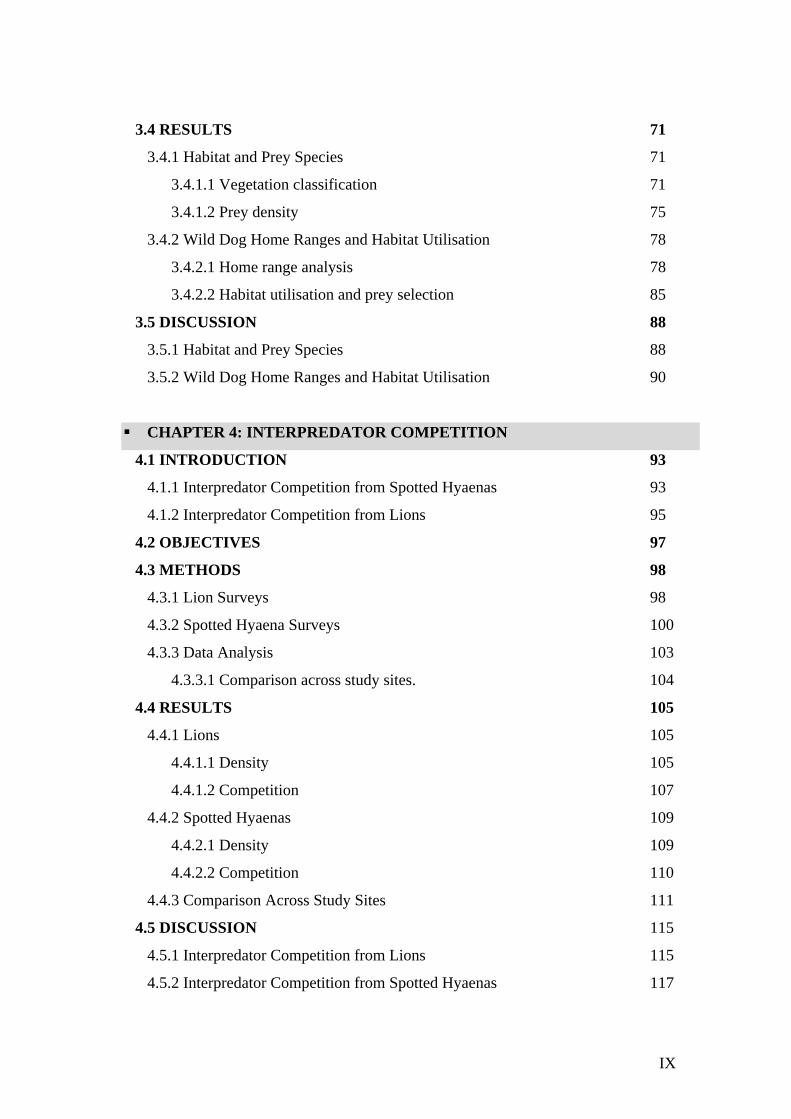
3.4 RESULTS 71
3.4.1 Habitat and Prey Species 71
3.4.1.1 Vegetation classification 71
3.4.1.2 Prey density 75
3.4.2 Wild Dog Home Ranges and Habitat Utilisation 78
3.4.2.1 Home range analysis 78
3.4.2.2 Habitat utilisation and prey selection 85
3.5 DISCUSSION 88
3.5.1 Habitat and Prey Species 88
3.5.2 Wild Dog Home Ranges and Habitat Utilisation 90
CHAPTER 4: INTERPREDATOR COMPETITION
4.1 INTRODUCTION 93
4.1.1 Interpredator Competition from Spotted Hyaenas 93
4.1.2 Interpredator Competition from Lions 95
4.2 OBJECTIVES 97
4.3 METHODS 98
4.3.1 Lion Surveys 98
4.3.2 Spotted Hyaena Surveys 100
4.3.3 Data Analysis 103
4.3.3.1 Comparison across study sites. 104
4.4 RESULTS 105
4.4.1 Lions 105
4.4.1.1 Density 105
4.4.1.2 Competition 107
4.4.2 Spotted Hyaenas 109
4.4.2.1 Density 109
4.4.2.2 Competition 110
4.4.3 Comparison Across Study Sites 111
4.5 DISCUSSION 115
4.5.1 Interpredator Competition from Lions 115
4.5.2 Interpredator Competition from Spotted Hyaenas 117
IX
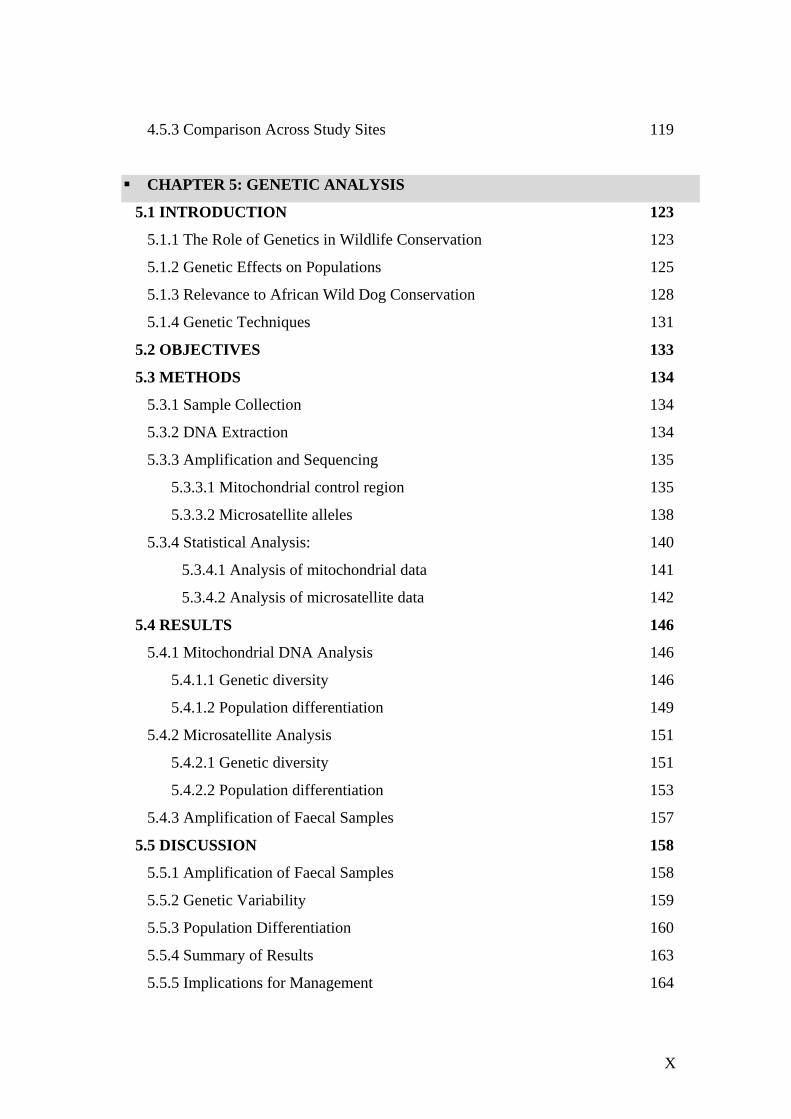
4.5.3 Comparison Across Study Sites 119
CHAPTER 5: GENETIC ANALYSIS
5.1 INTRODUCTION 123
5.1.1 The Role of Genetics in Wildlife Conservation 123
5.1.2 Genetic Effects on Populations 125
5.1.3 Relevance to African Wild Dog Conservation 128
5.1.4 Genetic Techniques 131
5.2 OBJECTIVES 133
5.3 METHODS 134
5.3.1 Sample Collection 134
5.3.2 DNA Extraction 134
5.3.3 Amplification and Sequencing 135
5.3.3.1 Mitochondrial control region 135
5.3.3.2 Microsatellite alleles 138
5.3.4 Statistical Analysis: 140
5.3.4.1 Analysis of mitochondrial data 141
5.3.4.2 Analysis of microsatellite data 142
5.4 RESULTS 146
5.4.1 Mitochondrial DNA Analysis 146
5.4.1.1 Genetic diversity 146
5.4.1.2 Population differentiation 149
5.4.2 Microsatellite Analysis 151
5.4.2.1 Genetic diversity 151
5.4.2.2 Population differentiation 153
5.4.3 Amplification of Faecal Samples 157
5.5 DISCUSSION 158
5.5.1 Amplification of Faecal Samples 158
5.5.2 Genetic Variability 159
5.5.3 Population Differentiation 160
5.5.4 Summary of Results 163
5.5.5 Implications for Management 164
X
CHAPTER 6: GENERAL DISCUSSION AND IMPLICATIONS FOR
MANAGEMENT
6.1 CONCLUSIONS FROM PREVIOUS CHAPTERS 167
6.1.1 Demographics and Causes of Decline 167
6.1.2 Ecology and Habitat Utilisation 168
6.1.3 Interpredator Competition 168
6.1.4 Genetic Analysis 169
6.2 GENERAL DISCUSSION 170
6.2.1 Population Viability 170
6.2.2 Implications for Population Management 174
6.2.2.1 Potential Management Strategies 176
I) Improve connectivity 177
II) Augment the Lower Zambezi population 180
6.3 CONCLUSIONS 183
6.4 ADDITIONAL RESEARCH REQUIRED 184
REFERENCES 185
APPENDICES
APPENDIX 1 210
I) Lower Zambezi wild dog population pedigree tree and 210
pack composition changes for the period 1998 to 2004
APPENDIX 2 212
I) Table 1. Common plant growth forms (adapted from Walker & 212
Hopkins, 1990)
II) Table 2. Vegetation cover classes (adapted from Walker & 212
Hopkins, 1990).
III) Table 3. Simplified structural formation classes used to 212
describe habitats (adapted from Walker & Hopkins, 1990)
IV) Table 4. List of plant species identified in each habitat type 213
XI
APPENDIX 3 216
I) Lion survey form 216
II) Table 1. Lion density values for home range areas over three 218
survey years, shown in Figures 4.2a,b, and c (Chapter 4)
III) Table 2. Spotted hyaena density estimates (adults per km2) 218
for each calling station over four surveys
APPENDIX 4 219
I) Table 1. Mitochondrial DNA nucleotide divergence (dA) 219
between wild dog populations across Africa
II) Table 2. Allelic Richness per locus and population, based on a 219
minimum sample size of 5 diploid individuals
III) Table 3. Microsatellite allele frequencies for Zambian African 220
wild dogs. Sample KAF 1A is from the Kafue NP, sample SL 2A is
from South Luangwa NP, all other samples are from the Lower
Zambezi NP
XII
LIST OF FIGURES PAGE Figure 1.1 Historical and current distribution of Lycaon Pictus 1 in Africa. Figure 1.2 Neighbour joining phylogenetic tree of African 3 wild dog and other canidae species, generated from 372 bp sequence of cytochrome-b mtDNA. Figure 1.3 Map of the general study area. 9
Figure 2.1 Example of wild dog identification record and 26 corresponding identification number. Figure 2.2 Map of protected area boundaries and study area boundaries 28 imposed over a Landsat-7 satellite image of the area (Intec America Corp. USA), including GPS location data for wild dogs. Figure 2.3 Adult male wild dog fitted with an anti-snare radio-collar. 31
Figure 2.4a Kaplan-Meier estimate of the survivor function for 38 the Lower Zambezi population. Figure 2.4b Kaplan-Meier estimate of survival by area grouping. 38 Figure 2.5 Annual survivorship by age class. 39 Figure 2.6a Mean sex ratio of age classes over six years. 46 Figure 2.6b Annual sex ratio of combined adults and yearlings. 46 Figure 3.1.a and b Map of the habitat distribution in the study area, 74 developed from a supervised vegetation classification. Figure 3.2a The relationship between impala density and 77 vegetation visibility. Figure 3.2b The relationship between impala mean herd size and 77 vegetation visibility. Figure 3.3 Comparison of morning (AM) and afternoon (PM) impala 77 density estimates (impala/km2) within different habitats. Figure 3.4 Graph showing the percentage area of home ranges generated 78 from an increasing number of observations.
XIII
Figure 3.5a Map of 100% Minimum Convex Polygon home ranges 80 for packs monitored by radio telemetry. Figure 3.5b Map of 100% Minimum Convex Polygon home ranges 80 for uncollared packs monitored by road tracking and sightings reports. Figure 3.6 Utilisation distributions for annual wild dog home ranges, 82 as density probability surface volume contours, showing 50%, 75% and 95% contour areas. Figure 3.7 Graph of pack size against home range area estimates 84 (100% MCP method). Figure 3.8 Habitat selection (PI) for individual packs. 86 Figure 4.1 Satellite image of the Lower Zambezi, illustrating hyaena 102 calling station locations. Figure 4.2 Map of annual lion densities in the valley floor of the study area. 106 Figure 4.3a Previous analysis of the relationship between lion and wild dog 113 densities across study sites, figure taken from Creel and Creel (1996). Figure 4.3b Current analysis of the relationship between lion and wild dog 113 densities across study sites. Figure 5.1 Phylogenetic relationships of wild dog control region mtDNA 129 haplotypes as published by Girman et al (2001). Figure (a) is a neighbour joining tree (Tamura and Nei, 1993, gamma correction, α=0.5) showing bootstrap support at nodes for neighbour joining (numerator) and maximum parsimony (denominator) trees from 1000 replicates. Figure (b) is a minimum spanning network with the proportional sizes of the nodes indicating the frequency of haplotypes in the entire sample. Figure 5.2 Map of geographic distribution of sampled free-ranging 140 African wild dog populations. Figure 5.3 Hierarchical analysis of mtDNA haplotype diversity in African 149 wild dog populations. Figure 5.4 Neighbour joining tree showing the relationships between 154 African wild dog populations based on Nei’s (1978) standard genetic distance from microsatellite data. Figure 5.5 Neighbour joining tree of individual African wild dogs grouped 156 by proportion of shared alleles.
XIV
Figure 6.1 Graph of wild dog population size over time in the Lower 172 Zambezi from 1998 to 2005. Figure 6.2 A basic diagram of the Allee effect, taken from 173 Courchamp et al (1999). Figure 6.3 Map of protected area boundaries and core study area 178 boundary, imposed over Landsat-7 satellite image of the area. Figure 6.4 Potential wild dog dispersal corridor in eastern Zambia. 179
XV
LIST OF TABLES PAGE Table 2.1. Number of suspected and confirmed causes of mortality in 40 adult and yearling wild dogs. Table 2.2 Titre results for indirect fluorescent antibody tests 42 for pathogens. Table 2.3 Litter size, survivorship to one year of age, and 43 associated number of adults and combined adult-yearlings in each pack. Table 2.4 Summary of dispersal events and group composition. 45 Table 3.1 Vegetation structure and composition for dominant habitats 72 in the study area. Table 3.2 Percentage of the study area covered by each habitat. Values 75 are given for both the entire study area, and for only the study area valley floor. Table 3.3 Impala mean density and cluster size within each habitat. 75 Sampling effort and truncation distances are included for each vegetation type. Table 3.4 Home range sizes and overlap estimates for wild dog packs. 79 Table 3.5 Wild dog prey selection within the study area, showing the 85 proportion of hunting effort spent on each species and the proportion of successful kills and biomass in the diet. Table 3.6 Wild dog habitat selection within the study area, expressed as 85 an index of preference (PI). Table 3.7 Percentage of hunting effort spent on each of the dominant 86 prey species within each habitat type. Table 3.8 Habitat selection during hunting by wild dogs, compared with 87 hunting success (all species) and corresponding impala density in each habitat. Table 4.1 Lion density estimates (adults/km2) and population structure 105 in the study area, from 3 annual surveys. Table 4.2 Index of preference for wild dog use of areas ranked by lion 108 density during wild dog breeding and non-breeding periods, and for annual wild dog data combined.
XVI
Table 4.3 Percentage habitat composition for areas of ranked 109 lion density. Table 4.4 Spotted hyaena population density (adults/km2) in the study 110 area, for three years. Table 4.5 Predator population densities in study sites across sub-Saharan 111 Africa. Table 4.6 Ordinary least-squares regression details, from input data and 114 exponential model as per Creel and Creel (1996). Table 5.1 Mitochondrial DNA haplotypes from eight geographic regions. 147 Data is composed from samples sequenced in this study combined with data from free ranging wild dog populations published in Girman et al. (2001). Table 5.2 Mitochondrial DNA and microsatellite genetic diversity in 148 African wild dog populations. Haplotypic diversity (h) and nucleotide diversity (π) are shown for mtDNA data. Mean expected heterozygosity (He), allelic richness (Al) and average sample size analysed for each locus (n/Locus) are shown for microsatellite data, for 11 loci tested. Table 5.3 AMOVA analysis of geographic groupings of wild dog 150 populations. Table 5.4 FIS values per population and per locus. 152 Table 5.5 Population differentiation. Pairwise ΦST estimates between 153 populations for mtDNA (below diagonal), and pairwise θST estimates for microsatellite markers (above diagonal). Table 5.6 Percentage of individuals not excluded from assignment 155 to each population (probability 0.05 or greater).
XVII