biochemistry lab reporttt
TRANSCRIPT

BIOCHEMISTRY
LAB REPORT
EFFECT OF SUBSTRATE CONCENTRATION ON ENZYME KINETICS
AUTHOR: Dilara Çelebi
DATE:21.04.2015
EVALUATOR : Larisa Besic
SUBBISSION DATE:28.04.2015

Introduction
Enzyme Concentration
In order to study the effect of increasing the enzyme concentration upon the reaction rate, the substrate must be present in an excess amount; i.e., the reaction must be independent of the substrate concentration. Any change in the amount of product formed over a specified period of time will be dependent upon the level of enzyme present. Graphically this can be represented as:
these reactions are said to be "zero order" because the rates are independent of substrate concentration, and are equal to some constant k. The formation of product proceeds at a rate which is linear with time. The addition of more substrate does not serve to increase the rate. In zero order kinetics, allowing the assay to run for double time results in double the amount of product.
Table I: Reaction Orders with Respect to Substrate Concentration
Order Rate Equation Comments
zero rate = k rate is independent of substrate concentration
first rate = k[S] rate is proportional to the first power of substrate concentration
second rate = k[S][S]=k[S]2 rate is proportional to the square of the substrate concentration
second rate = k[S1][S2] rate is proportional to the first power of each of two

reactantsr
The amount of enzyme present in a reaction is measured by the activity it catalyzes. The relationship between activity and concentration is affected by many factors such as temperature, pH, etc. An enzyme assay must be designed so that the observed activity is proportional to the amount of enzyme present in order that the enzyme concentration is the only limiting factor. It is satisfied only when the reaction is zero order.
When the concentration of the product of an enzymatic reaction is plotted against time, a similar curve results, Figure 6.
Between A and B, the curve represents a zero order reaction; that is, one in which the rate is constant with time. As substrate is used up, the enzyme's active sites are no longer saturated, substrate concentration becomes rate limiting, and the reaction becomes first order between B and C.

To measure enzyme activity ideally, the measurements must be made in that portion of the curve where the reaction is zero order. A reaction is most likely to be zero order initially since substrate concentration is then highest. To be certain that a reaction is zero order, multiple measurements of product (or substrate) concentration must be made.
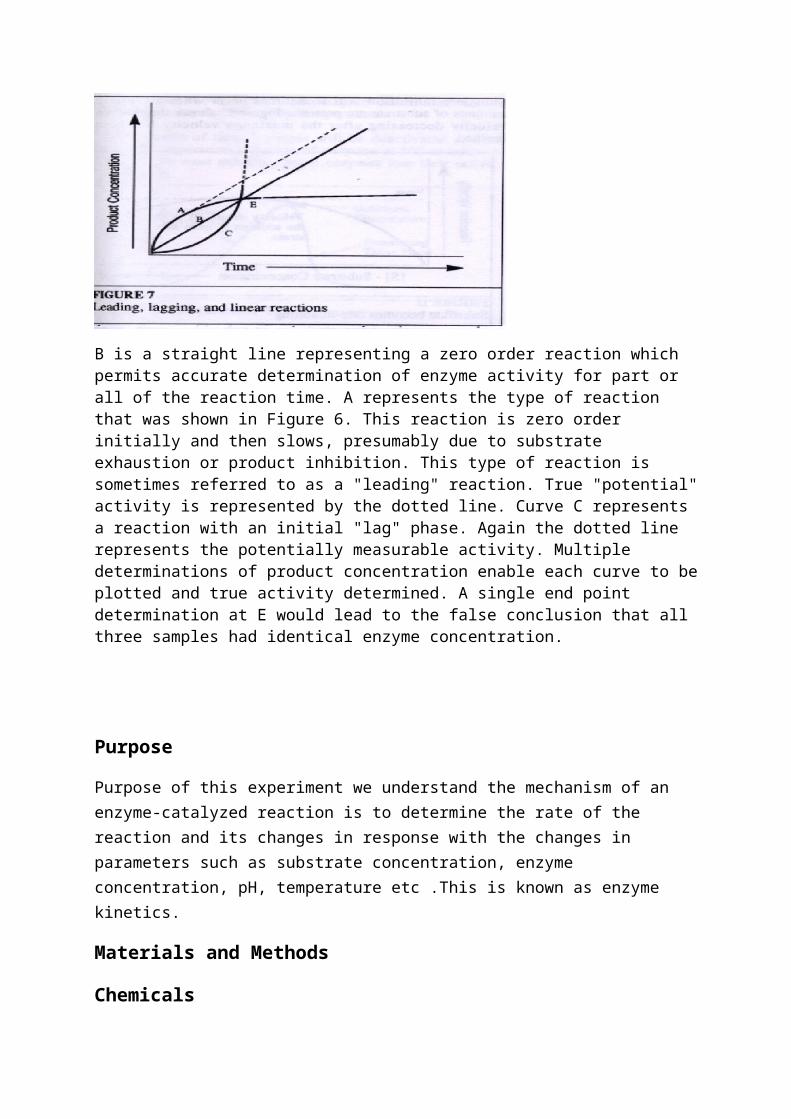
Figure 7 illustrates three types of reactions which might be encountered in enzyme assays and shows the problems which might be enountered if only single measurements are made.
B is a straight line representing a zero order reaction which permits accurate determination of enzyme activity for part or all of the reaction time. A represents the type of reaction that was shown in Figure 6. This reaction is zero order initially and then slows, presumably due to substrate exhaustion or product inhibition. This type of reaction is sometimes referred to as a "leading" reaction. True "potential" activity is represented by the dotted line. Curve C represents a reaction with an initial "lag" phase. Again the dotted line represents the potentially measurable activity. Multiple determinations of product concentration enable each curve to be plotted and true activity determined. A single end point determination at E would lead to the false conclusion that all three samples had identical enzyme concentration.
Purpose
Purpose of this experiment we understand the mechanism of an enzyme-catalyzed reaction is to determine the rate of the reaction and its changes in response with the changes in parameters such as substrate concentration, enzyme concentration, pH, temperature etc .This is known as enzyme kinetics.
Materials and Methods
Chemicals
• % 3 Hydrogen peroxide
• Fresh patato
• Distilled water
• Ice
Lab equipment
• Blender
• Knife
• Beakers
• Filter discs
• Stopwatch
• Filter paper
• Funnel
• Balance
• Weighing boat
Methods
1. Firstly we measured 50 g of patato
2. We put the patato in the blender we added 50 ml of distilled water and a small amount of ice we mixed it .
3. We filtrate our mixture ( we used filter paper and funnel )
4. After the filtration we had enzyme concentration we transferred our enzyme concentartion to beaker and we put a buch of small filter discs in to the beaker for 5 minutes .
5. Transferred three discs in each beaker containing different substrate concentration .
6. We measured the time needed for the disc to reach the top of the solution after reacting the bottom of the beaker.

Result
Graph

Discussing
Enzymes are protein catalysts that like all catalysts speed up the rate of a chemical reaction without being used up in the process.They achieve their effect by temporarily binding to the substrate and in doing so lowering the activation energy needed to convert it to a product.
References
http://www.worthington-biochem.com/introbiochem/enzymeconc.html