bioaugmentation for groundwater remediation || bioaugmentation considerations
TRANSCRIPT

CHAPTER 5
BIOAUGMENTATION CONSIDERATIONS
Carol E. Aziz,1 Ryan A. Wymore2 and Robert J. Steffan3
1ENVIRON, Mississauga, Ontario, Canada; 2CDM Smith, Denver, CO; 3Shaw Environmental,Inc., Lawrenceville, NJ
5.1 INTRODUCTION
Bioaugmentation can be employed in bioremediation systems to improve the rate andextent of solvent remediation. This chapter is intended to assist practitioners by summarizingthe factors that should be considered when selecting and designing a bioremediation approachemploying bioaugmentation.
Several factors can influence the effectiveness of bioaugmentation. These factors includethe environmental site conditions, inoculum volumes and densities, and the overall bioremedi-ation strategy to be used at the site. In short, practitioners have to make several decisions whenimplementing bioaugmentation that can affect the success of the effort, the time required foreffective treatment, or the costs for remediation.
This chapter begins by describing the effects of site conditions on the effectiveness ofbioaugmentation (Section 5.2). Section 5.3 (Field Methods) discusses electron donor, buffer andculture requirements, along with culture injection and initial distribution techniques. The finalsection, Section 5.4, describes typical bioremediation system configurations and the implica-tions and considerations for bioaugmentation.
5.2 EFFECT OF SITE CONDITIONS ON EFFECTIVENESSOF BIOAUGMENTATION
Several factors influence the establishment and performance of bioaugmentation culturesintroduced into groundwater environments. These include exposure to oxygen, temperatureand pH, competition for electron donor, chlorinated solvent concentration, the presence ofother chlorinated solvents, and site hydrogeology. These factors are briefly discussed below.
5.2.1 Exposure to Oxygen
Dehalococcoides spp. (Dhc) are strict anaerobic microorganisms, and oxygen toxicity cansignificantly impact culture viability (Maymo-Gatell et al., 1997). To prevent oxygen exposure,delivery of several of the Dhc – containing commercial cultures (such as KB-1® and SDC-9TM)has been accomplished using shipping canisters that maintain anaerobic culture conditions, andthe culture is typically added to aquifers after anaerobic and reducing conditions have beenachieved. For example, one vendor recommends that groundwater have an oxidation–reductionpotential (ORP) below �75 millivolts (mV) and a dissolved oxygen concentration of less than0.2 milligrams/liter (mg/L) prior to the injection of the Dhc-containing culture. Other importantORP indicators prior to bioaugmentation are evidence of nitrate and sulfate reduction.
H.F. Stroo et al. (eds.), Bioaugmentation for Groundwater Remediation,doi: 10.1007/978-1-4614-4115-1_5, # Springer Science+Business Media New York 2013
141
5.2.2 Temperature and pH
Temperature and pH are two other factors that affect the growth and activity of Dhc.Temperature will affect the rates of Dhc growth and solvent biodegradation. Complete dechlo-rination from trichloroethene (TCE) to ethene has been observed between 10�C and 30�C forcommercial dechlorinating cultures (with the exception of a site located in Alaska where thecomplete dechlorination of TCE to ethene was observed at groundwater temperatures between6–8�C). Dechlorination stalled at cis-1,2-dichloroethene (cis-DCE) at temperatures less than4–10�C (depending on the electron donor added) and above 40�C (Friis et al., 2007). Maximumgrowth rates (m) and zero order degradation rates were highest for TCE dechlorination at 30�Cwith lactate as a substrate (mTCE of 7.00 � 0.14 days�1). In general, maximum growth rates andTCE dechlorination rates were up to an order of magnitude higher than rates for utilization ofcis-DCE and vinyl chloride (VC). Temperature dependence of maximum growth rates anddegradation rates of cis-DCE and VC were similar and highest at 15–30�C (Friis et al., 2007).Therefore, Dhc growth and dechlorination rates will be slower in regions where groundwatertemperatures are lower and faster in regions where groundwater temperatures are higher. Tomitigate for colder temperatures, additional Dhc culture can be added.
Like most microbial processes, dechlorination activity is affected by pH and is highest nearneutral. The optimal pH for the growth of the KB-1® bacterial culture is between pH 6.0 and 8.3.Complete degradation to ethene occurs within this pH range, while partial degradation of TCEto cis-DCE and VC occurs between the 5–6 and 8.6–10 pH ranges. Dechlorination was notobserved to occur below pH 5 and above pH 10 (Rowlands, 2004). At pH values less than 5,dehalogenation of perchloroethene (PCE; also termed tetrachloroethene) was found to becompletely inhibited in Dhc-containing cultures (Vainberg et al., 2009). Others have found VCdehalogenation to be more sensitive to pH than TCE dechlorination, with strong inhibitionoccurring at a pH less than 6 (Eaddy, 2008). Buffers can be used to adjust the native groundwa-ter pH to near neutral conditions to improve rates, as discussed in Section 5.3.2.2.
5.2.3 Competition for Electron Donor/Geochemical Conditions
Successful bioaugmentation and TCE dechlorination to ethene requires sufficient electrondonor to drive the process. When other electron acceptors, such as nitrate, dissolved iron,dissolved manganese and sulfate are present, bacteria utilizing these alternate electron accep-tors will require electron donor to drive their reduction, resulting in competition for electrondonor. Generally this competition can be overcome by adding sufficient electron donor to meetthe demand of these other processes.
The presence of high background sulfate concentrations appears to adversely impact bioaug-mentation and dehalorespiration in some cases but not in others. For example, complete dechlori-nation of TCE to ethene was not observed in bioaugmented microcosms (Pinellas culture)containing high concentrations of sulfate (3,000–6,000 mg/L), despite stimulating active sulfatereduction to remove sulfate, repeated reamendments with the Pinellas culture, and the applicationof different electron donors (Battelle, 2004).
However, groundwater at the site of origin for KB-1® contained more than 1,000 mg/L ofsulfate, and as such, the KB-1® culture appears to have adapted to high concentrationsof sulfate. As part of the Source Area Bioremediation (SABRE) project, the effect of highsulfate concentrations (e.g., 1,250 mg/L) on reductive dechlorination using the KB-1® culturewas studied. At these concentrations, sulfate reduction was concurrent with cis-DCE reduction.The transformation of VC to ethene occurred once sulfate concentrations were reduced below
142 C.E. Aziz et al.

~50 mg/L (Dworatzek et al., 2006). Treatability studies may be warranted to assess the effectsof high sulfate concentration given that it enhances reductive dechlorination at some sites whileinhibiting it at others.
One possible problem with high levels of sulfate is the potential for the production ofexcessive sulfide concentrations as a result of sulfate reduction, which may inhibit anaerobicdechlorination as well as some fermentation reactions (Maillacheruvu and Parkin, 1996).The sulfide levels that may potentially inhibit dechlorinating microorganisms are not welldocumented. One study that investigated sulfide inhibition indicated that 5.0 millimolar(mM) (161 mg/L) sulfide stopped all dechlorination activity, but no inhibition was observed at1 mM (32.1 mg/L) (He et al., 2005). In general, dissolved sulfide and hydrogen sulfide arerapidly co-precipitated with ferrous iron (a byproduct of ferric iron reduction), providingsufficient iron is present to react with the sulfides.
The role of iron- and manganese-reduction in inhibiting bioaugmentation performance islargely uninvestigated. At some sites, high dissolved iron or manganese concentrations arethought to adversely affect dechlorination in a manner similar to other competing electronacceptors. The concentrations of dissolved iron and manganese that may inhibit anaerobicdechlorination have not been well documented or defined (Parsons Corporation, 2004).
5.2.4 Volatile Organic Compound (VOC) Concentration
It was once thought that bioremediation processes were ineffective for treating high concen-trations of chlorinated ethenes such as those found in dense nonaqueous phase liquid (DNAPL)source areas, which historically limited the application of the technology to dissolved plumetreatment or containment. However, data collected over the last several years demonstrate thatdechlorinating microorganisms are active over a wide range of chloroethene concentrations.Duhamel et al. (2002) reported dechlorination of PCE, TCE, cis-DCE and VC at initial concentra-tions of 132, 197, 77 and 87mg/L, respectively, in microcosm studies. Inmicrocosms conducted forthe SABRE project, complete dechlorination of TCE to ethene occurred at 400 mg/L and, in somecases, as high as 800 mg/L (Harkness et al., 2006). Similar results were reported by Yang andMcCarty (2000), who observed PCE dechlorination in the presence of cis-DCE and ethene atconcentrations of 0.66 and 1.05 mM (64 and 29 mg/L, respectively). The presence of such highconcentrations of PCE, cis-DCE and ethene can be inhibitory to methanogenesis (Yang andMcCarty, 2000), improving electron donor availability for dehalorespiration. The occurrence ofdechlorinating activity at very high chlorinated solvent concentrations has permitted bioremedia-tion/bioaugmentation to be used for DNAPL source remediation (Schaefer et al., 2010b).
It is also important to recognize that there is a lower volatile organic compound (VOC)concentration limit for sustaining reductive dechlorination. This level has not been well-definedin the field. However, in laboratory studies, Cupples et al. (2004) indicate that concentrations ofcis-DCE and VC must be above 0.7 micromolar (mM) (44–68 mg/L) so that growth of Dhcoutpaces its decay.
5.2.5 Inhibitory Constituents
While chloroethenes appear to be inhibitory only at extremely high aqueous concentrations,several VOCs have been demonstrated or are suspected to exert inhibitory effects at muchlower concentrations. Both chloroform (CF) and 1,1,1-trichloroethane (TCA) slowed rates of VCdechlorination to ethene by Dhc, with complete inhibition at concentrations of 450 microgramsper liter (mg/L) (3.8 mM) and 700 mg/L (5.2 mM), respectively (Duhamel et al., 2002). Compara-ble results have been reported for other chloroethenes, including inhibition of cis-DCE
Bioaugmentation Considerations 143

dechlorination by 190 mg/L (1.6 mM) chloroform (Maymo-Gatell et al., 2001), and of PCEdechlorination by 1,000 mg/L (8,400 mM) chloroform (Maymo-Gatell et al., 2001). To overcomeinhibition, bioaugmentation cultures such as SDC-9TM or KB-1® Plus, which both containDehalobactor species that are capable of dechlorination of 1,1,1-TCA and CF, can be used.
5.2.6 Hydrogeology
The hydrogeology of a site also can influence the success of bioaugmentation. If thehydraulic conductivity is very low, it will be more difficult and time-consuming to deliver bothelectron donor and bacteria to the targeted treatment zone. Likewise, if the subsurface isheterogeneous, it will be more challenging to achieve a uniform distribution of electron donorand inoculum. Consequently in low permeability formations, injection wells will need to bespaced closer together than in more permeable aquifers.
5.3 FIELD METHODS
5.3.1 Injection Infrastructure Considerations
Dhc culture is typically delivered to the subsurface via injection wells, which permit thesubsequent addition of electron donor, buffer or inoculum should these be required (Figure 5.1).Another commonly used method to deliver culture is via direct push injection (Figure 5.2),whereby culture is injected into the subsurface directly without the use of wells. The choice ofculture delivery method will hinge on both technical and economic considerations, which will bea function of the depth of the target contaminant zone and the number of anticipated electrondonor injections. If the contamination is deep (>~100 feet (ft) [30 meters (m)]) and/or multipleinjections of electron donor are likely to be required, then the installation of wells will probably
Figure 5.1. Photo of injection of bioaugmentation culture in injection well.
144 C.E. Aziz et al.

be the most feasible option. Shallower plumes or plumes in tight formations may favor the useof direct injection of electron donor and culture.
Ideally, the spacing of injection wells/points should incorporate the expected transportdistances of the bioaugmentation culture to permit good distribution of the culture. However,the transport of bioaugmentation cultures is still under study. Research using pure culturessuggests that introduced microorganisms will be removed as a result of straining and filtrationprocesses within a short distance (inches to feet) from the point of introduction (Mawdsleyet al., 1996; Emelko et al., 2006). However, pilot and field studies have documented thatdehalorespiring bacteria can move through aquifer materials greater than 100 ft (30 m) fromthe point of introduction (Major et al., 2002), suggesting that downgradient movement is due togrowth and detachment processes.
5.3.2 Preconditioning Requirements
Prior to injecting Dhc, it is important that the ORP and pH are suitable for growth and thatthere is sufficient electron donor present. In the following sections, the selection and additionof electron donors and buffers are discussed.
5.3.2.1 Selection and Addition of Electron Donors
Given the diversity of organisms contained within mixed consortia, most bioaugmentationcultures can utilize a wide variety of electron donors in fermentative processes, typicallyresulting in the conversion of the electron donor into molecular hydrogen and acetate. Dhcdepend primarily on hydrogen as the electron donor for dechlorination (Loffler et al., 2003)although some dechlorinating populations also can utilize acetate (He et al., 2002). Non-Dhcmicroorganisms present in mixed consortia play a significant role in supporting dechlorinatingactivity through the production of hydrogen through fermentative processes.
Figure 5.2. Photo of direct push injection of bioaugmentation culture.
Bioaugmentation Considerations 145

There are many organic substrates that can be naturally degraded and fermented in thesubsurface to generate hydrogen. Examples of easily fermentable organic substrates includealcohols, low-molecular-weight fatty acids (e.g., lactate), carbohydrates (e.g., sugars), vegetableoils and plant debris (e.g., mulch). The substrates most commonly added for enhanced anaero-bic bioremediation include lactate, molasses, Hydrogen Release Compound (HRC®), mulchand emulsified vegetable oils. Substrates used less frequently include ethanol, methanol,benzoate, butyrate, high-fructose corn syrup (HFCS), whey, chitin and gaseous hydrogen(Parsons Corporation, 2004). The physical nature of the substrate (i.e., liquid, solid or gas)will influence the frequency of addition, the addition technique, and the potential systemconfigurations.
The Dhc-containing culture KB-1® has been demonstrated to work with most commonlyused electron donors, including sugars (e.g., glucose, molasses), alcohols (e.g., methanol,ethanol), organic acids (e.g., lactate), vegetable oils (canola), emulsified oils (e.g.,EOS®, Newman Zone# and SRSTM) and slow release compounds (e.g., HRC®) (http://www.siremlab.com/products/kb-1, accessed June 19, 2012; Duhamel et al., 2002). Dhc sp. BAV1readily utilizes hydrogen but not formate, acetate, lactate, pyruvate, propionate, glucose,ethanol or yeast extract as an electron donor (He et al., 2003). SDC-9TM also has been appliedwith a wide variety of electron donors. Although hydrogen is used by methanogenic popula-tions, several studies suggest that Dhc microorganisms competitively utilize hydrogen atconcentrations below those supporting methanogenesis (Smatlak et al., 1996; Yang andMcCarty, 1998; Loffler et al., 1999).
The choice of electron donor will depend on the method of application and cost considera-tions. For example, biobarriers typically lend themselves to the use of emulsified vegetable oilor mulch whereas active recirculation systems favor soluble electron donors, such as lactate.Regardless of the electron donor selected, sufficient electron donor must be provided to meetthe demand of the competing electron acceptors (most notably sulfate) so that sufficientelectron donor is available for dechlorination reactions. The addition of electron donor isoften required to reduce the ORP of the aquifer to the desired range for complete reductivedechlorination (generally less than �75 to �100 mV).
Electron donor is typically added prior to or during bioaugmentation to provide a source offermentable substrate and lower the ORP of the groundwater. Depending on the bioremediationsystem configuration, the electron donor can be added using either extracted groundwater ormunicipal water. If either is oxygenated, it is generally recommended to wait for reducingconditions to be established in situ after the electron donor is injected before bioaugmenting.The time required for aquifer conditions to be appropriate for bioaugmentation after electrondonor addition varies from site to site; however, typical lag times are 4–8 weeks. Extracted watercan be reduced ex situ by amending a tank ofwaterwith a soluble electron donor and allowing time(typically days to weeks) for the biomass to consume oxygen and lower theORP to below�75mV.Chemical reductants, such as sodium sulfite, also may be used to reduce the extracted water. It isrecommended that small-scale tests be conducted prior to field implementation to better estimatethe time required to produce anaerobic water. Another approach involves the addition of thebioaugmentation culture in a “donut” of anaerobic water part way through the injection of theelectron donor as discussed further in Section 5.3.4.
5.3.2.2 Selection and Addition of Buffers
As mentioned earlier, Dhc is most active between pH 6 and 8.3. Prior to bioaugmentation,it is important to establish the aquifer pH in this range. To maintain growth and activity of Dhcfollowing bioaugmentation, it is also necessary to maintain the pH of the groundwater in
146 C.E. Aziz et al.

this range. However, volatile fatty acids and carbonic acid are produced during electron donorfermentation and hydrochloric acid (HCl) is generated through reductive dechlorination; bothof these processes can cause a decrease in pH. Thus, reductive dechlorination in source zoneswith high VOC concentrations can be associated with extensive localized dechlorination andproduction of HCl, whereby the soil’s natural buffering capacity can be exceeded (Robinsonand Barry, 2009). In these instances, it is important to supply enough buffer to compensate foracid production to maintain suitable conditions for Dhc. It should be borne in mind that otherprocesses can act to increase the pH of the aquifer. These processes include sulfate reduction,iron (III) oxide reduction, acetate fermentation, calcite dissolution and proton exchange onclays (Robinson et al., 2009).
If the natural aquifer pH is not in the 6–8.3 range, then the aquifer pH can be adjustedthrough the addition of buffers. Three commonly used buffers or buffer-containing productsinclude sodium bicarbonate, AquaBupHTM (EOS Remediation, Raleigh, NC, USA), andNeutral Zone# (RNAS, Brooklyn Center, MN, USA). These products are discussed below.
Sodium Bicarbonate is an inexpensive, readily available buffer, which has been widely used tobuffer groundwater for bioremediation/bioaugmentation applications. The disadvantage ofusing sodium bicarbonate is that it is soluble and can wash out of the treatment area, therebyrequiring multiple, often time-consuming, applications. For recirculating systems, sodiumbicarbonate can be metered in and distributed throughout the target area. For passive systems,the buffer solution can either be made up in tap water (which may need to be pre-reduced priorto injection and may cause localized plume dilution) or the contaminated groundwater can beextracted, buffered and re-injected, which may be subject to permitting or regulatory barriersand is time-consuming, especially for low permeability aquifers. The addition of sodiumbicarbonate also can increase the sodium concentration of the groundwater significantly, andmay alter the geochemical conditions enough to cause some mineral species to precipitate,which can lead to aquifer clogging.
AquaBupHTM is a mixture of an “alkaline buffering” suspension, emulsified vegetable oil, anda proprietary food additive. It is designed to provide a long-term source of buffer through thedistribution of particulate buffer (median particle size of 2.5 micrometer [mm]) in the vicinity ofthe injection point and has a low sodium content (<0.4%). This product can be used forbioremediation/bioaugmentation applications requiring the addition of both buffer and elec-tron donor. The vendor recommends that the acid demand of the aquifer matrix and ground-water be determined and then the amount of AquaBupHTM needed to achieve the desired pHcan be calculated. This approach may mean that additional injections of emulsified vegetable oil(without buffer) may be required initially and subsequently to provide sufficient electrondonor. AquaBupHTM is injected like an emulsified vegetable oil, with the product meteredinto an injection line. EOS Remediation provides a design spreadsheet to assist in estimating theappropriate dose of AquaBupHTM (www.eosremediation.com). The spreadsheet accounts forthe HCl produced from dechlorination, the carbonic acid produced through substrate fermen-tation, and the hydroxyl released from electron acceptor reduction.
Neutral Zone# is a colloidal suspension of calcium carbonate and is designed to remain inplace and not wash out of the targeted treatment zone. According to the vendor, it will notcause adversely high pH because the base is liberated by the acid it will neutralize and not bydissolution in water. The advantage of Neutral Zone# is that it can be added independently ofthe amount of electron donor added. Neutral Zone# is significantly more viscous and densethan emulsified vegetable oil. Therefore, the vendor recommends that the product be diluted5–10 fold with water and then injected with a proportional feed system into multiple points(permanent wells or direct-push points) simultaneously.
Bioaugmentation Considerations 147

Buffer capacity testing of the groundwater and soil or determination of the acid demand ofthe aquifer material and acidity of the groundwater by Standard Method 2310 should beconducted to determine the appropriate dose of the selected buffer (in the absence of biologicalreactions). Design tools can be employed to estimate buffer dose (e.g., EOS Remediationdesign spreadsheet for AquaBupHTM or spreadsheet tool and equations for sodium bicarbon-ate [Robinson and Barry, 2009; Robinson et al., 2009]). Geochemical models, such asPHREEQC and MINTEQ, and bench-scale biotreatability tests also can be employed toestimate buffer requirements.
5.3.3 Culture Requirements
Even though bioaugmentation for chlorinated VOC remediation is widely used, no rigorousmodel has been generated to estimate the amount of inoculum needed for a given site. Mostpractitioners appear to rely on the guidance of Lu et al. (2006) and attempt to achieve aminimum in situ concentration in the range of 107 Dhc/L, where complete degradation of TCEto ethene is often observed.
The simplest approach to estimating the amount of culture required is to estimate the porevolume of water within a targeted treatment zone and then multiply the treatment volume by107 Dhc/L. The volume of culture needed to achieve 107 Dhc/L is dependent on the Dhcconcentration in the bioaugmentation culture, which varies from vendor to vendor. Also, itgenerally is preferable to include a lag time to achieve the desired culture density, not only toreduce the culture costs but also because it is difficult and costly to distribute the cellsthroughout the target treatment zone without relying on growth and migration in situ. In anycase, some amount of time (weeks to months) will be required for the culture to grow andspread throughout the treatment area.
The use of this simple approach does not account for the effects of potentially importantfactors, notably the VOC concentrations in the target aquifer and the actual hydrogeology ofthe site. Both factors can have a significant effect on the distribution and growth of the addedculture. In cases with relatively high concentrations of VOCs, the model may overestimate theamount of culture needed, provided other geochemical conditions are appropriate for Dhcgrowth and transport. The model may underestimate the amount of culture needed in aquiferswhere VOC concentrations are low or where other geochemical factors may limit growth ortransport of Dhc cells in situ. Fine tuning the model may be difficult in many cases, and it willlikely require extensive laboratory microcosm and column studies and the application of morecomplex models like those provided by Schaefer et al. (2009).
Ultimately, the decision may be made by comparing the cost or risk of adding too much ortoo little culture with the cost of performing extensive laboratory testing. To aid in evaluatingthe amount of culture to apply, Table 5.1 provides data from several pilot and field-scalebioaugmentation projects to treat a variety of aquifers with varying chemical and hydrogeolo-gical characteristics. Further information on the relationship between inoculum density anddegradation rates can be found in Appendix A.
5.3.4 Injection Techniques
Prior to adding the Dhc bioaugmentation culture, the well or drive point is purged withcertified 100% argon or nitrogen to remove any oxygen from the well casing and to maintain aninert gas blanket in the well headspace. All of the required tubing also is purged to removeoxygen. Following purging, the compressed gas is used to pressurize the culture vessel and pushthe culture out of the vessel and down the pre-purged tubing positioned within the well screen at
148 C.E. Aziz et al.

Table
5.1.AmountofCulture
Usedin
VariousField
PilotandFull-Scale
BioaugmentationApplications
Site
Designation
TotalVOCs
(ppb)
Geology
Approx.
SurfaceArea
(ft2)
Approx.
Saturated
Thickness(ft)
Volume
Culture
Added
(L)
Approx.Conc.
DhcAdded
(cells/L)
Approx.Tim
eto
Significant
Degradation
Electron
Donor
Other
Treatm
ents
AerojetNPL
(Area20)/
Rancho
Cordova
,CA
2,000
Sand/gravel
3,640
20
50
1�
1010
<1month
Ethanol
Recirculation
Manufacturing
Facility
Portland,OR
>100,000
Siltysand
300
50
60
1�
1011
1–3months
EHC#
Passivebarrier;
12injection
points
IRSite
40,Seal
Beach,CA
<1,000
Coastalaquifer
1,368
40
40
1�
1011
<1month
Lactate
Semi-passive;
2injection
points
Form
er
Manufacturing
Facility,IN
~3,000
Sand/gravel
25,000
45
340
1�
1011
1–3months
EVO
Passivebarrier;
60injection
points
MoodyAFB,
SS-39,GA
>500
Sand/silt
360,000
10
360
1�
1010
<3months
Sodium
lactate
Recirculation;
10injection
wells,9
extractionwells
MoodyAFB
SS-38,GA
>1,000
Sand/silt
400,000
10
925
1�
1010
<90days
Sodium
lactate
Recirculation;
700-fthorizontal
wells:1
injection,1
extraction
MoodyAFB,
SD-16(w
est),
GA
~1,000
Sand/silt
100,000
10
2,900
1�
1010
9–12months
Vegoil
Passive;110
injectionpoints;
sodium
bicarbonate
MoodyAFB,
SD-16(east),
GA
>100
Sand/silt
156,000
10
177
1�
1010
3–6months
Vegoil
Passive;175
injectionpoints
MoodyAFB,
FT-07,GA
~10,000
Sand/silt
8,000
20
285
1�
1010
3–6months
Sodium
lactate
Passive;57
gravityfeed
injectionpoints
ColumbusAFB,
SS32,MS
>50
Sand/gravel
248,000
20
539
1�
1010
3–6months
Sodium
lacate/
vegoilmix
Passive;442
injectionpoints
(continued)
Bioaugmentation Considerations 149

Table
5.1.(continued)
Site
Designation
TotalVOCs
(ppb)
Geology
Approx.
SurfaceArea
(ft2)
Approx.
Saturated
Thickness(ft)
Volume
Culture
Added
(L)
Approx.Conc.
DhcAdded
(cells/L)
Approx.Tim
eto
Significant
Degradation
Electron
Donor
Other
Treatm
ents
Myrtle
Beach
AFB,FT-11,SC
70–900
Sand/silt
78,000
5276
1�
1010
6months
Sodium
lactate
Passive;337
injectionpoints
AFP-4,Building
181,TX
50,000
Siltandclay
8,000
10
75
1�
1010
3months
Vegoil
Passive;12
injectionwells
CampBullis,TX
~2,000
Karst
47,250
515
5�
1010
6months
Vegoil
Passive;5
horizontalwells
(~240ftin
length)
NavalStation
Treasure
Island,
Site
24,CA
~25,000
Sand,siltysand
andclay
10,500
25
60
1�
1010
75daysa
Sodium
lactate
Recirculation;3
injection,3
extractionwells.
NavalStation
Treasure
Island,
Site
24,CA
~35,000
Sand,siltysand
andclay
350,000
25
60
1�
1011
90days
Lactic
acid
Recirculation;
19injection,27
extractionwells.
105biobarrier
injectionpoints
NavalStation
Treasure
Island,
Site
21,CA
~1,500
Sand,siltysand
andclay
37,500
20
60
1�
1011
90days
Lactic
acid
Passive;45100
diameterdirect
injectionpoints
Vandenberg
AFB,Site
9,CA
~1,000
Sandandsilty
sand
10,000
560
1�
1010
6months
Sodium
lactate
Passive;
injectedin
10
monito
ring
wells.
Hickam
AFB,
Site
LF-05,HI
~100,000
Calcium
carbonate
sand
100
10
60
1�
1010
60days
Sodium
lactate
Passive;
2injectionwells
Hickam
AFB
Site
,CG-110,HI
~800
Volcanicsand
andsilt
10,600
15
60
1�
1011
<34daysb
Sodium
lactate
Passive;15
directinjection
locations
PearlHarbor
NavalBase,
Form
erAiea
Laundry
Facility,
HI
~100
Volcanicsand
andsilt
100
10
60
1�
1010
<60days
Sodium
lactate
andvegoiland
vitamin
B
Passive;
2injectionwells
(continued)
150 C.E. Aziz et al.

Site
Designation
TotalVOCs
(ppb)
Geology
Approx.
SurfaceArea
(ft2)
Approx.
Saturated
Thickness(ft)
Volume
Culture
Added
(L)
Approx.Conc.
DhcAdded
(cells/L)
Approx.Tim
eto
Significant
Degradation
Electron
Donor
Other
Treatm
ents
PearlHarbor
NavalBase,
Form
erAiea
Laundry
Facility,
HI
~100
Volcanicsand
andsilt
100
10
60
1�
1011
<60days
Sodium
lactate
andvegoiland
vitamin
B
Passive;
2injectionwells
PJKSEPLPilot
Study,CO
~3,600
Sandstone
500
40
56
1�
1011
1month
Sodium
lactate
andRestore
375#
Passive;3
injectionwells
PJKSEPLFull
Scale,CO
~8,600
Sandstone
60,000
40
189
1�
1011
Ongoing
Sodium
lactate
andRestore
375#
Passive;4
horizontalwells
PJKSD-4,CO
~700
Crystalline
fractured
bedrock,gneiss
20,000
40
38
1�
1011
15months
Sodium
lactate
andRestore
375#
Passive;6
injectionwells
PJKSSCA
NorthFullSca
le,
CO
~1,600
Sandstone
40,000
40
75
1�
1011
4months
Sodium
lactate
andRestore
375#
Passive;
2horizo
ntal
wells
PJKSSCA
South
Full
Scale,CO
~9,100
Sandstone
35,000
40
151
1�
1011
Ongoing
Sodium
lactate
andRestore
375#
Passive;4
horizontalwells
CapeCanaveral
AFS,FL
155,000
Sand,crushed
shells
400
10
39
notreported
<1month
Ethanol
Recirculation
BachmanRoad,
Pilot,MI
50–1,200
Finegrain
sand
272
6200
1�
109
15days
Sodium
lactate
Recirculation
DoverAFB,DE
1,200–
4,800
Sand/silt
1,102
10
180
2�
1011
90days
Sodium
lactate
Recirculation
Kelly
AFB,TX
800
Gravel,sand,
silt,clay
614
20
13
1�
109
100days
Methanol/
acetate
Recirculation
Note:AFB–AirForceBase;AFS–AirForceStation;L–liter(s);ppb–partsperbillion;EPL–EngineeringPropulsionLaboratory;EVO
–EmulsifiedVegetable
Oil;
NPL–NationalPrioritiesList
aComplete
conversionofTCEto
ethenebyday75
bComplete
conversionofTCEto
ethenebyday34
Table
5.1.(continued)
Bioaugmentation Considerations 151

the desired depth. A digital scale or other measuring device provided by vendors can be used todetermine the mass or volume of culture added to each well/drive point.
For injections requiring smaller volumes (0.3–1 L) of culture per well/drive point, meteringdevices have been developed that allow for the accurate injection of a smaller target culturevolume. For deeper injections in direct-push points, anaerobic water can be used to push theculture into the formation. In these cases, the tubing from the culture vessel is not positioned tothe desired depth in the drive point, but rather is connected at the surface to the tubing carryingthe anaerobic water to the desired depth.
5.3.5 Distribution Techniques
There are a number of techniques that can be used to distribute the culture in situ. The firsttraditional approach is to “push” in or chase the culture with an electron donor solution todistribute the culture further into the formation. While a small fraction of the culture may bepushed further into the formation, it appears (based on column studies) that most of the culturewill stay close to the injection well initially (as discussed in Section 5.3.1 and Appendix A). It isunclear how much further the culture will be transported under this scenario versus injectingtheDhc at the end of the electron donor injection, as mostDhc transport is expected to occur asa result of in situ growth and cell detachment.
A similar approach, which has been used to distribute Dhc in an aquifer prior to it beingfully reduced, is to sandwich Dhc between electron donor additions by injecting reducedanaerobic water before and after the Dhc. In other words, a portion of electron donor mixedwith aerobic water is injected, then anaerobic water, then culture, followed by more anaerobicwater and the remaining electron donor mixed with aerobic water (as illustrated in Figure 5.3).This technique is referred to as the “donut” approach, and it was developed to permitbioaugmentation and electron donor addition in one mobilization and to allow for a largeportion of the electron donor to be introduced with aerobic water from an easily-obtainedhydrant source. The disadvantage of this approach is the possibility of Dhc being exposed tooxygen in the electron donor injectate or aquifer. Therefore, the onset of reductive dechlorina-tion may be slower if a fraction of the Dhc is inactivated. However, bioaugmentation andelectron donor addition can be accomplished in one mobilization, lowering field labor costs.
Section View
Plan View
1. Donor 2. Anaerobicwater
5. Remainingdonor
4. Anaerobicwater
3. Microbialculture
Figure 5.3. Schematic of “donut” approach to bioaugmentation culture injection.
152 C.E. Aziz et al.

Two other techniques have been used to improve the distribution of Dhc after injection.One method is to use a forced gradient or recirculation system (discussed in Section 5.4).The other technique is to directly inject the culture in a large number of locations to achieve abetter initial distribution of Dhc. This technique permits the Dhc to be injected away fromoxidized areas (e.g., near an injection well or plume fringes) or downgradient in a number oflocations to minimize the time required for the Dhc to be transported downgradient naturallythrough growth and detachment. The downside of this approach may be the additional cost of adirect-push rig to accomplish the injections.
5.4 BIOREMEDIATION CONFIGURATIONS EMPLOYINGBIOAUGMENTATION
Because almost all bioaugmentation applications require the addition of an electron donor,it is important to consider the electron donor delivery method and bioremediation systemconfiguration.
The typical electron donor emplacement methodologies used for bioremediation include(adapted from ITRC [2005]):
� Conventional injection wells: Electron donors are injected into an existing or newly-installed well. Typically a network of wells is used to inject relatively large volumes ofliquids containing a soluble electron donor. Conventional wells often are used formoderate to high permeability aquifers or treatment zones.
� Direct-push injection points: A network of relatively closely spaced points is usuallyused, with injections of a relatively small volume of a soluble electron donor at eachinjection point. Direct-push injection is most applicable for shallow sites with relativelyhomogeneous conditions with a moderate to high permeability, although it also can beused in sandy clays or silty sands.
� Trenching: Trenches are usually backfilled with a large mass of a solid electron donor(e.g., mulch or chitin) and/or a long-lived liquid electron donor such as vegetable oil,often mixed with sand. Trenches can be used in aquifers with any degree of permeabil-ity, as long as the permeability of the trench is at least as high as the formation.
� Hydraulic or pneumatic fracturing: Fracturing of low permeability regions createszones in which electron donor (or culture) may be injected over greater distances.Either solid or liquid electron donors may be emplaced during or immediately afterfracturing. Fracturing is generally used in low permeability conditions or at highlyheterogeneous sites where the low permeability zones require treatment.
Various bioremediation approaches (classified as active, semi-passive or passive), can be usedin conjunctionwith bioaugmentation. In the following subsections, these approaches are described.The advantages and disadvantages of each approach for achieving and maintaining optimalconditions for bacterial growth (biostimulation) are considered, as these also impact bioaugmenta-tion. Afterwards, the practical implications of each approach for successful bioaugmentation arediscussed.
5.4.1 Active Recirculation Approach
Active recirculation uses pumping (extraction) and reinjection of groundwater and electrondonor across a treatment area. Often, the goal of a recirculation system is to control ground-water flow and donor distribution across the target treatment area in a more precise manner
Bioaugmentation Considerations 153

than is generally achievable in either the passive or semi-passive approach. Active recirculationsystems use conventional injection wells for electron donor delivery and usually also useinjection wells for culture injection (Table 5.2).
Active recirculation systems generally pump groundwater continuously. Electron donor isusually blended with the extracted water prior to its reinjection and can be added continuouslyto the extracted water (generally at low concentrations), or it can be pulsed into the extractedwater periodically (generally at higher concentrations). Soluble electron donor frequently isused in recirculation systems, because it is easiest to mix and pump and allows for thedistribution over the largest distances.
The type and amount of equipment can vary significantly depending on the size of the site,the desired extraction/injection flow rate, and the amount of automation required. A simplerecirculation system may involve extraction wells, injection wells and temporary conveyance(i.e., hoses) to transport water between them. More complex systems may have permanentpiping, surge tanks, flow meters, valves, transfer pumps and process instrumentation/controlssuch as level switches, alarms and a programmable logic controller (PLC). Amendment dosingcan be accomplished by manually mixing batches at the desired concentration, using propor-tional flow mixers, or by using metering pumps. An example of a recirculation system is shownin Figure 5.4.
5.4.1.1 Advantages/Disadvantages for Biostimulation
In general, recirculation is most appropriate for biostimulation at sites that have moderateto high hydraulic conductivity. It has been used for biostimulation (with bioaugmentation insome cases) at many sites (e.g., Lee et al., 2008; Ellis et al., 2000; Lendvay et al., 2003; Majoret al., 2002; Hood et al., 2008; Wymore et al., 2009; Brown et al., 2009). The recirculationapproach provides the greatest engineering control for biostimulation because of the ability tomanipulate hydraulic gradients using the injection/extraction system. Compared to passive andsemi-passive approaches, other advantages include:
� Rapid onset of reducing conditions because of the use of soluble donors;
� Largest electron donor distribution from an individual injection point (i.e., largestradius of influence during injection); and
� Ability to add large amounts of amendments over a relatively short timeframe.
The most significant disadvantage for active recirculation is that it generally has the highestcapital costs and O&M requirements of any approach. Continual system monitoring, either byautomated instrumentation or by onsite staff, is needed to ensure upset conditions are notencountered and that all above ground equipment is operating as designed. Besides requiringmore O&M, other disadvantages of active recirculation approaches include:
� Logistical constraints at active facilities may impact placement of above groundinfrastructure;
� Active systems are more prone to biofouling; and
� While good donor distribution can be achieved from individual injection points,multiple recirculation loops may be required to cover larger treatment areas.
5.4.1.2 Implications for Bioaugmentation
Active recirculation systems are costly and rely on frequent pumping. As a result, bioaug-mentation may be relatively desirable for several reasons: (1) the relative cost of the
154 C.E. Aziz et al.

Table
5.2.ElectronDonorDelivery
MethodsforBiostimulation/Bioaugmentation
InjectionWells
DirectPush
Trenching
Fracturing
Applicable
delivery
type
�Passive
�Semi-passive
�Activerecirculation
�Passive
�Passive
�Activerecirculation
�Passive
Electrondonortype
�Liquid
donors
orliquid
donors
withvery
small
scale
suspendedsolids
�Liquid
donors
orliquid
donors
withvery
small
scale
suspendedsolids
�Allelectrondonortypes
canbeused
�Allelectrondonortypes
canbeused
Geology
�Applicable
forallgeologies
�Applicable
for
unconsolidatedmedia
withoutlargegravelor
cobbles
�Applicable
forallgeologies
�Applicable
forlow
perm
eability
media
Arealextentoftreatm
ent
zone
�Achievelargerradiusof
influence(R
OI)withlow
pressure
injectionsthan
direct-push,but
incrementalROI
improvementdecreases
withvolume
�ROIgenerally
small
becauseinefficiencyof
injectionpoints
(flowrate
perunithead)unless
injectionsare
pressurized
�Pressurizedinjections
achievelargerROI,but
verticaldistribution
generally
becomeserratic
dueto
preferentialflow
�Lim
itedto
thetrench
footprint
�LargeROI
Thicknessoftreatm
ent
zone
�Wellscreenscanbe
installedforanythickness;
however,longerscreens
willnotachievegood
verticaldistributionin
heterogeneoussystems
(nestedwells
canbeused
toovercomethis,but
capitalcosts
are
increased)
�Canbeusedforany
thickness(subjectto
depth
limitations)
�Conventional“bottom
up”
injectionapproachcan
leadto
erraticvertical
distributiondueto
preferentialflowin
perm
eable
strata
�Lim
itedto
thetrenchdepth
�Treatm
entzonelim
itedto
thefracture
thickness
�Multiplefracturesgenerally
required
(continued)
Bioaugmentation Considerations 155

Table
5.2.(continued)
InjectionWells
DirectPush
Trenching
Fracturing
Depth
oftreatm
entzone
�Canbeusedforanydepth
�Depth
limitedbysizeofrig
usedandisvery
dependentuponform
ation
properties
�Depthsupto
60–70ftare
oftenachievable
inunconsolidatedmedia,
thoughsomerigsare
capable
ofgoingdeeper
�Lim
itedto
thetrenchdepth.
Depthsgreaterthan80ft
are
generally
cost
prohibitive
�Lim
itedto
drilling
equipmentused
Hydraulicconductivityof
treatm
entzone
�Mosteffectivein
moderate
tohighperm
eability
conditions
�Mosteffectivein
high
perm
eability
conditions
�Injectionpointinefficiency
canmakeflowrateslow
evenin
moderate
perm
eability
zonesunless
injectionsare
pressurized
�Generally
trenchisfilled
withhighhydraulic
conductivitymedia
�Fracture
zoneshavehigh
hydraulic
conductivity
Heterogeneityoftreatm
ent
zone
�Mosteffectiveforlow
tomoderate
heterogeneity
�Wellefficiency(flowrate
perunithead)oftenmuch
higherthandirect-push
points,whichallowslarger
volumeinjectionswithless
pressure,leadingto
less
preferentialflowduring
injection
�Mosteffectiveforlow
heterogeneity
�Injectionpointinefficiency
leadsto
ahigherdegreeof
preferentialflowforagiven
flow
rate
inheterogeneous
form
ationsrelativeto
injectionwells
�Treatm
entzone
homogenizedby
emplacinghomogenous
media
intrench
�Homogenousmedia
emplacedin
fractures
Groundwatervelocity
�Low
groundwater
velocitieswillminim
ize
downgradientim
pactof
electrondonor
emplacement
�Highgroundwater
velocitieswilllim
itlateral
impactofelectrondonor
emplacement
�Low
groundwater
velocitieswillminim
ize
downgradientim
pactof
electrondonor
emplacement
�Highgroundwater
velocitieswilllim
itlateral
impactofelectrondonor
emplacement
�Trenchcanbedesignedto
allowforadequate
treatm
enttimedepending
ongroundwatervelocity
�Low
groundwater
velocitieswillminim
ize
downgradientim
pactof
electrondonor
emplacement
�Highgroundwater
velocitieswilllim
itlateral
impactofelectrondonor
emplacement
(continued)
156 C.E. Aziz et al.

InjectionWells
DirectPush
Trenching
Fracturing
Capitalcost
�Capitalcostismoderate
relativeto
otherpassive
approaches
�Costs
increase
substantially
whennested
wells
are
usedto
treat
largecontaminated
thicknesses
�Lowestcapitalcostfor
passiveapproaches
�Highestcapitalcostof
passiveapproaches
�Highcapitalcostdueto
hydraulic
fracturing
technologyrequired
Operationsand
maintenance(O
&M)
�O&M
isfairlyminim
alin
passiveapplications
becauseinjectionsare
infrequent
�Somewellrehabilitation
dueto
biofoulingmightbe
requiredwheninjections
occuroverseveralyears
�O&M
isminim
alunless
manyinjectionsare
requiredoverthelifeofthe
project;asthenumberof
injectionevents
increases,
O&M
ofdirect-push
injectionwillapproach,and
eventually
surpass
injectionwells
�Low
tomoderate
O&M
required.Recirculation
systemsmayrequireO&M
topreventfouling
�NoO&M
required
�Generally
fracturingisonly
perform
edonetime
Implicationsfor
bioaugmentation
�Inoculationinto
injection
wells
ispreferredandmost
commonly
usedmethod
�Inoculationinto
direct-push
points
isgenerally
not
preferred
�Fewexamplesofdirect-
pushinoculationin
literature
�Directinoculationduring
trenchinstallationnot
recommendedbecauseof
likely
exposure
tooxygen
�Inoculationgenerally
perform
edthroughwells
directlyin
orjust
downgradientoftrench
�Inoculationduring
fracturinggenerally
not
perform
edbecausehigh
pressuresandhigh
volumeswould
create
unpredictable
distribution
oflowvolumeinoculum
�Inoculationgenerally
perform
edfollowing
fracturing
Table
5.2.(continued)
Bioaugmentation Considerations 157

bioaugmentation culture is low, compared to the capital and operating costs for biostimulationalone; (2) if bioaugmentation can reduce the time that active recirculation is required, it canreduce the overall remediation costs significantly; (3) the infrastructure needed for bioaug-mentation is already present so there is usually little additional cost to inject cultures; and (4) theactive recirculation may act to distribute the bioaugmentation culture.
The use of active recirculation to distribute bacteria and induce complete dechlorination iswell documented at the pilot scale (Ellis et al., 2000; Lendvay et al., 2003; Major et al., 2002;Hood et al., 2008; Schaefer et al., 2010a), although sufficient sampling was not performed in allcases in order to provide a full assessment of bacterial growth and distribution. A study at KellyAFB, TX (Major et al., 2002) was one for which Dehalococcoides transport times could bereasonably estimated and compared to conservative transport times. Travel times for Dhc werebetween 61 and 176 times longer than for conservative transport (i.e., the average groundwatervelocity, based on the average rate of movement of a conservative tracer that is not destroyedor retarded during transport). The Bachman Road, MI site study suggested that the Dhctransport time was only about 2.3 times greater than groundwater transport times (Lendvayet al., 2003).
However, performing inoculations can be complicated if the system is already constructedand operational, and bioaugmentation was not considered in the initial design. For example,the recirculation system for ESTCP project ER-200513 was constructed and operated to“pre-condition” the aquifer to establish reducing conditions prior to inoculation. Subsequently,
Figure 5.4. Photo of an active recirculation bioremediation system.
158 C.E. Aziz et al.

the injection wellheads had to be disassembled to perform the inoculation to ensure thatexposure to air was minimized. The addition of bioaugmentation culture directly to thereinjection line during recirculation operations is not advised as this approach can risk exposingthe culture to oxygen if the pipes/hoses are not flowing full or if the extracted groundwater isnot sufficiently reduced (Trotsky et al., 2010).
5.4.2 Semi-Passive Approach
The semi-passive approach refers to pulsed injection of amendment solution to achieve alarge radius of influence around each injection point, and then allow amendments to drift alongwith the groundwater. Semi-passive also can refer to systems employing lateral mixing ofelectron donor perpendicular to groundwater flow to minimize the number of required injectionwells. Inoculation is generally performed as a single injection event after establishing reducingconditions that are suitable for bioaugmentation. Recent studies have shown that reducingconditions adequate for bioaugmentation can be achieved 50 ft (~15 m) or more downgradientfrom an injection point, depending on the site’s hydrogeologic conditions (Mora et al., 2008).
To perform the injections, electron donor amendment is blended above ground to achievethe desired injection concentration. The amendment used in this approach can be either asoluble or a slow-release electron donor, although generally semi-passive systems use solubledonors such as sodium lactate or ethanol, which are immediately bioavailable upon injectioninto the subsurface. The frequency of injections is dependent on many factors, includingthe electron donor type used, hydrogeologic conditions, competing electron acceptors, andthe concentrations of the target contaminants.
5.4.2.1 Advantages/Disadvantages for Biostimulation
Semi-passive systems are generally favorable for biostimulation at sites that have moderateto high hydraulic conductivity and moderate hydraulic gradient, allowing ambient groundwaterflow and/or lateral mixing to distribute electron donor. The semi-passive technique has beensuccessfully applied at many sites (Mora et al., 2008) and during the recent ESTCP projectER-200513 (Trotsky et al., 2010).
The primary advantage to the semi-passive technique is that it is a flexible approach thatallows for frequent applications of electron donor, while keeping the operational requirementsand costs low.
Compared to passive and active recirculation approaches, other advantages include:
� Ability to distribute and maintain high concentrations of electron donor in a largeradius of influence from individual injection points;
� Ability to perform frequent (i.e., monthly to quarterly) amendment injections costeffectively (on smaller scales);
� Large areas can be treated effectively with fewer injection points compared to passivesystems; and
� Less O&M and capital requirements compared to active recirculation.
The semi-passive technique does have disadvantages compared to the passive and activerecirculation approaches, including:
� Individual injections can take multiple days depending on subsurface conditions;
� Vertical mixing may be inconsistent and more dependent on ambient flow conditionscompared to active recirculation.
Bioaugmentation Considerations 159

5.4.2.2 Implications for Bioaugmentation
Similar to the active recirculation strategy, bioaugmentation is not generally a largeincremental cost for semi-passive systems, because the infrastructure is already in place.Inoculation in a semi-passive approach is most often performed using the existing electrondonor injection well locations. Generally, only a single inoculation for bioaugmentation isrequired after sufficient electron donor injections have been performed to create an appropri-ate reducing environment for the bacterial culture. Recent studies have shown that semi-passivebioaugmentation can be successfully applied to sites to achieve complete dechlorination under avariety of subsurface conditions (Lee et al., 2008; Mora et al., 2008). If intermittent ground-water recirculation is used between wells, the potential exists for more uniform culturedistribution transverse to groundwater flow.
5.4.3 Passive Approach
A passive approach refers to a system where the electron donor is emplaced once or on aninfrequent basis (i.e., annually or less) and where no forced gradient is applied. Bioaugmenta-tion may be conducted either during or following the electron donor addition. Both electrondonor and bacterial transport occur primarily under the influence of ambient groundwaterflow. Example applications include “biobarriers”, where a treatment zone is created perpendic-ular to groundwater flow (using injection wells, direct push injection points, or trenches) toreduce the flux of contaminants downgradient and large-scale inundation of source areas orplumes with a long-lived, or “slow-release,” electron donor with the goal of achieving substan-tial treatment during the lifetime of the electron donor.
5.4.3.1 Advantages/Disadvantages for Biostimulation
Given that several methods for passive biostimulation/bioaugmentation exist, the advan-tages and disadvantages of the methods cannot be generalized, but must be consideredindividually. Table 5.2 discusses each delivery method relative to several key considerationsfor design and implementation. While advantages and disadvantages differ among the passiveapproaches, some generalizations can be made for passive approaches relative to semi-passiveand active biostimulation/bioaugmentation strategies. In general, passive approaches requireless O&M and have lower capital costs at small scales, but can have higher capital costs at largescales.
5.4.3.2 Implications for Bioaugmentation
The means of inoculation in a passive approach can depend largely on the methodologyused for electron donor emplacement. When conventional injection wells or direct-push injec-tion points are used, bioaugmentation is most often performed using the injection locations.For trenching, inoculation can be performed using a pipe laid in the trench during installation orusing wells installed in, or immediately downgradient, of the trench. For fracturing applica-tions, the boreholes used to initiate fractures can be used to inoculate groundwater oncefractures have been installed. Several studies have been performed showing that bioaugmenta-tion with hydraulic fracturing has significantly better results than standard bioaugmentation,especially in low permeability subsurface environments (Bjerg et al., 2006).
Although it is common to inject electron donors via single-use direct-push points, few casesof inoculations in direct-push injection points have been documented in the literature. Onereason direct-push points are not used more often may be that they are temporary points
160 C.E. Aziz et al.

installed at the time of injection, and therefore it can be difficult to know if reducing conditionsare present before (and after) the inoculation.
Inoculation in passive systems is generally performed in the same injection locations usedfor electron donor addition. Because survival and effectiveness of the inocula requires highlyreducing conditions, bioaugmentation may have to occur after electron donor addition hasresulted in appropriate conditions (Ellis et al., 2000; Major et al., 2002). However, if the aquiferis sufficiently reducing prior to initiation of biostimulation, inoculation can be performedsimultaneously with the initial electron donor addition. In most cases, only one inoculation isrequired.
A passive approach can be a successful method for bioaugmentation (Dybas et al., 1998;Lendvay et al., 2003). Kovacich et al. (2007) showed that Dhc moved significant distancesdowngradient under ambient groundwater flow, reaching levels of 106–107 cells/L at wells 45 ft(~15 m) downgradient within only 8 months. Similarly, a recent field-scale comparison of“active” and “passive” bioaugmentation (ESTCP Project ER-200513; Trotsky et al., 2010)showed that Dhc could spread over considerable distances following passive bioaugmentation(i.e., a one-time injection, relying on migration with groundwater for further distribution).The passively-injected Dhc cells migrated at least 30 ft (10 m) downgradient, causing completedechlorination to ethene over that distance. The measured travel time for the Dhc was only1.5–3 times longer than the conservative tracer (bromide).
5.5 CONCLUSIONS
Bioaugmentation will be most successful if exposure to oxygen is minimized, the aquiferpH is near neutral, and sufficient electron donor is provided to meet the demand of thechlorinated solvents and competing alternate electron acceptors. Many different types offermentable carbon substrates can be employed to provide a source of hydrogen to the Dhcbacteria to drive reductive dechlorination. The choice of substrate will largely depend on thesystem configuration and cost. If aquifer conditions are not immediately suitable, precondi-tioning through the addition of electron donor and/or buffer is often required to lower the ORPto less than�75 mV and change the pH to near neutral. Electron donor and buffer selection willbe influenced by the system configuration and cost considerations.
Currently there are no firm guidelines with respect to the amount of culture to inject.Typically, practitioners aim to achieve a minimum of 107 Dhc/L in situ for a target treatmentvolume, as empirically this density has generally corresponded with the presence of ethene.A more complex model for estimating dosage effects has been developed (Schaefer et al.,2009) and verified in the field (Schaefer et al., 2010a), and it is expected to be available soon asa module for a widely-used groundwater transport model (Torlapati et al., 2012).
There are various techniques for distributing the culture, including using the electron donorsolution to push the culture following injection, recirculation, or multiple direct push injectionsof culture. The relative effectiveness of these various approaches is still under study, but allof the techniques have been widely used. Laboratory column studies have shown that mostDhc remain near the point of injection, and the more mobile cells have been shown to have thesame or better activity that the original inoculum. However, several field-scale studies havedemonstrated that Dhc can travel hundreds of feet from the injection well over time, presum-ably through growth and detachment processes.
There are a variety of bioremediation system configurations (i.e., active, semi-passive andpassive) where bioaugmentation can be employed. All three general approaches have beensuccessful for bioaugmentation applications. Time is required for Dhc to migrate throughout
Bioaugmentation Considerations 161

and colonize the treatment zone, and this fact should be borne in mind during the design andperformance monitoring of bioremediation systems employing bioaugmentation.
ACKNOWLEDGMENT
The authors thank Mike Lamar and Kent Sorenson (CDM Smith) for the helpful discussionsand contributions to this chapter.
REFERENCES
Azizian MF, Behrens S, Sabalowsky A, Dolan ME, Spormann AM, Semprini L. 2008.Continuous-flow column study of reductive dehalogenation of PCE upon bioaugmentationwith the Evanite enrichment culture. J Contam Hydrol 100:11–21.
Battelle. 2004. Demonstration of Bioaugmentation at Kelly AFB, TX. ER-199914 Final Report.ESTCP, Arlington, VA, USA. http://www.serdp-estcp.org/Program-Areas/Environmental-Restoration/Contaminated-Groundwater/ER-199914. Accessed March 18, 2012.
Behrens S, Azizian MF, McMurdie PJ, Sabalowsky A, Dolan ME, Semprini L, Spormann AM.2008. Monitoring abundance and expression of Dehalococcoides species chloroethene-reductive dehalogenases in a tetrachlorethene-dechlorinating flow column. Appl EnvironMicrobiol 74:5695–5703.
Bjerg PL, Jacobson CS, Durant N, Cox E, Jorgensen TH. 2006. Field demonstration ofstimulated reductive dechlorination and bioaugmentation after hydraulic fracturing inclayey till. 1st European Workshop on In-Situ Stimulation and Remediation of Contami-nated Fractured Soils, Szczecin, Poland, September 28–29. Oral Presentation.
Brown BV, Turner SS, Anderson DL, Sorenson Jr KS. 2009. Full-scale bioremediation of ahigh-concentration chlorinated solvents mixture through recirculation with horizontalwells. In Wickramanayake GB, Rectanus HV, conference chairs, Proceedings, TenthInternational In Situ and On-Site Battelle Bioremediation Symposium, Baltimore, MD,USA, May 5–8. Battelle Memorial Institute, Columbus, OH, USA, Abstract D-10.
Cupples AM, Spormann AM, McCarty PL. 2004. Vinyl chloride and cis-dichloroethene dechlo-rination kinetics and microorganism growth under substrate limiting conditions. EnvironSci Technol 38:1102–1107.
Duhamel M, Wehr SD, Yu L, Rizvi H, Seepersad S, Dworatzek S, Cox EE, Edwards EA. 2002.Comparison of anaerobic dechlorinating enrichment cultures maintained on tetrachlor-oethene, trichloroethene, cis-dichloroethene, and vinyl chloride. Water Res 36:4193–4202.
Dworatzek S, Roberts J, Harkness M, Fisher A, Mack EE, Payne JA, Lee M, Major D, AchesonC, Herrmann R, Mao X. 2006. Inhibition of reductive dechlorination by sulfate reductionin microcosms. In Sass BM, conference chair, Proceedings Fifth International Conferenceon Remediation of Chlorinated and Recalcitrant Compounds, Monterey, CA, USA, May22–25. Battelle Press, Columbus, OH, USA, Abstract A-70.
DybasMJ, BarcelonaM, Bezborodnikov S, Davies S, Forney L, Heuer H, Kawka O, Mayotte T,Sepulveda-Torres L, Smalla K, Sneathen M, Tiedje J, Voice T, Wiggert DC, Witt ME,Criddle CS. 1998. Pilot-scale evaluation of bioaugmentation for in situ remediation of acarbon tetrachloride-contaminated aquifer. Environ Sci Technol 32:3598–3611.
162 C.E. Aziz et al.

Eaddy A. 2008. Scale-Up and Characterization of an Enrichment Culture for Bioaugmentationof the P-Area Chlorinated Ethene Plume at the Savannah River Site. MS Thesis, ClemsonUniversity, Clemson, SC, USA.
Ellis DE, Lutz EJ, Odom JM, Buchanan Jr RJ, Bartlett CL, Lee MD, Harkness MR, DeweerdKA. 2000. Bioaugmentation for accelerated in situ anaerobic bioremediation. Environ SciTechnol 34:2254–2260.
Emelko MB, Hood ED, Cox EE, Edwards EA. 2006. Bioaugmentation for Chlorinated SolventRemediation. Proceedings, Advanced Technology in the Environmental Field. Lanzarote,Canary Islands, Spain, February 6–9.
Friis AK, Heimann AC, Jakobsen R, Albrechtsen H-J, Cox E, Bjerg PL. 2007. Temperaturedependence of anaerobic TCE – Dechlorination in a highly enriched Dehalococcoides-containing culture. Water Res 41:355–364.
Fuller ME, Dong H, Mailloux BJ, Onstott TC, DeFlaun MF. 2000. Examining bacterialtransport in intact cores from Oyster, Virginia: Effect of sedimentary facies type onbacteria breakthrough and retention. Water Resour Res 36:2417–2431.
Ginn TR, Wood BD, Nelson KE, Scheibe TD, Murphy EM, Clement TP. 2002. Processes inmicrobial transport in the natural subsurface. Adv Water Resour 25:1017–1042.
Harkness M, Fisher A, Royer R, Possolo A, Lee M, Mack EE, Payne J, Major D, Roberts J,Dworatzek S, Acheson C, Herrmann R, Mao X. 2006. SABRE multi-lab, statistically basedmicrocosm study for TCE source zone remediation. In Sass BM, conference chair,Proceedings, Fifth International Conference on Remediation of Chlorinated and Recalci-trant Compounds, Monterey, CA, USA, May 22–25. Battelle Press, Columbus, OH, USA,Abstract B-44.
He J, Sung Y, Dollhopf ME, Fathepure BZ, Tiedje JM, Loffler FE. 2002. Acetate versushydrogen as direct electron donors to stimulate the microbial reductive dechlorinationprocess at chloroethene-contaminated sites. Environ Sci Technol 36:3945–3952.
He J, Ritalahti KM, Yang KL, Koenigsberg SS, Loffler FE. 2003. Detoxification of vinylchloride to ethene coupled to growth of an anaerobic bacterium. Nat 424:62–65.
He J, Sung Y, Krajmalnik-Brown R, Ritalahti K, Loffler F. 2005. Isolation and characterizationof Dehalococcoides sp. strain FL2, a trichloroethene (TCE)- and 1,2-dichloroethene-respir-ing anaerobe. Environ Microbiol 7:1442–1450.
Hood ED, Major DW, Quinn JW, Yoon W-S, Gavaskar A, Edwards EA. 2008. Demonstrationof enhanced bioremediation in a TCE source area at launch complex 34, Cape CanaveralAir Force Station. Groundwater Monitor Remediat 28:98–107.
ITRC (Interstate Technology & Regulatory Council). 2005. Overview of In Situ Bioremediationof Chlorinated Ethene DNAPL Source Zones. BIODNAPL-1. Bioremediation of DenseNonaqueous Phase Liquids (Bio DNAPL) Team, ITRC, Washington, DC, USA.
Kovacich MS, Beck D, Rabideau T, Pettypiece E, Smith K, Noel M, Zack MJ, Cannaert MT.2007. Full-scale biaugmentation to create a passive biobarrier to remediate a TCE ground-water plume. In Gavaskar AR, Silver CF, chairs, Proceedings of the Ninth InternationalIn Situ and On-Site Bioremediation Symposium, Baltimore, MD, USA, May 7–10, 2007,Paper I-18.
Lee PKH, Macbeth TW, Sorenson Jr KS, Deeb RA, Cohen LA. 2008. Quantifying genes andtranscripts to assess the in situ physiology of Dehalococcoides spp, in a trichloroethene-contaminated groundwater site. Appl Envrion Microbiol 74:2728–2739.
Lendvay JM, Loffler FE, Dollhope M, Aiello MR, Daniels G, Fathepure BZ, Gebhard M, HeineR, Helton R, Shi J, Brown KR,Major Jr CI, Barcelona J, Petrovskis E, Hickey R, Tiedje JM,
Bioaugmentation Considerations 163

Adriaens P. 2003. Bioreactive barriers: A comparison of bioaugmentation and biostimula-tion for chlorinated solvent remediation. Environ Sci Technol 37:1422–1431.
Loffler FE, Tiedje JM, Sanford RA. 1999. The fraction of electrons consumed in electronacceptor reduction (Fe) and hydrogen thresholds as indicators of halorespiratory physiol-ogy. Appl Environ Microbiol 65:4049–4056.
Loffler FE, Cole JR, Ritalahti KM, Tiedje JM. 2003. Diversity of Dechlorinating Bacteria. InHaggblom MM, Dossert ID, eds, Dehalogenation: Microbial Processes and EnvironmentalApplications, Kluwer Academic Publishers, New York, NY, USA.
Lu X, Wislon JT, Kampbell. 2006. Relationship between Dehalococcoides DNA in groundwater and rates of reductive dechlorination at field scale. Water Res 40:3131–3140.
Maillacheruvu KY, Parkin GF. 1996. Kinetics of growth, substrate utilization, and sulfidetoxicity for propionate, acetate, and hydrogen utilizers in anaerobic systems. WaterEnviron Res 68:1099–1106.
Major DW, McMaster ML, Cox EE, Edwards EA, Dworatzek SM, Hendrickson ER, Starr MG,Payne JA, Buonamici LW. 2002. Field demonstration of successful bioaugmentation toachieve dechlorination of tetrachloroethene to ethene. Environ Sci Technol 36:5106–5116.
Mawdsley JL, Brooks AW, Merry RJ. 1996. Movement of the protozoan pathogen C. parvumthrough three contrasting soil types. Biol Fertility Soils 21:30–36.
Maymo-Gatell X, Chien YT, Gossett JM, Zinder SH. 1997. Isolation of a bacterium thatreductively dechlorinates tetrachloroethene to ethene. Sci 276:1568–1571.
Maymo-Gatell X, Nijenhuis I, Zinder SH. 2001. Reductive dechlorination of cis-1,2-dichloroetheneand vinyl chloride by Dehalococcoides ethenogenes. Environ Sci Technol 35:516–521.
Mora RH, Macbeth TW, MacHarg T, Gundarlahalli J, Holbrook H, Schiff P. 2008. Enhancedbioremediation using whey powder for a trichloroethene plume in a high-sulfate, fracturedgranite aquifer. Remediat J 18:7–30.
Parsons Corporation. 2004. Principles and Practices of Enhanced Anaerobic Bioremediation ofChlorinated Solvents. Prepared for Air Force Center for Environmental Excellence, BrooksCity-Base, TX, USA and the Naval Facilities Engineering Service Center, Port Hueneme,CA, USA.
Ritalahti KM, Loffler FE, Rasch EE, Koenigsberg SS. 2005. Bioaugmentation for chlorinatedethene detoxification: Bioaugmentation and molecular diagnostics in the bioremediation ofchlorinated ethene-contaminated sites. Indust Biotechnol 1:114–118.
Robinson C, Barry DA. 2009. Design tool for estimation of buffer requirement for enhancedreductive dechlorination of chlorinated solvents in groundwater. Environ Model Software24:1332–1338.
Robinson C, Barry DA,McCarty PL, Gerhard JI, Kouznetsova I. 2009. pH control for enhancedreductive dechlorination of chlorinated source zones. Sci Total Environ 407:4560–4573.
Roling WFM. 2007. Do microbial numbers count? Quantifying the regulation of biogeochemi-cal fluxes by population size and cellular activity. FEMS Microbiol Ecol 62:202–210.
Rowlands D. 2004. Development of Optimal pH for Degradation of Chlorinated Solvents bythe KB-1® Anaerobic Bacterial Culture. Prepared for Geosyntec Consultants/SiREM,Guelph, Ontario, Canada.
Schaefer CE, Vainberg S, Condee C, Steffan RJ. 2009. Bioaugmentation for chlorinatedethenes using Dehalococcoides sp.: Comparison between batch and column experiments.Chemosphere 75:141–148.
Schaefer CE, Lippincott DR, Steffan RJ. 2010a. Field-scale evaluation of bioaugmentationdosage for treating chlorinated ethenes. Ground Water Monitor Remediat 30:113–124.
164 C.E. Aziz et al.

Schaefer CE, Towne RM, Vainberg S, McCray JE, Steffan RJ. 2010b. Bioaugmentation fortreatment of dense non-aqueous phase liquid in fractured sandstone blocks. Environ SciTechnol 44:4958–4964.
Scheutz CE, Durant ND, Dennis P, Hansen MH, Jorgensen T, Jakobsen R, Cox EE, Bjerg PL.2008. Concurrent ethene generation and growth of Dehalococcoides containing vinylchloride reductive dehalogenase genes during an enhanced reductive dechlorination fielddemonstration. Environ Sci Technol 42:9302–9309.
Sleep BE, Seepersad DJ, Mo K, Heidorn CM, Hrapovic L, Morrill PL, McMaster ML, HoodED, Lebron C, Lollar BS, Major DW, Edwards EA. 2006. Biological enhancement oftetrachlorethene dissolution and associated microbial community changes. Environ SciTechnol 40:3623–3633.
Smatlak CR, Gossett JM, Zinder SH. 1996. Comparative kinetics of hydrogen utilization forreductive dechlorination of tetrachloroethene and methanogenesis in an anaerobic enrich-ment culture. Environ Sci Technol 30:2850–2858.
Steffan R, Schaefer C, Lippincott D. 2010. Bioaugmentation for Groundwater Remediation.Final Report. ESTCP, Arlington, VA, USA. http://www.serdp-estcp.org/Program-Areas/Environmental-Restoration/Contaminated-Groundwater/ER-200515. Accessed March 17,2012.
Torlapati J, Clement TP, Schaefer CE, Lee K-K. 2012. Modeling Dehalococcoides sp. aug-mented bioremediation in a single fracture system. Ground Water Monitor Remediat DOI:10.1111/j.1745-6592.2011.01392.x.
Trotsky J, Wymore RA, Lamar MR, Sorenson KS. 2010. A Low-Cost, Passive Approach forBacterial Growth and Distribution for Large-Scale Implementation of Bioaugmentation.Final Report. ESTCP, Arlington, VA, USA. http://www.serdp-estcp.org/Program-Areas/Environmental-Restoration/Contaminated-Groundwater/ER-200513. Accessed March 18,2012.
Vainberg S, Condee CW, Steffan RJ. 2009. Large scale production of Dehalococcoidessp.-containing cultures for bioaugmentation. J Indust Microbiol Biotechnol 36:1189–1197.
Wymore RA, Subramanian RR, Sorenson Jr KS, Evans PJ, Bamer J, Tulsiani U. 2009. Pilot-scale bioremediation with recirculation for a TCE source area with high 1,1-DCEconcentrations. In Wickramanayake GB, Rectanus HV, conference chairs, Proceedings,Tenth International In Situ and On Site Bioremediation Symposium, Baltimore, MD, USA,May 5–8. Battelle Memorial Institute, Columbus, OH, USA, Abstract D-13.
Yang Y, McCarty PL, 1998. Competition for hydrogen within a chlorinated solvent dehalogen-ating mixed culture. Environ Sci Technol 32:3591–3597.
Yang Y, McCarty PL. 2000. Biologically enhanced dissolution of tetrachloroethene DNAPL.Environ Sci Technol 34:2979–2984.
Yolcubal L, Pierce SA, Maier RM, Brusseau ML. 2002. Biodegradation during contaminanttransport in porous media: V. The influence of growth and cell elution on microbialdistribution. J Environ Qual 31:1824–1830.
APPENDIX 5A
BACKGROUND ON INNOCULUM DENSITYAND DECHLORINATION RATES
For any bioaugmentation application, a key question is howmany organisms must be addedto a site. The amount of organisms needed directly affects the cost of the technology, and it can
Bioaugmentation Considerations 165

be affected by several factors, including: (1) the concentration of contaminant present;(2) hydrogeochemical conditions at the site; (3) competition by indigenous organisms; (4) thenumber and relative activity of dehalogenating organisms (i.e., Dhc) in the added consortium;(5) in situ growth or death of the added organisms; and (6) filtration, attachment anddetachment of the added culture.
Although several hundred bioaugmentation projects have now been performed around theworld, most have relied on simple assumptions, simple models, cost barriers, a sense of feel, orwild guesses to determine the amount of culture to add. Because relatively few of theseapplications have been described in published literature, and because the published studiesoften do not describe how many organisms were used or how the amount of culture wasselected, the task of selecting the “correct” amount of culture for a given application remainschallenging.
Some guidance on the amount of culture needed for successful remediation was providedby Lu et al. (2006) who evaluated eight sites to determine the amount of Dhc needed to achievereasonable rates of remediation at field scale. They concluded that sites with a “generallyuseful” rate of dechlorination of cis-DCE and VC (rate constant �0.3/year) had Dhc densitiesgreater than 107 cells/L of groundwater. Although this data set was small, the results areconsistent with field-scale results where successful bioaugmentation was associated with Dhcnumbers >107/L (Hood et al., 2008; Ellis et al., 2000; Lendvay et al., 2003; Major et al., 2002;Ritalahti et al., 2005).
However, Roling (2007) analyzed the data provided by Lu et al. by using “metaboliccontrol analysis” (MCA) and concluded that the flux reported by Lu et al. was not regulatedby population size, but rather it was regulated at the cellular level (e.g., the specific activity ofthe cells). The key point is that effective bioaugmentation requires not only an adequatenumber, but the organisms also must be in an appropriate physiological condition. A recentstudy by Schaefer et al. (2009) provides support for this conclusion, and suggests that in situtreatment of VOCs can select for Dhc populations with faster dechlorination rates. Unfortu-nately, these findings complicate the challenge of predicting the amount of Dhc organismsthat must be added to a target aquifer to achieve timely and cost effective remediation.
Laboratory Studies
Several laboratory microcosm, column and model aquifer studies have been performed toevaluate bioaugmentation for chlorinated solvent remediation. Although these studies areuseful for evaluating the efficacy of a bioaugmentation remedy for a chosen site, they rarelycompare the effect of different cell dosages on remedial efficiency. In fact, the amount ofDhccells added to microcosms is often not reported. In one case, 2 milliliters (mL) of a culturepresumably containing 106 Dhc/mL was added to microcosms containing 60 g of soil and150 mL of groundwater and a TCE concentration of approximately 800 mg/L TCE (Major et al.,2002). This inoculum density is equal to approximately 1 � 107 Dhc/L. TCE degradation beganafter about 30 days of incubation and all of the TCE was converted to cis-DCE by about day 42.When a 100-fold higher concentration of TCE was added, TCE degradation began at about day42 and was complete by about day 90.
In another laboratory study (Sleep et al., 2006), 30 mL of a Dhc culture containing2 � 107 Dhc/mL was added to a bench-scale flow cell with a pore volume of approximately2 L of water and a PCE DNAPL. This inoculum density represented a Dhc concentration of~3 � 108 Dhc/L. cis-DCE was detected in the flow cell effluent 13 days after bioaugmenta-tion, and the Dhc concentrations in the effluent increased corresponding to increasedconcentrations of cis-DCE in the effluent. Over the course of the study, approximately
166 C.E. Aziz et al.
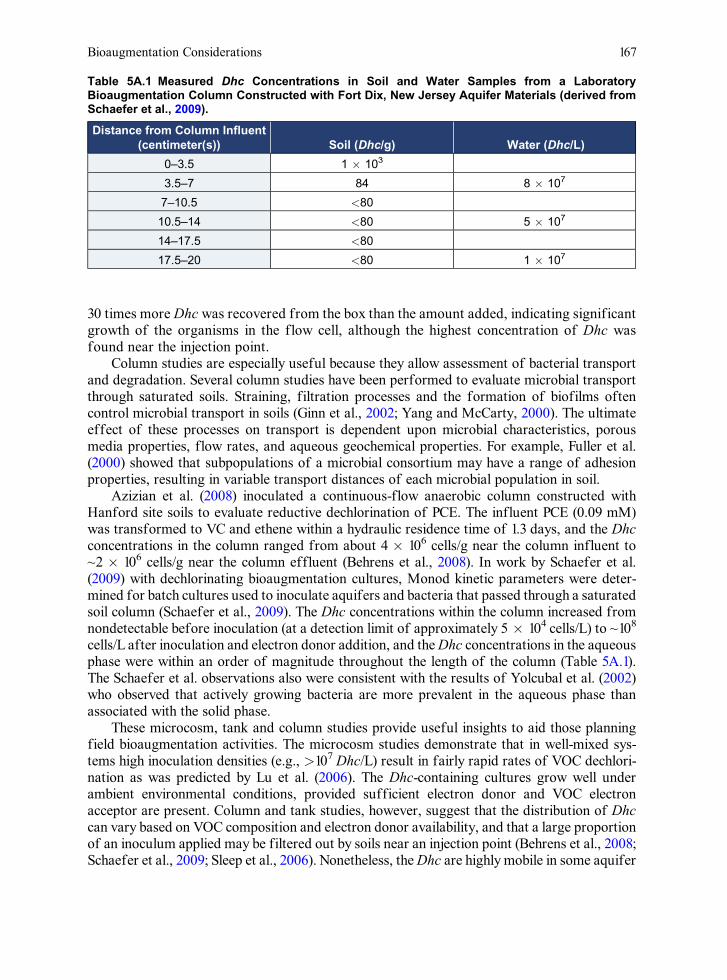
30 times more Dhc was recovered from the box than the amount added, indicating significantgrowth of the organisms in the flow cell, although the highest concentration of Dhc wasfound near the injection point.
Column studies are especially useful because they allow assessment of bacterial transportand degradation. Several column studies have been performed to evaluate microbial transportthrough saturated soils. Straining, filtration processes and the formation of biofilms oftencontrol microbial transport in soils (Ginn et al., 2002; Yang and McCarty, 2000). The ultimateeffect of these processes on transport is dependent upon microbial characteristics, porousmedia properties, flow rates, and aqueous geochemical properties. For example, Fuller et al.(2000) showed that subpopulations of a microbial consortium may have a range of adhesionproperties, resulting in variable transport distances of each microbial population in soil.
Azizian et al. (2008) inoculated a continuous-flow anaerobic column constructed withHanford site soils to evaluate reductive dechlorination of PCE. The influent PCE (0.09 mM)was transformed to VC and ethene within a hydraulic residence time of 1.3 days, and the Dhcconcentrations in the column ranged from about 4 � 106 cells/g near the column influent to~2 � 106 cells/g near the column effluent (Behrens et al., 2008). In work by Schaefer et al.(2009) with dechlorinating bioaugmentation cultures, Monod kinetic parameters were deter-mined for batch cultures used to inoculate aquifers and bacteria that passed through a saturatedsoil column (Schaefer et al., 2009). The Dhc concentrations within the column increased fromnondetectable before inoculation (at a detection limit of approximately 5 � 104 cells/L) to ~108
cells/L after inoculation and electron donor addition, and theDhc concentrations in the aqueousphase were within an order of magnitude throughout the length of the column (Table 5A.1).The Schaefer et al. observations also were consistent with the results of Yolcubal et al. (2002)who observed that actively growing bacteria are more prevalent in the aqueous phase thanassociated with the solid phase.
These microcosm, tank and column studies provide useful insights to aid those planningfield bioaugmentation activities. The microcosm studies demonstrate that in well-mixed sys-tems high inoculation densities (e.g., >107 Dhc/L) result in fairly rapid rates of VOC dechlori-nation as was predicted by Lu et al. (2006). The Dhc-containing cultures grow well underambient environmental conditions, provided sufficient electron donor and VOC electronacceptor are present. Column and tank studies, however, suggest that the distribution of Dhccan vary based on VOC composition and electron donor availability, and that a large proportionof an inoculum applied may be filtered out by soils near an injection point (Behrens et al., 2008;Schaefer et al., 2009; Sleep et al., 2006). Nonetheless, theDhc are highly mobile in some aquifer
Table 5A.1 Measured Dhc Concentrations in Soil and Water Samples from a LaboratoryBioaugmentation Column Constructed with Fort Dix, New Jersey Aquifer Materials (derived fromSchaefer et al., 2009).
Distance from Column Influent(centimeter(s)) Soil (Dhc/g) Water (Dhc/L)
0–3.5 1 � 103
3.5–7 84 8 � 107
7–10.5 <80
10.5–14 <80 5 � 107
14–17.5 <80
17.5–20 <80 1 � 107
Bioaugmentation Considerations 167

materials and they can be readily transported in the aqueous phase (Schaefer et al., 2009), whichis consistent with early field observations (Ellis et al., 2000; Lendvay et al., 2003; Major et al.,2002). Further, the Dhc subpopulations that move through the aquifer may be compositionallydifferent than the original inoculum (Behrens et al., 2008), and they may have a greater specificactivity that the original inoculum (Schaefer et al., 2009).
Correlations Between Inoculum Density and In SituDechlorination Rates
Despite the extensive laboratory research performed to evaluate bioaugmentation withDhc-containing consortia, and the application of the technology at several hundred sites,no clear correlations between inoculum density and in situ dechlorination rates have emerged.The only study focused on correlating in situ Dhc levels in the field to degradation activities arethose discussed above by Lu et al. (2006) and that study focused on natural Dhc populationsrather than those added as a bioaugmentation remedy.
Only a few field-scale bioaugmentation projects have been described in detail, and manyof these were pilot studies performed early in the development of Dhc-containing culturesfor VOC remediation before quantitative polymerase chain reaction (qPCR) techniqueswere available to quantify the numbers of Dhc present in the aquifers. In a recent study,Lee et al. (2008) measured Dhc numbers and reductive dehalogenase gene transcripts toevaluate Dhc performance and activity at a bioaugmentation site. The site, located at FortLewis, WA, USA, contained TCE at DNAPL concentrations, and bioaugmentation was per-formed in two plots containing a recirculation system. During the 3 months after cultureinjection, VC reductase gene (vcrA) copy numbers increased by as much as 2 orders ofmagnitude in the plots, but no attempts were made to correlate Dhc or reductive dehalogenasenumbers to in situ dechlorination rates. In a similar recent study (Scheutz et al., 2008),successfully bioaugmented a site with Dhc and found that the Dhc numbers increased toapproximately 108 cells/L after 76 days, and remained relatively constant throughout most ofthe remainder of the demonstration.
Most recently, Schaefer et al. (2010a) evaluated the effect of inoculation density ondechlorination rates in a silty sand aquifer at Fort Dix, NJ, USA (Steffan et al., 2010). Theaquifer at the site had native Dhc, but the indigenous strains were unable to dechlorinate DCEor VC, resulting in a DCE stall at the site. Furthermore, the aquifer had a low natural pH (pH<5) that required pH adjustment in order to achieve complete dechlorination, even with anadded inoculum. The study used four recirculation loops initially designed to achieve a 30-daytravel time between the injection and extraction wells. Three loops were inoculated with 10X, 1X,or 0.1 X of the predicted necessary inoculum. The predicted inoculum density was based on aneven distribution of the added cells within the treatment zone to an aqueous Dhc concentrationof 107 Dhc/L. Figure 5A.1 shows the VOC concentrations in the second row of monitoring wells(20 ft [6 m] from the injection well) in the three inoculated recirculation loops. Most notably,ethene was produced in all three inoculated recirculation loops, including loop three (BMW 6)which received the lowest inoculum volume (i.e., 100-fold less than loop 1 [BMW2]). No ethenewas produced in loop 4 which was not inoculated but did contain native Dhc strains. The studyconcluded that many factors affect the amount of culture needed for effective treatment andthat selecting the amount of culture needed cannot reliably be based solely on the amount ofgroundwater to be treated. A 1-dimensional model has been developed to aid practitioners indetermining the amount of culture needed (Schaefer et al., 2009), and the utility of the model for
168 C.E. Aziz et al.

predicting remediation performance with different inoculum amounts was verified during thefield study (Schaefer et al., 2010a).
Also notable from the Fort Dix field experiment data is significant transport and apparentgrowth of Dhc in situ. These results are consistent with previously described field results andthe results of laboratory studies as described above. Dhc levels in the actively dechlorinatingtreatment loops were in the range of 107–109 Dhc/L. The results from this demonstrationindicate that there is no simple relationship between numbers and activity. Rather, the migrationof injected Dhc cultures, and subsequent treatment of dissolved chlorinated ethenes, is highlydependent upon a relatively small fraction of the Dhc population that is mobile in thesubsurface (because they readily detach from the solid surfaces). The rate at which thesemobileDhc increase is dependent upon the growth rate of the injected (and primarily immobile)Dhc, which do not migrate a substantial distance into the soil. In addition, based on the modelsimulations and sensitivity, the Dhc detachment and growth rate may be more important fordetermining overall bioaugmentation success than initial Dhc dosage or the utilization rate(Schaefer et al., 2010a; Torlapati et al., 2012).
Days
0.0
0.5
1.0
1.5
2.0
2.5
3.0
3.5
4.0
-100 0 100 200 300 400
-100 0 100 200 300 400
BMW2
Days
0.0
5.0
10
15
20
1000
104
105
106
107
108
109
1010
1011
1000
104
105
106
107
108
109
1010
1011
-100 0 100 200 300 400
BMW4
Days Days
0.0
0.5
1.0
1.5
2.0
2.5
3.0
100
104
105
106
1010
100
104
105
106
1010
-100 0 100 200 300 400
BMW8
Dhc (cells/L
)Dhc (cells/L
)
Dhc (cells/L
)Dhc (cells/L
)V
OC
s an
d E
then
e (µ
M)
VO
Cs
and
Eth
ene
(µM
)V
OC
s an
d E
then
e (µ
M)
VO
Cs
and
Eth
ene
(µM
)
0.0
2.0
4.0
6.0
8.0
10BMW6
StartUp
Bioaugmentation #2
Bioaugmentation #1
ba
dc
Figure 5A.1. Concentration of VOCs and Dhc at the second row of monitoring wells of a fielddemonstration system at Fort Dix, New Jersey. The monitoring wells were located 20 ft down-gradient of the recirculation system injection wells. The system employed four recirculation loopsthat were inoculated with enough Dhc culture to theoretically achieve 108Dhc/L (BMW2), 107Dhc/L(BMW4), 106 Dhc/L (BMW6), and native Dhc only (BMW8). Bioaugmentation events were as identi-fied for BMW6. Shortly after the first bioaugmentation event, pH in the aquifer exceeded pH 9 dueto a system failure, so a second inoculum was applied to the site as indicated. Symbols representTCE (○), DCE (□), VC (e), Ethene (�), and Dhc (▪).
Bioaugmentation Considerations 169