beyond integration readiness level (irl): a
TRANSCRIPT
Beyond Integration Readiness Level (IRL):
A Multidimensional Framework to Facilitate the Integration of
System of Systems
by Clarence Lacar Eder
BS in Mechanical Engineering, May 1996, University of Hawaii
Masters in Business Administration, March 1999, Wright State University
A Dissertation submitted to
The Faculty of
The School of Engineering and Applied Science
of The George Washington University
in partial fulfillment of the requirements
for the degree of Doctor of Philosophy
May 21, 2017
Shahram Sarkani
Professor of Engineering Management and Systems Engineering
Thomas Andrew Mazzuchi
Professor of Engineering Management and Systems Engineering

ii
The School of Engineering and Applied Science of The George Washington University
certifies that Clarence Lacar Eder has passed the Final Examination for the degree of
Doctor of Philosophy as of March 3, 2017. This is the final and approved form of the
dissertation.
Beyond Integration Readiness Level (IRL):
A Multidimensional Framework to Facilitate the Integration of System of Systems
Clarence Lacar Eder
Dissertation Research Committee:
Shahram Sarkani, Professor of Engineering Management and Systems Engineering,
Dissertation Co-Director
Thomas Andrew Mazzuchi, Professor of Engineering Management and Systems
Engineering, Dissertation Co-Director
E. Lile Murphree, Professor Emeritus of Engineering Management and Systems
Engineering, Committee Member
Paul Blessner, Professional Lecturer in Engineering Management and Systems
Engineering, Committee Member
Bill Olson, Professional Lecturer in Engineering Management and Systems
Engineering, Committee Member

iii
© Copyright 2017 by Clarence L. Eder.
All rights reserved

iv
Dedication
I dedicate this dissertation to my wife, Stacy North Eder, and my two beautiful
children, Haley North Eder and Colin Kekoa Eder, who continue to provide their
unconditional love to me, and provided their relentless support throughout this program
while I balance many other responsibilities.
I also want to dedicate this to my mother, Lucrecia Lacar Eder, who passed away
prior to me starting this program. She has been the source of motivation and positive
thinking throughout my life, and her spirit continues to inspire me to accomplish great
things.

v
Acknowledgments
I am grateful for Dr. Thomas A. Mazzuchi and Dr. Shahram Sarkani, Professors of
Engineering Management and Systems Engineering at George Washington University,
who have guided me throughout this research process and helped me refine the framework
of my research.
I want to thank the wonderful men and women of our United States Air Force,
Department of Defense (DoD) Government Civilians, Systems Engineering Technical
Assistance (SETA) and Federally Funded Research and Development Center (FFRDC)
contractors who have provided their insight to my research based on their acquisitions and
engineering experience. I want to thank the Los Angeles Chapter of the International
Council of Systems Engineers (INCOSE) and many other systems engineering and
acquisition professionals for their inputs and participation into my survey.
I want to acknowledge my friend and former supervisor at the Missile Defense
Agency (MDA), Tim Clardy, who helped me become part of this MDA PhD cohort
program with him. Tim, along with John Chang and Mehrdad Karimi, have been
instrumental in helping me overcome some challenges throughout the program.
Last, but not least, my family’s unwavering support has been tremendous—Stacy
Eder (wife), Haley Eder (daughter), Colin Eder (son), Feliberto Eder (father), Charles Eder
(brother), and Carolyn Eder Rivera (sister).

vi
Abstract of Dissertation
Beyond Integration Readiness Level (IRL):
A Multidimensional Framework to Facilitate the Integration of System of Systems
Integration Readiness Level (IRL) can be an effective systems engineering tool
to facilitate integration of System of Systems (SoS). Further research in systems
integration, analysis of major SoS integration data, and analysis of expert survey inputs
to SoS integration can enhance the current IRL principles for systems integration use.
The enhanced IRL assessment can help address Department of Defense’s (DoD)
uncontrollable cost growth of space systems as well as deliver systems in short
timelines in support of DoD’s goal to expedite the deployment of capabilities. IRL was
developed to complement Technology Readiness Level (TRL), but DoD never
implemented IRL. This research explains how IRL can be a separate tool to assess
integration of systems as opposed to just integration of technologies. To enhance IRL
evaluation, data of past DoD space systems’ major integration issues were collected,
aligned with integration variables, and then grouped into attributes. The resulting
attributes and their refined definitions are the basis to calculate an enhanced IRL
through a systems integration assessment framework. The IRL assessment identifies
integration areas of emphasis that need to be addressed throughout the system
development effort before the system becomes operational.
Keywords:
Integration Readiness Level (IRL), Technology Readiness Level (TRL), systems
integration, Department of Defense (DoD) Acquisitions, System of Systems (SoS),
DoD Space Systems

vii
Table of Contents
Dedication…………………………………………………………………….…………..iv
Acknowledgements………………………………………………………….…………….v
Abstract…………………………………………………………………….……………..vi
Table of Contents………………………………………………………….……………..vii
List of Figures...………………………………………………………….………………..x
List of Tables.…………………………………………………………………………….xi
Chapter 1: Introduction……………………………………………………………………1
1.1 Problem Statement…………………………………………………..…….1
1.2 History of Problem………………………………………………...............2
1.3 Problem Focus…………………...……………….…...………….…...…...6
1.4 Initial Research Approach……………………………………………..…..8
1.5 Impact to DoD Acquisitions……………………....…………….………....8
1.6 Organization of the Dissertation………………….……………….………9
Chapter 2: Literature Review…………………………………...…………….…………12
2.1 Integration Readiness Level……………………………………………...12
2.2 Technology Readiness Assessment (TRA)……………………………....13
2.3 Systems Integration………………………………………………………15
2.4 System of Systems……………………………….………………..…..…16
2.5 Space Systems……………………………………………………………17
2.6 Architectural Framework…………………………………….…………..17
2.7 Integration Attributes………………………………………………….....18
2.8 Regression Analysis and Supporting Analysis Tools…...………………..20
viii
Chapter 3: Research Management…………………….………………….……………...24
3.1 Theory……………………………………………………………………24
3.2 Research Criteria…………………………………………………………24
3.3 DoD Space Systems Data………………...……………….……….……..26
3.4 Research Goals………………………………………………….………..27
3.5 Limitations of Research………………………………….……….…...…30
3.6 Assumptions……………………………………………………………...32
3.7 Challenges………………………………………………………………..33
Chapter 4: Methodology………………………………………………….……………....34
4.1 Research Process…………………………………………………………34
4.2 Data Exploration…………………………………………………………35
4.3 Data Collection…………………………………………….………….…36
4.4 Attributes Derived from Data Collection…………………………….…..39
4.5 Results of Data Collection………………………………….……….…...44
4.6 Summary of Data Collection Results…………………………………….61
Chapter 5: Results………………………………………………………………………..62
5.1 Data Analysis…………………………………………………………….62
5.2 Data Validation Through Survey………………………………………...65
5.3 Survey Development and Administration…………………….………….67
5.4 Survey Results………….....……………………………….………….…72
5.5 Survey Analysis……………………………………………………….…82
5.6 Comparison of Results…………………………………………………...92
5.7 Weight of Attributes………………………………...……………..…….94

ix
Chapter 6: Conclusion……………………………………………………….…………...95
6.1 Final Criteria of Attributes………………………………….……………95
6.2 Integration Assessment Framework Development………………………97
6.3 Integration Assessment Framework Application……………………….103
6.4 Discussion………………………………………………………………113
6.5 Limitations and Future Work…………………………………………...115
Chapter 7: References…………………………………………………………………..116

x
List of Figures
Figure 1-1: Systems Engineering V-Model (MITRE Corporation, 2009)……………..….1
Figure 2-1: DoD Acquisition Process (DoDI 5000.02, 2015)……...…………….……....13
Figure 2-2: Context Diagram for the Integration Process (INCOSE Systems
Engineering Handbook Ver 3.2.2, 2011)……..…………………………………………..15
Figure 3-1: Space Capability Integration Into Family of Systems (Notional View)….....26
Figure 3-2: Notional DoD Space Systems Architecture and Major Integration Points.....29
Figure 5-1: Normal Probability Graph of the Attributes Derived from Data Collection….64
Figure 5-2: Normal Probability Graph of the Attributes (Ranked Values from the
Survey)..........................................................................................................................….85
Figure 5-3: Normal Probability Graph for Survey Results (with Log Years of
Experience)........................................................................................................................91
Figure 5-4: Research Framework to Derive Weights of Attributes……………………...92
Figure 6-1: Systems Integration Assessment Framework…………………………..……98
Figure 6-2: Case 1 Example: Integration of X1 payload into OCS Family of
Systems………………………………………………………………………………....106
Figure 6-3: Case 2 Example: Integration of NBS into OES System of Systems…….…110

xi
List of Tables
Table 1-1: IRL and TRL Definition (Sauser, B. et al., 2010)……………………………..5
Table 4-1a & b: Advanced Extremely High Frequency (AEHF) Data………….…….…45
Table 4-2a & b: Evolved Expendable Launch Vehicle (EELV) Data………….………...48
Table 4-3a & b: Global Positioning Satellite (GPS) Data…………………….………….50
Table 4-4a & b: National Polar-Orbiting Operational Environment Satellite System
(NPOESS) Data…………………………………...………….…………………….…….53
Table 4-5a & b: Space Based Infrared Systems (SBIRS) Data…………………….…….55
Table 4-6a & b: Wideband Global Satellite Communications (WGS) Data……………..58
Table 4-7: Summary of DoD Space Systems Integration Data from 1999-2014………...61
Table 5-1a to d: Results of Data Analysis…………………………………………….….65
Table 5-2: Key for Survey Results Data (Questions #1 to 7)……………………….……73
Table 5-3: Survey Results Data (Questions #1 to 7)……………………………………..74
Table 5-4: Summary of Survey Results – Ranking Attributes……………………………83
Table 5-5: Survey Results Summary Statistics…………………………………………..86
Table 5-6: Value of Attributes from Survey Results (Accounting for Log Years of
Experience)………………………………………………………………………………88
Table 5-7a & b: Survey Results Summary Statistics (Accounting for Log Years of
Experience)………………………………………………………………………………91
Table 5-8a & b: Comparison of Data and Survey Analyses……………………………..93
Table 5-9: Derived Weight of Each Attribute……………………………………………94
Table 6-1: Criteria of Each Attribute Using Derived Integration Variables……………..96

xii
Table 6-2a & b: Guidelines to Initial IRL for Each Attribute Using IRL Principles…….101

1
CHAPTER 1: INTRODUCTION
1.1 Problem Statement
Integration Readiness Level (IRL) was introduced to help understand the maturity
of integrating one system to another (Sauser B et al., 2010). The need to expand the use
of IRL is increasingly becoming more relevant in the United States’ Department of
Defense (DoD) Acquisitions as programs try to acquire integrated systems with the intent
to have multiple capabilities and interfaces.
When discussing about integration in systems engineering, it usually falls into the
latter part of the Systems Engineering Life Cycle process as depicted in the Systems
Engineering V-Model. The model can be implemented in many different ways; however,
according to MITRE’s Evolution of Systems Engineering (2009), “they all share
fundamental elements” as depicted in Figure 1-1.
Figure 1-1. Systems Engineering V-Model (Mitre Corporation, 2009)

2
In the Systems Engineering V-Model, the process starts with Concept
Development to System Design and Development, and then to Transition Operations and
Maintenance. The application of integrating the system becomes the focus only after
System Design and Development. System Integration, however, needs to be planned for
earlier in the systems engineering lifecycle to improve success of overall system delivery.
Understanding integration feasibility early in the program would be beneficial in
managing and planning for the success of overall integration of complex systems or
System of Systems (SoS).
Further research in systems integration, analysis of integration data, and the
development of systems architecture framework can help enhance IRL principles for SoS
integration. Enhanced IRL can improve to facilitate SoS integration, and the research
will focus on Department of Defense (DoD) SoS to derive integration assessment
framework.
1.2 History of Problem
The need to understand integration feasibility is necessary for integrating systems
into a Family of Systems. Systems Engineers need to understand all necessary
dependencies for successful integration. Throughout the years, DoD Acquisitions
implemented several systems engineering processes and tools to help meet budgetary
requirements while still trying to produce the best weapon systems available. There are
two major reasons why integration feasibility would be beneficial to include into the
systems engineering processes in DoD:

3
1) Uncontrollable Cost Growth:
SoS such as DoD space systems acquisitions have increased in actual system costs
from the initial estimates while the capability of the system decreased from original
intent. According to Government Accountability Office (GAO) report (2011), “the total
estimated costs for major space programs increased by about $13.9 Billion from initial
estimates for fiscal years 2010 through 2015, which is an increase of about 286 percent.”
This need to be managed better within DoD and additional tools are needed to understand
future impacts to system delivery.
2) Expediting Deployment of Capabilities:
DoD also implemented initiatives in place to expedite the deployment of
capabilities into operations as part of the Urgent Warfighter Needs efforts. Based on a
GAO report (2012), various practices have been implemented by program offices in order
to meet challenges to deliver capabilities within short time lines. Having additional
integration tools available to understand the feasibility of weapon systems deployment on
aggressive timelines could prevent schedule delays.
The DoD acquisition issues of uncontrollable cost growth and the need to
expedite the deployment of capabilities into operations trigger the drive to improve
systems engineering processes and tools that program managers can depend on when
making program decisions. Acquiring weapon systems with the right capability, under
budget, and deploy on schedule is the balance that DoD program managers need to make
decisions on in order to be successful with their programs. The right capability can be
defined to defeat current threats, which usually means applying the latest technology into
the weapon systems. Maturity of the technologies used into these systems becomes

4
critical to acquiring these systems. Understanding technology maturity helps with overall
planning because it explains the availability of those technology that supports the
development of the system.
In order to make decisions about systems and technology availability, DoD
Acquisitions adopted the use of Technology Readiness Level (TRL) in 2002 (DoDI
5000.02, 2013). TRL provides measurement for explaining the maturity of a system
based on the technology used for that system.
To further the use of TRL, IRL was introduced as an integration tool to
complement TRL as illustrated in Table 1-1 (Sauser B et al., 2010). IRL was developed
to align with the TRL definitions, but it was never officially implemented by DoD to help
with integration assessment. Other readiness levels such as System Readiness Level
(SRL) and Test Readiness Level were also introduced but not officially recognized by
DoD Acquisitions.
Although not implemented, the use of IRL could become a necessary tool to help
reduce integration risks of complex systems. Integrating SoS are becoming more
complex and the current definitions of IRL do not allow it to be independent of the TRL
process, which could be one reason why IRL is heavily scrutinized in current systems
engineering literature. IRL was developed to support TRL’s limitation of evaluating
complex interfaces. According to London, M.A. et al. (2014), while TRL is used for
“considering discrete technology elements, IRL is only limited to connecting these
technology links between components.”

5
Lvl TRL IRL
1 Basic principles observed and
reported
An interface between technologies has been identified
with sufficient detail to allow characterization of the
relationship
2 Technology concept and/or
application formulated
There is some level of specificity to characterize the
interaction between technologies through their interface
3 Analytical and experimental critical
function and/or characteristic proof of
concept
There is compatibility between technologies to orderly
and efficiently integrate and interact
4 Component and/or breadboard
validation in laboratory environment
There is sufficient detail in the quality and assurance of
the integration between technologies
5 Component and/or breadboard
validation in relevant environment
There is sufficient control between technologies
necessary to establish, manage, and terminate the
integration
6 System/subsystem model
demonstration in relevant environment
The integrating technologies can accept, translate, and
structure information for its intended application
7 System prototype demonstration in
relevant environment
The integration of technologies has been verified and
validated with sufficient detail to be actionable
8 Actual system completed and
qualified through test and
demonstration
Actual integration completed and mission qualified
through test and demonstration in the system
environment
9 Integration is mission proven through
successful mission operations
Execute a support program that meets operational
support performance requirements and sustains the
system in the most cost-effective manner over its total
life cycle
Table 1-1. IRL and TRL Definitions (Sauser, B. et al., 2010)

6
Based on Sauser, B. et al. (2010), IRL was introduced as, “a metric for systematic
measurement of the interfacing of compatible interactions for various technologies and
the consistent comparison of the maturity between integration points.” The concept itself
could be more useful, but it is currently limited to support TRL concepts (as shown in
Table 1-1). IRL’s main concept is to be used to evaluate integration of two technologies
that were evaluated by TRL process.
The principles of IRL can be used and enhanced to facilitate the integration of
SoS. As indicated by Ge, B. et al. (2013), “SoS is defined as a large-scale integrated
systems that are heterogeneous and independently operable on their own, but are
networked together for a common goal.” Many commonly used SoS terms such as
interoperable and synergistic are important factors that need to be considered when
integrating SoS (Madni A, Sievers M, 2014). The challenges of SoS integration is
constant in DoD acquisitions as technology continues to improve and new capabilities
emerge as better options for the warfighter. Understanding the feasibility of integration
early in the process can help temper the expectations needed throughout the development
and deployment of new systems.
1.3 Problem Focus
The focus of the research is to understand integration issues and challenges of
prior SoS systems, and extract data to improve IRL assessment and facilitate future SoS
integration. As challenges continue when integrating new capability into an existing
family of systems, the need for understanding the overall effort is necessary for upfront
planning. The components that make up SoS usually have different purposes, and the
different organizations associated with those purposes typically use different

7
terminologies and concepts. Thus, SoS integration must be able to address the
differences in semantic and syntactic between their organizations. Identifying these
issues ahead of time help highlight areas that need additional focus of IRL assessment.
Understanding systems integration itself is a very challenging task due to several
factors that impact the integration processes. Systems integration can be interpreted
differently, and although integration is a commonly used word, it is not clearly defined by
both industry and academia on its application (Djavanshir G, Khorramshahgol R, 2007).
As explained by Tien, J. (2008), “integration can occur through functional, physical,
organizational, and temporal dimensions, which can also include management and
processes of the actual system.” Elements involved in integration tend to be
multidimensional, which can be more complicated than evaluating technologies. Also,
most current systems integration efforts focus on products instead of the process, which
can lead to inadequate analyses when trying to understand the impacts of integrating
components (Magnaye R, Sauser B, Ramirez-Marquez J, 2010). Integration of SoS is
complicated, which goes beyond just “putting together” components.
The focus of the research is to develop a framework to help address SoS
integration issues using IRL principles. The subjectivity of TRL and IRL processes has
been widely criticized through several journals. They have been argued to oversimplify
facets of system readiness and maturity. The risk and effort required for higher readiness
levels does not factor into the current assessment of TRL and IRL (Kujawski E, 2013).
However, the process of getting an initial assessment of the system prior to system design
and development is beneficial in understanding overall integration feasibility. Defining

8
feasibility of integration early enough in the process can impact decisions that could
avoid integration pitfalls later in the process.
1.4 Initial Research Approach
The initial research approach was to understand what major integration issues that
were encountered on different major systems. Several experienced systems engineers in
the space industry were interviewed in order to get additional information on different
integration issues that greatly impacted the systems they worked on. This initial process
was the path to understanding what type of data would be used for this research.
Interviewing several systems engineers, however, would not suffice as good data
due to small sample size and insufficient and inconsistent information. Thus, the focus
quickly changed to collecting hard integration data that have been recorded through the
years. The next challenge was finding the right systems with available integration data.
There are a variety of systems that have available integration data, but the focus
was to get data for large SoS. The DoD has numerous major weapons systems that could
be used for this research. The primary focus was gathering the right data that are
available, accessible, and had the means to validate the data.
1.5 Impact to DoD Acquisitions
DoD acquisition processes continue to evolve and program managers are given
multiple systems engineering tools to shape their programs. Their goal is to acquire the
best weapon systems available with a limited budget while delivering on schedule. As
different DoD systems continue to be complex while keeping up with the latest
technology, integration of these systems to current existing systems become very critical.

9
Many DoD systems face multiple challenges in integration, and testing these systems are
very complex and expensive.
As DoD Acquisitions learned from prior systems, many programs have
implemented systems engineering divisions and directorate within their program to
ensure that the necessary rigor is identified and applied throughout the design,
development, integration, test, and deployment of each system. Although integration is
focused heavily after development, a lot of the integration issues later in the program
should be addressed early in the requirements and design phases.
The results of the research will help identifying integration feasibility once the
requirements are defined. Throughout the DoD Acquisition process, there are several
reviews and events that allow the program managers to make decisions on how to
proceed with their program from the information received. The process of identifying
how different subsystems integrate into the overall system could be a critical tool to
understand the likelihood of program success.
1.6 Organization of Dissertation
Chapter 2: Literature Review
Chapter 2 summarizes the available journals and supporting documents for the
research. Understanding available literature on the topics covered in this research helped
define the framework and the purpose of the research. Systems integration work has
been documented in multiple journal articles and published material. These supporting
literatures identified different areas of focus towards IRL, Technology Readiness
Assessment (TRA), systems integration, SoS, space systems, architectural framework,

10
integration attributes, and regression analysis and supporting analysis tools. Each area is
explained from the various publications and the information from those publications were
leveraged to help define the purpose and the process of the research.
Chapter 3: Research Management
Chapter 3 summarizes the evolution of the research process. It explains the
theory and the proposed research criteria. Based on the research criteria, it refines the
data collection of DoD space systems and explains the goals of the research. The chapter
also explains how a technical conference influenced the limitations of the research. The
chapter ends with a list of initial assumptions of the research and a list of challenges that
need to be addressed throughout the research.
Chapter 4: Methodology
Chapter 4 explains the research process and data exploration to understand the
systems being researched. It describes the data collection process and what attributes
were derived from the data. It covers all the integration data collected and how the data
are categorized as a result of this research process.
Chapter 5: Results
Chapter 5 summarizes the data analysis and how the data has impacted the
research. It covers the data validation through survey, which explained how the data
could be relevant findings to this research. Chapter 5 explains the survey development
and administration, and provides the survey results. It also includes the survey analysis,
the comparison of results (between data collection results and survey response results),
and provides the weights of attributes based on the data and survey analyses.
11
Chapter 6: Conclusion
Chapter 6 begins with the final criteria of the attributes based on the results of the
data and survey. The weights of the attributes are key elements in the development of the
Integration Assessment Framework. The chapter also provides information on the
application of the framework. The chapter and the dissertation close with the discussion
of the research and a summary of its limitations and future work.

12
CHAPTER 2: LITERATURE REVIEW
2.1 Integration Readiness Level
The use of IRL process has been documented through several literatures with
different strategies of application. The most common use is an interim tool to support
TRL and/or SRL processes. TRL metrics were initially developed from seven levels
(NASA) in the late 1990s, and then to the nine levels that were adopted by DoD in 2002
(Mankins J, 2009). Assessment of TRL became more necessary as technology assessment
moved into complex SoS, and DoD acquisition programs needed tools to help make
decisions in complex environment (McConkie E, 2013). IRL’s original intent was to
provide a systematic analysis of integrating different technologies and understanding the
maturity between the points of integration (Pittera T, Derrico M, 2011). IRL was focused
on being a tool to understand the maturity of technologies used to integrate the systems as
opposed to just being a tool to integrate two or more systems.
In the DoD Acquisition Process, Technology Readiness Level (TRL) are used for
evaluating technology maturity. TRL level are derived using different test and
verification processes, which are supplemented by Subject Matter Experts (SMEs)
directed by the Program Managers. One of the goals of this research is to use IRL
assessment as a separate evaluation tool from TRL and help facilitate integration of
systems instead of the integration of technologies as originally intended for IRL. Both
the IRL and TRL assessments could provide significant values to the programs
throughout the DoD Acquisition process and improve the chances of delivering
successful systems. The current IRL definitions are still useful to describe each IRL

13
level, but the use of current IRL assessment and how the levels are derived are the
changes proposed by this research.
2.2 Technology Readiness Assessment (TRA)
The DoD Acquisition Process provides detailed guidance to the Program
Managers on planning for the lifecycle of their respective programs. According to the
DoD Instructions 5000.02 (2015), the DoD Acquisition Process is an extensive
framework that covers all the events before and after Milestones A, B, and C. As noted
in Figure 2-1, a Materiel Solution Analysis and Materiel Development Decisions are two
of the major activities and events that take place prior to Milestone A. The Technology
Maturation & Risk Reduction Phase (Pre-Milestone B) is where the initial Technology
Readiness Assessment (TRA) is conducted.
Figure 2-1. DoD Acquisition Process (DoDI 5000.02, 2015)
DoD Acquisitions use the TRA process to determine the TRL level for each
critical technology that is integrated into the system that is being developed. According
to the DoD TRA Guidance (2011), “TRA is a systematic, metrics-based process that
assesses the maturity of, and risk associated with, critical technologies to be used by a
program.” TRA measures critical technologies and assess the TRL level of those

14
technologies before they can be applied into the system design. Program Managers are
responsible to assign TRA to its SMEs and conduct a TRA. The DoD TRA Guidance
provides some top-level guidance on how to conduct TRAs, which are focused primarily
on the technology.
TRA evaluates the system’s critical technologies (potential risk areas defined by
SMEs) during system development. Critical technologies are assessed using TRL Levels
1-9 (defined in Table 1-1). According to the DoD TRA Guidance (2011), “to reduce the
risk associated with entering the Engineering and Manufacturing Development (EMD)
phase, technology (ies) must be demonstrated adequately to attain TRL 6 or above.” The
TRL 6 definition is to demonstrate technology in a relevant environment, and it is a
benchmark to enter EMD (Post Milestone B). Before the system becomes operational,
the goal is for the system development to be completed and qualified through test and
demonstration, which is the definition of TRL 8. TRL 8 can be accomplished through the
Production and Deployment Phase (Post Milestone C) before it goes to Operations and
Support.
IRL should follow the same TRL benchmark levels when going through the DoD
Acquisition process, and it can focus on the major integration areas of the SoS as opposed
to TRL’s focus of critical technologies. IRL determination should also be conducted
during the TRA timeframe where IRL 6 or greater is needed for the system to enter into
the EMD Phase. In addition, the DoD Acquisition Process provides many other
opportunities to conduct integration readiness assessment for the system after the initial
assessment is conducted. Like TRL, the goal would be to ensure IRL 8 is attained prior
to system operations.

15
2.3 Systems Integration
Systems Integration can be interpreted differently at many levels, but according to
INCOSE Systems Engineering Handbook (2015), “The ultimate goal of systems
integration is to ensure that the individual system elements function properly as a whole
and satisfy the design properties or characteristics of the system.” The INCOSE Systems
Engineering Handbook (2011) describes systems integration as a process with the context
diagram in Figure 2-2.
Figure 2-2. Context Diagram for the Integration Process (INCOSE Systems Engineering Handbook
Ver 3.2.2, 2011)
Figure 2-2 describes the Integration Activities that are impacted by the Inputs,
Enablers, and Controls to produce desirable Outputs. This process provides some context
on what can be considered when executing systems integration. Integration assessment
using IRL, which accounts for additional variables, can help facilitate this process. The
research will focus on the integration feasibility to implement this type of process.

16
When the goal is to incorporate the use of IRL into systems integration processes,
systems integration strategies and challenges must be identified. Systems integration is a
strategy advocated in order to achieve sustainable development—it is very diverse and
can be interpreted in many different ways (Vernay A, Boons F, 2015). System integration
strategies have been explained in several journals, which provided different perspectives
and help narrow the focus of this research from supporting technical/system maturity to
readiness of integration.
According to Gagliardi, M. et al. (2009), “severe integration problems can arise
due to inconsistencies, ambiguities, and gaps in how quality attributes are addressed in
the underlying systems.” One of the main reasons for this is not identifying the right
quality attribute that supports the integration activities early in the process. This is where
a set of quality attributes derived from the DoD space system integration issues can be
identified to help with systems integration.
2.4 System of Systems
Application of systems integration processes can be enhanced when additional
systems, processes, and organizations are involved in order to integrate SoS. SoS can be
defined as a collection of interoperating components and systems producing results that
are not achievable by each of the individual systems. Adding capabilities to an already
complex system epitomizes the definition of SoS (Zhang Y et al., 2012). In order to fully
realize the analysis of SoS, engineering and systems architecture must be used to address
allocation of functionality to component interaction as opposed to just dealing with
individual components (Ender T et al., 2010).

17
2.5 Space Systems
To understand the properties of SoS, DoD space systems can be used as examples
of complex SoS. DoD satellites are complex SoS that cannot be accessed for upgrade or
changes after they have been placed on orbit. DoD space systems have to satisfy
integration requirements that may include affordability, reliability, security, resilience,
and adaptability (Madni A, Sievers M, 2014). Conducting technical demonstration also
requires significant funding and resources for these types of complex SoS (Dubos G,
Saleh J, 2010). Thus, it is imperative that integrating them right the first time becomes a
high priority.
2.6 Architectural Framework
To understand the comprehensive processes involved in the integration of
complex SoS, one must understand how complex SoS are managed. Several architectural
frameworks have been proposed in literature to design, develop, and manage these types
of systems (Suh E, Chiriac N, Hotta-Otto K, 2015). Many of these larger systems
involved multiple organizations as stakeholders, and according to Rebelo, L. et al.
(2012), “large scale organizations, which have significant operations management needs,
seek out and execute complex projects that involve a very large number of resource and
schedule requirements.” In addition to the wide range of factors involved in complex
SoS, recent SoS development requires intensive information technology software, which
also triggers the use of architectural framework (Piaszcyk C, 2011).
Architectural frameworks are developed to illustrate operations and functions to
help clearly define roles of entities within complex SoS. Understanding and
18
implementing the right architecture and component design will help perform faster
integration processes and help reduce complexity (Jain R et al., 2008). The resulting data
from this research will provide the components needed to develop an architectural
framework. This framework will help explain how major attributes will contribute to the
assessment of enhanced IRL and will help illustrate the different factors needed for
consideration during evaluation of IRL at certain specific timelines.
2.7 Integration Attributes
Major attributes to support the integration assessment framework will be finalized
based on the results of the data collection. As explained by Jain, R. et al. (2013),
“attribute is a property or characteristics of an entity that can be distinguished
quantitatively or qualitatively by human or automated means; the attributes of a system or
architecture are used to describe the properties of the system or system architecture in a
unique distinguishing manner.” Attributes are usually basic elements related to
requirements, which can be interpreted that a requirement consists of multiple attributes
(Lung C, Xu X, Zaman M, 2007).
For attributes to be an effective tool for integration, they need to be integrated into
the framework and optimized to balance complexity and simplicity. Organizations can
adopt these attributes when integrating capabilities into the family of systems. Complex
systems can have unpredictable behaviors and using multiple attributes can help measure
the performance of these behaviors by quantitatively and qualitatively weighing the
individual attributes (Gifun J, Karydasb D, 2005).
19
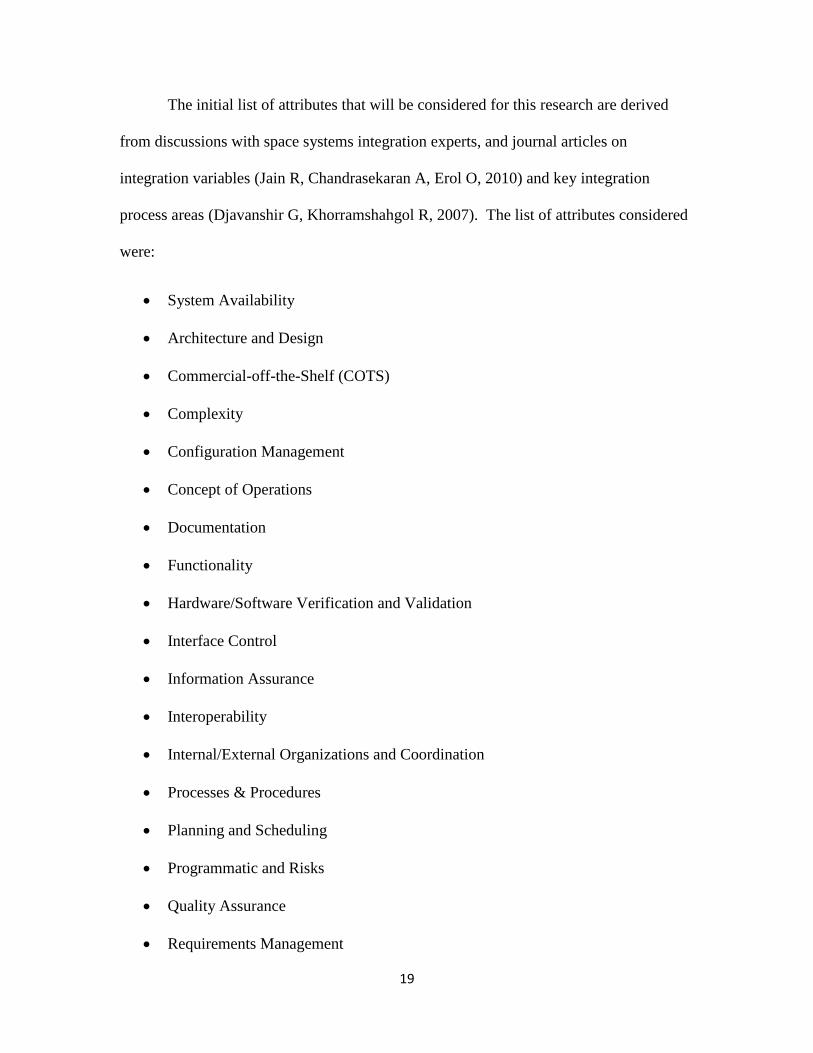
The initial list of attributes that will be considered for this research are derived
from discussions with space systems integration experts, and journal articles on
integration variables (Jain R, Chandrasekaran A, Erol O, 2010) and key integration
process areas (Djavanshir G, Khorramshahgol R, 2007). The list of attributes considered
were:
System Availability
Architecture and Design
Commercial-off-the-Shelf (COTS)
Complexity
Configuration Management
Concept of Operations
Documentation
Functionality
Hardware/Software Verification and Validation
Interface Control
Information Assurance
Interoperability
Internal/External Organizations and Coordination
Processes & Procedures
Planning and Scheduling
Programmatic and Risks
Quality Assurance
Requirements Management

20
Resources (Funding)
Risk Analysis and Management
Semantic consistency
Standards, Schedule Control
Strategic Planning
Technology Insertion
Testing
Training
These potential attributes will be used to help define each integration issue data
that is aligned to specific integration variable. Some of these attributes may overlap or
become part of another attribute. Collecting DoD Space Systems data will help identify
and provide the criteria for the major attributes associated with each data.
2.8 Regression Analysis and Supporting Analysis Tools
The data collected for this research can be manipulated to examine the
relationship with the research goals. One way to determine the trend of the integration
issues data collection is through regression analysis. According Lattin, J., Carroll, J.,
Green, P. (2002), “Regression analysis is the most widely used for analysis of
dependence, for which to examine relationship between a set of independent variables
(x’s) and single dependent variable (y).” Regression analysis can be used to examine data
relationships and model the relationships that would help with prediction. It is used for
predicting trends given a set of data and test hypothesis. Regression tries to produce the
“best fit” equation to explain a group of data using linear equation. The equation of a
straight line is:

21
y = a + bx
where a is the intercept and b is the slope. The line that gives the best fit to the data is
called least squares line or sample regression line.
If the scatter plot of a sample data suggests a linear relationship between the two
variables, drawing a straight line on the plot can summarize a relationship. Linear
regression calculates an equation that minimizes the distance between the fitted line and
all of the data points. Least squared method gives the best-estimated line for the set of
sample data. Regression estimates are more reliable if it has a large dataset, sample
variance of the independent variables is high, small variance error, and the less closely
related are the independent variables (Greene W, 2010).
Normal Distribution
When collecting data, it is important to understand the relationship between
independent variables and the dependent variable. To understand how they are
distributed throughout the sample size, Normal Distribution is used. Normal Distribution
is a probability distribution that plots all of its values in a symmetrical fashion and most
of the results are situated around the probability’s mean (Lane D et. al., 2007). Normal
distributions are defined by two parameters, the mean (μ) and the standard deviation (σ)
(Lane D et. al., 2007). Understanding these properties will help determine how the data
will be used in the research.
Null Hypothesis Test
The P-value is used for hypothesis tests, where the null hypothesis is either
rejected or fail to be rejected (Abell M, Braselton J, Rafter J, 1998). When doing a

22
hypothesis test for a set of data, P-value can help measure the evidence against the null
hypothesis, and it has a calculated value from 0 to 1. A P-value less than 0.05 often
explain evidence that the null hypothesis is rejected (Minitab Support, 2016). To
calculate the P-value, it is established that sample mean has a normal distribution, where
the test statistic = (sample mean – hypothesized mean) / (sample standard deviation /
square root of sample size). The test statistic is the value under the normal distribution
curve. The P-value is the sum of the values outside of the test statistic under the normal
distribution curve. When the P-value is less than 0.05 (this is derived with 0.95 test
statistic), the null hypothesis is rejected.
Predictors in Regression Analysis
R-squared is a statistical measure of how close the data are to the fitted regression
line. It is defined as the percentage of the response variable variance that is explained by
a linear model (Lattin J, Carroll J, Green P, 2002).
R-squared = 1 – ((sum of squares about regression line) /
(sum of squares about mean of Y))
According to Lattin J., Carroll, J., Green, P. (2002), “R-squared with a value of 75% or
higher is a good fit.”
Adjusted R-squared is a modified version of R-squared that has been adjusted for
the number of predictors in the model more than would be expected by chance. It
imposes a penalty for adding additional explanatory variables if the fit is poor.
Adjusted R-squared = 1 – {(sum of squares about regression line) /

23
{[(samples size – number of predictors) – 1)] x
(sum of squares about mean of Y)}
In multiple regression, when a new variable is added it affects the coefficients of
the existing variables. The coefficients of the multiple regression model are estimated
using sample data with a defined number of independent variables. Adjusted R-squared
can help with goodness-of-fit measurement using additional variables.
Other data analysis tools provide a different value of statistical predictor. The
Minitab Analysis Software Tool provides the standard error of the regression (S) value,
which like the R-squared, provides a measure of how well the model fits the data. The
overall value of S is the average distance from the regression line. The smaller the value
of S, the better it would be because it is closer to the fitted regression line (Lattin J,
Carroll J, Green P, 2002).

24
CHAPTER 3: RESEARCH MANAGEMENT
3.1 Theory
IRL can be an effective systems integration assessment tool and given the right
multidimensional framework, it can facilitate the integration of SoS. Utilizing other
integration variables and expanding the current notional definitions of IRL can
significantly impact the assessment of SoS integration. IRL was also proposed as an
intermediate step by making it part of a matrix function with TRL in order to determine
the SRL (McConkie E et al., 2013). When IRL is used as a function of SRL, IRL could be
overlooked from being a significant independent assessment value, and the IRL level may
be influenced by what is needed as the SRL value. Current IRL definitions can be useful
as an input to the framework as opposed to just being an intermediate assessment to
understand technology or system maturity.
There are others who determine integration readiness can be assessed as part of
DoD Acquisition’s TRA process, but this process does not capture the purpose of
integration. TRL was never intended to measure integration maturity (Magnaye R, Sauser
B, Ramirez-Marquez J, 2010). A system with mature technology does not automatically
equate to having a high IRL when interfacing with another system with mature
technology. However, with time and more opportunities to resolve integration issues, the
assumption is that the IRL value becomes higher.
3.2 Research Criteria
In determining the research criteria, the focus was to find relevant integration data
for major systems across DoD Acquisitions. Integration of SoS becomes very
25
challenging as the system becomes larger and more expensive with multiple parts to
consider. There is significant value in understanding macro level SoS and be able to
understand their integration properties into other SoS. Thus, the focus of the research and
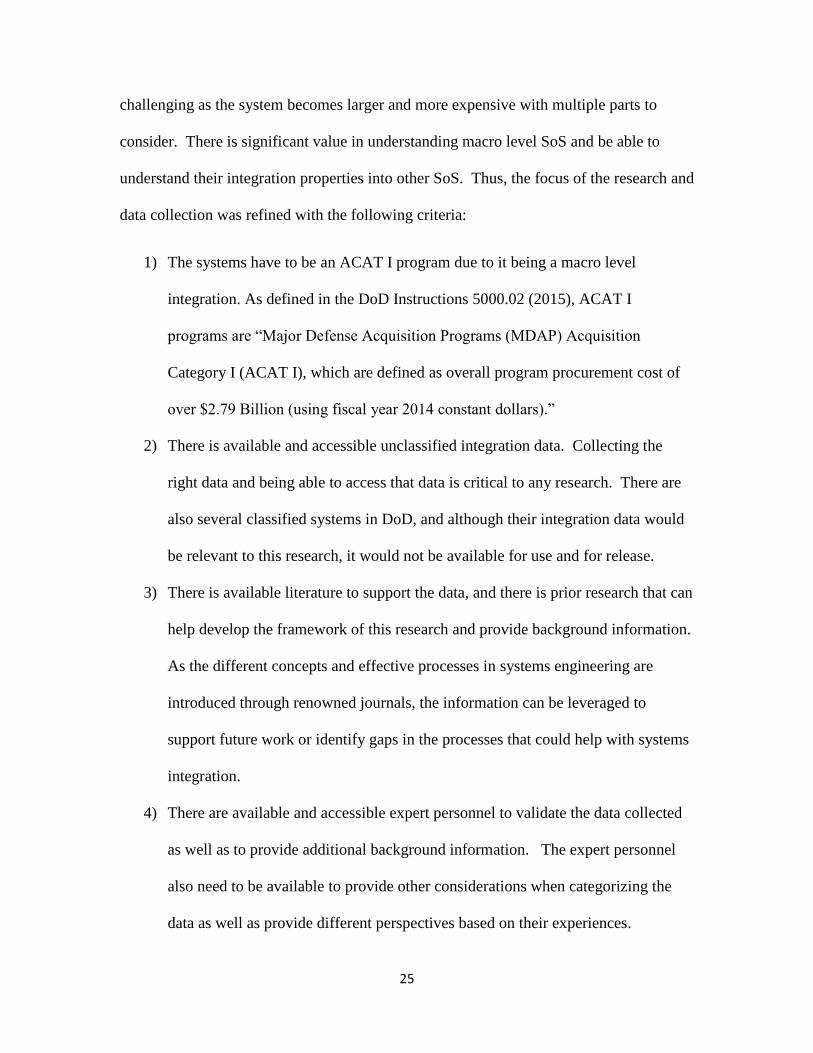
data collection was refined with the following criteria:
1) The systems have to be an ACAT I program due to it being a macro level
integration. As defined in the DoD Instructions 5000.02 (2015), ACAT I
programs are “Major Defense Acquisition Programs (MDAP) Acquisition
Category I (ACAT I), which are defined as overall program procurement cost of
over $2.79 Billion (using fiscal year 2014 constant dollars).”
2) There is available and accessible unclassified integration data. Collecting the
right data and being able to access that data is critical to any research. There are
also several classified systems in DoD, and although their integration data would
be relevant to this research, it would not be available for use and for release.
3) There is available literature to support the data, and there is prior research that can
help develop the framework of this research and provide background information.
As the different concepts and effective processes in systems engineering are
introduced through renowned journals, the information can be leveraged to
support future work or identify gaps in the processes that could help with systems
integration.
4) There are available and accessible expert personnel to validate the data collected
as well as to provide additional background information. The expert personnel
also need to be available to provide other considerations when categorizing the
data as well as provide different perspectives based on their experiences.

26
3.3 DoD Space Systems Data
With the defined criteria, the focus of the research was refined to DoD Space
Systems since they continue to provide examples of complex System of Systems. With
very limited opportunities to do operational tests and analyses for satellite systems and
rocket launches, space systems provide a platform to incorporate the latest technologies
and processes to attain successful operational systems. As part of space system
complexity, space systems also factors in the need for expediting the insertion of “cutting-
edge” technology while adapting to new evolution of new technology and reducing
qualification timelines (Pittera T, Derrico M, 2011). IRL can be used to assess the
integration of these type of complex SoS given a rigorous process that account for other
variables.
The DoD space systems that will be used for data collection have been or planned
to be integrated into the space mission area family of systems as illustrated in Figure 3-1:
Figure 3-1. Space Capability Integration Into Family of Systems (Notional View)

27
The integration data will be collected from six major DoD space systems that are
considered ACAT I programs. The major space systems are: 1) Advanced Extremely
High Frequency (AEHF) satellite communications (SATCOM); 2) Evolved Expendable
Launch Vehicle (EELV); 3) Global Positioning Satellite (GPS); 4) National Polar-
Orbiting Operational Environment Satellite System (NPOESS); 5) Space Based Infrared
Systems (SBIRS); and 6) Wideband Global SATCOM (WGS).
3.4 Research Goals
The goal is to develop a systems integration assessment framework tool based on
the attributes identified through data analysis. It is imperative that assessment of complex
systems must address common interfaces, interoperability, reliability, and operations
(Bhasin K, Hayden J, 2008). Methods and processes in system engineering are used for
defining requirements and provide the framework to identify a generalized architecture
(Bhasin K, Hayden J, 2008). One of the major goals is to understand how integration
issues can be addressed early in the acquisition process or planning stages in order to
reduce the number of integration challenges and complexities later in the systems
engineering process (Jain R, Chandrasekaran A, Erol O, 2010).
Cost for systems integration can increase substantially, and implementing
processes to understand enterprise-wide systems integration requirements must be
considered before deciding on a solution and architecture (Bolloju N, 2009). Based on
Kruchten, P., Capilla, R., and Duenas, J. (2009), architectural elements are the primary
constituents of describing “components and connectors while nonfunctional properties
shape the final architecture.”

28
To support the goal of this research, data will be collected on six DoD major
space systems integration issues in past 16 years, the data will be aligned with items that
impact integration (as integration variables), the items will be grouped into major
attributes, and the attributes will be analyzed to understand how they could be used to
influence the SoS IRL score. Each derived attribute will provide a dimension into an
integration assessment framework that will determine the enhanced IRL score for SoS
integration. The framework will evaluate the overall integration feasibility, which will be
able to help identify risks and mitigation strategies. To validate the data collected, an
expert survey will be conducted. The results of the survey will help influence how the
attributes are defined and weighted as they become components of the integration
assessment framework.
The DoD Space Systems goal of integrating desired capabilities into family of
DoD space/satellite systems is illustrated notionally in Figure 3-2 with the major
integration points. The desired capability of DoD space system is usually integrated into
a sensor, which becomes the payload of a satellite. The payload is integrated into a
satellite bus and both systems become the satellite system. The satellite system is
integrated into ground systems for communications and data exchange. The ground
systems are the satellite operations centers, ground antennas, tracking stations, and the
locations that process the mission data coming from the satellite system.

29
Figure 3-2. Notional DoD Space Systems Architecture and Major Integration Points
Due to its uniqueness, the integration of desired capabilities into the payload is
usually the most challenging efforts in development and integration of space systems.
After the payload has been developed and integrated into the satellite bus, they are
rigorously tested on the ground. The satellite bus (or spacecraft bus) is the infrastructure
of a spacecraft, usually providing locations for the payload, power source, and other
instruments. From there, the satellite system is integrated into a launch vehicle (its ride
to get on orbit). The satellite system is also integrated into the family of systems to ensure
interoperability with existing systems and produce the final product/data to its users. The
launch vehicle is integrated into the Ground Systems and the satellite system. The
Ground Systems enable communication with all systems throughout launch, deployment,
and operations of satellite system. The desired end state or successful SoS integration
includes successful launch and deployment of satellite system on orbit that meet (or
exceed) performance of all systems involved.
30
3.5 Limitations of Research
Excluding Integration Requirements
This research provides a tool to facilitate the integration of SoS; however, it does
not focus on the development of systems integration requirements. Integration
Requirements are critical but this research assumes that the stakeholders have agreed to
the requirements before planning the scope that allows integration activities to be
executed. Requirements need to be clearly defined to the lowest level and the assumption
is to have clear requirements before conducting integration assessment(s). The proposed
IRL assessment process will be iterative based on the changes in scope (if any) by the
stakeholders. Understanding enterprise-wide integration requirements is necessary before
developing a specific architectural framework to help with the integration process
(Bolloju N, 2009). Understanding integration requirements processes can help with
traceability of derived requirements during the integration planning and implementation
stages.
Feedback from DEPEND Conference
When the research process began to mature and the target data for collection
became more defined, an extended abstract of the research was developed. The reason
for this was to get additional feedback through a technical conference on the focus of the
research. The extended abstract helped refine the research and the path to complete it.
Part of the focus of the research was to improve process dependability of systems
integration. The result of the research was to provide a dependable systems engineering
tool that decision makers can use to facilitate systems integration. Therefore, an

31
extended abstract was submitted for presentation to the International Academy, Research,
and Industry Association (IARIA) Eighth International Conference on Dependability in
March 2015 (DEPEND 2015).
The DEPEND 2015 conference focused on dependability of processes including
integration and specific systems. The extended abstract was reviewed by IARIA panel
reviewers to be considered as part of the Doctoral Forum of the conference, which
provided the opportunity to discuss and receive feedback on the thesis research from
peers and senior practitioners in the field. Feedback from the panel were provided and
adjudicated for extended abstract update. The updated extended abstract was approved
and published by IARIA (Eder C, 2015), which was presented at the DEPEND 2015
conference on August 2015 in Venice, Italy.
The extended abstract review process and feedback from the conference
presentation panel helped to clarify the focus of the research and understand the
limitations and assumptions of the research. Based on the feedback and additional
research, the initial list of attributes identified in Paragraph 2.6 has been truncated. As
mentioned in the Beyond IRL Extended Abstract (Eder C, 2015), “Initial integration
variables that are being considered include: 1) Schedule (need date, allowed timeline to
integrate); 2) Resources (Funding, Personnel, Available tools); 3) Processes
(Documented approach, Binding Agreements, Testing); 4) Policies (Directives,
Guidance); 5) Communication (Documentation, Semantics, Expectations); and 6) Risks
(Cost, Schedule, Technical).” Initial research into the space systems data provided this
list of integration variables, which was later refined into integration attributes.
32
Two research limitations were identified based on the review panel and presentation
feedback:
1) Provide a detailed description of each attribute and distinguish between them.
The research process needs to define how each attribute is different from each
other by different users and applications. This feedback was accepted and applied
during the data collection process and during the development of the survey
questions to validate the data.
2) Distinguish between complex SoS Integration (integration of macro or major
systems that accounts for many factors) and small systems integration approaches
that focus mostly on interoperability issues. The conference feedback highlighted
the difference of these two views and how different they should be handled during
the research process. Another topic was presented at the conference that focused
on smaller integration process, which involved just the interoperability of two
systems and the resources to make that happen. Understanding that process
helped differentiate the focus of this research, which involves a much larger and
more complex integration.
3.6 Assumptions:
The initial assumptions to the research, which is also closely related to the
research criteria identified in Section 3.2, include the following:
1) The data collected would be clearly define the integration attributes
2) There is integration data available every year during the timeframe identified
3) There are available software tools to help analyze the data

33
4) Experts are available to validate data and provide survey results to enhance the
definitions and the use of the data
3.7 Challenges
As the research process continued to be defined, there were some anticipated
challenges that were documented. The goal was to address these challenges throughout
the research process and determine ways to make them advantageous for the research:
1) Determining the scope of research (types of data to collect, limitations of data,
availability of data, and releasability of data)
2) Understanding the relationships of the attributes and how they are different from
one another
3) Applying different mathematical tools and supporting software tools to help
analyze the data and understand how the results are applied into the integration
assessment framework
4) Identifying the right SMEs to validate the integration data
5) Convincing the right SMEs to participate in the survey process to validate the data
34
CHAPTER 4: METHODOLOGY
4.1 Research Process
In support of the research goals of improving SoS integration assessment, the
research process needed to be defined. The research process is as follows:
1. Collect high level integration issues data from six DoD major space systems from
1999–2014
2. Identify the integration variable that is impacted by each integration issue
3. Group the integration variables based on common focus areas
4. The integration variables will define the parameters for the final set of attributes
5. Analyze how each attribute is distributed throughout all six major space systems in
the 16 years of data sets
6. Complete regression analysis of the attributes and determine weights of each attribute
(The Minitab software tool will be used to assist with data analyses)
7. Validate attributes and the type of integration variable associated with each attribute
by completing a survey of systems engineering, integration, and acquisitions experts
in DoD
8. Analyze survey results using regression and correlations (The Minitab Version
software tool will be used to assist with survey results analyses)
9. Compare both data analysis and survey analysis; identify final criteria for each
attribute and determine the weight of each attribute
10. Based on the analyses, develop a systems integration framework tool using the
weighted attributes

35
Once the integration assessment framework is developed, it can be used to help
facilitate SoS integration. The output of the framework is the IRL score for the entire
SoS, and as each major attribute matures, the IRL score improves. The framework can be
used throughout the design, development, and deployment of the SoS. The stakeholders
or designated Subject Matter Experts (SMEs) will have to provide upfront analysis, and
agree on what the initial IRL level for each of the major attribute.
4.2 Data Exploration
In looking for a large sample size, the research for integration data led to the
understanding of the major impacts to each DoD space system. Most of the DoD space
systems were just ending the Research phase of the system in 1999. The pre-acquisition
planning to procure the systems have either started or have matured in 1999, and
integration issues surfaced during that timeframe. Each of the major systems were all
budgeted for by the DoD in planning for their procurement reflecting on early cost
estimates.
Throughout the years from 1999, multiple major decisions were made, which
considered many factors that included financial disconnects (cost growth, budget
support), schedule slippage, requirement changes, and technology risks. As evident
through the reports highlighted in the Department of Operational Test & Evaluation
(DOT&E) and other supporting documents (Aerospace annual reports, GAO, and
program documents), significant integration issues were identified throughout the years.
The 2014 reports were published in 2015, and therefore, 2014 was the last year these
integration issues were considered for this research. The data collection for this research

36
started in 2015, which focused on six major DoD space systems: 1) AEHF; 2) EELV; 3)
GPS; 4) NPOESS; 5) SBIRS; and 6) WGS.
4.3 Data Collection
For 16 years from 1999–2014, major integration data from DOT&E reports with
additional GAO supporting documents were collected (DOT&E Annual Reports, 1999–
2014), which explained major integration issues encountered by the six major space
programs for each year. The DOT&E annual reports are formal U.S. government
documents that are consistently written to capture all the major issues throughout the
DoD programs. The reports have specific guidelines for approval before it can be signed
by the Director of Operational Test and Evaluation, and published in the DOT&E website
for the United States Congress to review as needed. The reports, which satisfy the
provisions of Title 10, United States Code, Section 139, summarize the operational test
and evaluation activities of the DoD. Each annual report captures the previous fiscal year
activities.
The issues identified in the reports are explained, but additional background
information was gathered from the U.S. Air Force Space & Missiles Systems Center
(SMC) program offices. Additional interviews of SMC personnel to gather background
information were also conducted for better understanding of some of the issues. These
space acquisitions programs have encountered challenges that directly impacted
integration activities throughout the 16 years. Each major issue identified per year was
counted as one issue (i.e. if one issue persisted through 4 years, it will be counted as 4
issues). Below is the description and data collection summary of each of the DoD space
system:

37
1) AEHF: AEHF is a communication satellite SoS that provides secure and survivable
communication capability to U.S. military during any level of conflict. According to
DOT&E Annual Reports (1999–2014), it serves “as the protected backbone of the DoD
military communication architecture.” The AEHF capability ensures continuous secure
communication during all levels of conflict for warfighters.
There were 79 major integration issues identified for AEHF during the 16-year
span. Some of AEHF major integration issues included: testing processes for digital
processors, and integrating nuclear hardening and shielding, electric propulsion, phased
array antenna, and nuller spot beam.
2) EELV: EELV is a SoS launch vehicles and services provided to DoD and commercial
customers. It was developed to provide launch capability that reduces the cost of
alternative launch options while meeting mission assurance requirements.
There were 24 major integration issues identified for EELV during the 16-year
span. Some of the major issues were data availability to the stakeholders for test
verification processes, documentation of flight analysis plan, and integration of several
design processes.
3) GPS: GPS is a major SoS that provides data dependent by DoD and civilian users. It
has 24-satellite constellation that provides real-time and highly accurate positioning and
location data. It can function through all weather and provides passive data to worldwide
users. DoD is dependent on this data to precisely determine their velocity, time, and
position.

38
There were 71 major integration issues identified for GPS during the 16-year
span. Some of the major issues were communication between cross-link systems,
development and integration of GPS Military-Code and civil signal capabilities,
integration of receivers into major platforms (i.e. ships and aircraft), and refinement of
end-to-end test strategy.
4) NPOESS: NPOESS was an enhanced weather SoS program that were administered by
three different government organizations: DoD’s Air Force; Department of Commerce’s
(DoC) National Aeronautics and Space Administration (NASA); and DoC’s National
Oceanic and Atmospheric Administration (NOAA). NPOESS provided the platform to
acquire satellite SoS to collect and disseminate environmental data for the three
organizations. Although development planning and integration started in 1999, the
program was eventually cancelled in 2011. There are many valuable integration lessons
learned derived throughout the years.
There were 18 major integration issues identified for NPOESS during its
existence. Some of the major issues included field terminal integration and
interoperability, integration of quality environmental data record, and integration
challenges of program sensor design and algorithm development.
5) SBIRS: SBIRS are remote sensing satellite SoS that supports DoD by providing
unprecedented timely and improved infrared data quality. SBIRS top missions of
improving missile warning and missile defense have been realized through complex
development and integration processes. It has also greatly enhanced the other mission
areas of technical intelligence and battlespace characterization.

39
There were 46 major integration issues identified for SBIRS during the 16-year
span. Some of the major integration issues included defining multiple test strategies,
development of Model & Simulation systems to support operations of integration and
testing, ground software development and integration, flight software integration into
satellite.
6) WGS: WGS SoS enables communication to U.S. military and Coalition partners and
allies during war and all levels of conflicts. Its wideband capability provides greater
bandwidth to transfer data during conflicts.
There were 33 major integration issues identified for WGS during the 16-year
span. Some of the major issues included integration complexity of X-band and Ka-band
cross-banding on the on-board satellite, integration technical issues on orbital placement,
frequency reuse, and launch services integration, interoperability complexity of control
software development.
4.4 Attributes Derived from Data Collection
To understand the impact of each major integration issue, each issue was aligned
with an integration variable to best describe the major area impacted by the issue. The
integration variables were then grouped together based on similar focus areas and aligned
with contributing attribute. Interviews with integration experts and additional research
were conducted to define the right number of attributes from the initial list. The
definition of each potential attribute continued to be refined based on the different groups
of integration variables supporting them. After identifying the integration issues and
integration variables, the list of contributing attributes was finalized. Each integration

40
variable was assigned to a major attribute, which also helped define the criteria for that
attribute. The result was seven final attributes, which are defined below:
Availability:
Availability is the attribute that was designated to understand the accessibility of
supporting hardware, software, documentation, and expertise in order to enable
integration activities. Integrating into legacy systems may not have proper support
documentation and expert personnel may not be readily available, and this attribute will
help to identify those supporting entities. The items derived from the integration issues
that support this attribute are access to high TRL supporting systems, subsystems, and
components, and access to supporting documentation and expertise.
The availability of the right supporting systems is critical to the success of the
overall system delivery. To help address Availability, the reuse of existing infrastructure
and the use of Commercial-Off-the-Shelf (COTS) items are identified before integration
activities. To meet time commitments, the reuse of systems, subsystems, and components
from the current infrastructure are highly encouraged with the possibility of replacing
them with COTS items on future updates (Tyree J, Akerman A, 2005).
Complexity:
Complexity is the attribute that manages the technical risks of integration. The
items derived from the integration issues that support this attribute are managing low
technical maturity of system design, development, and integration, and determining
complex interfaces. According to Jain, R. et al. (2008), “complexity can be defined as
the degree to which a system or component has a design or implementation that is

41
difficult to understand and verify.” The complexity of systems integration has significant
influence on driving schedule delays (Dubos G, Sale J, Braun R, 2008). Complexity
affects the degree of complication of several factors such the number of interfaces and
intricacies of different components (Jain R et al., 2008). Although it has been widely
studied, there is no defined mathematical model for systems related to complexity
(Haghnevis M, Askin R, 2012).
Interoperability:
Interoperability is the attribute that will address compatibility, connectivity, and
communication between systems, subsystems, and components. The items derived from
the integration issues that support this attribute are understanding compatibility and
interface issues, addressing semantic/syntactic issues, and managing communication
issues between systems. Interoperability assessments can be very challenging in SoS
because of the different testing involved to verify their functionality (Lin C et al., 2009).
According to Madni A, Sievers M (2014), “interoperability is the ability of
distinct systems to share semantically compatible information and then process and
manage the information in semantically compatible ways, enabling users to perform
desired tasks.” Interoperability can be improved, which means that the metrics to measure
it can be defined. However, interoperability is still a complex and broad topic, and its
condition may not be easily quantified (Rezaei R, Chiew T, Lee S, 2013).
Management:
Management is the attribute that plans, develops, and directs integration strategies. The
items derived from the integration issues that support this attribute include leading

42
coordination between stakeholders, providing guidance and directives, determining
scope, managing requirements, and developing and implementing policies and
agreements. Management ensures that the stakeholders’ derived integration requirements
are met throughout the integration process. Managing stakeholders’ decisions is critical in
shaping the final design of the system (Booch G, 2006). Management must be able to
navigate through the challenges of diminishing budgets, changing politics, and evolving
technologies to support integration activities.
The management methods for integration address issues of philosophy, operation,
and collaboration (Tien J, 2008). Management addresses requirements traceability. As
indicated by Piaszcyk, C. (2011), “traceability is used to evaluate the impact of top-level
requirements changes” that can help eliminate requirements creep.
Processes:
Processes is the attribute that enables the development, documentation, and
execution of all integration activities. The items derived from the integration issues that
support this attribute are processes that develop, document and execute the following:
testing, verification and validation, configuration management, training, model and
simulation activities, information assurance, mission assurance, model and simulation,
communication and decision making, security, safety, quality assurance, and
manufacturing and assembly. Processes implemented during integration must be clearly
defined and documented. Many organizations’ efforts in key process areas for
integration did not have much success due to ill-defined processes (Djavanshir G,
Khorramshahgol R, 2007). Processes for integration include standards, procedures, and
algorithms associated with integration activities (Tien J, 2008).
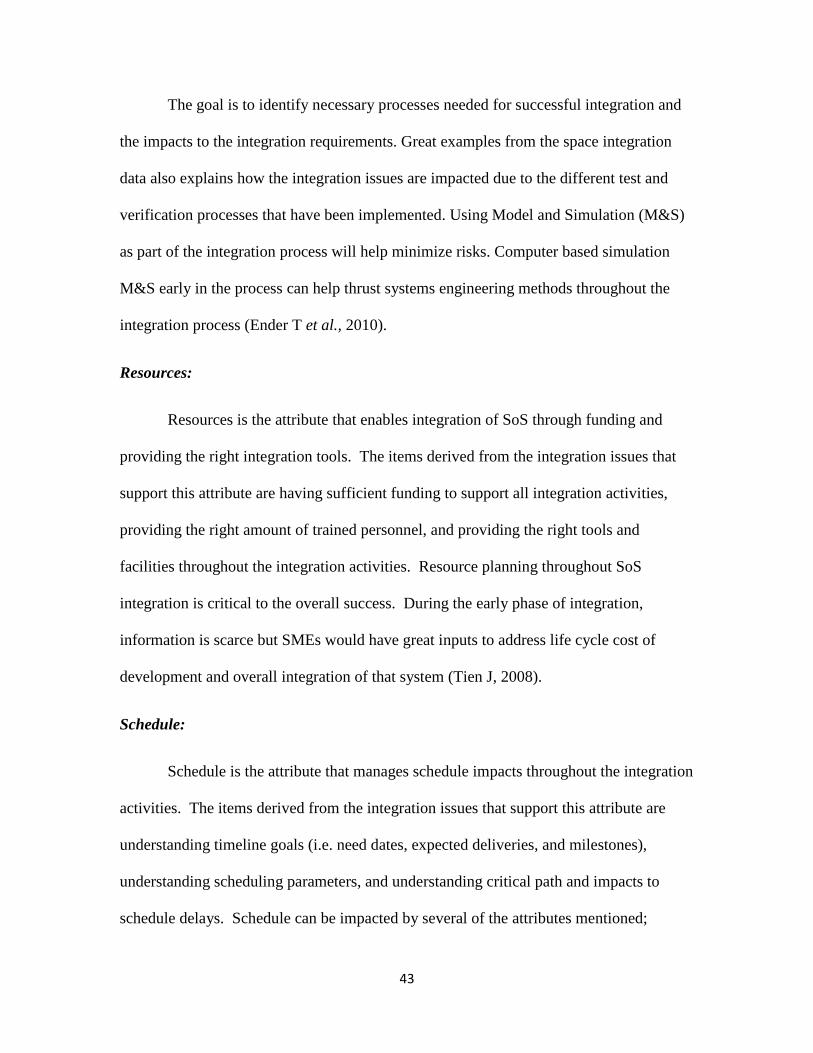
43
The goal is to identify necessary processes needed for successful integration and
the impacts to the integration requirements. Great examples from the space integration
data also explains how the integration issues are impacted due to the different test and
verification processes that have been implemented. Using Model and Simulation (M&S)
as part of the integration process will help minimize risks. Computer based simulation
M&S early in the process can help thrust systems engineering methods throughout the
integration process (Ender T et al., 2010).
Resources:
Resources is the attribute that enables integration of SoS through funding and
providing the right integration tools. The items derived from the integration issues that
support this attribute are having sufficient funding to support all integration activities,
providing the right amount of trained personnel, and providing the right tools and
facilities throughout the integration activities. Resource planning throughout SoS
integration is critical to the overall success. During the early phase of integration,
information is scarce but SMEs would have great inputs to address life cycle cost of
development and overall integration of that system (Tien J, 2008).
Schedule:
Schedule is the attribute that manages schedule impacts throughout the integration
activities. The items derived from the integration issues that support this attribute are
understanding timeline goals (i.e. need dates, expected deliveries, and milestones),
understanding scheduling parameters, and understanding critical path and impacts to
schedule delays. Schedule can be impacted by several of the attributes mentioned;

44
however, an independent assessment is needed in order to understand how different
changes impact scheduled milestones and activities. Need date and allowed time of
integration must be established early on with analysis for fluctuations and critical path.
Usually, the more time given for integration, the better the IRL score, which can be
attributed to system maturity through time and processes.
Schedule delay usually increases the overall cost of the system and may impact
the current requirements (i.e. launching a satellite at a certain month/year as required).
Based on Dubos, G., Saleh, J., and Braun R. (2008), “schedule slippage plagues the space
industry and is autonomic with the recent emphasis on space responsiveness; the GAO
has repeatedly noted the difficulties encountered by the DoD in keeping its acquisition of
space systems on schedule, and they identified the low TRL of the system/payload under
development as the primary culprit driving schedule risk and slippage.”
4.5 Results of Data Collection
Some of the attributes derived from the data may slightly impact the other
attributes based on how they are interpreted. Therefore, the stakeholders need to establish
clear definitions (as summarized above), understand the distinctions between attributes,
and document assumptions being made for each major attribute. Each integration issue is
aligned with an integration variable and then grouped with one of the seven major
attributes based on their focus areas. Tables 4-1a to 4-6a capture the data of each
attribute from each Space System. The tables show how a specific integration issue is
aligned to an integration variable and how it becomes a subset to one of the seven
attributes. Tables 4-1b to 4-6b also provide the number of years that the issue impacted
for each of the space systems.

45
Table 4-1a: AEHF Data
Major Integration Issue from 1999-2014
# Integration Issue Type of Issue
Contributing
Attribute
# of Years
Impacted
1
Insufficient integration & test processes
of satellite's digital processor Testing Process Processes 1
2
Nuclear hardening and shielding
integration into system
System Design
Maturity Complexity 6
3
Nuller spot beam performance and
integration
System Design
Maturity Complexity 6
4
Phased array antenna performance and
integration
System Design
Maturity Complexity 6
5
Electric propulsion development and
integration
System Design
Maturity Complexity 6
6
Integration of turbo coding into system
is susceptible to nuclear fading Interface Interoperability 3
7
Lack of terminal synchronization within
systems
Communication
between systems Interoperability 4
8 Insufficient software testing Testing Process Processes 3
9
Need for a payload simulator for
integration, test, and verification
HW/SW
Availability Availability 2
10
Compatibility of payload and new
terminals (standardization and
consistency)
Compatibility
between systems Interoperability 2
11
Cryptographic capability to support
AEHF data rate
Compatibility
between systems Interoperability 2
12 Manufacturing of complex circuit
Manufacturing
Process Processes 2
13
Model & Simulation for development,
integration, test, and operations of nuller
spot beam (testing single & multiple
jammer scenarios)
Test and
Verification Processes 2
14
Fidelity of available system test
simulator
Supporting
System
Availability Availability 2
15 Increased system throughput capacity
Communication
between systems Interoperability 1
16
Schedule of legacy system testing
inclusion to Mission Control segment
Schedule
impacts Schedule 1
17
Planning of space, mission control, and
user segment integration &
synchronization strategy
Strategy
Development Management 3
18
Insufficient specialized Model &
Simulation validation process
Validation
Process Processes 2
19
Satellite to satellite payload cross-links,
theater-to-theater communications,
network control interoperability,
Communication
between systems Interoperability 2
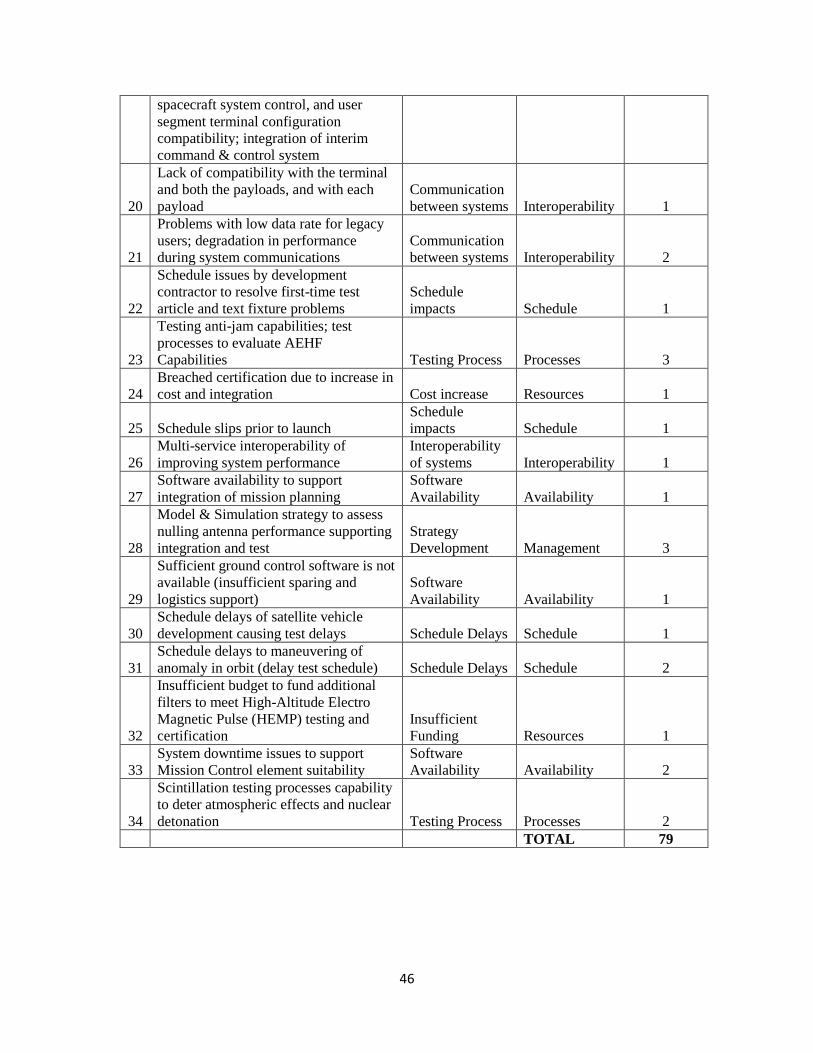
46
spacecraft system control, and user
segment terminal configuration
compatibility; integration of interim
command & control system
20
Lack of compatibility with the terminal
and both the payloads, and with each
payload
Communication
between systems Interoperability 1
21
Problems with low data rate for legacy
users; degradation in performance
during system communications
Communication
between systems Interoperability 2
22
Schedule issues by development
contractor to resolve first-time test
article and text fixture problems
Schedule
impacts Schedule 1
23
Testing anti-jam capabilities; test
processes to evaluate AEHF
Capabilities Testing Process Processes 3
24
Breached certification due to increase in
cost and integration Cost increase Resources 1
25 Schedule slips prior to launch
Schedule
impacts Schedule 1
26
Multi-service interoperability of
improving system performance
Interoperability
of systems Interoperability 1
27
Software availability to support
integration of mission planning
Software
Availability Availability 1
28
Model & Simulation strategy to assess
nulling antenna performance supporting
integration and test
Strategy
Development Management 3
29
Sufficient ground control software is not
available (insufficient sparing and
logistics support)
Software
Availability Availability 1
30
Schedule delays of satellite vehicle
development causing test delays Schedule Delays Schedule 1
31
Schedule delays to maneuvering of
anomaly in orbit (delay test schedule) Schedule Delays Schedule 2
32
Insufficient budget to fund additional
filters to meet High-Altitude Electro
Magnetic Pulse (HEMP) testing and
certification
Insufficient
Funding Resources 1
33
System downtime issues to support
Mission Control element suitability
Software
Availability Availability 2
34
Scintillation testing processes capability
to deter atmospheric effects and nuclear
detonation Testing Process Processes 2
TOTAL 79

47
Table 4-1b: AEHF Data
Major Integration Issue (Number of Attributes by Year)
YEAR AVAIL COMP INTER MGMT PROC RESO SCHED
1999
2000 1
2001 1 4 2 1
2002 1 4 4 2
2003 4 4 3
2004 1 4 2 1
2005 1 4 2 1 1 1
2006 4 2 1 1
2007 1 1 1 1
2008 2 1 1 1
2009 2 1 1 1
2010 1 1 1 1
2011 1 1 1 1
2012
2013
2014
Totals 8 24 19 6 14 2 6
TOTAL 79

48
Table 4-2a: EELV Data
Major Integration Issue from 1999-2014
# Integration Issue Type of Issue
Contributing
Attribute
# of Years
Impacted
1
Availability of modified Ground
Operations System
Supporting
System
Availability Availability 1
2
Insufficient testing processes on
performance of rocket components Test Processes Processes 1
3
Requirement changes to rocket engine
design
Requirement
Changes Management 1
4
Integration of legacy upper stage to the
new launch vehicle design
System
Interfaces and
Compatibility Interoperability 1
5
Legacy commonality from legacy launch
vehicle to new launch vehicle (avionics,
subsystems, parts, and engine)
System
Compatibility Interoperability 1
6
Integration processes of space launch
operations (deploy, sustain, augment)
Operations
Processes Processes 1
7
Accessing agreement issues of
development contractor’s integration and
test information/data
Contracted
Agreement and
Policies Management 1
8
Insufficient processes to obtain data of
system qualification tests for verification
Verification
Processes Processes 2
9
Lack of contractual requirement for test
reporting
Contracted
Agreement and
Policies Management 2
10
Processes for improving the
documentation of post-flight analysis
plans
Documentation
Processes Processes 2
11
Lack of additional development and
integration funding to satisfy government
and industry launches
Insufficient
Funding Resources 1
12
Insufficient use of Models and
Simulations to predict systems
integration and mission performance
Implementation
of Processes Processes 1
13
Interoperability and standardization
issues of supporting two launch ranges
Interoperability
between systems Interoperability 1
14
Design issues on reliability, logistics
supportability, multiple payload
interfaces, and information assurance
System Design
Maturity Complexity 2
15
Insufficient rocket engine and subsystem
testing Testing Process Processes 1
16
Ill-defined combined system test
processes Testing Process Processes 1
17
Ill-defined systems engineering processes
for system anomaly resolution
Verification
Processes Processes 1
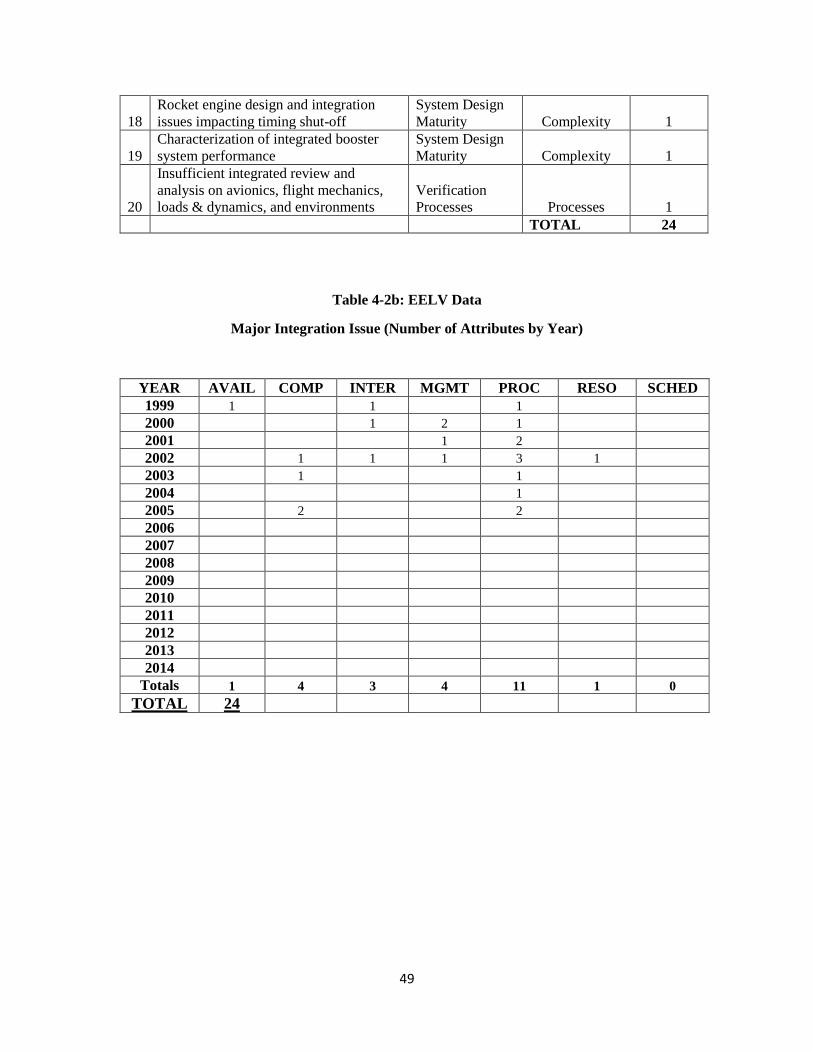
49
18
Rocket engine design and integration
issues impacting timing shut-off
System Design
Maturity Complexity 1
19
Characterization of integrated booster
system performance
System Design
Maturity Complexity 1
20
Insufficient integrated review and
analysis on avionics, flight mechanics,
loads & dynamics, and environments
Verification
Processes Processes 1
TOTAL 24
Table 4-2b: EELV Data
Major Integration Issue (Number of Attributes by Year)
YEAR AVAIL COMP INTER MGMT PROC RESO SCHED
1999 1 1 1
2000 1 2 1
2001 1 2
2002 1 1 1 3 1
2003 1 1
2004 1
2005 2 2
2006
2007
2008
2009
2010
2011
2012
2013
2014
Totals 1 4 3 4 11 1 0
TOTAL 24
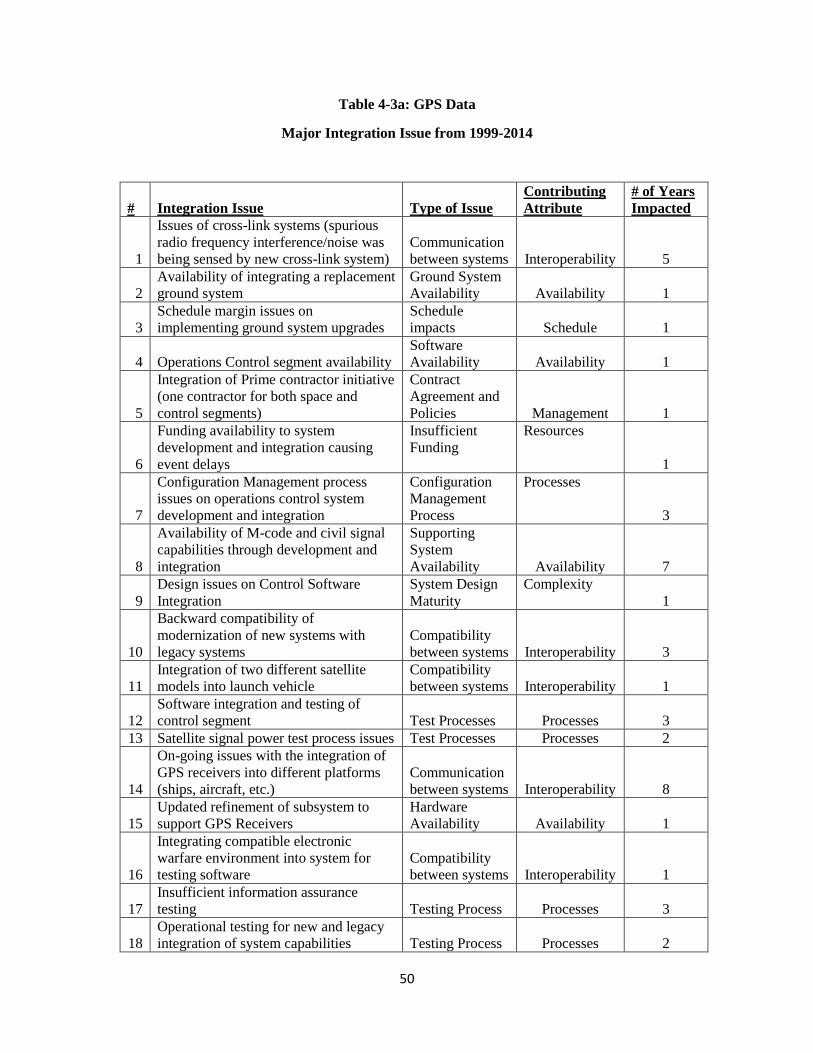
50
Table 4-3a: GPS Data
Major Integration Issue from 1999-2014
# Integration Issue Type of Issue
Contributing
Attribute
# of Years
Impacted
1
Issues of cross-link systems (spurious
radio frequency interference/noise was
being sensed by new cross-link system)
Communication
between systems Interoperability 5
2
Availability of integrating a replacement
ground system
Ground System
Availability Availability 1
3
Schedule margin issues on
implementing ground system upgrades
Schedule
impacts Schedule 1
4 Operations Control segment availability
Software
Availability Availability 1
5
Integration of Prime contractor initiative
(one contractor for both space and
control segments)
Contract
Agreement and
Policies Management 1
6
Funding availability to system
development and integration causing
event delays
Insufficient
Funding
Resources
1
7
Configuration Management process
issues on operations control system
development and integration
Configuration
Management
Process
Processes
3
8
Availability of M-code and civil signal
capabilities through development and
integration
Supporting
System
Availability Availability 7
9
Design issues on Control Software
Integration
System Design
Maturity
Complexity
1
10
Backward compatibility of
modernization of new systems with
legacy systems
Compatibility
between systems Interoperability 3
11
Integration of two different satellite
models into launch vehicle
Compatibility
between systems Interoperability 1
12
Software integration and testing of
control segment Test Processes Processes 3
13 Satellite signal power test process issues Test Processes Processes 2
14
On-going issues with the integration of
GPS receivers into different platforms
(ships, aircraft, etc.)
Communication
between systems Interoperability 8
15
Updated refinement of subsystem to
support GPS Receivers
Hardware
Availability Availability 1
16
Integrating compatible electronic
warfare environment into system for
testing software
Compatibility
between systems Interoperability 1
17
Insufficient information assurance
testing Testing Process Processes 3
18
Operational testing for new and legacy
integration of system capabilities Testing Process Processes 2

51
19
Planning and refinement of integration
and test strategy; insufficient rigorous
end-to-end planning
Planning Test
Strategy
Management
7
20
Schedule delays impacting integration,
tests, and supporting resources
Schedule
Impacts
Schedule
3
21
Synchronization of the development and
integration of space, control, and user
segments (risks to test new GPS
capabilities into operational platforms)
Compatibility
between systems Interoperability 6
22
Test processes and assessment of new
system capabilities Test Processes Processes 1
23
Prototype military receiver not available
for development and integration testing
Hardware
Availability Availability 1
24
Lack of documentation for interface
control documents, requirement
documents, and test plan
Documentation
Process Processes 1
25
Lack of mission planning tool; limited
operational realism when integrating
and testing different subsystems
Hardware and
Software
Availability Availability 2
26
Insufficient details to the documentation
of integration, test, and evaluation plan;
hindered strategy of test planning and
integration
Documentation
Process Processes 1
27
Updates needed for Crypto-keyed GPS
receivers design to enhance utility in
jammed environment
System Design
Maturity Complexity 1
28
Lack of Documentation for Selective
Availability Anti-Spoofing Module
(SAASM) and updated GPS receivers
Documentation
Process Processes 1
29
Inaccurate, Implausible, and Incoherent
schedule
Schedule
impacts Schedule 1
30
Updated Military GPS User Equipment
receiver availability for integration and
testing
Hardware
Availability Availability 1
TOTAL 71

52
Table 4-3b: GPS Data
Major Integration Issue (Number of Attributes by Year)
YEAR AVAIL COMP INTER MGMT PROC RESO SCHED
1999 1 1 1
2000 2 1 1 1 1
2001 1 1
2002 1 1 2 1
2003 1 4 3
2004 1 2 2
2005 2 2 1 4
2006 1 1 1 1 1
2007 2 1 1
2008 2 1 1 1
2009 2 2 1 2
2010 1 2 1 2
2011 1 1 1
2012
2013
2014 1 1 1
Totals 14 2 24 8 17 1 5
TOTAL 71

53
Table 4-4a: NPOESS Data
Major Integration Issue from 1999-2014
# Integration Issue Type of Issue
Contributing
Attribute
# of Years
Impacted
1
Availability of Critical Imager &
Sounding systems
Systems
Availability Availability 1
2
Compatibility of legacy ground
systems and operational system
Compatibility
between systems Interoperability 1
3
Development of acceptable integration
and test strategy
Strategy
Development Management 1
4
Documented processes on the
integration of space segment,
command & control segment and
communication segment; interface data
processor segment; and launch support
Documentation
Process Processes 1
5
Designing and developing algorithm
performance to new systems
System Design
Maturity Complexity 1
6
Funding issues to support
interoperability of high rate data in X
Band and low rate data in L Band
Insufficient
Funding
Resources
1
7
Integration of different elements,
multiple vendors, teams, and success is
lacking definition and rigorous systems
engineering
System of
Systems
Challenges Complexity 1
8
Inconsistent agreement and definitions
of different decision makers’ roles and
responsibilities
Stakeholder
Agreements
Management
1
9
Design issues with the quality of
Environment data record on algorithm,
sensor performance, quality control of
interface data processing segment
System Design
Complexity
Complexity
2
10
Insufficient interoperability of field
terminals and ground systems
Interoperability
between systems
Interoperability
2
11
Design viability of delivering three
sensors that can support ground
segment capability
Design
Complexity Complexity 1
12
Technical challenges on subsystems:
program sensor design, integration,
and algorithm development
System Design
Maturity Complexity 2
13
Satellite control compatibility to
existing network
Compatibility
between systems Interoperability 1
14
Lack of documentation process of
adequate threshold definitions in data
terminals
Documentation
Processes
Processes
1
15
Lack of available space environment
sensors that can be used for
integration, test, and upgrades
Supporting
Subsystem
Availability
Availability
1
TOTAL 18

54
Table 4-4b: NPOESS Data
Major Integration Issue (Number of Attributes by Year)
YEAR AVAIL COMP INTER MGMT PROC RESO SCHED
1999
2000 1 1
2001 1
2002 2 1 1
2003 2 1 1
2004 1 2 1
2005 1 2
2006
2007
2008
2009
2010
2011
2012
2013
2014
Totals 2 7 4 2 2 1 0
TOTAL 18
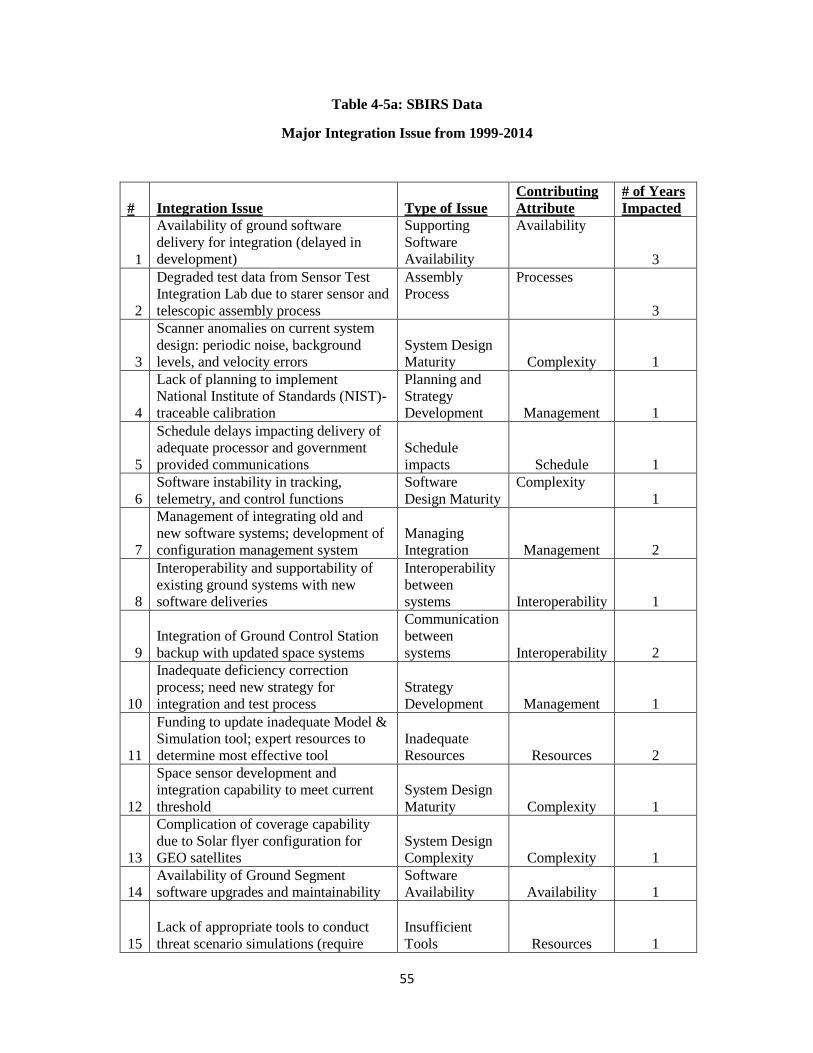
55
Table 4-5a: SBIRS Data
Major Integration Issue from 1999-2014
# Integration Issue Type of Issue
Contributing
Attribute
# of Years
Impacted
1
Availability of ground software
delivery for integration (delayed in
development)
Supporting
Software
Availability
Availability
3
2
Degraded test data from Sensor Test
Integration Lab due to starer sensor and
telescopic assembly process
Assembly
Process
Processes
3
3
Scanner anomalies on current system
design: periodic noise, background
levels, and velocity errors
System Design
Maturity Complexity 1
4
Lack of planning to implement
National Institute of Standards (NIST)-
traceable calibration
Planning and
Strategy
Development Management 1
5
Schedule delays impacting delivery of
adequate processor and government
provided communications
Schedule
impacts Schedule 1
6
Software instability in tracking,
telemetry, and control functions
Software
Design Maturity
Complexity
1
7
Management of integrating old and
new software systems; development of
configuration management system
Managing
Integration Management 2
8
Interoperability and supportability of
existing ground systems with new
software deliveries
Interoperability
between
systems Interoperability 1
9
Integration of Ground Control Station
backup with updated space systems
Communication
between
systems Interoperability 2
10
Inadequate deficiency correction
process; need new strategy for
integration and test process
Strategy
Development Management 1
11
Funding to update inadequate Model &
Simulation tool; expert resources to
determine most effective tool
Inadequate
Resources Resources 2
12
Space sensor development and
integration capability to meet current
threshold
System Design
Maturity Complexity 1
13
Complication of coverage capability
due to Solar flyer configuration for
GEO satellites
System Design
Complexity Complexity 1
14
Availability of Ground Segment
software upgrades and maintainability
Software
Availability Availability 1
15
Lack of appropriate tools to conduct
threat scenario simulations (require
Insufficient
Tools Resources 1

56
new simulation tool and message
injector)
16
Assembly rework and parts fabrication
of High Voltage Power Supply in gyro
assembly
Manufacturing
Process Processes 1
17
Lack of requirements definition on the
integration of SBIRS control segment,
CONOPS, and operational
dependability
Requirements
Development Management 2
18
Availability of subsystems to support
the development of overall system
(concerns with degree of concurrency
between space and ground segment
development and operational impact of
any further program delays)
Hardware and
Software
Availability Availability 1
19
Insufficient definition of integrated test
strategy to meet current schedule,
ground architecture, and overall
systems operational requirement
Strategy
Development
Management
6
20
Lack of accredited software test models
available for test scenarios and
simulations
Software
Availability Availability 2
21
Insufficient definitions of operational
concepts and development/operations
phases
Requirements
Management Management 2
22
Lack of tools and resources to support
Model and Simulation development of
operational integration and testing
Insufficient
Tools and
Resources
Resources
3
23
Compressed schedules to accreditation
of operational test scenarios increased
software integration issues
Schedule
Impacts
Schedule
2
24
Communication Issues of space control
and telemetry and Flight Software
integration in Satellite
Communication
between
systems
Interoperability
3
25
Limited ground software tools to
determine limitations of software
capabilities
Insufficient
Tools Resources 1
26
Insufficient processes for data
collection of deficiencies, fixes, and
impacts to mission capability
Data Collection
Process Processes 1
TOTAL 46

57
Table 4-5b: SBIRS Data
Major Integration Issue (Number of Attributes by Year)
YEAR AVAIL COMP INTER MGMT PROC RESO SCHED
1999 1 2 2 1 1
2000 1 2 1 1
2001 1 1 1 2 1
2002 1 1 1
2003 1 1 1
2004 1 1
2005 1 3
2006 1 2
2007 1 1 1 1
2008 1 1 2 1
2009 1 1 1
2010
2011
2012 1
2013
2014
Totals 7 4 6 14 5 7 3
TOTAL 46

58
Table 4-6a: WGS Data
Major Integration Issue from 1999-2014
# Integration Issue Type of Issue
Contributing
Attribute
# of Years
Impacted
1
Complexity of designing and
integrating effective cross-banding
between X-band and Ka-band on board
the satellite
System Design
Maturity Complexity 4
2
Lack of software tools to support
development of system configuration
control element
Insufficient
Tools
Resources
2
3
Software development complexity to
support the interoperability
requirements for control software
control
Software
Complexity Complexity 2
4
Insufficient communication network
between operational system users Communication
Interoperabilit
y 1
5
System interoperability issues of WGS
and transmission system
System
Interoperability
Interoperabilit
y 2
6
Lack of workable communication
payloads in WGS; need to ensure
consistent communication between
different bands (Ka and X bands) and
between users
Communication
between
systems
Interoperabilit
y 1
7
Insufficient documentation processes
to support development and integration
Documentation
Processes
Processes
1
8
Ill-defined requirement definitions to
separate legacy and new systems on
orbit
Strategy
Development
and
Requirement
Management
Management
1
9
Updating requirements on the
integration of solar panels into design;
decisions on payload weight issues
Strategy
Development Management 1
10
Insufficient schedule assessment to
account for development and
integration
Schedule
Impacts
Schedule
1
11
System availability to enable linkage
between space and ground systems
Hardware and
Software
Availability Availability 1
12
Insufficient Operator workload; highly
trained personnel needed for increased
responsibilities
Insufficient
Personnel Resources 1
13
Support to operations from different
organizations and DoD services;
insufficient number of personnel
Insufficient
Personnel Resources 1

59
14
Lack of upgraded automation software
operations center networks
Supporting
System
Availability
Availability
1
15
Design and integration complexity of
frequency reuse, satellite orbital
placement, and launch service
availability
System Design
Maturity Complexity 4
16
Schedule requirements are insufficient
for integration and test assessment
Schedule
impacts Schedule 1
17
Oscillator component issues with
payload channelizer subsystem;
controls payload switching and
crossbanding
Compatibility
between
systems
Interoperabilit
y 1
18
Quality control production of wrongly
integrated fasteners
Production
Process Process 1
19
Updating connectivity between related
systems such as the Global Broadcast
System to improve interoperability
System
Connectivity
Interoperabilit
y 2
20
Quality control testing at production
facility caused problems with assembly
of first two WGS satellites
Manufacturing
Process Processes 1
21
Insufficient management controls to
address current satellite issues
Management
Standards Management 1
22
Unavailable software for users on
WGS communication using Common
Network Planning
Software
Availability Availability 1
23
Interoperability of legacy baseband
equipment
Interoperability
between
systems
Interoperabilit
y 1
TOTAL 33
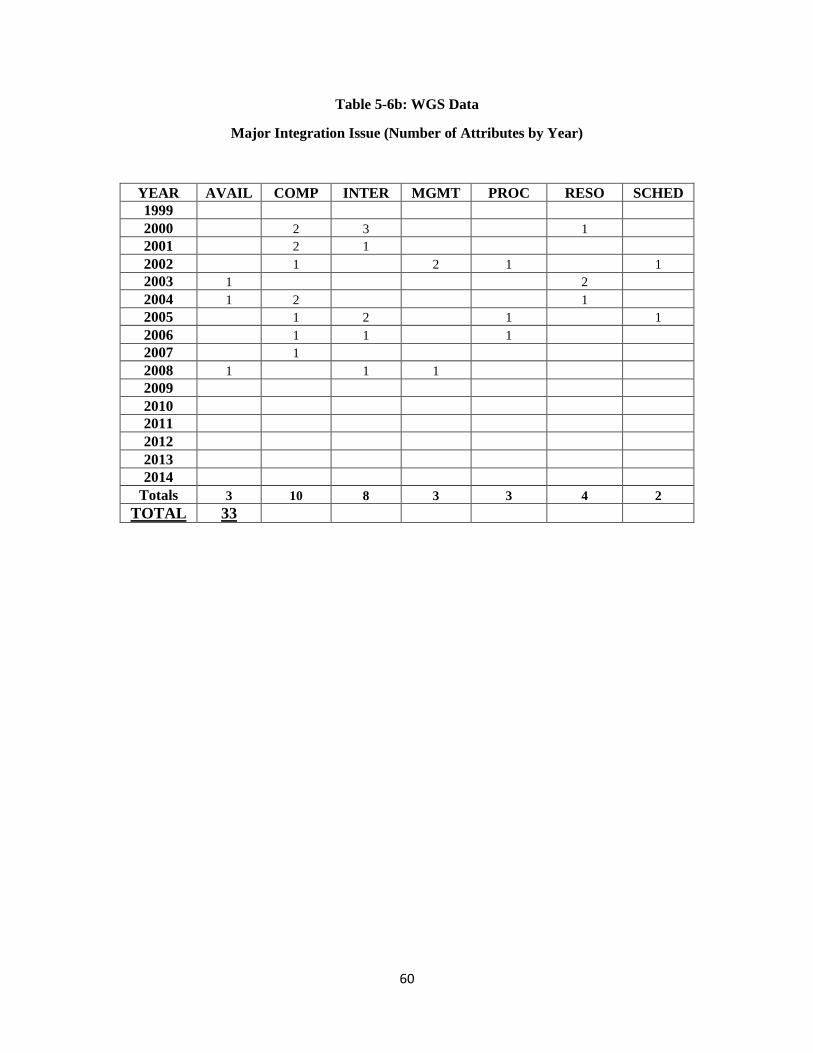
60
Table 5-6b: WGS Data
Major Integration Issue (Number of Attributes by Year)
YEAR AVAIL COMP INTER MGMT PROC RESO SCHED
1999
2000 2 3 1
2001 2 1
2002 1 2 1 1
2003 1 2
2004 1 2 1
2005 1 2 1 1
2006 1 1 1
2007 1
2008 1 1 1
2009
2010
2011
2012
2013
2014
Totals 3 10 8 3 3 4 2
TOTAL 33
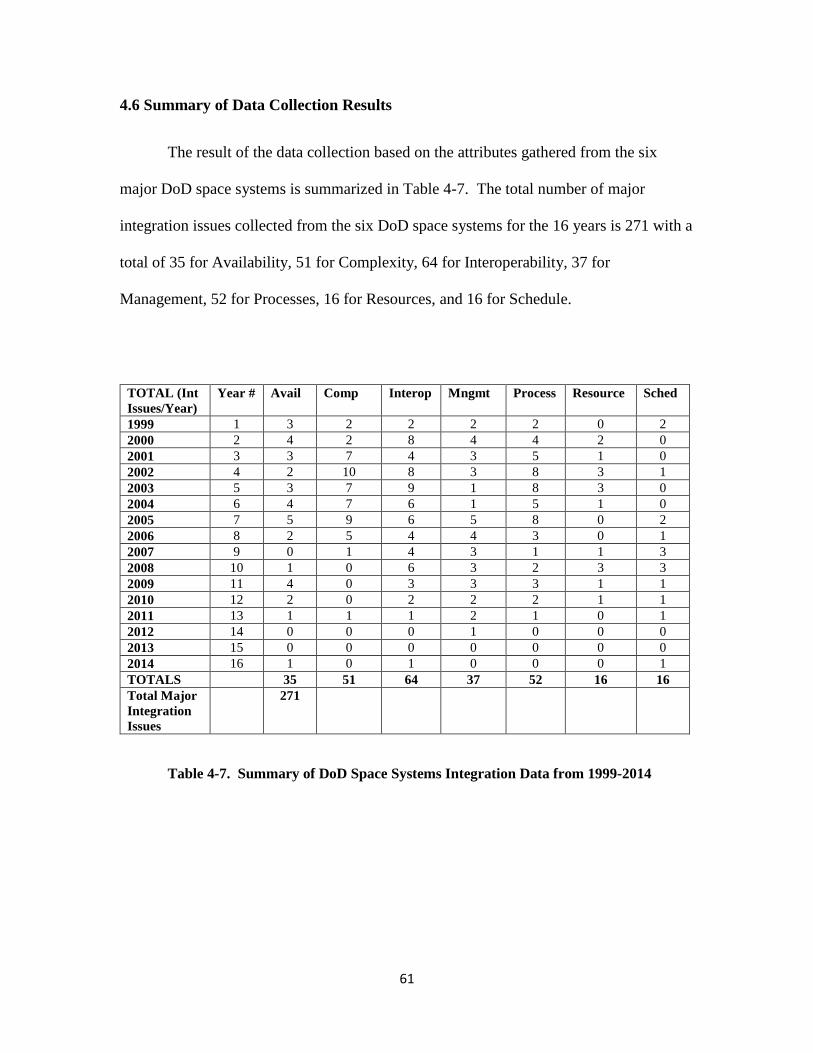
61
4.6 Summary of Data Collection Results
The result of the data collection based on the attributes gathered from the six
major DoD space systems is summarized in Table 4-7. The total number of major
integration issues collected from the six DoD space systems for the 16 years is 271 with a
total of 35 for Availability, 51 for Complexity, 64 for Interoperability, 37 for
Management, 52 for Processes, 16 for Resources, and 16 for Schedule.
TOTAL (Int
Issues/Year)
Year # Avail Comp Interop Mngmt Process Resource Sched
1999 1 3 2 2 2 2 0 2
2000 2 4 2 8 4 4 2 0
2001 3 3 7 4 3 5 1 0
2002 4 2 10 8 3 8 3 1
2003 5 3 7 9 1 8 3 0
2004 6 4 7 6 1 5 1 0
2005 7 5 9 6 5 8 0 2
2006 8 2 5 4 4 3 0 1
2007 9 0 1 4 3 1 1 3
2008 10 1 0 6 3 2 3 3
2009 11 4 0 3 3 3 1 1
2010 12 2 0 2 2 2 1 1
2011 13 1 1 1 2 1 0 1
2012 14 0 0 0 1 0 0 0
2013 15 0 0 0 0 0 0 0
2014 16 1 0 1 0 0 0 1
TOTALS 35 51 64 37 52 16 16
Total Major
Integration
Issues
271
Table 4-7. Summary of DoD Space Systems Integration Data from 1999-2014
62
CHAPTER 5: RESULTS
5.1 Data Analysis
To determine the relationships between the seven attributes for the given years, a
multivariable regression analysis was completed with the help of the Minitab software
tool. The summary of analysis for each attribute is highlighted in the Normal Probability
Graph in Figure 5-1. The resulting numbers are provided in Tables 5-1a to d. Table 5-1a
shows the Mean and Standard Deviation (StDev) for each of the seven Attributes with the
N number of years (16 total years). It also shows the Minimum and Maximum values for
each attribute.
According to the Normal Probability Graph in Figure 5-1 and the resulting values
in Table 5-1a, the value of the attributes are distributed in 3 groups with closely related
plots: 1) Processes, Interoperability, and Complexity have the highest means and highest
standard deviations; 2) Management and Availability values lie in the middle; and 3)
Resources and Schedule have the lowest mean values (1.0) and with Schedule having a
lower standard deviation. The analysis explained that although Interoperability has the
highest mean from the collective space systems integration issues, Complexity had the
highest standard deviation. Complexity had the highest variance from 0 to as much as 10
issues per year.
Table 5-1b provides the P-value calculation. The null hypothesis is that the
attribute’s set of data follows a normal distribution. According the results, Complexity,
Resources, and Schedule have P-values less than 0.05, which rejects the null hypothesis.
These attributes do not follow a normal distribution. The other attributes (Availability,

63
Interoperability, Management, and Processes) have P-values greater than 0.05, which
shows that the data follow a normal distribution. The P-value was calculated in order to
understand how each of the attributes’ data set is compared against each other. Further
investigation explains why the three attributes do not have normal distribution:
Complexity related issues were not distributed normally since there were 49
Complexity related issues of the DoD space systems in the first 8 years of the 16-year
sample and there are only 2 issues in the next 8 years. This is consistent to the
assumption in Section 3.1 that as more time is given to address complex issues and
allowing the program to mature, the less of these Complexity related issues would
occur, which also impacts the overall IRL assessment. In addition, from 2011 to
2014, these DoD space system programs have either matured through the Systems
Engineering Life Cycle or have been cancelled (NPOESS); therefore the major
integration issues for those years are minimal compared to the years before that.
Resources related issues throughout the 16 years had a maximum of 3 per year (in 3
years) while having 7 years with the value of 0. There are a total of 16 Resources
related issues in the 16 years, which explains why it is not normally distributed.
Schedule, like Resources, also shows 16 Schedule related issues in the 16 years.
Based on the data collection, both Resources and Schedule are lower valued
attributes, and it may be due to how they are reported in the DOT&E annual reports.
Resources may not be an issue for that year if additional funding was provided, and
Schedule issues may be caused by other attributes.
For statistical measure, R-squared helps explain how close the data are to the
fitted regression line. Table 5-1c shows the calculated values for the Standard Error for

64
the Regression (S), the goodness of fit (R-squared or R-sq), and the modified version of
R-squared (R-sqAdj). R-squared is calculated at 68.0%, which is just below the
acceptable 75% “good fit” value (Lattin J, Carroll J, Green P, 2002). This shows that
there is correlation between the variables and the Year. A modified version of the R-
squared value is the Adjusted-R-squared, which accounts for the number of predictors in
the model. In this case, the Adjusted-R-squared significantly drops the R-squared value.
The Regression Equation have also been calculated in Table 5-1d, which helps with
predicting the year for the given attributes. However, the goal of this research is to
identify and define the attributes and their relationships among each other. Therefore, the
Regression Equation will not be used.
Figure 5-1. Normal Probability Graph of the Attributes Derived from Collected Data

65
Summary Statistics
Variable N Mean StDev Minimum Maximum
Availability 16 2.188 1.601 0 5
Complexity 16 3.188 3.656 0 10
Interoperability 16 4.000 2.921 0 9
Management 16 2.313 1.448 0 5
Processes 16 3.250 2.840 0 8
Resources 16 1.000 1.155 0 3
Schedule 16 1.000 1.033 0 3
Table 5-1a. Summary Statistics
Source P-Value
Availability 0.3065
Complexity <0.0050
Interoperability 0.4230
Management 0.3135
Processes 0.0724
Resources <0.0050
Schedule 0.0058
Table 5-1b. Analysis of Variance
Model Summary
S R-sq R-sq(adj)
3.6838 68.07% 40.13%
Table 5-1c. Model Summary
Regression Equation
Year = 15.140 − 0.070 Schedule − 2.183 Resources + 2.341 Processes
− 0.5640 Management − 0.290 Interoperability − 1.5063 Complexity − 2.162 Availability
Table 5-1d. Regression Equation
66
5.2 Data Validation through Survey
The integration data was very useful in identifying critical attributes to support a
framework for facilitating SoS integration. SoS integration is complex and being able to
develop a systems integration assessment tool to determine integration feasibility is
necessary for overall program planning. Although the identified attributes from the data
collection can help improve the integration feasibility assessment, the attributes need to
be validated by systems engineering, integration, and DoD acquisition experts.
A survey was conducted to help validate the usefulness of the seven major
integration attributes. The survey was four weeks long that targeted 159 systems
engineering, integration, and DoD acquisition experts with varying experiences in space
systems, and/or complex SoS. From the 159 targeted participants, 88 have responded to
the survey, which helped validate the attributes derived from the six major space systems
data. The 88 participants were systems engineers, DoD acquisition professionals, and
SMEs.
The survey was developed to ask the participants their opinions, based on their
experience, of the integration attributes derived from the DoD Space Systems. They
were asked to rank the attributes based on importance when considering for SoS
integration. They were asked for their credentials though years of experience, field of
expertise, and the types of SoS that they had experience with. The participants were
targeted based on their credentials and were given the opportunity to provide feedback if
they agreed or disagreed with the list of attributes. They were also given the opportunity
to provide additional attributes and integration variables that helped define the original
attributes. Most the participants were: systems engineers and DoD acquisition

67
professionals working at the United States Air Force Space and Missiles Systems Center
and the Missile Defense Agency; system engineers who were members of the
International Council of Systems Engineers in Los Angeles; and development engineers
from major companies in the space industry.
5.3 Survey Development and Administration
The process to develop and administer a survey required important steps to ensure
a quality survey was produced without negative repercussions. To implement the survey,
an Independent Review Board (IRB) package needed to be completed to include the
intent of the survey and to ensure certain ethical and George Washington University
regulations are not violated. Before any survey was initiated, a Collaborative
Institutional Training Initiative (CITI Program) needed to be successfully completed,
which covered ethical principles, defining research with human subjects, Federal
regulations, risk assessment, and privacy and confidentiality.
IRB Package Consent Summary:
The IRB package provided very specific reasons to conduct the survey
emphasizing that it was entirely voluntary for the participants to take. Participants were
requested to complete the survey because of their experience in SoS and space systems
integration. They needed to have had experience or are currently supporting the
acquisitions (planning, design, development, test, integration, and deployment) of space
systems and/or SoS. Targeted participants should have been involved in any functional
capacity (i.e. systems engineering, SMEs, contracts, etc.) and/or are stakeholders in the
decisions to space systems or SoS integration. Participants were advised to not continue
68
with survey if they did not meet the qualifications provided in the introduction of the
survey. Finally, the survey is restricted to only unclassified responses. Any higher
security classification responses were not acceptable and are against the law, which was
defined in the research criteria.
The survey would take approximately 30 minutes to complete; however, the
participants may decline to answer any of the questions being asked as well as choose to
stop their participation in the survey at any time. There was no known risk associated
with the survey or the research. The answers from the survey would only be used for the
purpose of the research and potential identifying information was kept confidential. The
data derived from the survey will not include any identifying information for the survey
participants, and will only be reported in an aggregate format.
The survey was administered in three different ways: 1) through Qualtrics, an
online survey tool that has proven to protect encrypted data (i.e. actual names or email
address of the survey participant)—this method garnered the most response; 2) through
email—some of the participants were emailed a copy of the survey and they also
provided their response through email; and 3) through hardcopy printouts—the surveys
were distributed to experts through different meetings and system engineering
conferences.
Each participant would not benefit directly or financially from his/her
participation in the survey. The major motivation was to be involved with potentially
improving systems engineering and integration processes within their respective
organizations with the results being potentially published in scholarly paper. The

69
participants were informed that their inputs and insight to the research would directly
help challenge or validate new perspective they may have about space systems or SoS
integration.
The participants would only complete the survey once and with no follow-up
questions after completion. Their feedback will focus on providing feedback and
comments to the data collected. The survey was administered in January 2016 and lasted
for five (5) weeks. Online consent forms needed to be completed by the participants
before starting the survey.
Survey Questions:
1. List the name(s) of the Space Systems (and/or complex systems) you have worked
on:
2. What are your area(s) of expertise in the system(s) you mentioned above (i.e.
Systems Engineering, Acquisitions, Finance, Logistics, Schedule, Contracts,
Business Management, Configuration Management, Technical/Integration,
Management, Subject Matter Expert, etc.)?
3. How many years of work experience do you have in your area(s) of expertise?
4. Rank the attributes identified below (derived from the DoD space systems
integration data) that may help ensure successful integration of your overall
system:
a. ____ Availability (Available Technology, Readiness of Hardware and
Software components/subsystems)
b. ____Complexity (Technical risks, Number of interfaces, Level of effort)

70
c. ____Interoperability (Desired output/data, Semantics, Syntax,
Component Communication)
d. ____Management (Stakeholders, Directives, Guidance, Internal/External
Coordination)
e. ____Processes (Planning and Execution, Test and Verification,
Documentation)
f. ____Resources (Funding, Personnel, Right Expertise/Experience,
Hardware and Software tools)
g. ____Schedule (Need date, Allowed time, Fluctuations/Critical Path)
5. Do you agree with the 7 primary attributes listed in Question 4? Why or why not?
6. Do you agree with the list in parenthesis supporting each attribute in Question
4? Why or why not?
7. What other attribute(s) should be considered in addition to the 7 identified in
Question 4?
8. Would you put Security as a separate attribute from the 7 above? Or would you
include it under Processes?
9. What is your organization doing (or has done) to address major integration issues
and challenges?
10. Have you heard of Integration Readiness Level (IRL) assessment before? (circle)
Yes / No
11. IRL has been used to support Technology Readiness Assessment; however, it can
also be beneficial to support overall systems integration. The higher the IRL
71
score, the higher the integration feasibility. Do you think including the attributes
above would make IRL more useful in systems integration? (circle)
Yes / No
12. IRL could be used to understand the integration challenges ahead of time and
provide areas of emphasis throughout the integration process. How would you
benefit if you understood the feasibility of integration before integrating the actual
system? Provide examples (if any).
13. Based on your experience, what factors can hurt the system if Schedule continues
to be delayed (impact of time)?
14. Would you agree that your Integration Readiness Level (IRL) score improves
through time due to more opportunities to address potential risks and
issues? Why or why not?
15. What do you think are some major risk areas when integrating overall System of
Systems (i.e. Space Systems, Enterprise Systems, Complex Systems, etc.)?
16. Based on your experience, what do you see most often that causes systems
integration failure? Why?
17. What are some recommendations you have to improve overall systems
integration?
18. What has been one of the longest integration issue for the system you worked
on? How long did it take to resolve (estimated in years)?
72
5.4 Survey Results
Summary of Survey Results
Questions 1 to 7 were the most useful responses to this research that were
analyzed through the survey analysis below and compared with the data that were
collected from the DoD space systems. Table 5-2 is the Key to the Survey Results Data
for Questions #1 to 7. Table 5-3 is the Survey Results Data for Questions #1 to 7.
Questions 8 to 18 provided additional background information of the systems that the
participants were involved with and their experience. The responses received from all of
the questions validated the Attributes data collected, and it helped provide additional
background information for each Attribute.
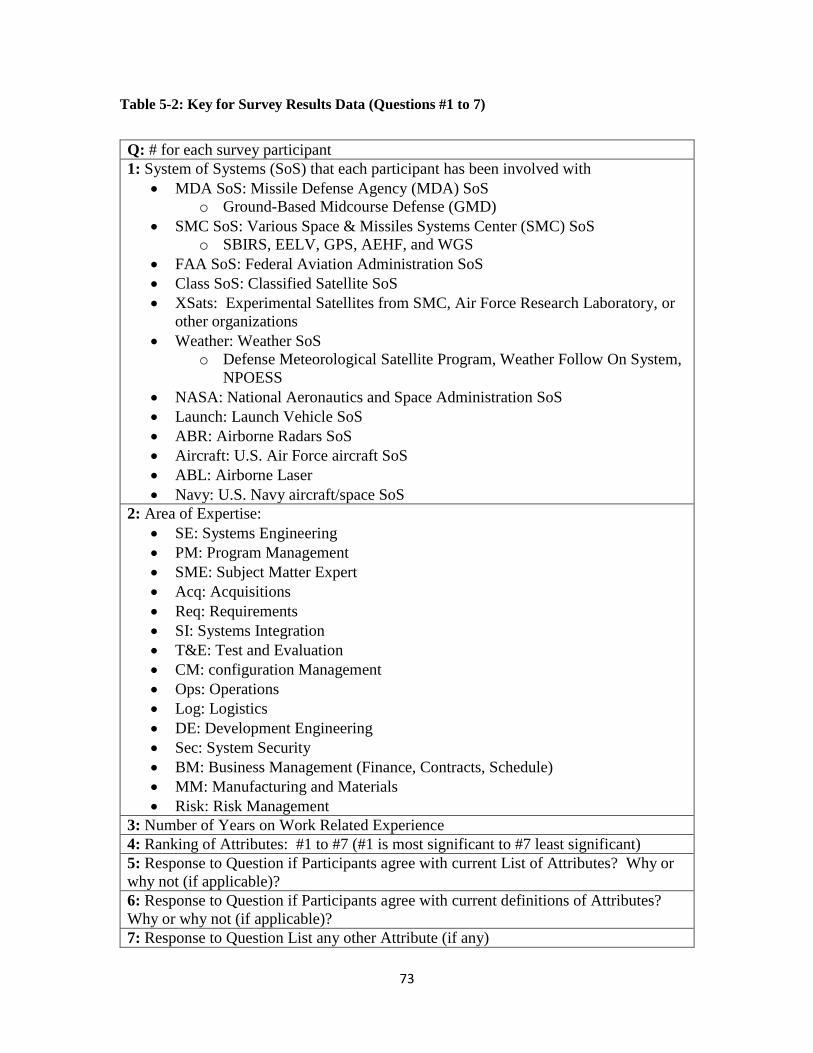
73
Table 5-2: Key for Survey Results Data (Questions #1 to 7)
Q: # for each survey participant
1: System of Systems (SoS) that each participant has been involved with
MDA SoS: Missile Defense Agency (MDA) SoS
o Ground-Based Midcourse Defense (GMD)
SMC SoS: Various Space & Missiles Systems Center (SMC) SoS
o SBIRS, EELV, GPS, AEHF, and WGS
FAA SoS: Federal Aviation Administration SoS
Class SoS: Classified Satellite SoS
XSats: Experimental Satellites from SMC, Air Force Research Laboratory, or
other organizations
Weather: Weather SoS
o Defense Meteorological Satellite Program, Weather Follow On System,
NPOESS
NASA: National Aeronautics and Space Administration SoS
Launch: Launch Vehicle SoS
ABR: Airborne Radars SoS
Aircraft: U.S. Air Force aircraft SoS
ABL: Airborne Laser
Navy: U.S. Navy aircraft/space SoS
2: Area of Expertise:
SE: Systems Engineering
PM: Program Management
SME: Subject Matter Expert
Acq: Acquisitions
Req: Requirements
SI: Systems Integration
T&E: Test and Evaluation
CM: configuration Management
Ops: Operations
Log: Logistics
DE: Development Engineering
Sec: System Security
BM: Business Management (Finance, Contracts, Schedule)
MM: Manufacturing and Materials
Risk: Risk Management
3: Number of Years on Work Related Experience
4: Ranking of Attributes: #1 to #7 (#1 is most significant to #7 least significant)
5: Response to Question if Participants agree with current List of Attributes? Why or
why not (if applicable)?
6: Response to Question if Participants agree with current definitions of Attributes?
Why or why not (if applicable)?
7: Response to Question List any other Attribute (if any)

74
Table 5-3: Survey Results Data (Questions #1 to 7)
Q 1 2 3 4 5 6 7
# SoS Exp Yr
s
R
1
A
2
N
3
K
4
I
5
N
6
G
7
Agree w/Attr Agree w/Def Other Attr
1 MDA SoS SE 39 A C I M P R S Yes Yes None
2 MDA-SoS SE,
T&E
35 P R C I S M A Yes Yes Team
Structure
3 SMC SoS SE,
MM
40 M I C A P R S Yes. Need
Mgt
guidance.
Add Decision
Making &
Leadership
Same as Q6
4 FAA &
MDA SoS
SE 34 I C A P M R S No. Need
Concept of
Ops
No. Add
Funding and
Staffing
Same as Q6
5 Class SoS Sec 16 R A M P S I C Need
clarification
on
Complexity
&
Interoperabili
ty
Yes Stable
Reqmts
6 XSats PM,
SME
13 R M I P S A C Yes Yes None
7 Class SoS SE,
PM,
SME
35 R M P A C I S Yes Yes V&V
Process
8 SMC SoS Acq 3 R M S A C P I Yes Yes None
9 Weather Req,
SME
20 M R P A D S I Yes Yes None
10 Class SoS SE,
S&P
8 P R M S I A C Yes Yes None
11 NASA,
MDA SoS
SE 36 C I R A M P S Add Reqmts,
Architecture,
& M&S
Same as Q5 Same as Q5
12 SMC SoS,
Launch
SE,
CM,
Req
20 M P R C I A S Yes Yes Reqmts
Definition
13 AR DE 16 A C R I P M S Yes Yes None
14 SMC SoS Acq 3 M R A C S P I Yes Yes None
15 SMC SoS SE,
SI,
Acq
21 A R M S C I P Add Planning Planning Planning as
separate
Attribute
16 SMC SoS SE,
Acq,
CM
11 M P R A C I S Yes Yes None
17 MDA SoS SE 4 R S P A M I C Yes Yes Config Mgt
18 SMC SoS,
MDA SoS
SE,
Acq,
SME
30 P I C A R M S Yes Yes Capture
“ilities”
19 SMC SoS Acq 3 M R P A C I S Yes Yes Clear
Reqmts
20 SMC SoS SE,
Acq
20 A I R S P M C Yes Yes Reqmts
Definition

75
Q 1 2 3 4 5 6 7
# SoS Exp Ex R
1
A
2
N
3
K
4
I
5
N
6
G
7
Agree w/Attr Agree w/Def Other Attr
21 Class SoS SE 16 P C M I R S A Yes Ad d Config
Mgt to
Processes
None
22 Launch SE,
Acq,
Ops
10 C I M R P A S Need to
Explain
Schedule
Update
Schedule
Definition
Reqmts
Definition
23 Class SoS Acq,
BM,
SME
20 M R P S A I C Yes Yes Technical
Scope
24 XSats SE,
T&E
36 R A S M P C I Yes Yes Concept of
Operations
25 SMC SoS Acq,
BM,
SME
14 C I R M A S P Yes Cybersecurity
under
Processes
Product
Support
26 SMC SoS,
Aircraft
SE,
T&E
15 S C R P M A I Yes Yes Reqmts
Definition
27 SMC SoS Acq,
BM
8 P M A S R C I Yes Yes Flexibility
28 SMC SoS SE,
PM
35 C A S I M P R Yes Yes None
29 MDA SoS PM,
Acq,
T&E
27 M R S I C A P Yes Yes Cost &
Schedule
Risks
30 NASA SE,
PM
12 R C M P S I A Yes Yes None
31 Class SoS SE,
Acq
13 M R P A S C I Yes Yes None
32 SMC SoS SE,
Acq
25 C A S M P R I Yes Yes None
33 Class SoS SE,
T&E
16 R M C A S I P Yes Yes None
34 SMC SoS SME 50 C I P A R M S Yes Yes Reqmts
Definition
35 Launch,
SMC SoS
T&E 11 R S C A I M P Yes Yes None
36 NASA,
SMC SoS
SE,
PM
25 C P A I M R S Yes Reqmts as
part of
Complexity
Reqmts
could also
be separated
37 Weather Acq 9 M R C P S A I Yes Yes Necessity
38 Launch BM 18 M R S A P C I Yes Yes Contracts
Timeframe
39 SMC SoS PM 12 M S I P C A R Yes Yes Rate of
Technology
40 ABL DE 18 R C A P I S M Yes Yes Transfer of
Knowledge
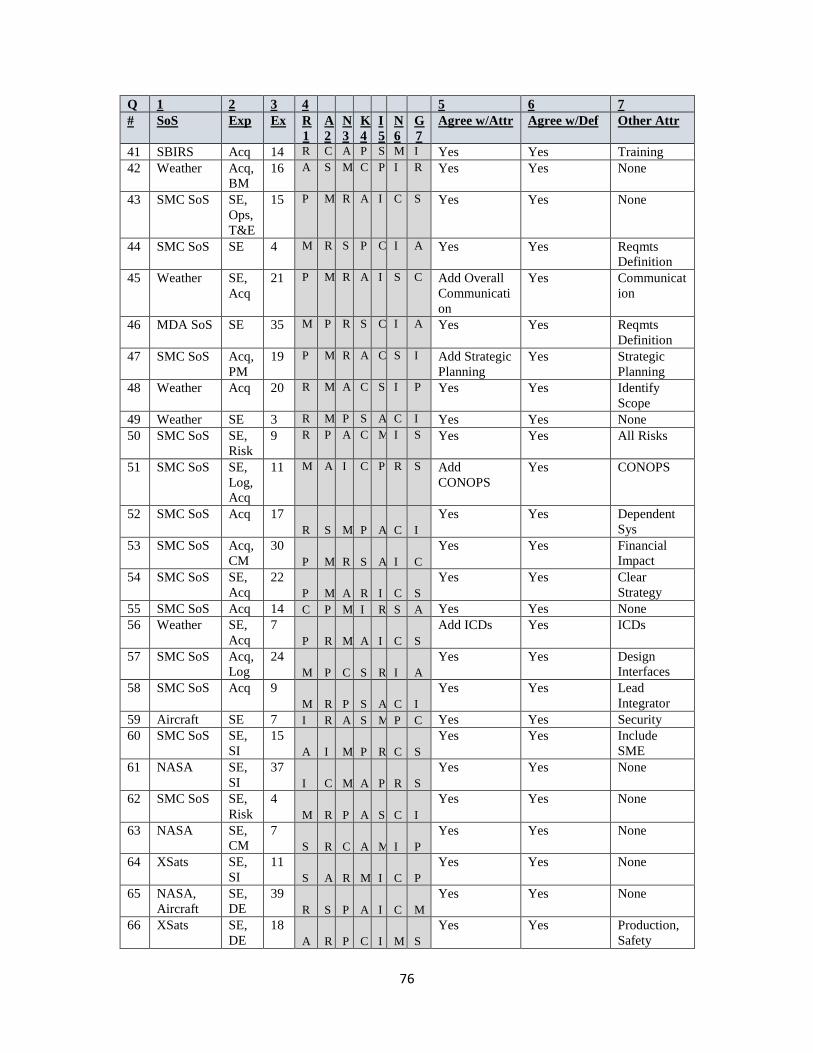
76
Q 1 2 3 4 5 6 7
# SoS Exp Ex R
1
A
2
N
3
K
4
I
5
N
6
G
7
Agree w/Attr Agree w/Def Other Attr
41 SBIRS Acq 14 R C A P S M I Yes Yes Training
42 Weather Acq,
BM
16 A S M C P I R Yes Yes None
43 SMC SoS SE,
Ops,
T&E
15 P M R A I C S Yes Yes None
44 SMC SoS SE 4 M R S P C I A Yes Yes Reqmts
Definition
45 Weather SE,
Acq
21 P M R A I S C Add Overall
Communicati
on
Yes Communicat
ion
46 MDA SoS SE 35 M P R S C I A Yes Yes Reqmts
Definition
47 SMC SoS Acq,
PM
19 P M R A C S I Add Strategic
Planning
Yes Strategic
Planning
48 Weather Acq 20 R M A C S I P Yes Yes Identify
Scope
49 Weather SE 3 R M P S A C I Yes Yes None
50 SMC SoS SE,
Risk
9 R P A C M I S Yes Yes All Risks
51 SMC SoS SE,
Log,
Acq
11 M A I C P R S Add
CONOPS
Yes CONOPS
52 SMC SoS Acq 17
R S M P A C I
Yes Yes Dependent
Sys
53 SMC SoS Acq,
CM
30
P M R S A I C
Yes Yes Financial
Impact
54 SMC SoS SE,
Acq
22
P M A R I C S
Yes Yes Clear
Strategy
55 SMC SoS Acq 14 C P M I R S A Yes Yes None
56 Weather SE,
Acq
7
P R M A I C S
Add ICDs Yes ICDs
57 SMC SoS Acq,
Log
24
M P C S R I A
Yes Yes Design
Interfaces
58 SMC SoS Acq 9
M R P S A C I
Yes Yes Lead
Integrator
59 Aircraft SE 7 I R A S M P C Yes Yes Security
60 SMC SoS SE,
SI
15
A I M P R C S
Yes Yes Include
SME
61 NASA SE,
SI
37
I C M A P R S
Yes Yes None
62 SMC SoS SE,
Risk
4
M R P A S C I
Yes Yes None
63 NASA SE,
CM
7
S R C A M I P
Yes Yes None
64 XSats SE,
SI
11
S A R M I C P
Yes Yes None
65 NASA,
Aircraft
SE,
DE
39
R S P A I C M
Yes Yes None
66 XSats SE,
DE
18
A R P C I M S
Yes Yes Production,
Safety

77
Q 1 2 3 4 5 6 7
# SoS Exp Ex R
1
A
2
N
3
K
4
I
5
N
6
G
7
Agree w/Attr Agree w/Def Other Attr
67 NASA,
Launch
SE,
SI,
SME
50
I A R P M C S
Modeling &
Simulation
(M&S)
M&S Communicat
ion
68 NASA SE,
DE
20
R P I S A C M
Yes Yes Reqmts
Definition
69 NASA,
Navy
SE,
CM,
SI
36
R I C S A M P
Yes Yes None
70 Aircraft,
Navy
SE 16
A R C M S P I
Yes Include
Facilities
None
71 Aircraft,
MDA,
SMC SoS
SE 19
I A C R M P S
Yes Yes None
72 SMC SoS SE,
DE,
Acq
8 C A R I P M S Yes Establish
culture under
Management
None
73 SMC SoS SE,
Acq,
SME
24 C A R S M P I Clarity and
Stability
Interface &
Standards
under Interop
Reqmts
Stability
74 SMC SoS Acq 10 A C M S P I R Yes Yes Threat
Assessment
75 Weather Acq 22 A C I M P R S Yes Yes Authority
76 XSats,
NASA,
Launch
SE,
Acq
13 M P R S O C A Politics Yes Leadership
77 SMC SoS SE,
Log,
Ops,
T&E
36 M P C R A S I Yes Yes None
78 SMC SoS Acq,
BM
20 M P R S C I A Yes Yes Decisive &
Cohesive
79 SMC SoS SE 3 M P C A R S I Yes Yes None
80 SMC SoS SE,
PM
24 M S R A P C I Yes Yes None
81 SMC SoS SE 28 A C I R S M P Yes Yes None
82 MDA SoS SE 15
M R A P C I S
CONOPS Yes Reqmts
Definition
83 SMC SoS SE,
Scq,
SME
30
M R P A S C I
Yes Yes None
84 Launch DE,
SME
26
A I R P S C M
Yes Yes Cybersecurit
y
85 SMC SoS SE,
Sec
27
M P R I C A S
Yes Yes None
86 SMC SoS SE,
Acq,
BM
14
M C I A S R P
Yes Leadership None
87 SMC SoS SE 35 M R S P C A I Safety, Risks Yes None
88 SMC SoS SE,
BM
8
A M S C P R I
Yes Motivation None
78
Responses for Questions 8-18:
Question 8: This question asked about including Security as either part of Processes
attribute or that it should be a separate attribute based on the participants’ experience.
Security can capture systems security, cybersecurity, administrative security, and
physical security. They are all very important to the operations of the SoS and during
integration. However, the overwhelming response (over 65%) was to include Security
under the Processes attribute. There were 14% of responses that claimed it should be
separated from the Processes attributes but most claimed that it would not be its own
attribute. There were also 14% of the responses that Security can be captured under the
Requirements attribute, and 7% of the responses were undecided. Based on the
responses, Security will be captured under the Processes attribute.
Question 9: The responses to Question 9 varied tremendously based on the participants’
experience on what their organizations have done to address major integration issues and
challenges. The common responses were: 1) established a strong systems engineering
process; 2) gathered resources to fund additional meetings for experience workforce and
SMEs; 3) implementation of Tiger Team to get timely responses; 4) established risk
management processes; 4) clearly communicated requirements and goals; and 5)
emphasized the involvement of management.
Question 10 and 11: The focus of these questions was to understand if they heard about
IRL before reading it on this survey (Question 10) and if it would be useful based on
what they know about it now (Question 11). About half (54%) said they have not heard
about IRL. One of the primary reasons could be that TRL is only used in DoD

79
Acquisitions. However, about 90% of them believe that it would be useful to improve
systems integration based on introduction summary of the survey.
Question 12: There were 86% of the participants who responded to this question and their
responses on benefiting from knowing IRL levels early in the process are summarized
into three major areas that could help with the program and the system: 1) Improve risk
management throughout the program; 2) Planning for resources ahead of time to support
those risk areas; and 3) Identify critical path in schedule by better understanding the
complexity and timeframe of efforts and events. The major benefit would be to help with
decisions affecting areas of integration concerns and risks.
Questions 13 and 14: These two questions are related to understand how schedule delays
could impact integration readiness. The response was overwhelming in that schedule
delays would directly impact cost and resources. There were some agreement that IRL
could improve through time by better understanding of the system maturity and more
opportunities to do extra analyses; however, schedule would still negatively impact the
resources. There were responses that provided time can help mitigate some integration
risks with additional time to work through them, but time may also add scope and effort
that could increase cost.
Question 15: This question asked about overarching risk areas throughout the SoS
integration process. The responses to this question provided additional information on
what needs to be considered while defining the Integration Attributes. The responses
helped validate the need for the Attributes to be clearly defined and be able to capture
those responses into their definitions. There were 90% of the participants’ who provided
a response to this questions, which were all captured under the following risk areas: 1)

80
Interface and compatibility issues; 2) Definition of clear requirements; 3) Coordination
and communication between stakeholders; 4) Complexity of software and hardware
development; 4) Low production of systems to do tests and comparisons; 5) Prioritization
for limited resource; 6) Manage schedule and expectations; 7) Conducting Test and
Verification processes; 8) Cost overruns and resource planning; and 9) Technical
maturity of supporting systems.
Question 16: This question further expanded the previous question and allowed the
participants to provide examples on the cause(s) of the integration failures that they have
experienced. The responses are very similar to Question 15 with the same amount of
participants who responded (90%), and most have also referenced Question 15 as their
response to this question. The responses to the causes of integration failures include: 1)
Miscommunication and lack of proper coordination between management and
stakeholders; 2) Inadequate (or lack of) test and verification processes; 3) Requirements
creep throughout the process; 4) Implementation of weak systems engineering process; 5)
Mismanaging complexity; 6) Lack of personnel experience; 7) Lack of proper
documentation; and 8) Lack of clear, concise, and realistic requirements.
Question 17: This question provided the participants an opportunity to identify and
recommend areas to improve systems integration based on their experience, and 85% of
them responded. Their responses to this question included: 1) Establish realistic and
stable requirements and schedule; 2) Apply lessons learned from prior SoS integration
processes; 3) Must have the right expertise and experience working on the SoS
integration; 4) Implement effective and efficient communication processes; 5) Using
81
mature and well understood technologies; and 6) Establish strong systems engineering
processes.
Question 18: This question allowed the participants to provide the timeline to work
through their integration issues. Only 75% of the participants provided a response to this
question. Depending on the type of issue they experienced, the timeline to resolve the
issues took between 6 months to 15 years. This provided another reason why
understanding integration issues early can help mitigate some of the schedule risks
throughout the program.
Initial Assessment of the Survey Results:
All the results from the survey were evaluated to understand the impacts of
system integration. The results were insightful and provided validation of the usefulness
of the attributes as well as help frame their definitions. All the answers helped establish
the definition for each attribute, which can be very effective during the enhanced IRL
assessment process. The survey analysis provided the breakdown of the attributes and
how they are distributed during the IRL enhanced assessment process.
There were a total of 18 questions in the survey where some questions were for
clarification of their responses to prior questions. The survey participants were a very
experienced group, which had an average of 19.4 years of experience in their respective
field.
Of the 88 participants, only seven said they were not in complete agreement with
the attributes; however, their concerns were all addressed throughout the research process
and through the updated definition for each attribute. The concerns were: exclusion of

82
management guidance (addressed under Management); exclusion of concept of
operations, which is developed as part of the scope of integration (also a Management
task); exclusion of Model & Simulations (M&S) tools (addressed under Processes);
exclusion of overall planning (addressed under Management); exclusion of requirements
(which is outside of the focus of this research, but addressed in Problem Focus); and
exclusion of risk areas (technical risks were addressed in Complexity and overall
program risks are the output of the systems integration assessment framework). Most of
the survey participants agreed that given the right supporting tools, an enhanced IRL
assessment would be useful.
5.5 Survey Analysis
All 88 participants ranked the seven attributes in order and are summarized in
Table 5-4. The ranking of the attributes are distributed by having the #1 ranked attribute
equal to 7/7 (1.0). Values for the subsequent ranking: #2 is 6/7 (or 0.857), #3 is 5/7 or
(0.714), #4 is 4/7 (or 0.571), #5 is 3/7 (or 0.429), #6 is 2/7 (or 0.286), and #7 is 1/7 (or
0.143).

83
Table 5-4: Summary of Survey Results – Ranking Attributes
# Exp
(Yrs) Avail Compl Interop Mgmt Proc Resour Sched
1 39 1.000 0.857 0.714 0.571 0.429 0.286 0.143
2 35 0.143 0.714 0.571 0.286 1.000 0.857 0.429
3 40 0.571 0.714 0.857 1.000 0.429 0.286 0.143
4 34 0.714 0.857 1.000 0.429 0.571 0.286 0.143
5 16 0.857 0.143 0.286 0.714 0.571 1.000 0.429
6 13 0.286 0.143 0.714 0.857 0.571 1.000 0.429
7 35 0.571 0.429 0.286 0.857 0.714 1.000 0.143
8 3 0.571 0.429 0.143 0.857 0.286 1.000 0.714
9 20 0.571 0.429 0.143 1.000 0.714 0.857 0.286
10 8 0.286 0.143 0.429 0.714 1.000 0.857 0.571
11 36 0.571 1.000 0.857 0.429 0.286 0.714 0.143
12 20 0.286 0.571 0.429 1.000 0.857 0.714 0.143
13 16 1.000 0.857 0.571 0.286 0.429 0.714 0.143
14 3 0.714 0.571 0.143 1.000 0.286 0.857 0.429
15 21 1.000 0.429 0.286 0.714 0.143 0.857 0.571
16 11 0.571 0.429 0.286 1.000 0.857 0.714 0.143
17 4 0.571 0.143 0.286 0.429 0.714 1.000 0.857
18 30 0.571 0.714 0.857 0.286 1.000 0.429 0.143
19 3 0.571 0.430 0.287 1.000 0.713 0.857 0.143
20 20 1.000 0.143 0.857 0.286 0.429 0.714 0.571
21 16 0.143 0.857 0.571 0.714 1.000 0.429 0.286
22 10 0.286 1.000 0.857 0.714 0.429 0.571 0.143
23 20 0.429 0.143 0.286 1.000 0.714 0.857 0.571
24 36 0.857 0.286 0.143 0.571 0.429 1.000 0.714
25 14 0.429 1.000 0.857 0.571 0.143 0.714 0.286
26 15 0.286 0.857 0.143 0.429 0.571 0.714 1.000
27 8 0.714 0.286 0.143 0.857 1.000 0.429 0.571
28 35 0.857 1.000 0.571 0.429 0.286 0.143 0.714
29 27 0.286 0.429 0.571 1.000 0.143 0.857 0.714
30 12 0.143 0.857 0.286 0.714 0.571 1.000 0.429
31 13 0.571 0.286 0.143 1.000 0.714 0.857 0.429
32 25 0.857 1.000 0.143 0.571 0.429 0.286 0.714
33 16 0.571 0.714 0.286 0.857 0.143 1.000 0.429
34 50 0.571 1.000 0.857 0.286 0.714 0.429 0.143
35 11 0.571 0.714 0.429 0.286 0.143 1.000 0.857
36 25 0.714 1.000 0.571 0.429 0.857 0.286 0.143
37 9 0.286 0.714 0.143 1.000 0.571 0.857 0.429
38 18 0.571 0.286 0.143 1.000 0.429 0.857 0.714
39 12 0.286 0.429 0.714 1.000 0.571 0.143 0.857
40 18 0.714 0.857 0.429 0.143 0.571 1.000 0.286
41 14 0.714 0.857 0.143 0.286 0.571 1.000 0.429
42 16 1.000 0.571 0.286 0.714 0.429 0.143 0.857
43 15 0.571 0.286 0.429 0.857 1.000 0.714 0.143
44 4 0.143 0.429 0.286 1.000 0.571 0.857 0.714
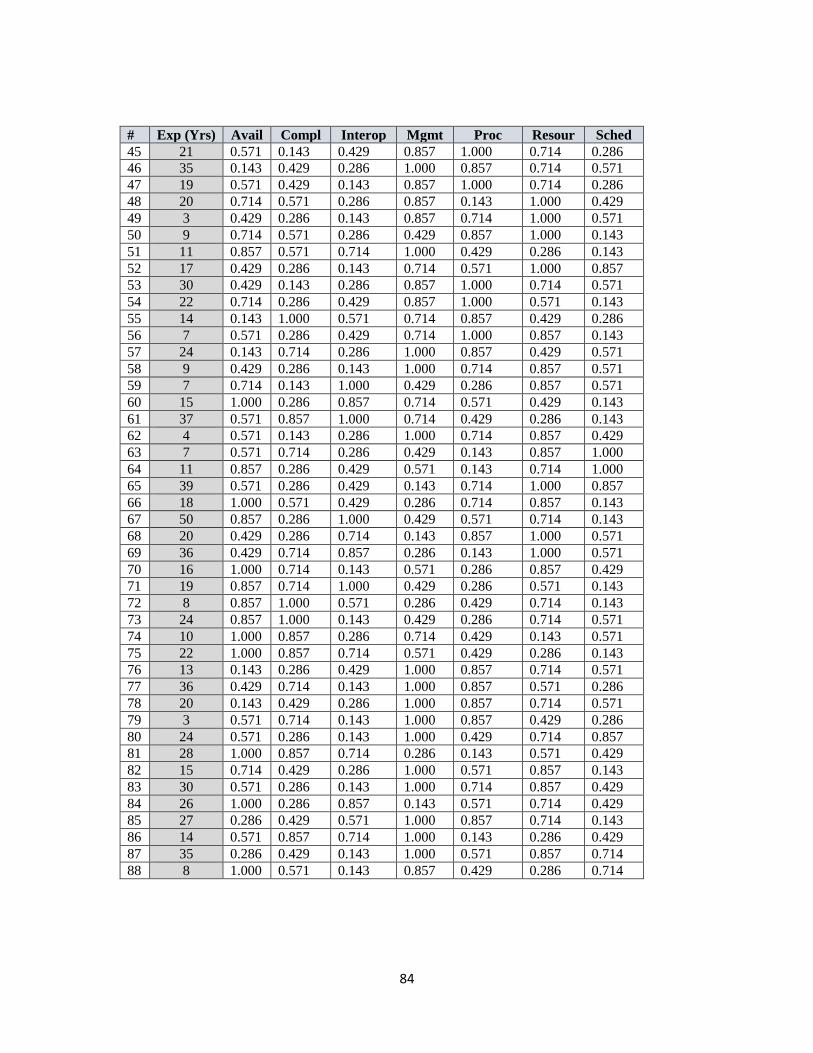
84
# Exp (Yrs) Avail Compl Interop Mgmt Proc Resour Sched
45 21 0.571 0.143 0.429 0.857 1.000 0.714 0.286
46 35 0.143 0.429 0.286 1.000 0.857 0.714 0.571
47 19 0.571 0.429 0.143 0.857 1.000 0.714 0.286
48 20 0.714 0.571 0.286 0.857 0.143 1.000 0.429
49 3 0.429 0.286 0.143 0.857 0.714 1.000 0.571
50 9 0.714 0.571 0.286 0.429 0.857 1.000 0.143
51 11 0.857 0.571 0.714 1.000 0.429 0.286 0.143
52 17 0.429 0.286 0.143 0.714 0.571 1.000 0.857
53 30 0.429 0.143 0.286 0.857 1.000 0.714 0.571
54 22 0.714 0.286 0.429 0.857 1.000 0.571 0.143
55 14 0.143 1.000 0.571 0.714 0.857 0.429 0.286
56 7 0.571 0.286 0.429 0.714 1.000 0.857 0.143
57 24 0.143 0.714 0.286 1.000 0.857 0.429 0.571
58 9 0.429 0.286 0.143 1.000 0.714 0.857 0.571
59 7 0.714 0.143 1.000 0.429 0.286 0.857 0.571
60 15 1.000 0.286 0.857 0.714 0.571 0.429 0.143
61 37 0.571 0.857 1.000 0.714 0.429 0.286 0.143
62 4 0.571 0.143 0.286 1.000 0.714 0.857 0.429
63 7 0.571 0.714 0.286 0.429 0.143 0.857 1.000
64 11 0.857 0.286 0.429 0.571 0.143 0.714 1.000
65 39 0.571 0.286 0.429 0.143 0.714 1.000 0.857
66 18 1.000 0.571 0.429 0.286 0.714 0.857 0.143
67 50 0.857 0.286 1.000 0.429 0.571 0.714 0.143
68 20 0.429 0.286 0.714 0.143 0.857 1.000 0.571
69 36 0.429 0.714 0.857 0.286 0.143 1.000 0.571
70 16 1.000 0.714 0.143 0.571 0.286 0.857 0.429
71 19 0.857 0.714 1.000 0.429 0.286 0.571 0.143
72 8 0.857 1.000 0.571 0.286 0.429 0.714 0.143
73 24 0.857 1.000 0.143 0.429 0.286 0.714 0.571
74 10 1.000 0.857 0.286 0.714 0.429 0.143 0.571
75 22 1.000 0.857 0.714 0.571 0.429 0.286 0.143
76 13 0.143 0.286 0.429 1.000 0.857 0.714 0.571
77 36 0.429 0.714 0.143 1.000 0.857 0.571 0.286
78 20 0.143 0.429 0.286 1.000 0.857 0.714 0.571
79 3 0.571 0.714 0.143 1.000 0.857 0.429 0.286
80 24 0.571 0.286 0.143 1.000 0.429 0.714 0.857
81 28 1.000 0.857 0.714 0.286 0.143 0.571 0.429
82 15 0.714 0.429 0.286 1.000 0.571 0.857 0.143
83 30 0.571 0.286 0.143 1.000 0.714 0.857 0.429
84 26 1.000 0.286 0.857 0.143 0.571 0.714 0.429
85 27 0.286 0.429 0.571 1.000 0.857 0.714 0.143
86 14 0.571 0.857 0.714 1.000 0.143 0.286 0.429
87 35 0.286 0.429 0.143 1.000 0.571 0.857 0.714
88 8 1.000 0.571 0.143 0.857 0.429 0.286 0.714

85
The results of the survey showed that almost all participants were in agreement
with the derived attributes. Using the multivariable regression analysis, the Normal
Probability Graph for all the attributes is shown Figure 5-2. Figure 5-2 illustrates how
the seven attributes are distributed based on their ranking and Table 5-5 shows the
resulting values for the ranked attributes. The Resources and Management attributes
have the highest percentage values for 1.0 (#1 of 7), which is the reason for their high
means. This is different from the data analysis where Interoperability, Processes, and
Complexity had the highest means. In contrast, the graph shows that Schedule has the
highest percentage values for 0.143 (#7 of 7), which is the reason for the lowest mean. In
comparison to the data analysis, Schedule also had the lowest mean.
Figure 5-2: Normal Probability Graph of Attributes (Ranked Values from the Survey)
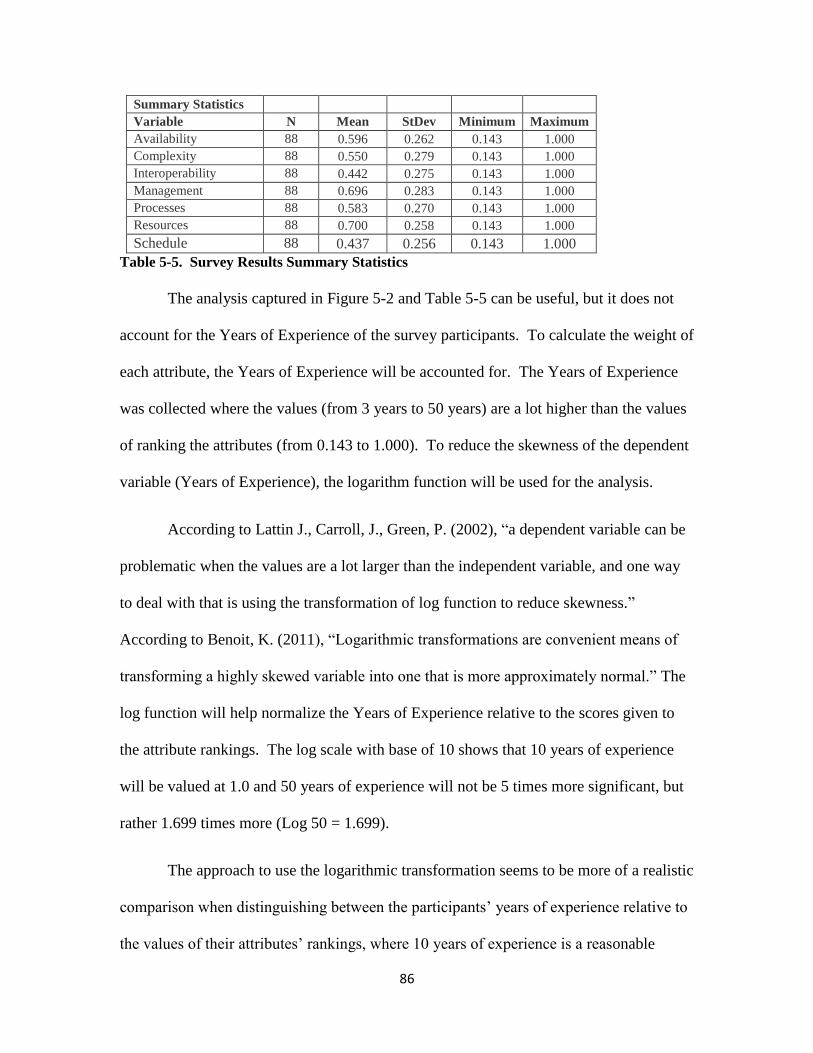
86
Summary Statistics
Variable N Mean StDev Minimum Maximum
Availability 88 0.596 0.262 0.143 1.000
Complexity 88 0.550 0.279 0.143 1.000
Interoperability 88 0.442 0.275 0.143 1.000
Management 88 0.696 0.283 0.143 1.000
Processes 88 0.583 0.270 0.143 1.000
Resources 88 0.700 0.258 0.143 1.000
Schedule 88 0.437 0.256 0.143 1.000
Table 5-5. Survey Results Summary Statistics
The analysis captured in Figure 5-2 and Table 5-5 can be useful, but it does not
account for the Years of Experience of the survey participants. To calculate the weight of
each attribute, the Years of Experience will be accounted for. The Years of Experience
was collected where the values (from 3 years to 50 years) are a lot higher than the values
of ranking the attributes (from 0.143 to 1.000). To reduce the skewness of the dependent
variable (Years of Experience), the logarithm function will be used for the analysis.
According to Lattin J., Carroll, J., Green, P. (2002), “a dependent variable can be
problematic when the values are a lot larger than the independent variable, and one way
to deal with that is using the transformation of log function to reduce skewness.”
According to Benoit, K. (2011), “Logarithmic transformations are convenient means of
transforming a highly skewed variable into one that is more approximately normal.” The
log function will help normalize the Years of Experience relative to the scores given to
the attribute rankings. The log scale with base of 10 shows that 10 years of experience
will be valued at 1.0 and 50 years of experience will not be 5 times more significant, but
rather 1.699 times more (Log 50 = 1.699).
The approach to use the logarithmic transformation seems to be more of a realistic
comparison when distinguishing between the participants’ years of experience relative to
the values of their attributes’ rankings, where 10 years of experience is a reasonable

87
amount to acquire relevant experience in systems engineering and acquisitions. The 10
years of experience usually gives the systems engineers and acquisition professionals
enough time to obtain beginning, intermediate, and advanced level certifications in DoD
acquisitions while gaining relevant experience to be considered experts. Conversely, log
1 year of experience is 0 where their inputs would not be considered due to their lack of
experience. Therefore, setting the logarithm with base 10 for the 10 years of experience
is reasonable. Tables 5-6 shows the calculated values of Log Years of Experience
multiplied to each ranking of the attributes in order to determine the weight of each
attribute ranking relative to years of experience.
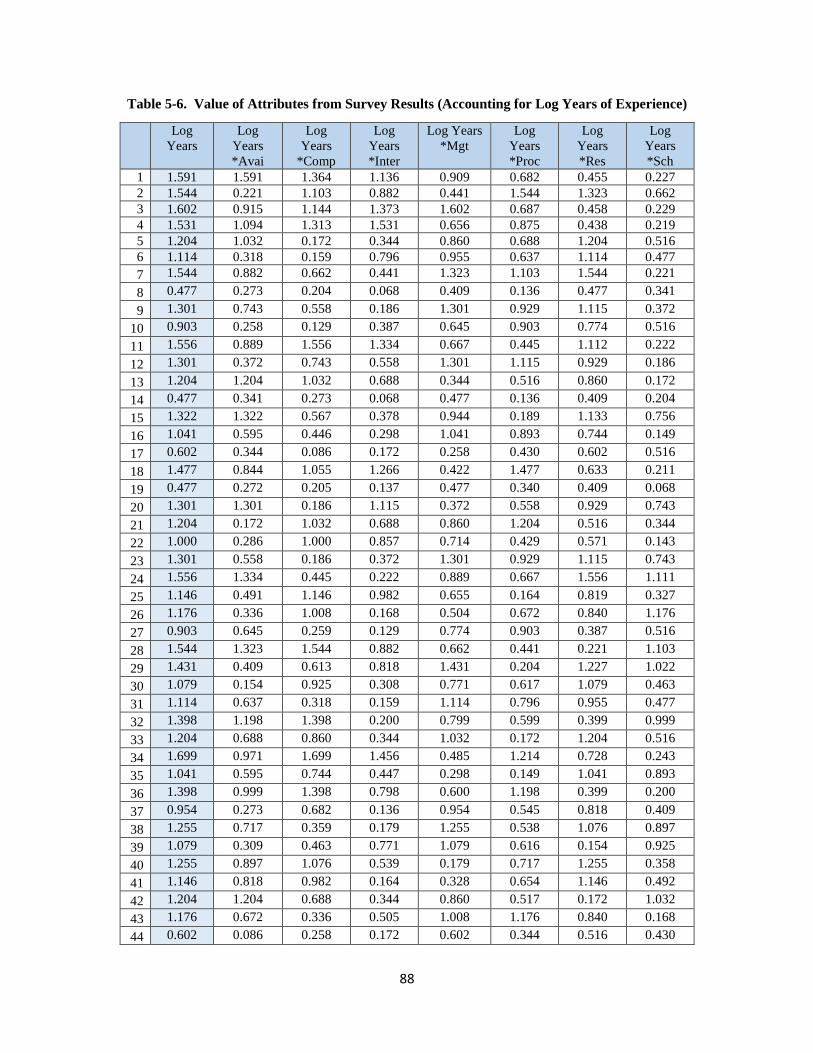
88
Table 5-6. Value of Attributes from Survey Results (Accounting for Log Years of Experience)
Log
Years
Log
Years
*Avai
Log
Years
*Comp
Log
Years
*Inter
Log Years
*Mgt
Log
Years
*Proc
Log
Years
*Res
Log
Years
*Sch
1 1.591 1.591 1.364 1.136 0.909 0.682 0.455 0.227
2 1.544 0.221 1.103 0.882 0.441 1.544 1.323 0.662
3 1.602 0.915 1.144 1.373 1.602 0.687 0.458 0.229
4 1.531 1.094 1.313 1.531 0.656 0.875 0.438 0.219
5 1.204 1.032 0.172 0.344 0.860 0.688 1.204 0.516
6 1.114 0.318 0.159 0.796 0.955 0.637 1.114 0.477
7 1.544 0.882 0.662 0.441 1.323 1.103 1.544 0.221
8 0.477 0.273 0.204 0.068 0.409 0.136 0.477 0.341
9 1.301 0.743 0.558 0.186 1.301 0.929 1.115 0.372
10 0.903 0.258 0.129 0.387 0.645 0.903 0.774 0.516
11 1.556 0.889 1.556 1.334 0.667 0.445 1.112 0.222
12 1.301 0.372 0.743 0.558 1.301 1.115 0.929 0.186
13 1.204 1.204 1.032 0.688 0.344 0.516 0.860 0.172
14 0.477 0.341 0.273 0.068 0.477 0.136 0.409 0.204
15 1.322 1.322 0.567 0.378 0.944 0.189 1.133 0.756
16 1.041 0.595 0.446 0.298 1.041 0.893 0.744 0.149
17 0.602 0.344 0.086 0.172 0.258 0.430 0.602 0.516
18 1.477 0.844 1.055 1.266 0.422 1.477 0.633 0.211
19 0.477 0.272 0.205 0.137 0.477 0.340 0.409 0.068
20 1.301 1.301 0.186 1.115 0.372 0.558 0.929 0.743
21 1.204 0.172 1.032 0.688 0.860 1.204 0.516 0.344
22 1.000 0.286 1.000 0.857 0.714 0.429 0.571 0.143
23 1.301 0.558 0.186 0.372 1.301 0.929 1.115 0.743
24 1.556 1.334 0.445 0.222 0.889 0.667 1.556 1.111
25 1.146 0.491 1.146 0.982 0.655 0.164 0.819 0.327
26 1.176 0.336 1.008 0.168 0.504 0.672 0.840 1.176
27 0.903 0.645 0.259 0.129 0.774 0.903 0.387 0.516
28 1.544 1.323 1.544 0.882 0.662 0.441 0.221 1.103
29 1.431 0.409 0.613 0.818 1.431 0.204 1.227 1.022
30 1.079 0.154 0.925 0.308 0.771 0.617 1.079 0.463
31 1.114 0.637 0.318 0.159 1.114 0.796 0.955 0.477
32 1.398 1.198 1.398 0.200 0.799 0.599 0.399 0.999
33 1.204 0.688 0.860 0.344 1.032 0.172 1.204 0.516
34 1.699 0.971 1.699 1.456 0.485 1.214 0.728 0.243
35 1.041 0.595 0.744 0.447 0.298 0.149 1.041 0.893
36 1.398 0.999 1.398 0.798 0.600 1.198 0.399 0.200
37 0.954 0.273 0.682 0.136 0.954 0.545 0.818 0.409
38 1.255 0.717 0.359 0.179 1.255 0.538 1.076 0.897
39 1.079 0.309 0.463 0.771 1.079 0.616 0.154 0.925
40 1.255 0.897 1.076 0.539 0.179 0.717 1.255 0.358
41 1.146 0.818 0.982 0.164 0.328 0.654 1.146 0.492
42 1.204 1.204 0.688 0.344 0.860 0.517 0.172 1.032
43 1.176 0.672 0.336 0.505 1.008 1.176 0.840 0.168
44 0.602 0.086 0.258 0.172 0.602 0.344 0.516 0.430

89
Log
Years
Log
Years
*Avai
Log
Years
*Comp
Log
Years
*Inter
Log Years
*Mgt
Log
Years
*Proc
Log
Years
*Res
Log
Years
*Sch
45 1.322 0.755 0.189 0.567 1.133 1.322 0.944 0.378
46 1.544 0.221 0.662 0.442 1.544 1.323 1.102 0.882
47 1.279 0.730 0.549 0.183 1.096 1.279 0.913 0.366
48 1.301 0.929 0.743 0.372 1.115 0.186 1.301 0.558
49 0.477 0.205 0.136 0.068 0.409 0.341 0.477 0.272
50 0.954 0.681 0.545 0.273 0.409 0.818 0.954 0.136
51 1.041 0.892 0.595 0.744 1.041 0.447 0.298 0.149
52 1.230 0.528 0.352 0.176 0.879 0.703 1.230 1.054
53 1.477 0.634 0.211 0.422 1.266 1.477 1.055 0.843
54 1.342 0.958 0.384 0.576 1.150 1.342 0.767 0.192
55 1.146 0.164 1.146 0.654 0.818 0.982 0.492 0.328
56 0.845 0.483 0.242 0.363 0.603 0.845 0.724 0.121
57 1.380 0.197 0.985 0.395 1.380 1.183 0.592 0.788
58 0.954 0.409 0.273 0.136 0.954 0.681 0.818 0.545
59 0.845 0.603 0.121 0.845 0.363 0.242 0.724 0.483
60 1.176 1.176 0.336 1.008 0.840 0.672 0.505 0.168
61 1.568 0.895 1.344 1.568 1.120 0.673 0.449 0.224
62 0.602 0.344 0.086 0.172 0.602 0.430 0.516 0.258
63 0.845 0.483 0.603 0.242 0.363 0.121 0.724 0.845
64 1.041 0.892 0.298 0.447 0.595 0.149 0.744 1.041
65 1.591 0.908 0.455 0.683 0.228 1.136 1.591 1.364
66 1.255 1.255 0.717 0.539 0.359 0.896 1.076 0.180
67 1.699 1.456 0.486 1.699 0.729 0.970 1.213 0.243
68 1.301 0.558 0.372 0.929 0.186 1.115 1.301 0.743
69 1.556 0.668 1.111 1.334 0.445 0.223 1.556 0.889
70 1.204 1.204 0.860 0.172 0.688 0.344 1.032 0.517
71 1.279 1.096 0.913 1.279 0.549 0.366 0.730 0.183
72 0.903 0.774 0.903 0.516 0.258 0.387 0.645 0.129
73 1.380 1.183 1.380 0.197 0.592 0.395 0.985 0.788
74 1.000 1.000 0.857 0.286 0.714 0.429 0.143 0.571
75 1.342 1.342 1.150 0.958 0.767 0.576 0.384 0.192
76 1.114 0.159 0.319 0.478 1.114 0.955 0.795 0.636
77 1.556 0.668 1.111 0.223 1.556 1.334 0.889 0.445
78 1.301 0.186 0.558 0.372 1.301 1.115 0.929 0.743
79 0.477 0.272 0.341 0.068 0.477 0.409 0.205 0.136
80 1.380 0.788 0.395 0.197 1.380 0.592 0.985 1.183
81 1.447 1.447 1.240 1.033 0.414 0.207 0.826 0.621
82 1.176 0.840 0.505 0.336 1.176 0.672 1.008 0.168
83 1.477 0.843 0.422 0.211 1.477 1.055 1.266 0.634
84 1.415 1.415 0.405 1.213 0.202 0.808 1.010 0.607
85 1.431 0.409 0.614 0.817 1.431 1.227 1.022 0.205
86 1.146 0.654 0.982 0.818 1.146 0.164 0.328 0.492
87 1.544 0.442 0.662 0.221 1.544 0.882 1.323 1.102
88 0.903 0.903 0.516 0.129 0.774 0.387 0.258 0.645
90
Figure 5-3 illustrates the values of the ranked attributes from the survey
accounting for the Log Years of Experience of each participant. The resulting numbers
for the regression analysis is covered in 5-7a & b. Accounting for the Log Years of
Experience did not produce significant changes among the weights of each attribute
relative to each other. Figure 5-3 still shows that the Resources and Management
attributes still have the highest values in the graphs, while Schedule attribute has the
lowest value. One of the reasons for the Resources and Management values is the
thought that these two attributes are enablers of the other attributes. For example,
Management needs to approve funding (Resources) in order to execute the integration
activities. Because of the attention these two attributes get in program offices, they can
also be resolved before being captured as issues in the DOT&E Annual Reports. The
Schedule attribute has a low value for both the data and survey analyses because it is
usually caused by one of the other attributes (i.e. a Complexity related issue caused the
delay of the scheduled integration activities). However, schedule (planning and
execution) is still critical to the success of SoS integration, and needs to be considered as
a separate attribute.
Table 5-7a shows the resulting values of the means and standard deviations for
each attribute, with the lowest to highest means is still the same order as when not taking
the Years of Experience into account. The null hypothesis for this analysis is that data
follow a normal distribution. According to the P-Values in Table 5-7b, only Resources is
greater than 0.05, which shows the data follow a normal distribution.

91
Figure 5-3: Normal Probability Graph for Survey Results (with Log Years of Experience)
Summary Statistics
Variable N Mean StDev Minimum Maximum
Availability 88 0.719 0.382 0.086 1.591
Complexity 88 0.676 0.410 0.086 1.699
Interoperability 88 0.559 0.415 0.068 1.699
Management 88 0.815 0.383 0.179 1.602
Processes 88 0.700 0.379 0.121 1.544
Resources 88 0.824 0.357 0.143 1.591
Schedule 88 0.512 0.323 0.068 1.364
Table 5-7a. Survey Results Mean & Standard Deviation w/ Log Years of Experience
Source P-Value
Availability 0.0307
Complexity <0.0050
Interoperability <0.0050
Management 0.0431
Processes 0.0220
Resources 0.1927
Schedule <0.0050
Table 5-7b. Survey Results Mean & Standard Deviation w/ Log Years of Experience

92
5.6 Comparison of Results
Using the results from the data analysis and survey analysis, the weights of the
attributes were calculated. Figure 5-4 illustrates the process to derive the weight of each
attribute. Both sets of data (data results and survey results) have different focus from one
another: 1) the data collection focuses on the number of attributes identified in the 16
years of space systems integration; and 2) the survey results focuses on the ranking of the
attributes with the given year of experience of the participants. However, the data
derived from the two sets provide significant input to understanding how the attributes
can be distributed during integration assessment.
Figure 5-4. Research Framework to Derive Weights of Attributes

93
The data and survey analyses measure different values; therefore, the approach to
compare the two is to evaluate the mean and standard deviation each attribute evaluated
in each set. Each attribute is given a weighted percentage value relative to the other
attributes (for each set). The weight of each attribute is calculated by comparing between
the Data Mean & Standard Deviation and the Survey Mean & Standard Deviation
analyses as shown in Table 5-8a and b.
Table 5-8a. Mean and Standard Deviation for Integration Data and Survey Results
Comparing
Analyses
Int Data,
Mean
Int Data,
Std Dev
Survey,
Mean
Survey,
Std Dev
Availability 2.188 1.601 0.719 0.382
Complexity 3.188 3.656 0.676 0.410
Interoperability 4.000 2.921 0.559 0.415
Management 2.313 1.448 0.815 0.383
Processes 3.250 2.840 0.700 0.379
Resources 1.000 1.155 0.824 0.357
Schedule 1.000 1.033 0.512 0.323
Table 5-8b. Percentage of each Mean and Standard Deviation for Integration Data and Survey Results
Weight
Int Data,
Mean
Int Data,
High
Int Data,
Low
Survey,
Mean
Survey,
High
Survey,
Low
Availability 12.9% 12.0% 25.7% 15.0% 14.8% 15.6%
Complexity 18.8% 21.7% -20.5% 14.1% 14.6% 12.3%
Interoperability 23.6% 21.9% 47.2% 11.6% 13.1% 6.7%
Management 13.7% 11.9% 37.8% 17.0% 16.1% 20.1%
Processes 19.2% 19.3% 17.9% 14.6% 14.5% 14.9%
Resources 5.9% 6.8% -6.8% 17.2% 15.9% 21.7%
Schedule 5.9% 6.4% -1.4% 10.7% 11.2% 8.8%

94
5.7 Weights of Attributes
Based on the percentage for each attribute, there are a lot of disconnects between
the integration data analysis and the expert survey analysis on how the attributes should
be weighted. The closest numbers for the Data and Survey are Availability at about 12.9-
15% and Management at about 13.7-17%. Using the standard deviation, the High and
Low for the means have also been calculated. The percentages for the High and Low
values show significant variances. In this case, using the average of two means will
provide a better estimate to use as the final weight of each attribute (Table 5-9).
Table 5-9. Derived Weight of Each Attribute
Avg Weight
Mean
Total
Final
Weight
Availability 27.9% 13.9%
Complexity 32.9% 16.4%
Interoperability 35.2% 17.6%
Management 30.7% 15.4%
Processes 33.8% 16.9%
Resources 23.1% 11.5%
Schedule 16.6% 8.3%

95
CHAPTER 6: CONCLUSION
6.1 Final Criteria of Attributes
One of the major goals throughout the research was to define each attribute (and
understand the integration variables aligned to each attribute) so that they can be useful
throughout the systems integration process. When they were initially introduced, some of
the attributes could be interpreted similar to the other attributes based on how they were
used. Despite the initial assumptions in Section 3.6 about the data collection clearly
explaining each attribute, there were still some uncertainties on how each attribute would
be defined.
Executing the research process by utilizing all the literature references, the
collected data, and the survey, the results and analyses have proven that the criteria to
define each attribute can be refined further. The data collection and analysis helped
identify the attributes and the survey results and analysis helped refine the definitions of
each attribute. Refining the criteria also helped to distinguish each attribute from one
another. The final criteria to define each attribute are summarized in Table 6-1.
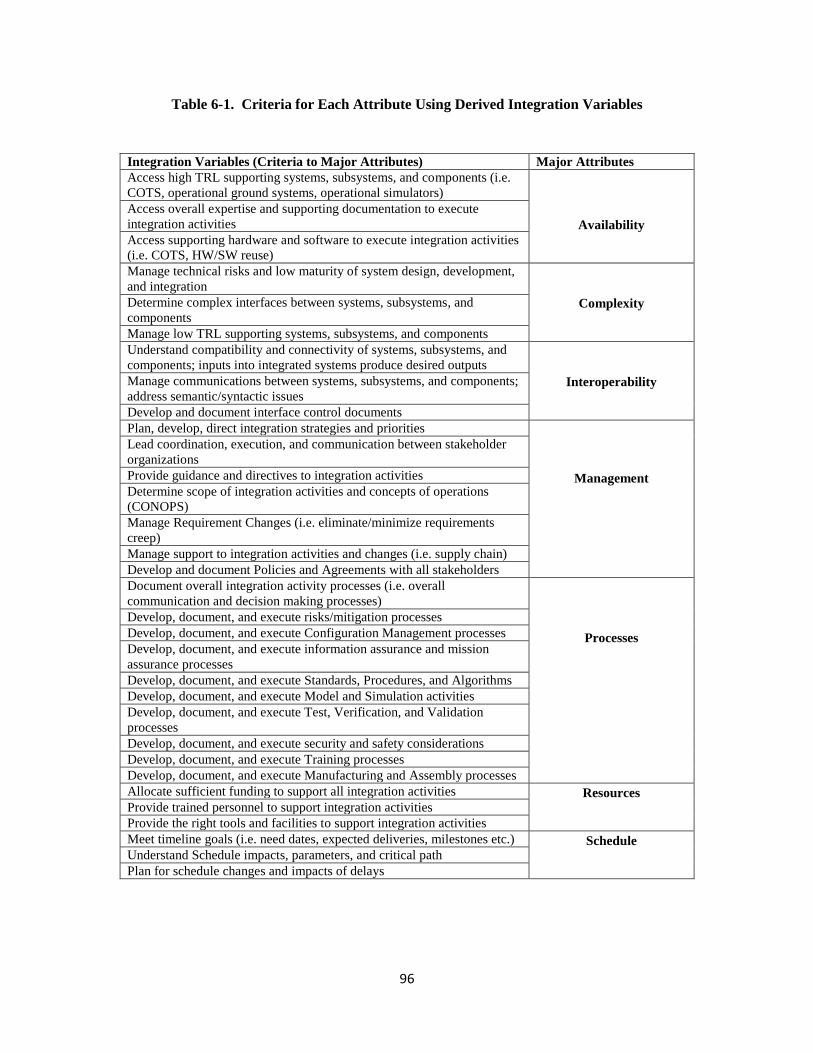
96
Table 6-1. Criteria for Each Attribute Using Derived Integration Variables
Integration Variables (Criteria to Major Attributes) Major Attributes
Access high TRL supporting systems, subsystems, and components (i.e.
COTS, operational ground systems, operational simulators)
Availability
Access overall expertise and supporting documentation to execute
integration activities
Access supporting hardware and software to execute integration activities
(i.e. COTS, HW/SW reuse)
Manage technical risks and low maturity of system design, development,
and integration
Complexity
Determine complex interfaces between systems, subsystems, and
components
Manage low TRL supporting systems, subsystems, and components
Understand compatibility and connectivity of systems, subsystems, and
components; inputs into integrated systems produce desired outputs
Interoperability
Manage communications between systems, subsystems, and components;
address semantic/syntactic issues
Develop and document interface control documents
Plan, develop, direct integration strategies and priorities
Management
Lead coordination, execution, and communication between stakeholder
organizations
Provide guidance and directives to integration activities
Determine scope of integration activities and concepts of operations
(CONOPS)
Manage Requirement Changes (i.e. eliminate/minimize requirements
creep)
Manage support to integration activities and changes (i.e. supply chain)
Develop and document Policies and Agreements with all stakeholders
Document overall integration activity processes (i.e. overall
communication and decision making processes)
Processes
Develop, document, and execute risks/mitigation processes
Develop, document, and execute Configuration Management processes
Develop, document, and execute information assurance and mission
assurance processes
Develop, document, and execute Standards, Procedures, and Algorithms
Develop, document, and execute Model and Simulation activities
Develop, document, and execute Test, Verification, and Validation
processes
Develop, document, and execute security and safety considerations
Develop, document, and execute Training processes
Develop, document, and execute Manufacturing and Assembly processes
Allocate sufficient funding to support all integration activities Resources
Provide trained personnel to support integration activities
Provide the right tools and facilities to support integration activities
Meet timeline goals (i.e. need dates, expected deliveries, milestones etc.) Schedule
Understand Schedule impacts, parameters, and critical path
Plan for schedule changes and impacts of delays

97
6.2 Integration Assessment Framework Development
The integration requirements are addressed through an architectural framework,
which according to Jain, R., Chandrasekaran, A., and Erol, O. (2010), “includes in both
the physical and functional architectures of the system.” With the final criteria providing
clear definition of each attribute in Table 6-1 and with the weights of the attributes
derived from the data and survey analyses (Section 5.7), an integration assessment
framework was developed to help understand integration feasibility. When the models of
a system are related through transformation, the collective frames can be referred to as a
framework (Lin C et al., 2009).
In architectural framework, understanding how the problem is framed is the most
important step because it helps define the subsequent steps. Frameworks and standards
define what should be modeled as opposed to which models should be used and how
these models are related to each other (Zalewski A, Kijas S, 2013). According to Martin,
J. (2008), “problem framing techniques have been found to be useful in avoiding rework
and maximizing results.” Architectural approaches include conveying options, change,
and implications, as well as identifying easier traceability by providing agile
documentation (Tyree J, Akerman A, 2005). The change based on initial IRL scores to
enhanced IRL scores supports this approach. Architecture analysis includes key
foundation that provides consistency, data completeness and transformation, lack of
ambiguity, and flexibility to support iterative process (Ge B, Hipel K, Chen Y, 2014).
Static Analysis is used in which, according to Ge, B. et al. (2013), helps leverage “static
architectural models for analyzing and comparing the associations captured from the data
elements.”

98
The resulting systems integration assessment framework to facilitate SoS
integration is illustrated in Figure 6-1.
Figure 6-1. Systems Integration Assessment Framework

99
Framework Description
New Capabilities: This block introduces the new capability (ies) into the SoS.
Integration Requirements: This block is the development of Integration
Requirements based on the New Capabilities
Scope of Integration: This block identifies the scope of integration and defines
the limitations of the integration process based on the requirements.
Integration Activities: This block defines the integration activities based on the
scope of integration that was determined
Family of Systems: This block defines the potential impacts of the integration
activities into the Family of Systems. Based on the criticality, it may impact the
integration requirements and foster change.
Initial IRL Assessment:
o One of the initial steps of the framework is to determine the IRL value of
the integration items supporting each attribute by using the current IRL
principles and definitions as guidelines. Table 6-2a & b provides the
guidance on how initial IRL for each attribute are defined using the IRL
principles between systems as opposed to IRL principles between
technologies.
o Approaches to determine initial readiness level include: 1) Individual
estimation by a SME; 2) Group discussion estimation through meeting or
conference; and 3) Individual-group estimation where SMEs completes
independent estimations and then discuss them with a group for a
consensus decision (Tan W, Ramirez-Marquez J, Sauser B, 2011). Some

100
of the current techniques that can be used to formulate the estimate of
initial readiness level assessment also include educated guess (not enough
knowledge and not enough time), analogy (comparing prior work), and
standards (developed within different organizations) (Tan W, Ramirez-
Marquez J, Sauser B, 2011). Using the framework for systems integration
will be an iterative process.
Integration Variables: This sets of blocks explain the areas of focus during the
systems integration assessment
Attributes: This set of blocks include the defined integration attributes with their
calculated weights toward the SoS integration
Enhanced IRL Score: This block is the resulting IRL after each assessment
Validate IRL Score: This block represents the validation of the enhanced IRL
score and an opportunity to identify risk areas. It also an opportunity to determine
options to adjust scope if necessary
Stakeholder Decision: This block allows the Stakeholders to evaluate the
validated score and make decisions to either move forward with the current
process, make adjustments to risk areas, or make adjustments to the scope of
integration

101
IRL
Lvl
IRL
Principles
IRL
Availability
IRL
Complexity
IRL
Interoperability
1 Interface between systems
have been identified
All currently available and
unavailable supporting
integration items (systems,
subsystems, components,
expertise, and documentation)
are identified
Complexity and technical
risks areas of design,
development, and integration
are identified
Interfaces and
connectivity areas of
systems, subsystems, and
components items are
identified
2 Interaction between systems
have been specifically
characterized
Available and unavailable items
are characterized
Technical risk areas are
characterized
Interaction between items
are characterized
3 There is compatibility
between systems
Initial plans to obtain
unavailable items are
compatible with overall strategy
Initial mitigation strategies
are compatible to technical
risk areas
Interoperability strategies
are compatible with
integration activities
4 Sufficient detail in quality
and assurance between
systems
Plans to obtain unavailable
items provide sufficient details
Sufficient detail for
mitigation strategies are
defined
Interoperability strategies
have sufficient details
5 Sufficient control between
systems necessary to
establish, manage &
terminate integration
Plans are delivered and have
sufficient control
Proposed mitigation
strategies are delivered and
have sufficient control
Proposed strategies are
delivered and have
sufficient control
6 Accept, translate, and
structure information
between systems
Proposed plans are accepted and
executed
Mitigation strategies are
accepted
Proposed strategies are
accepted and executed
7 Integration between systems
has been verified and
validated
Plans are verified and validated Mitigation strategies are
verified and validated
Proposed strategies are
verified and validated
8 Actual integration
completed & mission
qualified
All items are delivered and
mission qualified
Mitigation strategies are
mission qualified
Proposed strategies are
mission qualified
9 Integrated systems are
mission proven
All items are mission proven Mitigation strategies are
mission proven
Proposed strategies are
mission proven
Table 6-2a. Guidelines to Initial IRL for each Attribute Using IRL Principles (Part I)

102
IRL
Lvl
IRL
Definition
IRL
Management
IRL
Processes
IRL
Resources
IRL
Schedule
1 Interface between
systems have been
identified
Strategies, scope,
requirements, and
priorities are identified
All integration
activity processes are
identified
All resources and
funding risks to support
integration are
identified
Detailed integration
schedule and
schedule risks are
identified
2 Interaction between
systems have been
specifically
characterized
Key management
decisions are
characterized
Processes are
characterized
All resources and
funding risks are
characterized
All schedule item
and risks are
characterized
3 There is compatibility
between systems
Current strategies are
compatible with
Management decisions
Processes are
documented and are
compatible with
management
strategies
Initial mitigation
strategies to funding
risks are compatible
with integration
strategy
Initial mitigation
strategies to
schedule risks are
compatible with
integration strategy
4 Sufficient detail in
quality and assurance
between systems
Management strategies
have sufficient detail
in quality and
assurance
Processes are
sufficient detail in
quality and assurance
Mitigation strategies
have sufficient detail in
quality and assurance
Mitigation strategies
have sufficient detail
in quality and
assurance
5 Sufficient control
between systems
necessary to establish,
manage & terminate
integration
Management strategies
are implemented with
sufficient control
Processes are
documented with
sufficient control
Mitigation strategies
are delivered with
sufficient control
Mitigation strategies
are delivered with
sufficient control
6 Accept, translate, and
structure information
between systems
Management
strategies, goals, and
scope are accepted and
executed
Processes are
accepted and
executed
Mitigation strategies for
funding risks are
accepted and executed
Mitigation strategies
for schedule risks
are accepted and
executed
7 Integration between
systems has been
verified and validated
Management strategies
are verified and
validated
Processes are verified
and validated
Mitigation strategies
are verified and
validated
Mitigation strategies
are verified and
validated
8 Actual integration
completed & mission
qualified
Management strategies
are mission qualified
Processes are mission
qualified
Mitigation strategies
are mission qualified
Mitigation strategies
are mission qualifed
9 Integrated systems are
mission proven
Management strategies
are mission proven
Processes are mission
proven
Mitigation strategies
are mission proven
Mitigation strategies
are mission proven
Table 6-2b. Guidelines to Initial IRL for each Attribute Using IRL Principles (Part II)

103
6.3 Systems Integration Assessment Framework Application
The process of using the Systems Integration Assessment Framework is as
follows:
1. SoS integration begins with the concept of integrating new capabilities into a family
of systems or SoS.
2. Clear integration requirements are provided and approved by the stakeholders.
3. The Scope of Integration (i.e. cost, schedule, Concept of Operations etc.) is
determined by the Stakeholders.
4. Based on the scope, the Integration Activities are identified and evaluated to
determine if the activities impact the Family of Systems. The Integration
Requirements, Scope of Integration, and/or Integration Activities may be adjusted if
the Integration Activities negatively impacts the Family of Systems.
5. To begin understanding the overall feasibility of integration, the stakeholders and
designated SMEs determine IRL score for the integration variables (or major areas of
concern) under each attribute.
6. Using IRL principles (as described in Table 6-2a & b), the initial IRL value for each
attribute is determined.
Each of the integration variable under each attribute are evaluated using the
Guidelines in Table 6-2a & b; the lowest IRL value (as described in Table 6-2a &
b) will be used as the attribute’s IRL value. For example, the integration variables
defined in the Availability attribute are supporting system’s software and
hardware, personnel, and documents. If software is IRL 6, hardware is IRL 5,
personnel is IRL 4, and documents are IRL 6, then the Availability attribute’s IRL

104
value (IRLAvailability) is 4, which is lowest IRL value of the integration
variables (Personnel). Like TRL evaluation, the IRL value cannot be higher than
the lowest value of its constituents (Leete S et al., 2015).
7. The derived weighted percentages are used to determine the enhanced IRL score for
the SoS (IRLSoS). The resulting equation becomes:
IRLSoS = (IRLAvailability x 0.139) + (IRLComplexity x 0.164) +
(IRLInteroperability x 0.176) +
(IRLManagement x 0.154) + (IRLProcesses x 0.169) + (IRLResources x 0.115) +
(IRLSchedule x 0.083)
8. The Enhanced IRL score (IRLSoS) will be rounded down to lower whole number (i.e.
IRLSoS = 4.5 will have the IRL score of 4). The IRL definition for each level in
Table 6-2a & b will explain the IRL enhanced score, which provides the overall
integration level at that point in time.
9. Stakeholders evaluate and validate the enhanced IRL score, identify risk areas, and
determine options to adjust the integration variables under each attribute and/or adjust
the scope of integration if necessary.
10. Determining integration feasibility is an iterative process and this framework allows
the stakeholders to look at options to improve the areas of emphasis (low IRL levels)
when new information is obtained.
11. Assessment of IRL can also be tied into major events and reviews throughout the
development and deployment processes. It allows program managers to make
adjustments to their program based on the results of the IRL assessment.
105
Application in DoD Acquisition Process
The System Integration Assessment Framework can be applied throughout the
DoD Acquisition Process. The framework can be implemented after the new
capabilities’ system requirements are developed and Materiel Solution Analysis is
completed (post-Milestone A of the DoD programs). An integration assessment can be
conducted as part of the TRA process and as the system matures, it is likely that more
relevant information is received and helps improve SoS integration. Therefore,
continuous use of this framework would be beneficial for the program managers, which
will help them understand and improve the lower IRL areas. Formal program reviews
such as System Requirements Review, System Functional Review, Preliminary Design
Review, and Critical Design Review would be optimal events to apply this framework
and assess the feasibility of systems integration.
Framework Application Examples
To fully understand the application of the integration assessment framework tool,
two fictional case examples are provided. The first example includes an experimental
space sensor payload to be integrated into a communication satellite family of systems.
The second example includes a new software capability to account for new business areas
that needs to be integrated into the current operational software enterprise System of
Systems.

106
CASE 1 Example: Experimental Payload integration into Operational Communication
Satellite Family of Systems
1. Integration Requirements:
a. Integrate an experimental payload (X1) into the next set of operational
communication satellites (CS2) to measure capability (i.e. measure
communication interference) and integrate entire satellite system into the
already established operational communication satellite (OCS) family of
systems
b. Integration requirements architecture is illustrated in Figure 6-2:
Figure 6-2. Case 1 Example: Integration of X1 payload into OCS Family of Systems
2. Scope of Integration:
a. Integration cost is estimated at $30M
b. Integration schedule is 24 months to make X1 operational
c. Current integration scope does not include the CS2 integration with OCS
integration. CS2 is the primary payload that shares the satellite bus with X1.
OCS Family of Systems
Ground Systems
Launch Vehicle
X1 Payload CS2 Payload
& Sat Bus
Experimental Capability
X1 User

107
3. Integration Activities (as illustrated in Figure 6-2):
a. Integrate X1 into: 1) CS2 Payload and Satellite Bus; 2) Ground Systems; 3)
Launch Vehicle; and 4) OCS Family of Systems
b. Stakeholders and SMEs determined the major integration variables under each
attribute
4. Family of Systems: Defined integration activities do not negatively impact the OCS
5. Initial IRL Assessment (using Tables 6-2a and 6-2b as IRL level guidelines):
a. Availability: IRL=8
i. All supporting systems (software, hardware, documentation and expert
personnel) have been identified, delivered, and mission qualified.
b. Complexity: IRL=5 (lowest score from integration variables under
Complexity)
i. Complexity of design: Two major preliminary designs (X1 and CS2)
are complete and mitigation strategies are accepted. IRL=6
ii. Complexity of their integration to OCS: proposed strategies have been
defined, delivered, and have sufficient control. IRL=5
c. Interoperability: IRL=6 (lowest score from integration variables under
Interoperability)
i. X1 to CS2: Integration of size, weight, communication links, and
power have been determined; strategies are accepted and executed.
IRL=6
ii. X1 to Ground Systems: proposed strategies are mission proven. IRL=9
iii. X1 to Launch Vehicle: proposed strategies are mission proven. IRL=9

108
iv. X1 to OCS: strategies are accepted and executed. IRL=6
d. Management: IRL=6
i. Management has provided strategies, goals, and scope that are
accepted and executed.
e. Processes: IRL=3 (lowest score from integration variables under Processes)
i. Documentation Processes: Interface Control Documents (ICDs) are
documented and compatible with management strategies. IRL=3
ii. Testing processes: Test Plans are in sufficient detail in quality and
assurance. IRL=4
iii. Development processes are all mission proven. IRL=9.
f. Resources: IRL=7
i. There are enough resources to cover the estimated $30M estimate;
personnel, facilities, and tools are verified and validated.
g. Schedule: IRL=3
i. Current 24-month schedule may be a medium risk; compatible with
integration strategy but does not have sufficient detail.
6. Enhanced IRL Score is equal to:
IRLSoS = (IRLAvailability x 0.139) + (IRLComplexity x 0.164) +
(IRLInteroperability x 0.176) + (IRLManagement x 0.154) + (IRLProcesses x 0.169)
+ (IRLResources x 0.115) + (IRLSchedule x 0.083)
IRLSoS = (8 x 0.139) + (5 x 0.164) + (6 x 0.176) + (6 x 0.154) + (3 x 0.169) + (7 x
0.115) + (3 x 0.083) = 5.473
109
7. The calculated IRLSoS is 5.473. The IRLSoS is rounded to the lower whole number
(IRL 5), which means there is sufficient control between systems necessary to
establish, manage & terminate integration. If this is a DoD Acquisition Program, it
would not pass the minimum IRL 6 to move into the Engineering & Manufacturing
Development (EMD) Phase. Therefore, additional emphasis to the lower valued
attributes needs to be addressed by the Stakeholders before another IRL assessment
can be completed.
8. The current DoD Acquisition process requires a TRL value of 6 or more to be
approved to enter into the EMD phase. Since the Complexity attribute includes the
system design and technologies to achieve TRL value, addressing Complexity would
be a primary responsibility in order to improve both the TRL and IRL values from
Level 5.
9. Once the stakeholders agree on how to address the attributes’ low IRL values and
implement the strategies to improve them, the IRLSoS is calculated again. The goal
is to have IRL 8 (actual integration completed & mission qualified) prior to
operations.

110
CASE 2: The requirement is to integrate a new software capability to account for new
business areas into the current operational enterprise software System of Systems.
1. Integration Requirements:
a. Integrate the company’s new business segment (NBS) software to account for
newly acquired business areas into the company’s current multi-segment
operational enterprise software (OES) system of systems. The OES includes
the customer segment, logistics management segment, employee segment,
financial management segment, marketing segment, and partners segment.
b. Integration requirements architecture is illustrated in Figure 6-3:
Figure 6-3. Case 2 Example: Integration of NBS into OES System of Systems
2. Scope of Integration:
a. Integration Cost is estimated at $10M
b. Integration schedule is 12 months to make NBS operational
3. Integration Activities (as illustrated in Figure 6-3):
a. Integrate NBS to: 1) Software Test Platform; 2) Operational Support; and 3)
OES SoS
New Business Segment (NBS)
Software
SW Test Platform
OES SoS
Operational Support
(Sys Admin)
New Business Area
Users

111
b. Stakeholders and SMEs determined the major integration variables under each
attribute
4. Family of Systems: Defined integration activities do not negatively impact the OES
and its segments
5. Initial IRL Assessment (using Tables 6-2a and 6-2b as IRL level guidelines):
a. Availability: IRL=2 (lowest score from major Availability areas)
i. COTS software, hardware, and documentation are delivered and
mission qualified. IRL=8
ii. Expert personnel (specialized coders and testers) are unavailable but
have been characterized. IRL=2
b. Complexity: IRL=5 (lowest score from major Complexity areas)
i. The design to the NBS software has sufficient detail for mitigation
strategies are delivered and have sufficient control. IRL=5
ii. Complexity of integrating to OES has mitigation strategies accepted.
IRL=6
c. Interoperability: IRL=4 (lowest score from major Interoperability areas)
i. NBS to SW Test: New software to test has proposed strategies that are
verified and validated. IRL=7
ii. NBS to Ops Support: New software done before so proposed strategies
is mission proven. IRL=9
iii. NBS to OES: Interoperability strategies have sufficient details. IRL=4
d. Management: IRL=6
i. Management strategies are verified and validated. IRL=6

112
e. Processes: IRL=4 (lowest score from major Processes areas)
i. Documentation Processes are mission proven. IRL=9
ii. Test processes have sufficient detail in quality and assurance. IRL=4
iii. Software development processes are mission proven. IRL=9.
f. Resources: IRL=6
i. Mitigation for funding risks of $10M are accepted and executed.
g. Schedule: IRL=6
i. Mitigation risks for schedule are accepted and executed.
6. Enhanced IRL Score is equal to:
IRLSoS = (2 x 0.139) + (5 x 0.164) + (4 x 0.176) + (6 x 0.154) + (4 x 0.169) + (6 x
0.115) + (6 x 0.083) = 4.590
7. The current IRLSoS is 4.590. The IRLSoS is rounded to the lower whole number
(IRL 4), which means that there is sufficient detail in quality and assurance between
systems. Since this is a business SoS, it does not follow the DoD acquisition process.
However, the assessment provides areas of emphasis to improve before completing
another IRL assessment.
8. The goal is to have the actual integration completed and mission qualified (IRL 8)
before it can be fully integrated into the OES SoS.
9. The advantage of this SoS is having a Software Test Platform to continue improving
lower IRL areas and qualifies them before integrating into the OES SoS for
operational use.
113
6.4 Discussion
Throughout the research process, there were several assumptions and challenges
that helped shape the direction of the research. The initial approach to collect the desired
data through interview of integration experts was not feasible and the approach to
validate those data would not be clearly defined. Through refinement of the research
process, the effort to research and collect DoD space systems integration data through
documented reports have provided a more defined focus. The timeframe of the data
collected from 1999 to 2014 provided significant insight to the behavior of the systems
regarding systems integration. Extracting the integration variables and derived attributes
from the data helped define the elements needed to understand and improve systems
integration assessment. The method of gathering the data and using expert survey to
validate the data helped improve the definition of the attributes and determine the weight
of each attribute based on their importance to systems integration, which became the key
elements in developing the integration assessment framework. The process to determine
the final criteria for the attributes was very comprehensive, but it helped distinguish each
attribute from one another.
Using the Minitab software analysis tool was very helpful when analyzing the
data and the survey results. The software tool helped provide clarity on the relationships
between data points. After completing the data analysis, the next significant step was
validating the data with the right SMEs, which was critical to completing the research.
Identifying the SMEs that have worked on the SoS data have been very helpful and their
participation to the survey were very insightful to the overall criteria of each attribute.
114
As the research completed and the findings were summarized in a journal article
for publication, the format to explain the process needed some improvement. All the
information to complete the research were available; however, the feedback from systems
engineering journal review panels, specifically the Defense Acquisition Research Journal
review panel, helped provide guidance on summarizing the entire research. The
application process of the integration assessment framework that was derived from
defining the seven attributes is a useful systems engineering tool for program managers to
determine integration feasibility. The Defense Acquisition Research Journal approved
the research summary for publication in December 2016.
The result of the research produced seven systems integration attributes that are
defined from derived criteria and are given different weights. Each attribute adds a
dimension in evaluating SoS integration, and the resulting integration assessment
framework tool provides an enhance IRL score that will help determine integration
feasibility in planning and facilitating integration activities. The attributes were validated
through the expert survey and the results proved that other attributes were more important
than what it was initially defined.
The integration assessment framework tool can be used as many times as new
information is provided, and adjusting the expectations and scope can help with
understanding the feasibility of the IRL score. Calculating the enhanced IRL score is an
iterative process with the thought that the IRL score could improve through time due to
additional information and adjustments to each attribute. Although the current DoD
process of deploying space system capabilities for operational use does not require

115
assessment of integration maturity, the result of this research should help quantify the
feasibility of integrating SoS using IRL principles.
6.5 Limitations and Future Work
Although several processes have been provided to assess TRL and IRL, there is
still some subjectivity to these analyses. Every program has some uniqueness on how to
integrate their systems, but the past data and past experience can help put some rigor in
the analysis. IRL has effective principles if it complements other analyses to help with
program manager decisions. Results can offer areas of emphasis as opposed to detailed
solution. For IRL to be used effectively, high-level assumptions need to be clear up front
and agreed to by stakeholders.
When grouped with other readiness metrics, IRL may have some applications in
DoD research and development (Ross S, 2016), but IRL itself does not have the capacity
to critically assess research and development effort. It also does not evaluate cost and
schedule (Sauser B et al., 2010). A more quantitative algorithm may be required for the
assessment of IRL for complex systems. Without rigorous criteria, assessment for the
determining IRL could lead to inaccurate analysis. Assessment of TRL and IRL
sometimes can lead to oversimplification (Ramirez-Marquez J, Sauser B, 2009).
Although some of IRL may be subjective, there are several analyses using IRL
principles that can be done to develop processes and help with program managers’
decisions on SoS integration. Throughout DoD acquisitions and large complex programs,
integration challenges will continue to persist and the need for additional analysis and
tools to overcome those challenges are necessary.

116
CHAPTER 7: REFERENCES
Abell M., Braselton, J., Rafter, J. (1998) Statistics with Mathematica. Cambridge,
MA: Academic Press
Assistant Secretary of Defense for Research and Engineering. (2011). Technology
Readiness Assessment (TRA) Guidance. Washington, DC. Retrieved from:
http://www.acq.osd.mil/chieftechnologist/publications/docs/TRA2011.pdf
Benoit, K. (2011). Linear Regression Models with Logarithmic Transformations.
Methodology Institute London School of Economics Lecture Papers. Retrieve
from: http://www.kenbenoit.net/courses/ME104/logmodels2.pdf
Bhasin, K., Hayden, J. (2008). Architecting network of networks for space system
of systems. 2008 IEEE International Conference on System of Systems
Engineering.
Bolloju, N. (2009). Conceptual modeling of systems integration requirements.
IEEE Software, 26(5), 66–74.
Booch, G. (2006). On Architecture. IEEE Software, 23(2), 16–18.
Ceruti, M. (2003). Data Management Challenges and development for military
information systems. IEEE Transactions on Knowledge and Data Engineering,
15(5), 1059–1068.
Department of Operational Test and Evaluation (DOT&E). (1999-2014). Annual
Reports.
Djavanshir, G., Khorramshahgol, R. (2007). Key Process areas in systems
integration. IT Professional, 9(4), 24–27.
Department of Defense (DoD) Electronic Publications. (2013). DoD Instructions
5000.02.
Dubos, G., Saleh, J., Braun, R. (2008). Technology readiness level, schedule risk,
and slippage in spacecraft design. Journal of Spacecraft and Rockets, 45(4), 836–
842.
Dubos, G., Saleh, J. (2010). Risk of spacecraft on-orbit obsolescence: Novel
framework, stochastic modeling, and implications. Asta Astronautica, 67(1-2),
155–172.
Eder, C. (2015). Extended Abstract - Beyond Integration Readiness Level (IRL):
A Multidimensional Framework to Facilitate the Integration of System of
Systems. IARIA 8th Annual DEPEND Conference. Retrieved from:
https://www.thinkmind.org/download.php?articleid=depend_2015_1_20_50020
Ender, T., Leurck, R., Weaver, B., Miceli, P., Blair, W., West, P., Mavris, D.
(2010). Systems-of-systems analysis of ballistic missile defense architecture
effectiveness through surrogate modeling and simulation. IEEE Systems Journal,
4(2), 156–166.
Gagliardi, M., Wood, W.G., Klein, J., Morley, J. (2009). A Uniform approach for
system of systems architecture evaluation. Crosstalk, 22(3-4), 12–15.
GAO Report to Congress. (2012). GAO-12-385: Urgent Warfighter Needs.

117
Ge, B., Hipel, K., Kewei, Y., Chen, Y. (2013). A data-centric capability-focused
approach for system-of- systems architecture modeling and analysis. Systems
Engineering, 16(3), 363–377.
Ge, B., Hipel, K., Chen, Y. (2014). A novel executable modeling approach for
system-of-systems architecture. IEEE Systems Journal, 8(1), 4–13.
Gifun, J.F., Karydasb, DM. (2010). Organizational attributes of highly reliable
complex systems. Quality and Reliability Engineering International, 26(1), 53–62.
Government Accountability Office (GAO) Report to Congress. (2011). GAO-11-
590T: Space Acquisitions: DoD Delivering New Generations of Satellite, but
Space Acquisition Challenges Remain.
Greene, W. (2010) Econometric Analysis 6th Edition. Upper Saddle River, NJ:
Prentice Hall
INCOSE. 2011. Systems Engineering Handbook: A Guide for System Life Cycle
Processes and Activities, version 3.2.2. San Diego, CA, USA: International
Council on Systems Engineering (INCOSE), INCOSE-TP-2003-002-03.2.2.
INCOSE. 2015. Systems Engineering Handbook: A Guide for System Life Cycle
Processes and Activities, version 4.0. Hoboken, NJ, USA: John Wiley and Sons,
Inc, ISBN: 978-1-118-99940-0
Jain, R., Chandrasekaran, A., Elias, G., Cloutier, R. (2008). Exploring the impact
of systems architecture and systems requirements on systems integration
complexity, IEEE Systems Journal, 2(2), 209–223.
Jain, R., Chandrasekaran, A., Erol, O. (2010). A systems integration framework
for process analysis and improvement. Systems Engineering, 13(3), 274–289.
Katz, D., Sarkani, S., Mazzuchi, T., Conrow, E. (2015). The Relationship of
Technology and Design Maturity to DoD Weapon System Cost Change and
Schedule Change During Engineering and Manufacturing Development. Systems
Engineering, 18(1), 1–15.
Kruchten, P., Capilla, R., Duenas, J. (2009). The decisions view’s role in software
architecture practice. IEEE Software, 26(2), 36–42.
Kujawski, E. (2013). Analysis and critique of the system readiness level. IEEE
Transactions on Systems, Man, and Cybernetics: Systems, 43(4), 979–987.
Lane, D., Hebl, M., Osherson, D., Ziemer, H. Investopedia (2007) Normal
Distribution. Online Statistics Education. Retrieved from:
http://onlinestatbook.com/2/index.html
Lattin, J., Carroll, J., Green, P. (2002). Analyzing Multivariate Data. Belmont,
CA: Cengage Learning.
Leete, S., Romero, R., Dempsey, J., Carey, J., Cline, H., Lively, C. (2015).
Technology Readiness Level Assessment Process as Applied to NASA Earth
Science Missions. American Institute of Aeronautics and Astronautics. Retrieve
from: https://espd.gsfc.nasa.gov/
Lin, C., Lu, S., Fei, X., Chebotko, A., Pai, D., Lai, Z., Fotouhi, F., Hua, J. (2009).
A Reference Architecture for Scientific Workflow Management Systems and the
View SOA Solution. IEEE Transactions on Services Computing, 2(1), 79–92.

118
London, M.A., Holzer, T.H., Eveleigh, T.J., Sarkani, S. (2014). Incidence matrix
approach for calculating readiness levels. Journal of Systems Science and
Systems Engineering, 23(4), 377–403.
Lung, C., Xu, X., Zaman, M. (2007). Software architecture decomposition using
attributes. International Journal of Software Engineering and Knowledge
Engineering 17(5): 599–613.
Madni, A., Sievers, M. (2014). System of systems integration: Key considerations
and challenges. Systems Engineering, 17(3), 330–347.
Magnaye, R., Sauser, B., Ramirez-Marquez, J.E. (2010). System development
planning using readiness levels in a cost of development minimization model.
Systems Engineering, 13(4), 311–323.
Mankins, J. (2009). Technology readiness and risk assessments: A new approach.
Acta Astronautica, 65(9-10), 1208–1215.
Martin, J. (2008). Using architecture modeling to assess the societal benefits of
the global earth observation system-of-systems. IEEE Systems Journal, 2(3), 304–
311.
McConkie, E., Mazzuchi, T., Sarkani, S., Marchette, D. (2013). Mathematical
properties of System Readiness Levels. Systems Engineering, 16(4), 391–400.
Minitab Support (2016). Retrieved from: http://support.minitab.com/
MITRE Corporation (2009). Evolution of Systems Engineering. McLean, VA.
Retrieved from: https://www.mitre.org/publications/systems-engineering-
guide/systems-engineering-guide/the-evolution-of-systems
Piaszcyk, C. (2011). Model Based Systems Engineering with Department of
Defense Architectural Framework. Systems Engineering, 14(3), 305–326.
Pittera, T., Derrico, M. (2011). Multi-purpose modular plug and play architecture
for space systems: Design, integration, and testing. Acta Astronautica, 69(7-8),
629–643.
Rabelo, L., Fishwick, P., Ezzell Z, Lacy L, Yousef N. (2012). Ontology-centered
integration for space operations. Journal of Simulation, 6(2), 112–124.
Ramirez-Marquez, J., Sauser, B. (2009). System development planning via
system maturity optimization. IEEE Transactions of Engineering Management,
56(3), 533–548.
Rezaei, R., Chiew, T., Lee, S. (2013). A review of interoperability assessment
models. Journal of Zhejiang University: Science, 14(9), 663–681.
Ross, S. (2016). Application of System and Integration Readiness Levels to
Department of Defense Research and Development. Defense Acquisition
Research Journal, 23(3), 248–273.
Sauser, B., Gove, R., Forbes, E., Ramirez-Marquez, J.E. (2010). Integration
maturity metrics: Development of an integration readiness level. Information.
Knowledge. Systems Management, 9(1), 17–46.
119
Suh, E., Chiriac, N., Holtta-Otto, K. (2015). Seeing Complex System through
Different Lenses: Impact of Decomposition Perspective on System Architecture
Analysis. Systems Engineering, 18(3), 229–240.
Tan, W., Ramirez-Marquez, J., Sauser, B. (2011). A probabilistic approach to
system maturity assessment. Systems Engineering, 14(3), 279–293.
Tien, J. (2008). On integration and adaptation in complex service systems. Journal
of Systems Science and Systems Engineering, 17(4), 385–415.
Tyree, J., Akerman, A. (2005). Architecture Decisions: Demystifying
Architecture. IEEE Software, 22(2), 19–27.
Under Secretary of Defense. (2015). Department of Defense Instruction 5000.02.
Washington, DC: Office of the Under Secretary of Defense for Acquisition,
Technology, and Logistics, Retrieved from
http://www.acq.osd.mil/fo/docs/500002p.pdf.
Vernay, A., Boons, F. (2015). Assessing Systems Integration: A Conceptual
Framework and a Method. Systems Research and Behavioral Science, 32(1), 106–
123.
Warboys, B., Snowdon, B., Greenwood, R., Seet, W., Robertson, I., Morrison, R.,
Balasubramaniam, D., Kirby, G., Mickan, K. (2005). An Active-Architecture
Approach to COTS Integration. IEEE Software, 22(4), 20–27.
Zalewski, A., Kijas, S. (2013). From principles to details: Integrated framework
for architecture modeling of large scale software systems. E-Informatica Software
Engineering Journal, 7(1), 45–52.
Zhang, Y., Liu, X., Wang, Z., Chen, L. (2012). A service-oriented method for
system-of-systems requirements analysis and architecture design, Journal of
Software, 7(2), 358–365.