better data to improve the strength of energy indicators
TRANSCRIPT
Better data to improve the
strength of Energy Indicators
A national perspective from New Zealand’s
recent experiences
International Energy Agency Energy Efficiency Indicators Workshop
6-7 June 2012
1
Contents
• Some facts about New Zealand
• New Zealand Energy Strategy
• Background to Energy Statistics in New Zealand
• A solution – domain planning
• Energy Domain Plan 2006 – 2016
• Energy Use Surveys
• Reflections
• Sources of further information
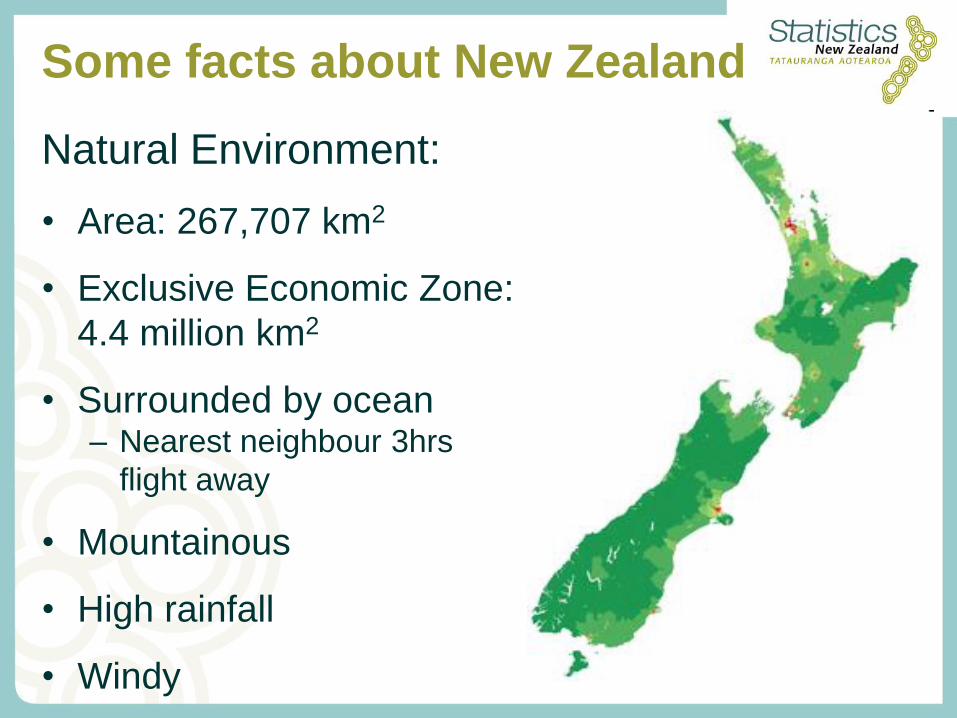
Some facts about New Zealand
Natural Environment:
• Area: 267,707 km2
• Exclusive Economic Zone:
4.4 million km2
• Surrounded by ocean – Nearest neighbour 3hrs
flight away
• Mountainous
• High rainfall
• Windy

Some facts about New Zealand
People & Economy:
• 4.4 million people
• 6.2 million dairy cattle
• 31.1 million sheep
• Importance of primary
exports and tourism
• Importance of ‘clean green’
image
• Much industry involved in
processing
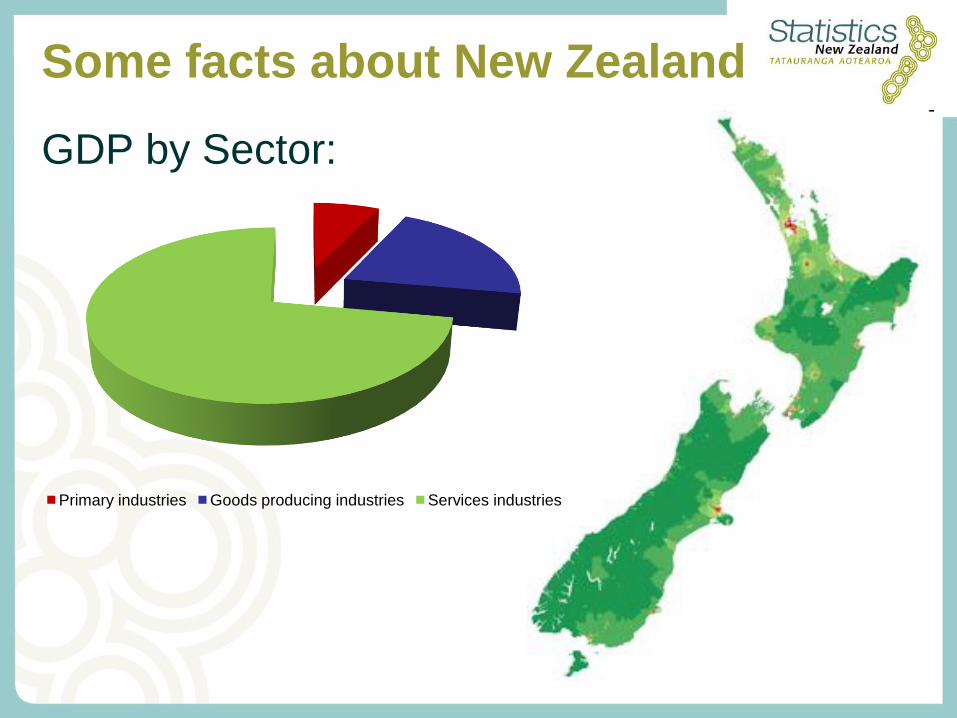
Some facts about New Zealand
GDP by Sector:
Primary industries Goods producing industries Services industries
Some facts about New Zealand
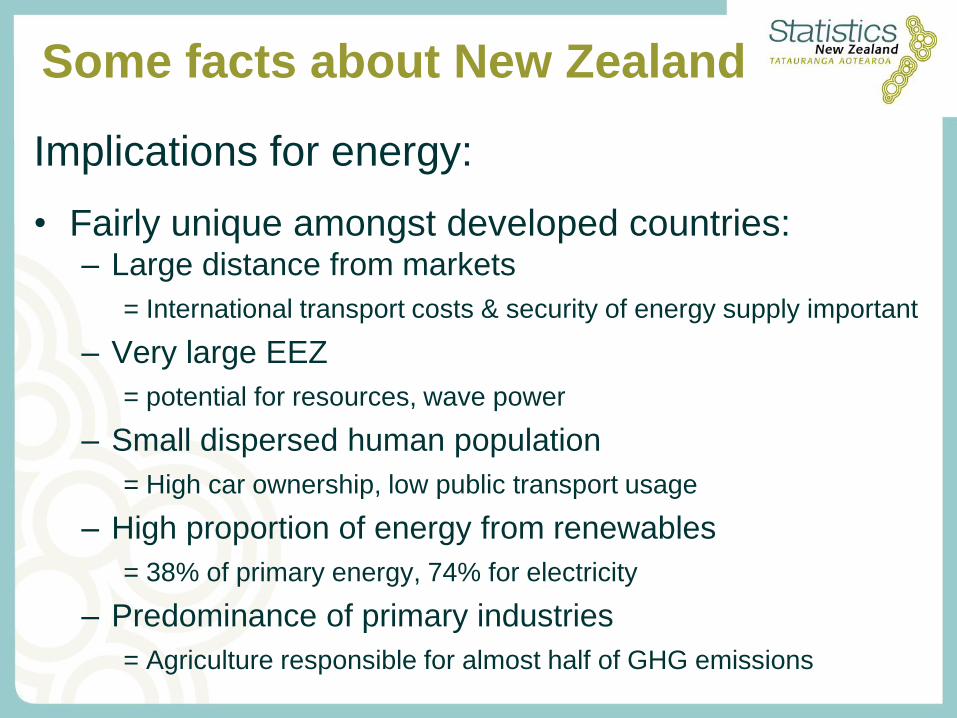
Implications for energy:
• Fairly unique amongst developed countries: – Large distance from markets
= International transport costs & security of energy supply important
– Very large EEZ
= potential for resources, wave power
– Small dispersed human population
= High car ownership, low public transport usage
– High proportion of energy from renewables
= 38% of primary energy, 74% for electricity
– Predominance of primary industries
= Agriculture responsible for almost half of GHG emissions
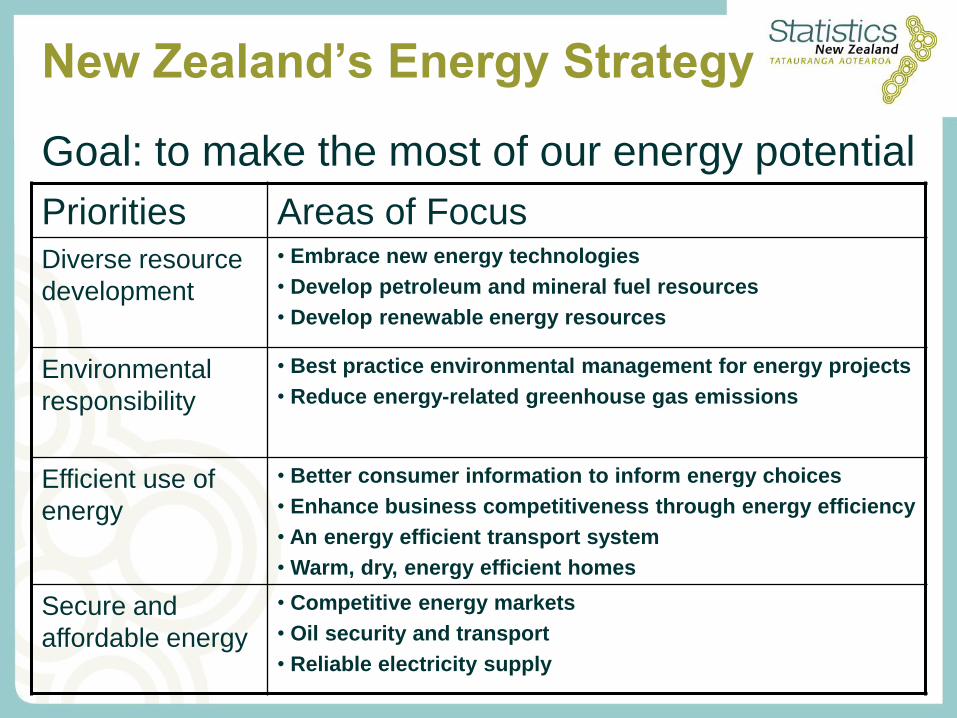
New Zealand’s Energy Strategy
Goal: to make the most of our energy potential
Priorities Areas of Focus
Diverse resource
development
• Embrace new energy technologies
• Develop petroleum and mineral fuel resources
• Develop renewable energy resources
Environmental
responsibility
• Best practice environmental management for energy projects
• Reduce energy-related greenhouse gas emissions
Efficient use of
energy
• Better consumer information to inform energy choices
• Enhance business competitiveness through energy efficiency
• An energy efficient transport system
• Warm, dry, energy efficient homes
Secure and
affordable energy
• Competitive energy markets
• Oil security and transport
• Reliable electricity supply
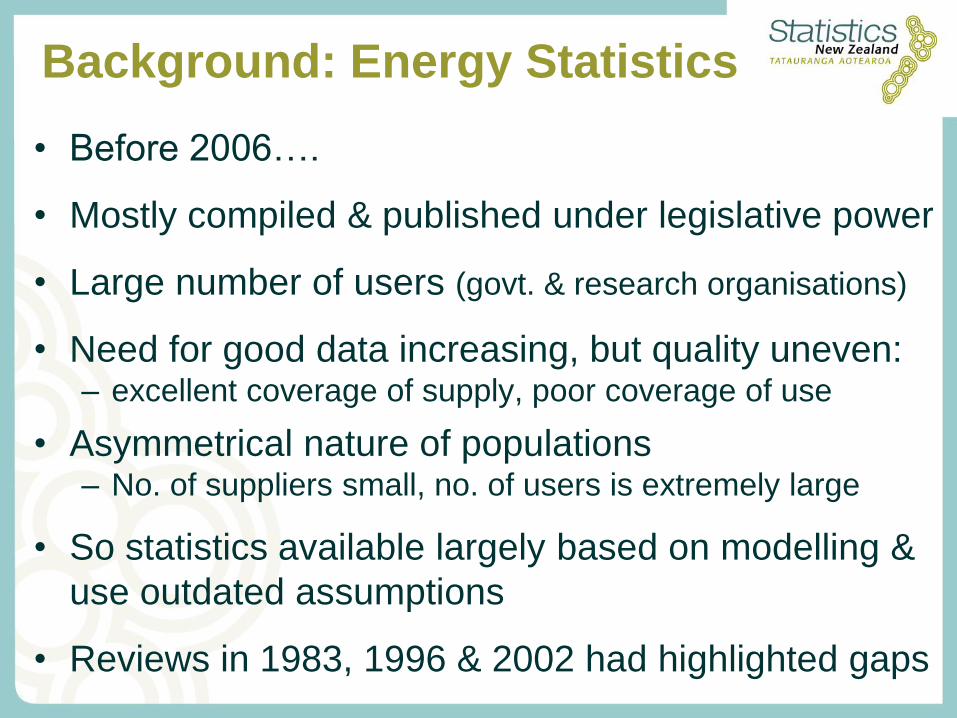
Background: Energy Statistics
• Before 2006….
• Mostly compiled & published under legislative power
• Large number of users (govt. & research organisations)
• Need for good data increasing, but quality uneven: – excellent coverage of supply, poor coverage of use
• Asymmetrical nature of populations – No. of suppliers small, no. of users is extremely large
• So statistics available largely based on modelling &
use outdated assumptions
• Reviews in 1983, 1996 & 2002 had highlighted gaps
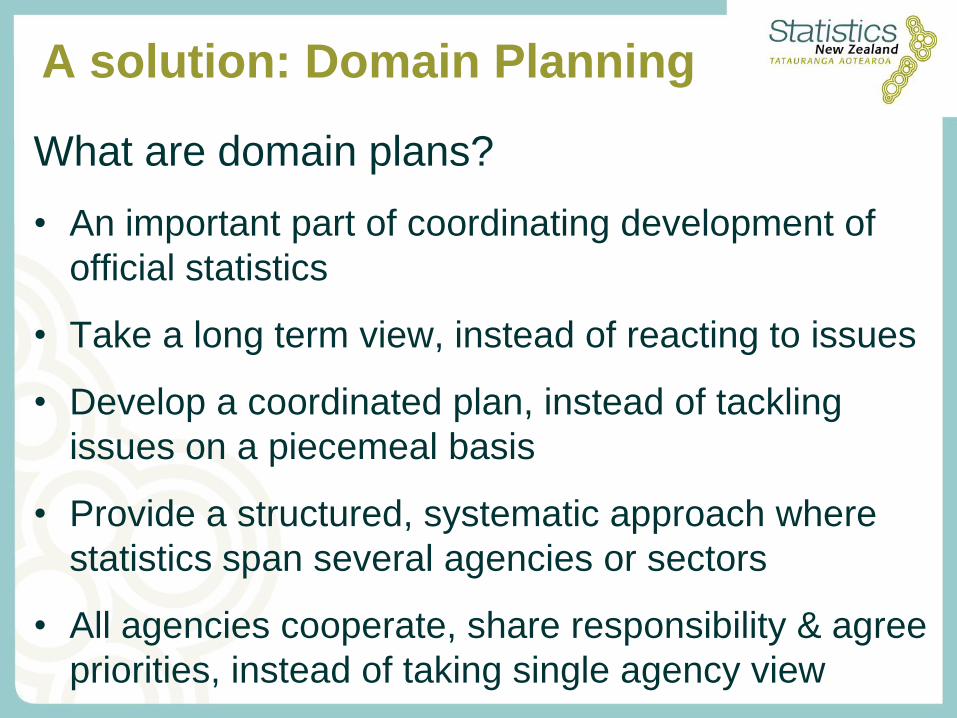
A solution: Domain Planning
What are domain plans?
• An important part of coordinating development of
official statistics
• Take a long term view, instead of reacting to issues
• Develop a coordinated plan, instead of tackling
issues on a piecemeal basis
• Provide a structured, systematic approach where
statistics span several agencies or sectors
• All agencies cooperate, share responsibility & agree
priorities, instead of taking single agency view
Domain Planning
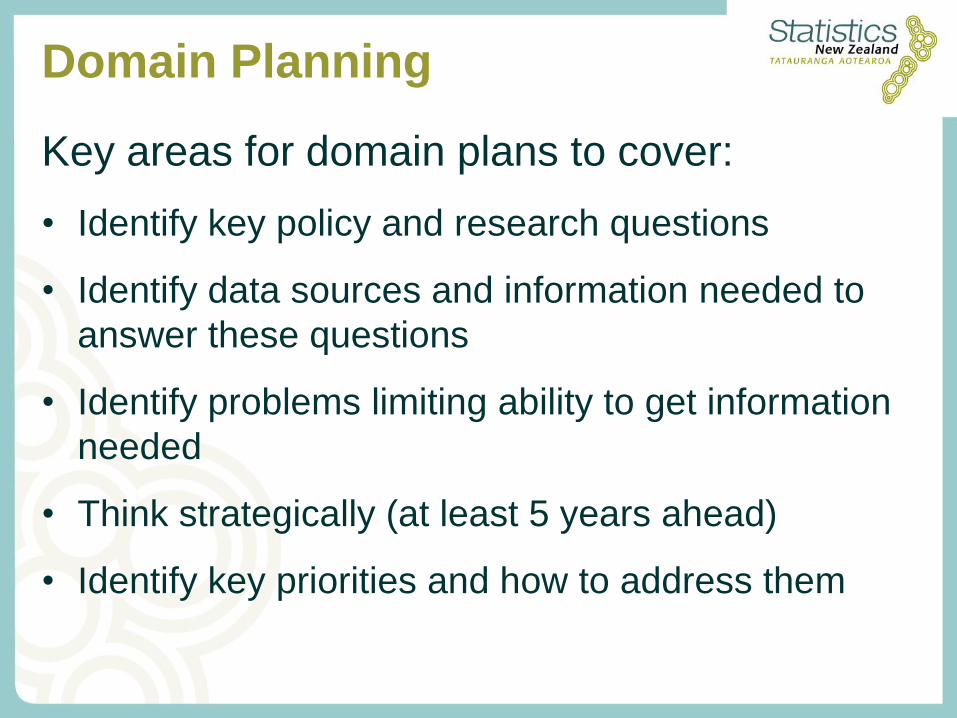
Key areas for domain plans to cover:
• Identify key policy and research questions
• Identify data sources and information needed to
answer these questions
• Identify problems limiting ability to get information
needed
• Think strategically (at least 5 years ahead)
• Identify key priorities and how to address them
Energy Domain Plan
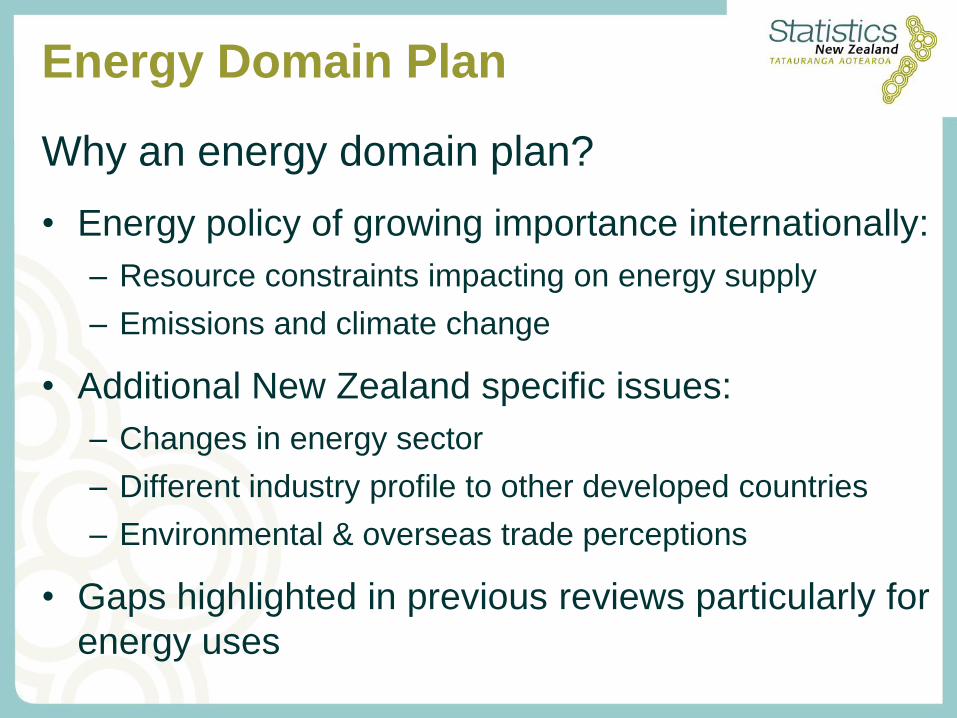
Why an energy domain plan?
• Energy policy of growing importance internationally:
– Resource constraints impacting on energy supply
– Emissions and climate change
• Additional New Zealand specific issues:
– Changes in energy sector
– Different industry profile to other developed countries
– Environmental & overseas trade perceptions
• Gaps highlighted in previous reviews particularly for
energy uses
Energy Domain Plan
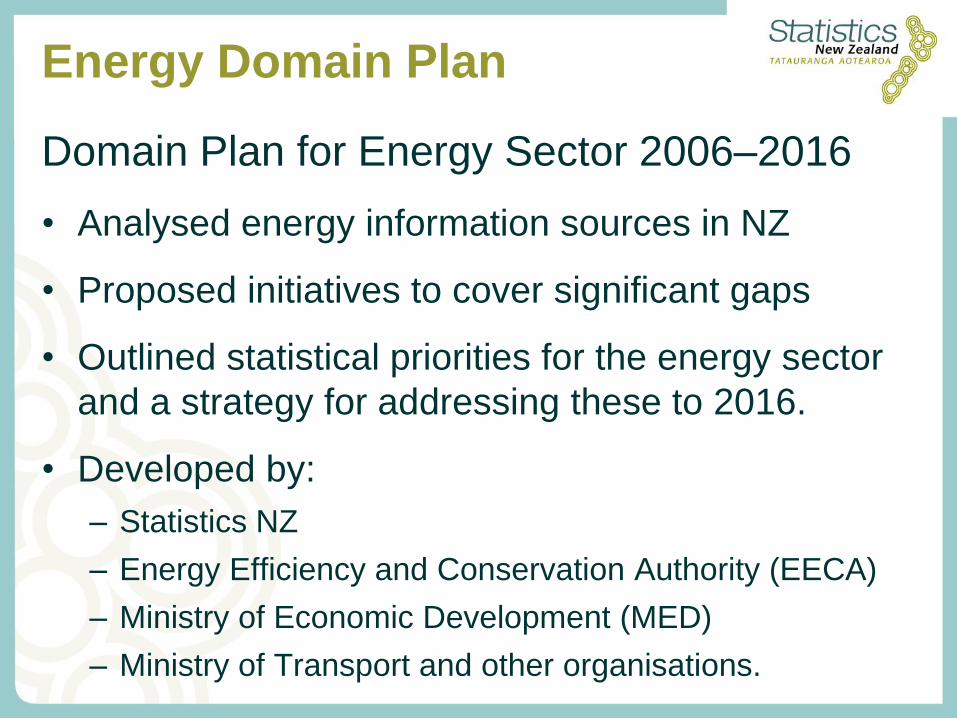
Domain Plan for Energy Sector 2006–2016
• Analysed energy information sources in NZ
• Proposed initiatives to cover significant gaps
• Outlined statistical priorities for the energy sector
and a strategy for addressing these to 2016.
• Developed by:
– Statistics NZ
– Energy Efficiency and Conservation Authority (EECA)
– Ministry of Economic Development (MED)
– Ministry of Transport and other organisations.
Energy Domain Plan
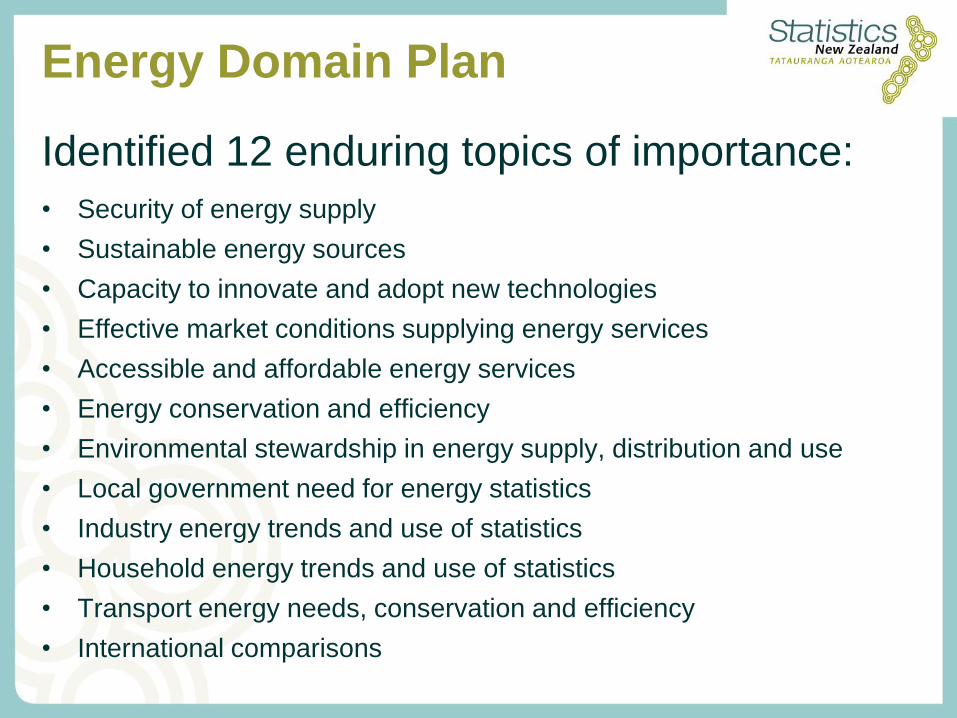
Identified 12 enduring topics of importance:
• Security of energy supply
• Sustainable energy sources
• Capacity to innovate and adopt new technologies
• Effective market conditions supplying energy services
• Accessible and affordable energy services
• Energy conservation and efficiency
• Environmental stewardship in energy supply, distribution and use
• Local government need for energy statistics
• Industry energy trends and use of statistics
• Household energy trends and use of statistics
• Transport energy needs, conservation and efficiency
• International comparisons
Energy Domain Plan
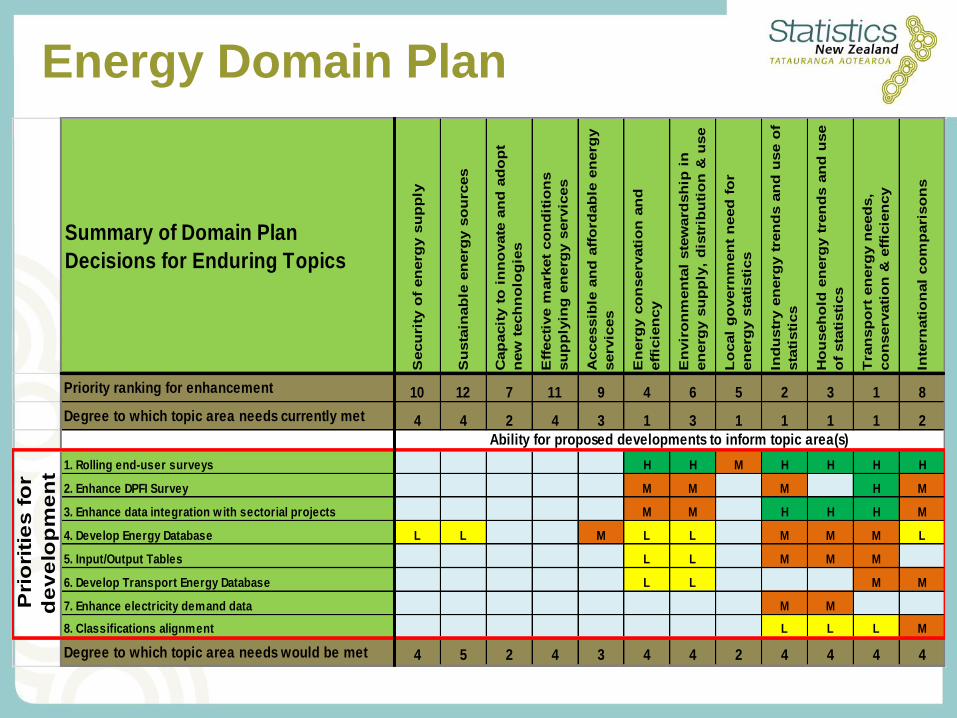
Summary of Domain Plan
Decisions for Enduring Topics
Secu
rity
of
en
erg
y s
up
ply
Su
sta
inab
le e
nerg
y s
ou
rces
Cap
acit
y t
o i
nn
ovate
an
d a
do
pt
new
tech
no
log
ies
Eff
ecti
ve m
ark
et
co
nd
itio
ns
su
pp
lyin
g e
nerg
y s
erv
ices
Accessib
le a
nd
aff
ord
ab
le e
nerg
y
serv
ices
En
erg
y c
on
serv
ati
on
an
d
eff
icie
ncy
En
vir
on
men
tal
ste
ward
sh
ip i
n
en
erg
y s
up
ply
, d
istr
ibu
tio
n &
use
Lo
cal
go
vern
men
t n
eed
fo
r
en
erg
y s
tati
sti
cs
Ind
ustr
y e
nerg
y t
ren
ds a
nd
use o
f
sta
tisti
cs
Ho
useh
old
en
erg
y t
ren
ds a
nd
use
of
sta
tisti
cs
Tra
nsp
ort
en
erg
y n
eed
s,
co
nserv
ati
on
& e
ffic
ien
cy
Inte
rnati
on
al
co
mp
ari
so
ns
Priority ranking for enhancement 10 12 7 11 9 4 6 5 2 3 1 8
Degree to which topic area needs currently met 4 4 2 4 3 1 3 1 1 1 1 2
1. Rolling end-user surveys H H M H H H H
2. Enhance DPFI Survey M M M H M
3. Enhance data integration with sectorial projects M M H H H M
4. Develop Energy Database L L M L L M M M L
5. Input/Output Tables L L M M M
6. Develop Transport Energy Database L L M M
7. Enhance electricity demand data M M
8. Classifications alignment L L L M
Degree to which topic area needs would be met 4 5 2 4 3 4 4 2 4 4 4 4
Pri
ori
tie
s f
or
de
ve
lop
me
nt
Ability for proposed developments to inform topic area(s)
Energy Use Surveys
Rationale:
• Offered most improvement to most topics
• Important to shed more light on modelled data:
– Especially liquid fuel use in agriculture
– ‘Unallocated’ and transport fuel use in energy balances
• Advantages of a statistical survey based on a
national business register:
– Comprehensive coverage
– Can split by industry, type of activity
– Allows for comparisons with other statistics (GDP etc.)
Energy Use Surveys
Design considerations:
• Level of breakdown required for outputs
– Industry & energy type versus load & confidentiality
• Feasibility of gathering different types of information
– Postal self-complete questionnaire
– Data availability
– Different nature of activities across industries
• Some specific issues: – Little prior data to inform sample design
– Avoid double counting (contractors, investors, share milkers)
– Separating business & personal energy uses
– Joint ventures (off shore oil platforms)
– Non-energy uses
Energy Use Surveys
Process:
• Joint agency development process
– Strong joint governance group for direction (EDAC)
• Strong project management focus
– Moved to a team experienced in new developments
• Thorough cognitive testing
– Refined through multiple rounds
• Existing generic processing system
– Flexible, user configurable, metadata driven
• Suite of surveys covering all industries across the
New Zealand economy over 3 years (not households)
Energy Use Surveys
Results: 1) Full detailed results available from:
http://www.stats.govt.nz/browse_for_stats/industry_sectors/Energy.aspx
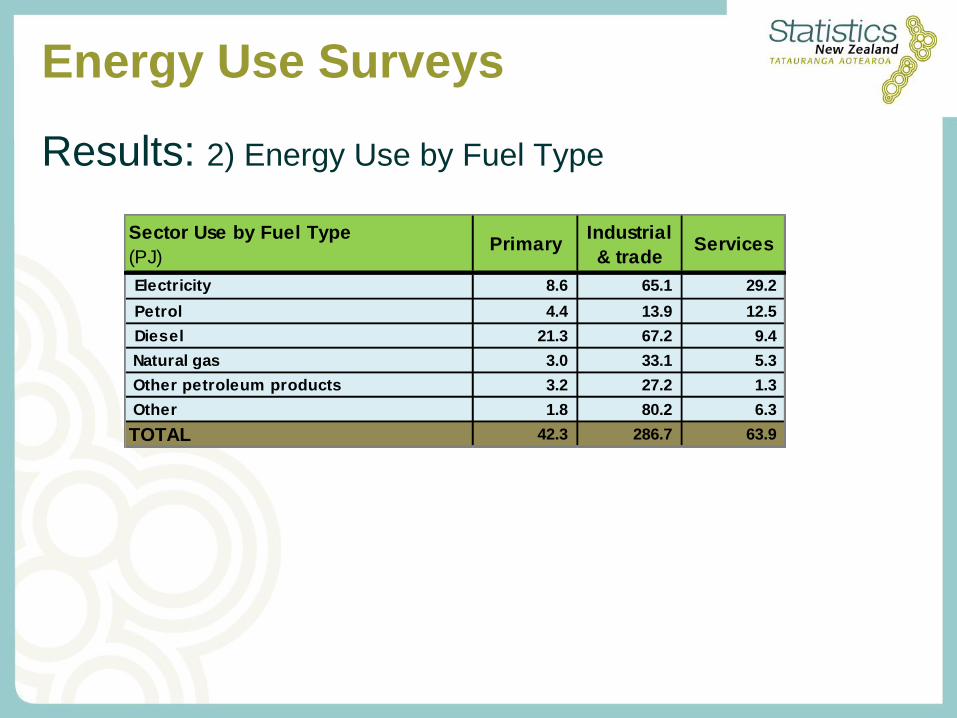
Energy Use Surveys
Results: 2) Energy Use by Fuel Type
Sector Use by Fuel Type
(PJ)Primary
Industrial
& tradeServices
Electricity 8.6 65.1 29.2
Petrol 4.4 13.9 12.5
Diesel 21.3 67.2 9.4
Natural gas 3.0 33.1 5.3
Other petroleum products 3.2 27.2 1.3
Other 1.8 80.2 6.3
TOTAL 42.3 286.7 63.9
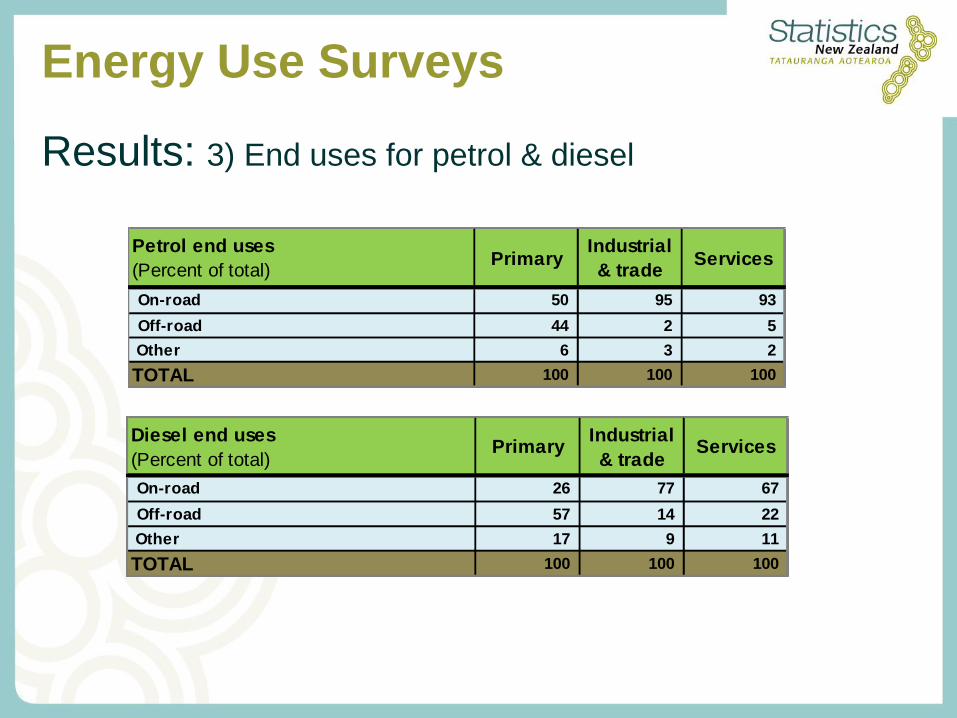
Energy Use Surveys
Results: 3) End uses for petrol & diesel
Petrol end uses
(Percent of total)Primary
Industrial
& tradeServices
On-road 50 95 93
Off-road 44 2 5
Other 6 3 2
TOTAL 100 100 100
Diesel end uses
(Percent of total)Primary
Industrial
& tradeServices
On-road 26 77 67
Off-road 57 14 22
Other 17 9 11
TOTAL 100 100 100
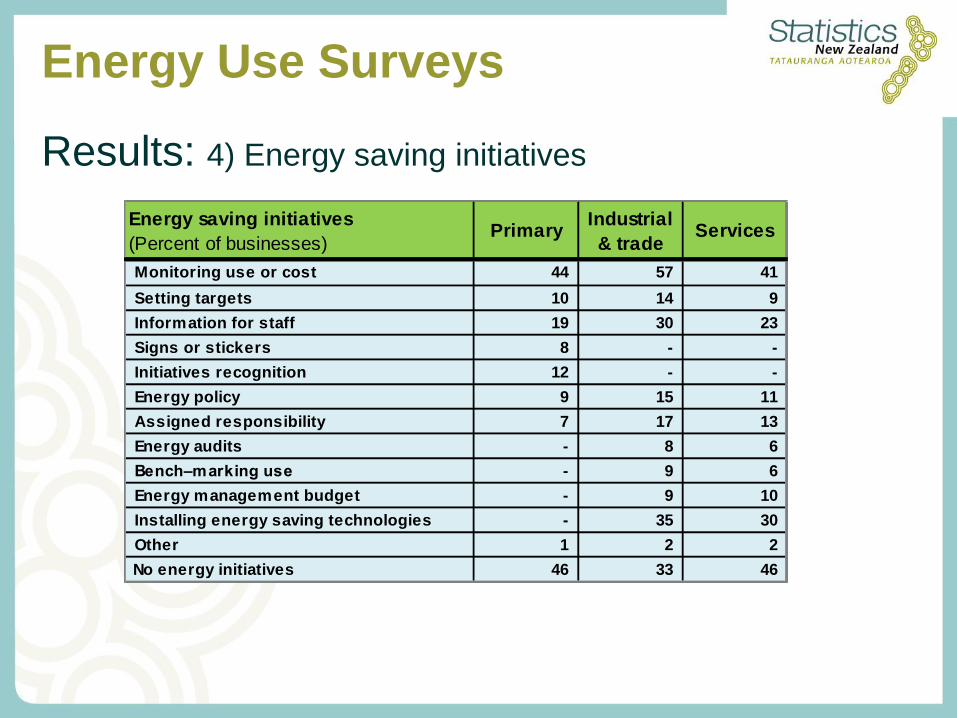
Energy Use Surveys
Results: 4) Energy saving initiatives
Energy saving initiatives
(Percent of businesses)Primary
Industrial
& tradeServices
Monitoring use or cost 44 57 41
Setting targets 10 14 9
Information for staff 19 30 23
Signs or stickers 8 - -
Initiatives recognition 12 - -
Energy policy 9 15 11
Assigned responsibility 7 17 13
Energy audits - 8 6
Bench–marking use - 9 6
Energy management budget - 9 10
Installing energy saving technologies - 35 30
Other 1 2 2
No energy initiatives 46 33 46
Energy Use Surveys
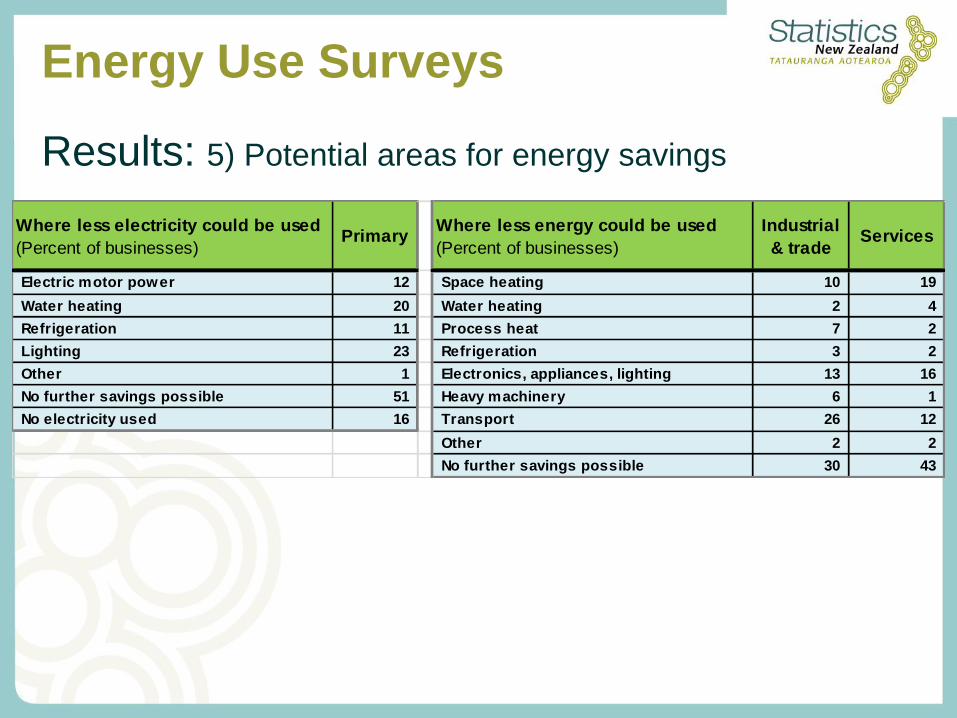
Results: 5) Potential areas for energy savings
Where less electricity could be used
(Percent of businesses)Primary
Where less energy could be used
(Percent of businesses)
Industrial
& tradeServices
Electric motor power 12 Space heating 10 19
Water heating 20 Water heating 2 4
Refrigeration 11 Process heat 7 2
Lighting 23 Refrigeration 3 2
Other 1 Electronics, appliances, lighting 13 16
No further savings possible 51 Heavy machinery 6 1
No electricity used 16 Transport 26 12
Other 2 2
No further savings possible 30 43
Reflections
The +’s:
• Domain planning process to agree priorities
• Cross agency cooperation
• Successful survey development quicker, cheaper
than anticipated
• Now more information to inform energy analysts
The –’s:
• Domain planning time consuming & resource
intensive - how to refresh, update over time?
• Can’t always provide detail ideally required
• Household use still a gap
To find out more
Statistics New Zealand
http://www.stats.govt.nz/browse_for_stats/industry_sectors/Energy.aspx
Ministry of Economic Development
http://www.med.govt.nz/sectors-industries/energy/energy-modelling
Energy Efficiency and Conversation Authority
http://www.eeca.govt.nz/