before a board of inquiry transmission gully notices of … · recurrence interval (ari) rainfall...
TRANSCRIPT

Statement of evidence of Michelle Kathleen Malcolm (Water Quality) for
the NZ Transport Agency and Porirua City Council
Dated: 17 November 2011
REFERENCE: John Hassan ([email protected])
Nicky McIndoe ([email protected])
Before a Board of Inquiry
Transmission Gully
Notices of Requirement and Consents
under: the Resource Management Act 1991
in the matter of: Notices of requirement for designations and resource
consent applications by the NZ Transport Agency,
Porirua City Council and Transpower New Zealand
Limited for the Transmission Gully Proposal
between: NZ Transport Agency
Requiring Authority and Applicant
and: Porirua City Council
Local Authority and Applicant
and: Transpower New Zealand Limited
Applicant

1
042407977/1320559.16
STATEMENT OF EVIDENCE OF MICHELLE KATHLEEN MALCOLM
FOR THE NZ TRANSPORT AGENCY AND PORIRUA CITY
COUNCIL
QUALIFICATIONS AND EXPERIENCE
1 My full name is Michelle Kathleen Malcolm.
2 I am a Senior Environmental Consultant at Sinclair Knight Merz
(SKM). I have a BSc with Honours in Physical Geography from
Victoria University of Wellington. I am a Certified Environmental
Practitioner with the Environment Institute of Australia and
New Zealand.
3 I have 15 years experience working in urban catchment
management, stormwater treatment, water quality effects
assessments and flood risk assessment. My involvement in these
areas spans policy, modelling, design and monitoring.
4 I have specialist expertise in stormwater management and water
quality effects assessments, which are key aspects of the
Transmission Gully Project. Recent projects I have been involved in
include:
4.1 Kapiti Coast Stormwater Discharge Consents Monitoring. I
developed a water quality monitoring programme for 18
catchments within the Kapiti Coast District, and assisted that
Council to obtain resource consents for all of its stormwater
discharges to both freshwater and marine receiving
environments. I am also involved in the ongoing
management of these consents. My work includes routine
monitoring, the development of water quality investigations
and the design of water quality mitigation projects. Recently,
I have been involved in the design of a retrofit wetland, to
treat runoff from an existing industrial catchment.
4.2 SH20 - Manukau Extension. I was the Project Manager for
the hydraulic aspects of the motorway design. I was involved
in the development of 1D models (using the model MIKE 11)
of the Puhinui stream. These models were used to estimate
flood levels and velocities for the Stream, which were then
used to design the motorway bridge and culvert crossings of
the Stream. I was also the internal technical peer reviewer of
the design of the stormwater management ponds to treat the
operational stormwater discharges, to meet the water quality
standards.
4.3 Review of Development Impacts on Stormwater. I undertook
an assessment of the vulnerability of Kapiti Coast District
Council’s proposed urban intensification areas to surface

2
042407977/1320559.16
water and groundwater flooding, as well as the adverse
hydraulic and water quality effects this urban intensification
could have on the existing stormwater networks and streams.
I identified options for each of the urban intensification nodes
to mitigate the adverse effects of development.
4.4 North Shore City Council Bioretention Guidelines. I developed
guidelines for the design, construction and maintenance of
bioretention stormwater devices for North Shore City Council.
Bioretention devices are used to improve water quality and
manage the changes in hydrological effects associated with
increased impervious areas. These were adopted by the
Council and are widely used throughout the Northshore.
4.5 I have undertaken assessments of environmental effects for a
number of resource consents for the discharge of stormwater
from industrial premises, including Higgins concrete batching
plant in Ngauranga, Wairoa Lumber processing and Blacktop
Construction in Manukau.
5 On 15 August 2011 the NZ Transport Agency (NZTA), Porirua City
Council (PCC) and Transpower NZ Limited (Transpower) lodged
Notices of Requirement (NoRs) and applications for resource
consent with the Environmental Protection Authority (EPA) in
relation to the Transmission Gully Proposal (the Proposal).
6 The Proposal comprises three individual projects, being:
6.1 The ‘NZTA Project’, which refers to the construction,
operation and maintenance of the Main Alignment and the
Kenepuru Link Road by the NZTA;
6.2 The ‘PCC Project’ which refers to the construction, operation
and maintenance of the Porirua Link Roads by PCC;1 and
6.3 The ‘Transpower Project’ which refers to the relocation of
parts of the PKK-TKR A 110kV electricity transmission line
between MacKays Crossing and Pauatahanui Substation by
Transpower.
7 My evidence is given in support of the NZTA and PCC Projects
(together the TGP or the Project). It does not relate to the
Transpower Project.
8 I am familiar with the area that the Project covers and the State
highway and local roading network in the vicinity of the Project. I
1 The Porirua Link Roads are the Whitby Link Road and the Waitangirua Link Road.

3
042407977/1320559.16
have visited the site for a drive-over of the whole alignment and
have also visited stream monitoring sites at locations near the road
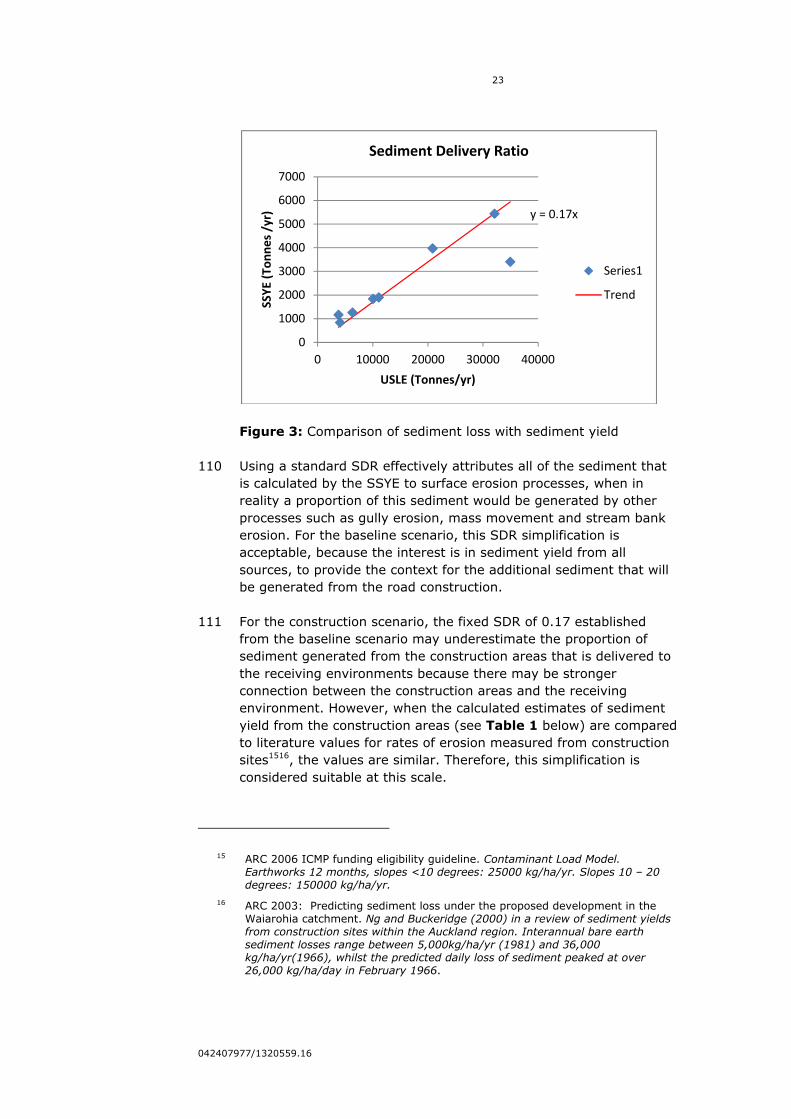
alignment. I am also familiar with the wider hydrological
environment in the surrounding region.
9 I am the co-author and lead reviewer of the Transmission Gully
Assessment of Water Quality Effects Report (Technical Report 15)
which formed part of the Assessment of Environmental Effects (AEE)
lodged in support of the Project.
10 I have read the Code of Conduct for Expert Witnesses as contained
in the Environment Court Consolidated Practice Note (2011), and I
agree to comply with it as if this Inquiry were before the
Environment Court. My qualifications as an expert are set out
above. I confirm that the issues addressed in this brief of evidence
are within my area of expertise. I have not omitted to consider
material facts known to me that might alter or detract from the
opinions expressed.
SCOPE OF EVIDENCE
11 My evidence will deal with the following:
11.1 Background and role;
11.2 Existing water quality;
11.3 Effects of the Project’s construction on water quality;
11.4 Effects of the Project’s operation on water quality;
11.5 Recommended mitigation;
11.6 Response to submissions;
11.7 Conclusions.
SUMMARY OF EVIDENCE
12 My evidence discusses the water quality effects associated with the
Project’s construction and operation on the nine receiving streams,
Porirua Harbour and the Kapiti Coast.
Construction
13 The increase in total suspended sediment (TSS) that is predicted to
occur in all catchments during rainfall events may result in a small
temporary decrease in visual clarity and a noticeable change in
colour in affected streams and the Porirua Harbour, but I would not
expect this to persist beyond storm events.

4
042407977/1320559.16
14 While the TSS is expected to increase, the overall contaminant
concentration is not expected to alter; therefore I would expect no
change or a small change in scums, foams, oil, grease, odour, stock
drinking water quality, biological growths and bathing water quality.
15 During construction, additional deposition of sediment on stream
beds is predicted to occur in all streams. This additional sediment is
predicted to accumulate at shallow depths. This additional sediment
deposition is not expected to be sufficient to alter the stream
channels’ characteristics or the ability of streams to convey flows.
16 With respect to Porirua Harbour, the sediment transport and
deposition model of the Porirua Harbour indicates that there will be
little impact on sediment deposition patterns in a 2 year Annual
Recurrence Interval (ARI) rainfall event.
17 In most of the wind and rainfall scenarios modelled to estimate the
effects on sedimentation patterns during a 10 year ARI event, much
of the additional sediment was deposited in the deeper central
basins of the Harbour in areas already experiencing high levels of
deposition. However, two of the modelled events had a greater
impact on the more ecologically vulnerable intertidal zone, as
discussed in Dr De Luca’s evidence.
18 The long term model results of the Porirua Harbour indicated that,
after 20 years from the start of construction of the Project, there
would be almost no detectable increase in sedimentation rates in
the Onepoto Arm of the Harbour and only an average increase of
between 0.1 and 0.2mm/yr in the Pauatahanui Inlet, as a result of
the Project.
19 In the very long term (i.e. 20 years plus), the mitigation planting
that is proposed as part of the Transmission Gully Project will have a
small potentially positive benefit by slightly slowing the rate of
Porirua Harbour infilling. In time this will compensate for the
increase in sediment generated during the construction period.
Operation
20 During the Project’s operation, my analysis indicates that the
proposed stormwater treatment devices will be effective in removing
contaminants.
21 The increases in contaminant loads in streams and the Pauatahanui
Inlet are only expected to result in very small changes in water
quality, with no change or only a small increase in scums, foams,
oil, grease, visual clarity, colour, objectionable odour, stock drinking
water, biological growths and bathing water quality.
22 The predicted change in traffic is likely to result in a slight decrease
in the contaminant loads being discharged to the Onepoto Arm of

5
042407977/1320559.16
the Porirua Harbour and to the Kapiti Coast. Therefore, I would
expect either no change or a slight positive effect in these areas
resulting from the ongoing operation of the Project.
BACKGROUND AND ROLE
23 NZTA engaged SKM in 2009 to assess the water quality effects of
the Project. I am the co-ordinator of this technical work.
24 I have been actively involved with the assessment of water quality
effects of the Project. My involvement included the initial scoping
phase and development of Project methodology, through to
modelling, analysis and effects assessment. I have attended Project
workshops, and site visits.
25 I coordinated the technical work undertaken to assess the water
quality effects, drawing together expertise from various specialists
within SKM, in the areas of water quality monitoring, erosion
modelling, hydrological modelling, river modelling, and coastal
modelling.
26 As noted above, I am the lead reviewer and co-author of Technical
Report 15. That report summarises all the technical work that was
undertaken as part of the assessment of water quality effects.
Links to other evidence
27 My evidence should be considered together with the evidence of
Mr Edwards, Mr Martell, Mr Gough, Mr Kelly, Mr Roberts,
Dr Sim, Dr Keesing and Dr De Luca.
28 My assessment has relied on the outputs of Mr Edwards’
construction approach, Mr Martell’s hydrological modelling and
operational stormwater management performance assumptions, and
Mr Gough’s erosion and sediment control performance
assumptions. I have also relied on the traffic modelling reported by
Mr Kelly. My work has inputs into the harbour modelling discussed
in Mr Robert’s evidence and the statistical analysis discussed in
Dr Sim’s evidence. The ecological assessment of effects on
freshwater has been undertaken by Dr Keesing and relies in part
on my modelling and analysis. The ecological analysis of effects on
coastal areas has been undertaken by Dr De Luca and relies in part
on my analysis of the Harbour modelling discussed by Mr Roberts.
29 Figure 1 illustrates the relationship of the analysis and evidence for
assessing the water quality effects during the construction phase.
Figure 2 illustrates the relationship of the analysis and evidence for
assessing the water quality effects during the operational phase.
30 The unit hydrograph hydrological modelling generated storm peak
flows and volumes for various return period events. This work was

6
042407977/1320559.16
used for the development of the sediment rating curve and provided
stream flows for the hydraulic modelling of streams and the Porirua
Harbour. The methodology of this work is discussed in Section 4 of
Technical Report 14: Assessment of Hydrology and Stormwater
Effects, and is presented in Mr Martell’s evidence.
31 The design and effectiveness of the proposed erosion and sediment
control devices to mitigate the effects of stormwater discharges
during the construction phase provided my assessment with a set of
performance assumptions for these devices that I used in the
sediment yield modelling. This work is discussed in Section 9 of
Technical Report 15, and is further defined in the SSEMPs and in the
Construction Environmental Management Plan, Erosion and
Sediment Control Plan, the Chemical Treatment Plan and the
proposed consent conditions. This work is presented in Mr Gough’s
evidence.
32 The design and effectiveness of the proposed operational
stormwater management devices provided my assessment with a
set of performance assumptions which I used for contaminant
modelling. This work, is discussed in Section 15 of Technical Report
15, and presented in Mr Martell’s evidence.
33 Mitigation planting assumptions used to predict the effect of planting
on long term sediment yield were based on the work undertaken by
Boffa Miskell, and discussed in section 10 of Technical Report 11.
This work is presented in Mr Fuller’s evidence.
34 Technical details about the development of the Porirua Harbour
model, to supplement the discussion of Harbour modelling
methodology and results provided in my evidence, is presented in
Mr Robert’s evidence.
35 The results of the water quality characterisation analysis, the
sediment yield modelling, the stream sediment transport modelling
and the Porirua Harbour sediment transport modelling have been
used to inform the assessment of ecological effects. These effects
will be discussed in the evidence of Dr Keesing (freshwater
ecology) and Dr De Luca (marine ecology).

7
042407977/1320559.16
Figure 1: Relationship between the models and data sets used to
assess the water quality effects of the Transmission Gully Project from
construction.

8
042407977/1320559.16
Figure 2: Relationship between the models and data sets used to
assess the water quality effects of the Transmission Gully Project from
operation.
9
042407977/1320559.16
EXISTING WATER QUALITY – THE RECEIVING ENVIRONMENT
36 Existing water quality was determined using monitoring undertaken
at streams during dry and wet weather. This included visual
observations, and sampling for heavy metals, nutrients, TSS,
turbidity and hydrocarbons. Additional grab and automatic sample
testing for TSS and turbidity were taken in larger rainfall events.
Automatic turbidity loggers were installed in four locations for one
year. Assessment of fine particle sediment deposition on stream
beds and substrate was also undertaken.
37 The water quality of streams could be considered typical of streams
with similar land use, with the rural streams and upper portions of
all streams more impacted by nutrients and the lower sections and
more urban streams impacted by metals.
38 Monitoring showed that:
38.1 Existing water quality in the streams within Project
catchments is impacted by nutrients, including both nitrogen
and phosphorus constituents, with most sites exceeding
ANZECC2 ecological trigger levels. Biological growths occur in
some locations in low flow conditions, and are likely to be
related to existing nutrient levels. Objectionable odour was
not detected at sampling sites.
38.2 Some of the lower reaches of streams, such as Porirua,
Kenepuru, Duck, Ration and Horokiri have levels of metals
which on occasions exceeded ecological trigger levels. The
upper reaches of streams and the more rural streams tend to
have levels of metals that are below the ANZECC ecological
trigger levels. Poly-aromatic hydrocarbons were not
identified at any site at levels which exceed the ANZECC
ecological trigger levels.
38.3 The streams generally meet the ANZECC standard for
livestock drinking water purposes.
38.4 The streams generally have good clarity in dry weather and
small rainfall events, with the exception of the lower reaches
of the Porirua, Kenepuru and Pauatahanui Streams. In all
streams there was an absence of oil, grease and floatable
material. Scums and foams were present at some sites.
2 Australian and New Zealand Guidelines for Fresh and Marine Water Quality 2000.

10
042407977/1320559.16
38.5 The Wainui/Te Puka Stream, which is the only stream that is
managed for fishery purposes, meets the ANZECC standard
for fishery and fish for human consumption purposes.
38.6 With the exception of the Ration and Collins Streams, the
streams have predominately gravel beds. Most streams have
a low percentage of fine sediment. Higher percentages of
superficial fines were measured in the Ration and Porirua
streams. This helps us understand the sediment transport
regime active in the streams under the existing land use
conditions.
CONSTRUCTION EFFECTS ON WATER QUALITY
39 This section of my evidence discusses the actual and potential
effects of constructing the Project on water quality, including the
sediment load discharged in rainfall runoff to streams, and the
associated transportation and deposition of increased sediment
loads into streams and the coastal environment.
Sediment yield
40 The Universal Soil Loss Equation (USLE) was used to estimate the
baseline average annual sediment loss for all catchments that drain
to Porirua Harbour and for the Wainui/Te Puka and Whareroa
catchments. The estimated average annual sediment loss was
compared to the NIWA suspended-sediment yield estimator tool and
the ratio between the models was used to calculate the sediment
delivery ratio, which was then applied to the USLE calculation,
providing an estimate of sediment yield in each catchment.
41 Sediment rating curves to calculate event sediment yield from peak
flow, were developed using the calculated average annual sediment
yield and 50 years of simulated daily peak flow data, developed
using the SMWBM3 calculation of daily average flow and the flow
gauge records on the Porirua, Pauatahanui and Horokiri streams.
The sediment rating curve was applied to 20 years of simulated
daily flow data, and a long term harbour model simulation was
undertaken, this modelling indicated that the sediment accumulation
predicted by the model was consistent with sediment accumulation
measured in the harbour. The harbour modelling is discussed in
Mr Roberts’ evidence.
42 The rating curves were also validated with observed data (turbidity,
total suspended sediment and flow).
3 Soil moisture water balance model.

11
042407977/1320559.16
43 The sediment yield model was then adjusted to reflect the
construction staging scenario and the proposed mitigation design.4
Using design to manage construction effects
44 For the assessment of effects in the streams, the construction
staging scenario assumed the peak year for construction in each
stream. For the harbour, the construction staging scenario assumed
37.5ha of open earthworks in the Pauatahanui Inlet watershed and
17.5ha open in Onepoto Arm watershed.
45 The erosion control measures were assumed to remove 75% of
sediment on an average annual basis.
46 The chemically treated ponds were assumed to remove 70% of
sediment in the 2 year and 10 year ARI events and to remove 40%
of sediment in the 50 year ARI event.
47 The design of devices and the basis for the performance
assumptions are described in Mr Gough’s evidence.
Stream sediment transport modelling results
48 The predicted quantity of sediment input into the streams during
various rainfall events was modelled, so as to locate and quantify
sediment built up in streams during events. For the harbour
modelling, all sediment was assumed to reach the coast; this
reflects the long term transport of sediment through the streams
and into the Porirua Harbour and coastal area. 5
49 In order to assess the effect of the Project construction in isolation,
the ability to transport material from the channel bed was removed
from the model as a variable. Bed load is often estimated as 5-15%
of the total sediment load.6 As the bed transport function of the
model was not enabled, the modelling results describe relative
change in fine sediment deposition, rather than absolute sediment
transport and deposition.
50 The modelling accounted for the 1/3 of the 2 year (90th percentile
storm), 2 year, 10 year and the 50 year ARI storms. These storms
were chosen because they reflect a range of events from small
events that are almost certain to occur during the construction
programme through to a large event that could occur but is unlikely.
4 See Figure 15.46 in Technical Report 15.
5 Sediment transport was modelled in HEC-RAS 4.1.0. The hydraulic models contain geometry and flow information and were calibrated with rainfall and flow records. The hydraulic models were coupled to a 1D sediment transport model.
6 US Army Corps of Engineers (USACE) 1990: Environmental engineering for flood control Channels. EM 1110-2-1205. Washington, D.C.

12
042407977/1320559.16
51 The increases in TSS in the 1/3 of the 2 year and 10 year ARI
events range from an increase of 2% in the Pauatahanui and the
Porirua catchments to an increase of 79% in the Collins catchment.
The percentage increase is related to the proportion of the
catchment that will be in construction, and to the background TSS
levels which currently exist. In the 50 year ARI the percentage
increase is larger due to an assumed lower performance of erosion
and sediment control devices. The increase ranges from 4% in the
Porirua catchment to 158% in the Collins catchment.
52 The hydraulic modelling of the streams indicated that there was an
increase in the deposition of sediment in the streams in all modelled
events. Whilst the modelling indicated that sediment deposition did
increase in percentage terms, in terms of depth of sediment only
small increases in the relative depth of sediment deposition are
expected as a result of the Project.
53 In most scenarios the average change in bed deposition was less
than 1mm. An estimated maximum of 8mm increase was identified
in a 50 year ARI event in the Whareroa stream catchment. The
outcomes of this modelling were provided to Dr Keesing, in order
for him to consider the impacts on freshwater ecology.
Porirua Harbour modelling results
54 In order to understand how sediment moves around Porirua
Harbour, a coupled hydrodynamic, wave and sediment transport
model was developed7. This model is described in the evidence of
Mr Roberts.
55 The hydrodynamic, wave and sediment transport models
constructed as part of this study demonstrate acceptable calibration
with the available data.
Event based modelling
56 To understand the spectrum of potential effects, event based
modelling was undertaken for a range of storm events and wind
conditions. The results of this modelling have primarily been used
for the assessment of ecological effects.
57 Initial testing with the Harbour model indicated that sediment
deposition within the Harbour during heavy rain was greatly
influenced by the magnitude and location of the rainfall and by the
prevailing wind conditions during the event. Therefore, the event
based modelling was used to simulate the rainfall events coinciding
7 To represent the Harbour and undertake the event based and long term modelling assessments using the DHI MIKE 21 HD (hydrodynamic), MIKE 21 SW (Spectral Wave) and MIKE 21 ST (Sediment Transport) of Porirua harbour. All models were built using Flexible Mesh (FM) and version 2009, service pack five.

13
042407977/1320559.16
with calm conditions as well as a 90th percentile northerly and
southerly wind.
58 Simulations were carried out for a 15 day spring/neap tide cycle to
include a full tidal range in the scenarios. The wind conditions were
kept constant throughout the modelling period.8
59 Should a 2 year ARI rainfall event occur during the peak
construction, the model indicates this could contribute up to an
additional 200 tonnes of sediment to the Harbour (which is a 5%
increase on the predicted total load during a 2 year ARI event in the
‘without construction’ scenario). The model results indicate that
there will be little impact on sediment deposition patterns in a 2
year ARI rainfall event. Should this event occur during peak
construction there are likely to be isolated pockets of increased
sedimentation, typically less than 5mm deep, in locations already
heavily impacted and largely in the sub tidal areas of the Harbour.
The quantified increases in suspended sediment in a 2 year ARI
rainfall event are unlikely to be visually detectable for an extended
period of time.
60 Should a 10 year ARI rainfall event occur during the peak
construction period it is predicted that between 271 and 645 tonnes
of additional sediment will enter the Harbour. Between 4% and 9%
more sediment is predicted to enter the Harbour in a 10 year ARI
event, as compared to the ‘without construction’ scenario. The
model results determined that the effects of this additional sediment
are dependent on where it enters the Harbour and the coincident
wind conditions. The model was used to test a range of rainfall and
likely wind conditions. In most of the scenarios the analysis of the
10 year ARI events indicated that much of the additional sediment
would be deposited in the deeper central basins of the Harbour in
areas already experiencing high levels of deposition. However two
of the modelled events had a greater impact on areas which
Dr De Luca has identified as more ecologically vulnerable intertidal
zones.
61 These two events were:
61.1 High sediment loads entering the Harbour from the Duck and
Pauatahanui catchments during a northerly wind event; or
61.2 High sediment loads entering the Harbour from the Kenepuru
catchment during a southerly wind event.
8 The constant wind conditions were a simplification for modelling purposes, and not considered to represent a realistic wind scenario. The majority of the sediment drops out of suspension after 24 hours, and therefore the wind conditions after the first 24 hours are not a significant factor.
14
042407977/1320559.16
62 The likelihood of the 2 year and 10 year event occurring during the
whole construction programme and during the peak construction
period is discussed in Section 12.5.2 of Technical Report 15 and in
Dr Sim’s evidence.
Long term modelling
63 A long term simulation using a simplified Porirua Harbour model was
undertaken to understand the cumulative effects of the construction
of the Project on sediment deposition in the Harbour. The scenario
assumed a 6 year construction programme.
64 The long term model results provide an indication of the cumulative
effects of deposition in the Harbour from the full construction period.
Results were extracted after running the model for 10 years and 20
years. In the long term simulation, an additional 3000 tonnes of
sediment is estimated to enter the Harbour as a result of all the
construction activities. This represents around 2% of the total
terrestrial sediment load entering the Harbour over a 10 year
period. The long term model results indicated that little terrestrial
sediment deposited in the Harbour was subsequently washed out to
sea, and that much of the sediment would migrate over time into
the deeper central basins. The results indicated that 20 years after
the start of construction of the Project there would be almost no
detectable increase in sedimentation rates in the Onepoto Arm of
the Harbour and only an average increase of between 0.1 and
0.2mm/yr in the Pauatahanui Inlet.
65 The long term impact on sediment deposition of the proposed
mitigation planting discussed in Mr Fuller’s and Dr Keesing’s
evidence was assessed. Once this planting has established such
that it has the characteristics of native bush (which I am advised by
Mr Fuller will take between 15 and 20 years), it will, after a further
period of approximately 7 years, compensate for the increased
sediment load that is anticipated as a result of the road
construction. The mitigation planting was not accounted for in the
long term simulation discussed above.
Streams and coastal construction effects assessment
66 The potential effects of construction stormwater discharges on
streams have been assessed against the criteria in section 5.4.2 (as
required under Rule 5) of the Regional Freshwater Plan.
67 Small amounts of oil, grease and floatable materials could be
released into streams from construction machinery. Oil and grease
were not noted at any site in the water quality characterisation
sampling (described in paragraph 38.4 above). In my opinion, this
potential effect is best managed through the proposed Construction
Environmental Management Plan (CEMP). Proposed condition G.12
includes measures to manage the site, including the disposal and
storage of onsite rubbish, fuel storage, maintenance of vehicles and

15
042407977/1320559.16
the location of vehicle access and storage. Provided this plan is
implemented, I think these potential effects can be managed to an
acceptable level.
68 While the TSS is expected to increase, the contaminant
concentration is not expected to alter; therefore I would expect no
change or a small change in scums, foams, odour, stock drinking
water quality, biological growths and bathing water quality.
69 During heavy rainfall events the visual clarity and colour, even
without the additional sediment associated with the Project
construction, is likely to exceed ANZECC guideline values for
recreational water quality and aesthetics in all streams and the
coast. While the predicted changes attributable to the Project may
be conspicuous, the effect of the increased TSS on visual clarity and
colour is not expected to have a lasting effect in the streams or in
coastal waters.
70 Storage of water in sediment ponds can result in an increase in the
stored water temperature. However, I do not expect the
temperature in the receiving streams to increase by more than 3
degrees celsius. I do not expect the natural temperature of the
water to exceed 25 degrees celsius as a result of construction
stormwater discharges.
71 The chemical treatment of sediment treatment ponds (to reduce
TSS) can result in an increase in pH and increases in the discharge
of Aluminium. In my opinion this potential effect is best managed
through the proposed conditions. Condition E.15 identifies
monitoring requirements including for pH and condition E.19
requires the development of a chemical treatment plan including
details of monitoring, optimum dosage and a spill contingency plan.
72 During construction, additional sediment deposition is predicted to
occur in all streams; the additional deposition is predicted to
accumulate to very shallow depths and will not affect the stream
channel capacity to convey flows.9 The ecological assessment of the
predicted increase in sediment loads during the Project’s
construction is discussed in Dr Keesing’s evidence.
73 During construction, additional sediment is expected to be conveyed
by the streams into the coastal receiving environment. As noted
above, the the modelling results indicated that, 20 years after the
start of construction of the Project, there would be almost no
detectable increase in average annual sedimentation rates (as
compared to the “without construction scenario”) in the Onepoto
Arm of the Harbour over that period, and only an annual average
9 Table 15.33 Maximum Sediment Deposited, Technical Report 15.
16
042407977/1320559.16
increase of between 0.1 and 0.2mm/yr in the Pauatahanui Inlet
during that timeframe. In the longer term, mitigation planting
proposed may reduce the sediment yield such that the increase
associated with the road is compensated for, by a long term
reduction in sediment load. The majority of sediment is transported
in rainfall events. In large rainfall events, with coincident northerly
or southerly winds, sediment may be deposited in the ecologically
vulnerable intertidal zones. Dr De Luca’s evidence discusses the
ecological effects of the predicted increase in sediment deposition in
the coastal area during the Project’s construction.
OPERATIONAL EFFECTS ON WATER QUALITY
74 This section of my evidence discusses the impact of stormwater
discharges during the operation of the Project on the contaminant
load in streams, in the Porirua Harbour and along the Kapiti Coast.
Operational stormwater discharge results
75 For each catchment, the proportion of the catchment which will be
converted to road was calculated. This was then weighted with
median concentrations from motorway studies for TSS, total and
dissolved zinc and total and dissolved copper. The proportion of the
catchment that will not be converted to road was weighted with the
median concentrations of each parameter, collected during the 2010
water quality characterisation sampling.
76 This method was used to estimate impacts in each stream
catchment, at the most upstream discharge point, immediately
downstream of the road and near the stream mouths.
77 The results of this analysis indicated that predicted small increases
in concentrations are not expected to exceed ecological ANZECC
guideline values for any of the catchments that do not already
exceed ecological guideline values.
78 In addition to the catchment and motorway data method, the
Auckland Regional Council’s Contaminant Load Model (CLM) was
used to assess the relative change in stormwater quality. The CLM
incorporates the change in traffic associated with the Project and
allows for the assessment of cumulative effects from other planned
changes in land use.
79 A CLM was computed for each of the 23 watercourses that drain to
the Porirua Harbour, and the Wainui/Te Puka and Whareroa
catchments.
80 For some catchments, there is expected to be an overall
improvement in water quality at the mouth of the stream due to the
diversion of traffic off existing roads that have no stormwater
treatment.

17
042407977/1320559.16
81 The stream catchments that the CLM predicted to have sediment
quality poorer than the ANZECC ISQG10 trigger levels for
ecosystems in the ‘2031 without the Project’ are: the Porirua,
Kenepuru and Collins stream catchments for zinc, and the Porirua
stream catchment for copper.
82 The contaminant load for the Porirua Stream catchment and the
Collins Stream catchment is predicted to reduce in the scenario
‘2031 with the Project’. The contaminant load of zinc in the
Kenepuru Stream catchment is expected to increase by 2%. For all
other streams, the sediment quality is predicted to be better than
the ISQG-low ecological trigger values. There is no change
predicted in the rate or location of sediment deposition in streams in
the operational phase of the Project.
83 The increase in imperviousness associated with the Project is
approximately 1 - 2% per catchment. I consider that will have only
a slight effect on stream flows. This is because the percentage
amount of impervious area is small, and because wetlands are
proposed for some catchments (Horokiri, Ration, Pauatahanui and
Wainui) and will be designed to include extended detention. Native
planting is also proposed which will in part compensate for increases
in imperviousness in some catchments. Erosion protection
measures will be used to protect streams from erosion at point
source discharge locations. Erosion protection is discussed in
Mr Gough’s evidence.
84 In the Onepoto Arm of the Porirua Harbour and the Kapiti Coast,
levels of TSS, metals and total petroleum hydrocarbons (TPH) in
stormwater discharged are predicted to decrease. This is because
the Project will displace traffic off existing roads that do not provide
stormwater treatment.
85 Levels of TSS, metals and TPH in stormwater discharged to the
Pauatahanui Inlet are predicted to slightly increase as a result of the
Project. This is because the Project will result in a change in the
distribution of traffic with more traffic directed into the watershed of
the Pauatahanui Inlet.
Assessment against Regional Freshwater Plan Standards
86 The potential effects of operational stormwater discharges have
been assessed against the permitted activity standards (under Rule
2) of the Regional Freshwater Plan.
87 For many catchments, a decrease in TPH is expected. For those
where an increase is expected, in my opinion the proposed
10 Interim Sediment Quality Guidelines, Australian and New Zealand Guidelines for Fresh and Marine Water Quality 2000.

18
042407977/1320559.16
treatment devices will treat stormwater sufficiently so as to prevent
the production of conspicuous oil and grease or notable increases in
the emission of objectionable odour in streams and the marine
environment.
88 All treatment devices are proposed to include gross pollutant traps.
Therefore, it is expected that there will be a less than minor
increase in floatable or suspended material in streams or the marine
environment.
89 For all catchments, a small reduction in TSS is expected. For some
streams, a reduction in contaminants is also expected. In these
watercourses, a small positive effect in visual clarity and colour may
be expected. In streams where an increase in contaminants is
expected, in my opinion the proposed treatment devices will treat
stormwater sufficiently so as to prevent any notable change in
visual clarity or colour in streams and the marine environment.
90 In all streams, the levels of metals are lower than stock drinking
water guidelines and the proposed treatment devices will treat
stormwater sufficiently so as to prevent increases that would exceed
these guidelines. In the Wainui/Te Puka stream, the only stream
managed for fishery purposes, the metals are currently below the
ANZECC guideline levels covering fish for human consumption. The
proposed treatment devices will treat stormwater sufficiently so as
to prevent increases that would exceed the fish for human
consumption ANZECC guideline. Metals are predicted to slightly
decrease in the Onepoto Arm and the Kapiti Coast. In the
Pauatahanui Inlet, the small increase in metals is well below the
trigger levels for bathing quality, and therefore I would expect no
change in bathing quality standards.
91 While stormwater treatment in wetlands can increase the
temperature of stormwater, I do not expect any discharges to result
in a change in temperature greater than 3 degrees in streams or the
marine environment. I do not expect the natural temperature of the
water in the streams or the marine environment waters to exceed
25 degrees as a result of operational stormwater discharges.
92 I do not expect any operational stormwater discharges to result in a
change in scums and foams, pH, dissolved oxygen, biological
growths, or sediment deposition.
93 The ecological assessment of the predicted increase in contaminant
loads during the Project’s operation, on streams is discussed in
Dr Keesing’s evidence and on marine ecology in Dr De Luca’s
evidence.

19
042407977/1320559.16
METHODS TO MANAGE EFFECTS DURING CONSTRUCTION
(INCLUDING CONDITIONS)
94 The assessment of water quality effects during construction included
assumptions around construction staging, the quantity of sediment
discharged in stormwater, and the quantity of other contaminants
discharged in stormwater.
Site Management
95 During construction, litter and oil could be discharged from the
construction site. In my opinion, this potential effect is best
managed through the proposed CEMP. Proposed condition G.12
includes measures to manage the site, including the disposal and
storage of onsite rubbish, fuel storage, maintenance of vehicles and
location of vehicle access and storage. The CEMP condition sets a
framework that is consistent with my assumptions for the
assessment of water quality effects.
Unplanned discharges
96 Condition G.19 sets out a process for notifying the manager of the
consents department of the Regional Council if any contaminants
(including sediment) or material are released and enter any
watercourse. This requires the consent holder to establish control
measures, liaise with the manager on remediation and
rehabilitation, to carry our remedial action and record incidents and
steps taken to remedy adverse ecological effects. This condition sets
a process for managing potential effects of unplanned discharges,
which is consistent with my assumptions for the assessment of
water quality effects.
Construction staging
97 The CEMP is described in condition G.12. This condition requires a
staging programme to be reviewed and certified, which includes
details on a methodology to identify how earthworks will be staged
during the relevant part of the Project to manage the effects of the
Project on the Pauatahanui Inlet. I support a staged approach as
my analysis has indicated that staging the Project is a key factor in
avoiding potential effects associated with substantial increases in
sediment loads.
98 In addition, conditions E.1 and E.2 set open earthworks limits in the
Pauatahanui Inlet and Onepoto Arm watersheds. These limits for
earthworks reflect the open earthworks assumptions in the
modelling undertaken for the assessment of effects on water
quality. The specified limits will manage the road construction in a
manner that accounts for the cumulative effects of open earthworks.
It also provides limits on open earthworks in those catchments that
were identified as the most sensitive, thus limiting potential effects.
Further reducing sediment loads would require reducing the open
earthworks areas in catchments such as the Duck and Kenepuru.
20
042407977/1320559.16
This is not proposed because it would result in a longer construction
programme.
Performance management
99 Mr Gough recommends that the wording of conditions is changed
to address the design and performance of sediment control devices,
so it is consistent with the assumptions in my assessment of water
quality effects. I support this wording change, because it better
reflects the assumptions made in the assessment of water quality
effects.
100 Performance monitoring will be specified within each Erosion and
Sediment Control Plan. Monitoring is outlined in conditions E.15 and
E.16. The intent of the monitoring will be to confirm that effects
that are occurring meet agreed performance criteria. The
parameters also include monitoring for levels of pH and aluminium
(Al3+) to ensure the chemical treatment of sediment retention
ponds is not outside of agreed performance criteria. Conditions E.18
and E.19 set out a process for chemical treatment and the
development of chemical treatment plans, which include monitoring,
maintenance and providing details of optimum dosage. Mr Gough
has recommended changes to these conditions; I support his
recommendations, because chemical treatment has the potential to
reduce pH of the discharge, which could impact on downstream
water quality. My assessment has assumed that chemical treatment
is designed and maintained in a manner which avoids this potential
risk. The recommended modifications suggested by Mr Gough set
a framework for the development of chemical treatment that is
designed and operated in a manner that is consistent with the
assumptions in my assessment of water quality effects.
RESPONSE TO KEY ISSUES REPORT
Greater Wellington Regional Council
101 In Section 4.7.2 of the Key Issues Report the Greater Wellington
Regional Council notes that Rule 7 of the Regional Freshwater Plan
provides for the minor abstraction of fresh water as a permitted
activity subject to conditions. It is therefore possible that drinking
water takes occur in the catchments affected by TGP. During the
Project’s operation I would not anticipate any effect on existing
water takes. During construction, additional sediment may impact
on the quality of permitted drinking water takes. However, it is
unlikely that people will be abstracting drinking water during
storms, and therefore I consider the main potential risk being to
water intake equipment.
102 Section 5.7 of the Report discusses the removal of plantation
forestry (RC1). The earthworks associated with this forestry
removal would be subject to the open earthworks condition E.2,

21
042407977/1320559.16
which limits the peak area of non-stabilised earthworks in the
Onepoto catchment to 17.25 ha.
RESPONSE TO SUBMISSIONS
Submitter 43 – Department of Conservation
103 The Department of Conservation (DOC) submission raises a number
of points regarding the modelling of sediment yield and retention. I
have also read the memorandum of counsel on behalf of the
Director-General of Conservation in relation to a request for peer
review of sediment generation modelling, dated 11 November 2011
(together with appended reports by Dr Les Basher and Brian
Handyside).
104 The modelling methodology for sediment generation and delivery
was developed by a team at SKM. I coordinated the technical work,
under the guidance of Dr Phillip Jordan, who is the global practice
leader for modelling catchment processes at SKM. The development
of the soil moisture water balance model was undertaken by John
Hansford, who at time was employed as a Senior Hydrologist at
SKM. The unit hydrograph modelling is discussed in Mr Martell’s
evidence.
105 The estimation of sediment yield for the Transmission Gully Project
has relied on four models:
105.1 The USLE to estimate soil loss under the existing and both the
“with construction” and “without construction” scenarios;
105.2 Suspended sediment yield estimator (SSYE) to estimate
sediment yield and calculate a sediment delivery ratio for the
USLE;
105.3 The soil moisture water balance model to calculate daily
average and daily peak flows; and
105.4 The unit hydrograph models to calculate storm peak flows
and volumes.
106 For the purposes of assessing the effects of the Project on water
quality, the primary interest is the sediment that is delivered to the
receiving environment. In the text, ‘Handbook of Erosion Modelling’
it is stated: “When dealing with practical problems, it is important to
decide how much information is needed on the processes by which
sediment gets detached, transported and deposited. If it is sufficient
to know only the quantity of material eroded over time, there is no

22
042407977/1320559.16
need to assess the different processes and a lumped model is likely
to suffice.” 11
107 The NIWA tool suspended sediment yield estimator (SSYE) is a
lumped empirical model that provides sediment yield for all
catchments in New Zealand and has been calibrated against a large
NZ dataset, it has been reported as predicting 96% of variance for
measured North Island yields with a variance of 1.8. However the
model cannot be used to assess change in landuse directly. 12
108 The USLE is an empirical method for estimating sediment loss, and
can model the change in soil loss resulting from a change in land
use. It is a widely used and accepted method of estimating sediment
loss, which has been shown to perform well compared with process-
based models: Studies13 have shown that overall, average annual
and even annual values of soil erosion rates as measured on erosion
plots are not better predicted by using a dynamic, process-based
model rather than a statistical approach”14.
109 A limitation of the USLE is that it only predicts erosion from sheet
and rill erosion, not gully erosion, mass movement or stream bank
erosion. The USLE only models sediment loss on a plot scale, and
the application of a sediment delivery ratio (SDR) is required to
estimate the sediment yield at the receiving environment. A
comparison between the estimates of sediment loss made by the
USLE and the sediment yield from the SSYE was made and a strong
relationship between the two models was found (see Figure 3
below). The ratio of 0.17 between the models was applied as the
SDR for the USLE in all catchments. It is recognised that using the
ratio of the two models to calculate a catchment wide SDR is a
pragmatic solution, to a complex problem.
11 Morgan R.P.C. and Nearing M.A Handbook of Erosion Modelling. Pg 19
12 Hicks DM, Shankar U, McKerchar AI, Basher L, Jessen M, Lynn I, Page M 2011. Suspended sediment yields from New Zealand Rivers. Journal of Hydrology (NZ) 50: 81-142.
13 Tiwari Ak, Risse LM, Nearing MA, 2000: Evaluation of WEPP and its comparison with USLE and RUSLE, from the Transactions of the American Society of Agricultural Engineers. 43, pg 1129 -1135
14 Morgan R.P.C. and Nearing M.A Handbook of Erosion Modelling.pg 124
23
042407977/1320559.16
Figure 3: Comparison of sediment loss with sediment yield
110 Using a standard SDR effectively attributes all of the sediment that
is calculated by the SSYE to surface erosion processes, when in
reality a proportion of this sediment would be generated by other
processes such as gully erosion, mass movement and stream bank
erosion. For the baseline scenario, this SDR simplification is
acceptable, because the interest is in sediment yield from all
sources, to provide the context for the additional sediment that will
be generated from the road construction.
111 For the construction scenario, the fixed SDR of 0.17 established
from the baseline scenario may underestimate the proportion of
sediment generated from the construction areas that is delivered to
the receiving environments because there may be stronger
connection between the construction areas and the receiving
environment. However, when the calculated estimates of sediment
yield from the construction areas (see Table 1 below) are compared
to literature values for rates of erosion measured from construction
sites1516, the values are similar. Therefore, this simplification is
considered suitable at this scale.
15 ARC 2006 ICMP funding eligibility guideline. Contaminant Load Model. Earthworks 12 months, slopes <10 degrees: 25000 kg/ha/yr. Slopes 10 – 20 degrees: 150000 kg/ha/yr.
16 ARC 2003: Predicting sediment loss under the proposed development in the Waiarohia catchment. Ng and Buckeridge (2000) in a review of sediment yields from construction sites within the Auckland region. Interannual bare earth sediment losses range between 5,000kg/ha/yr (1981) and 36,000 kg/ha/yr(1966), whilst the predicted daily loss of sediment peaked at over 26,000 kg/ha/day in February 1966.
y = 0.17x
0
1000
2000
3000
4000
5000
6000
7000
0 10000 20000 30000 40000
SSY
E (T
on
ne
s /y
r)
USLE (Tonnes/yr)
Sediment Delivery Ratio
Series1
Trend

24
042407977/1320559.16
Table 1. Sediment from Road construction areas in Ration and
Horokiri catchments
Transmission Gully Peak Construction Scenario. SDR 0.17 applies to both scenarios. No erosion or sediment control applied. P of 0.9 in construction scenario. C factor alters to reflect landuse change.
Kg/Ha/Yr
Ration (24 Ha)
Baseline 800
2017 Road. Approx 7 degrees 47500
Horokiri (21 Ha)
Baseline 2600
2018 Road. Approx 19 degrees 114800
112 The first method of verifying the estimate of the average annual
sediment load was to run a long term simulation of the Harbour
model for 20 years (this is described in Section 12.6.1 of Technical
Report 15). This modelling indicated that the rates of deposition
predicted using the average annual sediment load were broadly
consistent with sediment accumulation depths measured in the
Harbour. This is further discussed in Mr Roberts’ evidence.
113 The second method of verification was to compare observed data
with the calculated sediment rating curve. When this data is plotted
against the rating curve, good agreement was found (as illustrated
in Figures 15.43 – 15.45 in Technical Report 15). In his report,
Dr Basher states that the plot of TSS and flow for Horokiri, looks
entirely reasonable (paragraph 27), but he is uncertain how the
rating curve was developed and questions why the USLE method
was used to derive the sediment rating curve rather than developing
a curve from observed data.
114 The rating curve was developed by assuming that 50 years of
simulated flow data would provide a sufficiently long record to
calculate an average annual sediment load. Therefore, the rating
curve selected was the curve that enabled the average annual
sediment load to be distributed across the flow record such that the
average annual sediment load was achieved after 50 years. This
calculation assumed an exponent of 1.9 for all curves. The rating
curve was then adjusted to reflect the percentage increase in
average annual sediment load, calculated using the USLE (adjusted
with the SDR) in the construction scenario. The advantage of this
method over calculating a rating curve from the observed data is
that this rating curve relates to the landuse in the catchment
through the USLE, and therefore can be adjusted to reflect the
predicted landuse change. The observed data was only collected for
one year at the same time as the model was being developed, and
therefore this data was considered more suitable for verification.

25
042407977/1320559.16
115 The report by Dr Basher (paragraph 26) acknowledges the peak flow
to event sediment yield relationship is very good (illustrated in
Figure 15.43 – 15.45 in Technical Report 15). He is unclear how
turbidity data was converted to sediment yield and states that there
is likely to be high uncertainty in the data points. The calculation of
turbidity data to sediment yield was undertaken by converting
turbidity to TSS, using the relationships described in Table 15.84 of
Technical Report 15. Specific events were selected and event loads
were calculated using the turbidity and flow gauge data for the
event duration. The flow gauge record was adjusted to represent
flow at the turbidity logger site. For grab sample data, the measured
concentrations were taken to be average concentrations, and the
loads were calculated from SMWBM flow and measured flow
estimates. It is recognised that there is uncertainty around these
estimations of event sediment loads, but they are suitable for
verifying the sediment rating curve.
116 The submission from DOC17 and report by Dr Basher18 suggest that
other models may have been more suitable for calculating sediment
yield for this Project, (such as the GLEAMS model and WEPP model).
The GLEAMS model has been used by NIWA for the estimation of
sediment yield for the recent Waterview Connection Project. The
GLEAMS model is a process-based model as regards the simulation
of runoff and sediment, and relies on the factors of the USLE as part
of the erosion component sub models. The WEPP model is a daily
simulation model based on hydrology and erosion processes.
117 GLEAMS models sheet and rill erosion; it does not model mass
movements or stream bank erosion. Therefore a baseline estimate
of sediment yield generated using GLEAMS may underestimate
sediment yield; exhibiting the same behaviour as the USLE
approach that was used for the Project. Both GLEAMS and WEPP can
model erosion processes within catchments. However for the
Project the key concern is about the sediment yield at the receiving
environment. Using GLEAMS and WEPP, it is possible to assess the
effectiveness of erosion and sediment control devices at specific
locations. However, the Transmission Gully Project’s construction
methodology, including the erosion and sediment control design,
has not yet been developed in detail. Therefore, the approach used
for the Project, where the performance of sediment control devices
is applied to the sediment yield calculations, is more consistent with
the current level of information available.
118 GLEAMS, allows for the calculation of daily sediment loads, and
therefore seasonal variations and staging can be assessed.
However, the construction methodology for the Transmission Gully
17 Paragraph 9
18 Paragraphs 29 - 32

26
042407977/1320559.16
Project does not yet enable a staging programme linked to seasons
to be applied. Therefore, the approach used (being to calculate an
estimated peak construction year to generate an estimate of
average annual sediment under the construction scenario) is more
consistent with the current level of information available.
119 In summary, the approach adopted for the Project is pragmatic and
suitable. When the model projections for the existing situation are
compared with observed sediment accumulation in the Harbour and
measured suspended sediment concentrations in streams, good
agreement is found. This provides confidence in the long term and
event based sediment yield predictions. For the construction
scenario, the construction design is not sufficiently developed to
enable the complex assessment available with process-based
models such as GLEAMS or WEPP to be fully utilised. When the
estimates of sediment yield from the construction areas are
compared with literature values there is good agreement. This
affords confidence that the adopted modelling approach provides a
realistic estimate of sediment yield in the existing and the
construction scenarios and is suitable for assessing the effects of the
Project.
120 The DOC submission19 states that the generation of sediment does
not include any analysis of uncertainty, and there is little data to
confirm the accuracy of the model’s predictions. The verification
process described above has been used to provide confidence, given
the uncertainty associated with the estimation of sediment yield.
Additional scenarios with higher and lower estimations of the
average annual sediment load or different rating curve shapes,
could be modelled. Any change would apply to both the ‘with
Project’ and ‘without the Project’ scenarios, and therefore would be
unlikely to significantly alter the relative change between scenarios.
121 The other area of uncertainty relates to the sediment generated by
the Project construction. This is most relevant in understanding the
effects of the Project. The main factors that contribute to the
generation of sediment in the construction scenario are the open
areas of earthworks and the effectiveness of the erosion and
sediment control measures. While it would be possible to model a
range of different assumptions, it is my opinion that this uncertainty
is best managed by the conditions. Conditions E.1 and E.2 set
earthworks limits that are consistent with the assessment of effects.
Conditions E.3 and E.15 and E.16 set performance and monitoring
standards to manage the erosion and sediment control measures, in
a manner that is consistent with the assumptions in the assessment
of effects.
19 Paragraph 10

27
042407977/1320559.16
122 Dr Basher’s report concludes that it is unclear how the USLE was
applied to the specific works of TGP and the specific locations.
Section 10.6.2 of Technical Report 15 describes how the baseline
USLE was altered to reflect 2021 landuse and the Project. The
factors that were altered were the C20 factor, the P21 factor and the
SRE22 factor. The C factor was altered to reflect 2021 land use in
both the ‘with the Project’ and ‘without the Project’ scenarios. In the
‘with the Project’ scenario, it was also altered to describe bare earth
for a 75m wide length along the proposed open earthworks area of
the Project alignment. The SRE factor describes the effectiveness of
the erosion control measures. For the ‘with the Project’ scenario, the
erosion control measures were assumed to have a 75% treatment
efficiency, and were applied to the whole of the alignment area
described as bare earth. The P factor was adjusted from 1 to 0.9 to
represent bare soil with a rough irregular surface. The assumptions
for open earthworks are described in Section 3 of Technical Report
15. Figure 15.1 of that Report illustrates the locations of the
coincident open earthworks areas in the Kenepuru, Duck and
Horokiri catchments that were used as the peak construction
scenario for the Harbour modelling.
123 DOC’s submission23 states that the magnitude or probability of
adverse effects on the Pauatahanui Inlet and streams could be
greater if the amount of sediment generated by the Project is
greater than predicted. While this is true, there could also be lesser
effects if the amount of sediment generated by the Project is less
than predicted. The approach taken has been to select a scenario
that represents a realistic estimation of the effects in the 2 year ARI
and 10 year ARI rainfall events. In addition, conservative
assumptions have been applied. Peak open earthworks have been
assumed and so it follows that for the majority of the Project it is
likely that the area of open earthworks, and therefore sediment
yield, will be less than those assumed. It is assumed that the open
earthworks are always in soils that have the characteristics of
surface soils, while in reality there are significant sections of rock
and cohesive sub-soils, which are less erosion prone. The 90th
percentile northerly and southerly winds are also assumed to
coincide with rainfall events.
124 DOC’s submission24 states that assessment of rainfall events and
sediment yield should not be limited only to the 2 year peak
construction period, but should be extended to include information
20 Cover
21 Bare soil management
22 Sediment removal efficiency
23 Paragraphs 11 and 14
24 Paragraph 12

28
042407977/1320559.16
for the 6 year construction timeframe. The assessment does account
for the whole period. Firstly, the event based scenarios where the 2
year and 10 year events are modelled coinciding with the peak
construction period, are a conservative assessment of effects for the
entire construction period, the likelihood of these events occurring
over the entire construction period is discussed in Section 12.5.1 of
Technical Report 15, and further discussed in Dr Sim’s evidence.
Secondly, the long term modelling accounts for the increased
sedimentation over the entire construction period. This is discussed
in Section 12.6 of Technical Report 15.
125 The DOC submission25 states that it is unclear as to whether climate
change predictions have been applied to the sediment yield
predictions. Climate change scenarios were not applied to the
calculation of the sediment yield. The construction period for the
assessment of effects was assumed to be 2016 – 2021. While it is
recognised that the IPCC climate change predictions provide a linear
increase in temperature and associated climatic effects between the
present time and future, the Ministry for the Environment
Guidance26 27 provides projections for scenarios starting at 2040, by
which time the road construction is likely to be complete. Modelling
could be undertaken to assess the impact of climate change on
sediment yield. However, this would apply to both the ‘with the
Project’ and the ‘without the Project’ scenarios and therefore the
relative change between the scenarios is unlikely to be significantly
altered. If climate change was applied to the sediment yield
calculations for the assessment of effects, projected sea level
increases would also be applied, which would alter the intertidal
areas being assessed for their ecological values. However, changes
in rainfall intensity could result in changes to the sizing
requirements for the sediment retention ponds, therefore I suggest
the conditions are amended to require that relevant climate change
guidance is applied to sediment pond design, at the time of
construction.
126 The DOC Submission28 also suggests that larger events than the 10
year ARI should be considered. I have undertaken calculations of
the change in sediment in the 50 year ARI event, and these
calculations have been provided for the assessment of the effects in
the streams. After discussion with Dr De Luca, it was decided not
to model the 50 year ARI in the Porirua Harbour. Her advice was
that the background effects in the ‘without the Project’ scenario
25 Paragraph 16
26 Ministry for the Environment 2008: Tools for estimating the effects of climate change on flood flow. A guidance manual for local government.
27 Ministry for the Environment 2008: Climate change effects and impact assessment. A guidance manual for local government.
28 Paragraph 16

29
042407977/1320559.16
were likely to be such that the 2 year and 10 year ARI scenarios
were a higher priority for assessment.
127 The DOC submission29 suggests that the sediment generation and
management assessment be independently peer reviewed. The
assessment of water quality effects has already been subject to peer
reviews. NZTA engaged Dr Tim Fisher and Dr Alastair Senior from
Tonkin and Taylor who undertook an independent peer review. In
addition, an independent review was also undertaken for the RATAG
group by Golders. These peer reviews have provided valuable
comment that has been carefully considered and taken into account
in the development of the assessment of effects, and none have
raised concerns about the validity of the USLE equation and the
predictions of sediment.
Submitters 32, 35, 42 Pauatahanui Inlet Community Trust,
Guardians of Pauatahanui Inlet, Paremata Residents
Association
128 The submitters propose a number of possible mitigation options. It
is suggested that NZTA contribute to plans contained in the Harbour
Strategy aimed at reducing sediment entering the harbour from
sources other than the Transmission Gully Project. The sediment
yield model developed for the Project provides a suitable tool for
assessing the relative change in sediment generation that could be
expected from landuse change within the harbour catchment.
129 The submitters recommend that NZTA be required to continuously
update stormwater treatment methods. The NZTA is not seeking
resource consent for the operational stormwater discharges because
they meet the permitted standard, and therefore this
recommendation may be best implemented through NZTA’s
stormwater maintenance programme.
130 The submitters also recommend that stormwater treatment
measures be installed to treat stormwater from other roads in the
catchment. It would be possible to retrofit stormwater management
devices to treat runoff from existing roads in many locations. This
would reduce sediment loads delivered to the Harbour from these
other sources, and it may be that devices could be installed such
that the small increase in contaminants in the Pauatahanui Inlet
associated with the Project could be compensated for, resulting in
reduction in the overall contaminant loads to the whole of the
Harbour. However, the stormwater management devices that are
proposed to treat operational stormwater from the Project are
predicted to be successful at reducing contaminant loads, and the
water quality effects that are predicted as a result of the operational
stormwater discharges do not necessitate the need for additional
29 Paragraph 17.

30
042407977/1320559.16
mitigation. (My evidence excludes discussion of ecological effects
which are discussed by Dr Keesing and Dr De Luca).
Submitter 46 Pukerua Bay Residents Association
131 The submitter states that the construction of the Transmission Gully
Project must not contribute to environmental degradation and
should ideally contribute to mitigating existing damage. The water
quality effects of the Project (excluding the ecological effects,
discussed by Dr Keesing and Dr De Luca), are largely avoided
through the use of erosion and sediment control devices. In the
long term the increase in sediment generated during construction
will result in only a small increase in infilling of the Harbour, and in
time the proposed mitigation planting will compensate for that small
increase in infilling. When the road is operational the proposed
stormwater management devices are expected to be effective at
removing contaminants, and it is expected that the Onepoto arm of
the Harbour will experience a slight improvement in water quality
and the Pauatahanui inlet will experience a small increase in
contaminant load.
Submitter 31 Sheriden and Osborne, 36 G&M Milner 51
Mr Jianfei Li, 52 Mrs J E Gray, 62 D&J Barnes, 63 SB Hill & J
Sinclair Grace
132 The submitters raise a concern that construction sediment could
build up in the stream at 27000 to Culvert PO6. The sediment in
this catchment (Porir3HR, Table S.1, Appendix 15.S of Technical
Report 15) during the peak construction period is predicted to
increase by 17% in the 2 year and 10 year ARI and 33% in the 50
year ARI. The proposal at culvert PO6, discussed in Mr Martell’s
evidence, is to provide some attenuation for flows in the 10 year
ARI event and larger events. This is likely to result in less sediment
being discharged downstream of the culvert in these events. This is
likely to provide a small benefit for the stream and harbour
downstream of the culvert in these events, but is likely to result in
local deposition of sediment behind the culvert. The Porirua Stream
and Porirua Harbour sediment transport and deposition modelling
did not account for sediment deposition in this location, and make
the conservative assumption that all sediment from this catchment
reaches the Porirua Stream and that all sediment from the Porirua
Stream reaches the Harbour. Dr Keesing discusses the ecological
effects of the proposed culvert and increase in sediment loads.
Submitter 15 Cannons Creek Residents and Ratepayers
Association
133 The submitter is worried that that the chemical runoff from the new
link road tar seal may affect pets and plant life. With the proposed
stormwater treatment, the operational stormwater discharges are
unlikely to cause adverse effects on plants or pets. The predicted
concentrations in the ‘With Project’ scenario, for zinc and copper in
all streams, are below the contact recreation and drinking water