gully toolboxenvironment.gov.au/.../files/grant-gully-toolbox.docx · web viewgully toolbox a...
TRANSCRIPT

Gully ToolboxA technical guide for the Reef
Trust Gully Erosion Control Programme 2015-16
Scott Wilkinson1, Aaron Hawdon1, Peter Hairsine2, Jenet Austin1
1 CSIRO Land and Water2 The Fenner School, Australian National University
1
© Commonwealth of Australia 2015
The Gully Toolbox is licensed by the Commonwealth of Australia for use under a Creative Commons Attribution 4.0 Australia licence with the exception of the Coat of Arms of the Commonwealth of Australia, the CSIRO logo, the logo of the agency responsible for publishing the report, content supplied by third parties, and any images depicting people. For licence conditions see: https://creativecommons.org/licenses/by/4.0/.
Attribute this document as: Wilkinson S, Hawdon A, Hairsine P, Austin J. 2015. Gully Toolbox. A technical guide for the Reef Trust Gully Erosion Control Programme 2015-16. Commonwealth of Australia.
The Commonwealth of Australia has made all reasonable efforts to identify content supplied by third parties using the following format ‘© Copyright, [name of third party]’.
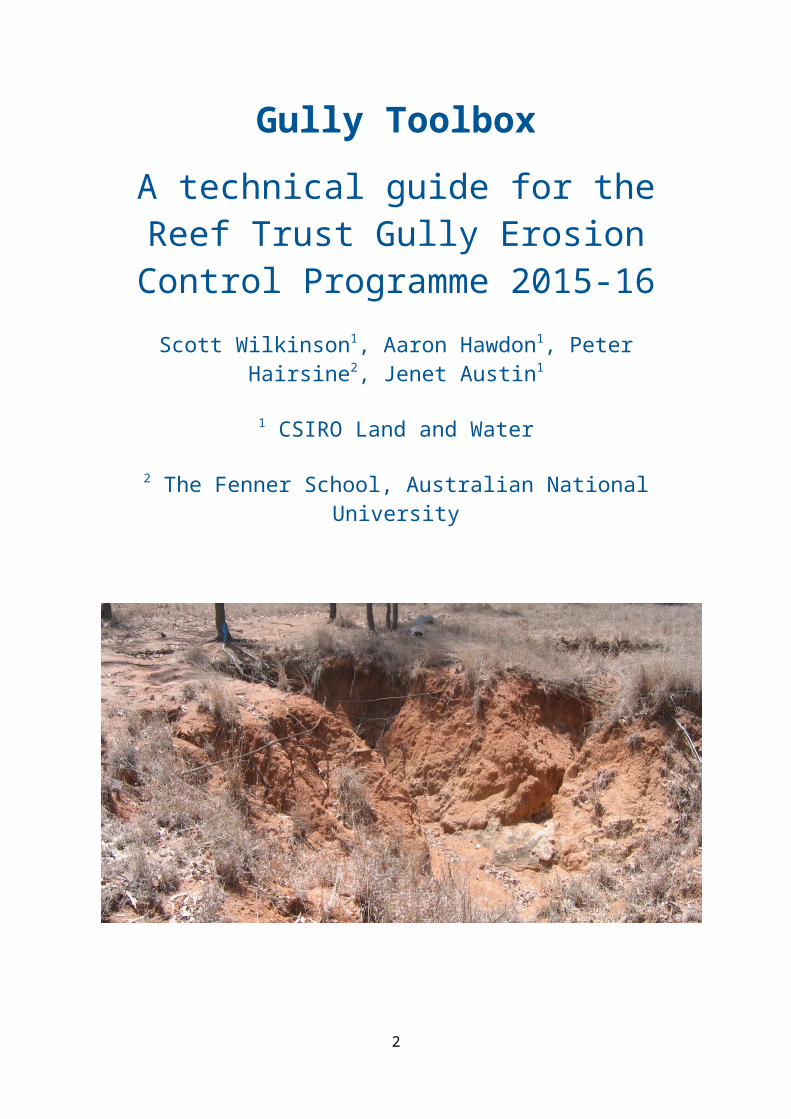
Cover image: Gully erosion in the Upper Burdekin catchment, photographer Rebecca Bartley.
2

Executive Summary
This is a guide to selecting, designing and implementing gully erosion control activities to cost-effectively reduce sediment yield to the Great Barrier Reef (GBR) lagoon. It supports the Reef Trust Gully Erosion Control Programme 2015-16.
Gully erosion supplies ~40% of the fine sediment exported into the GBR lagoon, from just 0.1% of grazing land area. Gully erosion is where runoff cuts into the land surface to a depth of >0.3m, usually within a sharply defined area. It occurs along drainage lines and in deep depositional soils adjacent to some large river channels. Most gullies in the catchments of the GBR formed in the period 1850–1900 when the focus was opening up new areas to grazing and agriculture. Gully erosion is a problem which current land managers have in large part inherited.
As the primary goal of the Reef Trust Gully Erosion Control Programme is to improve the quality of the water in the GBR lagoon and the contributing catchment areas are vast, the Programme is restricted to ten priority management units. Gully erosion across these 10 units contributes more than half of the fine sediment export contributed from gully erosion across all GBR catchments. Gully erosion makes large per-hectare contributions to the fine sediment yield from these units because they contain many gullies and their river systems deliver sediment efficiently to the coast without large losses in downstream reservoirs or floodplains.
This document provides a specification of the gully erosion control activities that can be undertaken. Cost-effectiveness is an important consideration given the extent of gully erosion to be treated in priority areas. The first step of gully erosion control is to fence around gullies to enable vegetation to grow with no or occasional grazing. Revegetation activities are the second step, including seeding and planting within and around gullies and porous check-dams to assist revegetation within gullies. Managing forage utilisation and vegetation in the catchment area that drains to the gully is important, and is also supported by companion programs. These low-cost actions have been demonstrated to work in reef catchments. Further control measures, including gully reshaping, road drainage and contour ripping should only be undertaken within the programme where there are special circumstances. Engineering approaches also have a higher risk of failure resulting in further gullying in large runoff events.
This document also describes the monitoring that is required to support continuous learning and improvement in gully erosion control by agencies and landholders.
3
Contents1 Introduction...................................................................................................................................7
1.1 The gully erosion process.......................................................................................................7
1.2 Objectives of gully erosion control........................................................................................8
1.3 Programme strategy..............................................................................................................8
2 Spatial patterns in gully extent....................................................................................................10
3 Gully erosion control activities....................................................................................................12
3.1 Fencing.................................................................................................................................12
3.1.1 Objective......................................................................................................................12
3.1.2 Integration with other fencing requirements..............................................................13
3.1.3 Specifications...............................................................................................................13
3.2 Porous checkdams...............................................................................................................14
3.2.1 Functional Objective....................................................................................................14
3.2.2 Construction................................................................................................................14
3.2.3 Placement....................................................................................................................16
3.2.4 Design example............................................................................................................16
3.3 Revegetation in and around gullies......................................................................................16
3.3.1 Objective......................................................................................................................16
3.3.2 Specifications...............................................................................................................17
3.4 Forage management of paddocks draining to gullies..........................................................17
3.5 Water points........................................................................................................................18
3.6 Contour banks and diversion banks.....................................................................................18
3.7 Managing road and track drainage......................................................................................19
3.8 Grade control and gully head drop structures.....................................................................19
3.8.1 Objectives....................................................................................................................19
3.8.2 Specifications...............................................................................................................19
3.9 Gully reshaping....................................................................................................................20
Example.......................................................................................................................................21
4 Monitoring and Reporting...........................................................................................................21
4.1 Objectives............................................................................................................................21
4.2 Summary of reporting..........................................................................................................22
4.3 Site reports on planned activities and before-treatment monitoring..................................23
4.4 Site monitoring....................................................................................................................26
4

4.4.1 Principles......................................................................................................................26
4.4.2 Timing of monitoring...................................................................................................26
4.4.3 Monitoring design........................................................................................................27
4.4.4 Photography to support monitoring............................................................................29
4.4.5 Mapping out erosion control activities and monitoring at the site..............................30
4.4.6 Reporting site monitoring results................................................................................33
5 Acknowledgements.....................................................................................................................33
6 References...................................................................................................................................33
7 Appendix A – Maps of Gully Density in priority management units............................................35
5
1 Introduction
1.1 The gully erosion processGully erosion involves the incision of a defined drainage channel into the land surface to a depth of more than 0.3 m. Gullies are widespread in semi-arid climates globally, caused by a combination of climatic oscillation, geomorphic and hydraulic controls and land use (Ciesiolka, 1987).
Initiation of gully erosion is often triggered by vegetation degradation such as that caused by grazing and drought-flood cycles. An individual gully starts when a small near-vertical wall is created at a stock track or other disturbance, where surface runoff is concentrated in a drainage line or where seepage reduces the strength and erosion resistance of soil during and after a major rainfall event. The new gully expands upslope and grows in size due to the instability of the wall.
At landscape scale, gully erosion is focused in areas of deeper and less-stable soil, terrain of low to moderate slopes or the vertical relief around river channels, and where runoff is concentrated in drainage lines and valley bottoms.
While some gully features were noted by early European explorers, the vast majority of gullies in Great Barrier Reef (GBR) catchments today developed following the introduction of cattle and sheep grazing post-1850 (Shellberg et al., 2010; Wilkinson et al., 2013). Most gullies in the catchments of the GBR would have formed in an era when the focus was on opening up new agricultural land. Gully erosion is thus a problem which current land managers have in large part inherited. The locations of gully erosion are also in large part determined by climatic, terrain and soil characteristics.
Today, the length of gullies in GBR catchments totals >87,000 km. Assuming a mean width of 5 m, gully erosion covers just 0.1% of grazing land. However, analysis of sediment source tracing, erosion mapping and load monitoring indicates that gully erosion supplies ~40% of the fine sediment (silt and clay, <63 µm particle size) exported from river basins to the GBR lagoon (Wilkinson et al., 2015).
Figure 1. (Left) Hillslope and (right) alluvial gullies in the Burdekin River basin. Photographs by Scott Wilkinson.
Two forms of gully erosion occur within reef catchments. Hillslope gully erosion is a linear or branching feature along a former overland flow path or drainage line. Alluvial gully erosion involves incision of floodplains and river frontage country in deeper alluvial or depositional soils adjacent to large streams, and is characterised by irregular gullies deviating away from the predominant alignment of the pre-existing stream bank. Examples are shown in Figure 1. As well as creating ‘new’
6
incisions in the natural land surface, gully erosion can also involve enlargement of small natural water courses to a total size exceeding several times their prior depth and width. The resulting large channels are generally linear in form but may develop many branches.
1.2 Objectives of gully erosion controlExperience has shown that once a gully has formed, stopping gully erosion completely is impractical or very expensive. Gully erosion control aims to reduce the sediment yield from gullies into streams and rivers, by increasing sediment trapping within the gully channel to stabilise its form, and by slowing erosion of sidewalls and of the gully head (Figure 2).
Figure 2. The principles of gully erosion control for reducing gully sediment yield (Wilkinson et al., 2015).
The principles of gully erosion control are long-established (Geyik, 1986). The first principles is to increase the resistance to soil erosion and sediment transport by increasing the vegetation in and around gullies, which are often denuded or contain very little vegetation. Reducing runoff and seepage into gullies can also be effective. However, gullies with exposed soil require little runoff to continue eroding. Runoff can be physically diverted away from the gully head but it can be difficult to discharge diverted runoff safely without creating new gullies. Improving soil health is a second way to reduce runoff into the gully, but it can require large changes in grazing pressure and take a long time to achieve substantial impacts on runoff where vegetation has become degraded. Gullies will remain locations of higher vulnerability to erosion, which require greater resistance to erosion than elsewhere.
The success or failure of gully erosion control activities depends on how they are selected and designed appropriately for each situation, and constructed consistent with established guidelines. Given the large extent of gullies in the relatively low intensity of land use in grazing areas, cost effective gully erosion control relies on low cost measures applied to many gullies.
1.3 Programme strategyThe gully erosion control strategy is to fence around gullies to enable vegetation to grow with negligible or only light grazing pressure, and to manage forage utilisation and vegetation in the gully catchment to help reduce runoff (Order 1 activities in Table 1, these are normally essential activities at any site). Revegetation activities (e.g., seeding, planting) and porous check-dams to slow runoff within gully channels and assist revegetation, are next (Order 2). If gully fencing removes stock access to water then off stream water points are required (Order 2). If roads or tracks are the main source of runoff, drainage management may be required (Order 2). Engineering activities in gullies (Order 3) should be used only if relevant activities in lower orders are also applied and there are
7
special needs at a site. Following this order, more costly gully erosion control activities are supported by lower level activities to increase their effectiveness and to reduce their risk of failure. In short, “all structural measures must be accompanied with vegetative measures” (Geyik, 1986).
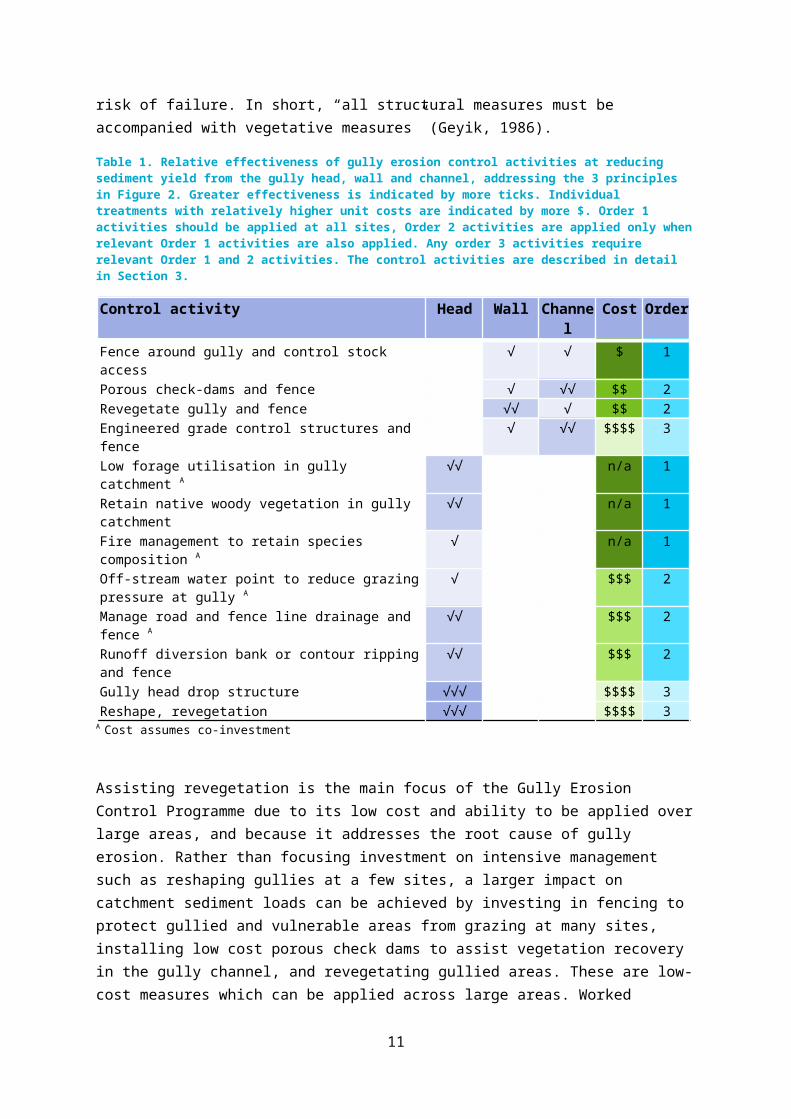
Table 1. Relative effectiveness of gully erosion control activities at reducing sediment yield from the gully head, wall and channel, addressing the 3 principles in Figure 2. Greater effectiveness is indicated by more ticks. Individual treatments with relatively higher unit costs are indicated by more $. Order 1 activities should be applied at all sites, Order 2 activities are applied only when relevant Order 1 activities are also applied. Any order 3 activities require relevant Order 1 and 2 activities. The control activities are described in detail in Section 3.
Control activity Head Wall Channel Cost OrderFence around gully and control stock access √ √ $ 1Porous check-dams and fence √ √√ $$ 2Revegetate gully and fence √√ √ $$ 2Engineered grade control structures and fence √ √√ $$$$ 3Low forage utilisation in gully catchment A √√ n/a 1Retain native woody vegetation in gully catchment √√ n/a 1Fire management to retain species composition A √ n/a 1Off-stream water point to reduce grazing pressure at gully A √ $$$ 2Manage road and fence line drainage and fence A √√ $$$ 2Runoff diversion bank or contour ripping and fence √√ $$$ 2Gully head drop structure √√√ $$$$ 3Reshape, revegetation √√√ $$$$ 3
A Cost assumes co-investment
Assisting revegetation is the main focus of the Gully Erosion Control Programme due to its low cost and ability to be applied over large areas, and because it addresses the root cause of gully erosion. Rather than focusing investment on intensive management such as reshaping gullies at a few sites, a larger impact on catchment sediment loads can be achieved by investing in fencing to protect gullied and vulnerable areas from grazing at many sites, installing low cost porous check dams to assist vegetation recovery in the gully channel, and revegetating gullied areas. These are low-cost measures which can be applied across large areas. Worked examples given in Sections 3.2 and 3.9, and Table 3, indicate that revegetation of gully features including porous check-dams is approximately one-third the cost per hectare, and sediment saving in tonnes per year (t/y), of mechanical reshaping, indicating that three times (and possibly more) the erosion area can be treated with lower cost activities.
The revegetation approach also helps to integrate gully erosion control with grazing land management, including forage management in areas draining to gullies, which is important for the long-term sustainability of gully erosion control.
Where more costly measures such as mechanical/engineering options are planned they must be justified in terms of the fine sediment they save, e.g. $ per tonne of sediment abated per year. Note Estimating the cost-effectiveness of engineering approaches should consider the risk of their pronounced failure in large runoff events. Order 1 and 2 activities can be applied in all soil types, but the design and implementation of activities involving earthworks must carefully consider soil erodibility.
8

2 Spatial patterns in gully extentA recent data synthesis identified priority areas in the GBR catchments in which gully erosion contributes high levels of fine sediment to the GBR lagoon (Wilkinson et al., 2015). The Gully Erosion Control Programme uses this knowledge base and other information to focus activities within 10 of the 47 GBR catchment management units (see Programme Guidelines, spatial data on website and Figure 3). Gully erosion in these 10 units contributes more than half of the fine sediment export contributed from gully erosion across all GBR catchments. These units are primarily closer to the coast where rainfall and erosion rates are higher. They are also well-connected through the river network to the coast, so that the effect of erosion control on sediment export to the GBR lagoon will not be attenuated by deposition processes occurring in large dams or floodplains downstream of project sites.
Within each of the 10 priority management units, spatial patterns in gully extent should be considered when selecting and designing gully erosion control activities. Areas with more extensive gully erosion may be more cost-effective to treat if, for example, each kilometre of fencing can control stock access to a larger area or length of gully erosion. Therefore, project sites should be targeted within each management unit towards areas with higher levels of gully density to increase their cost-effectiveness. The nature of gully erosion control works required may also be different in areas with large extents of gully erosion.
Gully extent has been mapped across the priority management units from air photos, and in some units by erosion modelling (Figure 3 and Appendix A; spatial data are available on request to Reef Trust). Contrasts in mapping methods are evident between management units, and this mapping is not used to allocate funds between management units. Gully sediment loss is affected by gully size and erosion rate as well as gully extent. However, the gully extent mapping is useful for planning gully erosion control activities within each management unit, enabling activities to be targeted to areas of higher density where gully fencing can be more efficient in terms of containing larger lengths and areas of gully erosion per kilometre of fence. Project planning at the site scale should also consider gully characteristics and erosion rates as described in Section 4.
Prevention of gullies in non-gullied areas is also important, especially in soil types with duplex profiles, such as Chromosols (red goldfields) and Sodosols (“spewy” soils with yellow/brown subsurface clay). These soils have high clay content in the subsoil which limits infiltration, leading to more frequent saturation of the soil surface, and surface runoff. Avoiding gully erosion in areas with sodic subsoils is also very important because once these subsoils are exposed they are very difficult to stabilise.
9
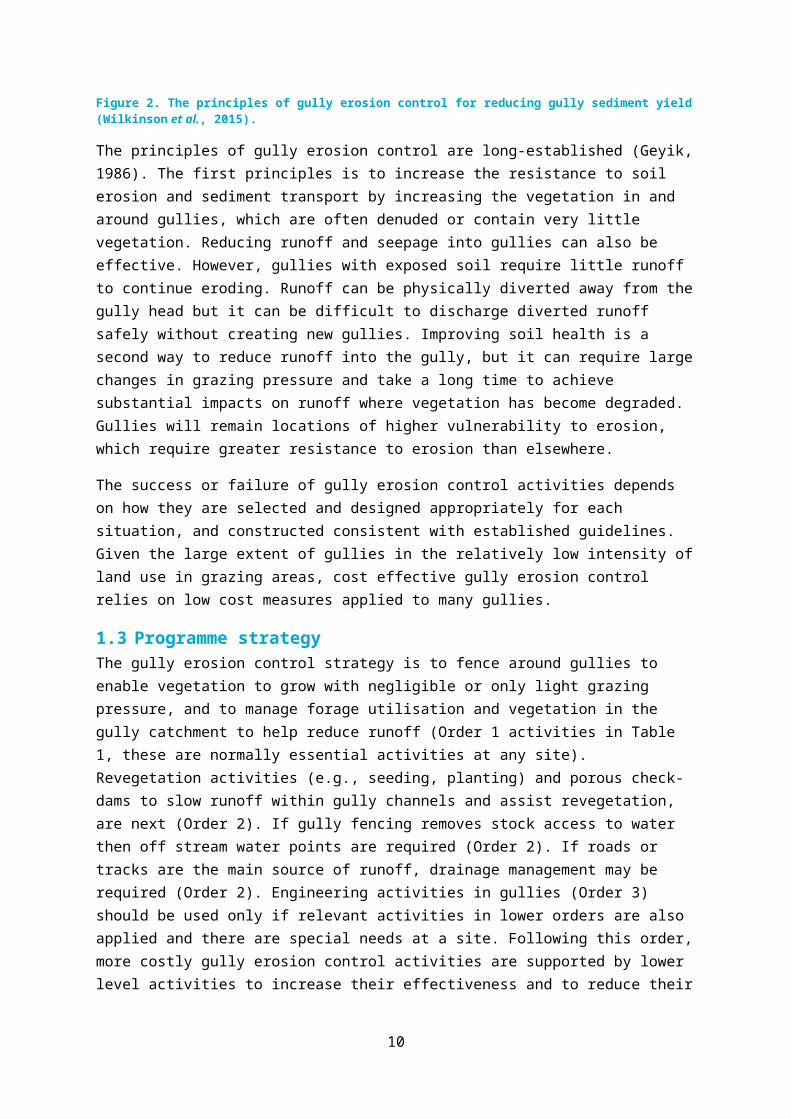
Figure 3 The density of gullies for catchments draining to the GBR lagoon. Catchment management units are labelled and outlined in black. The ten management units in the Reef Trust Gully Erosion Control Programme are outlined in blue. Variation is evident between management units in the methods for mapping gully density, and this mapping is not used to allocate funds between management units. The gully density data sources in each unit are: Normanby (Brooks et al., 2013); Bowen/Bogie and East Burdekin (Tindall et al., 2014) ©Copyright The State of Queensland, Lower Burdekin, Don, Isaac and Mary (Darr et al., © Copyright DNRM unpublished data), Theresa Creek, Mackenzie, Fitzroy (Trevithick et al., 2009) © Copyright The State of Queenland, remaining units (Hughes et al., 2001; NLWRA, 2001). In some management units data were converted from original mapping units to km/km2 based on estimated gully widths. Please note: spatial data can be downloaded from the website.
10
3 Gully erosion control activitiesKey features of the main gully erosion control activities listed in Table 1 are described below. Applicants/Delivery Partners are encouraged to also consult other recent references on gully erosion control in Queensland including Carey et al. (2015) and Shellberg and Brooks (2013). Gully erosion control activities other than the ones described may be utilised provided they address the objectives described in Section 1.2, and their application can be demonstrated to be cost-effective.
All activities should be undertaken with care for safety and Work Health and Safety obligations in mind.
3.1 Fencing Cost: low – many gullies treated
Risks: Low – may fail if grazing pressure in gullies remains high
Cost effectiveness for sediment: high - many gullies treated
3.1.1 ObjectiveTo enable the area in and around the gully to be managed primarily for erosion control rather than livestock production, with short periods of dry-season grazing only as required to manage fire risk or vegetation composition. This will enable native perennial vegetation to develop a high biomass which helps in resisting erosion and sediment transport, in keeping the soil drier and in reinforcing the soil with plant roots.
Fencing should be used at all gully erosion control sites. Fencing is essential to protect active or passive revegetation of gullies, since livestock will preferentially select new vegetation growth. Cattle access also causes physical disturbance of the soil through hoof compaction or by dislodging soil particles.
Fencing around gullies is a more reliable approach to gully erosion control than managing grazing pressure in large paddocks containing gullies because;
1. Gullies require higher levels of vegetation biomass than other areas of the landscape because the resistance of incised gully walls and channels to erosion is much lower than the surrounding areas for the reasons listed below:
a. Gully walls have higher gradients than hillslope surfaces, reducing soil stability and increasing runoff energy;
b. Soil around gullies is weakened by being saturated more frequently and for longer than higher in the landscape;
c. Gullies are exposed to much higher runoff volumes and shear stresses due to concentration of surface runoff from the hillslope area above.
2. Degraded areas like gullies are preferentially grazed. The small amount of grass which grows in degraded areas like gullies is ‘fertilised’ by mineralisation of particulate nutrients associated with the erosion process, making it more attractive to cattle and perpetuating the erosion process.
3. If gullies are contained within larger paddocks it is easy for management of grazing pressure on the gullies to drift away from sustainable levels which require stocking rate adjustments
11
to match seasonal conditions. In contrast, once gullies are fenced, and provided fences are maintained, conscious decisions are required to graze these areas.
Gully fencing is more efficient and cost-effective if multiple gullies can be included within the fence so that the length and area of gullies within the fence is increased relative to the length of the fence.
3.1.2 Integration with other fencing requirementsGully fencing can assist grazing land management by;
excluding cattle from gullies because they complicate mustering; providing the infrastructure to better manage grazing timing and pressure within smaller
paddocks to improve the condition and appearance of the property; and rehabilitating areas of active erosion.
Integrating gully fencing with riparian fencing makes good sense since gullies are usually connected to streams. The key is to control grazing pressure on gullies and other incised surface drainage lines that are more vulnerable to erosion, separately from flatter areas where vegetation is more stable. Because gullies require much lower grazing pressure than non-gullied areas, it is ideal if fencing can be designed to make it unnecessary to graze the gullied area except for short periods to help manage fire risk. Rotational grazing of gullied areas, such as in smaller ‘frontage’ paddocks, may not provide sufficient protection from grazing pressure unless carefully managed to maintain complete ground cover.
Where linear branching gullies are extensive across entire paddocks (e.g., gully spacing of <500m) it may not be feasible to fence around all gullies. In this scenario the downstream parts of gullies may be lumped within a ‘riparian’ fence, with spur (or branch line) fences between gullies to keep stock tracks away from gullies.
Gully fencing may assist efforts to achieve paddock subdivision. Areas draining into gullies need wet season spelling and careful management of grazing pressure to improve perennial pasture composition and soil health and thus to reduce runoff. Paddock subdivision may help to achieve this. If it is feasible to design the layout of gully fencing to help achieve paddock subdivision, landholder co-investment may be more likely.
3.1.3 SpecificationsSet the fence back at least 5 m from the gully edge (at least 10 m from gullies deeper than 3m). Do not make the fenced area so large that it becomes used for routine grazing. Use at least a 20 m set-back around the gully head and side branches to allow for ongoing erosion and to encompass erosion-prone areas such as scalds. Ensure that the fence encloses all areas where other gully erosion control activities are undertaken.
Ensure that the fence is sound enough to prevent livestock entry even when forage biomass in and around the gully is much higher than in the paddock. Prevent livestock access at the downstream end with a secure flood gate if the fence crosses the gully channel.
Felling trees or disturbing ground vegetation to erect the fence should be kept to the absolute minimum required to access the site by vehicle and erect the fence. Do not undertake earthworks or disturb the ground vegetation cover other than as required to access the site.
12
There is a benefit to landholder involvement in fence construction if it helps to encourage stock exclusion and fence maintenance.
3.2 Porous checkdamsCost: Low-Medium, many gullies treated
Risks: Low - not effective where runoff volumes are large
Cost effectiveness for sediment reduction: Good
3.2.1 Functional ObjectiveTo slow the flow of water in the base of gullies, and improve soil condition by causing deposition of fine sediment, nutrients and seeds. This assists germination of available seeds from perennial grasses, shrubs and trees, leading to a higher biomass of native vegetation in the gully floors (and in the longer term a higher diversity). Once established, vegetation enhances sediment deposition to reduce gully sediment yield, leading to gradual gully infilling in the very long term.
Typically gully floor sediment deposits have a very small proportion by weight of silt and clay particles (Bartley et al., 2007), making them too dry, unstable and nutrient poor to sustain much vegetation apart from weeds which tend to die off during droughts (Wilkinson et al., 2013). In other situations gully floor sediments can also become hard-set due to rainsplash.
Porous check dams (sometimes called leaky weirs) work by slowing the water flow during runoff, rather than by permanently damming water. Debris accumulates on the upstream side of the check-dam increasing the structure’s ability to slow the flow.
Porous check-dams have been widely used in gully management both worldwide and in Australia, and have been successfully trialled in the catchments of the GBR (Wilkinson et al., 2013).
3.2.2 ConstructionPorous check dams are simple to construct and use materials from near the gully. Consequently they are cheap to build – enabling many gullies to be treated for a modest budget.
Material that needs to be purchased are: flexible wire mesh with 100 millimetre square openings, star pickets for anchoring to the base of the gully and some fencing wire.
Materials that are sourced from the site are: fallen timber (branches and shrubs) and or rocks. The check dam timber should persist long enough for vegetation to become established and decompose over time.
If rocks are used, the average size of rocks should be 10-20 cm. The rocks should be of mixed sizes with minimal rock smaller than 5cm.
13

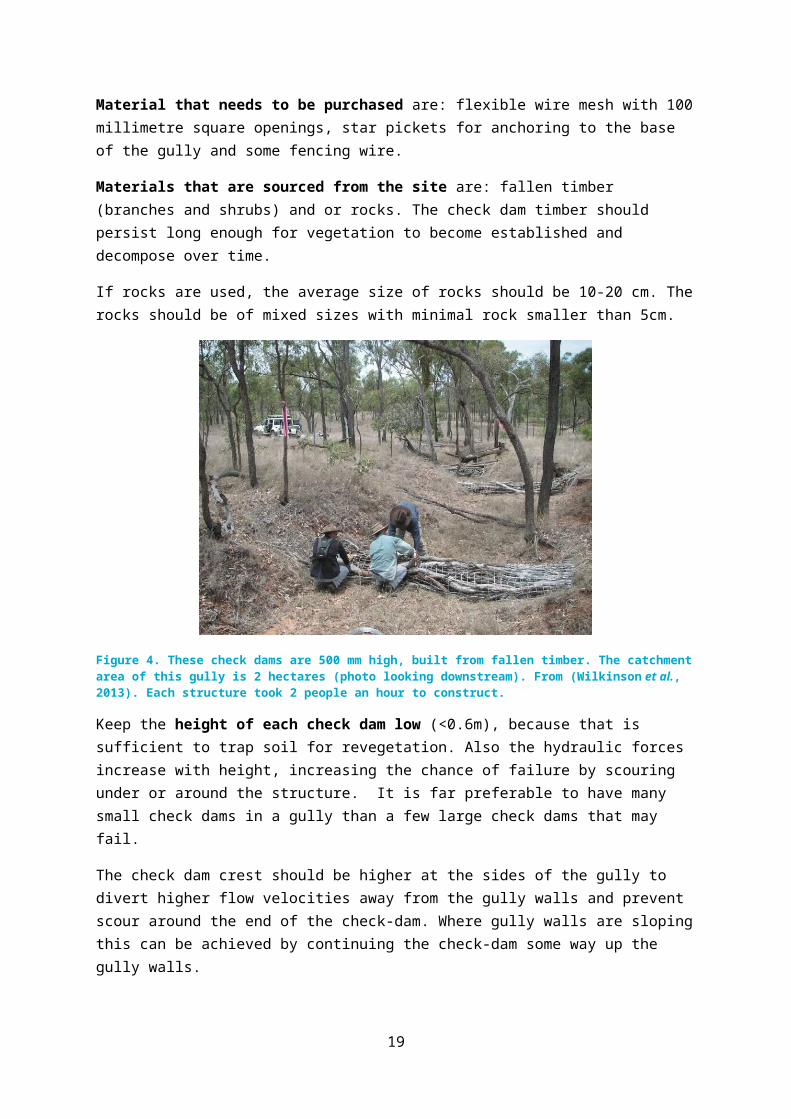
Figure 4. These check dams are 500 mm high, built from fallen timber. The catchment area of this gully is 2 hectares (photo looking downstream). From (Wilkinson et al., 2013). Each structure took 2 people an hour to construct.
Keep the height of each check dam low (<0.6m), because that is sufficient to trap soil for revegetation. Also the hydraulic forces increase with height, increasing the chance of failure by scouring under or around the structure. It is far preferable to have many small check dams in a gully than a few large check dams that may fail.
The check dam crest should be higher at the sides of the gully to divert higher flow velocities away from the gully walls and prevent scour around the end of the check-dam. Where gully walls are sloping this can be achieved by continuing the check-dam some way up the gully walls.
Construction of porous check dams with fallen timber is commenced by laying the metal mesh across the base of the gully. Sheets are overlapped and joined with fencing wire. The ends of the mesh are positioned so that the completed structure will be firmly against the gully wall. The fallen timber or rocks are them piled in a sausage-like manner along the mesh. The mesh is then closed over the timber or rocks and secured with fencing wire. Finally, star pickets are driven through the centre of the barrier at approximately 2 metre intervals, to anchor the check dam to the base of the gully.
Moving the material to the site should be done by hand or with small machines. The use of large machines such as excavators should be avoided or minimised due to soil disturbance leading to more gully erosion, or bringing in weed seeds.
If using rock, or for larger gully catchment areas and runoff volumes (assuming the gully slope is flat enough that check-dams will enable fine sediment deposition), consider keying check-dams into the gully sidewalls, and using rock to construct energy dissipating aprons on the gully floor downstream of each check-dam.
In sodic soil consider reducing the check-dam height and spacing and increasing the porosity to avoid outflanking.
14

Note that the materials suggested above are much more preferable than the geotextile (weed mat) barriers (or sand bags) used for temporary erosion control on construction sites.
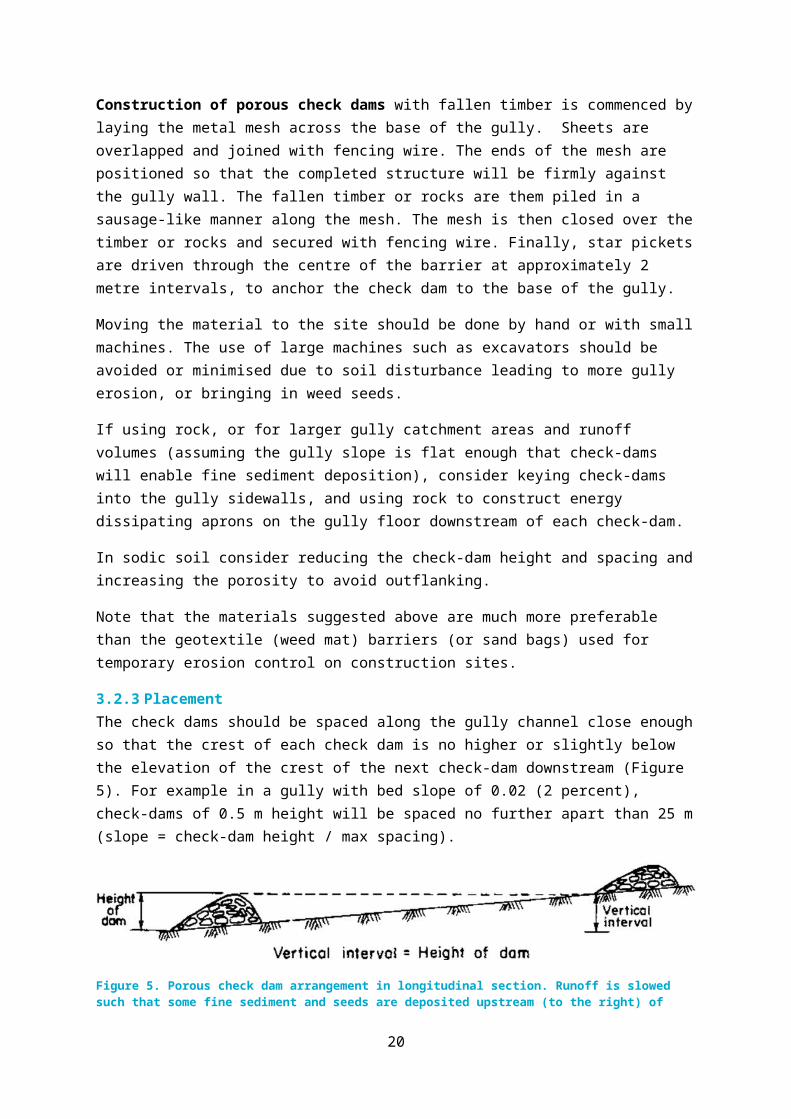
3.2.3 PlacementThe check dams should be spaced along the gully channel close enough so that the crest of each check dam is no higher or slightly below the elevation of the crest of the next check-dam downstream (Figure 5). For example in a gully with bed slope of 0.02 (2 percent), check-dams of 0.5 m height will be spaced no further apart than 25 m (slope = check-dam height / max spacing).
Figure 5. Porous check dam arrangement in longitudinal section. Runoff is slowed such that some fine sediment and seeds are deposited upstream (to the right) of each check-dam, improving the moisture and nutrient status. To prevent scour downstream of check-dams ensure they are spaced so the crest of each check-dam is at least as high as the base (toe) of the next one upstream. Reproduced from Berton (1989), cited in Critchley and Siegert (1991).
Install check-dams in the following places:
Along the main channel and side-branches of the gully Down the gully until the catchment area of the downstream check-dam has an upstream
catchment area approximately 2 ha, or larger in flatter landscapes. At larger catchment areas the runoff volumes become too large for deposition to occur.
Not in the steeper section of gullies immediately downstream of the headcut, where the steeper channel slope leads to smaller check dam spacing, and the gully channel is narrower giving higher runoff velocity.
Porous check dams should be used in combination with the fencing out of gullies, to allow vegetation to become established in the gully.
3.2.4 Design exampleAn example of costing the application of check-dams and fencing to a large gully is outlined in Table 3 (Gully ID1). The estimated cost assumes fencing completely around the gully at $5,000 per km, plus installation of 300 porous check-dams at a spacing of 15m over 4,500 m of linear drainage line within the feature. An additional $20,000 is estimated for site preparation, for sourcing additional materials and for revegetation.
3.3 Revegetation in and around gulliesCost: Low-Medium depending on techniques
Risks: Establishing vegetation in a variable climate
Cost effectiveness for sediment reduction: Good
3.3.1 ObjectiveActive revegetation may not be required where native trees, shrubs and grasses occur upslope to provide seeds, but is worthwhile in areas where natural vegetation has been removed or cannot be expected to recover.
15

The objectives of revegetation are to establish a self-maintaining system which protects the soil surface from rainsplash, slows down runoff by obstructing flow and roughening the surface, increases soil strength by reinforcing the soil with roots and moderating soil moisture, and reduces surface runoff by evaporation and transpiration from the leaves. Organic litter will help to improve the soil health over time.
3.3.2 SpecificationsLocal professional advice should be sought for revegetation species and techniques. Typically a diversity of grasses, shrubs and trees will provide the best mix of functions in the long term. Perennial tussock grasses provide good erosion control, particularly species with large basal area and root mass (Shellberg and Brooks, 2013). Woody stem densities should be low enough to allow grass growth. Species native to the local area should be used wherever feasible.
The response to revegetation will be more vigorous in more fertile and structured soils. Deep ripping along the contour can assist root penetration for new plants and retaining surface runoff but should not be done directly adjacent to gullies, especially where the subsoil slakes or disperses readily in water. Surface ploughing near gullies is risky because of the soil exposure and minimal effect on runoff.
Revegetating exposed sodic soils which are strongly dispersive on contact with water is assisted by providing an initial cover of compost and/or non-dispersive topsoil, and by chemically treating with gypsum to support initial vegetation establishment (Shellberg and Brooks, 2013; Carey, 2014). Seeding directly with rapid-growing grasses is a cheaper alternative which can also be somewhat effective for revegetating sodic soils. Note that soil sodicity varies from slight to strong and different approaches may work in different situations.
Weed control, such as by mulching or weed mat can be important to allow vegetation to establish.
Revegetation should be protected from livestock for at least the first 3 years or until plants are large enough to survive grazing.
Consider seeking landholder co-investment especially if seeding outside the gully-exclusion fence or seeding with pasture grasses.
3.4 Forage management of paddocks draining to gulliesCost: Very low; training cost only.
Risks: No control on stocking rates after project is complete
Cost effectiveness for sediment reduction: Good
This activity is used in paddocks draining into gullies to support fencing, porous check-dams and revegetation at gully erosion control sites. It should be used where gully fencing does not cover the entire gully catchment. It will involve training and extension activities as required to support the legacy of revegetation and fencing activities at project sites. Training may also involve graziers additional to the site landholders where that helps to achieve Programme objectives.
Training should focus on setting stocking rates based on a forage budget that limits the utilisation of forage by livestock to less than 25% of the annual herbage growth, a level which is sustainable for
16
sustaining the perennial composition of forage on most land types (Hunt et al., 2014), and also wet season spelling. Available resources include:
Grazing BMP modules for Grazing Land Management and Soil Health (www.bmpgrazing.com.au);
Stocktake phone app and software (http://www.stocktakeplus.com.au/); FutureBeef website https://futurebeef.com.au/resources/multimedia/#GLM; Meat & Livestock Australia Edge network Grazing Land Management course.
3.5 Water pointsCost: Medium – depends on piping distance required
Risks: Unlikely to reduce grazing pressure sufficiently unless gully is fenced out.
Cost effectiveness for sediment reduction: Low-Medium
Stock watering points are best positioned on hills or ridges so that stock tracks lead away from these higher parts of the landscape. Having watering points low in the landscapes including sites adjacent to gullies, leads to stock tracks near and through gullies which increase erosion rates and hampers other rehabilitation measures.
Moving watering points to more favourable locations is a relatively expensive measure. In this programme, a typical reason to install a water point will be where new gully fencing prevents access to what was previously the only perennial water in the paddock. Otherwise, caution must be exercised in implementing this activity as simply adding watering points can result in an increase in stock numbers and continued run down of pastures over time, which can exacerbate land degradation and gully erosion. Additional water points can potentially also attract more native grazing animals.
3.6 Contour banks and diversion banksCost: Medium – only treat active gullies which cannot be stabilised without diverting runoff
Risks: Caution in use of heavy machinery – may damage catchment vegetation, and exacerbate erosion if incorrectly designed.
Cost effectiveness for sediment reduction: Medium
The aim of contour and diversion banks is to divert run-off away from gully heads and into natural waterways or stable areas which are not susceptible to erosion (Geyik, 1986). However, there is a risk of starting a new gully where the water is diverted (Carey et al., 2015). Excessive surface runoff is often indicative of over-grazing, either historically or currently. Revegetation and controlling grazing pressure are cheaper activities which address the cause of excess surface runoff, and which support commitment to responsible long term management.
Diversion banks or detention structures, together with their runoff discharge areas, should be included inside the gully fencing so that they can be managed at high biomass to maximise water infiltration.
17
Ripping along the contours is an alternative to formed diversion banks and can reduce runoff for a number of years to (alongside spelling) assist revegetation of the gully catchment. This activity should be used with caution and kept at least 50 m away from existing gullies.
Soil disturbance has a risk of creating further gully erosion, particularly in erodible soil types.
3.7 Managing road and track drainageCost: Medium – only treat active gullies where runoff dominated by road drainage
Risks: Caution in use of heavy machinery – may expose erodible subsoils, and exacerbate erosion if incorrectly designed.
Cost effectiveness for sediment reduction: Low-Medium depending on co-investment
Roads, tracks and other compacted areas of soil are known to produce high levels of runoff. Carefully designed drainage of these surfaces can contribute to both reducing concentrated flows reaching existing gullies and minimise the chances of new gullies forming. Road drainage takes several forms including culvert pipes, cross drains (also locally called speed bump or “whoa boys”) and road crowning. The use of closely spaced drainage (typically every 20 to 50 metres) along a road results in non-erosive overland flow from roads.
Road drainage is relatively expensive and should be considered only where runoff into active gullies is dominated by road drainage. Where maintenance of road drainage provides a private benefit a co-investment from the landholder should be considered.
Soil disturbance has a risk of creating further gully erosion, particularly in erodible soil types.
3.8 Grade control and gully head drop structuresCost: high – only treat gullies threatening infrastructure
Risks: Caution in use of heavy machinery – may destabilise gully
Cost effectiveness for sediment reduction: low
3.8.1 ObjectivesGrade control structures and rock chute drop structures at the gully head can save sediment that would be lost with the continued upslope movement of a headcut or secondary incision of a channel bed to a larger depth than before.
However, these measures are relatively expensive, and are only used when other options such as porous check dams are inappropriate due to the gully size and rate of expansion. In the wrong place or in mature gullies they are very expensive and a poor option in terms of cost effectiveness. They can be justified in situations where a gully is threatening a structure such as a road or pipeline; co-investment is recommended in such cases. Lower-cost activities are preferred for controlling gully erosion over extensive areas.
3.8.2 SpecificationsUse of grade control structures requires specialist design and construction. As gullies are frequently associated with sodic and dispersive soils, an assessment of the likelihood of failure of the structure
18
as a result of dispersion of the adjacent soil is required. Out-flanking or scouring around structures by runoff is a common mode of failure. Fencing during and after construction is essential. The use of heavy machinery in construction may result in disturbance of the gully and its immediate surrounds thus introducing new risks of gully erosion.
Design guides for grade control structures are available (e.g., Geyik, 1986); Section II. Basic Gully Treatment Measures.
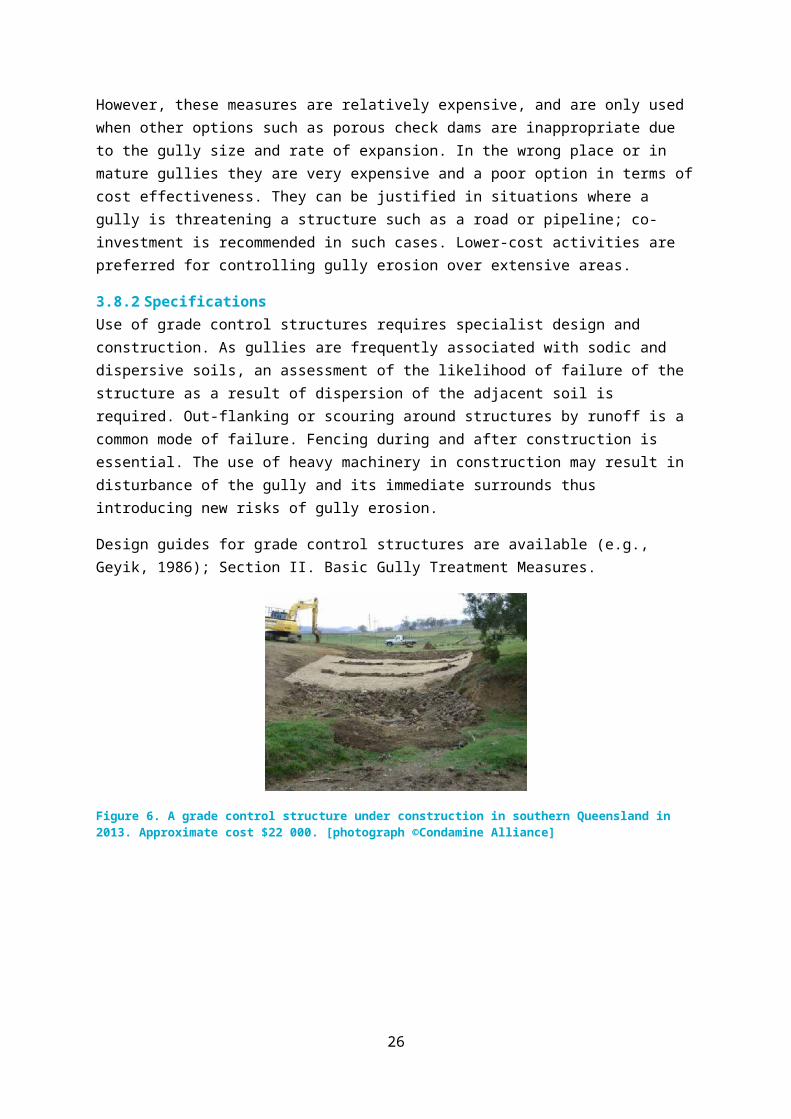
Figure 6. A grade control structure under construction in southern Queensland in 2013. Approximate cost $22 000. [photograph ©Condamine Alliance]
Figure 7. A rock chute – approximate cost $11 000 [photograph ©Condamine Alliance]
3.9 Gully reshapingCost: high – only treat gullies threatening infrastructure
Risks: Heavy machinery may destabilise gully. Requires rapid revegetation.
Cost effectiveness for sediment reduction: low
Reshaping of gullies into evenly-sloping areas (batters) can appear to provide immediate control of sediment loss, but requires skilled design and is very expensive per unit area. It is also dependent on successful control of surface runoff and revegetation. Reshaping may assist in establishing vegetation on sodic soils, provided immediate surface cover is provided from organic mulch (Shellberg and Brooks, 2013). Chemical treatment of sodic soils (e.g., with gypsum) may also be
19
temporarily required if they are exposed in the reshaped area. The reshaped area will be more steeply sloping than the natural surface, and hence more vulnerable to erosion than the surrounding natural surface. In order to maintain the integrity of the reshaped area, it should not be used for conventional grazing, and ongoing control of stock access is required by secure fencing.
Reshaping has a relatively high cost per unit area (e.g., Shellberg and Brooks (2013) estimated $10,000–$30,000 per ha). Soil disturbance has a risk of creating further gully erosion, particularly in erodible soil types. Some erosion of the area following reshaping can be expected. Gully reshaping has a risk of failure, for example severe rainfall in the recovery period can initiate re-incision of the reshaped area.
Reshaping must be implemented only in combination with other gully erosion control activities: “In regions with heavy rains, filling, shaping and diversions alone will not suffice to control gullies. Additional gully control and slope stabilization measures, such as check dams and revegetation should be undertaken” (Geyik, 1986).
ExampleAn example of design and costing reshaping of a gully is given in Table 3 (Gully ID2). The cost is based on $15,000 per ha as estimated for mechanical reshaping followed by applying gypsum, locally available compost and hand sown grass seed (Shellberg and Brooks, 2013). Additional design costs may be incurred where specialist expertise is required. Relative to revegetation of the existing topography, the immediate site outcome is more transformational and the reduction in yield may be more rapid. However, extreme rainfall may cause the works to fail. However, in this example reshaping is less cost-effective than revegetation of the existing topography including porous check-dams.
4 Monitoring and Reporting
4.1 Objectives An essential part of the Project Activities is to report the characteristics of gullies at project sites, the gully erosion control activities implemented, and to monitor the environmental impact in local conditions. Monitoring and Reporting in the Programme has several objectives:
1. To measure and report the characteristics of gullies at project sites, and the selection and design of gully erosion control activities consistent with the objectives in Section 1.2;
2. To help define the cost-effectiveness of gully erosion control activities at each site in terms of the past erosion rates, and expected sediment saving from the activities locally and to the GBR lagoon;
3. To confirm the completion and integrity of on-ground activities; 4. To assess partner and landholder perspectives of gully erosion control works, and inform
decisions on future activities;5. To inform evaluation of the project impact on vegetation; 6. To facilitate learning between sites, and adaptive management of the project and
Programme in consultation with the Department of the Environment (the Department) and Technical Partner;
20
7. To assist the Paddock to Reef Monitoring, Modelling and Reporting Programme to estimate erosion reductions from gully erosion control activities;
8. To provide a baseline for subsequent follow up monitoring to evaluate longer-term outcomes on land condition and erosion.
Other monitoring activities that may occur outside the project include (i) scaling up monitoring results to assess regional impacts, and (ii) researchers doing intensive studies of gully erosion control to verify their effectiveness on erosion and sediment yields and to further refine rehabilitation techniques.
4.2 Summary of reportingDelivery Partners are required to report a summary of progress implementing activities (as stated in the Application Form), every six months. This will be undertaken through the Australian Government’s Monitoring, Evaluation, Reporting and Improvement Tool (MERIT - https://fieldcapture.ala.org.au/). The following content needs to be included with the six monthly reporting:
1. Progress of activity implementation and achieved outputs, linked to sites and points of interest (in MERIT), including Table 2;
2. The planned site designs for the coming period and estimated cost-effectiveness as described in Section 4.3, including Table 3. In the early stages of the project this may also occur separately to regular reporting dates;
3. Before treatment site monitoring as described in Section 4.4, including Table 5, Table 6 and the photos which can be attached as a non-public documents in MERIT. In the early stages of the project this may also occur separately to regular reporting dates;
4. Site monitoring after treatment, including photographs and commentary as described in Section 4.4, including Table 5, Table 6 and the photos which can be attached as a non-public documents in MERIT; and
5. On an annual basis, submission of the Master Table spreadsheet and spatial layers of project area.
21
Table 2. Summary report of project activities for a six-month period. These totals are to be summed from the Table 3 for each project site completed.
Treatment Num
ber o
f site
s
Tota
lGu
lly A
rea
Trea
ted
Tota
l Co
st
($)
Effec
tiven
ess
of C
ontr
ol
(%)
Est.
Sedi
men
t Re
ducti
on(t
/yr)
Cost
Effec
tiven
ess
($/t
/yr)
Fence around gully and control stock access
Fence around gully and revegetate
Fence around gully and install porous check-dams
Water point to reduce grazing pressure at gully (no fence)
Reduced forage utilisation in gully catchment to <25%
Manage infrastructure and fence around gully (e.g. road drainage)
Runoff diversion bank and fence around gully
Gully head drop structure and fence around gully
Engineered grade control structures and fence
Reshape, revegetation and fence around gully
Other (specify)
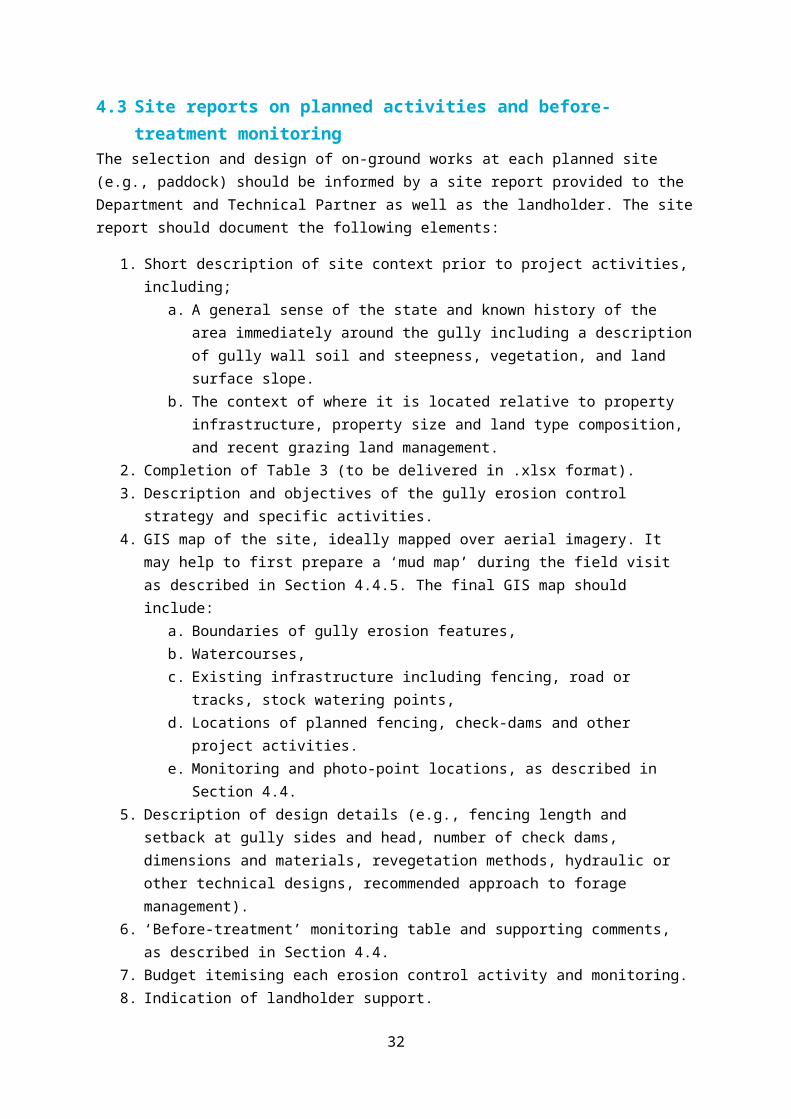
4.3 Site reports on planned activities and before-treatment monitoring The selection and design of on-ground works at each planned site (e.g., paddock) should be informed by a site report provided to the Department and Technical Partner as well as the landholder. The site report should document the following elements:
1. Short description of site context prior to project activities, including;a. A general sense of the state and known history of the area immediately around the
gully including a description of gully wall soil and steepness, vegetation, and land surface slope.
b. The context of where it is located relative to property infrastructure, property size and land type composition, and recent grazing land management.
2. Completion of Table 3 (to be delivered in .xlsx format).3. Description and objectives of the gully erosion control strategy and specific activities.
22
4. GIS map of the site, ideally mapped over aerial imagery. It may help to first prepare a ‘mud map’ during the field visit as described in Section 4.4.5. The final GIS map should include:
a. Boundaries of gully erosion features, b. Watercourses, c. Existing infrastructure including fencing, road or tracks, stock watering points,d. Locations of planned fencing, check-dams and other project activities. e. Monitoring and photo-point locations, as described in Section 4.4.
5. Description of design details (e.g., fencing length and setback at gully sides and head, number of check dams, dimensions and materials, revegetation methods, hydraulic or other technical designs, recommended approach to forage management).
6. ‘Before-treatment’ monitoring table and supporting comments, as described in Section 4.4. 7. Budget itemising each erosion control activity and monitoring. 8. Indication of landholder support.
Timing: Once funding agreements are signed, the site report should be provided to the Department for review within a reasonable timeframe prior to works commencing. Site reports are not required prior to submission of Programme applications. Following the initial six months, the site reports of planned works and monitoring should be provided to the Department on a 6 monthly basis, prior to the next period of implementation.
23
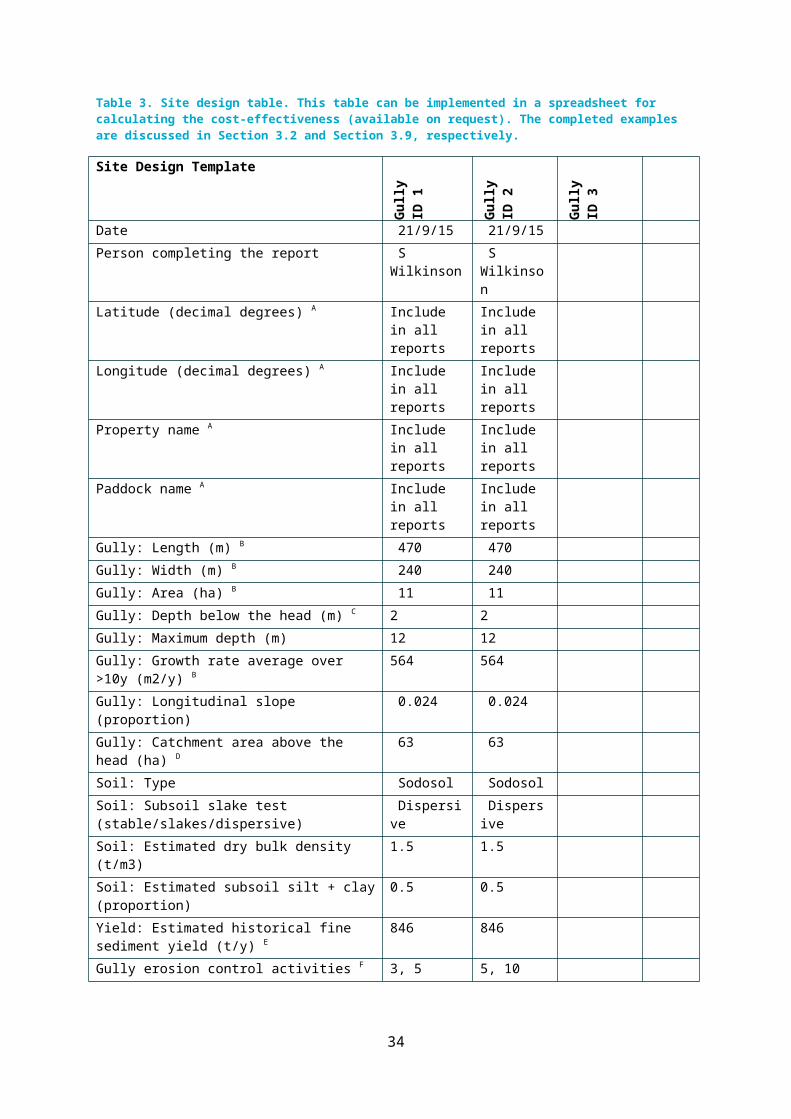
Table 3. Site design table. This table can be implemented in a spreadsheet for calculating the cost-effectiveness (available on request). The completed examples are discussed in Section 3.2 and Section 3.9, respectively.
Site Design Template
Gully
ID 1
Gully
ID 2
Gully
ID 3
Date 21/9/15 21/9/15 Person completing the report S Wilkinson S Wilkinson Latitude (decimal degrees) A Include in all
reportsInclude in all reports
Longitude (decimal degrees) A Include in all reports
Include in all reports
Property name A Include in all reports
Include in all reports
Paddock name A Include in all reports
Include in all reports
Gully: Length (m) B 470 470 Gully: Width (m) B 240 240 Gully: Area (ha) B 11 11 Gully: Depth below the head (m) C 2 2 Gully: Maximum depth (m) 12 12 Gully: Growth rate average over >10y (m2/y) B 564 564 Gully: Longitudinal slope (proportion) 0.024 0.024 Gully: Catchment area above the head (ha) D 63 63 Soil: Type Sodosol Sodosol Soil: Subsoil slake test (stable/slakes/dispersive) Dispersive Dispersive Soil: Estimated dry bulk density (t/m3) 1.5 1.5 Soil: Estimated subsoil silt + clay (proportion) 0.5 0.5 Yield: Estimated historical fine sediment yield (t/y) E 846 846Gully erosion control activities F 3, 5 5, 10Gully control effectiveness (proportion) F 0.5 0.5Total Suspended Sediment saving (t/y) G 423 423Total cost of gully erosion control activities ($) 57,100 169,200
Cost-effectiveness ($ per t/y) 135 400A These parameters should be included in site reports. Actual values are not included in this example (which is a real gully in
the Bowen River catchment) because this is a public report rather than a project site report.B Estimate from historical air photos and Google Earth. Gully Length is the longest overall dimension of the gully, and Width
is the average width measured at right angles to the length, such that Area (ha) = Length (m) × Width (m) / 10,000. If no data on historical changes in extent can be obtained then assume Growth rate = Gully area × 0.005 (assumes gully age = 100 years and current erosion rate = 50% of the average rate since gully initiation).
C From monitoring, see Table 5. D Can be estimated from aerial imagery if clearly defined, or by mapping the upstream contributing area in GIS using the 1”
Hydrologically Enforced Digital Elevation Model (DEM-H; ANZCW0703014615) (Gallant et al., 2011), available from http://www.ga.gov.au/scientific-topics/national-location-information/digital-elevation-data
E Estimated historical fine sediment yield (t y-1) = Gully Head depth (m) × Gully Growth rate (m2/y) × Soil dry bulk density (t m-3) × Soil proportion of silt + clay. For linear gullies the Growth rate = average extension (m/y) × Gully width (m).
F From Table 4, or estimated based on the monitoring results from comparable field trials in the area. If a combination of techniques are used list them, and describe variants in the text.
G Total Suspended Sediment saving = Estimated fine sediment yield × Gully control effectiveness
24

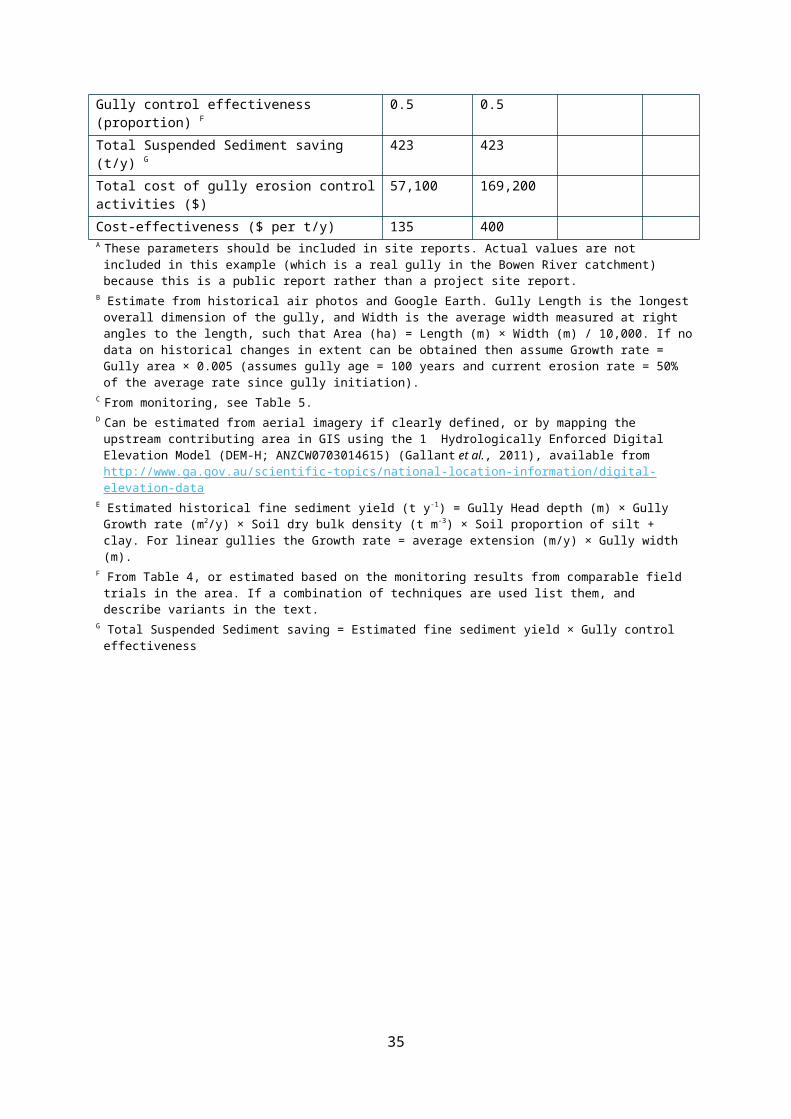
Table 4. Estimated effectiveness of gully erosion control measures for use in site design in Table 3.
Gully erosion control activity Activity Number Effectiveness A
Fence around gully and control stock access 1 0.2Fence around gully and revegetate 2 0.3Fence around gully and install porous check-dams 3 0.5Water point to reduce grazing pressure at gully (no fence) 4 0.05Stocking rate reduced in gully catchment to <25% forage utilisation 5 0.1 B
Manage infrastructure and fence around gully (e.g. road drainage) 6 0.3 B
Runoff diversion bank and fence around gully 7 0.4 C
Gully head drop structure and fence around gully 8 0.5Engineered grade control structures and fence 9 0.5Reshape, revegetation and fence around gully 10 0.5Other activity 11 specify
A Expert opinion based; for guidance only.B Can be added to the effectiveness of treatments in the gully C Accounts for some increase in erosion below discharge point
4.4 Site monitoring
4.4.1 Principles Monitoring consists of a simple set of observations and photos that are made at least three times (before treatment and twice after treatment). The emphasis is on consistency – so that the evaluation follows the scientific method. Try to be as consistent as possible in making the observations and taking the photos.
Monitoring design requires the application of some principles of scientific experiments so that external factors like variability in the weather and stocking rates outside the managed area are removed from the assessment. For this reason monitoring should use a Before After Control Impact (BACI) design in which some gullies in each paddock are left untreated for comparison over time, and both the treated and untreated gullies are monitored before and after the treatment (gully erosion control activity) is applied. The monitoring is designed to be reasonably rapid to undertake in the field (~30 minutes for 2 people), and to require limited skills and experience. Formal comparisons between sites and over time should be performed by specialists.
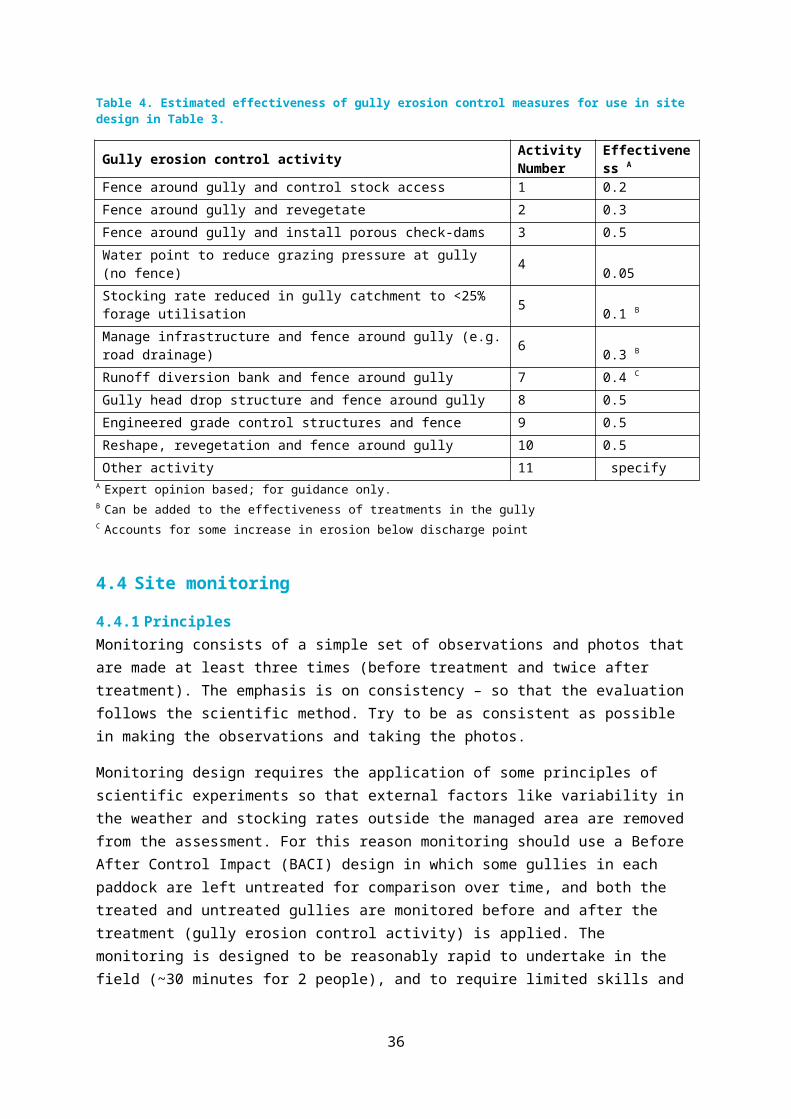
4.4.2 Timing of monitoring Each site should ideally be monitored at least three times during the project:
1. Before site activities commence. Ideally this is early in the dry season between March and May so that results are comparable with later years.
2. Shortly after treatment: For Order 1 activities (Table 1) this will mostly be photo point measurements, provided treatment occurred within the same dry season as the before-treatment monitoring. If the activities involved physical revegetation or earthworks, the effects of this disturbance should be monitored.
25
3. At the end of each subsequent wet season (between March and May) following completion of gully erosion control activities. Seasonal rainfall predominantly drives gully erosion and the responses to revegetation activities. Measurement at the end of the wet season is also ideal to indicate the effectiveness and integrity of remediation activities. Where possible, also repeating the Landscape Condition Assessments upslope of the gully late in the dry season (between September and November) will capture the lowest functional state for the season to provide context for measuring recovery.
o For sites where gully erosion control activities occur in 2016, this will involve monitoring in both 2017 and 2018. Applications may identify savings which would be made if only one wet season was monitored after treatment.
4.4.3 Monitoring design In each paddock that gully erosion control works are planned and undertaken, at least one gully should be monitored, which is/are typical of all the gullies treated. At least one comparable gully feature, or part of the gully if there is only one feature, should be left untreated and also monitored using the same protocol as for the treated gullies.
The standard monitoring design includes:
1. Land Condition Assessments (LCAs) immediately upslope of the gully head, and in the paddock outside the planned fence location. The method is described in the Stocktake users guide (http://www.stocktakeplus.com.au/wp-content/uploads/2013/01/Stocktake-users-manual.pdf). A mobile application for field data collection is available for smartphones and tablets. Online tutorials are available.
2. Gully head location relative to a permanent reference marker, to enable the erosion rate between monitoring dates to be estimated.
3. Vegetation cover and photos at five marked sampling locations within or around the gully, coinciding with gully erosion control activities such as check-dams and contour banks. The furthest upslope and downslope of structural activities must be included and an additional three other locations in between. This sample-of-5 approach is used instead of monitoring every individual structure, to reduce field collection time where multiple treatments (such as check dams) are installed. The same five monitoring locations are used at each date of monitoring.
4. Rainfall in the last 12 months. 5. Landholder perspectives of the project activities, including the Water Quality Risk
Benchmarking questions (with the landholder).6. Annual completion of the Australian Government Reef Master spreadsheet.
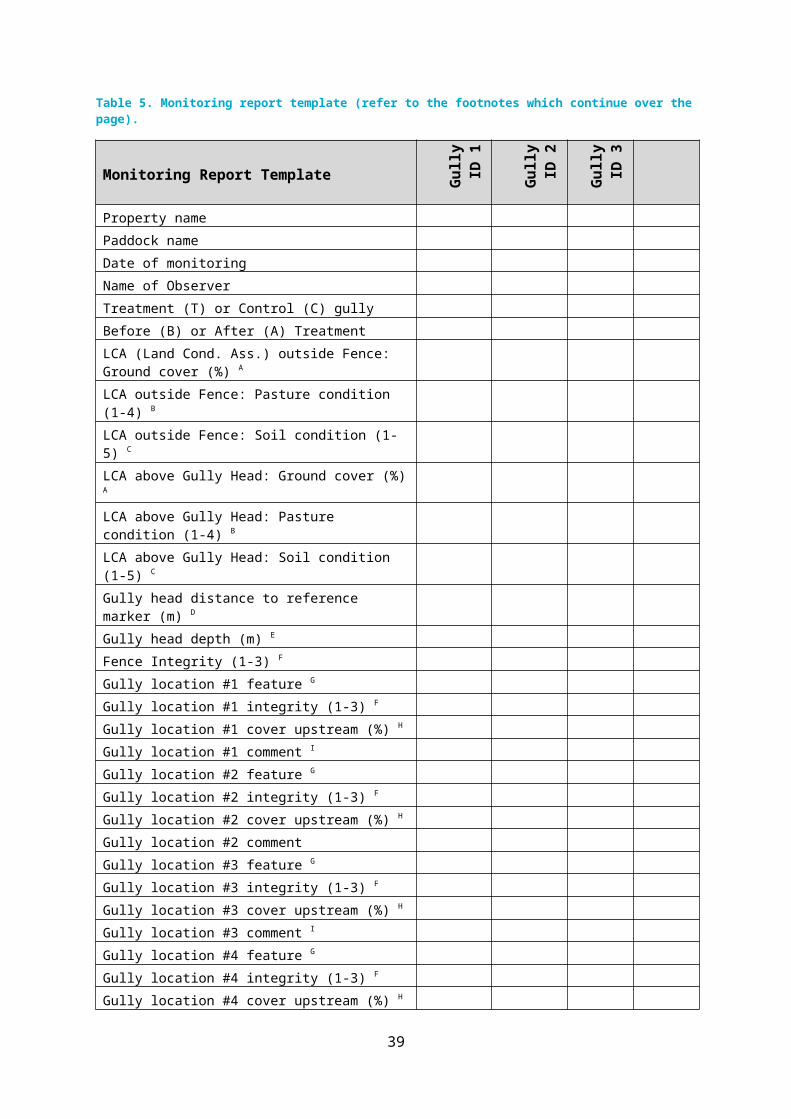
Monitoring should be recorded, and subsequently reported, using the template and instructions below (Table 5). The table can be used for recording comments at the site by cross-referencing from each comment field (using A, B, C, etc) to comments written on a separate sheet.
26
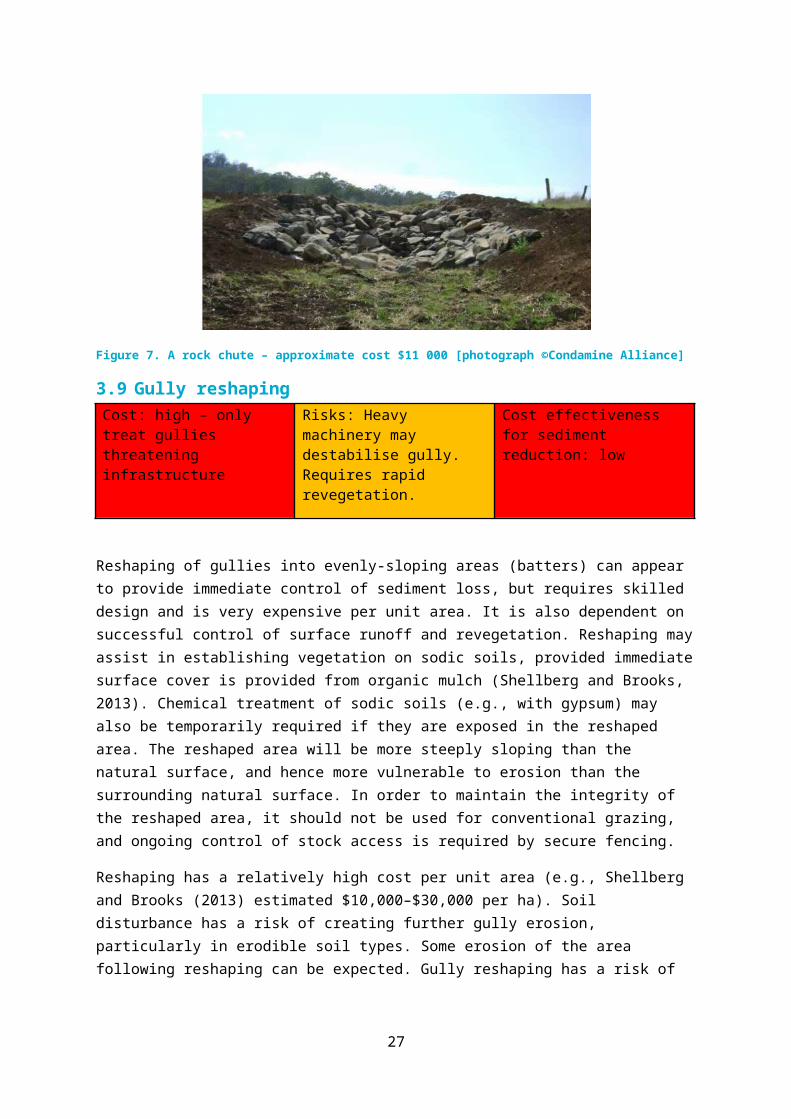
Table 5. Monitoring report template (refer to the footnotes which continue over the page).
Monitoring Report Template
Gully
ID 1
Gully
ID 2
Gully
ID 3
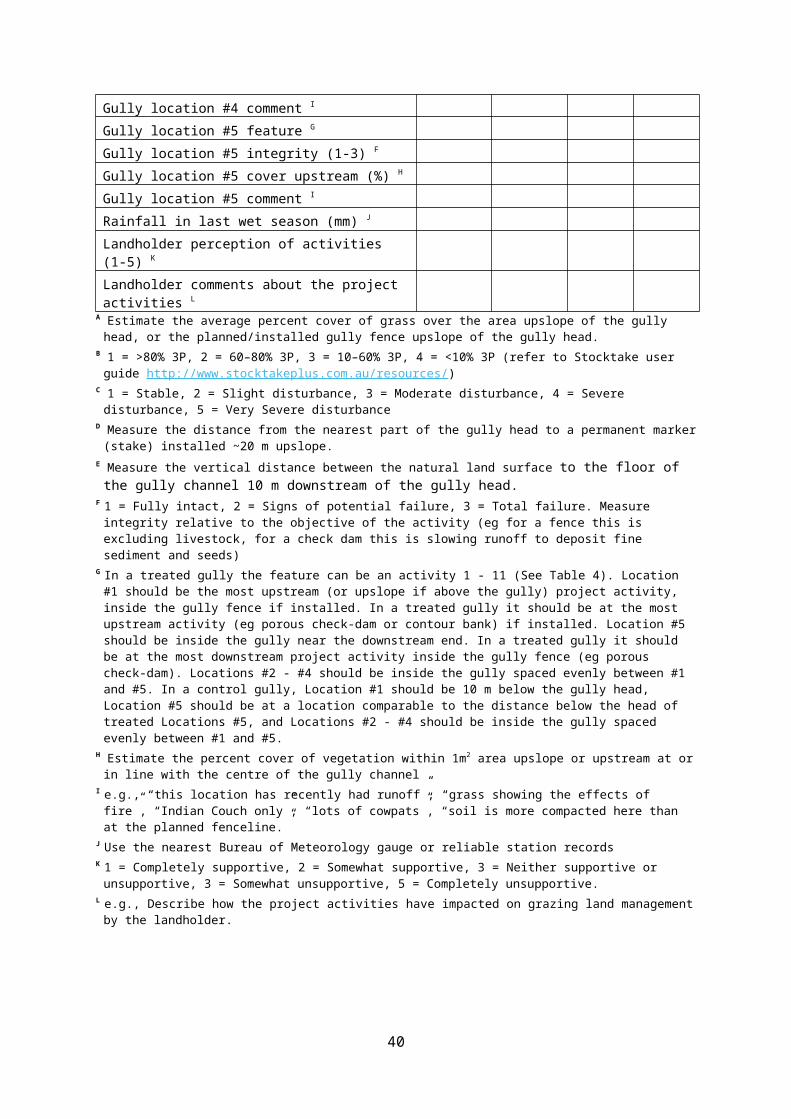
Property name Paddock nameDate of monitoring Name of Observer Treatment (T) or Control (C) gully Before (B) or After (A) Treatment LCA (Land Cond. Ass.) outside Fence: Ground cover (%) A LCA outside Fence: Pasture condition (1-4) B LCA outside Fence: Soil condition (1-5) C LCA above Gully Head: Ground cover (%) A LCA above Gully Head: Pasture condition (1-4) B LCA above Gully Head: Soil condition (1-5) C Gully head distance to reference marker (m) D Gully head depth (m) E Fence Integrity (1-3) F Gully location #1 feature G Gully location #1 integrity (1-3) F Gully location #1 cover upstream (%) H Gully location #1 comment I Gully location #2 feature G Gully location #2 integrity (1-3) F Gully location #2 cover upstream (%) H Gully location #2 comment Gully location #3 feature G Gully location #3 integrity (1-3) F Gully location #3 cover upstream (%) H Gully location #3 comment I Gully location #4 feature G Gully location #4 integrity (1-3) F Gully location #4 cover upstream (%) H Gully location #4 comment I Gully location #5 feature G Gully location #5 integrity (1-3) F Gully location #5 cover upstream (%) H Gully location #5 comment I Rainfall in last wet season (mm) J Landholder perception of activities (1-5) K Landholder comments about the project activities L
A Estimate the average percent cover of grass over the area upslope of the gully head, or the planned/installed gully fence upslope of the gully head.
27

B 1 = >80% 3P, 2 = 60–80% 3P, 3 = 10–60% 3P, 4 = <10% 3P (refer to Stocktake user guide http://www.stocktakeplus.com.au/resources/)
C 1 = Stable, 2 = Slight disturbance, 3 = Moderate disturbance, 4 = Severe disturbance, 5 = Very Severe disturbanceD Measure the distance from the nearest part of the gully head to a permanent marker (stake) installed ~20 m upslope. E Measure the vertical distance between the natural land surface to the floor of the gully channel 10 m downstream
of the gully head.F 1 = Fully intact, 2 = Signs of potential failure, 3 = Total failure. Measure integrity relative to the objective of the activity (eg
for a fence this is excluding livestock, for a check dam this is slowing runoff to deposit fine sediment and seeds) G In a treated gully the feature can be an activity 1 - 11 (See Table 4). Location #1 should be the most upstream (or upslope
if above the gully) project activity, inside the gully fence if installed. In a treated gully it should be at the most upstream activity (eg porous check-dam or contour bank) if installed. Location #5 should be inside the gully near the downstream end. In a treated gully it should be at the most downstream project activity inside the gully fence (eg porous check-dam). Locations #2 - #4 should be inside the gully spaced evenly between #1 and #5. In a control gully, Location #1 should be 10 m below the gully head, Location #5 should be at a location comparable to the distance below the head of treated Locations #5, and Locations #2 - #4 should be inside the gully spaced evenly between #1 and #5.
H Estimate the percent cover of vegetation within 1m2 area upslope or upstream at or in line with the centre of the gully channel
I e.g., “this location has recently had runoff”, “grass showing the effects of fire”, “Indian Couch only”, “lots of cowpats”, “soil is more compacted here than at the planned fenceline.”
J Use the nearest Bureau of Meteorology gauge or reliable station recordsK 1 = Completely supportive, 2 = Somewhat supportive, 3 = Neither supportive or unsupportive, 3 = Somewhat
unsupportive, 5 = Completely unsupportive. L e.g., Describe how the project activities have impacted on grazing land management by the landholder.
4.4.4 Photography to support monitoringPhotography is an important monitoring technique, provided the photo point locations and camera heights are consistent between dates. Key points:
1. For linear features which span the gully channel, the photo point should be on one side of the gully, with the photo taken looking in the cross-gully direction, along the length of the feature.
2. A 1.8 m metal star picket (stake) should be driven in at each photo point, to provide a permanent marker of sufficient height for the photo point.
3. The camera can be placed on the top of the photo point stake to achieve a consistent field of view.
4. The entire feature being monitored (e.g. gully head, check dam) should be contained within the frame of the photo.
5. The photo file formats should be *.jpg. 6. Resolution should be high so that a typical photo file is >3 Megabytes.
The locations for site monitoring photographs are listed in Table 6. This table can be used at the site as a checklist to tick off photo locations completed. Subsequently, it should be used to index photo filenames for reporting.
28
Table 6 Site monitoring photograph index.
Photopoint field checklist, and filename report
Gully
ID 1
Gully
ID 2
Gully
ID 3
Property name
Paddock name
Date
Name of Photographer
Fence line: upslope
Fence line: along fence
Fence line: ground
Gully head: upslope
Gully head: downslope
Gully head: ground
Gully head: from side
Gully location #1: along feature
Gully location #1: oblique upstream 45 degrees
Gully location #1: oblique downstream 45 degrees
Gully location #2: along feature
Gully location #2: oblique upstream 45 degrees
Gully location #2: oblique downstream 45 degrees
Gully location #3: along feature
Gully location #3: oblique upstream 45 degrees
Gully location #3: oblique downstream 45 degrees
Gully location #4: along feature
Gully location #4: oblique upstream 45 degrees
Gully location #4: oblique downstream 45 degrees
Gully location #5: along feature
Gully location #5: oblique upstream 45 degrees
Gully location #5: oblique downstream 45 degrees
General photos (add description and comments)
4.4.5 Mapping out erosion control activities and monitoring at the siteMonitoring locations listed in Table 5 should be included and labelled on the GIS map of site activities. Recording GPS co-ordinates of each location may assist this process.
29
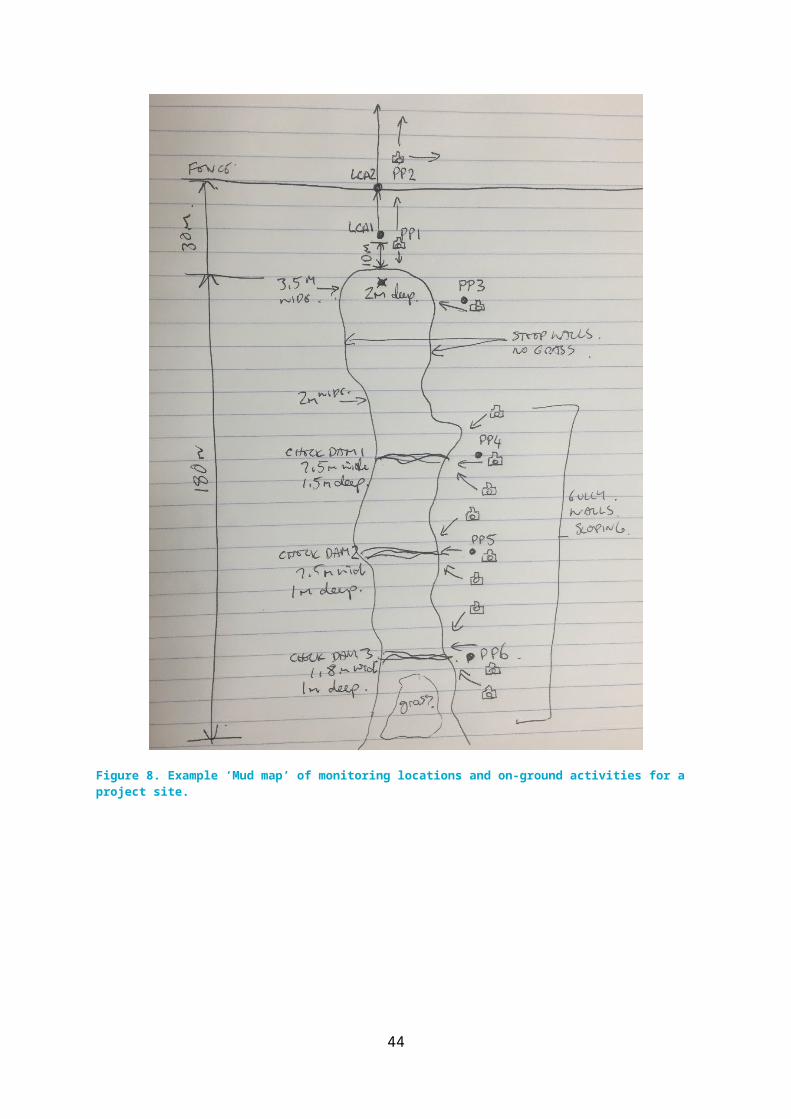
Drawing a ‘mud map’ while at the site drafting the activity design and undertaking the before treatment monitoring (e.g., Figure 8) will assist in the later preparation of a GIS map of monitoring locations relative to other project activities. Follow the check list of items below to include:
Shape of gully/gullies shown Overall dimensions of gully shown (length/width/depth) Height of head cut shown Locations of existing infrastructure (fencing, roads, tracks, stock watering points) Location of check dams and other planned activities Other features located eg erosion features Monitoring locations as per Table 5. Location and direction of photo points marked Annotated comments; e.g., “The walls are near vertical for about 30m below the gully head
with active erosion. Below this point the walls start to slope away and do not show any signs of slumping.”
30
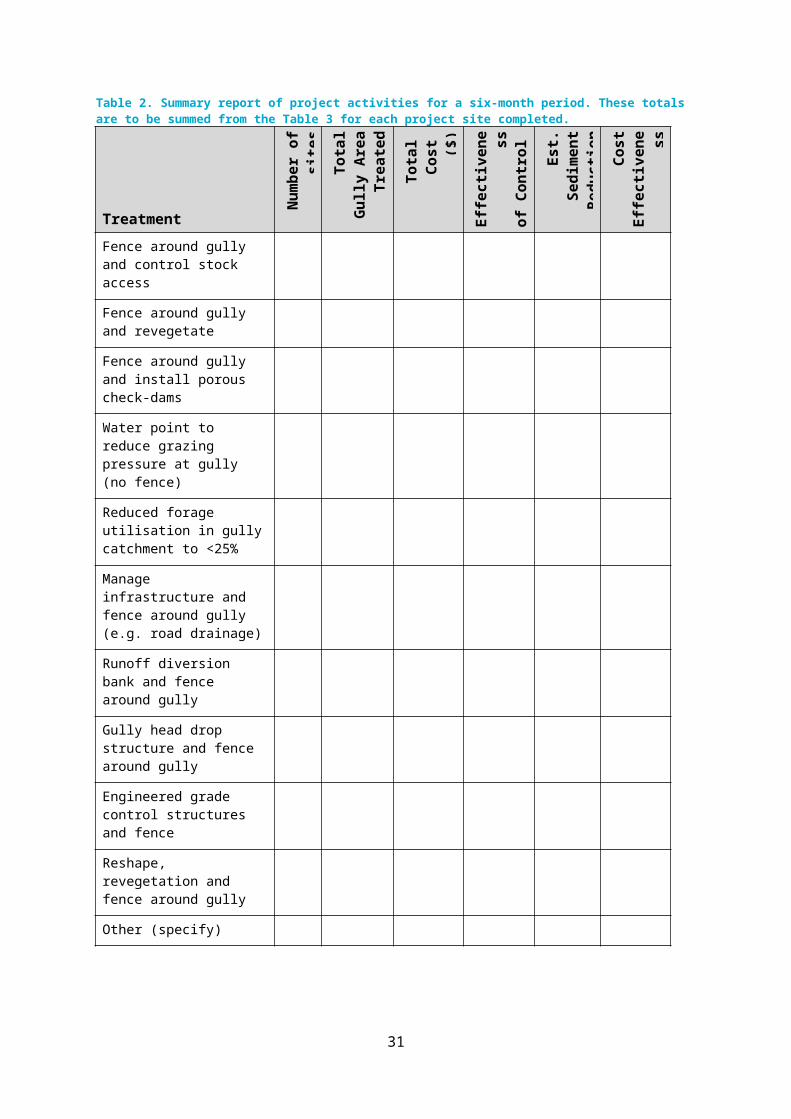
Figure 8. Example ‘Mud map’ of monitoring locations and on-ground activities for a project site.
31
4.4.6 Reporting site monitoring resultsThe monitoring report should describe the overall outcome of monitoring for each gully during the reporting period, supported by the GIS map and >5 example photos. Table 5 should be submitted in .xlsx format (template can be provided on request). The photo index Table 6 and photo files should be submitted for reference.
5 AcknowledgementsThis report was funded by the Australian Government through the Reef Trust. Comments on draft versions were provided by Anthea Coggan and Peter Stone (CSIRO), Reef Trust team members, Michele Barson (DoAWR) and Peter O’Reagain (QDAF).
6 ReferencesBartley R, Hawdon A, Post DA, Roth CH. 2007. A sediment budget for a grazed semi-arid catchment
in the Burdekin Basin, Australia. Geomorphology, 87: 302-321. http://dx.doi.org/10.1016/j.geomorph.2006.10.001.
Berton S. 1989. A detailed guide to specifications and use of permeable rock dams in West Africa (in French). GRET, Paris.
Brooks A, Spencer J, Olley J, Pietsch T, Borombovits D, Curwen G, Shellberg J, Howley C, Gleeson A, Simon A, Bankhead N, Klimetz D, Eslami-Endargoli L, Bourgeault A. 2013. An empirically-based sediment budget for the Normanby basin. . Griffith University, http://www.capeyorkwaterquality.info/downloads.
Carey B. 2014. Understanding dispersive soils. http://landcare.org.au/wp-content/uploads/2013/01/Understanding-dispersive-soils.pdf.
Carey B, Stone B, Shilton P, Norman P. 2015. Chapter 13 Gully erosion and its control. In: Soil Conservation Guidelines for Queensland, 3rd Edition. Queensland Department of Science, Information Technology and Innovation. www.publications.qld.gov.au/dataset/soil-conservation-guidelines
Ciesiolka C. 1987. Catchment management in the Nogoa watershed. AWRC Research Project 80/128.Critchley W, Siegert K. 1991. Water harvesting. FAO.
http://www.fao.org/docrep/u3160e/u3160e00.htm#Contents.Gallant JC, Wilson N, Dowling TI, Read AM, Inskeep C. 2011. SRTM-derived 1 Second Digital Elevation
Models Version 1.0. Geoscience Australia www.ga.gov.au/topographic-mapping/digital-elevation-data.html.
Geyik MP. 1986. FAO watershed management field manual - Gully control. FAO conservation guide 13/2. Food and Agriculture Organisation of the United Nations. http://www.fao.org/docrep/006/ad082e/AD082e00.htm#cont.
Gilad U, Denham R, Tindall D. 2012. Gullies, Google Earth and the Great Barrier Reef: A remote sensing methodology for mapping gullies over extensive areas. In: XXII ISPRS Congress, International Archives of the Photogrammetry, Remote Sensing and Spatial Information Sciences, Volume XXXIX-B8.
Hughes AO, Prosser IP, Stevenson J, Scott A, Lu H, Gallant J, Moran C. 2001. Gully erosion mapping for the National Land and Water Resources Audit. CSIRO Land and Water.
Hunt LP, McIvor JG, Grice AC, Bray SG. 2014. Principles and guidelines for managing cattle grazing in the grazing lands of northern Australia: stocking rates, pasture resting, prescribed fire, paddock size and water points – a review. The Rangeland Journal, 36: 105-119. http://dx.doi.org/10.1071/RJ13070.
NLWRA. 2001. Australian Agriculture Assessment 2001. National Land and Water Resources Audit.
32
Shellberg J, Brooks A, Spencer J. 2010. Land-use change from indigenous management to cattle grazing initiates the gullying of alluvial soils in northern Australia. In: 19th World Congress of Soil Science, Soil Solutions for a Changing World, http://www.soilscienceaustralia.com.au, pp: 3992-3995.
Shellberg JG, Brooks AP. 2013. Alluvial gully prevention and rehabilitation options for reducing sediment loads in the Normanby catchment and northern Australia. In: Final report for the Australian Government's Caring for Our Country - Reef Rescue initiative, Griffith University, Australian Rivers Institute. http://www.capeyorkwaterquality.info/references/cywq-223, pp: 314.
Tindall D, Marchand B, Gilad U, Goodwin N, Denham R, Byer S. 2014. Gully mapping and drivers in the grazing lands of the Burdekin catchment. RP66G Synthesis Report. Queensland Department of Science, Information Technology, Innovation and the Arts.
Trevithick R, Herring M, Dougall C, Denham R, Pringle M. 2009. Gully Density Mapping and Modelling for the Fitzroy Basin, Queensland, Australia. Queensland Department of Natural Resources and Water.
Wilkinson SN, Bartley R, Hairsine PB, Bui EN, Gregory L, Henderson AE. 2015. Managing gully erosion as an efficient approach to improving water quality in the Great Barrier Reef lagoon. Report to the Department of the Environment. CSIRO Land and Water. https://publications.csiro.au/rpr/download?pid=csiro:EP1410201&dsid=DS6.
Wilkinson SN, Kinsey-Henderson AE, Hawdon AA, Ellis TW, Nicholas DM. 2013. Gully erosion and its response to grazing practices in the Upper Burdekin catchment. CSIRO Water for a Healthy Country. https://publications.csiro.au/rpr, pp: 96.
33
7 Appendix A – Maps of Gully Density in priority management units
Please note: Gully density data are available by request from Reef Trust ([email protected]) as Geotiff grids (1 km2 resolution). The original gully density data were of varying resolution. In some units it was of finer resolution than presented here and it may assist site planning, but should be sourced from the data custodians if required. In the Normanby Griffith University (Brooks et al., 2013) mapped a subset of gullies as high-resolution polygons. In the Lower Burdekin, Don, Isaac and Mary; Darr et al., (©Copyright DNRM, unpublished data) mapped gully presence or absence in 100 m pixels. In East Burdekin and Bowen-Bogie gully presence or absence was modelled at 5 km pixels (1 km pixels in selected areas), as presented here. In Theresa Creek, Mackenzie and Fitzroy units gully density was modelled at 1 km2 resolution, as presented here.
34
Normanby
Figure 9. Density of gully erosion in the Normanby management unit, derived from mapping and sediment budget modelling sourced from Griffith University (Brooks et al., 2013). Gully density as shown here aggregates mapping of colluvial and alluvial forms of gully erosion, and also eroding secondary streams, which are included in gully erosion mapping in other management units. The density of eroding secondary streams relative to gullies was estimated based on the relative contributions of gully erosion and secondary streams to basin suspended sediment inputs estimated by Brooks et al. (2013). Density is shown at 1 km2 resolution.
35
Lower Burdekin
Figure 10. Density of gully erosion in the Lower Burdekin management unit, as mapped by Darr et al., (©Copyright DNRM, unpublished data).
36
Don
Figure 11. Density of gully erosion in the Don management unit, as mapped by Darr et al., (©Copyright DNRM, unpublished data).
37
East Burdekin
Figure 12. Density of gully erosion in the East Burdekin management unit, as mapped by Gilad et al. (2012) and Tindall et al. (2014), © Copyright The State of Queensland.
38
Bowen/Bogie
Figure 13. Density of gully erosion in the Bowen/Bogie management unit, as mapped by Gilad et al. (2012) and Tindall et al. (2014), © Copyright The State of Queensland.
39
Isaac
Figure 14. Density of gully erosion in the Isaac management unit, as mapped by Darr et al., (©Copyright DNRM, unpublished data).
40
Theresa Creek
Figure 15. Density of gully erosion in the Theresa Creek management unit, as mapped by Trevithick et al. (2009), © Copyright The State of Queensland (DNRW).
41

Mackenzie
Figure 16. Density of gully erosion in the Mackenzie management unit, as mapped by Trevithick et al. (2009), © Copyright The State of Queensland (DNRW).
42
Fitzroy
Figure 17. Density of gully erosion in the Fitzroy management unit, as mapped by Trevithick et al. (2009), © Copyright The State of Queensland (DNRW).
43
Mary (1/2)
Figure 18. Density of gully erosion in the Mary River basin / management unit, based on preliminary mapping (as of July 2015) on the western side of the basin by Darr et al., (©Copyright DNRM, unpublished data), and elsewhere by the mapping of Hughes et al. (2001).
44
Mary (2/2)
Figure 19. Density of gully erosion in the Mary River basin / management unit, based on mapping by Hughes et al. (2001). This figure is included due to the preliminary status of the DNRM mapping in Figure 18.
45