bc technology report card 2014 edition
TRANSCRIPT

8102019 BC Technology Report Card 2014 Edition
httpslidepdfcomreaderfullbc-technology-report-card-2014-edition 127
British ColumbiaTechnologyReport Card
2014 Edition
Bordering on the big playtaking our tech sector tothe next level
kpmgcatmt
8102019 BC Technology Report Card 2014 Edition
httpslidepdfcomreaderfullbc-technology-report-card-2014-edition 227
Contents
49
49
46
copy 2014 KPMG LLP a Canadian limit ed liability par tnership and a member firm of the KPMG network of independent member
firms affiliated with KPMG International Cooperative (ldquoKPMG Internationalrdquo) a Swiss entity All rights reserved
014 KPMG LLP a Canadian limited liabi lity partnership and a member firm of the KPMG network of independent member
s affiliated with KPMG International Cooperative (ldquoKPMG Internationalrdquo) a Swiss entity All rights reserved
03 Foreword
04 Executive Summary
06 Industry Profile and Comparative Analysis
Economic Impact Assessment
Conclusion
Acknowledgements
Introduction
Part A Economic Performance Indicators
Current BC Techno logy Industry Economic Impact
Economic Impact o f BC Techno logy Industry Growth
BC Techno logy Indust ry Economic Impact Mult ip liers
Intellectual Property
Research and Development
Access to Capital
Talent Availability
Part B Industry Input Indicators
Exports
Employment and Wages
Industry Revenues
Gross Domestic Product
8102019 BC Technology Report Card 2014 Edition
httpslidepdfcomreaderfullbc-technology-report-card-2014-edition 327
Foreword
In todayrsquos British Columbia technology has become a critical econom
engine not only driving tech industry growth beyond the $23 billion m
but contributing to innovation and success in a range of provincial ma
and industries As one of the largest contributors to the BC economy
tech sector is poised to play an essential role in the provincersquos growth
strategies and economic fortunes for the foreseeable future
We have however already seen the challenges this will entail In 2012 we collaborated wit
on the first edition of the British Columbia Technology Report Card ndash an in-depth study ex
the relative performance of BCrsquos tech sector While we learned that it was provincially str
outperforming other BC industry sectors we also learned that our performance against o
national and international tech sectors was below both our hopes and expectations
As a result we took our commitment to helping the industry fulfill its potential even further O
heels of the 2012 report we consulted extensively with technology sector leaders post-secon
institutions business leaders investors and government colleagues to develop A 4-Point P
for Growing the BC Tech Industry This initiative outlined the actions and activities necessar
significantly change the shape and growth of BCrsquos technology industry
Now the 2014 British Columbia Technology Report Card ndash Bordering on the big play taking
our tech sector to the next level provides an important progress check analyzing the secto
economic impacts across multiple dimensions and offering further deeper insights from ind
leaders What did we find How far have we come The positives remain positive with BC
technology sector outperfo rming other provincial secto rs and growing substantiall y in GDP
industry revenues and wages And there have been a healthy number of new companies f
as well as an increase in the number of mid-sized companies However while we have nar
the gap when compared with tech sectors in other jurisdictions the data shows that we st
in several important areas such as access to venture capital and talent availability ndash themes
were consistent with the recommendations outlined in the 4-Point Plan
This is a critical juncture for the technology industry in BC The road to greatness requideliberate strategic investments that support the vision of a vibrant diversified economWe are on the cusp of creating meaningful jobs and opportunities for generations of BColumbians to come if only we can meet the challenges at hand and continue to grow
improve We look forward to working with our industry academic and government colto ensure this vision becomes reality
Bill Tam
President and CEO
British Columbia Technology
Industry Association (BCTIA)
copy 2014 KPMG LLP a Canadian limit ed liability par tnership and a member firm of the KPMG network of independent member
firms affiliated with KPMG International Cooperative (ldquoKPMG Internationalrdquo) a Swiss entity All rights reserved
014 KPMG LLP a Canadian limited liabi lity partnership and a member firm of the KPMG network of independent member
s affiliated with KPMG International Cooperative (ldquoKPMG Internationalrdquo) a Swiss entity All rights reserved
8102019 BC Technology Report Card 2014 Edition
httpslidepdfcomreaderfullbc-technology-report-card-2014-edition 427
The technology industry is a leader in British Columbia today contributing
significantly to the provincersquos GDP and hosting a new crop of global stars like
Avigilon Build Direct Global Relay Hootsuite Vision Critical and Westport
Indeed the 2014 British Columbia Technology Report Card ndash Bordering on the
big play taking our tech sector to the next level suggests that on the provincial
stage the industry is reaping the benefits of deliberate long-term investments
made by all levels of government and is performing strongly compared to other
BC sectors However while this strength has been consistent over time (the
same positives emerged clearly in the 2012 report card) the BC tech industry
is still catching up to its peers in the rest of Canada and faces significant
challenges to becoming globally competitive
Given the advantages at hand ndash a strong tech infrastructure a vibrant start-up community a wealth
of ideas and innovation proximity to major tech markets ndash itrsquos critical that we realize the full potential
of BC tech through a renewed focus on and investment in the sector This is no time to falter
Tech literally drives the world from the way businesses compete at the highest levels to the way
individuals play and communicate and there is no end in sight While strength across all sectors is
important (BCrsquos burgeoning resource industries provide a prime example) the strongest economies
have a fundamentally strong tech component and BC is on the cusp of taking that strength to the
next level With an abundance of technology companies already operating in BC now is the time to lay
the groundwork for their future success and begin reaping the resulting benefits to the BC economy
Overall this report card examines the performance of the
BC technology industry relative to other industries in BC
and to the technology industries of other provinces and
countries We take a deeper dive into the trends reflected in
the data by incorporating insights from some of BCrsquos leading
corporate tech sector executives Finally we estimate the
economic benefits the province could obtain from growth in
the technology industryrsquos output
The collected data also supports a number of key conclusions
The BC technology industry is reaping the benefits of
past investments An engine of growth in BC today the
technology sector is one of the strongest contributors to
provincial GDP and creates jobs that pay 66 percent higher
wages than the industrial average BCrsquos technology sector also
has a significantly higher overall economic impact than the
provincersquos primary resource industries By incenting private
investment in the sector the introduction of programs such
as the Small Business Venture Capital tax credit the angel
tax credit Scientific Research amp Experimental Development
(SRampED) tax incentive the Interactive Digital Media tax
credit and the BC Renaissance Capital Fund have all played
significant roles in driving the successes we see today
Provincial investment and sector focus are more
important than ever While the aforementioned capital
investment and tax credit programs have helped the growth
of the technology sector to date renewing and augmenting
these programs would play a significant role in taking our
tech sector to the next level The tech industry is working
hard to improve and with the BC government and technology
minister currently refreshing the provincersquos technology
strategy there is strong room for optimism in our tech future
and in the opportunity for all parties to work together to
address some key challenges
Government support in the following three critical areas
could have a significant impact on the continued growth
of the technology industry and its companies
bull Revitalizing access to early stage venture capitalA local supply of early stage venture capital is largely
absent in the province Early stage venture capital
is an essential ingredient to the most successful tech
companies Without it companies falter stall or w
fail outright in capturing the market opportunity be
them The decline of local venture capital not only
deprives companies of adequate risk capital but a
the guidance and networking support that are ess
to early stage growth Moreover an over-reliance o
foreign venture capital increases the risk that succ
companies will eventually relocate to other jurisdi
bull Expanding talent availability There is a dearth
seasoned senior management while upcomin
talent is currently lacking in specific fields suc
as engineering sciences and marketing The ta
needed to fill senior roles is t ypically cultivated or
as firms grow in size to medium and large enterpWith relatively few medium and large enterprises
the available pool of senior management is notice
constrained At the staff level companies are incr
challenged to fill roles locally as a result of fewer s
enrolling in key areas ndash including engineering scie
marketing ndash compared to other provinces in Canad
bull Growing the size of firms The BC technology in
faces the challenge of growing the average size
firms and growing the number of medium and
anchor companies in the province Organic grow
start-up success are the lifeblood of a vibrant sus
tech sector but currently the vast majority of BC t
companies employ fewer than 50 people Given t
to which medium and large firms benefit the econ
through RampD employment community involveme
other spinoff effects a commitment to a growth s
to both grow existing ones and attract larger com
is essential
While these are difficult issues BC tech is holding its
in many ways contributing significantly to the BC ec
making strides to catch up with other provincial tech
and attracting an increasing number of global players
all BC tech stakeholders from companies to governm
to academic institutions continue to pool not only ouintellectual and financial resources but our commitm
to meeting the challenges above long-term success
be ours for the taking
Executive Summary
Anthony Lindsay
Partner Greater Vancouver Area
Market LeaderTechnology Media
and Telecommunications KPMG
Economic Performance
Indicators
Versus Other BC Industry Sectors Versus Other Provincial Tech Sectors
2014 2012 2014 2012
A A
Industry Input Indicators NA NA
Overall A A
C+
Cndash
C+
C
Cndash
CSlavi Diamandiev
Greater Vancouver Area
Economics Practice Lead
Management Consulting KPMG
BC Technology Industry ndash 2014 Report Card
014 KPMG LLP a Canadian limit ed liability par tnership and a member firm of the KPMG network of independent member
s affiliated with KPMG International Cooperative (ldquoKPMG Internationalrdquo) a Swiss entity All rights reserved
copy 2014 KPMG LLP a Canadian limit ed liability par tnership and a member firm of the KPMG network of independent member
firms affiliated with KPMG International Cooperative (ldquoKPMG Internationalrdquo) a Swiss entity All rights reserved
British Columbia Technology Report Card
Executive Sum
8102019 BC Technology Report Card 2014 Edition
httpslidepdfcomreaderfullbc-technology-report-card-2014-edition 527
1 There is no universally adopted definition of what the tech (or ldquohigh-techrdquo) industry should encompass and in any case such a definition is likely to vary over tim
technology evolves For the purposes of this report KPMG has used the definition adopted by BC Statistics which allows us to leverage the rich dataset publishe
agency and ensures consistency with the definition used in the 2012 edition of the Tech Report Card published by KPMG The high technology sector as defined
Stats is comprised of ldquostandard industries that produce high technology goods and services as their ultimate outputsrdquo In 2014 a total of 39 standard industry
have been included in the high technology sector representing a mix of manufacturing and service producing sectors
IntroductionThe BC technology industry comprises a number of complementary s
with over 9000 companies operating in the province1 The majority ofare small enterprises with 90 percent of their output being services
the technology industry generates $15 billion in GDP and creates ove
jobs in BC
This report card paints a detailed statistical portrait of the BC techno
sector comparing it to other industries in BC and to technology indu
across Canada and globally We then rate the performance of the BC
industry today review its progress since the 2012 report card and hig
themes for collective action going forward
We would like to acknowledge the contribution of BC Stats in devel
a rich collection of data and analysis for the high technology sector in
making our detailed assessment possible
Industry Profileand ComparativAnalysis
014 KPMG LLP a Canadian limit ed liability par tnership and a member firm of the KPMG network of independent member
s affiliated with KPMG International Cooperative (ldquoKPMG Internationalrdquo) a Swiss entity All rights reserved
copy 2014 KPMG LLP a Canadian limit ed liability par tnership and a member firm of the KPMG network of independent member
firms affiliated with KPMG International Cooperative (ldquoKPMG Internationalrdquo) a Swiss entity All rights reserved
8102019 BC Technology Report Card 2014 Edition
httpslidepdfcomreaderfullbc-technology-report-card-2014-edition 627
Engineering amp Other
ServicesFeaturing companies
engaged in engineering
activities related to design
development and
utilization of machines
instruments and services
and companies engaged in
scientific research
development and
consulting servicesCleantechFeaturing companies in energy generation
energy transmission and storage energy
use in transportation energy efficiency
and resource management
Information amp Communications TechnologyFeaturing companies in telecommunications software
development computer services manufacturing and
wholesaling but excluding wireless and digital media
which have been presented separately for the
purposes of this report
Digital Media amp WirelessDigital media features companies in video
gaming animation and visual effects social
media interactive marketing and e-learning
Wireless features companies in all areas of the
mobile ecosystem including mobile operators
platform providers and device manufacturers
Life SciencesFeaturing companies involved in
biopharmaceuticals medical devices
bioproducts and bioenergy and greater
life sciences
~ 20550 jobs~ 2667 companies
~ $95 billion inrevenues
~ 27480 jobs~ 3900 companies
~ $75 billion inrevenues
~ 16500 jobs~ 1150 companies
~ $3 billion inrevenues
3
~ 8500 jobs~ 310 companies~ $805 million in
revenues
~ 6400 jobs~ 202 companies~ $17 billion in
revenues
BC TechnologyIndustry
4
5
2
1
NPUTS
RODUCTION INDUSTRY STRUCTURE
bull Jobs 84000
bull Avg Wage $1440wk
LABOUR
bull
bull A
VC Investment $201M
ngel Investment $97M
CAPITAL
Distr ibution of Companies by Size
0
2000
4000
6000
8000
1 ndash 4
5 ndash 9
1 0 ndash 1 9
2 0 ndash 4 9
5 0 ndash 9 9
1 0 0 ndash 1 9 9
2 0 0 ndash 4 9 9
Number of Employees
DigitalMedia~$3B
ICT~$95B
Clean Tech~$17B
Life Sciences~$08B
BC TechIndustry
Revenues
Engineering ampOther Services
~$75B
bull RampD Investment $3B
bull patents 165yr
bull university licenses 116yr
INTELLECTUAL
CAPITAL
UTPUTS bull GDP $15 B
bull REVENUES $23 B
bull EXPORTS $3 B
Services 90
Goods 10
Services 66
Goods 33
Although this complex industry comprises approximately 9000 companies delivering products and
services across a number of complementary and overlapping sectors the BC Technology Industry
Association recognizes five distinct industry segments
he Technology Industry at a Glance
urce KPMG Industry Analysis Framework and analysis of data from BC Stats Profile of the British Columbia High Technology Sector BC Stats March 2014 Source BCTIA Analysis2
2 The jobs company count and revenue figures reported in this s chematic are not directly comparabl e to those in the 2012 report card since the
technology industry has been broken up differently to align total figures with those reported by BC Stats Notably the Digital Media amp Wireless
sectors have been grouped together and the Engineering amp Other Services sector has been extracted from the Information amp Communications
Technology sector
014 KPMG LLP a Canadian limit ed liability par tnership and a member firm of the KPMG network of independent member
s affiliated with KPMG International Cooperative (ldquoKPMG Internationalrdquo) a Swiss entity All rights reserved
copy 2014 KPMG LLP a Canadian limit ed liability par tnership and a member firm of the KPMG network of independent member
firms affiliated with KPMG International Cooperative (ldquoKPMG Internationalrdquo) a Swiss entity All rights reserved
British Columbia Technology Report Card 2014 British Columbia Technology Report Card
Industry Profile and Comparative Analysis Industry Profile and Comparative An
8102019 BC Technology Report Card 2014 Edition
httpslidepdfcomreaderfullbc-technology-report-card-2014-edition 727
art A Economic Performance Indicatorsnce the last report card the BC technology industry has outperformed other industry sectors in the
ovince particularly in terms of revenues and GDP growth There has also been significant growth in
ages relative to other industries While this overall growth has led to some sector gains it has yet
catch up with the performance of the technology industries in some of the other provinces3
onsistent with the 2012 report card the economic performance of the BC technology industry was reviewed on the basis of five key
conomic performance indicators GDP revenues employment wage levels and exports of goods and services
Gross Domestic Product
The technology industry is respons ible for 76 percent of the BC economy and contributes $155 billion
to the provincial GDP However despite gains in terms of GDP per cap ita BC continues to tr ail the
performance of other provinces and states
onomic Performance Indicators
Grade
Gross Domestic Product
Versus Other
BC Industry Sectors 2014
Versus Other Provincial
Tech Sectors 2014
Industry Revenues
Employment
Wages
Exports Data Unavailable
A C+
Versus Other BC
Industry Sectors
Versus Other Provincial
Tech Sectors
Summary
Industry GDP
Industry GDP Growth
C Technology Industry ndash 2014 Report Card
Comparison of GDP
Versus other BC industry sectors
bull Strong economic contribution ndash Contributes more to the economy than resource-based
sectors with one of the highest GDP generated of all industries in BC ($155B in 2012)
bull Strong growth ndash Grew by double the rate of the BC economy having the second highest
GDP growth among all industries in BC
bull Large labour force ndash Employs 84000 people more than the forestry mining and oil and
gas sectors combined
bull High paying jobs ndash Wages are 66 percent higher than the BC industrial averageVersus other provincial tech sectors
bull Lagging economic contribution ndash Per capita GDP continues to be lower than provinces
with significant technology sectors however BC has been catching up in recent years
bull Lagging employment ndash Per capita employment is lower than provinces with significant
technology sectors
Highlights
014 KPMG LLP a Canadian limit ed liability par tnership and a member firm of the KPMG network of independent member
s affiliated with KPMG International Cooperative (ldquoKPMG Internationalrdquo) a Swiss entity All rights reserved
copy 2014 KPMG LLP a Canadian limit ed liability par tnership and a member firm of the KPMG network of independent member
firms affiliated with KPMG International Cooperative (ldquoKPMG Internationalrdquo) a Swiss entity All rights reserved
British Columbia Technology Report Card 2014 British Columbia Technology Report Card
Industry Profile and Comparative Analysis Industry Profile and Comparative An
8102019 BC Technology Report Card 2014 Edition
httpslidepdfcomreaderfullbc-technology-report-card-2014-edition 827
oing deeperonsistent with the findings of the 2012 report card BC tech continues to be one of the top three
ntributors to the provincial economy outperforming traditional sectors such as forestry mining oil
d gas and transportation in GDP contribution4
oll ar figures are not directly comp arable to the 2012 report card due to a difference in the base year (ldquochainedrdquo dollar calcula tion) used by BC
tats Also GDP figures are not additive since the technology industry GDP figure is derived by BC Stats and is not mutually exclusive with
he GDP figures of other industries
urce Profile of the British Columbia High Technology Sector BC Stats March 2014
Source Profile of the British Columbia High Technology Sector BC Stats March 2014
Source Profile of the British Columbia High Technology Sector BC Stats March 2014
DP Contribution 2012 (chained 2007 dollars) and Change since 2009
Index of GDP Contribution (2007 = 100)
Growth Rate of GDP Contribution 2007 ndash 2012
Go od s p ro du ci ng S er vic es p ro du cin gTechnology
Forestry
Utilities
Wholesale Trade
Mining Oil amp Gas Extraction
of Scientific and Technology
ransportation amp Warehousing
Retail Trade
Technology
Construction
Other Manufacturing
Finance Ins Real Estate
+38
+07
+09
+14
+05
+11
+08
+09
+12
+11
+09
$ million$1651
$3927
$7844
$10186
$10302
$10844
$11414
$13758
$14040
$15524
$44310
BCrsquos tehas groby 12 p
since 2while tBC GDby 6 pe
Havingby 12 psince 2BCrsquos teindust
experiethe sechighesgrowthof all B
indust
90
95
100
105
110
2007 2008 2009 2010 2011 2012
I n d e x
( 2 0 0 7
= 1
0 0 )
BC Technology BC Industr ial Aggregate
Moreover technology has grown at double the rate of the overall BC economy over the last five years
having the second highest rate of GDP growth of all BC industries
ndash20 ndash15 ndash10 ndash5 0 5 10 15
Forestry
Other Manufacturing
Wholesale Trade
Utilities
Prof Scientific and Tech
Retail Trade
Mining Oil amp Gas Extraction
Transportation amp Warehousing
Finance Ins Real Estate
Technology
Construction
T ec hn ol og y Go od s pr od uc in g S er vi ce s pr od uc in g
BClsquos techindustrymaintainsits position
among the topcontributors tothe provincialeconomy
014 KPMG LLP a Canadian limit ed liability par tnership and a member firm of the KPMG network of independent member
s affiliated with KPMG International Cooperative (ldquoKPMG Internationalrdquo) a Swiss entity All rights reserved
copy 2014 KPMG LLP a Canadian limit ed liability par tnership and a member firm of the KPMG network of independent member
firms affiliated with KPMG International Cooperative (ldquoKPMG Internationalrdquo) a Swiss entity All rights reserved
British Columbia Technology Report Card 2014 British Columbia Technology Report Card
Industry Profile and Comparative Analysis Industry Profile and Comparative An
8102019 BC Technology Report Card 2014 Edition
httpslidepdfcomreaderfullbc-technology-report-card-2014-edition 927
addition to its direct contributions to the BC economy the tech industry has indirect impacts
eated by industry suppliers and induced impacts from the spending of the labour income generated
technology and supplier industries In total these represent the total economic impacts of the
dustry and this number proves to be significant Our analysis finds that per dollar of revenues the
chnology industry in BC has a higher total GDP impact than BCrsquos primary resource industries
well as the construction industry High GDP per dollar of revenue is indicative of high value added
ring the production process (as measured by a relatively high value of the final productservice net
the intermediary inputs in production) From an income perspective high GDP per dollar of revenue
associated with high levels of labour income and company profits generated by the industry (net of
preciation interest taxes and subsidies)
r every $1 of Revenues $GDP
nduced GDP Impact
08 085 09 095 10
01 02 03 04 05
Total GDP Impact
ldquoForestryrdquo includes Forestry and Logging
ldquoMining Oil amp Gasrdquo includes Mining Quarrying and Oil amp Gas Extraction
ldquoConstructionrdquo includes Residential Construction
ldquoTechnologyrdquo includes the Technology Industry as defined by BC Stats
01 02 03 04 05
ndirect GDP Impact
03 04 05 06 07
Direct GDP Impact
omparison of GDP Impacts Across BC Industries
Tech GDP Contribution and Share of Services and Manufacturing Sectors 2012
urce KPMG Analysis of Statistics Canadarsquos Inter-provincial Input-Output Multipliers
te For a more detailed description and analysis of the economic impacts of the BC technology industry on the overall economy please refer
he Economic Impact Analysis section of this report card
The technology industry in BC is comparable to that in Alberta in both absolute size and composition
in both provinces nearly 90 percent of the industryrsquos value-added output is generated by its services
sector In contrast the technology industries in Ontario and Queacutebec are much larger in absolute size and
manufacturing plays a greater industry role
m i l l i o n
( c h a i n e d 2 0 0 7 )
Services Manufacturing
British Columbia Alberta Ontario Queacutebec
68
78
9489
$50000
$40000
$30000
$20000
$10000
$0
Source Profile of the British Columbia High Technology Sector BC Stats March 2014
The maof BC toutputgenera
the sersector
014 KPMG LLP a Canadian limit ed liability par tnership and a member firm of the KPMG network of independent member
s affiliated with KPMG International Cooperative (ldquoKPMG Internationalrdquo) a Swiss entity All rights reserved
copy 2014 KPMG LLP a Canadian limited liabi lity partnership and a member firm of the KPMG network of independent member
firms affiliated with KPMG International Cooperative (ldquoKPMG Internationalrdquo) a Swiss entity All rights reserved
British Columbia Technology Report Card 2014 British Columbia Technology Report Card
Industry Profile and Comparative Analysis Industry Profile and Comparative An
8102019 BC Technology Report Card 2014 Edition
httpslidepdfcomreaderfullbc-technology-report-card-2014-edition 1027
hen the population size of each province is taken into account enabling a more reasonable performance
mparison we find that BCrsquos technology industry has historically generated the lowest GDP on a per
pita basis However over the last five years BCrsquos technology sector has had the highest compound
nual growth rate among all the provinces significantly reducing the GDP per capita gap
ech GDP Per Capita (chained 2007) Technology GDP as a Percent of Total GDP
dex of Technology Industry GDP (2007 = 100)
$4100
$3900
$3700
$3500
$3300
$3100
$2900
$2700
2007 2008 2009 2010 2011 2012
Br it ish Columbia Alber ta Ont ario Queacutebec Canada
urce KPMG analysis of data from the Profile of the British Columbia High Technology Sector BC Stats March 2014 and Statistics Canadarsquos
NSIM Table 051-0001
urce Profile of the British Columbia High Technology Sector BC Stats March 2014
Source KPMG analysis of data from the Profile of the British Columbia High Technology Sector BC Stats March 2014 and World Bank
National Accounts
2007 2008 2009 2010 2011 2012
Br it ish Columbia Alber ta Ont ario Queacutebec Canada
115
110
105
100
95
90
85
80
In fact at 24 percent BCrsquos technology industry GDP is growing faster than the Canadian and US averages
and BCrsquos technology sector now accounts for the same proportion of the overall provincial GDP as does
the technology industry for Canada as a whole56 That said BCrsquos technology industry is still 30 percent
behind that of the US in terms of its contribution to tot al GDP highlighting a significant upsi de potential
120
100
80
60
40
20
00
76
69
(2009)
77 103 24 11 21
Tech GDP as a of Total in 2012 CAGR in Tech GDP (2007ndash2012)
Br it ish C olu mbia C anada Un it ed S tat es
5 This analysis uses nominal values to calculate Compound Annual Growth Rate (CAGR) for the USrsquos Tech GDP (deflated numbers are
unavailable) The gap between the growth rates of BC and US technology industries will be even larger if the US GDP is adjusted for inflation
6 The data for BC tech GDP from the 2012 report card has been revised In 2009 BC tech GDP as a share of its economy was 69 percent and
not 59 percent as previously reported
BCrsquos techindustry
trails otherprovinces inper-capita GDPcontributionbut is closing
the gap
While
techrsquos a perceof totais at p
Canad30 percbehindUS itscontrib
growinthan b
BC tech hasthe highestannual growth
rate among allthe provinces
014 KPMG LLP a Canadian limit ed liability par tnership and a member firm of the KPMG network of independent member
s affiliated with KPMG International Cooperative (ldquoKPMG Internationalrdquo) a Swiss entity All rights reserved
copy 2014 KPMG LLP a Canadian limited liabi lity partnership and a member firm of the KPMG network of independent member
firms affiliated with KPMG International Cooperative (ldquoKPMG Internationalrdquo) a Swiss entity All rights reserved
British Columbia Technology Report Card 2014 British Columbia Technology Report Card
Industry Profile and Comparative Analysis Industry Profile and Comparative An
8102019 BC Technology Report Card 2014 Edition
httpslidepdfcomreaderfullbc-technology-report-card-2014-edition 1127
Going deeper
BCrsquos technology industry revenues have rebounded since the 2008 recession showing a higher
compound annual rate since 2009 (67 percent) than it did prior to 2009 (55 percent)78
hile BC has made progress since 2012 in terms of the size of the technology industry relative to the
erall economy there remains a significant opportunity for growth as evidenced by comparison to both
dividual US states as well as the US average
GDP originating in the technology sector 2011Comparison of Industry Revenues
BC Technology Revenues
0 5 10 15 20 25
Oregon
Washington
Colorado
California
assachusetts
New Mexico
Maryland
Indiana
w Hampshire
Virginia
Idaho
New Jersey
orth Carolina
US
Connecticut
Utah
Kansas
Vermont
Georgia
Arizona
Missouri
Texas
Minnesota
Pennsylvania
Canada
ish Columbia
urce Profile of the British Columbia High Technology Sector BC Stats
Source Profile of the British Columbia High Technology Sector BC Stats March 2014
Industry Revenues
The technology industry generates a significant revenue base in BC that has grown substantially over
the last few years However on a per capita basis technology continues to trail other provinces
Versus Other BC Industry
Sectors 2014
Versus Other Provincial
Tech Sectors 2014
Summary
Industry Revenues NA
Industry Revenue Growth
7 Revenue figures are not adjusted for inflation For inflation-adjusted output values please refer to the GDP section of this analysis
8 Industry revenue figures for BC were generated using revenue data by establishments That is for firms headquartered in BC
only the revenues generated from their BC operations are included in the revenue calculations
2 0 0
2
2 0 0 3
2 0 0 4
2 0 0 5
2 0 0 6
2007 2 0 0 8
2 0 0 9
2 0 1 0
2 0 1 1
2 0 1
2
130
141
152
169
179
200201
191
192
224
232
Industrevenuhave g
at 67 pon an abasis s
014 KPMG LLP a Canadian limit ed liability par tnership and a member firm of the KPMG network of independent member
s affiliated with KPMG International Cooperative (ldquoKPMG Internationalrdquo) a Swiss entity All rights reserved
copy 2014 KPMG LLP a Canadian limit ed liability par tnership and a member firm of the KPMG network of independent member
firms affiliated with KPMG International Cooperative (ldquoKPMG Internationalrdquo) a Swiss entity All rights reserved
British Columbia Technology Report Card 2014 British Columbia Technology Report Card
Industry Profile and Comparative Analysis Industry Profile and Comparative An
8102019 BC Technology Report Card 2014 Edition
httpslidepdfcomreaderfullbc-technology-report-card-2014-edition 1227
owever BCrsquos technology industry revenues continue to account for a lower share of overall Canadian
chnology industry revenue as compared to BCrsquos share of the Canadian population While the gap has
ghtly narrowed compared to our 2012 findings BC remains the only province among Queacutebec Ontario and
berta to show such a trend
oreover the sectorrsquos revenue growth rate continues to outperform the Canadian average although BC
s been surpassed by Alberta in this regard
200
180
160
140
120
100
80
2002 2003 2004 2005 2006 2007 2008 2009 2010 2011 2012
Bri tish Columbi a Al berta Ont ari o Queacutebec Canada
dex of Technology Industry Revenue (2002 = 100)
opulation and Technology Revenues as a Percent of Canadian Totals 2012
urce Profile of the British Columbia High Technology Sector BC Stats March 2014
urce KPMG analysis of data from the Profile of the British Columbia High Technology Sector BC Stats March 2014 and Statistics Canada
NSIM Table 051-0001
British ColumbiaAlbertaOntarioQueacutebec
0
0
0
0
0
Population 2012Technology Revenues 2012
BC techrevenuegrowth
continues tooutperformthe Canadianaverage
BC tech
continues totrail otherprovinces inper capita
revenueThis gap hasnarrowedslightly since
the 2012report card
Industry leaders interviewed by KPMG observed that a number of external factors have helped to
augment the growth of BCrsquos tech industry
bull Government programs such as the National Research Councilrsquos Industrial Research Assistance
Program (IRAP) the Scientific Research and Experimental Development (SRampED) program
and the Small Business Venture Capital program are significant industry drivers as they incent
investment in innovative technologies and create a healthy start-up climate Other agencies
such as the BC Bioener gy Network BC In novation Council BC Trade amp Investment NRC-IRAP
the Natural Sciences and Engineering Research Council (NSERC) Export Development Canada
Sustainable Development Technology Canada (SDTC) Western Economic Diversification (WED)
and the Department of Foreign Affairs and Trade Development (DFATD) provide funding support
and program resources to assist local start-ups
bull BC is a more cost effective place to do business The corporate income tax regime andsecurity and privacy regulations create a favourable investment environment and are attractive
to companies looking to set up operations
bull The close proximity of BC tech to US markets such as Seattle and Silicon Valley is seen as
an advantage and a major growth driver
bull In certain technology sectors (eg financial and business software mobilewireless
technologies and web-based and gaming technologies) growth has been supported by rich
talent pools available at a lower cost relative to US clusters such as Silicon Valley BC tech
companies have also demonstrated stronger employee retention rates when compared to
other jurisdictions in the US and globally
bull Last but not least there is a perception within the industry that the technology sector in BC is
a tightly knit cohesive community which helps attract creative people to grow their businesses
in this province
Industry insights on output growth
014 KPMG LLP a Canadian limit ed liability par tnership and a member firm of the KPMG network of independent member
s affiliated with KPMG International Cooperative (ldquoKPMG Internationalrdquo) a Swiss entity All rights reserved
copy 2014 KPMG LLP a Canadian limited liabi lity partnership and a member firm of the KPMG network of independent member
firms affiliated with KPMG International Cooperative (ldquoKPMG Internationalrdquo) a Swiss entity All rights reserved
British Columbia Technology Report Card 2014 British Columbia Technology Report Card
Industry Profile and Comparative Analysis Industry Profile and Comparative An
8102019 BC Technology Report Card 2014 Edition
httpslidepdfcomreaderfullbc-technology-report-card-2014-edition 1327
omparison of Employment
omparison of Wages
Employment and Wages
e number of jobs sustained by BCrsquos technology industry has grown significantly over the last
cade However this growth has slowed in recent years placing BC behind other provinces in terms
technology jobs per capita This slowdown in employment growth may be the result of gains in
oductivity where higher value is being created by each job in the province or it may be because a
eater proportion of out-of-province employees are being employed by BC companies
e real wage in BC has grown significantly Although this is potentially consistent with growth in
oductivity there are likely other important contributing factors such as the high cost of living in BC
age inflation caused by the arrival of new multinationals and the significant competition for certain
pes of talent In any case BC technology offers high paying jobs ndash not only relative to other BC
dustries but also to the Canadian average for technology
Industry Employment
Industry Employment Growth
Summary
Versus Other BC Industry
Sectors 2014
Versus Other Provincial
Tech Sectors 2014
Industry Wages
Versus Other BC Industry
Sectors 2014
Versus Other Provincial
Tech Sectors 2014
Summary
Employment in 2009 and 2012
Going deeper
Employment
Employing 84000 people in 2012 the BC technology industry continued to outperform resource-based
industries such as forestry mining and oil and gas
Source Profile of the British Columbia High Technology Sector BC Stats March 2014
$
Retail amp Wholesale Trade 344
341
184
187
114
122
111
117
97
103
84
84
80
78
67
75
2009 2012
Accomodation amp Food Services
Construction
Finance Insurance amp Real Estate
Transportation amp Warehousing
Technology
Manufacturing
Forestry Mining OilGas amp Utilities
In 2012tech emmore p
than thforestrymining
and gaand ut
industcombi
copy 2014 KPMG LLP a Canadian limited liabi lity partnership and a member firm of the KPMG network of independent member
firms affiliated with KPMG International Cooperative (ldquoKPMG Internationalrdquo) a Swiss entity All rights reserved
014 KPMG LLP a Canadian limited liabi lity partnership and a member firm of the KPMG network of independent member
s affiliated with KPMG International Cooperative (ldquoKPMG Internationalrdquo) a Swiss entity All rights reserved
British Columbia Technology Report Card 2014 British Columbia Technology Report Card
Industry Profile and Comparative Analysis Industry Profile and Comparative An
8102019 BC Technology Report Card 2014 Edition
httpslidepdfcomreaderfullbc-technology-report-card-2014-edition 1427
owever while the technology sector experienced the third highest growth in employment among all
e industries in BC between 1999 and 2012 employment has been flat since 2009 9
or reference the min ing oil amp gas and extraction industr y which experienced the highest growth in employment between 1999 and 2012 started
t one-sixth the employment level of the technology industry in the base year 1999 and remains significantly lower in 2012 at 22000 employees
101
68
38
35
ndash44
ndash14
6
16
22
32
1101009080706050403020100ndash10ndash20ndash30ndash40ndash50
Mining Oil and Gas Extraction
Construction
Technology
ccomodation amp Food Services
Retail amp Wholesale Trade
Transportation amp Warehousing
ance Insurance amp Real Estate
Utilities
Manufacturing
Forestry
mployment Growth between 1999 and 2012
urce Profile of the British Columbia High Technology Sector BC Stats March 2014
The tech
sector hasexperiencedthe thirdhighestgrowth in
employmentin the provincesince 1999However
growth hasbeen minimalsince 2009
Some companies suggested that employment had in fact grown in more recent years and that
the demand for talent is as high as ever assertions which would not be reflected in data ending at
2012 It was also suggested that companies have been employing personnel outside the province
due in the part to limited talent availability in certain areas ndash another factor which is not captured by
the analysis On the other hand leaders from larger BC technology companies supported the view
that employment growth has slowed driven by productivity gains and a focus on better utilizing
existing employees
Deeper analysis of the employment data suggests variation in the employment trend by industry sector
and firm size For example between 2009 and 2012 there was a notable decline in employment in
BCrsquos ldquomotion picture and post-productionrdquo sector This was compensated for however by healthy
employment growth in other t ech sectors such as ldquoengineering and other servicesrdquo
Industry leaders have also predicted industry growth since 2013 again an assertion which our
data would not reflect
Industry Insights on Employment Trends
Technology Jobs per 100000 Population
Canada Tech Industry GDP per Person Employed
Source Profile of the British Columbia High Technology Sector BC Stats March 2014
Source KPMG analysis of data from Profile of the British Columbia High Technology Sector BC Stats March 2014
On a per capita basis BCrsquos technology sector employment has remained stable since 2009 at
approximately 18 percent below the Canadian average
The improvement in GDP concurrent with flat employment numbers implies that BC is the only province
where technology labour productivity has potentially improved over the last five years
3000
2500
2000
1500
1000
2002 2003 2004 2005 2006 2007 2008 2009 2010 2011 2012
CanadaOnt ar io QueacutebecBritish Columbia Alberta
$180000
$170000
$160000
$150000
$140000
$130000
$120000
$110000
$100000
2007 2008 2009 2010 2011 2012
CanadaO ntar io Q ueacute be cBritish Columbia Alberta
BC tecemplo
per capbeen ssince 2
014 KPMG LLP a Canadian limit ed liability par tnership and a member firm of the KPMG network of independent member
s affiliated with KPMG International Cooperative (ldquoKPMG Internationalrdquo) a Swiss entity All rights reserved
copy 2014 KPMG LLP a Canadian limit ed liability par tnership and a member firm of the KPMG network of independent member
firms affiliated with KPMG International Cooperative (ldquoKPMG Internationalrdquo) a Swiss entity All rights reserved
British Columbia Technology Report Card 2014 British Columbia Technology Report Card
Industry Profile and Comparative Analysis Industry Profile and Comparative An
8102019 BC Technology Report Card 2014 Edition
httpslidepdfcomreaderfullbc-technology-report-card-2014-edition 1527
dustry Wages
nce the 2012 report card BCrsquos technology industry has seen rapid wage growth relative to the average
age in all other provincial industries In 2012 the average tech wage was 66 percent higher than the
erage for the economy as a whole compared with 58 percent in 2009
ationally the real weekly wage in BCrsquos technology industry has grown by twice as much as the Canadian
erage Moreover in 2012 BCrsquos technology industry wage was higher than the Canadian average and
mparable to the level in Ontario However BC continues to trail Alberta in this regard where technology
bs pay 20 percent higher and are comparable to US levels This is consistent with the overall trend in
ages in Alberta which are typically higher than BCrsquos across most industries
verage Earnings minus BC Technology versus BC
eal Weekly Wages (in 2012 prices)
0000
0000
0000
0000
0000
0000
0000
0000
2002 2003 2004 2005 2006 2007 2008 2009 2010 2011 2012
BC TechnologyBC All Industries
$0
urce KPMG analysis of data from Profile of the British Columbia High Technology Sector BC Stats March 2014
urce KPMG analysis of data from Profile of the British Columbia High Technology Sector BC Stats March 2014 and Statistics Canada
NSIM Table 326-0021
600
200
800
400
000
2002 2003 2004 2005 2006 2007 2008 2009 2010 2011 2012
CanadaQueacutebecOntarioAlbertaBritish Columbia US
BC tech jobsearn 66 percentmore than theBC average
salary
BC has higherpaying tech jobs than
the Canadianindustry asa whole
Exports
BC tech industry exports have experienced growth since the 2012 report card however there is room
for significant improvement when it comes to accessing new markets Globally the technology industrytends to be highly mobile since enterprises need not have operations in close proximity to their product
and service markets international trade becomes very important BC tech has the potential to make
significant progress on the global front since its current export performance is poor relative to the
Canadian industry as a whole and it has not experienced any significant growth over the last decade10
10 The data and a nalysis presented in this section is based on the best available data to date However service exports data may be an
underestimate of the true level of service exports As noted by BC Stats data for service exports is challenging to measure since it cannot
be tracked through customs databases Instead it is estimated using surveys and other information available to BC Stats (Profile of the
British Columbia High Technology Sector 2013)
Comparison of Exports
Industry Exports
Summary
Industry Exports Growth
Versus Other BC Industry Sectors 2014
While in theory the rise of the real wage reflects rising productivity there are likely other factors
at play in BCrsquos tech industry Some industry leaders interviewed by KPMG suggested that the
rising cost of living in BC is putting significant upward pressure on compensation Others pointed
to market distortions in specific types of jobs such as software development caused by the entry
of multinational firms that are willing to pay above-market rates to attract talent
Industry Insights on Wage Trends
014 KPMG LLP a Canadian limit ed liability par tnership and a member firm of the KPMG network of independent member
s affiliated with KPMG International Cooperative (ldquoKPMG Internationalrdquo) a Swiss entity All rights reserved
copy 2014 KPMG LLP a Canadian limit ed liability par tnership and a member firm of the KPMG network of independent member
firms affiliated with KPMG International Cooperative (ldquoKPMG Internationalrdquo) a Swiss entity All rights reserved
British Columbia Technology Report Card 2014 British Columbia Technology Report Card
Industry Profile and Comparative Analysis Industry Profile and Comparative An
8102019 BC Technology Report Card 2014 Edition
httpslidepdfcomreaderfullbc-technology-report-card-2014-edition 1627
oing deeper
2012 the BC technology industry exported $3 billion in goods and services with services accounting
r two-thirds of this amount ndash a ratio that has remained fairly constant over time11 Over the last
cade technology exports have grown very slowly and this growth has been notably poor in the
ars since the recession Between 2009 and 2012 while total exports from BC grew by 20 percent
C technology exports grew by only 5 percent
Data for BCrsquos technology services exports have been revised significantly downwards by BC Stats for the years since 2006 Therefore the
updated analysis of exports may not be consistent with the findings of the 2012 report card
500
000
500
000500
000
$500
$02 00 2 2 00 3
Goods Services
2004 2005 2006 2007 2008 2009 2010 2011 2012
C Technology Exports
urce Profile of the British Columbia High Technology Sector BC Stats July 2011
Exports of BC
tech goodsand serviceshave been
relativelystable
The technology industry comprises 65 percent of BCrsquos total exports ndash a figure relatively proportional
to its share of the provinci al GDP Of the total goods and ser vices exported the te ch industryrsquos share
of services is much higher than that of goods although its share has declined by 35 percent compared
to 2012 findings12
12 Based on the revised services export data published by BC Stats it is found that BC technologyrsquos share of total service exports in 2009 was
lower than the figure reported in the 2012 report card (it was 20 percent instead of 32 percent)
70
60
50
40
30
20
10
0
2001 2002 2003 2004 2005 2006 2007 2008 2009
B ri ti sh C ol um bi a C an ad a
Tech Exports (as a of Tech GDP)
Technol ogy O ther I ndustr ies
BC ExportShare
65
935
BC GDPShare
76
924
BC Goods Export Share
BC Services Export Share
13
3
87
97
$16 billion
$31 billion
Source Profile of the British Columbia High Technology Sector BC Stats March 2014
Source Profile of the British Columbia High Technology Sector BC Stats March 2014
However as a percentage of its output BC tech exports a smaller share than the Canadian tech
industry as a whole which implies that our export intensity is lower than that of tech industries in
other provinces
BC tecof provexport
proporto its sthe proeconom
BC tecexport28 perc
its totain 2009compa40 percoutput
exportethe Ca
technoindustr
copy 2014 KPMG LLP a Canadian limit ed liability par tnership and a member firm of the KPMG network of independent member
firms affiliated with KPMG International Cooperative (ldquoKPMG Internationalrdquo) a Swiss entity All rights reserved
014 KPMG LLP a Canadian limited liabi lity partnership and a member firm of the KPMG network of independent member
s affiliated with KPMG International Cooperative (ldquoKPMG Internationalrdquo) a Swiss entity All rights reserved
British Columbia Technology Report Card 2014 British Columbia Technology Report Card
Industry Profile and Comparative Analysis Industry Profile and Comparative An
8102019 BC Technology Report Card 2014 Edition
httpslidepdfcomreaderfullbc-technology-report-card-2014-edition 1727
om a trade balance perspective BC continues to be a significant net importer of technology goods
th the majority originating in the Pacific Rim The magnitude of these imports indicates there is local
mand for certain types of technology goods not being met by local supply
hile detailed trade data for technology services is lacking for BC a closer examination of technology
ods data reveals further insights
terms of exports while the US continues to be the largest consumer of BC technology goods there
s been a significant trend in market diversification towards the Pacific Rim and other countries over
e past decade
C Tech Goods Exports and Imports
urce Profile of the British Columbia High Technology Sector BC Stats March 2014
urce Profile of the British Columbia High Technology Sector BC Stats March 2014
Goods Exports Goods Imports
2002 2003 2004 2005 2006 2007 2008 2009 2010 2011 2012
$5000
$4000
$3000
$2000
$1000
$0
The share oftechnology
goods exportsfrom BC to theUS has beendeclining
BC imports$5 billionworth of
technologygoods whilegeneratingonly $1 billionin exports
Economic Performance Indicators ndash Summary
Current economic performance indicators largely confirm the findings of the 2012 report card
BC technology performs strongly compared to other provincial industries but continues to trail the
technology industries in other provinces To gain more perspective around the ldquowhyrdquo of these results
the following section analyzes inputs to the BC tech industry and highlights the root drivers of its
economic performance
Export readiness and the ability to successfully access new markets are closely correlated to firm
capacities Smaller companies often lack the resources capital and expertise necessary to readily
exploit new markets
The underperformance in BC tech exports relative to other provinces is likely related to the
overweighting of small and very small technology companies in BC Industry leaders observed
that smaller companies often require access to local early-adopter customers as a proving ground
before expanding to new markets As such both corporations and government agencies can play
an important role by helping improve product designmarketing processes and serving as a critical
reference customer
Despite this many BC tech companies find their productsservices are better received in foreign
markets than at home Even among leading companies very few indicate they have much or any
business with BC-based customers
Unlike the US there is as yet no funding set aside by provincial or federal governments to procure
locally from small businesses In fact in some cases the government procurement process has
minimum requirements that are beyond the capabilities of smaller companies
The tech industry is global and in many segments fiercely competitive Successfully growing
exports requires both financial capacity and management expertise ndash issues that BC tech
companies face regularly
Industry Insights on Exports and Market Access
014 KPMG LLP a Canadian limit ed liability par tnership and a member firm of the KPMG network of independent member
s affiliated with KPMG International Cooperative (ldquoKPMG Internationalrdquo) a Swiss entity All rights reserved
copy 2014 KPMG LLP a Canadian limit ed liability par tnership and a member firm of the KPMG network of independent member
firms affiliated with KPMG International Cooperative (ldquoKPMG Internationalrdquo) a Swiss entity All rights reserved
British Columbia Technology Report Card 2014 British Columbia Technology Report Card
Industry Profile and Comparative Analysis Industry Profile and Comparative An
8102019 BC Technology Report Card 2014 Edition
httpslidepdfcomreaderfullbc-technology-report-card-2014-edition 1827
art B Industry Input Indicatorshile the BC technology industry continues to perform well compared to other BC industries it continues
underperform relative to the technology industries in other provinces ndash although the gap is being
osed It is also generally behind the tech sectors of the countries in the Organization for Economic
o-operation and Development (OECD) particularly in the areas of t alent venture capital investment
d research and development (RampD) all of which are necessary growth drivers A closer assessment
BCrsquos technology industry inputs offers a glimpse into key areas of weakness and highlights areas
here appropriate targeted investment may serve to underwrite the sectorrsquos future performance
rt of the noted underperformance can be attributed to the capacity constraints of BC firms Populated
th small enterprises BC tech firms have a limited ability to raise capital investment invest in RampD
crease the available talent pool collaborate with post-secondary research institutes and build
ellectual property
C Technology Industry ndash 2014 Report Card
Talent Availability
Industr y Input Indicator s Ver sus O ther Provincial Tech Sectors 2014
Grade
Access to Capital
Research and Development
Intellectual Property
Cndash
bull Low talent availability ndash BC lags other provinces in granting engineering and sciences degrees
at both the undergraduate and graduate levels and is well below the OECD average in granting
technical doctoral degrees
bull Lack of venture capital investment ndash While BC has a relatively healthy level of angel
investment venture capital investment is largely lacking or insufficient
bull Lagging RampD investment ndash BC fares poorly compared to other provinces and OECD countries
on the level of RampD invested as a percentage of output Of particular concern is the declining
level of business expenditure on RampD which is already behind other jurisdictions
bull Fewer patents ndash BCrsquos level of patents granted lags other provinces and OECD countries on
both a per capita basis and as a percent of applications filed
Highlights
Talent Availability
Talent is a critical resource for the technology sector feeding the innovation and creativity that in turn
drive the global industry From information amp communications technology to engineering amp other
services to life sciences each sector relies on the availability of a skill-specific talent pool to meet
existing business demands and generate new growth ideas The technical skills required by the industry
are primarily developed at higher education institutions then nurtured within the industry The number of
degrees awarded in a province is therefore a useful measure of the technical talent available for firms
to draw on
While there has been an improvement in the granting of degrees in math and computer science in
BC relative to other provinces we continue to lag in the granting of degrees in other technical fields
BC fares particularly poorly in the architecture and engineering fields and underperforms the Canadian
average in life sciences Moreover BCrsquos performance has fallen relative to other OECD countries in the
granting of technical PhDs
Talent Availability
Undergraduate Degrees
Industry Input Indicators
Summary
Undergraduate Technology Degrees
Graduate Technology Degrees
Versus other Provincial Tech Sectors 2014
014 KPMG LLP a Canadian limit ed liability par tnership and a member firm of the KPMG network of independent member
s affiliated with KPMG International Cooperative (ldquoKPMG Internationalrdquo) a Swiss entity All rights reserved
copy 2014 KPMG LLP a Canadian limited liabi lity partnership and a member firm of the KPMG network of independent member
firms affiliated with KPMG International Cooperative (ldquoKPMG Internationalrdquo) a Swiss entity All rights reserved
British Columbia Technology Report Card 2014 British Columbia Technology Report Card
Industry Profile and Comparative Analysis Industry Profile and Comparative An
8102019 BC Technology Report Card 2014 Edition
httpslidepdfcomreaderfullbc-technology-report-card-2014-edition 1927
oing deeper
illed labour availability in BC as measured by the level of undergraduate degrees granted per capita
iled only Ontario in 2012 having grown steadily over the last three years13
Data for Queacutebec has been revised downwards significantly by BC Stats Undergraduate degrees per 100000 population was lower than the
evel in BC up to 2008 and remains that way till 2011
urce Profile of the British Columbia High Technology Sector BC Stats March 2014
0
0
0
0
0
0
0
20022001 2003 2004 2005 2006 2007 2008 2009 2010 2011
O ntar io Q ueacute be cBritish Columbia Alberta
ndergraduate Degrees per 100000 Population
nnual Undergraduate Degrees per 100000 Population 2011
owever in terms of the relevance of those degrees to the technology industry BC continues to
il other provinces on average For both undergraduate and graduate degrees BC is well behind the
nadian average and the degree rates of other provinces in the fields of architecture and engineering
e province is also behind the Canadian average in the granting of undergraduate and graduate degrees
the physical and life sciences disciplines Only in the fields of math computer science and information
ence has there been a positive trend since 2009 with BC now second only to Ontario in granting
th undergraduate and graduate degrees in these disciplines
Queacutebec Ont ario Alberta Brit ish ColumbiaCanada
0
0
0
0
0
0
0
0Undergraduate
Degrees ndash Architecture and
Engineering
Undergraduate
Degrees ndash Physical
and Life Sciences
Undergraduate
Degrees ndash Math Computer
and Information Science
BC produces thesecond highest
number ofundergraduateson a per capitabasis butcontinues to
trail Ontariosignificantly
Globally Canadarsquos rate of granting technology-related doctoral degrees per 1000 population in the
reference age cohort is well below the OECD average Since 2009 the level in Canada remained
the same at 12 percent while the OECD average improved slightly to 16 percent KPMG estimates
that BCrsquos rate of doctoral degrees of 06 percent also did not change since the last estimate in
2009 meaning a deficit of 60 percent versus other OECD jurisdictions More concerning yet is that
many of the countries that trailed Canada and British Columbia in 2000 had surpassed us by 2011
(eg Italy Iceland and Greece)
Source Profile of the British Columbia High Technology Sector BC Stats March 2014
Source KPMG Analysis and OECD Science Technology and Industry Scorecard 2013 OECD 2013
urce Profile of the British Columbia High Technology Sector BC Stats March 2014
Technology Related Doctoral Degrees as Percentage of Population in Reference Age Cohort
Annual Graduate Degrees per 100000 Population 2011
Queacutebec Ontario Alberta British ColumbiaCanada
300
250
200
150
100
50
00Graduate Degrees ndash
Architecture andEngineering
Graduate Degrees ndash Physicaland Life Sciences
Graduate Degrees ndash MathComputer and Information Science
014 KPMG LLP a Canadian limit ed liability par tnership and a member firm of the KPMG network of independent member
s affiliated with KPMG International Cooperative (ldquoKPMG Internationalrdquo) a Swiss entity All rights reserved
copy 2014 KPMG LLP a Canadian limit ed liability par tnership and a member firm of the KPMG network of independent member
firms affiliated with KPMG International Cooperative (ldquoKPMG Internationalrdquo) a Swiss entity All rights reserved
British Columbia Technology Report Card 2014 British Columbia Technology Report Card
Industry Profile and Comparative Analysis Industry Profile and Comparative An
8102019 BC Technology Report Card 2014 Edition
httpslidepdfcomreaderfullbc-technology-report-card-2014-edition 2027
Access to Capital
ccess to risk capital throughout the growth cycle is one of
e most significant determinants of tech sector success
has been empirically established that companies that
ceive risk capital have a significantly higher survival rate
perience stronger revenue employee wage and asset
owth and invest in higher levels of RampD 14
e BC technology industry has had a healthy growth in
gel investment which typically takes the form of seed
pital that helps in the emergence of start-ups However
rly stage venture capital investment ndash a necessary fuel
r growing start-ups into thriving companies ndash is deficient
BC and has been declining in recent years And of the
early stage venture capital that is invested there has
been a decline in the share invested by local funds which
deprives companies not only of adequate risk capital but
also of the guidance and networking opportunities that
are essential in early growth stages At the same time
BC companies attract a significant amount of foreign and
extra-provincial investment at the later stages of growth
Together these findings suggest that small technology firms
in BC are limited in their ability to access timely risk capital
that can propel their growth and firms that successfully
attract foreign venture capital may be at risk of relocating
outside BC
These findings can be explored in detail in the recent study by CVCA and Industry Canada titled ldquoThe Performance of Canadian Firms that
Received Venture Capital Financingrdquo published in June 2013
ccess to Capital
Access to Angel Investment
Summary
Access to Venture Capital
Are at Versus Other Provincial Tech Sectors 2014
Industry leaders almost universally agreed that access
to talent has become the most significant issue facing
their firms They cite a tightening of talent availability
over the past few years growing shortages in certain
key technical areas including software and web
development and a need to expand the available talent
pool in areas such as industrial technologies and sales
and marketing as critical issues
The challenges in talent availability have been exacerbated
by the arrival or impending arrival of several multinational
firms on the BC tech scene With a relatively constrained
talent pool the competition for available resources has
increased and with it compensation levels have risen
Several of the larger US-based multinationals are offering
compensation packages at significant premiums over the
average compensation levels in the BC market leading
to growing talent development attraction and retention
challenges for smaller BC companies In some cases this
has led to BC-based companies establishing or growing
their operations outside of BC where talent is less
expensive and more available
Leaders agreed that long-term industry success will
require an expanded talent pool developed by improving
the quantity and quality (job-readiness) of post-secondary
degree programs as well as by attracting talent from
outside of BC and Canada
The high cost of real estate was cited as a primary
barrier to attracting outside talent particularly where
mid- and senior-level management must be relocated
As a result companies are looking at alternative ways
of addressing relocation costs and at targeting talentmarkets where the cost differential or the expectation
of home ownership are less
Industry Insights on Talent Availability
In recent years the vast majority of venture capital invested in BC was in later stage financing Early
stage venture capital is significantly more limited and has been declining over the last few years
Capital by Stage of Investment
Venture Capital by Stage of Investment
Going deeper
BC has experienced steady growth in the level of angel investments in the province since the mid-2000s
Venture capital investment on the other hand has been more volatile
Source CVCA and BCTIA analysis of Thompson Reuters Data
Source CVCA and BCTIA analysis of Thompson Reuters Data
$0
$100
$200
$300
4
2003
$40
$110
2004
$31
$254
2005
$32
$226
2006
$54
$298
2007
$54
$316
2008
$64
$260
2009
$67
$141
2010
$72
$223
2011
$87
$233
2012
$97
$201
Ve ntur e C ap ital Ang el
$ m i l l i o n
$0
$100
$200
$300
$51
$172
$43
$190
$16
$185
2010 2011 2012
VC Later Stage VC Early Stage
$ m i l l i o n
014 KPMG LLP a Canadian limit ed liability par tnership and a member firm of the KPMG network of independent member
s affiliated with KPMG International Cooperative (ldquoKPMG Internationalrdquo) a Swiss entity All rights reserved
copy 2014 KPMG LLP a Canadian limit ed liability par tnership and a member firm of the KPMG network of independent member
firms affiliated with KPMG International Cooperative (ldquoKPMG Internationalrdquo) a Swiss entity All rights reserved
British Columbia Technology Report Card 2014 British Columbia Technology Report Card
Industry Profile and Comparative Analysis Industry Profile and Comparative An
8102019 BC Technology Report Card 2014 Edition
httpslidepdfcomreaderfullbc-technology-report-card-2014-edition 2127
verall BC placed second to last in the level of total venture capital invested among the 20 North
merican jurisdictions examined This is particularly concerning as the technology industry is inherently
obile and decisions regarding the location of operations can be significantly influenced by structural
ctors such as access to capital rather than the presence of local demand
e decline in locally sourced early stage capital is particularly concerning given its importance At the
me time a significant share of later stage investment originates from foreign sources which presents
potential risk that firms may subsequently relocate outside of BC
urce CVCA and BCTIA analysis of Thompson Reuters Data
urce KPMG Analysis of Thomson Reuters Data
$million
$33
$18
$11
$32
$0
$10
$20
$30
$40
2010 2011 2012
$3
$12
CanadianForeign
arly Stage VC Investment by Source
enture Capital Investments 2012
C a
l i f o r n
i a
M a s s e c
h u s e t t s
N e w
Y o r k
T e x a s
W a s
h i n g t o n
M a r y
l a n
d
U t a
h
O h i o
N e w
J e r s e y
O n t a r i o
V i r g i n i a
Q u e
b e c
B r i t i s
h C o
l u m
b i a
P e n n s y
l v a n
i a
I l l i n o
i s
A r i z o n a
C o
l o r a
d o
G e o r g
i a
M i n n e s o t a
M i c h i g a n
V C P e r
C a p
i t a -
$
$500
$450
$400
$350
$300
$250
$200
$150
$100
$50
$0
$6000
$5000
$4000
$3000
$2000
$1000
$0
VC per capita 2012Venture Capital 2012
Locallysourced earlystage VC
investmenthas beendeclining
Research and Development
RampD expenditure is the long-term investment in an industryrsquos future economic performance It measures
commitment to using innovation and knowledge creation to enhance productivity and improve competitiveness
Over the last few years there has been little increase in overall RampD investment in BC As such it
ranks below Ontario and Queacutebec However the composition of RampD spending has changed over time
with the share of business investment in RampD experiencing a steady decline The fact that the industry
is populated with small firms with fewer than 50 employees can help explain this trend BC is host to
very few large anchor companies that have the revenues and the capital to spend in significant ways
on research for the purposes of enhancing competitiveness
Research and Development
Summary
BERD as a Percentage of GDP
RampD as a Percentage of GDP
Versus other Provincial Tech Sectors 2014
The technology industry leaders interviewed recognized that there is a healthy local angel
network in BC However early stage venture capital financing in BC is seen as either absent
or modest making it difficult for small companies to grow There is a sense that attracting
venture capital from out-of-province is also challenging because physical proximity is an
important investment factor
Overall the opinion was that the limited presence of venture capital in BC leads to an absence
of investment competition which impacts competitive valuation and terms Industry leaders also
noted that local venture capital funds often take a revenue-based valuation approach Paradoxically
this may mean that a company can be valued higher by an angel investor prior to earning any
revenue than by an institutional investor once it starts generating revenue Since angel investors
typically expect high returns on initial investment this may make it difficult for small companies
to raise subsequent rounds of institutional financing often leaving them with prospects of
constrained growth due to limited capitalization or the option of selling early This lack of breadth
in the capital pool can lead to a vicious cycle of limited company growth and depressed valuations
of small companies seeking funding
Industry Insights on Risk Capital Investment
014 KPMG LLP a Canadian limit ed liability par tnership and a member firm of the KPMG network of independent member
s affiliated with KPMG International Cooperative (ldquoKPMG Internationalrdquo) a Swiss entity All rights reserved
copy 2014 KPMG LLP a Canadian limit ed liability par tnership and a member firm of the KPMG network of independent member
firms affiliated with KPMG International Cooperative (ldquoKPMG Internationalrdquo) a Swiss entity All rights reserved
British Columbia Technology Report Card 2014 British Columbia Technology Report Card
Industry Profile and Comparative Analysis Industry Profile and Comparative An
8102019 BC Technology Report Card 2014 Edition
httpslidepdfcomreaderfullbc-technology-report-card-2014-edition 2227
BC total RampD spending as a percent of GDP has remained relatively constant since 2008 Other
ovinces experienced a slight decline in this metric While BC remains higher than Alberta in this
gard it still makes up only 60 percent of the RampD expenditure levels in Ontario and Queacutebec
oing deeper
$3 billion there was no significant increase in the total RampD expenditure in BC since 2008 although
e composition of the spending changed The share of higher education and private non-profit
penditure continued to grow from 39 percent in 2008 to 43 percent in 2010 while that of business
terprise shrank by an equivalent amount to 53 percent in 2010
urce Profile of the British Columbia High Technology Sector BC Stats March 2014
urce Profile of the British Columbia High Technology Sector BC Stats March 2014
0
500
1000
1500
2000
2500
3000
3500
2000 2001 2002 2003 2004 2005 2006 2007 2008 2009 2010
Business Enterprise Higher Education amp Private Non-Profit
F ed er al Go vt P ro vin ci al Go ve rn me nt amp Re se ar ch In st it ut ion s
ampD Expenditures in British Columbia
ampD as a Percent of GDP
000
050
100
150
200
250
300
2007 2008 2009 2010
Ont ar io QueacutebecBritish Columbia Alberta
Overall RampDinvestment in
BC has beenconstant withan increase
in highereducation
spendingequal to thereductionin business
investmentin RampD
BCrsquos levelof RampD as apercentageof GDP has
been constantbut remains40 percent
lower thanOntario and
Queacutebec
Source KPMG Analysis of BC Stats Data and OECD Science Technology and Industry Scorecard 2013 OECD 2013
RampD Expenditure as a Percent of GDP
Since the last report card BC did not improve its global standing in RampD intensity as it continues
to perform 40 percent below the OECD average
I S R
K O R
F I N
J P N
S
W E
C H E
D N K
D E U
U S A
A U T
S V N
I S L
O E C D
E S T
F R A
C H N
B E L
O N
A U S
E
U 2 8
N L D
C Z E
G B R
L U X
C A N
I R L
N O R
P R T
B C
E S P
Z A F
I T A
H
U N
N Z L
R U S
M
E X
T U R
P O L
S V K
C H L
0
1
2
3
4
5
2011 2001
Q C
The BERD (business expenditures on RampD) ratio ndash which reflects the level of industry commitment
within the technology industry ndash has fallen for all provinces since 2008 BC still performs better than
Alberta with its businesses contributing 078 percent of GDP to RampD investment but remains well
below Queacutebec and Ontario which contribute 142 percent and 109 percent respectively
Source Profile of the British Columbia High Technology Sector BC Stats March 2014
Business Expenditure on RampD as a Percent of GDP
0
05
10
15
20
2007 2008 2009 2010
P e r c e n t o f G D P
CanadaOntario QueacutebecBritish Columbia Alberta
BusineRampD apercen
of GDPis 20 plower tCanad
BC fell below averageexpendpercent
014 KPMG LLP a Canadian limit ed liability par tnership and a member firm of the KPMG network of independent member
s affiliated with KPMG International Cooperative (ldquoKPMG Internationalrdquo) a Swiss entity All rights reserved
copy 2014 KPMG LLP a Canadian limit ed liability par tnership and a member firm of the KPMG network of independent member
firms affiliated with KPMG International Cooperative (ldquoKPMG Internationalrdquo) a Swiss entity All rights reserved
British Columbia Technology Report Card 2014 British Columbia Technology Report Card
Industry Profile and Comparative Analysis Industry Profile and Comparative An
8102019 BC Technology Report Card 2014 Edition
httpslidepdfcomreaderfullbc-technology-report-card-2014-edition 2327
0
0
0
0
0
0
0
0
0
I S R K O R F I N J
P N S W E C
H E D N K
D E U
U S A
A U T
S V N I S L
O E C D E
S T F R A
C H N B
E L A U S
E U 2 8 I R L C
Z E G B R
L U X
C A N N
L D N O R B C
H U N E
S P P R T I T A R
U S N Z L
Z A F
T U R
S V K
P O L
M E X
C H L
2011 2001
usiness Expenditure on RampD as a Percent of GDP
Crsquos BERD remained 50 percent below the OECD average and did not experience any change from the
01 level This means between 2001 and 2011 BC was surpassed by countries like China and Australia
their level of BERD investment as a p ercent of GDP
urce KPMG Analysis of BC Stats Data and OECD Science Technology and Industry Scorecard 2011 OECD 2011
BusinessRampD in BCis one-thirdthe level of
leading OECDcountries
Going deeper
Compared to other provinces with significant technology industries BC continues to trail in terms of both
the number of patents filed and the number of patents granted on both an absolute and per capita basis
Intellectual Property
Canadian Patents Filed and Granted
Source Canadian Patent Office
Intellectual Property
Intellectual property is a bellwether of the inventory of assets that can be commercialized to underwrite
future economic performance As measured by the number of patent applications submitted and
granted intellectual property reflects the success of RampD investment in the development of innovative
products provides an indication of the commercial viability of research and provides an indication of the
competitiveness of the technology industry as a whole Consistent with the findings of the 2012 report
card BC still ranks well below all other provinces with significant technology industries in the level of
patents awarded both on a per capita basis and as a percentage of applications filed
Patents Granted
Versus Other Provincial Tech Sectors 2014
Summary
0
500
1000
1500
2000
2500
Patents Filed ndash2011
Patents Filedndash2012
Patents Granted ndash2011
Patents Granted ndash2012
Ontario Queacutebec Alberta British Columbia
copy 2014 KPMG LLP a Canadian limit ed liability par tnership and a member firm of the KPMG network of independent member
firms affiliated with KPMG International Cooperative (ldquoKPMG Internationalrdquo) a Swiss entity All rights reserved
014 KPMG LLP a Canadian limited liabi lity partnership and a member firm of the KPMG network of independent member
s affiliated with KPMG International Cooperative (ldquoKPMG Internationalrdquo) a Swiss entity All rights reserved
British Columbia Technology Report Card 2014 British Columbia Technology Report Card
Industry Profile and Comparative Analysis Industry Profile and Comparative An
8102019 BC Technology Report Card 2014 Edition
httpslidepdfcomreaderfullbc-technology-report-card-2014-edition 2427
ore telling is the fact that BC has had the lowest level of patents awarded as a percent of applications
er the last decade
e prevalence of small firms in the BC technology sector has a direct impact on the capacity of
mpanies to successfully pursue patents Not only do they have limited capacity to invest in RampD to
velop patentable innovations but their capital constraints limit their ability to access the legal and
ministrative expertise needed to execute patent applications
atents Awarded per 100000 Population
atents Granted as a Percent of Patent Applications
urce Profile of the British Columbia High Technology Sector BC Stats March 2014
urce Profile of the British Columbia High Technology Sector BC Stats March 2014
00
00
00
00
00
00
00
00
00
2001 2002 2003 2004 2005 2006 2007 2008 2009 2010 2011
CanadaO ntar io Q ueacute be cBritish Columbia Alberta
2001 2002 2003 2004 2005 2006 2007 2008 2009 2010 2011
CanadaO ntar io Q ueacute be cBritish Columbia Alberta
BCrsquos patentperformancesignificantlytrails otherprovinces
Canada still ranks 18th well behind the worldrsquos leading countries in terms of the number of triadic
patent families per million population ndash a measure of patents taken at three major patent offices in
the world KPMGrsquos estimate for BC places it even further down the list than it was in 200815
Triadic Patent Families per Million Population 2010
Source KPMG Analysis of BC Stats Data and OECD Science Technology and Industry Scorecard 2013 OECD 2013
15 KPMG estimated BCrsquos ranking on the chart by considering the relative proportions of patents awarded in BC versus Canada as a whole on
a per capita basis
0
20
40
60
80
100
1
I D N
I N D
B R A
T U R
R U S
C H L
Z A F
C H N
P O L
S V K
G R C
C Z E
P R T
H U N
E S P
E S T
S V N
W L D
B C
I S L
N Z L
I T A
A U S
I R L
C A N
N O R
G B R
L U X
O E C D
B E L
F R A
K O R
I S R
U S A
A U T
N L D
D N K
F I N D E U
S W E
C H E
J P N
M E X
BCrsquos paperform
is one-the levleadingcountr
014 KPMG LLP a Canadian limit ed liability par tnership and a member firm of the KPMG network of independent member
s affiliated with KPMG International Cooperative (ldquoKPMG Internationalrdquo) a Swiss entity All rights reserved
copy 2014 KPMG LLP a Canadian limited liabi lity partnership and a member firm of the KPMG network of independent member
firms affiliated with KPMG International Cooperative (ldquoKPMG Internationalrdquo) a Swiss entity All rights reserved
British Columbia Technology Report Card 2014 British Columbia Technology Report Card
Industry Profile and Comparative Analysis Industry Profile and Comparative An
8102019 BC Technology Report Card 2014 Edition
httpslidepdfcomreaderfullbc-technology-report-card-2014-edition 2527
he technology industry not only generates GDP employment and income
ithin the technology sectors (referred to as direct impact) it also brings
dditional benefits to the overall BC economy by supporting suppliers to
e industry (indirect impact) and through the re-spending of labour income
arned in technology and supplier industries (induced impact)
ur economic impact analysis indicates that the overall impact of the technology industry on the BConomy is significantly magnified by the indirect and induced impacts We estimate that based on
rrent technology industry revenues of $23 billion the total contribution to the BC economy is
$23 ndash $26 billion in GDP
165000 ndash 188000 jobs created or sustained
$10 ndash $12 billion in total labour income
ese high levels of economic benefits are consistent with an industry that is high value-add employs
ghly skilled workers pays high wages and is well integrated in the economy 16
s noted earlier in the report while the technology industry has made a significant contribution to the
C economy our province still trails other Canadian provinces and US jurisdictions in this respect For
ample the BC technology ind ustry current ly comprises 76 percent of provincial GDP compared to
3 percent contribut ed by the US technology industry to US GDP So what would happen if the BC
chnology industry grew to comprise 103 percent of the provincial economy
ur analysis indicates that growing to 103 percent of the provincial economy would bring an additional
1B in BC technology industry revenues and an associated increase of $91B ndash 102B in total
DP 65K ndash 74K additional jobs created or sustained and a $41B ndash 46B increa se in labour
come These estimates include the combined benefits of the direct indirect and induced impacts
the economy
Economic ImpactAssessment
sti mating the technology industry economic impact is challenging due to the lack of standard technology industry classificati ons and
corresponding technology-specific impact multipliers To estimate the impact KPMG used weighted averages of standard industry sector impact
multipliers based on the definition of sectors comprising the tech industry We have chosen to represent the impacts as ranges using different
sectoral weights The use of ranges reflects the inherent variability in the technology industry caused by the diversity of sectors that it comprises
For example a dollar worth of output in the tech industry will have a different economic impact depending on whether it is generated by the
software publishing sector the telecommunication sector or the motion picture and post-production sector In our analysis of direct impacts we
have used figures reported by BC Stats To estimate the indirect and induced impacts we have used industry-standard multipliers developed by
Statistics Canada
Going deeper
Current BC Technology Industry Economic Impact
Given that the industry generated $23 billion in revenues we estimate that the industry contributed
$23 ndash $26 billion to total GDP created or sustained 165000 ndash 188000 jobs an d delivered $10 ndash $12 billion
to total labour income This impact breaks down in direct indirect and induced impact as follows
Current BC Tech Industry Impact
GDP
JOBS
LABOUR INCOME
$23 Bin Tech Industry
Revenues
Direct Impact Indirect Impact Induced Impact Total Impact
$15B
84K
$6B
$4B ndash 5B
43K ndash 52K
$4B ndash 6B
39K ndash 52K
$2B ndash 3B
$23B ndash 26B
165K ndash 188K
$10B ndash 12B$23B ndash 3B
BC Technology Industry Economic Impact Multipliers
In order to compare the technology industry to other industries as well as forecast the impact of
industry growth we have estimated the technology industry impact per dollar of revenue
We find that for each dollar of technology industry revenue the industry generates $1 ndash $112 in total
GDP and $045 ndash $05 in total labo ur income Further for each million dollars in te chnology industr y
revenue the industry generates or sustains seven to eight jobs in BC This impact breaks down in
direct indirect and induced impact as follows
Economic Impact Multiplier Estimates
GDP ($)
$1in Tech Revenues
For each
$1M in Tech Revenues
For each
Direct Impact Indirect Impact Induced Impact Total Impact
065 016 ndash 022 019 ndash 025 100 ndash 112
JOBS 362 186 ndash 228 168 ndash 226 716 ndash 817
LABOUR INCOME ($) 027 010 ndash 013 008 ndash 011 045 ndash 050
014 KPMG LLP a Canadian limit ed liability par tnership and a member firm of the KPMG network of independent member
s affiliated with KPMG International Cooperative (ldquoKPMG Internationalrdquo) a Swiss entity All rights reserved
copy 2014 KPMG LLP a Canadian limit ed liability par tnership and a member firm of the KPMG network of independent member
firms affiliated with KPMG International Cooperative (ldquoKPMG Internationalrdquo) a Swiss entity All rights reserved
British Columbia Technology Report Card
Economic Impact Assess
8102019 BC Technology Report Card 2014 Edition
httpslidepdfcomreaderfullbc-technology-report-card-2014-edition 2627
GDP
JOBS
LABOUR INCOME
$91 BTech Revenues
Additional
Direct Impact Indirect Impact Induced Impact Total Impact
$59B
33K
$25B
$15B ndash 2B
17K ndash 21K
$09B ndash 12B
$17B ndash 23B
15K ndash 21K
$07B ndash 10B
$91B ndash 102B
65K ndash 74K
$41B ndash 46B
Economic Impact of BC Technology Industry Growth
demonstrate the magnitude of potential economic benefit from growing the BC technology industry
e chose to estimate these benefits in the context of a specific growth figure As shown in the GDP
alysis section of this report BC trails significantly many US states as well as the US average in terms
the share of the technology industry to the economy as a whole We asked the question ndash what
ould be the economic impact if we caught up to the US average
e US technology industr y contributes 103 percen t to the overall US GDP as compared to 76 percent
ntributed by the BC technology industry to the BC economy To reach the current contribution level
the US the BC technology industr y will need to add an additional $6 B in GDP corresponding to an
ditional $9B in technology industry revenues (given current industry multipliers)
ur analysis indicates that growing to 103 percent of the provincial economy would bring an additional1B in BC technology indust ry revenues and an associ ated increase of $91B ndash 102B in total GDP
K ndash 74K additional jobs created or sustained and a $41B ndash 46B increase in labour income This
pact breaks down in direct indirect and induced impact as follows
conomic Impact of Growing the BC Technology Industry Contribution to Match the US
While this report card clearly demonstrates the tech
industryrsquos importance to BCrsquos economy itrsquos the possibilities
revealed that most command our attention And itrsquos in our
flaws that our future lies Despite the industryrsquos provincial
strength we trail our Canadian peers on a number of
metrics such as the availability of local venture capital
building field-specific talent pools and increasing firm size
But though these challenges are significant identifying
them ndash knowing what we have to do and where to apply our
resources investments and commitments ndash provides a clear
roadmap for improvement and sustainable success
Wersquore in a very good place The potential for BC tech to become
a major national and global player is right in front of us Indeed
a number of technology companies are already flourishing in
BC with significant operations owned or being built by
bull Canadarsquos largest defense company MDA
bull Canadarsquos largest cleantech company Westport
bull Worldrsquos largest machine-to-machine wireless company
Sierra Wireless
bull Canadarsquos largest social media management company
Hootsuite
bull The first commercial quantum computing company Dwave
bull And global leaders like Amazon Best Buy Boeing
Electronic Arts Microsoft IBM McKesson Sams
Schneider Electri c Sony Imageworks and SAP
As these and other companies have realized BC is o
the most vibrant start-up ecosystems anywhere in th
one that regularly translates great ideas creative tale
audacious vision into some of the hottest tech compaaround Itrsquos a dynamic environment teeming with bra
entrepreneurs who thrive on their peersrsquo global aspira
With this core of industry infrastructure top talent an
innovative thinking in place BC is well positioned to
the tech industryrsquos many emerging and evolving opp
Every powder keg however needs a fuse BC is a te
hot spot but we have to keep stoking the fires of in
ambition and talent to ensure the positive gains mad
2012 become major leaps the next time we take stoc
means we have to work together ndash emerging tech st
ups and major corporate players industry investors a
trend-setters policy makers and academic leaders al
we continue to improve in the key areas identified in
report we can keep building the momentum BC tech
to realize its provincial successes and gains on the n
and global scales
ConclusionTaking the next step together
AcknowledgementsKPMG would like to gratefully acknowledge the support of BC Stats in the development of this report
Our detailed statistical analysis would not have been possible without the rich collection of BC industry
data provided to us by BC Stats
014 KPMG LLP a Canadian limit ed liability par tnership and a member firm of the KPMG network of independent member
s affiliated with KPMG International Cooperative (ldquoKPMG Internationalrdquo) a Swiss entity All rights reserved
copy 2014 KPMG LLP a Canadian limit ed liability par tnership and a member firm of the KPMG network of independent member
firms affiliated with KPMG International Cooperative (ldquoKPMG Internationalrdquo) a Swiss entity All rights reserved
British Columbia Technology Report Card 2014 British Columbia Technology Report Card
Economic Impact Assessment Concl
8102019 BC Technology Report Card 2014 Edition
httpslidepdfcomreaderfullbc-technology-report-card-2014-edition 2727
KPMG in Canada provides Audit Tax and Advisory services We work closely with our clients
helping them to mitigate risks and grasp opportunities
KPMG in Canada is committed to our clients We have made considerable investments in regards to
personnel research and hard-won experience Through these investments we strive to be the best
in everything we do turning our experience and industry knowledge into real value for our clients
This is the KPMG Way
Contact us
For more information please contact your KPMG adviser or one of the following professionals
Anthony Lindsay
Partner Greater Vancouver Area Market Leader
Technology Media and Telecommunications
T 604-646-6379
E tdlindsaykpmgca
Slavi Diamandiev
Greater Vancouver Area
Economics Practice Leader
Management Consulting
T 604-673-4458
E sdiamandievkpmgca
Ed Zacharuk
Partner Greater Vancouver Area SRampED
Practice Leader
T 604-691-3201
E ezacharukkpmgca
Sukesh Kumar
Partner National Leader India Desk
T 604-527-3468
E skumarkpmgca
Walter Pela
Partner in Charge of Tax Services
Greater Vancouver Area
T 604-691-3193
E wpelakpmgca
Ian Wilshaw
Partner Greater Vancouver Area Market Leader
Private Equity
T 604-691-3557
E idwilshawkpmgca
The information contained herein is of a general nature and is not intended to address the circumstances of any particular individual or entity Although we endeavor to
provide accurate and timely information there can be no guarantee that such information is accurate as of the date it is received or that it will continue to be accurate in
the future No one should act on such information without appropriate professional advice after a thorough examination of the particular situation
kpmgcatmt

8102019 BC Technology Report Card 2014 Edition
httpslidepdfcomreaderfullbc-technology-report-card-2014-edition 727
art A Economic Performance Indicatorsnce the last report card the BC technology industry has outperformed other industry sectors in the
ovince particularly in terms of revenues and GDP growth There has also been significant growth in
ages relative to other industries While this overall growth has led to some sector gains it has yet
catch up with the performance of the technology industries in some of the other provinces3
onsistent with the 2012 report card the economic performance of the BC technology industry was reviewed on the basis of five key
conomic performance indicators GDP revenues employment wage levels and exports of goods and services
Gross Domestic Product
The technology industry is respons ible for 76 percent of the BC economy and contributes $155 billion
to the provincial GDP However despite gains in terms of GDP per cap ita BC continues to tr ail the
performance of other provinces and states
onomic Performance Indicators
Grade
Gross Domestic Product
Versus Other
BC Industry Sectors 2014
Versus Other Provincial
Tech Sectors 2014
Industry Revenues
Employment
Wages
Exports Data Unavailable
A C+
Versus Other BC
Industry Sectors
Versus Other Provincial
Tech Sectors
Summary
Industry GDP
Industry GDP Growth
C Technology Industry ndash 2014 Report Card
Comparison of GDP
Versus other BC industry sectors
bull Strong economic contribution ndash Contributes more to the economy than resource-based
sectors with one of the highest GDP generated of all industries in BC ($155B in 2012)
bull Strong growth ndash Grew by double the rate of the BC economy having the second highest
GDP growth among all industries in BC
bull Large labour force ndash Employs 84000 people more than the forestry mining and oil and
gas sectors combined
bull High paying jobs ndash Wages are 66 percent higher than the BC industrial averageVersus other provincial tech sectors
bull Lagging economic contribution ndash Per capita GDP continues to be lower than provinces
with significant technology sectors however BC has been catching up in recent years
bull Lagging employment ndash Per capita employment is lower than provinces with significant
technology sectors
Highlights
014 KPMG LLP a Canadian limit ed liability par tnership and a member firm of the KPMG network of independent member
s affiliated with KPMG International Cooperative (ldquoKPMG Internationalrdquo) a Swiss entity All rights reserved
copy 2014 KPMG LLP a Canadian limit ed liability par tnership and a member firm of the KPMG network of independent member
firms affiliated with KPMG International Cooperative (ldquoKPMG Internationalrdquo) a Swiss entity All rights reserved
British Columbia Technology Report Card 2014 British Columbia Technology Report Card
Industry Profile and Comparative Analysis Industry Profile and Comparative An
8102019 BC Technology Report Card 2014 Edition
httpslidepdfcomreaderfullbc-technology-report-card-2014-edition 827
oing deeperonsistent with the findings of the 2012 report card BC tech continues to be one of the top three
ntributors to the provincial economy outperforming traditional sectors such as forestry mining oil
d gas and transportation in GDP contribution4
oll ar figures are not directly comp arable to the 2012 report card due to a difference in the base year (ldquochainedrdquo dollar calcula tion) used by BC
tats Also GDP figures are not additive since the technology industry GDP figure is derived by BC Stats and is not mutually exclusive with
he GDP figures of other industries
urce Profile of the British Columbia High Technology Sector BC Stats March 2014
Source Profile of the British Columbia High Technology Sector BC Stats March 2014
Source Profile of the British Columbia High Technology Sector BC Stats March 2014
DP Contribution 2012 (chained 2007 dollars) and Change since 2009
Index of GDP Contribution (2007 = 100)
Growth Rate of GDP Contribution 2007 ndash 2012
Go od s p ro du ci ng S er vic es p ro du cin gTechnology
Forestry
Utilities
Wholesale Trade
Mining Oil amp Gas Extraction
of Scientific and Technology
ransportation amp Warehousing
Retail Trade
Technology
Construction
Other Manufacturing
Finance Ins Real Estate
+38
+07
+09
+14
+05
+11
+08
+09
+12
+11
+09
$ million$1651
$3927
$7844
$10186
$10302
$10844
$11414
$13758
$14040
$15524
$44310
BCrsquos tehas groby 12 p
since 2while tBC GDby 6 pe
Havingby 12 psince 2BCrsquos teindust
experiethe sechighesgrowthof all B
indust
90
95
100
105
110
2007 2008 2009 2010 2011 2012
I n d e x
( 2 0 0 7
= 1
0 0 )
BC Technology BC Industr ial Aggregate
Moreover technology has grown at double the rate of the overall BC economy over the last five years
having the second highest rate of GDP growth of all BC industries
ndash20 ndash15 ndash10 ndash5 0 5 10 15
Forestry
Other Manufacturing
Wholesale Trade
Utilities
Prof Scientific and Tech
Retail Trade
Mining Oil amp Gas Extraction
Transportation amp Warehousing
Finance Ins Real Estate
Technology
Construction
T ec hn ol og y Go od s pr od uc in g S er vi ce s pr od uc in g
BClsquos techindustrymaintainsits position
among the topcontributors tothe provincialeconomy
014 KPMG LLP a Canadian limit ed liability par tnership and a member firm of the KPMG network of independent member
s affiliated with KPMG International Cooperative (ldquoKPMG Internationalrdquo) a Swiss entity All rights reserved
copy 2014 KPMG LLP a Canadian limit ed liability par tnership and a member firm of the KPMG network of independent member
firms affiliated with KPMG International Cooperative (ldquoKPMG Internationalrdquo) a Swiss entity All rights reserved
British Columbia Technology Report Card 2014 British Columbia Technology Report Card
Industry Profile and Comparative Analysis Industry Profile and Comparative An
8102019 BC Technology Report Card 2014 Edition
httpslidepdfcomreaderfullbc-technology-report-card-2014-edition 927
addition to its direct contributions to the BC economy the tech industry has indirect impacts
eated by industry suppliers and induced impacts from the spending of the labour income generated
technology and supplier industries In total these represent the total economic impacts of the
dustry and this number proves to be significant Our analysis finds that per dollar of revenues the
chnology industry in BC has a higher total GDP impact than BCrsquos primary resource industries
well as the construction industry High GDP per dollar of revenue is indicative of high value added
ring the production process (as measured by a relatively high value of the final productservice net
the intermediary inputs in production) From an income perspective high GDP per dollar of revenue
associated with high levels of labour income and company profits generated by the industry (net of
preciation interest taxes and subsidies)
r every $1 of Revenues $GDP
nduced GDP Impact
08 085 09 095 10
01 02 03 04 05
Total GDP Impact
ldquoForestryrdquo includes Forestry and Logging
ldquoMining Oil amp Gasrdquo includes Mining Quarrying and Oil amp Gas Extraction
ldquoConstructionrdquo includes Residential Construction
ldquoTechnologyrdquo includes the Technology Industry as defined by BC Stats
01 02 03 04 05
ndirect GDP Impact
03 04 05 06 07
Direct GDP Impact
omparison of GDP Impacts Across BC Industries
Tech GDP Contribution and Share of Services and Manufacturing Sectors 2012
urce KPMG Analysis of Statistics Canadarsquos Inter-provincial Input-Output Multipliers
te For a more detailed description and analysis of the economic impacts of the BC technology industry on the overall economy please refer
he Economic Impact Analysis section of this report card
The technology industry in BC is comparable to that in Alberta in both absolute size and composition
in both provinces nearly 90 percent of the industryrsquos value-added output is generated by its services
sector In contrast the technology industries in Ontario and Queacutebec are much larger in absolute size and
manufacturing plays a greater industry role
m i l l i o n
( c h a i n e d 2 0 0 7 )
Services Manufacturing
British Columbia Alberta Ontario Queacutebec
68
78
9489
$50000
$40000
$30000
$20000
$10000
$0
Source Profile of the British Columbia High Technology Sector BC Stats March 2014
The maof BC toutputgenera
the sersector
014 KPMG LLP a Canadian limit ed liability par tnership and a member firm of the KPMG network of independent member
s affiliated with KPMG International Cooperative (ldquoKPMG Internationalrdquo) a Swiss entity All rights reserved
copy 2014 KPMG LLP a Canadian limited liabi lity partnership and a member firm of the KPMG network of independent member
firms affiliated with KPMG International Cooperative (ldquoKPMG Internationalrdquo) a Swiss entity All rights reserved
British Columbia Technology Report Card 2014 British Columbia Technology Report Card
Industry Profile and Comparative Analysis Industry Profile and Comparative An
8102019 BC Technology Report Card 2014 Edition
httpslidepdfcomreaderfullbc-technology-report-card-2014-edition 1027
hen the population size of each province is taken into account enabling a more reasonable performance
mparison we find that BCrsquos technology industry has historically generated the lowest GDP on a per
pita basis However over the last five years BCrsquos technology sector has had the highest compound
nual growth rate among all the provinces significantly reducing the GDP per capita gap
ech GDP Per Capita (chained 2007) Technology GDP as a Percent of Total GDP
dex of Technology Industry GDP (2007 = 100)
$4100
$3900
$3700
$3500
$3300
$3100
$2900
$2700
2007 2008 2009 2010 2011 2012
Br it ish Columbia Alber ta Ont ario Queacutebec Canada
urce KPMG analysis of data from the Profile of the British Columbia High Technology Sector BC Stats March 2014 and Statistics Canadarsquos
NSIM Table 051-0001
urce Profile of the British Columbia High Technology Sector BC Stats March 2014
Source KPMG analysis of data from the Profile of the British Columbia High Technology Sector BC Stats March 2014 and World Bank
National Accounts
2007 2008 2009 2010 2011 2012
Br it ish Columbia Alber ta Ont ario Queacutebec Canada
115
110
105
100
95
90
85
80
In fact at 24 percent BCrsquos technology industry GDP is growing faster than the Canadian and US averages
and BCrsquos technology sector now accounts for the same proportion of the overall provincial GDP as does
the technology industry for Canada as a whole56 That said BCrsquos technology industry is still 30 percent
behind that of the US in terms of its contribution to tot al GDP highlighting a significant upsi de potential
120
100
80
60
40
20
00
76
69
(2009)
77 103 24 11 21
Tech GDP as a of Total in 2012 CAGR in Tech GDP (2007ndash2012)
Br it ish C olu mbia C anada Un it ed S tat es
5 This analysis uses nominal values to calculate Compound Annual Growth Rate (CAGR) for the USrsquos Tech GDP (deflated numbers are
unavailable) The gap between the growth rates of BC and US technology industries will be even larger if the US GDP is adjusted for inflation
6 The data for BC tech GDP from the 2012 report card has been revised In 2009 BC tech GDP as a share of its economy was 69 percent and
not 59 percent as previously reported
BCrsquos techindustry
trails otherprovinces inper-capita GDPcontributionbut is closing
the gap
While
techrsquos a perceof totais at p
Canad30 percbehindUS itscontrib
growinthan b
BC tech hasthe highestannual growth
rate among allthe provinces
014 KPMG LLP a Canadian limit ed liability par tnership and a member firm of the KPMG network of independent member
s affiliated with KPMG International Cooperative (ldquoKPMG Internationalrdquo) a Swiss entity All rights reserved
copy 2014 KPMG LLP a Canadian limited liabi lity partnership and a member firm of the KPMG network of independent member
firms affiliated with KPMG International Cooperative (ldquoKPMG Internationalrdquo) a Swiss entity All rights reserved
British Columbia Technology Report Card 2014 British Columbia Technology Report Card
Industry Profile and Comparative Analysis Industry Profile and Comparative An
8102019 BC Technology Report Card 2014 Edition
httpslidepdfcomreaderfullbc-technology-report-card-2014-edition 1127
Going deeper
BCrsquos technology industry revenues have rebounded since the 2008 recession showing a higher
compound annual rate since 2009 (67 percent) than it did prior to 2009 (55 percent)78
hile BC has made progress since 2012 in terms of the size of the technology industry relative to the
erall economy there remains a significant opportunity for growth as evidenced by comparison to both
dividual US states as well as the US average
GDP originating in the technology sector 2011Comparison of Industry Revenues
BC Technology Revenues
0 5 10 15 20 25
Oregon
Washington
Colorado
California
assachusetts
New Mexico
Maryland
Indiana
w Hampshire
Virginia
Idaho
New Jersey
orth Carolina
US
Connecticut
Utah
Kansas
Vermont
Georgia
Arizona
Missouri
Texas
Minnesota
Pennsylvania
Canada
ish Columbia
urce Profile of the British Columbia High Technology Sector BC Stats
Source Profile of the British Columbia High Technology Sector BC Stats March 2014
Industry Revenues
The technology industry generates a significant revenue base in BC that has grown substantially over
the last few years However on a per capita basis technology continues to trail other provinces
Versus Other BC Industry
Sectors 2014
Versus Other Provincial
Tech Sectors 2014
Summary
Industry Revenues NA
Industry Revenue Growth
7 Revenue figures are not adjusted for inflation For inflation-adjusted output values please refer to the GDP section of this analysis
8 Industry revenue figures for BC were generated using revenue data by establishments That is for firms headquartered in BC
only the revenues generated from their BC operations are included in the revenue calculations
2 0 0
2
2 0 0 3
2 0 0 4
2 0 0 5
2 0 0 6
2007 2 0 0 8
2 0 0 9
2 0 1 0
2 0 1 1
2 0 1
2
130
141
152
169
179
200201
191
192
224
232
Industrevenuhave g
at 67 pon an abasis s
014 KPMG LLP a Canadian limit ed liability par tnership and a member firm of the KPMG network of independent member
s affiliated with KPMG International Cooperative (ldquoKPMG Internationalrdquo) a Swiss entity All rights reserved
copy 2014 KPMG LLP a Canadian limit ed liability par tnership and a member firm of the KPMG network of independent member
firms affiliated with KPMG International Cooperative (ldquoKPMG Internationalrdquo) a Swiss entity All rights reserved
British Columbia Technology Report Card 2014 British Columbia Technology Report Card
Industry Profile and Comparative Analysis Industry Profile and Comparative An
8102019 BC Technology Report Card 2014 Edition
httpslidepdfcomreaderfullbc-technology-report-card-2014-edition 1227
owever BCrsquos technology industry revenues continue to account for a lower share of overall Canadian
chnology industry revenue as compared to BCrsquos share of the Canadian population While the gap has
ghtly narrowed compared to our 2012 findings BC remains the only province among Queacutebec Ontario and
berta to show such a trend
oreover the sectorrsquos revenue growth rate continues to outperform the Canadian average although BC
s been surpassed by Alberta in this regard
200
180
160
140
120
100
80
2002 2003 2004 2005 2006 2007 2008 2009 2010 2011 2012
Bri tish Columbi a Al berta Ont ari o Queacutebec Canada
dex of Technology Industry Revenue (2002 = 100)
opulation and Technology Revenues as a Percent of Canadian Totals 2012
urce Profile of the British Columbia High Technology Sector BC Stats March 2014
urce KPMG analysis of data from the Profile of the British Columbia High Technology Sector BC Stats March 2014 and Statistics Canada
NSIM Table 051-0001
British ColumbiaAlbertaOntarioQueacutebec
0
0
0
0
0
Population 2012Technology Revenues 2012
BC techrevenuegrowth
continues tooutperformthe Canadianaverage
BC tech
continues totrail otherprovinces inper capita
revenueThis gap hasnarrowedslightly since
the 2012report card
Industry leaders interviewed by KPMG observed that a number of external factors have helped to
augment the growth of BCrsquos tech industry
bull Government programs such as the National Research Councilrsquos Industrial Research Assistance
Program (IRAP) the Scientific Research and Experimental Development (SRampED) program
and the Small Business Venture Capital program are significant industry drivers as they incent
investment in innovative technologies and create a healthy start-up climate Other agencies
such as the BC Bioener gy Network BC In novation Council BC Trade amp Investment NRC-IRAP
the Natural Sciences and Engineering Research Council (NSERC) Export Development Canada
Sustainable Development Technology Canada (SDTC) Western Economic Diversification (WED)
and the Department of Foreign Affairs and Trade Development (DFATD) provide funding support
and program resources to assist local start-ups
bull BC is a more cost effective place to do business The corporate income tax regime andsecurity and privacy regulations create a favourable investment environment and are attractive
to companies looking to set up operations
bull The close proximity of BC tech to US markets such as Seattle and Silicon Valley is seen as
an advantage and a major growth driver
bull In certain technology sectors (eg financial and business software mobilewireless
technologies and web-based and gaming technologies) growth has been supported by rich
talent pools available at a lower cost relative to US clusters such as Silicon Valley BC tech
companies have also demonstrated stronger employee retention rates when compared to
other jurisdictions in the US and globally
bull Last but not least there is a perception within the industry that the technology sector in BC is
a tightly knit cohesive community which helps attract creative people to grow their businesses
in this province
Industry insights on output growth
014 KPMG LLP a Canadian limit ed liability par tnership and a member firm of the KPMG network of independent member
s affiliated with KPMG International Cooperative (ldquoKPMG Internationalrdquo) a Swiss entity All rights reserved
copy 2014 KPMG LLP a Canadian limited liabi lity partnership and a member firm of the KPMG network of independent member
firms affiliated with KPMG International Cooperative (ldquoKPMG Internationalrdquo) a Swiss entity All rights reserved
British Columbia Technology Report Card 2014 British Columbia Technology Report Card
Industry Profile and Comparative Analysis Industry Profile and Comparative An
8102019 BC Technology Report Card 2014 Edition
httpslidepdfcomreaderfullbc-technology-report-card-2014-edition 1327
omparison of Employment
omparison of Wages
Employment and Wages
e number of jobs sustained by BCrsquos technology industry has grown significantly over the last
cade However this growth has slowed in recent years placing BC behind other provinces in terms
technology jobs per capita This slowdown in employment growth may be the result of gains in
oductivity where higher value is being created by each job in the province or it may be because a
eater proportion of out-of-province employees are being employed by BC companies
e real wage in BC has grown significantly Although this is potentially consistent with growth in
oductivity there are likely other important contributing factors such as the high cost of living in BC
age inflation caused by the arrival of new multinationals and the significant competition for certain
pes of talent In any case BC technology offers high paying jobs ndash not only relative to other BC
dustries but also to the Canadian average for technology
Industry Employment
Industry Employment Growth
Summary
Versus Other BC Industry
Sectors 2014
Versus Other Provincial
Tech Sectors 2014
Industry Wages
Versus Other BC Industry
Sectors 2014
Versus Other Provincial
Tech Sectors 2014
Summary
Employment in 2009 and 2012
Going deeper
Employment
Employing 84000 people in 2012 the BC technology industry continued to outperform resource-based
industries such as forestry mining and oil and gas
Source Profile of the British Columbia High Technology Sector BC Stats March 2014
$
Retail amp Wholesale Trade 344
341
184
187
114
122
111
117
97
103
84
84
80
78
67
75
2009 2012
Accomodation amp Food Services
Construction
Finance Insurance amp Real Estate
Transportation amp Warehousing
Technology
Manufacturing
Forestry Mining OilGas amp Utilities
In 2012tech emmore p
than thforestrymining
and gaand ut
industcombi
copy 2014 KPMG LLP a Canadian limited liabi lity partnership and a member firm of the KPMG network of independent member
firms affiliated with KPMG International Cooperative (ldquoKPMG Internationalrdquo) a Swiss entity All rights reserved
014 KPMG LLP a Canadian limited liabi lity partnership and a member firm of the KPMG network of independent member
s affiliated with KPMG International Cooperative (ldquoKPMG Internationalrdquo) a Swiss entity All rights reserved
British Columbia Technology Report Card 2014 British Columbia Technology Report Card
Industry Profile and Comparative Analysis Industry Profile and Comparative An
8102019 BC Technology Report Card 2014 Edition
httpslidepdfcomreaderfullbc-technology-report-card-2014-edition 1427
owever while the technology sector experienced the third highest growth in employment among all
e industries in BC between 1999 and 2012 employment has been flat since 2009 9
or reference the min ing oil amp gas and extraction industr y which experienced the highest growth in employment between 1999 and 2012 started
t one-sixth the employment level of the technology industry in the base year 1999 and remains significantly lower in 2012 at 22000 employees
101
68
38
35
ndash44
ndash14
6
16
22
32
1101009080706050403020100ndash10ndash20ndash30ndash40ndash50
Mining Oil and Gas Extraction
Construction
Technology
ccomodation amp Food Services
Retail amp Wholesale Trade
Transportation amp Warehousing
ance Insurance amp Real Estate
Utilities
Manufacturing
Forestry
mployment Growth between 1999 and 2012
urce Profile of the British Columbia High Technology Sector BC Stats March 2014
The tech
sector hasexperiencedthe thirdhighestgrowth in
employmentin the provincesince 1999However
growth hasbeen minimalsince 2009
Some companies suggested that employment had in fact grown in more recent years and that
the demand for talent is as high as ever assertions which would not be reflected in data ending at
2012 It was also suggested that companies have been employing personnel outside the province
due in the part to limited talent availability in certain areas ndash another factor which is not captured by
the analysis On the other hand leaders from larger BC technology companies supported the view
that employment growth has slowed driven by productivity gains and a focus on better utilizing
existing employees
Deeper analysis of the employment data suggests variation in the employment trend by industry sector
and firm size For example between 2009 and 2012 there was a notable decline in employment in
BCrsquos ldquomotion picture and post-productionrdquo sector This was compensated for however by healthy
employment growth in other t ech sectors such as ldquoengineering and other servicesrdquo
Industry leaders have also predicted industry growth since 2013 again an assertion which our
data would not reflect
Industry Insights on Employment Trends
Technology Jobs per 100000 Population
Canada Tech Industry GDP per Person Employed
Source Profile of the British Columbia High Technology Sector BC Stats March 2014
Source KPMG analysis of data from Profile of the British Columbia High Technology Sector BC Stats March 2014
On a per capita basis BCrsquos technology sector employment has remained stable since 2009 at
approximately 18 percent below the Canadian average
The improvement in GDP concurrent with flat employment numbers implies that BC is the only province
where technology labour productivity has potentially improved over the last five years
3000
2500
2000
1500
1000
2002 2003 2004 2005 2006 2007 2008 2009 2010 2011 2012
CanadaOnt ar io QueacutebecBritish Columbia Alberta
$180000
$170000
$160000
$150000
$140000
$130000
$120000
$110000
$100000
2007 2008 2009 2010 2011 2012
CanadaO ntar io Q ueacute be cBritish Columbia Alberta
BC tecemplo
per capbeen ssince 2
014 KPMG LLP a Canadian limit ed liability par tnership and a member firm of the KPMG network of independent member
s affiliated with KPMG International Cooperative (ldquoKPMG Internationalrdquo) a Swiss entity All rights reserved
copy 2014 KPMG LLP a Canadian limit ed liability par tnership and a member firm of the KPMG network of independent member
firms affiliated with KPMG International Cooperative (ldquoKPMG Internationalrdquo) a Swiss entity All rights reserved
British Columbia Technology Report Card 2014 British Columbia Technology Report Card
Industry Profile and Comparative Analysis Industry Profile and Comparative An
8102019 BC Technology Report Card 2014 Edition
httpslidepdfcomreaderfullbc-technology-report-card-2014-edition 1527
dustry Wages
nce the 2012 report card BCrsquos technology industry has seen rapid wage growth relative to the average
age in all other provincial industries In 2012 the average tech wage was 66 percent higher than the
erage for the economy as a whole compared with 58 percent in 2009
ationally the real weekly wage in BCrsquos technology industry has grown by twice as much as the Canadian
erage Moreover in 2012 BCrsquos technology industry wage was higher than the Canadian average and
mparable to the level in Ontario However BC continues to trail Alberta in this regard where technology
bs pay 20 percent higher and are comparable to US levels This is consistent with the overall trend in
ages in Alberta which are typically higher than BCrsquos across most industries
verage Earnings minus BC Technology versus BC
eal Weekly Wages (in 2012 prices)
0000
0000
0000
0000
0000
0000
0000
0000
2002 2003 2004 2005 2006 2007 2008 2009 2010 2011 2012
BC TechnologyBC All Industries
$0
urce KPMG analysis of data from Profile of the British Columbia High Technology Sector BC Stats March 2014
urce KPMG analysis of data from Profile of the British Columbia High Technology Sector BC Stats March 2014 and Statistics Canada
NSIM Table 326-0021
600
200
800
400
000
2002 2003 2004 2005 2006 2007 2008 2009 2010 2011 2012
CanadaQueacutebecOntarioAlbertaBritish Columbia US
BC tech jobsearn 66 percentmore than theBC average
salary
BC has higherpaying tech jobs than
the Canadianindustry asa whole
Exports
BC tech industry exports have experienced growth since the 2012 report card however there is room
for significant improvement when it comes to accessing new markets Globally the technology industrytends to be highly mobile since enterprises need not have operations in close proximity to their product
and service markets international trade becomes very important BC tech has the potential to make
significant progress on the global front since its current export performance is poor relative to the
Canadian industry as a whole and it has not experienced any significant growth over the last decade10
10 The data and a nalysis presented in this section is based on the best available data to date However service exports data may be an
underestimate of the true level of service exports As noted by BC Stats data for service exports is challenging to measure since it cannot
be tracked through customs databases Instead it is estimated using surveys and other information available to BC Stats (Profile of the
British Columbia High Technology Sector 2013)
Comparison of Exports
Industry Exports
Summary
Industry Exports Growth
Versus Other BC Industry Sectors 2014
While in theory the rise of the real wage reflects rising productivity there are likely other factors
at play in BCrsquos tech industry Some industry leaders interviewed by KPMG suggested that the
rising cost of living in BC is putting significant upward pressure on compensation Others pointed
to market distortions in specific types of jobs such as software development caused by the entry
of multinational firms that are willing to pay above-market rates to attract talent
Industry Insights on Wage Trends
014 KPMG LLP a Canadian limit ed liability par tnership and a member firm of the KPMG network of independent member
s affiliated with KPMG International Cooperative (ldquoKPMG Internationalrdquo) a Swiss entity All rights reserved
copy 2014 KPMG LLP a Canadian limit ed liability par tnership and a member firm of the KPMG network of independent member
firms affiliated with KPMG International Cooperative (ldquoKPMG Internationalrdquo) a Swiss entity All rights reserved
British Columbia Technology Report Card 2014 British Columbia Technology Report Card
Industry Profile and Comparative Analysis Industry Profile and Comparative An
8102019 BC Technology Report Card 2014 Edition
httpslidepdfcomreaderfullbc-technology-report-card-2014-edition 1627
oing deeper
2012 the BC technology industry exported $3 billion in goods and services with services accounting
r two-thirds of this amount ndash a ratio that has remained fairly constant over time11 Over the last
cade technology exports have grown very slowly and this growth has been notably poor in the
ars since the recession Between 2009 and 2012 while total exports from BC grew by 20 percent
C technology exports grew by only 5 percent
Data for BCrsquos technology services exports have been revised significantly downwards by BC Stats for the years since 2006 Therefore the
updated analysis of exports may not be consistent with the findings of the 2012 report card
500
000
500
000500
000
$500
$02 00 2 2 00 3
Goods Services
2004 2005 2006 2007 2008 2009 2010 2011 2012
C Technology Exports
urce Profile of the British Columbia High Technology Sector BC Stats July 2011
Exports of BC
tech goodsand serviceshave been
relativelystable
The technology industry comprises 65 percent of BCrsquos total exports ndash a figure relatively proportional
to its share of the provinci al GDP Of the total goods and ser vices exported the te ch industryrsquos share
of services is much higher than that of goods although its share has declined by 35 percent compared
to 2012 findings12
12 Based on the revised services export data published by BC Stats it is found that BC technologyrsquos share of total service exports in 2009 was
lower than the figure reported in the 2012 report card (it was 20 percent instead of 32 percent)
70
60
50
40
30
20
10
0
2001 2002 2003 2004 2005 2006 2007 2008 2009
B ri ti sh C ol um bi a C an ad a
Tech Exports (as a of Tech GDP)
Technol ogy O ther I ndustr ies
BC ExportShare
65
935
BC GDPShare
76
924
BC Goods Export Share
BC Services Export Share
13
3
87
97
$16 billion
$31 billion
Source Profile of the British Columbia High Technology Sector BC Stats March 2014
Source Profile of the British Columbia High Technology Sector BC Stats March 2014
However as a percentage of its output BC tech exports a smaller share than the Canadian tech
industry as a whole which implies that our export intensity is lower than that of tech industries in
other provinces
BC tecof provexport
proporto its sthe proeconom
BC tecexport28 perc
its totain 2009compa40 percoutput
exportethe Ca
technoindustr
copy 2014 KPMG LLP a Canadian limit ed liability par tnership and a member firm of the KPMG network of independent member
firms affiliated with KPMG International Cooperative (ldquoKPMG Internationalrdquo) a Swiss entity All rights reserved
014 KPMG LLP a Canadian limited liabi lity partnership and a member firm of the KPMG network of independent member
s affiliated with KPMG International Cooperative (ldquoKPMG Internationalrdquo) a Swiss entity All rights reserved
British Columbia Technology Report Card 2014 British Columbia Technology Report Card
Industry Profile and Comparative Analysis Industry Profile and Comparative An
8102019 BC Technology Report Card 2014 Edition
httpslidepdfcomreaderfullbc-technology-report-card-2014-edition 1727
om a trade balance perspective BC continues to be a significant net importer of technology goods
th the majority originating in the Pacific Rim The magnitude of these imports indicates there is local
mand for certain types of technology goods not being met by local supply
hile detailed trade data for technology services is lacking for BC a closer examination of technology
ods data reveals further insights
terms of exports while the US continues to be the largest consumer of BC technology goods there
s been a significant trend in market diversification towards the Pacific Rim and other countries over
e past decade
C Tech Goods Exports and Imports
urce Profile of the British Columbia High Technology Sector BC Stats March 2014
urce Profile of the British Columbia High Technology Sector BC Stats March 2014
Goods Exports Goods Imports
2002 2003 2004 2005 2006 2007 2008 2009 2010 2011 2012
$5000
$4000
$3000
$2000
$1000
$0
The share oftechnology
goods exportsfrom BC to theUS has beendeclining
BC imports$5 billionworth of
technologygoods whilegeneratingonly $1 billionin exports
Economic Performance Indicators ndash Summary
Current economic performance indicators largely confirm the findings of the 2012 report card
BC technology performs strongly compared to other provincial industries but continues to trail the
technology industries in other provinces To gain more perspective around the ldquowhyrdquo of these results
the following section analyzes inputs to the BC tech industry and highlights the root drivers of its
economic performance
Export readiness and the ability to successfully access new markets are closely correlated to firm
capacities Smaller companies often lack the resources capital and expertise necessary to readily
exploit new markets
The underperformance in BC tech exports relative to other provinces is likely related to the
overweighting of small and very small technology companies in BC Industry leaders observed
that smaller companies often require access to local early-adopter customers as a proving ground
before expanding to new markets As such both corporations and government agencies can play
an important role by helping improve product designmarketing processes and serving as a critical
reference customer
Despite this many BC tech companies find their productsservices are better received in foreign
markets than at home Even among leading companies very few indicate they have much or any
business with BC-based customers
Unlike the US there is as yet no funding set aside by provincial or federal governments to procure
locally from small businesses In fact in some cases the government procurement process has
minimum requirements that are beyond the capabilities of smaller companies
The tech industry is global and in many segments fiercely competitive Successfully growing
exports requires both financial capacity and management expertise ndash issues that BC tech
companies face regularly
Industry Insights on Exports and Market Access
014 KPMG LLP a Canadian limit ed liability par tnership and a member firm of the KPMG network of independent member
s affiliated with KPMG International Cooperative (ldquoKPMG Internationalrdquo) a Swiss entity All rights reserved
copy 2014 KPMG LLP a Canadian limit ed liability par tnership and a member firm of the KPMG network of independent member
firms affiliated with KPMG International Cooperative (ldquoKPMG Internationalrdquo) a Swiss entity All rights reserved
British Columbia Technology Report Card 2014 British Columbia Technology Report Card
Industry Profile and Comparative Analysis Industry Profile and Comparative An
8102019 BC Technology Report Card 2014 Edition
httpslidepdfcomreaderfullbc-technology-report-card-2014-edition 1827
art B Industry Input Indicatorshile the BC technology industry continues to perform well compared to other BC industries it continues
underperform relative to the technology industries in other provinces ndash although the gap is being
osed It is also generally behind the tech sectors of the countries in the Organization for Economic
o-operation and Development (OECD) particularly in the areas of t alent venture capital investment
d research and development (RampD) all of which are necessary growth drivers A closer assessment
BCrsquos technology industry inputs offers a glimpse into key areas of weakness and highlights areas
here appropriate targeted investment may serve to underwrite the sectorrsquos future performance
rt of the noted underperformance can be attributed to the capacity constraints of BC firms Populated
th small enterprises BC tech firms have a limited ability to raise capital investment invest in RampD
crease the available talent pool collaborate with post-secondary research institutes and build
ellectual property
C Technology Industry ndash 2014 Report Card
Talent Availability
Industr y Input Indicator s Ver sus O ther Provincial Tech Sectors 2014
Grade
Access to Capital
Research and Development
Intellectual Property
Cndash
bull Low talent availability ndash BC lags other provinces in granting engineering and sciences degrees
at both the undergraduate and graduate levels and is well below the OECD average in granting
technical doctoral degrees
bull Lack of venture capital investment ndash While BC has a relatively healthy level of angel
investment venture capital investment is largely lacking or insufficient
bull Lagging RampD investment ndash BC fares poorly compared to other provinces and OECD countries
on the level of RampD invested as a percentage of output Of particular concern is the declining
level of business expenditure on RampD which is already behind other jurisdictions
bull Fewer patents ndash BCrsquos level of patents granted lags other provinces and OECD countries on
both a per capita basis and as a percent of applications filed
Highlights
Talent Availability
Talent is a critical resource for the technology sector feeding the innovation and creativity that in turn
drive the global industry From information amp communications technology to engineering amp other
services to life sciences each sector relies on the availability of a skill-specific talent pool to meet
existing business demands and generate new growth ideas The technical skills required by the industry
are primarily developed at higher education institutions then nurtured within the industry The number of
degrees awarded in a province is therefore a useful measure of the technical talent available for firms
to draw on
While there has been an improvement in the granting of degrees in math and computer science in
BC relative to other provinces we continue to lag in the granting of degrees in other technical fields
BC fares particularly poorly in the architecture and engineering fields and underperforms the Canadian
average in life sciences Moreover BCrsquos performance has fallen relative to other OECD countries in the
granting of technical PhDs
Talent Availability
Undergraduate Degrees
Industry Input Indicators
Summary
Undergraduate Technology Degrees
Graduate Technology Degrees
Versus other Provincial Tech Sectors 2014
014 KPMG LLP a Canadian limit ed liability par tnership and a member firm of the KPMG network of independent member
s affiliated with KPMG International Cooperative (ldquoKPMG Internationalrdquo) a Swiss entity All rights reserved
copy 2014 KPMG LLP a Canadian limited liabi lity partnership and a member firm of the KPMG network of independent member
firms affiliated with KPMG International Cooperative (ldquoKPMG Internationalrdquo) a Swiss entity All rights reserved
British Columbia Technology Report Card 2014 British Columbia Technology Report Card
Industry Profile and Comparative Analysis Industry Profile and Comparative An
8102019 BC Technology Report Card 2014 Edition
httpslidepdfcomreaderfullbc-technology-report-card-2014-edition 1927
oing deeper
illed labour availability in BC as measured by the level of undergraduate degrees granted per capita
iled only Ontario in 2012 having grown steadily over the last three years13
Data for Queacutebec has been revised downwards significantly by BC Stats Undergraduate degrees per 100000 population was lower than the
evel in BC up to 2008 and remains that way till 2011
urce Profile of the British Columbia High Technology Sector BC Stats March 2014
0
0
0
0
0
0
0
20022001 2003 2004 2005 2006 2007 2008 2009 2010 2011
O ntar io Q ueacute be cBritish Columbia Alberta
ndergraduate Degrees per 100000 Population
nnual Undergraduate Degrees per 100000 Population 2011
owever in terms of the relevance of those degrees to the technology industry BC continues to
il other provinces on average For both undergraduate and graduate degrees BC is well behind the
nadian average and the degree rates of other provinces in the fields of architecture and engineering
e province is also behind the Canadian average in the granting of undergraduate and graduate degrees
the physical and life sciences disciplines Only in the fields of math computer science and information
ence has there been a positive trend since 2009 with BC now second only to Ontario in granting
th undergraduate and graduate degrees in these disciplines
Queacutebec Ont ario Alberta Brit ish ColumbiaCanada
0
0
0
0
0
0
0
0Undergraduate
Degrees ndash Architecture and
Engineering
Undergraduate
Degrees ndash Physical
and Life Sciences
Undergraduate
Degrees ndash Math Computer
and Information Science
BC produces thesecond highest
number ofundergraduateson a per capitabasis butcontinues to
trail Ontariosignificantly
Globally Canadarsquos rate of granting technology-related doctoral degrees per 1000 population in the
reference age cohort is well below the OECD average Since 2009 the level in Canada remained
the same at 12 percent while the OECD average improved slightly to 16 percent KPMG estimates
that BCrsquos rate of doctoral degrees of 06 percent also did not change since the last estimate in
2009 meaning a deficit of 60 percent versus other OECD jurisdictions More concerning yet is that
many of the countries that trailed Canada and British Columbia in 2000 had surpassed us by 2011
(eg Italy Iceland and Greece)
Source Profile of the British Columbia High Technology Sector BC Stats March 2014
Source KPMG Analysis and OECD Science Technology and Industry Scorecard 2013 OECD 2013
urce Profile of the British Columbia High Technology Sector BC Stats March 2014
Technology Related Doctoral Degrees as Percentage of Population in Reference Age Cohort
Annual Graduate Degrees per 100000 Population 2011
Queacutebec Ontario Alberta British ColumbiaCanada
300
250
200
150
100
50
00Graduate Degrees ndash
Architecture andEngineering
Graduate Degrees ndash Physicaland Life Sciences
Graduate Degrees ndash MathComputer and Information Science
014 KPMG LLP a Canadian limit ed liability par tnership and a member firm of the KPMG network of independent member
s affiliated with KPMG International Cooperative (ldquoKPMG Internationalrdquo) a Swiss entity All rights reserved
copy 2014 KPMG LLP a Canadian limit ed liability par tnership and a member firm of the KPMG network of independent member
firms affiliated with KPMG International Cooperative (ldquoKPMG Internationalrdquo) a Swiss entity All rights reserved
British Columbia Technology Report Card 2014 British Columbia Technology Report Card
Industry Profile and Comparative Analysis Industry Profile and Comparative An
8102019 BC Technology Report Card 2014 Edition
httpslidepdfcomreaderfullbc-technology-report-card-2014-edition 2027
Access to Capital
ccess to risk capital throughout the growth cycle is one of
e most significant determinants of tech sector success
has been empirically established that companies that
ceive risk capital have a significantly higher survival rate
perience stronger revenue employee wage and asset
owth and invest in higher levels of RampD 14
e BC technology industry has had a healthy growth in
gel investment which typically takes the form of seed
pital that helps in the emergence of start-ups However
rly stage venture capital investment ndash a necessary fuel
r growing start-ups into thriving companies ndash is deficient
BC and has been declining in recent years And of the
early stage venture capital that is invested there has
been a decline in the share invested by local funds which
deprives companies not only of adequate risk capital but
also of the guidance and networking opportunities that
are essential in early growth stages At the same time
BC companies attract a significant amount of foreign and
extra-provincial investment at the later stages of growth
Together these findings suggest that small technology firms
in BC are limited in their ability to access timely risk capital
that can propel their growth and firms that successfully
attract foreign venture capital may be at risk of relocating
outside BC
These findings can be explored in detail in the recent study by CVCA and Industry Canada titled ldquoThe Performance of Canadian Firms that
Received Venture Capital Financingrdquo published in June 2013
ccess to Capital
Access to Angel Investment
Summary
Access to Venture Capital
Are at Versus Other Provincial Tech Sectors 2014
Industry leaders almost universally agreed that access
to talent has become the most significant issue facing
their firms They cite a tightening of talent availability
over the past few years growing shortages in certain
key technical areas including software and web
development and a need to expand the available talent
pool in areas such as industrial technologies and sales
and marketing as critical issues
The challenges in talent availability have been exacerbated
by the arrival or impending arrival of several multinational
firms on the BC tech scene With a relatively constrained
talent pool the competition for available resources has
increased and with it compensation levels have risen
Several of the larger US-based multinationals are offering
compensation packages at significant premiums over the
average compensation levels in the BC market leading
to growing talent development attraction and retention
challenges for smaller BC companies In some cases this
has led to BC-based companies establishing or growing
their operations outside of BC where talent is less
expensive and more available
Leaders agreed that long-term industry success will
require an expanded talent pool developed by improving
the quantity and quality (job-readiness) of post-secondary
degree programs as well as by attracting talent from
outside of BC and Canada
The high cost of real estate was cited as a primary
barrier to attracting outside talent particularly where
mid- and senior-level management must be relocated
As a result companies are looking at alternative ways
of addressing relocation costs and at targeting talentmarkets where the cost differential or the expectation
of home ownership are less
Industry Insights on Talent Availability
In recent years the vast majority of venture capital invested in BC was in later stage financing Early
stage venture capital is significantly more limited and has been declining over the last few years
Capital by Stage of Investment
Venture Capital by Stage of Investment
Going deeper
BC has experienced steady growth in the level of angel investments in the province since the mid-2000s
Venture capital investment on the other hand has been more volatile
Source CVCA and BCTIA analysis of Thompson Reuters Data
Source CVCA and BCTIA analysis of Thompson Reuters Data
$0
$100
$200
$300
4
2003
$40
$110
2004
$31
$254
2005
$32
$226
2006
$54
$298
2007
$54
$316
2008
$64
$260
2009
$67
$141
2010
$72
$223
2011
$87
$233
2012
$97
$201
Ve ntur e C ap ital Ang el
$ m i l l i o n
$0
$100
$200
$300
$51
$172
$43
$190
$16
$185
2010 2011 2012
VC Later Stage VC Early Stage
$ m i l l i o n
014 KPMG LLP a Canadian limit ed liability par tnership and a member firm of the KPMG network of independent member
s affiliated with KPMG International Cooperative (ldquoKPMG Internationalrdquo) a Swiss entity All rights reserved
copy 2014 KPMG LLP a Canadian limit ed liability par tnership and a member firm of the KPMG network of independent member
firms affiliated with KPMG International Cooperative (ldquoKPMG Internationalrdquo) a Swiss entity All rights reserved
British Columbia Technology Report Card 2014 British Columbia Technology Report Card
Industry Profile and Comparative Analysis Industry Profile and Comparative An
8102019 BC Technology Report Card 2014 Edition
httpslidepdfcomreaderfullbc-technology-report-card-2014-edition 2127
verall BC placed second to last in the level of total venture capital invested among the 20 North
merican jurisdictions examined This is particularly concerning as the technology industry is inherently
obile and decisions regarding the location of operations can be significantly influenced by structural
ctors such as access to capital rather than the presence of local demand
e decline in locally sourced early stage capital is particularly concerning given its importance At the
me time a significant share of later stage investment originates from foreign sources which presents
potential risk that firms may subsequently relocate outside of BC
urce CVCA and BCTIA analysis of Thompson Reuters Data
urce KPMG Analysis of Thomson Reuters Data
$million
$33
$18
$11
$32
$0
$10
$20
$30
$40
2010 2011 2012
$3
$12
CanadianForeign
arly Stage VC Investment by Source
enture Capital Investments 2012
C a
l i f o r n
i a
M a s s e c
h u s e t t s
N e w
Y o r k
T e x a s
W a s
h i n g t o n
M a r y
l a n
d
U t a
h
O h i o
N e w
J e r s e y
O n t a r i o
V i r g i n i a
Q u e
b e c
B r i t i s
h C o
l u m
b i a
P e n n s y
l v a n
i a
I l l i n o
i s
A r i z o n a
C o
l o r a
d o
G e o r g
i a
M i n n e s o t a
M i c h i g a n
V C P e r
C a p
i t a -
$
$500
$450
$400
$350
$300
$250
$200
$150
$100
$50
$0
$6000
$5000
$4000
$3000
$2000
$1000
$0
VC per capita 2012Venture Capital 2012
Locallysourced earlystage VC
investmenthas beendeclining
Research and Development
RampD expenditure is the long-term investment in an industryrsquos future economic performance It measures
commitment to using innovation and knowledge creation to enhance productivity and improve competitiveness
Over the last few years there has been little increase in overall RampD investment in BC As such it
ranks below Ontario and Queacutebec However the composition of RampD spending has changed over time
with the share of business investment in RampD experiencing a steady decline The fact that the industry
is populated with small firms with fewer than 50 employees can help explain this trend BC is host to
very few large anchor companies that have the revenues and the capital to spend in significant ways
on research for the purposes of enhancing competitiveness
Research and Development
Summary
BERD as a Percentage of GDP
RampD as a Percentage of GDP
Versus other Provincial Tech Sectors 2014
The technology industry leaders interviewed recognized that there is a healthy local angel
network in BC However early stage venture capital financing in BC is seen as either absent
or modest making it difficult for small companies to grow There is a sense that attracting
venture capital from out-of-province is also challenging because physical proximity is an
important investment factor
Overall the opinion was that the limited presence of venture capital in BC leads to an absence
of investment competition which impacts competitive valuation and terms Industry leaders also
noted that local venture capital funds often take a revenue-based valuation approach Paradoxically
this may mean that a company can be valued higher by an angel investor prior to earning any
revenue than by an institutional investor once it starts generating revenue Since angel investors
typically expect high returns on initial investment this may make it difficult for small companies
to raise subsequent rounds of institutional financing often leaving them with prospects of
constrained growth due to limited capitalization or the option of selling early This lack of breadth
in the capital pool can lead to a vicious cycle of limited company growth and depressed valuations
of small companies seeking funding
Industry Insights on Risk Capital Investment
014 KPMG LLP a Canadian limit ed liability par tnership and a member firm of the KPMG network of independent member
s affiliated with KPMG International Cooperative (ldquoKPMG Internationalrdquo) a Swiss entity All rights reserved
copy 2014 KPMG LLP a Canadian limit ed liability par tnership and a member firm of the KPMG network of independent member
firms affiliated with KPMG International Cooperative (ldquoKPMG Internationalrdquo) a Swiss entity All rights reserved
British Columbia Technology Report Card 2014 British Columbia Technology Report Card
Industry Profile and Comparative Analysis Industry Profile and Comparative An
8102019 BC Technology Report Card 2014 Edition
httpslidepdfcomreaderfullbc-technology-report-card-2014-edition 2227
BC total RampD spending as a percent of GDP has remained relatively constant since 2008 Other
ovinces experienced a slight decline in this metric While BC remains higher than Alberta in this
gard it still makes up only 60 percent of the RampD expenditure levels in Ontario and Queacutebec
oing deeper
$3 billion there was no significant increase in the total RampD expenditure in BC since 2008 although
e composition of the spending changed The share of higher education and private non-profit
penditure continued to grow from 39 percent in 2008 to 43 percent in 2010 while that of business
terprise shrank by an equivalent amount to 53 percent in 2010
urce Profile of the British Columbia High Technology Sector BC Stats March 2014
urce Profile of the British Columbia High Technology Sector BC Stats March 2014
0
500
1000
1500
2000
2500
3000
3500
2000 2001 2002 2003 2004 2005 2006 2007 2008 2009 2010
Business Enterprise Higher Education amp Private Non-Profit
F ed er al Go vt P ro vin ci al Go ve rn me nt amp Re se ar ch In st it ut ion s
ampD Expenditures in British Columbia
ampD as a Percent of GDP
000
050
100
150
200
250
300
2007 2008 2009 2010
Ont ar io QueacutebecBritish Columbia Alberta
Overall RampDinvestment in
BC has beenconstant withan increase
in highereducation
spendingequal to thereductionin business
investmentin RampD
BCrsquos levelof RampD as apercentageof GDP has
been constantbut remains40 percent
lower thanOntario and
Queacutebec
Source KPMG Analysis of BC Stats Data and OECD Science Technology and Industry Scorecard 2013 OECD 2013
RampD Expenditure as a Percent of GDP
Since the last report card BC did not improve its global standing in RampD intensity as it continues
to perform 40 percent below the OECD average
I S R
K O R
F I N
J P N
S
W E
C H E
D N K
D E U
U S A
A U T
S V N
I S L
O E C D
E S T
F R A
C H N
B E L
O N
A U S
E
U 2 8
N L D
C Z E
G B R
L U X
C A N
I R L
N O R
P R T
B C
E S P
Z A F
I T A
H
U N
N Z L
R U S
M
E X
T U R
P O L
S V K
C H L
0
1
2
3
4
5
2011 2001
Q C
The BERD (business expenditures on RampD) ratio ndash which reflects the level of industry commitment
within the technology industry ndash has fallen for all provinces since 2008 BC still performs better than
Alberta with its businesses contributing 078 percent of GDP to RampD investment but remains well
below Queacutebec and Ontario which contribute 142 percent and 109 percent respectively
Source Profile of the British Columbia High Technology Sector BC Stats March 2014
Business Expenditure on RampD as a Percent of GDP
0
05
10
15
20
2007 2008 2009 2010
P e r c e n t o f G D P
CanadaOntario QueacutebecBritish Columbia Alberta
BusineRampD apercen
of GDPis 20 plower tCanad
BC fell below averageexpendpercent
014 KPMG LLP a Canadian limit ed liability par tnership and a member firm of the KPMG network of independent member
s affiliated with KPMG International Cooperative (ldquoKPMG Internationalrdquo) a Swiss entity All rights reserved
copy 2014 KPMG LLP a Canadian limit ed liability par tnership and a member firm of the KPMG network of independent member
firms affiliated with KPMG International Cooperative (ldquoKPMG Internationalrdquo) a Swiss entity All rights reserved
British Columbia Technology Report Card 2014 British Columbia Technology Report Card
Industry Profile and Comparative Analysis Industry Profile and Comparative An
8102019 BC Technology Report Card 2014 Edition
httpslidepdfcomreaderfullbc-technology-report-card-2014-edition 2327
0
0
0
0
0
0
0
0
0
I S R K O R F I N J
P N S W E C
H E D N K
D E U
U S A
A U T
S V N I S L
O E C D E
S T F R A
C H N B
E L A U S
E U 2 8 I R L C
Z E G B R
L U X
C A N N
L D N O R B C
H U N E
S P P R T I T A R
U S N Z L
Z A F
T U R
S V K
P O L
M E X
C H L
2011 2001
usiness Expenditure on RampD as a Percent of GDP
Crsquos BERD remained 50 percent below the OECD average and did not experience any change from the
01 level This means between 2001 and 2011 BC was surpassed by countries like China and Australia
their level of BERD investment as a p ercent of GDP
urce KPMG Analysis of BC Stats Data and OECD Science Technology and Industry Scorecard 2011 OECD 2011
BusinessRampD in BCis one-thirdthe level of
leading OECDcountries
Going deeper
Compared to other provinces with significant technology industries BC continues to trail in terms of both
the number of patents filed and the number of patents granted on both an absolute and per capita basis
Intellectual Property
Canadian Patents Filed and Granted
Source Canadian Patent Office
Intellectual Property
Intellectual property is a bellwether of the inventory of assets that can be commercialized to underwrite
future economic performance As measured by the number of patent applications submitted and
granted intellectual property reflects the success of RampD investment in the development of innovative
products provides an indication of the commercial viability of research and provides an indication of the
competitiveness of the technology industry as a whole Consistent with the findings of the 2012 report
card BC still ranks well below all other provinces with significant technology industries in the level of
patents awarded both on a per capita basis and as a percentage of applications filed
Patents Granted
Versus Other Provincial Tech Sectors 2014
Summary
0
500
1000
1500
2000
2500
Patents Filed ndash2011
Patents Filedndash2012
Patents Granted ndash2011
Patents Granted ndash2012
Ontario Queacutebec Alberta British Columbia
copy 2014 KPMG LLP a Canadian limit ed liability par tnership and a member firm of the KPMG network of independent member
firms affiliated with KPMG International Cooperative (ldquoKPMG Internationalrdquo) a Swiss entity All rights reserved
014 KPMG LLP a Canadian limited liabi lity partnership and a member firm of the KPMG network of independent member
s affiliated with KPMG International Cooperative (ldquoKPMG Internationalrdquo) a Swiss entity All rights reserved
British Columbia Technology Report Card 2014 British Columbia Technology Report Card
Industry Profile and Comparative Analysis Industry Profile and Comparative An
8102019 BC Technology Report Card 2014 Edition
httpslidepdfcomreaderfullbc-technology-report-card-2014-edition 2427
ore telling is the fact that BC has had the lowest level of patents awarded as a percent of applications
er the last decade
e prevalence of small firms in the BC technology sector has a direct impact on the capacity of
mpanies to successfully pursue patents Not only do they have limited capacity to invest in RampD to
velop patentable innovations but their capital constraints limit their ability to access the legal and
ministrative expertise needed to execute patent applications
atents Awarded per 100000 Population
atents Granted as a Percent of Patent Applications
urce Profile of the British Columbia High Technology Sector BC Stats March 2014
urce Profile of the British Columbia High Technology Sector BC Stats March 2014
00
00
00
00
00
00
00
00
00
2001 2002 2003 2004 2005 2006 2007 2008 2009 2010 2011
CanadaO ntar io Q ueacute be cBritish Columbia Alberta
2001 2002 2003 2004 2005 2006 2007 2008 2009 2010 2011
CanadaO ntar io Q ueacute be cBritish Columbia Alberta
BCrsquos patentperformancesignificantlytrails otherprovinces
Canada still ranks 18th well behind the worldrsquos leading countries in terms of the number of triadic
patent families per million population ndash a measure of patents taken at three major patent offices in
the world KPMGrsquos estimate for BC places it even further down the list than it was in 200815
Triadic Patent Families per Million Population 2010
Source KPMG Analysis of BC Stats Data and OECD Science Technology and Industry Scorecard 2013 OECD 2013
15 KPMG estimated BCrsquos ranking on the chart by considering the relative proportions of patents awarded in BC versus Canada as a whole on
a per capita basis
0
20
40
60
80
100
1
I D N
I N D
B R A
T U R
R U S
C H L
Z A F
C H N
P O L
S V K
G R C
C Z E
P R T
H U N
E S P
E S T
S V N
W L D
B C
I S L
N Z L
I T A
A U S
I R L
C A N
N O R
G B R
L U X
O E C D
B E L
F R A
K O R
I S R
U S A
A U T
N L D
D N K
F I N D E U
S W E
C H E
J P N
M E X
BCrsquos paperform
is one-the levleadingcountr
014 KPMG LLP a Canadian limit ed liability par tnership and a member firm of the KPMG network of independent member
s affiliated with KPMG International Cooperative (ldquoKPMG Internationalrdquo) a Swiss entity All rights reserved
copy 2014 KPMG LLP a Canadian limited liabi lity partnership and a member firm of the KPMG network of independent member
firms affiliated with KPMG International Cooperative (ldquoKPMG Internationalrdquo) a Swiss entity All rights reserved
British Columbia Technology Report Card 2014 British Columbia Technology Report Card
Industry Profile and Comparative Analysis Industry Profile and Comparative An
8102019 BC Technology Report Card 2014 Edition
httpslidepdfcomreaderfullbc-technology-report-card-2014-edition 2527
he technology industry not only generates GDP employment and income
ithin the technology sectors (referred to as direct impact) it also brings
dditional benefits to the overall BC economy by supporting suppliers to
e industry (indirect impact) and through the re-spending of labour income
arned in technology and supplier industries (induced impact)
ur economic impact analysis indicates that the overall impact of the technology industry on the BConomy is significantly magnified by the indirect and induced impacts We estimate that based on
rrent technology industry revenues of $23 billion the total contribution to the BC economy is
$23 ndash $26 billion in GDP
165000 ndash 188000 jobs created or sustained
$10 ndash $12 billion in total labour income
ese high levels of economic benefits are consistent with an industry that is high value-add employs
ghly skilled workers pays high wages and is well integrated in the economy 16
s noted earlier in the report while the technology industry has made a significant contribution to the
C economy our province still trails other Canadian provinces and US jurisdictions in this respect For
ample the BC technology ind ustry current ly comprises 76 percent of provincial GDP compared to
3 percent contribut ed by the US technology industry to US GDP So what would happen if the BC
chnology industry grew to comprise 103 percent of the provincial economy
ur analysis indicates that growing to 103 percent of the provincial economy would bring an additional
1B in BC technology industry revenues and an associated increase of $91B ndash 102B in total
DP 65K ndash 74K additional jobs created or sustained and a $41B ndash 46B increa se in labour
come These estimates include the combined benefits of the direct indirect and induced impacts
the economy
Economic ImpactAssessment
sti mating the technology industry economic impact is challenging due to the lack of standard technology industry classificati ons and
corresponding technology-specific impact multipliers To estimate the impact KPMG used weighted averages of standard industry sector impact
multipliers based on the definition of sectors comprising the tech industry We have chosen to represent the impacts as ranges using different
sectoral weights The use of ranges reflects the inherent variability in the technology industry caused by the diversity of sectors that it comprises
For example a dollar worth of output in the tech industry will have a different economic impact depending on whether it is generated by the
software publishing sector the telecommunication sector or the motion picture and post-production sector In our analysis of direct impacts we
have used figures reported by BC Stats To estimate the indirect and induced impacts we have used industry-standard multipliers developed by
Statistics Canada
Going deeper
Current BC Technology Industry Economic Impact
Given that the industry generated $23 billion in revenues we estimate that the industry contributed
$23 ndash $26 billion to total GDP created or sustained 165000 ndash 188000 jobs an d delivered $10 ndash $12 billion
to total labour income This impact breaks down in direct indirect and induced impact as follows
Current BC Tech Industry Impact
GDP
JOBS
LABOUR INCOME
$23 Bin Tech Industry
Revenues
Direct Impact Indirect Impact Induced Impact Total Impact
$15B
84K
$6B
$4B ndash 5B
43K ndash 52K
$4B ndash 6B
39K ndash 52K
$2B ndash 3B
$23B ndash 26B
165K ndash 188K
$10B ndash 12B$23B ndash 3B
BC Technology Industry Economic Impact Multipliers
In order to compare the technology industry to other industries as well as forecast the impact of
industry growth we have estimated the technology industry impact per dollar of revenue
We find that for each dollar of technology industry revenue the industry generates $1 ndash $112 in total
GDP and $045 ndash $05 in total labo ur income Further for each million dollars in te chnology industr y
revenue the industry generates or sustains seven to eight jobs in BC This impact breaks down in
direct indirect and induced impact as follows
Economic Impact Multiplier Estimates
GDP ($)
$1in Tech Revenues
For each
$1M in Tech Revenues
For each
Direct Impact Indirect Impact Induced Impact Total Impact
065 016 ndash 022 019 ndash 025 100 ndash 112
JOBS 362 186 ndash 228 168 ndash 226 716 ndash 817
LABOUR INCOME ($) 027 010 ndash 013 008 ndash 011 045 ndash 050
014 KPMG LLP a Canadian limit ed liability par tnership and a member firm of the KPMG network of independent member
s affiliated with KPMG International Cooperative (ldquoKPMG Internationalrdquo) a Swiss entity All rights reserved
copy 2014 KPMG LLP a Canadian limit ed liability par tnership and a member firm of the KPMG network of independent member
firms affiliated with KPMG International Cooperative (ldquoKPMG Internationalrdquo) a Swiss entity All rights reserved
British Columbia Technology Report Card
Economic Impact Assess
8102019 BC Technology Report Card 2014 Edition
httpslidepdfcomreaderfullbc-technology-report-card-2014-edition 2627
GDP
JOBS
LABOUR INCOME
$91 BTech Revenues
Additional
Direct Impact Indirect Impact Induced Impact Total Impact
$59B
33K
$25B
$15B ndash 2B
17K ndash 21K
$09B ndash 12B
$17B ndash 23B
15K ndash 21K
$07B ndash 10B
$91B ndash 102B
65K ndash 74K
$41B ndash 46B
Economic Impact of BC Technology Industry Growth
demonstrate the magnitude of potential economic benefit from growing the BC technology industry
e chose to estimate these benefits in the context of a specific growth figure As shown in the GDP
alysis section of this report BC trails significantly many US states as well as the US average in terms
the share of the technology industry to the economy as a whole We asked the question ndash what
ould be the economic impact if we caught up to the US average
e US technology industr y contributes 103 percen t to the overall US GDP as compared to 76 percent
ntributed by the BC technology industry to the BC economy To reach the current contribution level
the US the BC technology industr y will need to add an additional $6 B in GDP corresponding to an
ditional $9B in technology industry revenues (given current industry multipliers)
ur analysis indicates that growing to 103 percent of the provincial economy would bring an additional1B in BC technology indust ry revenues and an associ ated increase of $91B ndash 102B in total GDP
K ndash 74K additional jobs created or sustained and a $41B ndash 46B increase in labour income This
pact breaks down in direct indirect and induced impact as follows
conomic Impact of Growing the BC Technology Industry Contribution to Match the US
While this report card clearly demonstrates the tech
industryrsquos importance to BCrsquos economy itrsquos the possibilities
revealed that most command our attention And itrsquos in our
flaws that our future lies Despite the industryrsquos provincial
strength we trail our Canadian peers on a number of
metrics such as the availability of local venture capital
building field-specific talent pools and increasing firm size
But though these challenges are significant identifying
them ndash knowing what we have to do and where to apply our
resources investments and commitments ndash provides a clear
roadmap for improvement and sustainable success
Wersquore in a very good place The potential for BC tech to become
a major national and global player is right in front of us Indeed
a number of technology companies are already flourishing in
BC with significant operations owned or being built by
bull Canadarsquos largest defense company MDA
bull Canadarsquos largest cleantech company Westport
bull Worldrsquos largest machine-to-machine wireless company
Sierra Wireless
bull Canadarsquos largest social media management company
Hootsuite
bull The first commercial quantum computing company Dwave
bull And global leaders like Amazon Best Buy Boeing
Electronic Arts Microsoft IBM McKesson Sams
Schneider Electri c Sony Imageworks and SAP
As these and other companies have realized BC is o
the most vibrant start-up ecosystems anywhere in th
one that regularly translates great ideas creative tale
audacious vision into some of the hottest tech compaaround Itrsquos a dynamic environment teeming with bra
entrepreneurs who thrive on their peersrsquo global aspira
With this core of industry infrastructure top talent an
innovative thinking in place BC is well positioned to
the tech industryrsquos many emerging and evolving opp
Every powder keg however needs a fuse BC is a te
hot spot but we have to keep stoking the fires of in
ambition and talent to ensure the positive gains mad
2012 become major leaps the next time we take stoc
means we have to work together ndash emerging tech st
ups and major corporate players industry investors a
trend-setters policy makers and academic leaders al
we continue to improve in the key areas identified in
report we can keep building the momentum BC tech
to realize its provincial successes and gains on the n
and global scales
ConclusionTaking the next step together
AcknowledgementsKPMG would like to gratefully acknowledge the support of BC Stats in the development of this report
Our detailed statistical analysis would not have been possible without the rich collection of BC industry
data provided to us by BC Stats
014 KPMG LLP a Canadian limit ed liability par tnership and a member firm of the KPMG network of independent member
s affiliated with KPMG International Cooperative (ldquoKPMG Internationalrdquo) a Swiss entity All rights reserved
copy 2014 KPMG LLP a Canadian limit ed liability par tnership and a member firm of the KPMG network of independent member
firms affiliated with KPMG International Cooperative (ldquoKPMG Internationalrdquo) a Swiss entity All rights reserved
British Columbia Technology Report Card 2014 British Columbia Technology Report Card
Economic Impact Assessment Concl
8102019 BC Technology Report Card 2014 Edition
httpslidepdfcomreaderfullbc-technology-report-card-2014-edition 2727
KPMG in Canada provides Audit Tax and Advisory services We work closely with our clients
helping them to mitigate risks and grasp opportunities
KPMG in Canada is committed to our clients We have made considerable investments in regards to
personnel research and hard-won experience Through these investments we strive to be the best
in everything we do turning our experience and industry knowledge into real value for our clients
This is the KPMG Way
Contact us
For more information please contact your KPMG adviser or one of the following professionals
Anthony Lindsay
Partner Greater Vancouver Area Market Leader
Technology Media and Telecommunications
T 604-646-6379
E tdlindsaykpmgca
Slavi Diamandiev
Greater Vancouver Area
Economics Practice Leader
Management Consulting
T 604-673-4458
E sdiamandievkpmgca
Ed Zacharuk
Partner Greater Vancouver Area SRampED
Practice Leader
T 604-691-3201
E ezacharukkpmgca
Sukesh Kumar
Partner National Leader India Desk
T 604-527-3468
E skumarkpmgca
Walter Pela
Partner in Charge of Tax Services
Greater Vancouver Area
T 604-691-3193
E wpelakpmgca
Ian Wilshaw
Partner Greater Vancouver Area Market Leader
Private Equity
T 604-691-3557
E idwilshawkpmgca
The information contained herein is of a general nature and is not intended to address the circumstances of any particular individual or entity Although we endeavor to
provide accurate and timely information there can be no guarantee that such information is accurate as of the date it is received or that it will continue to be accurate in
the future No one should act on such information without appropriate professional advice after a thorough examination of the particular situation
kpmgcatmt
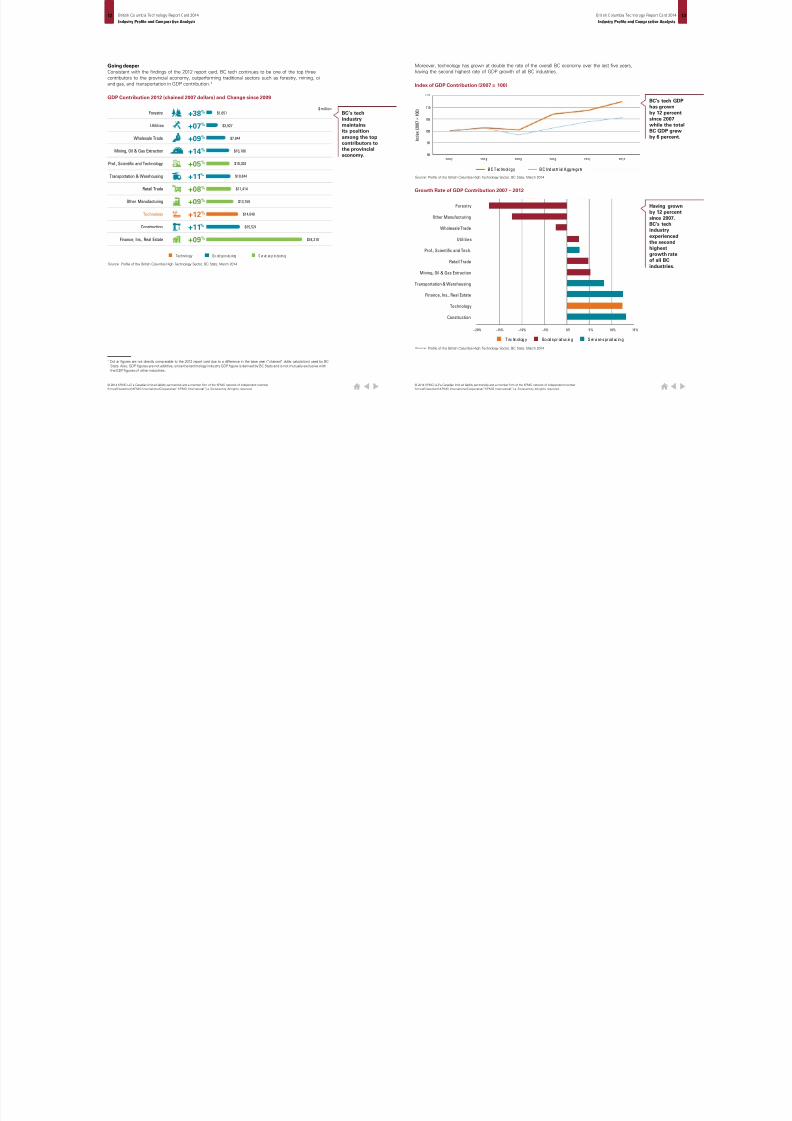
8102019 BC Technology Report Card 2014 Edition
httpslidepdfcomreaderfullbc-technology-report-card-2014-edition 927
addition to its direct contributions to the BC economy the tech industry has indirect impacts
eated by industry suppliers and induced impacts from the spending of the labour income generated
technology and supplier industries In total these represent the total economic impacts of the
dustry and this number proves to be significant Our analysis finds that per dollar of revenues the
chnology industry in BC has a higher total GDP impact than BCrsquos primary resource industries
well as the construction industry High GDP per dollar of revenue is indicative of high value added
ring the production process (as measured by a relatively high value of the final productservice net
the intermediary inputs in production) From an income perspective high GDP per dollar of revenue
associated with high levels of labour income and company profits generated by the industry (net of
preciation interest taxes and subsidies)
r every $1 of Revenues $GDP
nduced GDP Impact
08 085 09 095 10
01 02 03 04 05
Total GDP Impact
ldquoForestryrdquo includes Forestry and Logging
ldquoMining Oil amp Gasrdquo includes Mining Quarrying and Oil amp Gas Extraction
ldquoConstructionrdquo includes Residential Construction
ldquoTechnologyrdquo includes the Technology Industry as defined by BC Stats
01 02 03 04 05
ndirect GDP Impact
03 04 05 06 07
Direct GDP Impact
omparison of GDP Impacts Across BC Industries
Tech GDP Contribution and Share of Services and Manufacturing Sectors 2012
urce KPMG Analysis of Statistics Canadarsquos Inter-provincial Input-Output Multipliers
te For a more detailed description and analysis of the economic impacts of the BC technology industry on the overall economy please refer
he Economic Impact Analysis section of this report card
The technology industry in BC is comparable to that in Alberta in both absolute size and composition
in both provinces nearly 90 percent of the industryrsquos value-added output is generated by its services
sector In contrast the technology industries in Ontario and Queacutebec are much larger in absolute size and
manufacturing plays a greater industry role
m i l l i o n
( c h a i n e d 2 0 0 7 )
Services Manufacturing
British Columbia Alberta Ontario Queacutebec
68
78
9489
$50000
$40000
$30000
$20000
$10000
$0
Source Profile of the British Columbia High Technology Sector BC Stats March 2014
The maof BC toutputgenera
the sersector
014 KPMG LLP a Canadian limit ed liability par tnership and a member firm of the KPMG network of independent member
s affiliated with KPMG International Cooperative (ldquoKPMG Internationalrdquo) a Swiss entity All rights reserved
copy 2014 KPMG LLP a Canadian limited liabi lity partnership and a member firm of the KPMG network of independent member
firms affiliated with KPMG International Cooperative (ldquoKPMG Internationalrdquo) a Swiss entity All rights reserved
British Columbia Technology Report Card 2014 British Columbia Technology Report Card
Industry Profile and Comparative Analysis Industry Profile and Comparative An
8102019 BC Technology Report Card 2014 Edition
httpslidepdfcomreaderfullbc-technology-report-card-2014-edition 1027
hen the population size of each province is taken into account enabling a more reasonable performance
mparison we find that BCrsquos technology industry has historically generated the lowest GDP on a per
pita basis However over the last five years BCrsquos technology sector has had the highest compound
nual growth rate among all the provinces significantly reducing the GDP per capita gap
ech GDP Per Capita (chained 2007) Technology GDP as a Percent of Total GDP
dex of Technology Industry GDP (2007 = 100)
$4100
$3900
$3700
$3500
$3300
$3100
$2900
$2700
2007 2008 2009 2010 2011 2012
Br it ish Columbia Alber ta Ont ario Queacutebec Canada
urce KPMG analysis of data from the Profile of the British Columbia High Technology Sector BC Stats March 2014 and Statistics Canadarsquos
NSIM Table 051-0001
urce Profile of the British Columbia High Technology Sector BC Stats March 2014
Source KPMG analysis of data from the Profile of the British Columbia High Technology Sector BC Stats March 2014 and World Bank
National Accounts
2007 2008 2009 2010 2011 2012
Br it ish Columbia Alber ta Ont ario Queacutebec Canada
115
110
105
100
95
90
85
80
In fact at 24 percent BCrsquos technology industry GDP is growing faster than the Canadian and US averages
and BCrsquos technology sector now accounts for the same proportion of the overall provincial GDP as does
the technology industry for Canada as a whole56 That said BCrsquos technology industry is still 30 percent
behind that of the US in terms of its contribution to tot al GDP highlighting a significant upsi de potential
120
100
80
60
40
20
00
76
69
(2009)
77 103 24 11 21
Tech GDP as a of Total in 2012 CAGR in Tech GDP (2007ndash2012)
Br it ish C olu mbia C anada Un it ed S tat es
5 This analysis uses nominal values to calculate Compound Annual Growth Rate (CAGR) for the USrsquos Tech GDP (deflated numbers are
unavailable) The gap between the growth rates of BC and US technology industries will be even larger if the US GDP is adjusted for inflation
6 The data for BC tech GDP from the 2012 report card has been revised In 2009 BC tech GDP as a share of its economy was 69 percent and
not 59 percent as previously reported
BCrsquos techindustry
trails otherprovinces inper-capita GDPcontributionbut is closing
the gap
While
techrsquos a perceof totais at p
Canad30 percbehindUS itscontrib
growinthan b
BC tech hasthe highestannual growth
rate among allthe provinces
014 KPMG LLP a Canadian limit ed liability par tnership and a member firm of the KPMG network of independent member
s affiliated with KPMG International Cooperative (ldquoKPMG Internationalrdquo) a Swiss entity All rights reserved
copy 2014 KPMG LLP a Canadian limited liabi lity partnership and a member firm of the KPMG network of independent member
firms affiliated with KPMG International Cooperative (ldquoKPMG Internationalrdquo) a Swiss entity All rights reserved
British Columbia Technology Report Card 2014 British Columbia Technology Report Card
Industry Profile and Comparative Analysis Industry Profile and Comparative An
8102019 BC Technology Report Card 2014 Edition
httpslidepdfcomreaderfullbc-technology-report-card-2014-edition 1127
Going deeper
BCrsquos technology industry revenues have rebounded since the 2008 recession showing a higher
compound annual rate since 2009 (67 percent) than it did prior to 2009 (55 percent)78
hile BC has made progress since 2012 in terms of the size of the technology industry relative to the
erall economy there remains a significant opportunity for growth as evidenced by comparison to both
dividual US states as well as the US average
GDP originating in the technology sector 2011Comparison of Industry Revenues
BC Technology Revenues
0 5 10 15 20 25
Oregon
Washington
Colorado
California
assachusetts
New Mexico
Maryland
Indiana
w Hampshire
Virginia
Idaho
New Jersey
orth Carolina
US
Connecticut
Utah
Kansas
Vermont
Georgia
Arizona
Missouri
Texas
Minnesota
Pennsylvania
Canada
ish Columbia
urce Profile of the British Columbia High Technology Sector BC Stats
Source Profile of the British Columbia High Technology Sector BC Stats March 2014
Industry Revenues
The technology industry generates a significant revenue base in BC that has grown substantially over
the last few years However on a per capita basis technology continues to trail other provinces
Versus Other BC Industry
Sectors 2014
Versus Other Provincial
Tech Sectors 2014
Summary
Industry Revenues NA
Industry Revenue Growth
7 Revenue figures are not adjusted for inflation For inflation-adjusted output values please refer to the GDP section of this analysis
8 Industry revenue figures for BC were generated using revenue data by establishments That is for firms headquartered in BC
only the revenues generated from their BC operations are included in the revenue calculations
2 0 0
2
2 0 0 3
2 0 0 4
2 0 0 5
2 0 0 6
2007 2 0 0 8
2 0 0 9
2 0 1 0
2 0 1 1
2 0 1
2
130
141
152
169
179
200201
191
192
224
232
Industrevenuhave g
at 67 pon an abasis s
014 KPMG LLP a Canadian limit ed liability par tnership and a member firm of the KPMG network of independent member
s affiliated with KPMG International Cooperative (ldquoKPMG Internationalrdquo) a Swiss entity All rights reserved
copy 2014 KPMG LLP a Canadian limit ed liability par tnership and a member firm of the KPMG network of independent member
firms affiliated with KPMG International Cooperative (ldquoKPMG Internationalrdquo) a Swiss entity All rights reserved
British Columbia Technology Report Card 2014 British Columbia Technology Report Card
Industry Profile and Comparative Analysis Industry Profile and Comparative An
8102019 BC Technology Report Card 2014 Edition
httpslidepdfcomreaderfullbc-technology-report-card-2014-edition 1227
owever BCrsquos technology industry revenues continue to account for a lower share of overall Canadian
chnology industry revenue as compared to BCrsquos share of the Canadian population While the gap has
ghtly narrowed compared to our 2012 findings BC remains the only province among Queacutebec Ontario and
berta to show such a trend
oreover the sectorrsquos revenue growth rate continues to outperform the Canadian average although BC
s been surpassed by Alberta in this regard
200
180
160
140
120
100
80
2002 2003 2004 2005 2006 2007 2008 2009 2010 2011 2012
Bri tish Columbi a Al berta Ont ari o Queacutebec Canada
dex of Technology Industry Revenue (2002 = 100)
opulation and Technology Revenues as a Percent of Canadian Totals 2012
urce Profile of the British Columbia High Technology Sector BC Stats March 2014
urce KPMG analysis of data from the Profile of the British Columbia High Technology Sector BC Stats March 2014 and Statistics Canada
NSIM Table 051-0001
British ColumbiaAlbertaOntarioQueacutebec
0
0
0
0
0
Population 2012Technology Revenues 2012
BC techrevenuegrowth
continues tooutperformthe Canadianaverage
BC tech
continues totrail otherprovinces inper capita
revenueThis gap hasnarrowedslightly since
the 2012report card
Industry leaders interviewed by KPMG observed that a number of external factors have helped to
augment the growth of BCrsquos tech industry
bull Government programs such as the National Research Councilrsquos Industrial Research Assistance
Program (IRAP) the Scientific Research and Experimental Development (SRampED) program
and the Small Business Venture Capital program are significant industry drivers as they incent
investment in innovative technologies and create a healthy start-up climate Other agencies
such as the BC Bioener gy Network BC In novation Council BC Trade amp Investment NRC-IRAP
the Natural Sciences and Engineering Research Council (NSERC) Export Development Canada
Sustainable Development Technology Canada (SDTC) Western Economic Diversification (WED)
and the Department of Foreign Affairs and Trade Development (DFATD) provide funding support
and program resources to assist local start-ups
bull BC is a more cost effective place to do business The corporate income tax regime andsecurity and privacy regulations create a favourable investment environment and are attractive
to companies looking to set up operations
bull The close proximity of BC tech to US markets such as Seattle and Silicon Valley is seen as
an advantage and a major growth driver
bull In certain technology sectors (eg financial and business software mobilewireless
technologies and web-based and gaming technologies) growth has been supported by rich
talent pools available at a lower cost relative to US clusters such as Silicon Valley BC tech
companies have also demonstrated stronger employee retention rates when compared to
other jurisdictions in the US and globally
bull Last but not least there is a perception within the industry that the technology sector in BC is
a tightly knit cohesive community which helps attract creative people to grow their businesses
in this province
Industry insights on output growth
014 KPMG LLP a Canadian limit ed liability par tnership and a member firm of the KPMG network of independent member
s affiliated with KPMG International Cooperative (ldquoKPMG Internationalrdquo) a Swiss entity All rights reserved
copy 2014 KPMG LLP a Canadian limited liabi lity partnership and a member firm of the KPMG network of independent member
firms affiliated with KPMG International Cooperative (ldquoKPMG Internationalrdquo) a Swiss entity All rights reserved
British Columbia Technology Report Card 2014 British Columbia Technology Report Card
Industry Profile and Comparative Analysis Industry Profile and Comparative An
8102019 BC Technology Report Card 2014 Edition
httpslidepdfcomreaderfullbc-technology-report-card-2014-edition 1327
omparison of Employment
omparison of Wages
Employment and Wages
e number of jobs sustained by BCrsquos technology industry has grown significantly over the last
cade However this growth has slowed in recent years placing BC behind other provinces in terms
technology jobs per capita This slowdown in employment growth may be the result of gains in
oductivity where higher value is being created by each job in the province or it may be because a
eater proportion of out-of-province employees are being employed by BC companies
e real wage in BC has grown significantly Although this is potentially consistent with growth in
oductivity there are likely other important contributing factors such as the high cost of living in BC
age inflation caused by the arrival of new multinationals and the significant competition for certain
pes of talent In any case BC technology offers high paying jobs ndash not only relative to other BC
dustries but also to the Canadian average for technology
Industry Employment
Industry Employment Growth
Summary
Versus Other BC Industry
Sectors 2014
Versus Other Provincial
Tech Sectors 2014
Industry Wages
Versus Other BC Industry
Sectors 2014
Versus Other Provincial
Tech Sectors 2014
Summary
Employment in 2009 and 2012
Going deeper
Employment
Employing 84000 people in 2012 the BC technology industry continued to outperform resource-based
industries such as forestry mining and oil and gas
Source Profile of the British Columbia High Technology Sector BC Stats March 2014
$
Retail amp Wholesale Trade 344
341
184
187
114
122
111
117
97
103
84
84
80
78
67
75
2009 2012
Accomodation amp Food Services
Construction
Finance Insurance amp Real Estate
Transportation amp Warehousing
Technology
Manufacturing
Forestry Mining OilGas amp Utilities
In 2012tech emmore p
than thforestrymining
and gaand ut
industcombi
copy 2014 KPMG LLP a Canadian limited liabi lity partnership and a member firm of the KPMG network of independent member
firms affiliated with KPMG International Cooperative (ldquoKPMG Internationalrdquo) a Swiss entity All rights reserved
014 KPMG LLP a Canadian limited liabi lity partnership and a member firm of the KPMG network of independent member
s affiliated with KPMG International Cooperative (ldquoKPMG Internationalrdquo) a Swiss entity All rights reserved
British Columbia Technology Report Card 2014 British Columbia Technology Report Card
Industry Profile and Comparative Analysis Industry Profile and Comparative An
8102019 BC Technology Report Card 2014 Edition
httpslidepdfcomreaderfullbc-technology-report-card-2014-edition 1427
owever while the technology sector experienced the third highest growth in employment among all
e industries in BC between 1999 and 2012 employment has been flat since 2009 9
or reference the min ing oil amp gas and extraction industr y which experienced the highest growth in employment between 1999 and 2012 started
t one-sixth the employment level of the technology industry in the base year 1999 and remains significantly lower in 2012 at 22000 employees
101
68
38
35
ndash44
ndash14
6
16
22
32
1101009080706050403020100ndash10ndash20ndash30ndash40ndash50
Mining Oil and Gas Extraction
Construction
Technology
ccomodation amp Food Services
Retail amp Wholesale Trade
Transportation amp Warehousing
ance Insurance amp Real Estate
Utilities
Manufacturing
Forestry
mployment Growth between 1999 and 2012
urce Profile of the British Columbia High Technology Sector BC Stats March 2014
The tech
sector hasexperiencedthe thirdhighestgrowth in
employmentin the provincesince 1999However
growth hasbeen minimalsince 2009
Some companies suggested that employment had in fact grown in more recent years and that
the demand for talent is as high as ever assertions which would not be reflected in data ending at
2012 It was also suggested that companies have been employing personnel outside the province
due in the part to limited talent availability in certain areas ndash another factor which is not captured by
the analysis On the other hand leaders from larger BC technology companies supported the view
that employment growth has slowed driven by productivity gains and a focus on better utilizing
existing employees
Deeper analysis of the employment data suggests variation in the employment trend by industry sector
and firm size For example between 2009 and 2012 there was a notable decline in employment in
BCrsquos ldquomotion picture and post-productionrdquo sector This was compensated for however by healthy
employment growth in other t ech sectors such as ldquoengineering and other servicesrdquo
Industry leaders have also predicted industry growth since 2013 again an assertion which our
data would not reflect
Industry Insights on Employment Trends
Technology Jobs per 100000 Population
Canada Tech Industry GDP per Person Employed
Source Profile of the British Columbia High Technology Sector BC Stats March 2014
Source KPMG analysis of data from Profile of the British Columbia High Technology Sector BC Stats March 2014
On a per capita basis BCrsquos technology sector employment has remained stable since 2009 at
approximately 18 percent below the Canadian average
The improvement in GDP concurrent with flat employment numbers implies that BC is the only province
where technology labour productivity has potentially improved over the last five years
3000
2500
2000
1500
1000
2002 2003 2004 2005 2006 2007 2008 2009 2010 2011 2012
CanadaOnt ar io QueacutebecBritish Columbia Alberta
$180000
$170000
$160000
$150000
$140000
$130000
$120000
$110000
$100000
2007 2008 2009 2010 2011 2012
CanadaO ntar io Q ueacute be cBritish Columbia Alberta
BC tecemplo
per capbeen ssince 2
014 KPMG LLP a Canadian limit ed liability par tnership and a member firm of the KPMG network of independent member
s affiliated with KPMG International Cooperative (ldquoKPMG Internationalrdquo) a Swiss entity All rights reserved
copy 2014 KPMG LLP a Canadian limit ed liability par tnership and a member firm of the KPMG network of independent member
firms affiliated with KPMG International Cooperative (ldquoKPMG Internationalrdquo) a Swiss entity All rights reserved
British Columbia Technology Report Card 2014 British Columbia Technology Report Card
Industry Profile and Comparative Analysis Industry Profile and Comparative An
8102019 BC Technology Report Card 2014 Edition
httpslidepdfcomreaderfullbc-technology-report-card-2014-edition 1527
dustry Wages
nce the 2012 report card BCrsquos technology industry has seen rapid wage growth relative to the average
age in all other provincial industries In 2012 the average tech wage was 66 percent higher than the
erage for the economy as a whole compared with 58 percent in 2009
ationally the real weekly wage in BCrsquos technology industry has grown by twice as much as the Canadian
erage Moreover in 2012 BCrsquos technology industry wage was higher than the Canadian average and
mparable to the level in Ontario However BC continues to trail Alberta in this regard where technology
bs pay 20 percent higher and are comparable to US levels This is consistent with the overall trend in
ages in Alberta which are typically higher than BCrsquos across most industries
verage Earnings minus BC Technology versus BC
eal Weekly Wages (in 2012 prices)
0000
0000
0000
0000
0000
0000
0000
0000
2002 2003 2004 2005 2006 2007 2008 2009 2010 2011 2012
BC TechnologyBC All Industries
$0
urce KPMG analysis of data from Profile of the British Columbia High Technology Sector BC Stats March 2014
urce KPMG analysis of data from Profile of the British Columbia High Technology Sector BC Stats March 2014 and Statistics Canada
NSIM Table 326-0021
600
200
800
400
000
2002 2003 2004 2005 2006 2007 2008 2009 2010 2011 2012
CanadaQueacutebecOntarioAlbertaBritish Columbia US
BC tech jobsearn 66 percentmore than theBC average
salary
BC has higherpaying tech jobs than
the Canadianindustry asa whole
Exports
BC tech industry exports have experienced growth since the 2012 report card however there is room
for significant improvement when it comes to accessing new markets Globally the technology industrytends to be highly mobile since enterprises need not have operations in close proximity to their product
and service markets international trade becomes very important BC tech has the potential to make
significant progress on the global front since its current export performance is poor relative to the
Canadian industry as a whole and it has not experienced any significant growth over the last decade10
10 The data and a nalysis presented in this section is based on the best available data to date However service exports data may be an
underestimate of the true level of service exports As noted by BC Stats data for service exports is challenging to measure since it cannot
be tracked through customs databases Instead it is estimated using surveys and other information available to BC Stats (Profile of the
British Columbia High Technology Sector 2013)
Comparison of Exports
Industry Exports
Summary
Industry Exports Growth
Versus Other BC Industry Sectors 2014
While in theory the rise of the real wage reflects rising productivity there are likely other factors
at play in BCrsquos tech industry Some industry leaders interviewed by KPMG suggested that the
rising cost of living in BC is putting significant upward pressure on compensation Others pointed
to market distortions in specific types of jobs such as software development caused by the entry
of multinational firms that are willing to pay above-market rates to attract talent
Industry Insights on Wage Trends
014 KPMG LLP a Canadian limit ed liability par tnership and a member firm of the KPMG network of independent member
s affiliated with KPMG International Cooperative (ldquoKPMG Internationalrdquo) a Swiss entity All rights reserved
copy 2014 KPMG LLP a Canadian limit ed liability par tnership and a member firm of the KPMG network of independent member
firms affiliated with KPMG International Cooperative (ldquoKPMG Internationalrdquo) a Swiss entity All rights reserved
British Columbia Technology Report Card 2014 British Columbia Technology Report Card
Industry Profile and Comparative Analysis Industry Profile and Comparative An
8102019 BC Technology Report Card 2014 Edition
httpslidepdfcomreaderfullbc-technology-report-card-2014-edition 1627
oing deeper
2012 the BC technology industry exported $3 billion in goods and services with services accounting
r two-thirds of this amount ndash a ratio that has remained fairly constant over time11 Over the last
cade technology exports have grown very slowly and this growth has been notably poor in the
ars since the recession Between 2009 and 2012 while total exports from BC grew by 20 percent
C technology exports grew by only 5 percent
Data for BCrsquos technology services exports have been revised significantly downwards by BC Stats for the years since 2006 Therefore the
updated analysis of exports may not be consistent with the findings of the 2012 report card
500
000
500
000500
000
$500
$02 00 2 2 00 3
Goods Services
2004 2005 2006 2007 2008 2009 2010 2011 2012
C Technology Exports
urce Profile of the British Columbia High Technology Sector BC Stats July 2011
Exports of BC
tech goodsand serviceshave been
relativelystable
The technology industry comprises 65 percent of BCrsquos total exports ndash a figure relatively proportional
to its share of the provinci al GDP Of the total goods and ser vices exported the te ch industryrsquos share
of services is much higher than that of goods although its share has declined by 35 percent compared
to 2012 findings12
12 Based on the revised services export data published by BC Stats it is found that BC technologyrsquos share of total service exports in 2009 was
lower than the figure reported in the 2012 report card (it was 20 percent instead of 32 percent)
70
60
50
40
30
20
10
0
2001 2002 2003 2004 2005 2006 2007 2008 2009
B ri ti sh C ol um bi a C an ad a
Tech Exports (as a of Tech GDP)
Technol ogy O ther I ndustr ies
BC ExportShare
65
935
BC GDPShare
76
924
BC Goods Export Share
BC Services Export Share
13
3
87
97
$16 billion
$31 billion
Source Profile of the British Columbia High Technology Sector BC Stats March 2014
Source Profile of the British Columbia High Technology Sector BC Stats March 2014
However as a percentage of its output BC tech exports a smaller share than the Canadian tech
industry as a whole which implies that our export intensity is lower than that of tech industries in
other provinces
BC tecof provexport
proporto its sthe proeconom
BC tecexport28 perc
its totain 2009compa40 percoutput
exportethe Ca
technoindustr
copy 2014 KPMG LLP a Canadian limit ed liability par tnership and a member firm of the KPMG network of independent member
firms affiliated with KPMG International Cooperative (ldquoKPMG Internationalrdquo) a Swiss entity All rights reserved
014 KPMG LLP a Canadian limited liabi lity partnership and a member firm of the KPMG network of independent member
s affiliated with KPMG International Cooperative (ldquoKPMG Internationalrdquo) a Swiss entity All rights reserved
British Columbia Technology Report Card 2014 British Columbia Technology Report Card
Industry Profile and Comparative Analysis Industry Profile and Comparative An
8102019 BC Technology Report Card 2014 Edition
httpslidepdfcomreaderfullbc-technology-report-card-2014-edition 1727
om a trade balance perspective BC continues to be a significant net importer of technology goods
th the majority originating in the Pacific Rim The magnitude of these imports indicates there is local
mand for certain types of technology goods not being met by local supply
hile detailed trade data for technology services is lacking for BC a closer examination of technology
ods data reveals further insights
terms of exports while the US continues to be the largest consumer of BC technology goods there
s been a significant trend in market diversification towards the Pacific Rim and other countries over
e past decade
C Tech Goods Exports and Imports
urce Profile of the British Columbia High Technology Sector BC Stats March 2014
urce Profile of the British Columbia High Technology Sector BC Stats March 2014
Goods Exports Goods Imports
2002 2003 2004 2005 2006 2007 2008 2009 2010 2011 2012
$5000
$4000
$3000
$2000
$1000
$0
The share oftechnology
goods exportsfrom BC to theUS has beendeclining
BC imports$5 billionworth of
technologygoods whilegeneratingonly $1 billionin exports
Economic Performance Indicators ndash Summary
Current economic performance indicators largely confirm the findings of the 2012 report card
BC technology performs strongly compared to other provincial industries but continues to trail the
technology industries in other provinces To gain more perspective around the ldquowhyrdquo of these results
the following section analyzes inputs to the BC tech industry and highlights the root drivers of its
economic performance
Export readiness and the ability to successfully access new markets are closely correlated to firm
capacities Smaller companies often lack the resources capital and expertise necessary to readily
exploit new markets
The underperformance in BC tech exports relative to other provinces is likely related to the
overweighting of small and very small technology companies in BC Industry leaders observed
that smaller companies often require access to local early-adopter customers as a proving ground
before expanding to new markets As such both corporations and government agencies can play
an important role by helping improve product designmarketing processes and serving as a critical
reference customer
Despite this many BC tech companies find their productsservices are better received in foreign
markets than at home Even among leading companies very few indicate they have much or any
business with BC-based customers
Unlike the US there is as yet no funding set aside by provincial or federal governments to procure
locally from small businesses In fact in some cases the government procurement process has
minimum requirements that are beyond the capabilities of smaller companies
The tech industry is global and in many segments fiercely competitive Successfully growing
exports requires both financial capacity and management expertise ndash issues that BC tech
companies face regularly
Industry Insights on Exports and Market Access
014 KPMG LLP a Canadian limit ed liability par tnership and a member firm of the KPMG network of independent member
s affiliated with KPMG International Cooperative (ldquoKPMG Internationalrdquo) a Swiss entity All rights reserved
copy 2014 KPMG LLP a Canadian limit ed liability par tnership and a member firm of the KPMG network of independent member
firms affiliated with KPMG International Cooperative (ldquoKPMG Internationalrdquo) a Swiss entity All rights reserved
British Columbia Technology Report Card 2014 British Columbia Technology Report Card
Industry Profile and Comparative Analysis Industry Profile and Comparative An
8102019 BC Technology Report Card 2014 Edition
httpslidepdfcomreaderfullbc-technology-report-card-2014-edition 1827
art B Industry Input Indicatorshile the BC technology industry continues to perform well compared to other BC industries it continues
underperform relative to the technology industries in other provinces ndash although the gap is being
osed It is also generally behind the tech sectors of the countries in the Organization for Economic
o-operation and Development (OECD) particularly in the areas of t alent venture capital investment
d research and development (RampD) all of which are necessary growth drivers A closer assessment
BCrsquos technology industry inputs offers a glimpse into key areas of weakness and highlights areas
here appropriate targeted investment may serve to underwrite the sectorrsquos future performance
rt of the noted underperformance can be attributed to the capacity constraints of BC firms Populated
th small enterprises BC tech firms have a limited ability to raise capital investment invest in RampD
crease the available talent pool collaborate with post-secondary research institutes and build
ellectual property
C Technology Industry ndash 2014 Report Card
Talent Availability
Industr y Input Indicator s Ver sus O ther Provincial Tech Sectors 2014
Grade
Access to Capital
Research and Development
Intellectual Property
Cndash
bull Low talent availability ndash BC lags other provinces in granting engineering and sciences degrees
at both the undergraduate and graduate levels and is well below the OECD average in granting
technical doctoral degrees
bull Lack of venture capital investment ndash While BC has a relatively healthy level of angel
investment venture capital investment is largely lacking or insufficient
bull Lagging RampD investment ndash BC fares poorly compared to other provinces and OECD countries
on the level of RampD invested as a percentage of output Of particular concern is the declining
level of business expenditure on RampD which is already behind other jurisdictions
bull Fewer patents ndash BCrsquos level of patents granted lags other provinces and OECD countries on
both a per capita basis and as a percent of applications filed
Highlights
Talent Availability
Talent is a critical resource for the technology sector feeding the innovation and creativity that in turn
drive the global industry From information amp communications technology to engineering amp other
services to life sciences each sector relies on the availability of a skill-specific talent pool to meet
existing business demands and generate new growth ideas The technical skills required by the industry
are primarily developed at higher education institutions then nurtured within the industry The number of
degrees awarded in a province is therefore a useful measure of the technical talent available for firms
to draw on
While there has been an improvement in the granting of degrees in math and computer science in
BC relative to other provinces we continue to lag in the granting of degrees in other technical fields
BC fares particularly poorly in the architecture and engineering fields and underperforms the Canadian
average in life sciences Moreover BCrsquos performance has fallen relative to other OECD countries in the
granting of technical PhDs
Talent Availability
Undergraduate Degrees
Industry Input Indicators
Summary
Undergraduate Technology Degrees
Graduate Technology Degrees
Versus other Provincial Tech Sectors 2014
014 KPMG LLP a Canadian limit ed liability par tnership and a member firm of the KPMG network of independent member
s affiliated with KPMG International Cooperative (ldquoKPMG Internationalrdquo) a Swiss entity All rights reserved
copy 2014 KPMG LLP a Canadian limited liabi lity partnership and a member firm of the KPMG network of independent member
firms affiliated with KPMG International Cooperative (ldquoKPMG Internationalrdquo) a Swiss entity All rights reserved
British Columbia Technology Report Card 2014 British Columbia Technology Report Card
Industry Profile and Comparative Analysis Industry Profile and Comparative An
8102019 BC Technology Report Card 2014 Edition
httpslidepdfcomreaderfullbc-technology-report-card-2014-edition 1927
oing deeper
illed labour availability in BC as measured by the level of undergraduate degrees granted per capita
iled only Ontario in 2012 having grown steadily over the last three years13
Data for Queacutebec has been revised downwards significantly by BC Stats Undergraduate degrees per 100000 population was lower than the
evel in BC up to 2008 and remains that way till 2011
urce Profile of the British Columbia High Technology Sector BC Stats March 2014
0
0
0
0
0
0
0
20022001 2003 2004 2005 2006 2007 2008 2009 2010 2011
O ntar io Q ueacute be cBritish Columbia Alberta
ndergraduate Degrees per 100000 Population
nnual Undergraduate Degrees per 100000 Population 2011
owever in terms of the relevance of those degrees to the technology industry BC continues to
il other provinces on average For both undergraduate and graduate degrees BC is well behind the
nadian average and the degree rates of other provinces in the fields of architecture and engineering
e province is also behind the Canadian average in the granting of undergraduate and graduate degrees
the physical and life sciences disciplines Only in the fields of math computer science and information
ence has there been a positive trend since 2009 with BC now second only to Ontario in granting
th undergraduate and graduate degrees in these disciplines
Queacutebec Ont ario Alberta Brit ish ColumbiaCanada
0
0
0
0
0
0
0
0Undergraduate
Degrees ndash Architecture and
Engineering
Undergraduate
Degrees ndash Physical
and Life Sciences
Undergraduate
Degrees ndash Math Computer
and Information Science
BC produces thesecond highest
number ofundergraduateson a per capitabasis butcontinues to
trail Ontariosignificantly
Globally Canadarsquos rate of granting technology-related doctoral degrees per 1000 population in the
reference age cohort is well below the OECD average Since 2009 the level in Canada remained
the same at 12 percent while the OECD average improved slightly to 16 percent KPMG estimates
that BCrsquos rate of doctoral degrees of 06 percent also did not change since the last estimate in
2009 meaning a deficit of 60 percent versus other OECD jurisdictions More concerning yet is that
many of the countries that trailed Canada and British Columbia in 2000 had surpassed us by 2011
(eg Italy Iceland and Greece)
Source Profile of the British Columbia High Technology Sector BC Stats March 2014
Source KPMG Analysis and OECD Science Technology and Industry Scorecard 2013 OECD 2013
urce Profile of the British Columbia High Technology Sector BC Stats March 2014
Technology Related Doctoral Degrees as Percentage of Population in Reference Age Cohort
Annual Graduate Degrees per 100000 Population 2011
Queacutebec Ontario Alberta British ColumbiaCanada
300
250
200
150
100
50
00Graduate Degrees ndash
Architecture andEngineering
Graduate Degrees ndash Physicaland Life Sciences
Graduate Degrees ndash MathComputer and Information Science
014 KPMG LLP a Canadian limit ed liability par tnership and a member firm of the KPMG network of independent member
s affiliated with KPMG International Cooperative (ldquoKPMG Internationalrdquo) a Swiss entity All rights reserved
copy 2014 KPMG LLP a Canadian limit ed liability par tnership and a member firm of the KPMG network of independent member
firms affiliated with KPMG International Cooperative (ldquoKPMG Internationalrdquo) a Swiss entity All rights reserved
British Columbia Technology Report Card 2014 British Columbia Technology Report Card
Industry Profile and Comparative Analysis Industry Profile and Comparative An
8102019 BC Technology Report Card 2014 Edition
httpslidepdfcomreaderfullbc-technology-report-card-2014-edition 2027
Access to Capital
ccess to risk capital throughout the growth cycle is one of
e most significant determinants of tech sector success
has been empirically established that companies that
ceive risk capital have a significantly higher survival rate
perience stronger revenue employee wage and asset
owth and invest in higher levels of RampD 14
e BC technology industry has had a healthy growth in
gel investment which typically takes the form of seed
pital that helps in the emergence of start-ups However
rly stage venture capital investment ndash a necessary fuel
r growing start-ups into thriving companies ndash is deficient
BC and has been declining in recent years And of the
early stage venture capital that is invested there has
been a decline in the share invested by local funds which
deprives companies not only of adequate risk capital but
also of the guidance and networking opportunities that
are essential in early growth stages At the same time
BC companies attract a significant amount of foreign and
extra-provincial investment at the later stages of growth
Together these findings suggest that small technology firms
in BC are limited in their ability to access timely risk capital
that can propel their growth and firms that successfully
attract foreign venture capital may be at risk of relocating
outside BC
These findings can be explored in detail in the recent study by CVCA and Industry Canada titled ldquoThe Performance of Canadian Firms that
Received Venture Capital Financingrdquo published in June 2013
ccess to Capital
Access to Angel Investment
Summary
Access to Venture Capital
Are at Versus Other Provincial Tech Sectors 2014
Industry leaders almost universally agreed that access
to talent has become the most significant issue facing
their firms They cite a tightening of talent availability
over the past few years growing shortages in certain
key technical areas including software and web
development and a need to expand the available talent
pool in areas such as industrial technologies and sales
and marketing as critical issues
The challenges in talent availability have been exacerbated
by the arrival or impending arrival of several multinational
firms on the BC tech scene With a relatively constrained
talent pool the competition for available resources has
increased and with it compensation levels have risen
Several of the larger US-based multinationals are offering
compensation packages at significant premiums over the
average compensation levels in the BC market leading
to growing talent development attraction and retention
challenges for smaller BC companies In some cases this
has led to BC-based companies establishing or growing
their operations outside of BC where talent is less
expensive and more available
Leaders agreed that long-term industry success will
require an expanded talent pool developed by improving
the quantity and quality (job-readiness) of post-secondary
degree programs as well as by attracting talent from
outside of BC and Canada
The high cost of real estate was cited as a primary
barrier to attracting outside talent particularly where
mid- and senior-level management must be relocated
As a result companies are looking at alternative ways
of addressing relocation costs and at targeting talentmarkets where the cost differential or the expectation
of home ownership are less
Industry Insights on Talent Availability
In recent years the vast majority of venture capital invested in BC was in later stage financing Early
stage venture capital is significantly more limited and has been declining over the last few years
Capital by Stage of Investment
Venture Capital by Stage of Investment
Going deeper
BC has experienced steady growth in the level of angel investments in the province since the mid-2000s
Venture capital investment on the other hand has been more volatile
Source CVCA and BCTIA analysis of Thompson Reuters Data
Source CVCA and BCTIA analysis of Thompson Reuters Data
$0
$100
$200
$300
4
2003
$40
$110
2004
$31
$254
2005
$32
$226
2006
$54
$298
2007
$54
$316
2008
$64
$260
2009
$67
$141
2010
$72
$223
2011
$87
$233
2012
$97
$201
Ve ntur e C ap ital Ang el
$ m i l l i o n
$0
$100
$200
$300
$51
$172
$43
$190
$16
$185
2010 2011 2012
VC Later Stage VC Early Stage
$ m i l l i o n
014 KPMG LLP a Canadian limit ed liability par tnership and a member firm of the KPMG network of independent member
s affiliated with KPMG International Cooperative (ldquoKPMG Internationalrdquo) a Swiss entity All rights reserved
copy 2014 KPMG LLP a Canadian limit ed liability par tnership and a member firm of the KPMG network of independent member
firms affiliated with KPMG International Cooperative (ldquoKPMG Internationalrdquo) a Swiss entity All rights reserved
British Columbia Technology Report Card 2014 British Columbia Technology Report Card
Industry Profile and Comparative Analysis Industry Profile and Comparative An
8102019 BC Technology Report Card 2014 Edition
httpslidepdfcomreaderfullbc-technology-report-card-2014-edition 2127
verall BC placed second to last in the level of total venture capital invested among the 20 North
merican jurisdictions examined This is particularly concerning as the technology industry is inherently
obile and decisions regarding the location of operations can be significantly influenced by structural
ctors such as access to capital rather than the presence of local demand
e decline in locally sourced early stage capital is particularly concerning given its importance At the
me time a significant share of later stage investment originates from foreign sources which presents
potential risk that firms may subsequently relocate outside of BC
urce CVCA and BCTIA analysis of Thompson Reuters Data
urce KPMG Analysis of Thomson Reuters Data
$million
$33
$18
$11
$32
$0
$10
$20
$30
$40
2010 2011 2012
$3
$12
CanadianForeign
arly Stage VC Investment by Source
enture Capital Investments 2012
C a
l i f o r n
i a
M a s s e c
h u s e t t s
N e w
Y o r k
T e x a s
W a s
h i n g t o n
M a r y
l a n
d
U t a
h
O h i o
N e w
J e r s e y
O n t a r i o
V i r g i n i a
Q u e
b e c
B r i t i s
h C o
l u m
b i a
P e n n s y
l v a n
i a
I l l i n o
i s
A r i z o n a
C o
l o r a
d o
G e o r g
i a
M i n n e s o t a
M i c h i g a n
V C P e r
C a p
i t a -
$
$500
$450
$400
$350
$300
$250
$200
$150
$100
$50
$0
$6000
$5000
$4000
$3000
$2000
$1000
$0
VC per capita 2012Venture Capital 2012
Locallysourced earlystage VC
investmenthas beendeclining
Research and Development
RampD expenditure is the long-term investment in an industryrsquos future economic performance It measures
commitment to using innovation and knowledge creation to enhance productivity and improve competitiveness
Over the last few years there has been little increase in overall RampD investment in BC As such it
ranks below Ontario and Queacutebec However the composition of RampD spending has changed over time
with the share of business investment in RampD experiencing a steady decline The fact that the industry
is populated with small firms with fewer than 50 employees can help explain this trend BC is host to
very few large anchor companies that have the revenues and the capital to spend in significant ways
on research for the purposes of enhancing competitiveness
Research and Development
Summary
BERD as a Percentage of GDP
RampD as a Percentage of GDP
Versus other Provincial Tech Sectors 2014
The technology industry leaders interviewed recognized that there is a healthy local angel
network in BC However early stage venture capital financing in BC is seen as either absent
or modest making it difficult for small companies to grow There is a sense that attracting
venture capital from out-of-province is also challenging because physical proximity is an
important investment factor
Overall the opinion was that the limited presence of venture capital in BC leads to an absence
of investment competition which impacts competitive valuation and terms Industry leaders also
noted that local venture capital funds often take a revenue-based valuation approach Paradoxically
this may mean that a company can be valued higher by an angel investor prior to earning any
revenue than by an institutional investor once it starts generating revenue Since angel investors
typically expect high returns on initial investment this may make it difficult for small companies
to raise subsequent rounds of institutional financing often leaving them with prospects of
constrained growth due to limited capitalization or the option of selling early This lack of breadth
in the capital pool can lead to a vicious cycle of limited company growth and depressed valuations
of small companies seeking funding
Industry Insights on Risk Capital Investment
014 KPMG LLP a Canadian limit ed liability par tnership and a member firm of the KPMG network of independent member
s affiliated with KPMG International Cooperative (ldquoKPMG Internationalrdquo) a Swiss entity All rights reserved
copy 2014 KPMG LLP a Canadian limit ed liability par tnership and a member firm of the KPMG network of independent member
firms affiliated with KPMG International Cooperative (ldquoKPMG Internationalrdquo) a Swiss entity All rights reserved
British Columbia Technology Report Card 2014 British Columbia Technology Report Card
Industry Profile and Comparative Analysis Industry Profile and Comparative An
8102019 BC Technology Report Card 2014 Edition
httpslidepdfcomreaderfullbc-technology-report-card-2014-edition 2227
BC total RampD spending as a percent of GDP has remained relatively constant since 2008 Other
ovinces experienced a slight decline in this metric While BC remains higher than Alberta in this
gard it still makes up only 60 percent of the RampD expenditure levels in Ontario and Queacutebec
oing deeper
$3 billion there was no significant increase in the total RampD expenditure in BC since 2008 although
e composition of the spending changed The share of higher education and private non-profit
penditure continued to grow from 39 percent in 2008 to 43 percent in 2010 while that of business
terprise shrank by an equivalent amount to 53 percent in 2010
urce Profile of the British Columbia High Technology Sector BC Stats March 2014
urce Profile of the British Columbia High Technology Sector BC Stats March 2014
0
500
1000
1500
2000
2500
3000
3500
2000 2001 2002 2003 2004 2005 2006 2007 2008 2009 2010
Business Enterprise Higher Education amp Private Non-Profit
F ed er al Go vt P ro vin ci al Go ve rn me nt amp Re se ar ch In st it ut ion s
ampD Expenditures in British Columbia
ampD as a Percent of GDP
000
050
100
150
200
250
300
2007 2008 2009 2010
Ont ar io QueacutebecBritish Columbia Alberta
Overall RampDinvestment in
BC has beenconstant withan increase
in highereducation
spendingequal to thereductionin business
investmentin RampD
BCrsquos levelof RampD as apercentageof GDP has
been constantbut remains40 percent
lower thanOntario and
Queacutebec
Source KPMG Analysis of BC Stats Data and OECD Science Technology and Industry Scorecard 2013 OECD 2013
RampD Expenditure as a Percent of GDP
Since the last report card BC did not improve its global standing in RampD intensity as it continues
to perform 40 percent below the OECD average
I S R
K O R
F I N
J P N
S
W E
C H E
D N K
D E U
U S A
A U T
S V N
I S L
O E C D
E S T
F R A
C H N
B E L
O N
A U S
E
U 2 8
N L D
C Z E
G B R
L U X
C A N
I R L
N O R
P R T
B C
E S P
Z A F
I T A
H
U N
N Z L
R U S
M
E X
T U R
P O L
S V K
C H L
0
1
2
3
4
5
2011 2001
Q C
The BERD (business expenditures on RampD) ratio ndash which reflects the level of industry commitment
within the technology industry ndash has fallen for all provinces since 2008 BC still performs better than
Alberta with its businesses contributing 078 percent of GDP to RampD investment but remains well
below Queacutebec and Ontario which contribute 142 percent and 109 percent respectively
Source Profile of the British Columbia High Technology Sector BC Stats March 2014
Business Expenditure on RampD as a Percent of GDP
0
05
10
15
20
2007 2008 2009 2010
P e r c e n t o f G D P
CanadaOntario QueacutebecBritish Columbia Alberta
BusineRampD apercen
of GDPis 20 plower tCanad
BC fell below averageexpendpercent
014 KPMG LLP a Canadian limit ed liability par tnership and a member firm of the KPMG network of independent member
s affiliated with KPMG International Cooperative (ldquoKPMG Internationalrdquo) a Swiss entity All rights reserved
copy 2014 KPMG LLP a Canadian limit ed liability par tnership and a member firm of the KPMG network of independent member
firms affiliated with KPMG International Cooperative (ldquoKPMG Internationalrdquo) a Swiss entity All rights reserved
British Columbia Technology Report Card 2014 British Columbia Technology Report Card
Industry Profile and Comparative Analysis Industry Profile and Comparative An
8102019 BC Technology Report Card 2014 Edition
httpslidepdfcomreaderfullbc-technology-report-card-2014-edition 2327
0
0
0
0
0
0
0
0
0
I S R K O R F I N J
P N S W E C
H E D N K
D E U
U S A
A U T
S V N I S L
O E C D E
S T F R A
C H N B
E L A U S
E U 2 8 I R L C
Z E G B R
L U X
C A N N
L D N O R B C
H U N E
S P P R T I T A R
U S N Z L
Z A F
T U R
S V K
P O L
M E X
C H L
2011 2001
usiness Expenditure on RampD as a Percent of GDP
Crsquos BERD remained 50 percent below the OECD average and did not experience any change from the
01 level This means between 2001 and 2011 BC was surpassed by countries like China and Australia
their level of BERD investment as a p ercent of GDP
urce KPMG Analysis of BC Stats Data and OECD Science Technology and Industry Scorecard 2011 OECD 2011
BusinessRampD in BCis one-thirdthe level of
leading OECDcountries
Going deeper
Compared to other provinces with significant technology industries BC continues to trail in terms of both
the number of patents filed and the number of patents granted on both an absolute and per capita basis
Intellectual Property
Canadian Patents Filed and Granted
Source Canadian Patent Office
Intellectual Property
Intellectual property is a bellwether of the inventory of assets that can be commercialized to underwrite
future economic performance As measured by the number of patent applications submitted and
granted intellectual property reflects the success of RampD investment in the development of innovative
products provides an indication of the commercial viability of research and provides an indication of the
competitiveness of the technology industry as a whole Consistent with the findings of the 2012 report
card BC still ranks well below all other provinces with significant technology industries in the level of
patents awarded both on a per capita basis and as a percentage of applications filed
Patents Granted
Versus Other Provincial Tech Sectors 2014
Summary
0
500
1000
1500
2000
2500
Patents Filed ndash2011
Patents Filedndash2012
Patents Granted ndash2011
Patents Granted ndash2012
Ontario Queacutebec Alberta British Columbia
copy 2014 KPMG LLP a Canadian limit ed liability par tnership and a member firm of the KPMG network of independent member
firms affiliated with KPMG International Cooperative (ldquoKPMG Internationalrdquo) a Swiss entity All rights reserved
014 KPMG LLP a Canadian limited liabi lity partnership and a member firm of the KPMG network of independent member
s affiliated with KPMG International Cooperative (ldquoKPMG Internationalrdquo) a Swiss entity All rights reserved
British Columbia Technology Report Card 2014 British Columbia Technology Report Card
Industry Profile and Comparative Analysis Industry Profile and Comparative An
8102019 BC Technology Report Card 2014 Edition
httpslidepdfcomreaderfullbc-technology-report-card-2014-edition 2427
ore telling is the fact that BC has had the lowest level of patents awarded as a percent of applications
er the last decade
e prevalence of small firms in the BC technology sector has a direct impact on the capacity of
mpanies to successfully pursue patents Not only do they have limited capacity to invest in RampD to
velop patentable innovations but their capital constraints limit their ability to access the legal and
ministrative expertise needed to execute patent applications
atents Awarded per 100000 Population
atents Granted as a Percent of Patent Applications
urce Profile of the British Columbia High Technology Sector BC Stats March 2014
urce Profile of the British Columbia High Technology Sector BC Stats March 2014
00
00
00
00
00
00
00
00
00
2001 2002 2003 2004 2005 2006 2007 2008 2009 2010 2011
CanadaO ntar io Q ueacute be cBritish Columbia Alberta
2001 2002 2003 2004 2005 2006 2007 2008 2009 2010 2011
CanadaO ntar io Q ueacute be cBritish Columbia Alberta
BCrsquos patentperformancesignificantlytrails otherprovinces
Canada still ranks 18th well behind the worldrsquos leading countries in terms of the number of triadic
patent families per million population ndash a measure of patents taken at three major patent offices in
the world KPMGrsquos estimate for BC places it even further down the list than it was in 200815
Triadic Patent Families per Million Population 2010
Source KPMG Analysis of BC Stats Data and OECD Science Technology and Industry Scorecard 2013 OECD 2013
15 KPMG estimated BCrsquos ranking on the chart by considering the relative proportions of patents awarded in BC versus Canada as a whole on
a per capita basis
0
20
40
60
80
100
1
I D N
I N D
B R A
T U R
R U S
C H L
Z A F
C H N
P O L
S V K
G R C
C Z E
P R T
H U N
E S P
E S T
S V N
W L D
B C
I S L
N Z L
I T A
A U S
I R L
C A N
N O R
G B R
L U X
O E C D
B E L
F R A
K O R
I S R
U S A
A U T
N L D
D N K
F I N D E U
S W E
C H E
J P N
M E X
BCrsquos paperform
is one-the levleadingcountr
014 KPMG LLP a Canadian limit ed liability par tnership and a member firm of the KPMG network of independent member
s affiliated with KPMG International Cooperative (ldquoKPMG Internationalrdquo) a Swiss entity All rights reserved
copy 2014 KPMG LLP a Canadian limited liabi lity partnership and a member firm of the KPMG network of independent member
firms affiliated with KPMG International Cooperative (ldquoKPMG Internationalrdquo) a Swiss entity All rights reserved
British Columbia Technology Report Card 2014 British Columbia Technology Report Card
Industry Profile and Comparative Analysis Industry Profile and Comparative An
8102019 BC Technology Report Card 2014 Edition
httpslidepdfcomreaderfullbc-technology-report-card-2014-edition 2527
he technology industry not only generates GDP employment and income
ithin the technology sectors (referred to as direct impact) it also brings
dditional benefits to the overall BC economy by supporting suppliers to
e industry (indirect impact) and through the re-spending of labour income
arned in technology and supplier industries (induced impact)
ur economic impact analysis indicates that the overall impact of the technology industry on the BConomy is significantly magnified by the indirect and induced impacts We estimate that based on
rrent technology industry revenues of $23 billion the total contribution to the BC economy is
$23 ndash $26 billion in GDP
165000 ndash 188000 jobs created or sustained
$10 ndash $12 billion in total labour income
ese high levels of economic benefits are consistent with an industry that is high value-add employs
ghly skilled workers pays high wages and is well integrated in the economy 16
s noted earlier in the report while the technology industry has made a significant contribution to the
C economy our province still trails other Canadian provinces and US jurisdictions in this respect For
ample the BC technology ind ustry current ly comprises 76 percent of provincial GDP compared to
3 percent contribut ed by the US technology industry to US GDP So what would happen if the BC
chnology industry grew to comprise 103 percent of the provincial economy
ur analysis indicates that growing to 103 percent of the provincial economy would bring an additional
1B in BC technology industry revenues and an associated increase of $91B ndash 102B in total
DP 65K ndash 74K additional jobs created or sustained and a $41B ndash 46B increa se in labour
come These estimates include the combined benefits of the direct indirect and induced impacts
the economy
Economic ImpactAssessment
sti mating the technology industry economic impact is challenging due to the lack of standard technology industry classificati ons and
corresponding technology-specific impact multipliers To estimate the impact KPMG used weighted averages of standard industry sector impact
multipliers based on the definition of sectors comprising the tech industry We have chosen to represent the impacts as ranges using different
sectoral weights The use of ranges reflects the inherent variability in the technology industry caused by the diversity of sectors that it comprises
For example a dollar worth of output in the tech industry will have a different economic impact depending on whether it is generated by the
software publishing sector the telecommunication sector or the motion picture and post-production sector In our analysis of direct impacts we
have used figures reported by BC Stats To estimate the indirect and induced impacts we have used industry-standard multipliers developed by
Statistics Canada
Going deeper
Current BC Technology Industry Economic Impact
Given that the industry generated $23 billion in revenues we estimate that the industry contributed
$23 ndash $26 billion to total GDP created or sustained 165000 ndash 188000 jobs an d delivered $10 ndash $12 billion
to total labour income This impact breaks down in direct indirect and induced impact as follows
Current BC Tech Industry Impact
GDP
JOBS
LABOUR INCOME
$23 Bin Tech Industry
Revenues
Direct Impact Indirect Impact Induced Impact Total Impact
$15B
84K
$6B
$4B ndash 5B
43K ndash 52K
$4B ndash 6B
39K ndash 52K
$2B ndash 3B
$23B ndash 26B
165K ndash 188K
$10B ndash 12B$23B ndash 3B
BC Technology Industry Economic Impact Multipliers
In order to compare the technology industry to other industries as well as forecast the impact of
industry growth we have estimated the technology industry impact per dollar of revenue
We find that for each dollar of technology industry revenue the industry generates $1 ndash $112 in total
GDP and $045 ndash $05 in total labo ur income Further for each million dollars in te chnology industr y
revenue the industry generates or sustains seven to eight jobs in BC This impact breaks down in
direct indirect and induced impact as follows
Economic Impact Multiplier Estimates
GDP ($)
$1in Tech Revenues
For each
$1M in Tech Revenues
For each
Direct Impact Indirect Impact Induced Impact Total Impact
065 016 ndash 022 019 ndash 025 100 ndash 112
JOBS 362 186 ndash 228 168 ndash 226 716 ndash 817
LABOUR INCOME ($) 027 010 ndash 013 008 ndash 011 045 ndash 050
014 KPMG LLP a Canadian limit ed liability par tnership and a member firm of the KPMG network of independent member
s affiliated with KPMG International Cooperative (ldquoKPMG Internationalrdquo) a Swiss entity All rights reserved
copy 2014 KPMG LLP a Canadian limit ed liability par tnership and a member firm of the KPMG network of independent member
firms affiliated with KPMG International Cooperative (ldquoKPMG Internationalrdquo) a Swiss entity All rights reserved
British Columbia Technology Report Card
Economic Impact Assess
8102019 BC Technology Report Card 2014 Edition
httpslidepdfcomreaderfullbc-technology-report-card-2014-edition 2627
GDP
JOBS
LABOUR INCOME
$91 BTech Revenues
Additional
Direct Impact Indirect Impact Induced Impact Total Impact
$59B
33K
$25B
$15B ndash 2B
17K ndash 21K
$09B ndash 12B
$17B ndash 23B
15K ndash 21K
$07B ndash 10B
$91B ndash 102B
65K ndash 74K
$41B ndash 46B
Economic Impact of BC Technology Industry Growth
demonstrate the magnitude of potential economic benefit from growing the BC technology industry
e chose to estimate these benefits in the context of a specific growth figure As shown in the GDP
alysis section of this report BC trails significantly many US states as well as the US average in terms
the share of the technology industry to the economy as a whole We asked the question ndash what
ould be the economic impact if we caught up to the US average
e US technology industr y contributes 103 percen t to the overall US GDP as compared to 76 percent
ntributed by the BC technology industry to the BC economy To reach the current contribution level
the US the BC technology industr y will need to add an additional $6 B in GDP corresponding to an
ditional $9B in technology industry revenues (given current industry multipliers)
ur analysis indicates that growing to 103 percent of the provincial economy would bring an additional1B in BC technology indust ry revenues and an associ ated increase of $91B ndash 102B in total GDP
K ndash 74K additional jobs created or sustained and a $41B ndash 46B increase in labour income This
pact breaks down in direct indirect and induced impact as follows
conomic Impact of Growing the BC Technology Industry Contribution to Match the US
While this report card clearly demonstrates the tech
industryrsquos importance to BCrsquos economy itrsquos the possibilities
revealed that most command our attention And itrsquos in our
flaws that our future lies Despite the industryrsquos provincial
strength we trail our Canadian peers on a number of
metrics such as the availability of local venture capital
building field-specific talent pools and increasing firm size
But though these challenges are significant identifying
them ndash knowing what we have to do and where to apply our
resources investments and commitments ndash provides a clear
roadmap for improvement and sustainable success
Wersquore in a very good place The potential for BC tech to become
a major national and global player is right in front of us Indeed
a number of technology companies are already flourishing in
BC with significant operations owned or being built by
bull Canadarsquos largest defense company MDA
bull Canadarsquos largest cleantech company Westport
bull Worldrsquos largest machine-to-machine wireless company
Sierra Wireless
bull Canadarsquos largest social media management company
Hootsuite
bull The first commercial quantum computing company Dwave
bull And global leaders like Amazon Best Buy Boeing
Electronic Arts Microsoft IBM McKesson Sams
Schneider Electri c Sony Imageworks and SAP
As these and other companies have realized BC is o
the most vibrant start-up ecosystems anywhere in th
one that regularly translates great ideas creative tale
audacious vision into some of the hottest tech compaaround Itrsquos a dynamic environment teeming with bra
entrepreneurs who thrive on their peersrsquo global aspira
With this core of industry infrastructure top talent an
innovative thinking in place BC is well positioned to
the tech industryrsquos many emerging and evolving opp
Every powder keg however needs a fuse BC is a te
hot spot but we have to keep stoking the fires of in
ambition and talent to ensure the positive gains mad
2012 become major leaps the next time we take stoc
means we have to work together ndash emerging tech st
ups and major corporate players industry investors a
trend-setters policy makers and academic leaders al
we continue to improve in the key areas identified in
report we can keep building the momentum BC tech
to realize its provincial successes and gains on the n
and global scales
ConclusionTaking the next step together
AcknowledgementsKPMG would like to gratefully acknowledge the support of BC Stats in the development of this report
Our detailed statistical analysis would not have been possible without the rich collection of BC industry
data provided to us by BC Stats
014 KPMG LLP a Canadian limit ed liability par tnership and a member firm of the KPMG network of independent member
s affiliated with KPMG International Cooperative (ldquoKPMG Internationalrdquo) a Swiss entity All rights reserved
copy 2014 KPMG LLP a Canadian limit ed liability par tnership and a member firm of the KPMG network of independent member
firms affiliated with KPMG International Cooperative (ldquoKPMG Internationalrdquo) a Swiss entity All rights reserved
British Columbia Technology Report Card 2014 British Columbia Technology Report Card
Economic Impact Assessment Concl
8102019 BC Technology Report Card 2014 Edition
httpslidepdfcomreaderfullbc-technology-report-card-2014-edition 2727
KPMG in Canada provides Audit Tax and Advisory services We work closely with our clients
helping them to mitigate risks and grasp opportunities
KPMG in Canada is committed to our clients We have made considerable investments in regards to
personnel research and hard-won experience Through these investments we strive to be the best
in everything we do turning our experience and industry knowledge into real value for our clients
This is the KPMG Way
Contact us
For more information please contact your KPMG adviser or one of the following professionals
Anthony Lindsay
Partner Greater Vancouver Area Market Leader
Technology Media and Telecommunications
T 604-646-6379
E tdlindsaykpmgca
Slavi Diamandiev
Greater Vancouver Area
Economics Practice Leader
Management Consulting
T 604-673-4458
E sdiamandievkpmgca
Ed Zacharuk
Partner Greater Vancouver Area SRampED
Practice Leader
T 604-691-3201
E ezacharukkpmgca
Sukesh Kumar
Partner National Leader India Desk
T 604-527-3468
E skumarkpmgca
Walter Pela
Partner in Charge of Tax Services
Greater Vancouver Area
T 604-691-3193
E wpelakpmgca
Ian Wilshaw
Partner Greater Vancouver Area Market Leader
Private Equity
T 604-691-3557
E idwilshawkpmgca
The information contained herein is of a general nature and is not intended to address the circumstances of any particular individual or entity Although we endeavor to
provide accurate and timely information there can be no guarantee that such information is accurate as of the date it is received or that it will continue to be accurate in
the future No one should act on such information without appropriate professional advice after a thorough examination of the particular situation
kpmgcatmt
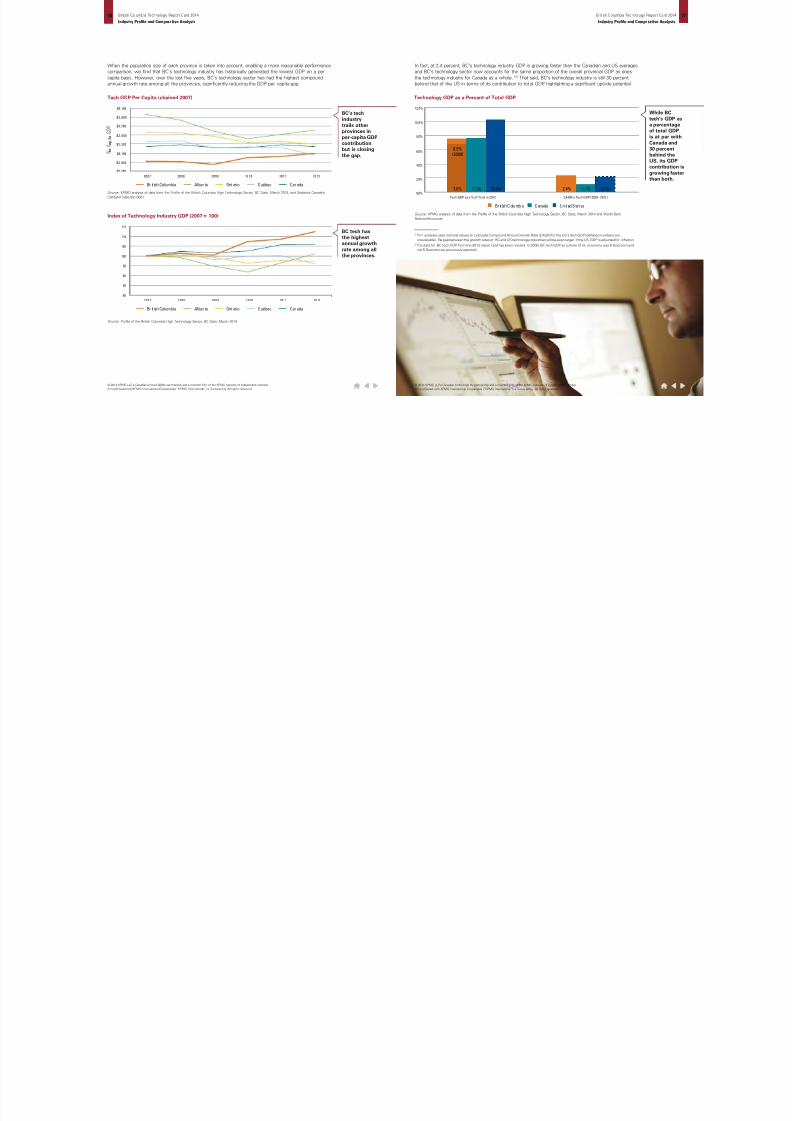
8102019 BC Technology Report Card 2014 Edition
httpslidepdfcomreaderfullbc-technology-report-card-2014-edition 1127
Going deeper
BCrsquos technology industry revenues have rebounded since the 2008 recession showing a higher
compound annual rate since 2009 (67 percent) than it did prior to 2009 (55 percent)78
hile BC has made progress since 2012 in terms of the size of the technology industry relative to the
erall economy there remains a significant opportunity for growth as evidenced by comparison to both
dividual US states as well as the US average
GDP originating in the technology sector 2011Comparison of Industry Revenues
BC Technology Revenues
0 5 10 15 20 25
Oregon
Washington
Colorado
California
assachusetts
New Mexico
Maryland
Indiana
w Hampshire
Virginia
Idaho
New Jersey
orth Carolina
US
Connecticut
Utah
Kansas
Vermont
Georgia
Arizona
Missouri
Texas
Minnesota
Pennsylvania
Canada
ish Columbia
urce Profile of the British Columbia High Technology Sector BC Stats
Source Profile of the British Columbia High Technology Sector BC Stats March 2014
Industry Revenues
The technology industry generates a significant revenue base in BC that has grown substantially over
the last few years However on a per capita basis technology continues to trail other provinces
Versus Other BC Industry
Sectors 2014
Versus Other Provincial
Tech Sectors 2014
Summary
Industry Revenues NA
Industry Revenue Growth
7 Revenue figures are not adjusted for inflation For inflation-adjusted output values please refer to the GDP section of this analysis
8 Industry revenue figures for BC were generated using revenue data by establishments That is for firms headquartered in BC
only the revenues generated from their BC operations are included in the revenue calculations
2 0 0
2
2 0 0 3
2 0 0 4
2 0 0 5
2 0 0 6
2007 2 0 0 8
2 0 0 9
2 0 1 0
2 0 1 1
2 0 1
2
130
141
152
169
179
200201
191
192
224
232
Industrevenuhave g
at 67 pon an abasis s
014 KPMG LLP a Canadian limit ed liability par tnership and a member firm of the KPMG network of independent member
s affiliated with KPMG International Cooperative (ldquoKPMG Internationalrdquo) a Swiss entity All rights reserved
copy 2014 KPMG LLP a Canadian limit ed liability par tnership and a member firm of the KPMG network of independent member
firms affiliated with KPMG International Cooperative (ldquoKPMG Internationalrdquo) a Swiss entity All rights reserved
British Columbia Technology Report Card 2014 British Columbia Technology Report Card
Industry Profile and Comparative Analysis Industry Profile and Comparative An
8102019 BC Technology Report Card 2014 Edition
httpslidepdfcomreaderfullbc-technology-report-card-2014-edition 1227
owever BCrsquos technology industry revenues continue to account for a lower share of overall Canadian
chnology industry revenue as compared to BCrsquos share of the Canadian population While the gap has
ghtly narrowed compared to our 2012 findings BC remains the only province among Queacutebec Ontario and
berta to show such a trend
oreover the sectorrsquos revenue growth rate continues to outperform the Canadian average although BC
s been surpassed by Alberta in this regard
200
180
160
140
120
100
80
2002 2003 2004 2005 2006 2007 2008 2009 2010 2011 2012
Bri tish Columbi a Al berta Ont ari o Queacutebec Canada
dex of Technology Industry Revenue (2002 = 100)
opulation and Technology Revenues as a Percent of Canadian Totals 2012
urce Profile of the British Columbia High Technology Sector BC Stats March 2014
urce KPMG analysis of data from the Profile of the British Columbia High Technology Sector BC Stats March 2014 and Statistics Canada
NSIM Table 051-0001
British ColumbiaAlbertaOntarioQueacutebec
0
0
0
0
0
Population 2012Technology Revenues 2012
BC techrevenuegrowth
continues tooutperformthe Canadianaverage
BC tech
continues totrail otherprovinces inper capita
revenueThis gap hasnarrowedslightly since
the 2012report card
Industry leaders interviewed by KPMG observed that a number of external factors have helped to
augment the growth of BCrsquos tech industry
bull Government programs such as the National Research Councilrsquos Industrial Research Assistance
Program (IRAP) the Scientific Research and Experimental Development (SRampED) program
and the Small Business Venture Capital program are significant industry drivers as they incent
investment in innovative technologies and create a healthy start-up climate Other agencies
such as the BC Bioener gy Network BC In novation Council BC Trade amp Investment NRC-IRAP
the Natural Sciences and Engineering Research Council (NSERC) Export Development Canada
Sustainable Development Technology Canada (SDTC) Western Economic Diversification (WED)
and the Department of Foreign Affairs and Trade Development (DFATD) provide funding support
and program resources to assist local start-ups
bull BC is a more cost effective place to do business The corporate income tax regime andsecurity and privacy regulations create a favourable investment environment and are attractive
to companies looking to set up operations
bull The close proximity of BC tech to US markets such as Seattle and Silicon Valley is seen as
an advantage and a major growth driver
bull In certain technology sectors (eg financial and business software mobilewireless
technologies and web-based and gaming technologies) growth has been supported by rich
talent pools available at a lower cost relative to US clusters such as Silicon Valley BC tech
companies have also demonstrated stronger employee retention rates when compared to
other jurisdictions in the US and globally
bull Last but not least there is a perception within the industry that the technology sector in BC is
a tightly knit cohesive community which helps attract creative people to grow their businesses
in this province
Industry insights on output growth
014 KPMG LLP a Canadian limit ed liability par tnership and a member firm of the KPMG network of independent member
s affiliated with KPMG International Cooperative (ldquoKPMG Internationalrdquo) a Swiss entity All rights reserved
copy 2014 KPMG LLP a Canadian limited liabi lity partnership and a member firm of the KPMG network of independent member
firms affiliated with KPMG International Cooperative (ldquoKPMG Internationalrdquo) a Swiss entity All rights reserved
British Columbia Technology Report Card 2014 British Columbia Technology Report Card
Industry Profile and Comparative Analysis Industry Profile and Comparative An
8102019 BC Technology Report Card 2014 Edition
httpslidepdfcomreaderfullbc-technology-report-card-2014-edition 1327
omparison of Employment
omparison of Wages
Employment and Wages
e number of jobs sustained by BCrsquos technology industry has grown significantly over the last
cade However this growth has slowed in recent years placing BC behind other provinces in terms
technology jobs per capita This slowdown in employment growth may be the result of gains in
oductivity where higher value is being created by each job in the province or it may be because a
eater proportion of out-of-province employees are being employed by BC companies
e real wage in BC has grown significantly Although this is potentially consistent with growth in
oductivity there are likely other important contributing factors such as the high cost of living in BC
age inflation caused by the arrival of new multinationals and the significant competition for certain
pes of talent In any case BC technology offers high paying jobs ndash not only relative to other BC
dustries but also to the Canadian average for technology
Industry Employment
Industry Employment Growth
Summary
Versus Other BC Industry
Sectors 2014
Versus Other Provincial
Tech Sectors 2014
Industry Wages
Versus Other BC Industry
Sectors 2014
Versus Other Provincial
Tech Sectors 2014
Summary
Employment in 2009 and 2012
Going deeper
Employment
Employing 84000 people in 2012 the BC technology industry continued to outperform resource-based
industries such as forestry mining and oil and gas
Source Profile of the British Columbia High Technology Sector BC Stats March 2014
$
Retail amp Wholesale Trade 344
341
184
187
114
122
111
117
97
103
84
84
80
78
67
75
2009 2012
Accomodation amp Food Services
Construction
Finance Insurance amp Real Estate
Transportation amp Warehousing
Technology
Manufacturing
Forestry Mining OilGas amp Utilities
In 2012tech emmore p
than thforestrymining
and gaand ut
industcombi
copy 2014 KPMG LLP a Canadian limited liabi lity partnership and a member firm of the KPMG network of independent member
firms affiliated with KPMG International Cooperative (ldquoKPMG Internationalrdquo) a Swiss entity All rights reserved
014 KPMG LLP a Canadian limited liabi lity partnership and a member firm of the KPMG network of independent member
s affiliated with KPMG International Cooperative (ldquoKPMG Internationalrdquo) a Swiss entity All rights reserved
British Columbia Technology Report Card 2014 British Columbia Technology Report Card
Industry Profile and Comparative Analysis Industry Profile and Comparative An
8102019 BC Technology Report Card 2014 Edition
httpslidepdfcomreaderfullbc-technology-report-card-2014-edition 1427
owever while the technology sector experienced the third highest growth in employment among all
e industries in BC between 1999 and 2012 employment has been flat since 2009 9
or reference the min ing oil amp gas and extraction industr y which experienced the highest growth in employment between 1999 and 2012 started
t one-sixth the employment level of the technology industry in the base year 1999 and remains significantly lower in 2012 at 22000 employees
101
68
38
35
ndash44
ndash14
6
16
22
32
1101009080706050403020100ndash10ndash20ndash30ndash40ndash50
Mining Oil and Gas Extraction
Construction
Technology
ccomodation amp Food Services
Retail amp Wholesale Trade
Transportation amp Warehousing
ance Insurance amp Real Estate
Utilities
Manufacturing
Forestry
mployment Growth between 1999 and 2012
urce Profile of the British Columbia High Technology Sector BC Stats March 2014
The tech
sector hasexperiencedthe thirdhighestgrowth in
employmentin the provincesince 1999However
growth hasbeen minimalsince 2009
Some companies suggested that employment had in fact grown in more recent years and that
the demand for talent is as high as ever assertions which would not be reflected in data ending at
2012 It was also suggested that companies have been employing personnel outside the province
due in the part to limited talent availability in certain areas ndash another factor which is not captured by
the analysis On the other hand leaders from larger BC technology companies supported the view
that employment growth has slowed driven by productivity gains and a focus on better utilizing
existing employees
Deeper analysis of the employment data suggests variation in the employment trend by industry sector
and firm size For example between 2009 and 2012 there was a notable decline in employment in
BCrsquos ldquomotion picture and post-productionrdquo sector This was compensated for however by healthy
employment growth in other t ech sectors such as ldquoengineering and other servicesrdquo
Industry leaders have also predicted industry growth since 2013 again an assertion which our
data would not reflect
Industry Insights on Employment Trends
Technology Jobs per 100000 Population
Canada Tech Industry GDP per Person Employed
Source Profile of the British Columbia High Technology Sector BC Stats March 2014
Source KPMG analysis of data from Profile of the British Columbia High Technology Sector BC Stats March 2014
On a per capita basis BCrsquos technology sector employment has remained stable since 2009 at
approximately 18 percent below the Canadian average
The improvement in GDP concurrent with flat employment numbers implies that BC is the only province
where technology labour productivity has potentially improved over the last five years
3000
2500
2000
1500
1000
2002 2003 2004 2005 2006 2007 2008 2009 2010 2011 2012
CanadaOnt ar io QueacutebecBritish Columbia Alberta
$180000
$170000
$160000
$150000
$140000
$130000
$120000
$110000
$100000
2007 2008 2009 2010 2011 2012
CanadaO ntar io Q ueacute be cBritish Columbia Alberta
BC tecemplo
per capbeen ssince 2
014 KPMG LLP a Canadian limit ed liability par tnership and a member firm of the KPMG network of independent member
s affiliated with KPMG International Cooperative (ldquoKPMG Internationalrdquo) a Swiss entity All rights reserved
copy 2014 KPMG LLP a Canadian limit ed liability par tnership and a member firm of the KPMG network of independent member
firms affiliated with KPMG International Cooperative (ldquoKPMG Internationalrdquo) a Swiss entity All rights reserved
British Columbia Technology Report Card 2014 British Columbia Technology Report Card
Industry Profile and Comparative Analysis Industry Profile and Comparative An
8102019 BC Technology Report Card 2014 Edition
httpslidepdfcomreaderfullbc-technology-report-card-2014-edition 1527
dustry Wages
nce the 2012 report card BCrsquos technology industry has seen rapid wage growth relative to the average
age in all other provincial industries In 2012 the average tech wage was 66 percent higher than the
erage for the economy as a whole compared with 58 percent in 2009
ationally the real weekly wage in BCrsquos technology industry has grown by twice as much as the Canadian
erage Moreover in 2012 BCrsquos technology industry wage was higher than the Canadian average and
mparable to the level in Ontario However BC continues to trail Alberta in this regard where technology
bs pay 20 percent higher and are comparable to US levels This is consistent with the overall trend in
ages in Alberta which are typically higher than BCrsquos across most industries
verage Earnings minus BC Technology versus BC
eal Weekly Wages (in 2012 prices)
0000
0000
0000
0000
0000
0000
0000
0000
2002 2003 2004 2005 2006 2007 2008 2009 2010 2011 2012
BC TechnologyBC All Industries
$0
urce KPMG analysis of data from Profile of the British Columbia High Technology Sector BC Stats March 2014
urce KPMG analysis of data from Profile of the British Columbia High Technology Sector BC Stats March 2014 and Statistics Canada
NSIM Table 326-0021
600
200
800
400
000
2002 2003 2004 2005 2006 2007 2008 2009 2010 2011 2012
CanadaQueacutebecOntarioAlbertaBritish Columbia US
BC tech jobsearn 66 percentmore than theBC average
salary
BC has higherpaying tech jobs than
the Canadianindustry asa whole
Exports
BC tech industry exports have experienced growth since the 2012 report card however there is room
for significant improvement when it comes to accessing new markets Globally the technology industrytends to be highly mobile since enterprises need not have operations in close proximity to their product
and service markets international trade becomes very important BC tech has the potential to make
significant progress on the global front since its current export performance is poor relative to the
Canadian industry as a whole and it has not experienced any significant growth over the last decade10
10 The data and a nalysis presented in this section is based on the best available data to date However service exports data may be an
underestimate of the true level of service exports As noted by BC Stats data for service exports is challenging to measure since it cannot
be tracked through customs databases Instead it is estimated using surveys and other information available to BC Stats (Profile of the
British Columbia High Technology Sector 2013)
Comparison of Exports
Industry Exports
Summary
Industry Exports Growth
Versus Other BC Industry Sectors 2014
While in theory the rise of the real wage reflects rising productivity there are likely other factors
at play in BCrsquos tech industry Some industry leaders interviewed by KPMG suggested that the
rising cost of living in BC is putting significant upward pressure on compensation Others pointed
to market distortions in specific types of jobs such as software development caused by the entry
of multinational firms that are willing to pay above-market rates to attract talent
Industry Insights on Wage Trends
014 KPMG LLP a Canadian limit ed liability par tnership and a member firm of the KPMG network of independent member
s affiliated with KPMG International Cooperative (ldquoKPMG Internationalrdquo) a Swiss entity All rights reserved
copy 2014 KPMG LLP a Canadian limit ed liability par tnership and a member firm of the KPMG network of independent member
firms affiliated with KPMG International Cooperative (ldquoKPMG Internationalrdquo) a Swiss entity All rights reserved
British Columbia Technology Report Card 2014 British Columbia Technology Report Card
Industry Profile and Comparative Analysis Industry Profile and Comparative An
8102019 BC Technology Report Card 2014 Edition
httpslidepdfcomreaderfullbc-technology-report-card-2014-edition 1627
oing deeper
2012 the BC technology industry exported $3 billion in goods and services with services accounting
r two-thirds of this amount ndash a ratio that has remained fairly constant over time11 Over the last
cade technology exports have grown very slowly and this growth has been notably poor in the
ars since the recession Between 2009 and 2012 while total exports from BC grew by 20 percent
C technology exports grew by only 5 percent
Data for BCrsquos technology services exports have been revised significantly downwards by BC Stats for the years since 2006 Therefore the
updated analysis of exports may not be consistent with the findings of the 2012 report card
500
000
500
000500
000
$500
$02 00 2 2 00 3
Goods Services
2004 2005 2006 2007 2008 2009 2010 2011 2012
C Technology Exports
urce Profile of the British Columbia High Technology Sector BC Stats July 2011
Exports of BC
tech goodsand serviceshave been
relativelystable
The technology industry comprises 65 percent of BCrsquos total exports ndash a figure relatively proportional
to its share of the provinci al GDP Of the total goods and ser vices exported the te ch industryrsquos share
of services is much higher than that of goods although its share has declined by 35 percent compared
to 2012 findings12
12 Based on the revised services export data published by BC Stats it is found that BC technologyrsquos share of total service exports in 2009 was
lower than the figure reported in the 2012 report card (it was 20 percent instead of 32 percent)
70
60
50
40
30
20
10
0
2001 2002 2003 2004 2005 2006 2007 2008 2009
B ri ti sh C ol um bi a C an ad a
Tech Exports (as a of Tech GDP)
Technol ogy O ther I ndustr ies
BC ExportShare
65
935
BC GDPShare
76
924
BC Goods Export Share
BC Services Export Share
13
3
87
97
$16 billion
$31 billion
Source Profile of the British Columbia High Technology Sector BC Stats March 2014
Source Profile of the British Columbia High Technology Sector BC Stats March 2014
However as a percentage of its output BC tech exports a smaller share than the Canadian tech
industry as a whole which implies that our export intensity is lower than that of tech industries in
other provinces
BC tecof provexport
proporto its sthe proeconom
BC tecexport28 perc
its totain 2009compa40 percoutput
exportethe Ca
technoindustr
copy 2014 KPMG LLP a Canadian limit ed liability par tnership and a member firm of the KPMG network of independent member
firms affiliated with KPMG International Cooperative (ldquoKPMG Internationalrdquo) a Swiss entity All rights reserved
014 KPMG LLP a Canadian limited liabi lity partnership and a member firm of the KPMG network of independent member
s affiliated with KPMG International Cooperative (ldquoKPMG Internationalrdquo) a Swiss entity All rights reserved
British Columbia Technology Report Card 2014 British Columbia Technology Report Card
Industry Profile and Comparative Analysis Industry Profile and Comparative An
8102019 BC Technology Report Card 2014 Edition
httpslidepdfcomreaderfullbc-technology-report-card-2014-edition 1727
om a trade balance perspective BC continues to be a significant net importer of technology goods
th the majority originating in the Pacific Rim The magnitude of these imports indicates there is local
mand for certain types of technology goods not being met by local supply
hile detailed trade data for technology services is lacking for BC a closer examination of technology
ods data reveals further insights
terms of exports while the US continues to be the largest consumer of BC technology goods there
s been a significant trend in market diversification towards the Pacific Rim and other countries over
e past decade
C Tech Goods Exports and Imports
urce Profile of the British Columbia High Technology Sector BC Stats March 2014
urce Profile of the British Columbia High Technology Sector BC Stats March 2014
Goods Exports Goods Imports
2002 2003 2004 2005 2006 2007 2008 2009 2010 2011 2012
$5000
$4000
$3000
$2000
$1000
$0
The share oftechnology
goods exportsfrom BC to theUS has beendeclining
BC imports$5 billionworth of
technologygoods whilegeneratingonly $1 billionin exports
Economic Performance Indicators ndash Summary
Current economic performance indicators largely confirm the findings of the 2012 report card
BC technology performs strongly compared to other provincial industries but continues to trail the
technology industries in other provinces To gain more perspective around the ldquowhyrdquo of these results
the following section analyzes inputs to the BC tech industry and highlights the root drivers of its
economic performance
Export readiness and the ability to successfully access new markets are closely correlated to firm
capacities Smaller companies often lack the resources capital and expertise necessary to readily
exploit new markets
The underperformance in BC tech exports relative to other provinces is likely related to the
overweighting of small and very small technology companies in BC Industry leaders observed
that smaller companies often require access to local early-adopter customers as a proving ground
before expanding to new markets As such both corporations and government agencies can play
an important role by helping improve product designmarketing processes and serving as a critical
reference customer
Despite this many BC tech companies find their productsservices are better received in foreign
markets than at home Even among leading companies very few indicate they have much or any
business with BC-based customers
Unlike the US there is as yet no funding set aside by provincial or federal governments to procure
locally from small businesses In fact in some cases the government procurement process has
minimum requirements that are beyond the capabilities of smaller companies
The tech industry is global and in many segments fiercely competitive Successfully growing
exports requires both financial capacity and management expertise ndash issues that BC tech
companies face regularly
Industry Insights on Exports and Market Access
014 KPMG LLP a Canadian limit ed liability par tnership and a member firm of the KPMG network of independent member
s affiliated with KPMG International Cooperative (ldquoKPMG Internationalrdquo) a Swiss entity All rights reserved
copy 2014 KPMG LLP a Canadian limit ed liability par tnership and a member firm of the KPMG network of independent member
firms affiliated with KPMG International Cooperative (ldquoKPMG Internationalrdquo) a Swiss entity All rights reserved
British Columbia Technology Report Card 2014 British Columbia Technology Report Card
Industry Profile and Comparative Analysis Industry Profile and Comparative An
8102019 BC Technology Report Card 2014 Edition
httpslidepdfcomreaderfullbc-technology-report-card-2014-edition 1827
art B Industry Input Indicatorshile the BC technology industry continues to perform well compared to other BC industries it continues
underperform relative to the technology industries in other provinces ndash although the gap is being
osed It is also generally behind the tech sectors of the countries in the Organization for Economic
o-operation and Development (OECD) particularly in the areas of t alent venture capital investment
d research and development (RampD) all of which are necessary growth drivers A closer assessment
BCrsquos technology industry inputs offers a glimpse into key areas of weakness and highlights areas
here appropriate targeted investment may serve to underwrite the sectorrsquos future performance
rt of the noted underperformance can be attributed to the capacity constraints of BC firms Populated
th small enterprises BC tech firms have a limited ability to raise capital investment invest in RampD
crease the available talent pool collaborate with post-secondary research institutes and build
ellectual property
C Technology Industry ndash 2014 Report Card
Talent Availability
Industr y Input Indicator s Ver sus O ther Provincial Tech Sectors 2014
Grade
Access to Capital
Research and Development
Intellectual Property
Cndash
bull Low talent availability ndash BC lags other provinces in granting engineering and sciences degrees
at both the undergraduate and graduate levels and is well below the OECD average in granting
technical doctoral degrees
bull Lack of venture capital investment ndash While BC has a relatively healthy level of angel
investment venture capital investment is largely lacking or insufficient
bull Lagging RampD investment ndash BC fares poorly compared to other provinces and OECD countries
on the level of RampD invested as a percentage of output Of particular concern is the declining
level of business expenditure on RampD which is already behind other jurisdictions
bull Fewer patents ndash BCrsquos level of patents granted lags other provinces and OECD countries on
both a per capita basis and as a percent of applications filed
Highlights
Talent Availability
Talent is a critical resource for the technology sector feeding the innovation and creativity that in turn
drive the global industry From information amp communications technology to engineering amp other
services to life sciences each sector relies on the availability of a skill-specific talent pool to meet
existing business demands and generate new growth ideas The technical skills required by the industry
are primarily developed at higher education institutions then nurtured within the industry The number of
degrees awarded in a province is therefore a useful measure of the technical talent available for firms
to draw on
While there has been an improvement in the granting of degrees in math and computer science in
BC relative to other provinces we continue to lag in the granting of degrees in other technical fields
BC fares particularly poorly in the architecture and engineering fields and underperforms the Canadian
average in life sciences Moreover BCrsquos performance has fallen relative to other OECD countries in the
granting of technical PhDs
Talent Availability
Undergraduate Degrees
Industry Input Indicators
Summary
Undergraduate Technology Degrees
Graduate Technology Degrees
Versus other Provincial Tech Sectors 2014
014 KPMG LLP a Canadian limit ed liability par tnership and a member firm of the KPMG network of independent member
s affiliated with KPMG International Cooperative (ldquoKPMG Internationalrdquo) a Swiss entity All rights reserved
copy 2014 KPMG LLP a Canadian limited liabi lity partnership and a member firm of the KPMG network of independent member
firms affiliated with KPMG International Cooperative (ldquoKPMG Internationalrdquo) a Swiss entity All rights reserved
British Columbia Technology Report Card 2014 British Columbia Technology Report Card
Industry Profile and Comparative Analysis Industry Profile and Comparative An
8102019 BC Technology Report Card 2014 Edition
httpslidepdfcomreaderfullbc-technology-report-card-2014-edition 1927
oing deeper
illed labour availability in BC as measured by the level of undergraduate degrees granted per capita
iled only Ontario in 2012 having grown steadily over the last three years13
Data for Queacutebec has been revised downwards significantly by BC Stats Undergraduate degrees per 100000 population was lower than the
evel in BC up to 2008 and remains that way till 2011
urce Profile of the British Columbia High Technology Sector BC Stats March 2014
0
0
0
0
0
0
0
20022001 2003 2004 2005 2006 2007 2008 2009 2010 2011
O ntar io Q ueacute be cBritish Columbia Alberta
ndergraduate Degrees per 100000 Population
nnual Undergraduate Degrees per 100000 Population 2011
owever in terms of the relevance of those degrees to the technology industry BC continues to
il other provinces on average For both undergraduate and graduate degrees BC is well behind the
nadian average and the degree rates of other provinces in the fields of architecture and engineering
e province is also behind the Canadian average in the granting of undergraduate and graduate degrees
the physical and life sciences disciplines Only in the fields of math computer science and information
ence has there been a positive trend since 2009 with BC now second only to Ontario in granting
th undergraduate and graduate degrees in these disciplines
Queacutebec Ont ario Alberta Brit ish ColumbiaCanada
0
0
0
0
0
0
0
0Undergraduate
Degrees ndash Architecture and
Engineering
Undergraduate
Degrees ndash Physical
and Life Sciences
Undergraduate
Degrees ndash Math Computer
and Information Science
BC produces thesecond highest
number ofundergraduateson a per capitabasis butcontinues to
trail Ontariosignificantly
Globally Canadarsquos rate of granting technology-related doctoral degrees per 1000 population in the
reference age cohort is well below the OECD average Since 2009 the level in Canada remained
the same at 12 percent while the OECD average improved slightly to 16 percent KPMG estimates
that BCrsquos rate of doctoral degrees of 06 percent also did not change since the last estimate in
2009 meaning a deficit of 60 percent versus other OECD jurisdictions More concerning yet is that
many of the countries that trailed Canada and British Columbia in 2000 had surpassed us by 2011
(eg Italy Iceland and Greece)
Source Profile of the British Columbia High Technology Sector BC Stats March 2014
Source KPMG Analysis and OECD Science Technology and Industry Scorecard 2013 OECD 2013
urce Profile of the British Columbia High Technology Sector BC Stats March 2014
Technology Related Doctoral Degrees as Percentage of Population in Reference Age Cohort
Annual Graduate Degrees per 100000 Population 2011
Queacutebec Ontario Alberta British ColumbiaCanada
300
250
200
150
100
50
00Graduate Degrees ndash
Architecture andEngineering
Graduate Degrees ndash Physicaland Life Sciences
Graduate Degrees ndash MathComputer and Information Science
014 KPMG LLP a Canadian limit ed liability par tnership and a member firm of the KPMG network of independent member
s affiliated with KPMG International Cooperative (ldquoKPMG Internationalrdquo) a Swiss entity All rights reserved
copy 2014 KPMG LLP a Canadian limit ed liability par tnership and a member firm of the KPMG network of independent member
firms affiliated with KPMG International Cooperative (ldquoKPMG Internationalrdquo) a Swiss entity All rights reserved
British Columbia Technology Report Card 2014 British Columbia Technology Report Card
Industry Profile and Comparative Analysis Industry Profile and Comparative An
8102019 BC Technology Report Card 2014 Edition
httpslidepdfcomreaderfullbc-technology-report-card-2014-edition 2027
Access to Capital
ccess to risk capital throughout the growth cycle is one of
e most significant determinants of tech sector success
has been empirically established that companies that
ceive risk capital have a significantly higher survival rate
perience stronger revenue employee wage and asset
owth and invest in higher levels of RampD 14
e BC technology industry has had a healthy growth in
gel investment which typically takes the form of seed
pital that helps in the emergence of start-ups However
rly stage venture capital investment ndash a necessary fuel
r growing start-ups into thriving companies ndash is deficient
BC and has been declining in recent years And of the
early stage venture capital that is invested there has
been a decline in the share invested by local funds which
deprives companies not only of adequate risk capital but
also of the guidance and networking opportunities that
are essential in early growth stages At the same time
BC companies attract a significant amount of foreign and
extra-provincial investment at the later stages of growth
Together these findings suggest that small technology firms
in BC are limited in their ability to access timely risk capital
that can propel their growth and firms that successfully
attract foreign venture capital may be at risk of relocating
outside BC
These findings can be explored in detail in the recent study by CVCA and Industry Canada titled ldquoThe Performance of Canadian Firms that
Received Venture Capital Financingrdquo published in June 2013
ccess to Capital
Access to Angel Investment
Summary
Access to Venture Capital
Are at Versus Other Provincial Tech Sectors 2014
Industry leaders almost universally agreed that access
to talent has become the most significant issue facing
their firms They cite a tightening of talent availability
over the past few years growing shortages in certain
key technical areas including software and web
development and a need to expand the available talent
pool in areas such as industrial technologies and sales
and marketing as critical issues
The challenges in talent availability have been exacerbated
by the arrival or impending arrival of several multinational
firms on the BC tech scene With a relatively constrained
talent pool the competition for available resources has
increased and with it compensation levels have risen
Several of the larger US-based multinationals are offering
compensation packages at significant premiums over the
average compensation levels in the BC market leading
to growing talent development attraction and retention
challenges for smaller BC companies In some cases this
has led to BC-based companies establishing or growing
their operations outside of BC where talent is less
expensive and more available
Leaders agreed that long-term industry success will
require an expanded talent pool developed by improving
the quantity and quality (job-readiness) of post-secondary
degree programs as well as by attracting talent from
outside of BC and Canada
The high cost of real estate was cited as a primary
barrier to attracting outside talent particularly where
mid- and senior-level management must be relocated
As a result companies are looking at alternative ways
of addressing relocation costs and at targeting talentmarkets where the cost differential or the expectation
of home ownership are less
Industry Insights on Talent Availability
In recent years the vast majority of venture capital invested in BC was in later stage financing Early
stage venture capital is significantly more limited and has been declining over the last few years
Capital by Stage of Investment
Venture Capital by Stage of Investment
Going deeper
BC has experienced steady growth in the level of angel investments in the province since the mid-2000s
Venture capital investment on the other hand has been more volatile
Source CVCA and BCTIA analysis of Thompson Reuters Data
Source CVCA and BCTIA analysis of Thompson Reuters Data
$0
$100
$200
$300
4
2003
$40
$110
2004
$31
$254
2005
$32
$226
2006
$54
$298
2007
$54
$316
2008
$64
$260
2009
$67
$141
2010
$72
$223
2011
$87
$233
2012
$97
$201
Ve ntur e C ap ital Ang el
$ m i l l i o n
$0
$100
$200
$300
$51
$172
$43
$190
$16
$185
2010 2011 2012
VC Later Stage VC Early Stage
$ m i l l i o n
014 KPMG LLP a Canadian limit ed liability par tnership and a member firm of the KPMG network of independent member
s affiliated with KPMG International Cooperative (ldquoKPMG Internationalrdquo) a Swiss entity All rights reserved
copy 2014 KPMG LLP a Canadian limit ed liability par tnership and a member firm of the KPMG network of independent member
firms affiliated with KPMG International Cooperative (ldquoKPMG Internationalrdquo) a Swiss entity All rights reserved
British Columbia Technology Report Card 2014 British Columbia Technology Report Card
Industry Profile and Comparative Analysis Industry Profile and Comparative An
8102019 BC Technology Report Card 2014 Edition
httpslidepdfcomreaderfullbc-technology-report-card-2014-edition 2127
verall BC placed second to last in the level of total venture capital invested among the 20 North
merican jurisdictions examined This is particularly concerning as the technology industry is inherently
obile and decisions regarding the location of operations can be significantly influenced by structural
ctors such as access to capital rather than the presence of local demand
e decline in locally sourced early stage capital is particularly concerning given its importance At the
me time a significant share of later stage investment originates from foreign sources which presents
potential risk that firms may subsequently relocate outside of BC
urce CVCA and BCTIA analysis of Thompson Reuters Data
urce KPMG Analysis of Thomson Reuters Data
$million
$33
$18
$11
$32
$0
$10
$20
$30
$40
2010 2011 2012
$3
$12
CanadianForeign
arly Stage VC Investment by Source
enture Capital Investments 2012
C a
l i f o r n
i a
M a s s e c
h u s e t t s
N e w
Y o r k
T e x a s
W a s
h i n g t o n
M a r y
l a n
d
U t a
h
O h i o
N e w
J e r s e y
O n t a r i o
V i r g i n i a
Q u e
b e c
B r i t i s
h C o
l u m
b i a
P e n n s y
l v a n
i a
I l l i n o
i s
A r i z o n a
C o
l o r a
d o
G e o r g
i a
M i n n e s o t a
M i c h i g a n
V C P e r
C a p
i t a -
$
$500
$450
$400
$350
$300
$250
$200
$150
$100
$50
$0
$6000
$5000
$4000
$3000
$2000
$1000
$0
VC per capita 2012Venture Capital 2012
Locallysourced earlystage VC
investmenthas beendeclining
Research and Development
RampD expenditure is the long-term investment in an industryrsquos future economic performance It measures
commitment to using innovation and knowledge creation to enhance productivity and improve competitiveness
Over the last few years there has been little increase in overall RampD investment in BC As such it
ranks below Ontario and Queacutebec However the composition of RampD spending has changed over time
with the share of business investment in RampD experiencing a steady decline The fact that the industry
is populated with small firms with fewer than 50 employees can help explain this trend BC is host to
very few large anchor companies that have the revenues and the capital to spend in significant ways
on research for the purposes of enhancing competitiveness
Research and Development
Summary
BERD as a Percentage of GDP
RampD as a Percentage of GDP
Versus other Provincial Tech Sectors 2014
The technology industry leaders interviewed recognized that there is a healthy local angel
network in BC However early stage venture capital financing in BC is seen as either absent
or modest making it difficult for small companies to grow There is a sense that attracting
venture capital from out-of-province is also challenging because physical proximity is an
important investment factor
Overall the opinion was that the limited presence of venture capital in BC leads to an absence
of investment competition which impacts competitive valuation and terms Industry leaders also
noted that local venture capital funds often take a revenue-based valuation approach Paradoxically
this may mean that a company can be valued higher by an angel investor prior to earning any
revenue than by an institutional investor once it starts generating revenue Since angel investors
typically expect high returns on initial investment this may make it difficult for small companies
to raise subsequent rounds of institutional financing often leaving them with prospects of
constrained growth due to limited capitalization or the option of selling early This lack of breadth
in the capital pool can lead to a vicious cycle of limited company growth and depressed valuations
of small companies seeking funding
Industry Insights on Risk Capital Investment
014 KPMG LLP a Canadian limit ed liability par tnership and a member firm of the KPMG network of independent member
s affiliated with KPMG International Cooperative (ldquoKPMG Internationalrdquo) a Swiss entity All rights reserved
copy 2014 KPMG LLP a Canadian limit ed liability par tnership and a member firm of the KPMG network of independent member
firms affiliated with KPMG International Cooperative (ldquoKPMG Internationalrdquo) a Swiss entity All rights reserved
British Columbia Technology Report Card 2014 British Columbia Technology Report Card
Industry Profile and Comparative Analysis Industry Profile and Comparative An
8102019 BC Technology Report Card 2014 Edition
httpslidepdfcomreaderfullbc-technology-report-card-2014-edition 2227
BC total RampD spending as a percent of GDP has remained relatively constant since 2008 Other
ovinces experienced a slight decline in this metric While BC remains higher than Alberta in this
gard it still makes up only 60 percent of the RampD expenditure levels in Ontario and Queacutebec
oing deeper
$3 billion there was no significant increase in the total RampD expenditure in BC since 2008 although
e composition of the spending changed The share of higher education and private non-profit
penditure continued to grow from 39 percent in 2008 to 43 percent in 2010 while that of business
terprise shrank by an equivalent amount to 53 percent in 2010
urce Profile of the British Columbia High Technology Sector BC Stats March 2014
urce Profile of the British Columbia High Technology Sector BC Stats March 2014
0
500
1000
1500
2000
2500
3000
3500
2000 2001 2002 2003 2004 2005 2006 2007 2008 2009 2010
Business Enterprise Higher Education amp Private Non-Profit
F ed er al Go vt P ro vin ci al Go ve rn me nt amp Re se ar ch In st it ut ion s
ampD Expenditures in British Columbia
ampD as a Percent of GDP
000
050
100
150
200
250
300
2007 2008 2009 2010
Ont ar io QueacutebecBritish Columbia Alberta
Overall RampDinvestment in
BC has beenconstant withan increase
in highereducation
spendingequal to thereductionin business
investmentin RampD
BCrsquos levelof RampD as apercentageof GDP has
been constantbut remains40 percent
lower thanOntario and
Queacutebec
Source KPMG Analysis of BC Stats Data and OECD Science Technology and Industry Scorecard 2013 OECD 2013
RampD Expenditure as a Percent of GDP
Since the last report card BC did not improve its global standing in RampD intensity as it continues
to perform 40 percent below the OECD average
I S R
K O R
F I N
J P N
S
W E
C H E
D N K
D E U
U S A
A U T
S V N
I S L
O E C D
E S T
F R A
C H N
B E L
O N
A U S
E
U 2 8
N L D
C Z E
G B R
L U X
C A N
I R L
N O R
P R T
B C
E S P
Z A F
I T A
H
U N
N Z L
R U S
M
E X
T U R
P O L
S V K
C H L
0
1
2
3
4
5
2011 2001
Q C
The BERD (business expenditures on RampD) ratio ndash which reflects the level of industry commitment
within the technology industry ndash has fallen for all provinces since 2008 BC still performs better than
Alberta with its businesses contributing 078 percent of GDP to RampD investment but remains well
below Queacutebec and Ontario which contribute 142 percent and 109 percent respectively
Source Profile of the British Columbia High Technology Sector BC Stats March 2014
Business Expenditure on RampD as a Percent of GDP
0
05
10
15
20
2007 2008 2009 2010
P e r c e n t o f G D P
CanadaOntario QueacutebecBritish Columbia Alberta
BusineRampD apercen
of GDPis 20 plower tCanad
BC fell below averageexpendpercent
014 KPMG LLP a Canadian limit ed liability par tnership and a member firm of the KPMG network of independent member
s affiliated with KPMG International Cooperative (ldquoKPMG Internationalrdquo) a Swiss entity All rights reserved
copy 2014 KPMG LLP a Canadian limit ed liability par tnership and a member firm of the KPMG network of independent member
firms affiliated with KPMG International Cooperative (ldquoKPMG Internationalrdquo) a Swiss entity All rights reserved
British Columbia Technology Report Card 2014 British Columbia Technology Report Card
Industry Profile and Comparative Analysis Industry Profile and Comparative An
8102019 BC Technology Report Card 2014 Edition
httpslidepdfcomreaderfullbc-technology-report-card-2014-edition 2327
0
0
0
0
0
0
0
0
0
I S R K O R F I N J
P N S W E C
H E D N K
D E U
U S A
A U T
S V N I S L
O E C D E
S T F R A
C H N B
E L A U S
E U 2 8 I R L C
Z E G B R
L U X
C A N N
L D N O R B C
H U N E
S P P R T I T A R
U S N Z L
Z A F
T U R
S V K
P O L
M E X
C H L
2011 2001
usiness Expenditure on RampD as a Percent of GDP
Crsquos BERD remained 50 percent below the OECD average and did not experience any change from the
01 level This means between 2001 and 2011 BC was surpassed by countries like China and Australia
their level of BERD investment as a p ercent of GDP
urce KPMG Analysis of BC Stats Data and OECD Science Technology and Industry Scorecard 2011 OECD 2011
BusinessRampD in BCis one-thirdthe level of
leading OECDcountries
Going deeper
Compared to other provinces with significant technology industries BC continues to trail in terms of both
the number of patents filed and the number of patents granted on both an absolute and per capita basis
Intellectual Property
Canadian Patents Filed and Granted
Source Canadian Patent Office
Intellectual Property
Intellectual property is a bellwether of the inventory of assets that can be commercialized to underwrite
future economic performance As measured by the number of patent applications submitted and
granted intellectual property reflects the success of RampD investment in the development of innovative
products provides an indication of the commercial viability of research and provides an indication of the
competitiveness of the technology industry as a whole Consistent with the findings of the 2012 report
card BC still ranks well below all other provinces with significant technology industries in the level of
patents awarded both on a per capita basis and as a percentage of applications filed
Patents Granted
Versus Other Provincial Tech Sectors 2014
Summary
0
500
1000
1500
2000
2500
Patents Filed ndash2011
Patents Filedndash2012
Patents Granted ndash2011
Patents Granted ndash2012
Ontario Queacutebec Alberta British Columbia
copy 2014 KPMG LLP a Canadian limit ed liability par tnership and a member firm of the KPMG network of independent member
firms affiliated with KPMG International Cooperative (ldquoKPMG Internationalrdquo) a Swiss entity All rights reserved
014 KPMG LLP a Canadian limited liabi lity partnership and a member firm of the KPMG network of independent member
s affiliated with KPMG International Cooperative (ldquoKPMG Internationalrdquo) a Swiss entity All rights reserved
British Columbia Technology Report Card 2014 British Columbia Technology Report Card
Industry Profile and Comparative Analysis Industry Profile and Comparative An
8102019 BC Technology Report Card 2014 Edition
httpslidepdfcomreaderfullbc-technology-report-card-2014-edition 2427
ore telling is the fact that BC has had the lowest level of patents awarded as a percent of applications
er the last decade
e prevalence of small firms in the BC technology sector has a direct impact on the capacity of
mpanies to successfully pursue patents Not only do they have limited capacity to invest in RampD to
velop patentable innovations but their capital constraints limit their ability to access the legal and
ministrative expertise needed to execute patent applications
atents Awarded per 100000 Population
atents Granted as a Percent of Patent Applications
urce Profile of the British Columbia High Technology Sector BC Stats March 2014
urce Profile of the British Columbia High Technology Sector BC Stats March 2014
00
00
00
00
00
00
00
00
00
2001 2002 2003 2004 2005 2006 2007 2008 2009 2010 2011
CanadaO ntar io Q ueacute be cBritish Columbia Alberta
2001 2002 2003 2004 2005 2006 2007 2008 2009 2010 2011
CanadaO ntar io Q ueacute be cBritish Columbia Alberta
BCrsquos patentperformancesignificantlytrails otherprovinces
Canada still ranks 18th well behind the worldrsquos leading countries in terms of the number of triadic
patent families per million population ndash a measure of patents taken at three major patent offices in
the world KPMGrsquos estimate for BC places it even further down the list than it was in 200815
Triadic Patent Families per Million Population 2010
Source KPMG Analysis of BC Stats Data and OECD Science Technology and Industry Scorecard 2013 OECD 2013
15 KPMG estimated BCrsquos ranking on the chart by considering the relative proportions of patents awarded in BC versus Canada as a whole on
a per capita basis
0
20
40
60
80
100
1
I D N
I N D
B R A
T U R
R U S
C H L
Z A F
C H N
P O L
S V K
G R C
C Z E
P R T
H U N
E S P
E S T
S V N
W L D
B C
I S L
N Z L
I T A
A U S
I R L
C A N
N O R
G B R
L U X
O E C D
B E L
F R A
K O R
I S R
U S A
A U T
N L D
D N K
F I N D E U
S W E
C H E
J P N
M E X
BCrsquos paperform
is one-the levleadingcountr
014 KPMG LLP a Canadian limit ed liability par tnership and a member firm of the KPMG network of independent member
s affiliated with KPMG International Cooperative (ldquoKPMG Internationalrdquo) a Swiss entity All rights reserved
copy 2014 KPMG LLP a Canadian limited liabi lity partnership and a member firm of the KPMG network of independent member
firms affiliated with KPMG International Cooperative (ldquoKPMG Internationalrdquo) a Swiss entity All rights reserved
British Columbia Technology Report Card 2014 British Columbia Technology Report Card
Industry Profile and Comparative Analysis Industry Profile and Comparative An
8102019 BC Technology Report Card 2014 Edition
httpslidepdfcomreaderfullbc-technology-report-card-2014-edition 2527
he technology industry not only generates GDP employment and income
ithin the technology sectors (referred to as direct impact) it also brings
dditional benefits to the overall BC economy by supporting suppliers to
e industry (indirect impact) and through the re-spending of labour income
arned in technology and supplier industries (induced impact)
ur economic impact analysis indicates that the overall impact of the technology industry on the BConomy is significantly magnified by the indirect and induced impacts We estimate that based on
rrent technology industry revenues of $23 billion the total contribution to the BC economy is
$23 ndash $26 billion in GDP
165000 ndash 188000 jobs created or sustained
$10 ndash $12 billion in total labour income
ese high levels of economic benefits are consistent with an industry that is high value-add employs
ghly skilled workers pays high wages and is well integrated in the economy 16
s noted earlier in the report while the technology industry has made a significant contribution to the
C economy our province still trails other Canadian provinces and US jurisdictions in this respect For
ample the BC technology ind ustry current ly comprises 76 percent of provincial GDP compared to
3 percent contribut ed by the US technology industry to US GDP So what would happen if the BC
chnology industry grew to comprise 103 percent of the provincial economy
ur analysis indicates that growing to 103 percent of the provincial economy would bring an additional
1B in BC technology industry revenues and an associated increase of $91B ndash 102B in total
DP 65K ndash 74K additional jobs created or sustained and a $41B ndash 46B increa se in labour
come These estimates include the combined benefits of the direct indirect and induced impacts
the economy
Economic ImpactAssessment
sti mating the technology industry economic impact is challenging due to the lack of standard technology industry classificati ons and
corresponding technology-specific impact multipliers To estimate the impact KPMG used weighted averages of standard industry sector impact
multipliers based on the definition of sectors comprising the tech industry We have chosen to represent the impacts as ranges using different
sectoral weights The use of ranges reflects the inherent variability in the technology industry caused by the diversity of sectors that it comprises
For example a dollar worth of output in the tech industry will have a different economic impact depending on whether it is generated by the
software publishing sector the telecommunication sector or the motion picture and post-production sector In our analysis of direct impacts we
have used figures reported by BC Stats To estimate the indirect and induced impacts we have used industry-standard multipliers developed by
Statistics Canada
Going deeper
Current BC Technology Industry Economic Impact
Given that the industry generated $23 billion in revenues we estimate that the industry contributed
$23 ndash $26 billion to total GDP created or sustained 165000 ndash 188000 jobs an d delivered $10 ndash $12 billion
to total labour income This impact breaks down in direct indirect and induced impact as follows
Current BC Tech Industry Impact
GDP
JOBS
LABOUR INCOME
$23 Bin Tech Industry
Revenues
Direct Impact Indirect Impact Induced Impact Total Impact
$15B
84K
$6B
$4B ndash 5B
43K ndash 52K
$4B ndash 6B
39K ndash 52K
$2B ndash 3B
$23B ndash 26B
165K ndash 188K
$10B ndash 12B$23B ndash 3B
BC Technology Industry Economic Impact Multipliers
In order to compare the technology industry to other industries as well as forecast the impact of
industry growth we have estimated the technology industry impact per dollar of revenue
We find that for each dollar of technology industry revenue the industry generates $1 ndash $112 in total
GDP and $045 ndash $05 in total labo ur income Further for each million dollars in te chnology industr y
revenue the industry generates or sustains seven to eight jobs in BC This impact breaks down in
direct indirect and induced impact as follows
Economic Impact Multiplier Estimates
GDP ($)
$1in Tech Revenues
For each
$1M in Tech Revenues
For each
Direct Impact Indirect Impact Induced Impact Total Impact
065 016 ndash 022 019 ndash 025 100 ndash 112
JOBS 362 186 ndash 228 168 ndash 226 716 ndash 817
LABOUR INCOME ($) 027 010 ndash 013 008 ndash 011 045 ndash 050
014 KPMG LLP a Canadian limit ed liability par tnership and a member firm of the KPMG network of independent member
s affiliated with KPMG International Cooperative (ldquoKPMG Internationalrdquo) a Swiss entity All rights reserved
copy 2014 KPMG LLP a Canadian limit ed liability par tnership and a member firm of the KPMG network of independent member
firms affiliated with KPMG International Cooperative (ldquoKPMG Internationalrdquo) a Swiss entity All rights reserved
British Columbia Technology Report Card
Economic Impact Assess
8102019 BC Technology Report Card 2014 Edition
httpslidepdfcomreaderfullbc-technology-report-card-2014-edition 2627
GDP
JOBS
LABOUR INCOME
$91 BTech Revenues
Additional
Direct Impact Indirect Impact Induced Impact Total Impact
$59B
33K
$25B
$15B ndash 2B
17K ndash 21K
$09B ndash 12B
$17B ndash 23B
15K ndash 21K
$07B ndash 10B
$91B ndash 102B
65K ndash 74K
$41B ndash 46B
Economic Impact of BC Technology Industry Growth
demonstrate the magnitude of potential economic benefit from growing the BC technology industry
e chose to estimate these benefits in the context of a specific growth figure As shown in the GDP
alysis section of this report BC trails significantly many US states as well as the US average in terms
the share of the technology industry to the economy as a whole We asked the question ndash what
ould be the economic impact if we caught up to the US average
e US technology industr y contributes 103 percen t to the overall US GDP as compared to 76 percent
ntributed by the BC technology industry to the BC economy To reach the current contribution level
the US the BC technology industr y will need to add an additional $6 B in GDP corresponding to an
ditional $9B in technology industry revenues (given current industry multipliers)
ur analysis indicates that growing to 103 percent of the provincial economy would bring an additional1B in BC technology indust ry revenues and an associ ated increase of $91B ndash 102B in total GDP
K ndash 74K additional jobs created or sustained and a $41B ndash 46B increase in labour income This
pact breaks down in direct indirect and induced impact as follows
conomic Impact of Growing the BC Technology Industry Contribution to Match the US
While this report card clearly demonstrates the tech
industryrsquos importance to BCrsquos economy itrsquos the possibilities
revealed that most command our attention And itrsquos in our
flaws that our future lies Despite the industryrsquos provincial
strength we trail our Canadian peers on a number of
metrics such as the availability of local venture capital
building field-specific talent pools and increasing firm size
But though these challenges are significant identifying
them ndash knowing what we have to do and where to apply our
resources investments and commitments ndash provides a clear
roadmap for improvement and sustainable success
Wersquore in a very good place The potential for BC tech to become
a major national and global player is right in front of us Indeed
a number of technology companies are already flourishing in
BC with significant operations owned or being built by
bull Canadarsquos largest defense company MDA
bull Canadarsquos largest cleantech company Westport
bull Worldrsquos largest machine-to-machine wireless company
Sierra Wireless
bull Canadarsquos largest social media management company
Hootsuite
bull The first commercial quantum computing company Dwave
bull And global leaders like Amazon Best Buy Boeing
Electronic Arts Microsoft IBM McKesson Sams
Schneider Electri c Sony Imageworks and SAP
As these and other companies have realized BC is o
the most vibrant start-up ecosystems anywhere in th
one that regularly translates great ideas creative tale
audacious vision into some of the hottest tech compaaround Itrsquos a dynamic environment teeming with bra
entrepreneurs who thrive on their peersrsquo global aspira
With this core of industry infrastructure top talent an
innovative thinking in place BC is well positioned to
the tech industryrsquos many emerging and evolving opp
Every powder keg however needs a fuse BC is a te
hot spot but we have to keep stoking the fires of in
ambition and talent to ensure the positive gains mad
2012 become major leaps the next time we take stoc
means we have to work together ndash emerging tech st
ups and major corporate players industry investors a
trend-setters policy makers and academic leaders al
we continue to improve in the key areas identified in
report we can keep building the momentum BC tech
to realize its provincial successes and gains on the n
and global scales
ConclusionTaking the next step together
AcknowledgementsKPMG would like to gratefully acknowledge the support of BC Stats in the development of this report
Our detailed statistical analysis would not have been possible without the rich collection of BC industry
data provided to us by BC Stats
014 KPMG LLP a Canadian limit ed liability par tnership and a member firm of the KPMG network of independent member
s affiliated with KPMG International Cooperative (ldquoKPMG Internationalrdquo) a Swiss entity All rights reserved
copy 2014 KPMG LLP a Canadian limit ed liability par tnership and a member firm of the KPMG network of independent member
firms affiliated with KPMG International Cooperative (ldquoKPMG Internationalrdquo) a Swiss entity All rights reserved
British Columbia Technology Report Card 2014 British Columbia Technology Report Card
Economic Impact Assessment Concl
8102019 BC Technology Report Card 2014 Edition
httpslidepdfcomreaderfullbc-technology-report-card-2014-edition 2727
KPMG in Canada provides Audit Tax and Advisory services We work closely with our clients
helping them to mitigate risks and grasp opportunities
KPMG in Canada is committed to our clients We have made considerable investments in regards to
personnel research and hard-won experience Through these investments we strive to be the best
in everything we do turning our experience and industry knowledge into real value for our clients
This is the KPMG Way
Contact us
For more information please contact your KPMG adviser or one of the following professionals
Anthony Lindsay
Partner Greater Vancouver Area Market Leader
Technology Media and Telecommunications
T 604-646-6379
E tdlindsaykpmgca
Slavi Diamandiev
Greater Vancouver Area
Economics Practice Leader
Management Consulting
T 604-673-4458
E sdiamandievkpmgca
Ed Zacharuk
Partner Greater Vancouver Area SRampED
Practice Leader
T 604-691-3201
E ezacharukkpmgca
Sukesh Kumar
Partner National Leader India Desk
T 604-527-3468
E skumarkpmgca
Walter Pela
Partner in Charge of Tax Services
Greater Vancouver Area
T 604-691-3193
E wpelakpmgca
Ian Wilshaw
Partner Greater Vancouver Area Market Leader
Private Equity
T 604-691-3557
E idwilshawkpmgca
The information contained herein is of a general nature and is not intended to address the circumstances of any particular individual or entity Although we endeavor to
provide accurate and timely information there can be no guarantee that such information is accurate as of the date it is received or that it will continue to be accurate in
the future No one should act on such information without appropriate professional advice after a thorough examination of the particular situation
kpmgcatmt
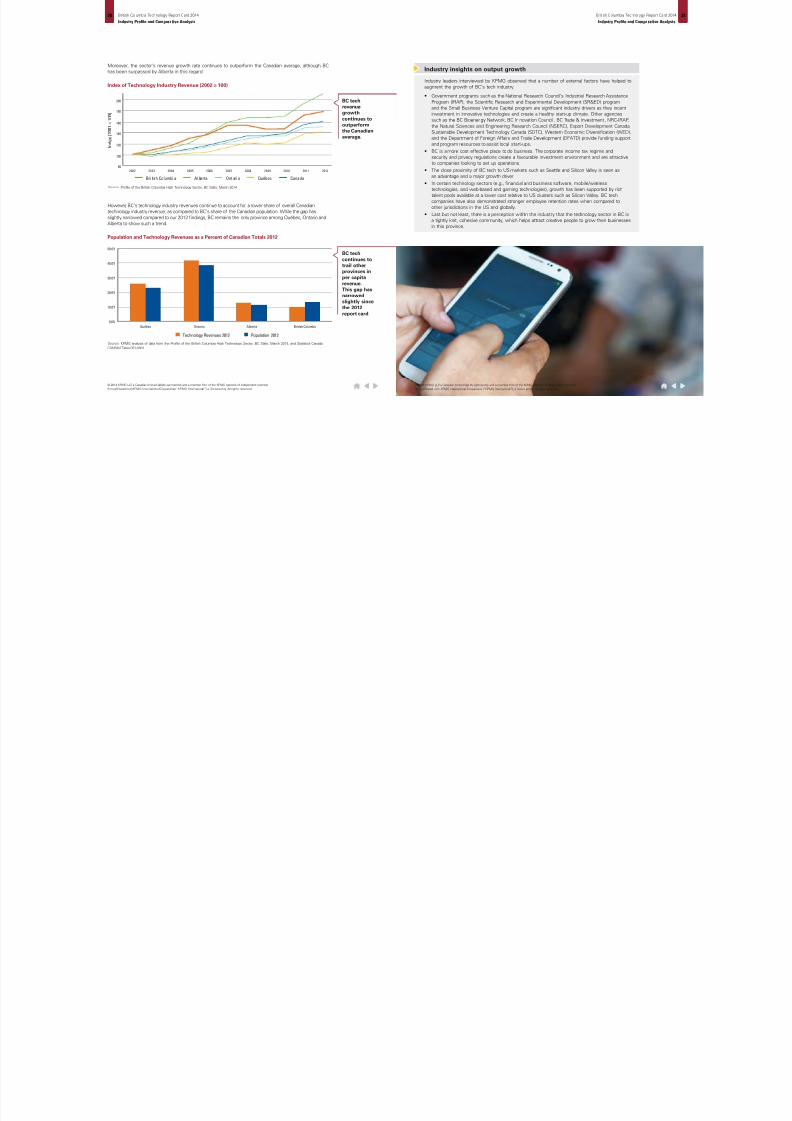
8102019 BC Technology Report Card 2014 Edition
httpslidepdfcomreaderfullbc-technology-report-card-2014-edition 1227
owever BCrsquos technology industry revenues continue to account for a lower share of overall Canadian
chnology industry revenue as compared to BCrsquos share of the Canadian population While the gap has
ghtly narrowed compared to our 2012 findings BC remains the only province among Queacutebec Ontario and
berta to show such a trend
oreover the sectorrsquos revenue growth rate continues to outperform the Canadian average although BC
s been surpassed by Alberta in this regard
200
180
160
140
120
100
80
2002 2003 2004 2005 2006 2007 2008 2009 2010 2011 2012
Bri tish Columbi a Al berta Ont ari o Queacutebec Canada
dex of Technology Industry Revenue (2002 = 100)
opulation and Technology Revenues as a Percent of Canadian Totals 2012
urce Profile of the British Columbia High Technology Sector BC Stats March 2014
urce KPMG analysis of data from the Profile of the British Columbia High Technology Sector BC Stats March 2014 and Statistics Canada
NSIM Table 051-0001
British ColumbiaAlbertaOntarioQueacutebec
0
0
0
0
0
Population 2012Technology Revenues 2012
BC techrevenuegrowth
continues tooutperformthe Canadianaverage
BC tech
continues totrail otherprovinces inper capita
revenueThis gap hasnarrowedslightly since
the 2012report card
Industry leaders interviewed by KPMG observed that a number of external factors have helped to
augment the growth of BCrsquos tech industry
bull Government programs such as the National Research Councilrsquos Industrial Research Assistance
Program (IRAP) the Scientific Research and Experimental Development (SRampED) program
and the Small Business Venture Capital program are significant industry drivers as they incent
investment in innovative technologies and create a healthy start-up climate Other agencies
such as the BC Bioener gy Network BC In novation Council BC Trade amp Investment NRC-IRAP
the Natural Sciences and Engineering Research Council (NSERC) Export Development Canada
Sustainable Development Technology Canada (SDTC) Western Economic Diversification (WED)
and the Department of Foreign Affairs and Trade Development (DFATD) provide funding support
and program resources to assist local start-ups
bull BC is a more cost effective place to do business The corporate income tax regime andsecurity and privacy regulations create a favourable investment environment and are attractive
to companies looking to set up operations
bull The close proximity of BC tech to US markets such as Seattle and Silicon Valley is seen as
an advantage and a major growth driver
bull In certain technology sectors (eg financial and business software mobilewireless
technologies and web-based and gaming technologies) growth has been supported by rich
talent pools available at a lower cost relative to US clusters such as Silicon Valley BC tech
companies have also demonstrated stronger employee retention rates when compared to
other jurisdictions in the US and globally
bull Last but not least there is a perception within the industry that the technology sector in BC is
a tightly knit cohesive community which helps attract creative people to grow their businesses
in this province
Industry insights on output growth
014 KPMG LLP a Canadian limit ed liability par tnership and a member firm of the KPMG network of independent member
s affiliated with KPMG International Cooperative (ldquoKPMG Internationalrdquo) a Swiss entity All rights reserved
copy 2014 KPMG LLP a Canadian limited liabi lity partnership and a member firm of the KPMG network of independent member
firms affiliated with KPMG International Cooperative (ldquoKPMG Internationalrdquo) a Swiss entity All rights reserved
British Columbia Technology Report Card 2014 British Columbia Technology Report Card
Industry Profile and Comparative Analysis Industry Profile and Comparative An
8102019 BC Technology Report Card 2014 Edition
httpslidepdfcomreaderfullbc-technology-report-card-2014-edition 1327
omparison of Employment
omparison of Wages
Employment and Wages
e number of jobs sustained by BCrsquos technology industry has grown significantly over the last
cade However this growth has slowed in recent years placing BC behind other provinces in terms
technology jobs per capita This slowdown in employment growth may be the result of gains in
oductivity where higher value is being created by each job in the province or it may be because a
eater proportion of out-of-province employees are being employed by BC companies
e real wage in BC has grown significantly Although this is potentially consistent with growth in
oductivity there are likely other important contributing factors such as the high cost of living in BC
age inflation caused by the arrival of new multinationals and the significant competition for certain
pes of talent In any case BC technology offers high paying jobs ndash not only relative to other BC
dustries but also to the Canadian average for technology
Industry Employment
Industry Employment Growth
Summary
Versus Other BC Industry
Sectors 2014
Versus Other Provincial
Tech Sectors 2014
Industry Wages
Versus Other BC Industry
Sectors 2014
Versus Other Provincial
Tech Sectors 2014
Summary
Employment in 2009 and 2012
Going deeper
Employment
Employing 84000 people in 2012 the BC technology industry continued to outperform resource-based
industries such as forestry mining and oil and gas
Source Profile of the British Columbia High Technology Sector BC Stats March 2014
$
Retail amp Wholesale Trade 344
341
184
187
114
122
111
117
97
103
84
84
80
78
67
75
2009 2012
Accomodation amp Food Services
Construction
Finance Insurance amp Real Estate
Transportation amp Warehousing
Technology
Manufacturing
Forestry Mining OilGas amp Utilities
In 2012tech emmore p
than thforestrymining
and gaand ut
industcombi
copy 2014 KPMG LLP a Canadian limited liabi lity partnership and a member firm of the KPMG network of independent member
firms affiliated with KPMG International Cooperative (ldquoKPMG Internationalrdquo) a Swiss entity All rights reserved
014 KPMG LLP a Canadian limited liabi lity partnership and a member firm of the KPMG network of independent member
s affiliated with KPMG International Cooperative (ldquoKPMG Internationalrdquo) a Swiss entity All rights reserved
British Columbia Technology Report Card 2014 British Columbia Technology Report Card
Industry Profile and Comparative Analysis Industry Profile and Comparative An
8102019 BC Technology Report Card 2014 Edition
httpslidepdfcomreaderfullbc-technology-report-card-2014-edition 1427
owever while the technology sector experienced the third highest growth in employment among all
e industries in BC between 1999 and 2012 employment has been flat since 2009 9
or reference the min ing oil amp gas and extraction industr y which experienced the highest growth in employment between 1999 and 2012 started
t one-sixth the employment level of the technology industry in the base year 1999 and remains significantly lower in 2012 at 22000 employees
101
68
38
35
ndash44
ndash14
6
16
22
32
1101009080706050403020100ndash10ndash20ndash30ndash40ndash50
Mining Oil and Gas Extraction
Construction
Technology
ccomodation amp Food Services
Retail amp Wholesale Trade
Transportation amp Warehousing
ance Insurance amp Real Estate
Utilities
Manufacturing
Forestry
mployment Growth between 1999 and 2012
urce Profile of the British Columbia High Technology Sector BC Stats March 2014
The tech
sector hasexperiencedthe thirdhighestgrowth in
employmentin the provincesince 1999However
growth hasbeen minimalsince 2009
Some companies suggested that employment had in fact grown in more recent years and that
the demand for talent is as high as ever assertions which would not be reflected in data ending at
2012 It was also suggested that companies have been employing personnel outside the province
due in the part to limited talent availability in certain areas ndash another factor which is not captured by
the analysis On the other hand leaders from larger BC technology companies supported the view
that employment growth has slowed driven by productivity gains and a focus on better utilizing
existing employees
Deeper analysis of the employment data suggests variation in the employment trend by industry sector
and firm size For example between 2009 and 2012 there was a notable decline in employment in
BCrsquos ldquomotion picture and post-productionrdquo sector This was compensated for however by healthy
employment growth in other t ech sectors such as ldquoengineering and other servicesrdquo
Industry leaders have also predicted industry growth since 2013 again an assertion which our
data would not reflect
Industry Insights on Employment Trends
Technology Jobs per 100000 Population
Canada Tech Industry GDP per Person Employed
Source Profile of the British Columbia High Technology Sector BC Stats March 2014
Source KPMG analysis of data from Profile of the British Columbia High Technology Sector BC Stats March 2014
On a per capita basis BCrsquos technology sector employment has remained stable since 2009 at
approximately 18 percent below the Canadian average
The improvement in GDP concurrent with flat employment numbers implies that BC is the only province
where technology labour productivity has potentially improved over the last five years
3000
2500
2000
1500
1000
2002 2003 2004 2005 2006 2007 2008 2009 2010 2011 2012
CanadaOnt ar io QueacutebecBritish Columbia Alberta
$180000
$170000
$160000
$150000
$140000
$130000
$120000
$110000
$100000
2007 2008 2009 2010 2011 2012
CanadaO ntar io Q ueacute be cBritish Columbia Alberta
BC tecemplo
per capbeen ssince 2
014 KPMG LLP a Canadian limit ed liability par tnership and a member firm of the KPMG network of independent member
s affiliated with KPMG International Cooperative (ldquoKPMG Internationalrdquo) a Swiss entity All rights reserved
copy 2014 KPMG LLP a Canadian limit ed liability par tnership and a member firm of the KPMG network of independent member
firms affiliated with KPMG International Cooperative (ldquoKPMG Internationalrdquo) a Swiss entity All rights reserved
British Columbia Technology Report Card 2014 British Columbia Technology Report Card
Industry Profile and Comparative Analysis Industry Profile and Comparative An
8102019 BC Technology Report Card 2014 Edition
httpslidepdfcomreaderfullbc-technology-report-card-2014-edition 1527
dustry Wages
nce the 2012 report card BCrsquos technology industry has seen rapid wage growth relative to the average
age in all other provincial industries In 2012 the average tech wage was 66 percent higher than the
erage for the economy as a whole compared with 58 percent in 2009
ationally the real weekly wage in BCrsquos technology industry has grown by twice as much as the Canadian
erage Moreover in 2012 BCrsquos technology industry wage was higher than the Canadian average and
mparable to the level in Ontario However BC continues to trail Alberta in this regard where technology
bs pay 20 percent higher and are comparable to US levels This is consistent with the overall trend in
ages in Alberta which are typically higher than BCrsquos across most industries
verage Earnings minus BC Technology versus BC
eal Weekly Wages (in 2012 prices)
0000
0000
0000
0000
0000
0000
0000
0000
2002 2003 2004 2005 2006 2007 2008 2009 2010 2011 2012
BC TechnologyBC All Industries
$0
urce KPMG analysis of data from Profile of the British Columbia High Technology Sector BC Stats March 2014
urce KPMG analysis of data from Profile of the British Columbia High Technology Sector BC Stats March 2014 and Statistics Canada
NSIM Table 326-0021
600
200
800
400
000
2002 2003 2004 2005 2006 2007 2008 2009 2010 2011 2012
CanadaQueacutebecOntarioAlbertaBritish Columbia US
BC tech jobsearn 66 percentmore than theBC average
salary
BC has higherpaying tech jobs than
the Canadianindustry asa whole
Exports
BC tech industry exports have experienced growth since the 2012 report card however there is room
for significant improvement when it comes to accessing new markets Globally the technology industrytends to be highly mobile since enterprises need not have operations in close proximity to their product
and service markets international trade becomes very important BC tech has the potential to make
significant progress on the global front since its current export performance is poor relative to the
Canadian industry as a whole and it has not experienced any significant growth over the last decade10
10 The data and a nalysis presented in this section is based on the best available data to date However service exports data may be an
underestimate of the true level of service exports As noted by BC Stats data for service exports is challenging to measure since it cannot
be tracked through customs databases Instead it is estimated using surveys and other information available to BC Stats (Profile of the
British Columbia High Technology Sector 2013)
Comparison of Exports
Industry Exports
Summary
Industry Exports Growth
Versus Other BC Industry Sectors 2014
While in theory the rise of the real wage reflects rising productivity there are likely other factors
at play in BCrsquos tech industry Some industry leaders interviewed by KPMG suggested that the
rising cost of living in BC is putting significant upward pressure on compensation Others pointed
to market distortions in specific types of jobs such as software development caused by the entry
of multinational firms that are willing to pay above-market rates to attract talent
Industry Insights on Wage Trends
014 KPMG LLP a Canadian limit ed liability par tnership and a member firm of the KPMG network of independent member
s affiliated with KPMG International Cooperative (ldquoKPMG Internationalrdquo) a Swiss entity All rights reserved
copy 2014 KPMG LLP a Canadian limit ed liability par tnership and a member firm of the KPMG network of independent member
firms affiliated with KPMG International Cooperative (ldquoKPMG Internationalrdquo) a Swiss entity All rights reserved
British Columbia Technology Report Card 2014 British Columbia Technology Report Card
Industry Profile and Comparative Analysis Industry Profile and Comparative An
8102019 BC Technology Report Card 2014 Edition
httpslidepdfcomreaderfullbc-technology-report-card-2014-edition 1627
oing deeper
2012 the BC technology industry exported $3 billion in goods and services with services accounting
r two-thirds of this amount ndash a ratio that has remained fairly constant over time11 Over the last
cade technology exports have grown very slowly and this growth has been notably poor in the
ars since the recession Between 2009 and 2012 while total exports from BC grew by 20 percent
C technology exports grew by only 5 percent
Data for BCrsquos technology services exports have been revised significantly downwards by BC Stats for the years since 2006 Therefore the
updated analysis of exports may not be consistent with the findings of the 2012 report card
500
000
500
000500
000
$500
$02 00 2 2 00 3
Goods Services
2004 2005 2006 2007 2008 2009 2010 2011 2012
C Technology Exports
urce Profile of the British Columbia High Technology Sector BC Stats July 2011
Exports of BC
tech goodsand serviceshave been
relativelystable
The technology industry comprises 65 percent of BCrsquos total exports ndash a figure relatively proportional
to its share of the provinci al GDP Of the total goods and ser vices exported the te ch industryrsquos share
of services is much higher than that of goods although its share has declined by 35 percent compared
to 2012 findings12
12 Based on the revised services export data published by BC Stats it is found that BC technologyrsquos share of total service exports in 2009 was
lower than the figure reported in the 2012 report card (it was 20 percent instead of 32 percent)
70
60
50
40
30
20
10
0
2001 2002 2003 2004 2005 2006 2007 2008 2009
B ri ti sh C ol um bi a C an ad a
Tech Exports (as a of Tech GDP)
Technol ogy O ther I ndustr ies
BC ExportShare
65
935
BC GDPShare
76
924
BC Goods Export Share
BC Services Export Share
13
3
87
97
$16 billion
$31 billion
Source Profile of the British Columbia High Technology Sector BC Stats March 2014
Source Profile of the British Columbia High Technology Sector BC Stats March 2014
However as a percentage of its output BC tech exports a smaller share than the Canadian tech
industry as a whole which implies that our export intensity is lower than that of tech industries in
other provinces
BC tecof provexport
proporto its sthe proeconom
BC tecexport28 perc
its totain 2009compa40 percoutput
exportethe Ca
technoindustr
copy 2014 KPMG LLP a Canadian limit ed liability par tnership and a member firm of the KPMG network of independent member
firms affiliated with KPMG International Cooperative (ldquoKPMG Internationalrdquo) a Swiss entity All rights reserved
014 KPMG LLP a Canadian limited liabi lity partnership and a member firm of the KPMG network of independent member
s affiliated with KPMG International Cooperative (ldquoKPMG Internationalrdquo) a Swiss entity All rights reserved
British Columbia Technology Report Card 2014 British Columbia Technology Report Card
Industry Profile and Comparative Analysis Industry Profile and Comparative An
8102019 BC Technology Report Card 2014 Edition
httpslidepdfcomreaderfullbc-technology-report-card-2014-edition 1727
om a trade balance perspective BC continues to be a significant net importer of technology goods
th the majority originating in the Pacific Rim The magnitude of these imports indicates there is local
mand for certain types of technology goods not being met by local supply
hile detailed trade data for technology services is lacking for BC a closer examination of technology
ods data reveals further insights
terms of exports while the US continues to be the largest consumer of BC technology goods there
s been a significant trend in market diversification towards the Pacific Rim and other countries over
e past decade
C Tech Goods Exports and Imports
urce Profile of the British Columbia High Technology Sector BC Stats March 2014
urce Profile of the British Columbia High Technology Sector BC Stats March 2014
Goods Exports Goods Imports
2002 2003 2004 2005 2006 2007 2008 2009 2010 2011 2012
$5000
$4000
$3000
$2000
$1000
$0
The share oftechnology
goods exportsfrom BC to theUS has beendeclining
BC imports$5 billionworth of
technologygoods whilegeneratingonly $1 billionin exports
Economic Performance Indicators ndash Summary
Current economic performance indicators largely confirm the findings of the 2012 report card
BC technology performs strongly compared to other provincial industries but continues to trail the
technology industries in other provinces To gain more perspective around the ldquowhyrdquo of these results
the following section analyzes inputs to the BC tech industry and highlights the root drivers of its
economic performance
Export readiness and the ability to successfully access new markets are closely correlated to firm
capacities Smaller companies often lack the resources capital and expertise necessary to readily
exploit new markets
The underperformance in BC tech exports relative to other provinces is likely related to the
overweighting of small and very small technology companies in BC Industry leaders observed
that smaller companies often require access to local early-adopter customers as a proving ground
before expanding to new markets As such both corporations and government agencies can play
an important role by helping improve product designmarketing processes and serving as a critical
reference customer
Despite this many BC tech companies find their productsservices are better received in foreign
markets than at home Even among leading companies very few indicate they have much or any
business with BC-based customers
Unlike the US there is as yet no funding set aside by provincial or federal governments to procure
locally from small businesses In fact in some cases the government procurement process has
minimum requirements that are beyond the capabilities of smaller companies
The tech industry is global and in many segments fiercely competitive Successfully growing
exports requires both financial capacity and management expertise ndash issues that BC tech
companies face regularly
Industry Insights on Exports and Market Access
014 KPMG LLP a Canadian limit ed liability par tnership and a member firm of the KPMG network of independent member
s affiliated with KPMG International Cooperative (ldquoKPMG Internationalrdquo) a Swiss entity All rights reserved
copy 2014 KPMG LLP a Canadian limit ed liability par tnership and a member firm of the KPMG network of independent member
firms affiliated with KPMG International Cooperative (ldquoKPMG Internationalrdquo) a Swiss entity All rights reserved
British Columbia Technology Report Card 2014 British Columbia Technology Report Card
Industry Profile and Comparative Analysis Industry Profile and Comparative An
8102019 BC Technology Report Card 2014 Edition
httpslidepdfcomreaderfullbc-technology-report-card-2014-edition 1827
art B Industry Input Indicatorshile the BC technology industry continues to perform well compared to other BC industries it continues
underperform relative to the technology industries in other provinces ndash although the gap is being
osed It is also generally behind the tech sectors of the countries in the Organization for Economic
o-operation and Development (OECD) particularly in the areas of t alent venture capital investment
d research and development (RampD) all of which are necessary growth drivers A closer assessment
BCrsquos technology industry inputs offers a glimpse into key areas of weakness and highlights areas
here appropriate targeted investment may serve to underwrite the sectorrsquos future performance
rt of the noted underperformance can be attributed to the capacity constraints of BC firms Populated
th small enterprises BC tech firms have a limited ability to raise capital investment invest in RampD
crease the available talent pool collaborate with post-secondary research institutes and build
ellectual property
C Technology Industry ndash 2014 Report Card
Talent Availability
Industr y Input Indicator s Ver sus O ther Provincial Tech Sectors 2014
Grade
Access to Capital
Research and Development
Intellectual Property
Cndash
bull Low talent availability ndash BC lags other provinces in granting engineering and sciences degrees
at both the undergraduate and graduate levels and is well below the OECD average in granting
technical doctoral degrees
bull Lack of venture capital investment ndash While BC has a relatively healthy level of angel
investment venture capital investment is largely lacking or insufficient
bull Lagging RampD investment ndash BC fares poorly compared to other provinces and OECD countries
on the level of RampD invested as a percentage of output Of particular concern is the declining
level of business expenditure on RampD which is already behind other jurisdictions
bull Fewer patents ndash BCrsquos level of patents granted lags other provinces and OECD countries on
both a per capita basis and as a percent of applications filed
Highlights
Talent Availability
Talent is a critical resource for the technology sector feeding the innovation and creativity that in turn
drive the global industry From information amp communications technology to engineering amp other
services to life sciences each sector relies on the availability of a skill-specific talent pool to meet
existing business demands and generate new growth ideas The technical skills required by the industry
are primarily developed at higher education institutions then nurtured within the industry The number of
degrees awarded in a province is therefore a useful measure of the technical talent available for firms
to draw on
While there has been an improvement in the granting of degrees in math and computer science in
BC relative to other provinces we continue to lag in the granting of degrees in other technical fields
BC fares particularly poorly in the architecture and engineering fields and underperforms the Canadian
average in life sciences Moreover BCrsquos performance has fallen relative to other OECD countries in the
granting of technical PhDs
Talent Availability
Undergraduate Degrees
Industry Input Indicators
Summary
Undergraduate Technology Degrees
Graduate Technology Degrees
Versus other Provincial Tech Sectors 2014
014 KPMG LLP a Canadian limit ed liability par tnership and a member firm of the KPMG network of independent member
s affiliated with KPMG International Cooperative (ldquoKPMG Internationalrdquo) a Swiss entity All rights reserved
copy 2014 KPMG LLP a Canadian limited liabi lity partnership and a member firm of the KPMG network of independent member
firms affiliated with KPMG International Cooperative (ldquoKPMG Internationalrdquo) a Swiss entity All rights reserved
British Columbia Technology Report Card 2014 British Columbia Technology Report Card
Industry Profile and Comparative Analysis Industry Profile and Comparative An
8102019 BC Technology Report Card 2014 Edition
httpslidepdfcomreaderfullbc-technology-report-card-2014-edition 1927
oing deeper
illed labour availability in BC as measured by the level of undergraduate degrees granted per capita
iled only Ontario in 2012 having grown steadily over the last three years13
Data for Queacutebec has been revised downwards significantly by BC Stats Undergraduate degrees per 100000 population was lower than the
evel in BC up to 2008 and remains that way till 2011
urce Profile of the British Columbia High Technology Sector BC Stats March 2014
0
0
0
0
0
0
0
20022001 2003 2004 2005 2006 2007 2008 2009 2010 2011
O ntar io Q ueacute be cBritish Columbia Alberta
ndergraduate Degrees per 100000 Population
nnual Undergraduate Degrees per 100000 Population 2011
owever in terms of the relevance of those degrees to the technology industry BC continues to
il other provinces on average For both undergraduate and graduate degrees BC is well behind the
nadian average and the degree rates of other provinces in the fields of architecture and engineering
e province is also behind the Canadian average in the granting of undergraduate and graduate degrees
the physical and life sciences disciplines Only in the fields of math computer science and information
ence has there been a positive trend since 2009 with BC now second only to Ontario in granting
th undergraduate and graduate degrees in these disciplines
Queacutebec Ont ario Alberta Brit ish ColumbiaCanada
0
0
0
0
0
0
0
0Undergraduate
Degrees ndash Architecture and
Engineering
Undergraduate
Degrees ndash Physical
and Life Sciences
Undergraduate
Degrees ndash Math Computer
and Information Science
BC produces thesecond highest
number ofundergraduateson a per capitabasis butcontinues to
trail Ontariosignificantly
Globally Canadarsquos rate of granting technology-related doctoral degrees per 1000 population in the
reference age cohort is well below the OECD average Since 2009 the level in Canada remained
the same at 12 percent while the OECD average improved slightly to 16 percent KPMG estimates
that BCrsquos rate of doctoral degrees of 06 percent also did not change since the last estimate in
2009 meaning a deficit of 60 percent versus other OECD jurisdictions More concerning yet is that
many of the countries that trailed Canada and British Columbia in 2000 had surpassed us by 2011
(eg Italy Iceland and Greece)
Source Profile of the British Columbia High Technology Sector BC Stats March 2014
Source KPMG Analysis and OECD Science Technology and Industry Scorecard 2013 OECD 2013
urce Profile of the British Columbia High Technology Sector BC Stats March 2014
Technology Related Doctoral Degrees as Percentage of Population in Reference Age Cohort
Annual Graduate Degrees per 100000 Population 2011
Queacutebec Ontario Alberta British ColumbiaCanada
300
250
200
150
100
50
00Graduate Degrees ndash
Architecture andEngineering
Graduate Degrees ndash Physicaland Life Sciences
Graduate Degrees ndash MathComputer and Information Science
014 KPMG LLP a Canadian limit ed liability par tnership and a member firm of the KPMG network of independent member
s affiliated with KPMG International Cooperative (ldquoKPMG Internationalrdquo) a Swiss entity All rights reserved
copy 2014 KPMG LLP a Canadian limit ed liability par tnership and a member firm of the KPMG network of independent member
firms affiliated with KPMG International Cooperative (ldquoKPMG Internationalrdquo) a Swiss entity All rights reserved
British Columbia Technology Report Card 2014 British Columbia Technology Report Card
Industry Profile and Comparative Analysis Industry Profile and Comparative An
8102019 BC Technology Report Card 2014 Edition
httpslidepdfcomreaderfullbc-technology-report-card-2014-edition 2027
Access to Capital
ccess to risk capital throughout the growth cycle is one of
e most significant determinants of tech sector success
has been empirically established that companies that
ceive risk capital have a significantly higher survival rate
perience stronger revenue employee wage and asset
owth and invest in higher levels of RampD 14
e BC technology industry has had a healthy growth in
gel investment which typically takes the form of seed
pital that helps in the emergence of start-ups However
rly stage venture capital investment ndash a necessary fuel
r growing start-ups into thriving companies ndash is deficient
BC and has been declining in recent years And of the
early stage venture capital that is invested there has
been a decline in the share invested by local funds which
deprives companies not only of adequate risk capital but
also of the guidance and networking opportunities that
are essential in early growth stages At the same time
BC companies attract a significant amount of foreign and
extra-provincial investment at the later stages of growth
Together these findings suggest that small technology firms
in BC are limited in their ability to access timely risk capital
that can propel their growth and firms that successfully
attract foreign venture capital may be at risk of relocating
outside BC
These findings can be explored in detail in the recent study by CVCA and Industry Canada titled ldquoThe Performance of Canadian Firms that
Received Venture Capital Financingrdquo published in June 2013
ccess to Capital
Access to Angel Investment
Summary
Access to Venture Capital
Are at Versus Other Provincial Tech Sectors 2014
Industry leaders almost universally agreed that access
to talent has become the most significant issue facing
their firms They cite a tightening of talent availability
over the past few years growing shortages in certain
key technical areas including software and web
development and a need to expand the available talent
pool in areas such as industrial technologies and sales
and marketing as critical issues
The challenges in talent availability have been exacerbated
by the arrival or impending arrival of several multinational
firms on the BC tech scene With a relatively constrained
talent pool the competition for available resources has
increased and with it compensation levels have risen
Several of the larger US-based multinationals are offering
compensation packages at significant premiums over the
average compensation levels in the BC market leading
to growing talent development attraction and retention
challenges for smaller BC companies In some cases this
has led to BC-based companies establishing or growing
their operations outside of BC where talent is less
expensive and more available
Leaders agreed that long-term industry success will
require an expanded talent pool developed by improving
the quantity and quality (job-readiness) of post-secondary
degree programs as well as by attracting talent from
outside of BC and Canada
The high cost of real estate was cited as a primary
barrier to attracting outside talent particularly where
mid- and senior-level management must be relocated
As a result companies are looking at alternative ways
of addressing relocation costs and at targeting talentmarkets where the cost differential or the expectation
of home ownership are less
Industry Insights on Talent Availability
In recent years the vast majority of venture capital invested in BC was in later stage financing Early
stage venture capital is significantly more limited and has been declining over the last few years
Capital by Stage of Investment
Venture Capital by Stage of Investment
Going deeper
BC has experienced steady growth in the level of angel investments in the province since the mid-2000s
Venture capital investment on the other hand has been more volatile
Source CVCA and BCTIA analysis of Thompson Reuters Data
Source CVCA and BCTIA analysis of Thompson Reuters Data
$0
$100
$200
$300
4
2003
$40
$110
2004
$31
$254
2005
$32
$226
2006
$54
$298
2007
$54
$316
2008
$64
$260
2009
$67
$141
2010
$72
$223
2011
$87
$233
2012
$97
$201
Ve ntur e C ap ital Ang el
$ m i l l i o n
$0
$100
$200
$300
$51
$172
$43
$190
$16
$185
2010 2011 2012
VC Later Stage VC Early Stage
$ m i l l i o n
014 KPMG LLP a Canadian limit ed liability par tnership and a member firm of the KPMG network of independent member
s affiliated with KPMG International Cooperative (ldquoKPMG Internationalrdquo) a Swiss entity All rights reserved
copy 2014 KPMG LLP a Canadian limit ed liability par tnership and a member firm of the KPMG network of independent member
firms affiliated with KPMG International Cooperative (ldquoKPMG Internationalrdquo) a Swiss entity All rights reserved
British Columbia Technology Report Card 2014 British Columbia Technology Report Card
Industry Profile and Comparative Analysis Industry Profile and Comparative An
8102019 BC Technology Report Card 2014 Edition
httpslidepdfcomreaderfullbc-technology-report-card-2014-edition 2127
verall BC placed second to last in the level of total venture capital invested among the 20 North
merican jurisdictions examined This is particularly concerning as the technology industry is inherently
obile and decisions regarding the location of operations can be significantly influenced by structural
ctors such as access to capital rather than the presence of local demand
e decline in locally sourced early stage capital is particularly concerning given its importance At the
me time a significant share of later stage investment originates from foreign sources which presents
potential risk that firms may subsequently relocate outside of BC
urce CVCA and BCTIA analysis of Thompson Reuters Data
urce KPMG Analysis of Thomson Reuters Data
$million
$33
$18
$11
$32
$0
$10
$20
$30
$40
2010 2011 2012
$3
$12
CanadianForeign
arly Stage VC Investment by Source
enture Capital Investments 2012
C a
l i f o r n
i a
M a s s e c
h u s e t t s
N e w
Y o r k
T e x a s
W a s
h i n g t o n
M a r y
l a n
d
U t a
h
O h i o
N e w
J e r s e y
O n t a r i o
V i r g i n i a
Q u e
b e c
B r i t i s
h C o
l u m
b i a
P e n n s y
l v a n
i a
I l l i n o
i s
A r i z o n a
C o
l o r a
d o
G e o r g
i a
M i n n e s o t a
M i c h i g a n
V C P e r
C a p
i t a -
$
$500
$450
$400
$350
$300
$250
$200
$150
$100
$50
$0
$6000
$5000
$4000
$3000
$2000
$1000
$0
VC per capita 2012Venture Capital 2012
Locallysourced earlystage VC
investmenthas beendeclining
Research and Development
RampD expenditure is the long-term investment in an industryrsquos future economic performance It measures
commitment to using innovation and knowledge creation to enhance productivity and improve competitiveness
Over the last few years there has been little increase in overall RampD investment in BC As such it
ranks below Ontario and Queacutebec However the composition of RampD spending has changed over time
with the share of business investment in RampD experiencing a steady decline The fact that the industry
is populated with small firms with fewer than 50 employees can help explain this trend BC is host to
very few large anchor companies that have the revenues and the capital to spend in significant ways
on research for the purposes of enhancing competitiveness
Research and Development
Summary
BERD as a Percentage of GDP
RampD as a Percentage of GDP
Versus other Provincial Tech Sectors 2014
The technology industry leaders interviewed recognized that there is a healthy local angel
network in BC However early stage venture capital financing in BC is seen as either absent
or modest making it difficult for small companies to grow There is a sense that attracting
venture capital from out-of-province is also challenging because physical proximity is an
important investment factor
Overall the opinion was that the limited presence of venture capital in BC leads to an absence
of investment competition which impacts competitive valuation and terms Industry leaders also
noted that local venture capital funds often take a revenue-based valuation approach Paradoxically
this may mean that a company can be valued higher by an angel investor prior to earning any
revenue than by an institutional investor once it starts generating revenue Since angel investors
typically expect high returns on initial investment this may make it difficult for small companies
to raise subsequent rounds of institutional financing often leaving them with prospects of
constrained growth due to limited capitalization or the option of selling early This lack of breadth
in the capital pool can lead to a vicious cycle of limited company growth and depressed valuations
of small companies seeking funding
Industry Insights on Risk Capital Investment
014 KPMG LLP a Canadian limit ed liability par tnership and a member firm of the KPMG network of independent member
s affiliated with KPMG International Cooperative (ldquoKPMG Internationalrdquo) a Swiss entity All rights reserved
copy 2014 KPMG LLP a Canadian limit ed liability par tnership and a member firm of the KPMG network of independent member
firms affiliated with KPMG International Cooperative (ldquoKPMG Internationalrdquo) a Swiss entity All rights reserved
British Columbia Technology Report Card 2014 British Columbia Technology Report Card
Industry Profile and Comparative Analysis Industry Profile and Comparative An
8102019 BC Technology Report Card 2014 Edition
httpslidepdfcomreaderfullbc-technology-report-card-2014-edition 2227
BC total RampD spending as a percent of GDP has remained relatively constant since 2008 Other
ovinces experienced a slight decline in this metric While BC remains higher than Alberta in this
gard it still makes up only 60 percent of the RampD expenditure levels in Ontario and Queacutebec
oing deeper
$3 billion there was no significant increase in the total RampD expenditure in BC since 2008 although
e composition of the spending changed The share of higher education and private non-profit
penditure continued to grow from 39 percent in 2008 to 43 percent in 2010 while that of business
terprise shrank by an equivalent amount to 53 percent in 2010
urce Profile of the British Columbia High Technology Sector BC Stats March 2014
urce Profile of the British Columbia High Technology Sector BC Stats March 2014
0
500
1000
1500
2000
2500
3000
3500
2000 2001 2002 2003 2004 2005 2006 2007 2008 2009 2010
Business Enterprise Higher Education amp Private Non-Profit
F ed er al Go vt P ro vin ci al Go ve rn me nt amp Re se ar ch In st it ut ion s
ampD Expenditures in British Columbia
ampD as a Percent of GDP
000
050
100
150
200
250
300
2007 2008 2009 2010
Ont ar io QueacutebecBritish Columbia Alberta
Overall RampDinvestment in
BC has beenconstant withan increase
in highereducation
spendingequal to thereductionin business
investmentin RampD
BCrsquos levelof RampD as apercentageof GDP has
been constantbut remains40 percent
lower thanOntario and
Queacutebec
Source KPMG Analysis of BC Stats Data and OECD Science Technology and Industry Scorecard 2013 OECD 2013
RampD Expenditure as a Percent of GDP
Since the last report card BC did not improve its global standing in RampD intensity as it continues
to perform 40 percent below the OECD average
I S R
K O R
F I N
J P N
S
W E
C H E
D N K
D E U
U S A
A U T
S V N
I S L
O E C D
E S T
F R A
C H N
B E L
O N
A U S
E
U 2 8
N L D
C Z E
G B R
L U X
C A N
I R L
N O R
P R T
B C
E S P
Z A F
I T A
H
U N
N Z L
R U S
M
E X
T U R
P O L
S V K
C H L
0
1
2
3
4
5
2011 2001
Q C
The BERD (business expenditures on RampD) ratio ndash which reflects the level of industry commitment
within the technology industry ndash has fallen for all provinces since 2008 BC still performs better than
Alberta with its businesses contributing 078 percent of GDP to RampD investment but remains well
below Queacutebec and Ontario which contribute 142 percent and 109 percent respectively
Source Profile of the British Columbia High Technology Sector BC Stats March 2014
Business Expenditure on RampD as a Percent of GDP
0
05
10
15
20
2007 2008 2009 2010
P e r c e n t o f G D P
CanadaOntario QueacutebecBritish Columbia Alberta
BusineRampD apercen
of GDPis 20 plower tCanad
BC fell below averageexpendpercent
014 KPMG LLP a Canadian limit ed liability par tnership and a member firm of the KPMG network of independent member
s affiliated with KPMG International Cooperative (ldquoKPMG Internationalrdquo) a Swiss entity All rights reserved
copy 2014 KPMG LLP a Canadian limit ed liability par tnership and a member firm of the KPMG network of independent member
firms affiliated with KPMG International Cooperative (ldquoKPMG Internationalrdquo) a Swiss entity All rights reserved
British Columbia Technology Report Card 2014 British Columbia Technology Report Card
Industry Profile and Comparative Analysis Industry Profile and Comparative An
8102019 BC Technology Report Card 2014 Edition
httpslidepdfcomreaderfullbc-technology-report-card-2014-edition 2327
0
0
0
0
0
0
0
0
0
I S R K O R F I N J
P N S W E C
H E D N K
D E U
U S A
A U T
S V N I S L
O E C D E
S T F R A
C H N B
E L A U S
E U 2 8 I R L C
Z E G B R
L U X
C A N N
L D N O R B C
H U N E
S P P R T I T A R
U S N Z L
Z A F
T U R
S V K
P O L
M E X
C H L
2011 2001
usiness Expenditure on RampD as a Percent of GDP
Crsquos BERD remained 50 percent below the OECD average and did not experience any change from the
01 level This means between 2001 and 2011 BC was surpassed by countries like China and Australia
their level of BERD investment as a p ercent of GDP
urce KPMG Analysis of BC Stats Data and OECD Science Technology and Industry Scorecard 2011 OECD 2011
BusinessRampD in BCis one-thirdthe level of
leading OECDcountries
Going deeper
Compared to other provinces with significant technology industries BC continues to trail in terms of both
the number of patents filed and the number of patents granted on both an absolute and per capita basis
Intellectual Property
Canadian Patents Filed and Granted
Source Canadian Patent Office
Intellectual Property
Intellectual property is a bellwether of the inventory of assets that can be commercialized to underwrite
future economic performance As measured by the number of patent applications submitted and
granted intellectual property reflects the success of RampD investment in the development of innovative
products provides an indication of the commercial viability of research and provides an indication of the
competitiveness of the technology industry as a whole Consistent with the findings of the 2012 report
card BC still ranks well below all other provinces with significant technology industries in the level of
patents awarded both on a per capita basis and as a percentage of applications filed
Patents Granted
Versus Other Provincial Tech Sectors 2014
Summary
0
500
1000
1500
2000
2500
Patents Filed ndash2011
Patents Filedndash2012
Patents Granted ndash2011
Patents Granted ndash2012
Ontario Queacutebec Alberta British Columbia
copy 2014 KPMG LLP a Canadian limit ed liability par tnership and a member firm of the KPMG network of independent member
firms affiliated with KPMG International Cooperative (ldquoKPMG Internationalrdquo) a Swiss entity All rights reserved
014 KPMG LLP a Canadian limited liabi lity partnership and a member firm of the KPMG network of independent member
s affiliated with KPMG International Cooperative (ldquoKPMG Internationalrdquo) a Swiss entity All rights reserved
British Columbia Technology Report Card 2014 British Columbia Technology Report Card
Industry Profile and Comparative Analysis Industry Profile and Comparative An
8102019 BC Technology Report Card 2014 Edition
httpslidepdfcomreaderfullbc-technology-report-card-2014-edition 2427
ore telling is the fact that BC has had the lowest level of patents awarded as a percent of applications
er the last decade
e prevalence of small firms in the BC technology sector has a direct impact on the capacity of
mpanies to successfully pursue patents Not only do they have limited capacity to invest in RampD to
velop patentable innovations but their capital constraints limit their ability to access the legal and
ministrative expertise needed to execute patent applications
atents Awarded per 100000 Population
atents Granted as a Percent of Patent Applications
urce Profile of the British Columbia High Technology Sector BC Stats March 2014
urce Profile of the British Columbia High Technology Sector BC Stats March 2014
00
00
00
00
00
00
00
00
00
2001 2002 2003 2004 2005 2006 2007 2008 2009 2010 2011
CanadaO ntar io Q ueacute be cBritish Columbia Alberta
2001 2002 2003 2004 2005 2006 2007 2008 2009 2010 2011
CanadaO ntar io Q ueacute be cBritish Columbia Alberta
BCrsquos patentperformancesignificantlytrails otherprovinces
Canada still ranks 18th well behind the worldrsquos leading countries in terms of the number of triadic
patent families per million population ndash a measure of patents taken at three major patent offices in
the world KPMGrsquos estimate for BC places it even further down the list than it was in 200815
Triadic Patent Families per Million Population 2010
Source KPMG Analysis of BC Stats Data and OECD Science Technology and Industry Scorecard 2013 OECD 2013
15 KPMG estimated BCrsquos ranking on the chart by considering the relative proportions of patents awarded in BC versus Canada as a whole on
a per capita basis
0
20
40
60
80
100
1
I D N
I N D
B R A
T U R
R U S
C H L
Z A F
C H N
P O L
S V K
G R C
C Z E
P R T
H U N
E S P
E S T
S V N
W L D
B C
I S L
N Z L
I T A
A U S
I R L
C A N
N O R
G B R
L U X
O E C D
B E L
F R A
K O R
I S R
U S A
A U T
N L D
D N K
F I N D E U
S W E
C H E
J P N
M E X
BCrsquos paperform
is one-the levleadingcountr
014 KPMG LLP a Canadian limit ed liability par tnership and a member firm of the KPMG network of independent member
s affiliated with KPMG International Cooperative (ldquoKPMG Internationalrdquo) a Swiss entity All rights reserved
copy 2014 KPMG LLP a Canadian limited liabi lity partnership and a member firm of the KPMG network of independent member
firms affiliated with KPMG International Cooperative (ldquoKPMG Internationalrdquo) a Swiss entity All rights reserved
British Columbia Technology Report Card 2014 British Columbia Technology Report Card
Industry Profile and Comparative Analysis Industry Profile and Comparative An
8102019 BC Technology Report Card 2014 Edition
httpslidepdfcomreaderfullbc-technology-report-card-2014-edition 2527
he technology industry not only generates GDP employment and income
ithin the technology sectors (referred to as direct impact) it also brings
dditional benefits to the overall BC economy by supporting suppliers to
e industry (indirect impact) and through the re-spending of labour income
arned in technology and supplier industries (induced impact)
ur economic impact analysis indicates that the overall impact of the technology industry on the BConomy is significantly magnified by the indirect and induced impacts We estimate that based on
rrent technology industry revenues of $23 billion the total contribution to the BC economy is
$23 ndash $26 billion in GDP
165000 ndash 188000 jobs created or sustained
$10 ndash $12 billion in total labour income
ese high levels of economic benefits are consistent with an industry that is high value-add employs
ghly skilled workers pays high wages and is well integrated in the economy 16
s noted earlier in the report while the technology industry has made a significant contribution to the
C economy our province still trails other Canadian provinces and US jurisdictions in this respect For
ample the BC technology ind ustry current ly comprises 76 percent of provincial GDP compared to
3 percent contribut ed by the US technology industry to US GDP So what would happen if the BC
chnology industry grew to comprise 103 percent of the provincial economy
ur analysis indicates that growing to 103 percent of the provincial economy would bring an additional
1B in BC technology industry revenues and an associated increase of $91B ndash 102B in total
DP 65K ndash 74K additional jobs created or sustained and a $41B ndash 46B increa se in labour
come These estimates include the combined benefits of the direct indirect and induced impacts
the economy
Economic ImpactAssessment
sti mating the technology industry economic impact is challenging due to the lack of standard technology industry classificati ons and
corresponding technology-specific impact multipliers To estimate the impact KPMG used weighted averages of standard industry sector impact
multipliers based on the definition of sectors comprising the tech industry We have chosen to represent the impacts as ranges using different
sectoral weights The use of ranges reflects the inherent variability in the technology industry caused by the diversity of sectors that it comprises
For example a dollar worth of output in the tech industry will have a different economic impact depending on whether it is generated by the
software publishing sector the telecommunication sector or the motion picture and post-production sector In our analysis of direct impacts we
have used figures reported by BC Stats To estimate the indirect and induced impacts we have used industry-standard multipliers developed by
Statistics Canada
Going deeper
Current BC Technology Industry Economic Impact
Given that the industry generated $23 billion in revenues we estimate that the industry contributed
$23 ndash $26 billion to total GDP created or sustained 165000 ndash 188000 jobs an d delivered $10 ndash $12 billion
to total labour income This impact breaks down in direct indirect and induced impact as follows
Current BC Tech Industry Impact
GDP
JOBS
LABOUR INCOME
$23 Bin Tech Industry
Revenues
Direct Impact Indirect Impact Induced Impact Total Impact
$15B
84K
$6B
$4B ndash 5B
43K ndash 52K
$4B ndash 6B
39K ndash 52K
$2B ndash 3B
$23B ndash 26B
165K ndash 188K
$10B ndash 12B$23B ndash 3B
BC Technology Industry Economic Impact Multipliers
In order to compare the technology industry to other industries as well as forecast the impact of
industry growth we have estimated the technology industry impact per dollar of revenue
We find that for each dollar of technology industry revenue the industry generates $1 ndash $112 in total
GDP and $045 ndash $05 in total labo ur income Further for each million dollars in te chnology industr y
revenue the industry generates or sustains seven to eight jobs in BC This impact breaks down in
direct indirect and induced impact as follows
Economic Impact Multiplier Estimates
GDP ($)
$1in Tech Revenues
For each
$1M in Tech Revenues
For each
Direct Impact Indirect Impact Induced Impact Total Impact
065 016 ndash 022 019 ndash 025 100 ndash 112
JOBS 362 186 ndash 228 168 ndash 226 716 ndash 817
LABOUR INCOME ($) 027 010 ndash 013 008 ndash 011 045 ndash 050
014 KPMG LLP a Canadian limit ed liability par tnership and a member firm of the KPMG network of independent member
s affiliated with KPMG International Cooperative (ldquoKPMG Internationalrdquo) a Swiss entity All rights reserved
copy 2014 KPMG LLP a Canadian limit ed liability par tnership and a member firm of the KPMG network of independent member
firms affiliated with KPMG International Cooperative (ldquoKPMG Internationalrdquo) a Swiss entity All rights reserved
British Columbia Technology Report Card
Economic Impact Assess
8102019 BC Technology Report Card 2014 Edition
httpslidepdfcomreaderfullbc-technology-report-card-2014-edition 2627
GDP
JOBS
LABOUR INCOME
$91 BTech Revenues
Additional
Direct Impact Indirect Impact Induced Impact Total Impact
$59B
33K
$25B
$15B ndash 2B
17K ndash 21K
$09B ndash 12B
$17B ndash 23B
15K ndash 21K
$07B ndash 10B
$91B ndash 102B
65K ndash 74K
$41B ndash 46B
Economic Impact of BC Technology Industry Growth
demonstrate the magnitude of potential economic benefit from growing the BC technology industry
e chose to estimate these benefits in the context of a specific growth figure As shown in the GDP
alysis section of this report BC trails significantly many US states as well as the US average in terms
the share of the technology industry to the economy as a whole We asked the question ndash what
ould be the economic impact if we caught up to the US average
e US technology industr y contributes 103 percen t to the overall US GDP as compared to 76 percent
ntributed by the BC technology industry to the BC economy To reach the current contribution level
the US the BC technology industr y will need to add an additional $6 B in GDP corresponding to an
ditional $9B in technology industry revenues (given current industry multipliers)
ur analysis indicates that growing to 103 percent of the provincial economy would bring an additional1B in BC technology indust ry revenues and an associ ated increase of $91B ndash 102B in total GDP
K ndash 74K additional jobs created or sustained and a $41B ndash 46B increase in labour income This
pact breaks down in direct indirect and induced impact as follows
conomic Impact of Growing the BC Technology Industry Contribution to Match the US
While this report card clearly demonstrates the tech
industryrsquos importance to BCrsquos economy itrsquos the possibilities
revealed that most command our attention And itrsquos in our
flaws that our future lies Despite the industryrsquos provincial
strength we trail our Canadian peers on a number of
metrics such as the availability of local venture capital
building field-specific talent pools and increasing firm size
But though these challenges are significant identifying
them ndash knowing what we have to do and where to apply our
resources investments and commitments ndash provides a clear
roadmap for improvement and sustainable success
Wersquore in a very good place The potential for BC tech to become
a major national and global player is right in front of us Indeed
a number of technology companies are already flourishing in
BC with significant operations owned or being built by
bull Canadarsquos largest defense company MDA
bull Canadarsquos largest cleantech company Westport
bull Worldrsquos largest machine-to-machine wireless company
Sierra Wireless
bull Canadarsquos largest social media management company
Hootsuite
bull The first commercial quantum computing company Dwave
bull And global leaders like Amazon Best Buy Boeing
Electronic Arts Microsoft IBM McKesson Sams
Schneider Electri c Sony Imageworks and SAP
As these and other companies have realized BC is o
the most vibrant start-up ecosystems anywhere in th
one that regularly translates great ideas creative tale
audacious vision into some of the hottest tech compaaround Itrsquos a dynamic environment teeming with bra
entrepreneurs who thrive on their peersrsquo global aspira
With this core of industry infrastructure top talent an
innovative thinking in place BC is well positioned to
the tech industryrsquos many emerging and evolving opp
Every powder keg however needs a fuse BC is a te
hot spot but we have to keep stoking the fires of in
ambition and talent to ensure the positive gains mad
2012 become major leaps the next time we take stoc
means we have to work together ndash emerging tech st
ups and major corporate players industry investors a
trend-setters policy makers and academic leaders al
we continue to improve in the key areas identified in
report we can keep building the momentum BC tech
to realize its provincial successes and gains on the n
and global scales
ConclusionTaking the next step together
AcknowledgementsKPMG would like to gratefully acknowledge the support of BC Stats in the development of this report
Our detailed statistical analysis would not have been possible without the rich collection of BC industry
data provided to us by BC Stats
014 KPMG LLP a Canadian limit ed liability par tnership and a member firm of the KPMG network of independent member
s affiliated with KPMG International Cooperative (ldquoKPMG Internationalrdquo) a Swiss entity All rights reserved
copy 2014 KPMG LLP a Canadian limit ed liability par tnership and a member firm of the KPMG network of independent member
firms affiliated with KPMG International Cooperative (ldquoKPMG Internationalrdquo) a Swiss entity All rights reserved
British Columbia Technology Report Card 2014 British Columbia Technology Report Card
Economic Impact Assessment Concl
8102019 BC Technology Report Card 2014 Edition
httpslidepdfcomreaderfullbc-technology-report-card-2014-edition 2727
KPMG in Canada provides Audit Tax and Advisory services We work closely with our clients
helping them to mitigate risks and grasp opportunities
KPMG in Canada is committed to our clients We have made considerable investments in regards to
personnel research and hard-won experience Through these investments we strive to be the best
in everything we do turning our experience and industry knowledge into real value for our clients
This is the KPMG Way
Contact us
For more information please contact your KPMG adviser or one of the following professionals
Anthony Lindsay
Partner Greater Vancouver Area Market Leader
Technology Media and Telecommunications
T 604-646-6379
E tdlindsaykpmgca
Slavi Diamandiev
Greater Vancouver Area
Economics Practice Leader
Management Consulting
T 604-673-4458
E sdiamandievkpmgca
Ed Zacharuk
Partner Greater Vancouver Area SRampED
Practice Leader
T 604-691-3201
E ezacharukkpmgca
Sukesh Kumar
Partner National Leader India Desk
T 604-527-3468
E skumarkpmgca
Walter Pela
Partner in Charge of Tax Services
Greater Vancouver Area
T 604-691-3193
E wpelakpmgca
Ian Wilshaw
Partner Greater Vancouver Area Market Leader
Private Equity
T 604-691-3557
E idwilshawkpmgca
The information contained herein is of a general nature and is not intended to address the circumstances of any particular individual or entity Although we endeavor to
provide accurate and timely information there can be no guarantee that such information is accurate as of the date it is received or that it will continue to be accurate in
the future No one should act on such information without appropriate professional advice after a thorough examination of the particular situation
kpmgcatmt
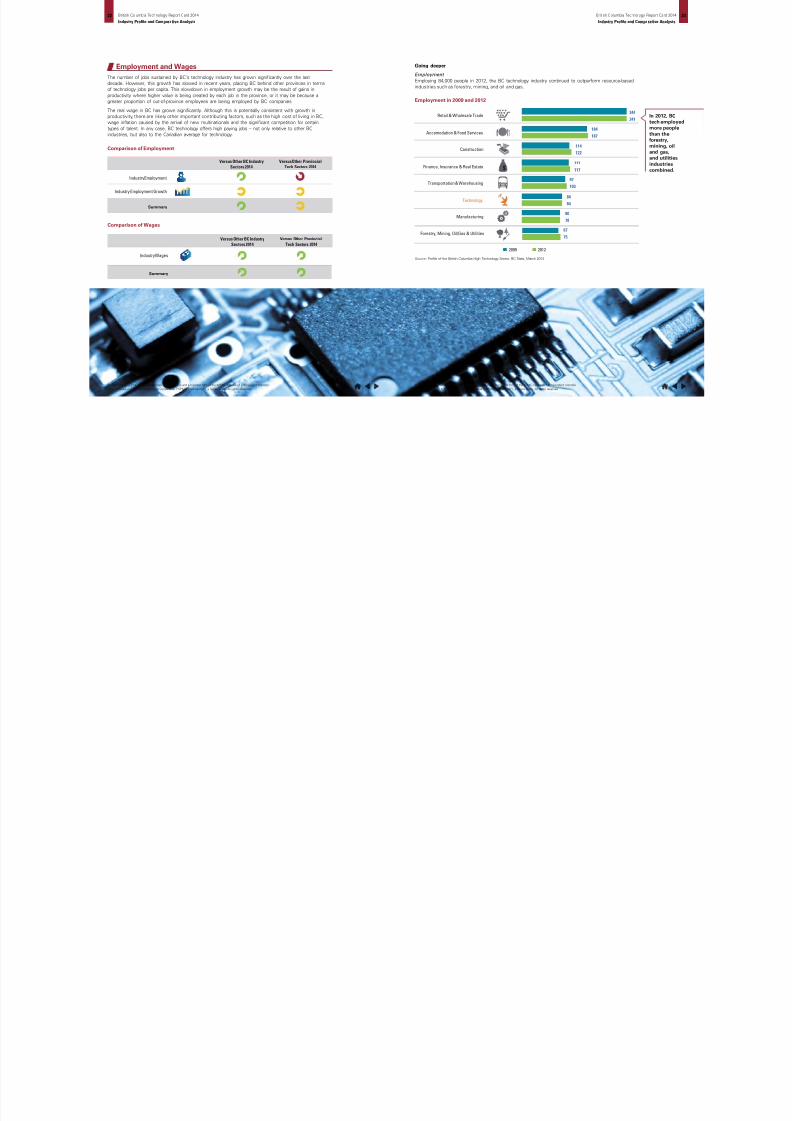
8102019 BC Technology Report Card 2014 Edition
httpslidepdfcomreaderfullbc-technology-report-card-2014-edition 1427
owever while the technology sector experienced the third highest growth in employment among all
e industries in BC between 1999 and 2012 employment has been flat since 2009 9
or reference the min ing oil amp gas and extraction industr y which experienced the highest growth in employment between 1999 and 2012 started
t one-sixth the employment level of the technology industry in the base year 1999 and remains significantly lower in 2012 at 22000 employees
101
68
38
35
ndash44
ndash14
6
16
22
32
1101009080706050403020100ndash10ndash20ndash30ndash40ndash50
Mining Oil and Gas Extraction
Construction
Technology
ccomodation amp Food Services
Retail amp Wholesale Trade
Transportation amp Warehousing
ance Insurance amp Real Estate
Utilities
Manufacturing
Forestry
mployment Growth between 1999 and 2012
urce Profile of the British Columbia High Technology Sector BC Stats March 2014
The tech
sector hasexperiencedthe thirdhighestgrowth in
employmentin the provincesince 1999However
growth hasbeen minimalsince 2009
Some companies suggested that employment had in fact grown in more recent years and that
the demand for talent is as high as ever assertions which would not be reflected in data ending at
2012 It was also suggested that companies have been employing personnel outside the province
due in the part to limited talent availability in certain areas ndash another factor which is not captured by
the analysis On the other hand leaders from larger BC technology companies supported the view
that employment growth has slowed driven by productivity gains and a focus on better utilizing
existing employees
Deeper analysis of the employment data suggests variation in the employment trend by industry sector
and firm size For example between 2009 and 2012 there was a notable decline in employment in
BCrsquos ldquomotion picture and post-productionrdquo sector This was compensated for however by healthy
employment growth in other t ech sectors such as ldquoengineering and other servicesrdquo
Industry leaders have also predicted industry growth since 2013 again an assertion which our
data would not reflect
Industry Insights on Employment Trends
Technology Jobs per 100000 Population
Canada Tech Industry GDP per Person Employed
Source Profile of the British Columbia High Technology Sector BC Stats March 2014
Source KPMG analysis of data from Profile of the British Columbia High Technology Sector BC Stats March 2014
On a per capita basis BCrsquos technology sector employment has remained stable since 2009 at
approximately 18 percent below the Canadian average
The improvement in GDP concurrent with flat employment numbers implies that BC is the only province
where technology labour productivity has potentially improved over the last five years
3000
2500
2000
1500
1000
2002 2003 2004 2005 2006 2007 2008 2009 2010 2011 2012
CanadaOnt ar io QueacutebecBritish Columbia Alberta
$180000
$170000
$160000
$150000
$140000
$130000
$120000
$110000
$100000
2007 2008 2009 2010 2011 2012
CanadaO ntar io Q ueacute be cBritish Columbia Alberta
BC tecemplo
per capbeen ssince 2
014 KPMG LLP a Canadian limit ed liability par tnership and a member firm of the KPMG network of independent member
s affiliated with KPMG International Cooperative (ldquoKPMG Internationalrdquo) a Swiss entity All rights reserved
copy 2014 KPMG LLP a Canadian limit ed liability par tnership and a member firm of the KPMG network of independent member
firms affiliated with KPMG International Cooperative (ldquoKPMG Internationalrdquo) a Swiss entity All rights reserved
British Columbia Technology Report Card 2014 British Columbia Technology Report Card
Industry Profile and Comparative Analysis Industry Profile and Comparative An
8102019 BC Technology Report Card 2014 Edition
httpslidepdfcomreaderfullbc-technology-report-card-2014-edition 1527
dustry Wages
nce the 2012 report card BCrsquos technology industry has seen rapid wage growth relative to the average
age in all other provincial industries In 2012 the average tech wage was 66 percent higher than the
erage for the economy as a whole compared with 58 percent in 2009
ationally the real weekly wage in BCrsquos technology industry has grown by twice as much as the Canadian
erage Moreover in 2012 BCrsquos technology industry wage was higher than the Canadian average and
mparable to the level in Ontario However BC continues to trail Alberta in this regard where technology
bs pay 20 percent higher and are comparable to US levels This is consistent with the overall trend in
ages in Alberta which are typically higher than BCrsquos across most industries
verage Earnings minus BC Technology versus BC
eal Weekly Wages (in 2012 prices)
0000
0000
0000
0000
0000
0000
0000
0000
2002 2003 2004 2005 2006 2007 2008 2009 2010 2011 2012
BC TechnologyBC All Industries
$0
urce KPMG analysis of data from Profile of the British Columbia High Technology Sector BC Stats March 2014
urce KPMG analysis of data from Profile of the British Columbia High Technology Sector BC Stats March 2014 and Statistics Canada
NSIM Table 326-0021
600
200
800
400
000
2002 2003 2004 2005 2006 2007 2008 2009 2010 2011 2012
CanadaQueacutebecOntarioAlbertaBritish Columbia US
BC tech jobsearn 66 percentmore than theBC average
salary
BC has higherpaying tech jobs than
the Canadianindustry asa whole
Exports
BC tech industry exports have experienced growth since the 2012 report card however there is room
for significant improvement when it comes to accessing new markets Globally the technology industrytends to be highly mobile since enterprises need not have operations in close proximity to their product
and service markets international trade becomes very important BC tech has the potential to make
significant progress on the global front since its current export performance is poor relative to the
Canadian industry as a whole and it has not experienced any significant growth over the last decade10
10 The data and a nalysis presented in this section is based on the best available data to date However service exports data may be an
underestimate of the true level of service exports As noted by BC Stats data for service exports is challenging to measure since it cannot
be tracked through customs databases Instead it is estimated using surveys and other information available to BC Stats (Profile of the
British Columbia High Technology Sector 2013)
Comparison of Exports
Industry Exports
Summary
Industry Exports Growth
Versus Other BC Industry Sectors 2014
While in theory the rise of the real wage reflects rising productivity there are likely other factors
at play in BCrsquos tech industry Some industry leaders interviewed by KPMG suggested that the
rising cost of living in BC is putting significant upward pressure on compensation Others pointed
to market distortions in specific types of jobs such as software development caused by the entry
of multinational firms that are willing to pay above-market rates to attract talent
Industry Insights on Wage Trends
014 KPMG LLP a Canadian limit ed liability par tnership and a member firm of the KPMG network of independent member
s affiliated with KPMG International Cooperative (ldquoKPMG Internationalrdquo) a Swiss entity All rights reserved
copy 2014 KPMG LLP a Canadian limit ed liability par tnership and a member firm of the KPMG network of independent member
firms affiliated with KPMG International Cooperative (ldquoKPMG Internationalrdquo) a Swiss entity All rights reserved
British Columbia Technology Report Card 2014 British Columbia Technology Report Card
Industry Profile and Comparative Analysis Industry Profile and Comparative An
8102019 BC Technology Report Card 2014 Edition
httpslidepdfcomreaderfullbc-technology-report-card-2014-edition 1627
oing deeper
2012 the BC technology industry exported $3 billion in goods and services with services accounting
r two-thirds of this amount ndash a ratio that has remained fairly constant over time11 Over the last
cade technology exports have grown very slowly and this growth has been notably poor in the
ars since the recession Between 2009 and 2012 while total exports from BC grew by 20 percent
C technology exports grew by only 5 percent
Data for BCrsquos technology services exports have been revised significantly downwards by BC Stats for the years since 2006 Therefore the
updated analysis of exports may not be consistent with the findings of the 2012 report card
500
000
500
000500
000
$500
$02 00 2 2 00 3
Goods Services
2004 2005 2006 2007 2008 2009 2010 2011 2012
C Technology Exports
urce Profile of the British Columbia High Technology Sector BC Stats July 2011
Exports of BC
tech goodsand serviceshave been
relativelystable
The technology industry comprises 65 percent of BCrsquos total exports ndash a figure relatively proportional
to its share of the provinci al GDP Of the total goods and ser vices exported the te ch industryrsquos share
of services is much higher than that of goods although its share has declined by 35 percent compared
to 2012 findings12
12 Based on the revised services export data published by BC Stats it is found that BC technologyrsquos share of total service exports in 2009 was
lower than the figure reported in the 2012 report card (it was 20 percent instead of 32 percent)
70
60
50
40
30
20
10
0
2001 2002 2003 2004 2005 2006 2007 2008 2009
B ri ti sh C ol um bi a C an ad a
Tech Exports (as a of Tech GDP)
Technol ogy O ther I ndustr ies
BC ExportShare
65
935
BC GDPShare
76
924
BC Goods Export Share
BC Services Export Share
13
3
87
97
$16 billion
$31 billion
Source Profile of the British Columbia High Technology Sector BC Stats March 2014
Source Profile of the British Columbia High Technology Sector BC Stats March 2014
However as a percentage of its output BC tech exports a smaller share than the Canadian tech
industry as a whole which implies that our export intensity is lower than that of tech industries in
other provinces
BC tecof provexport
proporto its sthe proeconom
BC tecexport28 perc
its totain 2009compa40 percoutput
exportethe Ca
technoindustr
copy 2014 KPMG LLP a Canadian limit ed liability par tnership and a member firm of the KPMG network of independent member
firms affiliated with KPMG International Cooperative (ldquoKPMG Internationalrdquo) a Swiss entity All rights reserved
014 KPMG LLP a Canadian limited liabi lity partnership and a member firm of the KPMG network of independent member
s affiliated with KPMG International Cooperative (ldquoKPMG Internationalrdquo) a Swiss entity All rights reserved
British Columbia Technology Report Card 2014 British Columbia Technology Report Card
Industry Profile and Comparative Analysis Industry Profile and Comparative An
8102019 BC Technology Report Card 2014 Edition
httpslidepdfcomreaderfullbc-technology-report-card-2014-edition 1727
om a trade balance perspective BC continues to be a significant net importer of technology goods
th the majority originating in the Pacific Rim The magnitude of these imports indicates there is local
mand for certain types of technology goods not being met by local supply
hile detailed trade data for technology services is lacking for BC a closer examination of technology
ods data reveals further insights
terms of exports while the US continues to be the largest consumer of BC technology goods there
s been a significant trend in market diversification towards the Pacific Rim and other countries over
e past decade
C Tech Goods Exports and Imports
urce Profile of the British Columbia High Technology Sector BC Stats March 2014
urce Profile of the British Columbia High Technology Sector BC Stats March 2014
Goods Exports Goods Imports
2002 2003 2004 2005 2006 2007 2008 2009 2010 2011 2012
$5000
$4000
$3000
$2000
$1000
$0
The share oftechnology
goods exportsfrom BC to theUS has beendeclining
BC imports$5 billionworth of
technologygoods whilegeneratingonly $1 billionin exports
Economic Performance Indicators ndash Summary
Current economic performance indicators largely confirm the findings of the 2012 report card
BC technology performs strongly compared to other provincial industries but continues to trail the
technology industries in other provinces To gain more perspective around the ldquowhyrdquo of these results
the following section analyzes inputs to the BC tech industry and highlights the root drivers of its
economic performance
Export readiness and the ability to successfully access new markets are closely correlated to firm
capacities Smaller companies often lack the resources capital and expertise necessary to readily
exploit new markets
The underperformance in BC tech exports relative to other provinces is likely related to the
overweighting of small and very small technology companies in BC Industry leaders observed
that smaller companies often require access to local early-adopter customers as a proving ground
before expanding to new markets As such both corporations and government agencies can play
an important role by helping improve product designmarketing processes and serving as a critical
reference customer
Despite this many BC tech companies find their productsservices are better received in foreign
markets than at home Even among leading companies very few indicate they have much or any
business with BC-based customers
Unlike the US there is as yet no funding set aside by provincial or federal governments to procure
locally from small businesses In fact in some cases the government procurement process has
minimum requirements that are beyond the capabilities of smaller companies
The tech industry is global and in many segments fiercely competitive Successfully growing
exports requires both financial capacity and management expertise ndash issues that BC tech
companies face regularly
Industry Insights on Exports and Market Access
014 KPMG LLP a Canadian limit ed liability par tnership and a member firm of the KPMG network of independent member
s affiliated with KPMG International Cooperative (ldquoKPMG Internationalrdquo) a Swiss entity All rights reserved
copy 2014 KPMG LLP a Canadian limit ed liability par tnership and a member firm of the KPMG network of independent member
firms affiliated with KPMG International Cooperative (ldquoKPMG Internationalrdquo) a Swiss entity All rights reserved
British Columbia Technology Report Card 2014 British Columbia Technology Report Card
Industry Profile and Comparative Analysis Industry Profile and Comparative An
8102019 BC Technology Report Card 2014 Edition
httpslidepdfcomreaderfullbc-technology-report-card-2014-edition 1827
art B Industry Input Indicatorshile the BC technology industry continues to perform well compared to other BC industries it continues
underperform relative to the technology industries in other provinces ndash although the gap is being
osed It is also generally behind the tech sectors of the countries in the Organization for Economic
o-operation and Development (OECD) particularly in the areas of t alent venture capital investment
d research and development (RampD) all of which are necessary growth drivers A closer assessment
BCrsquos technology industry inputs offers a glimpse into key areas of weakness and highlights areas
here appropriate targeted investment may serve to underwrite the sectorrsquos future performance
rt of the noted underperformance can be attributed to the capacity constraints of BC firms Populated
th small enterprises BC tech firms have a limited ability to raise capital investment invest in RampD
crease the available talent pool collaborate with post-secondary research institutes and build
ellectual property
C Technology Industry ndash 2014 Report Card
Talent Availability
Industr y Input Indicator s Ver sus O ther Provincial Tech Sectors 2014
Grade
Access to Capital
Research and Development
Intellectual Property
Cndash
bull Low talent availability ndash BC lags other provinces in granting engineering and sciences degrees
at both the undergraduate and graduate levels and is well below the OECD average in granting
technical doctoral degrees
bull Lack of venture capital investment ndash While BC has a relatively healthy level of angel
investment venture capital investment is largely lacking or insufficient
bull Lagging RampD investment ndash BC fares poorly compared to other provinces and OECD countries
on the level of RampD invested as a percentage of output Of particular concern is the declining
level of business expenditure on RampD which is already behind other jurisdictions
bull Fewer patents ndash BCrsquos level of patents granted lags other provinces and OECD countries on
both a per capita basis and as a percent of applications filed
Highlights
Talent Availability
Talent is a critical resource for the technology sector feeding the innovation and creativity that in turn
drive the global industry From information amp communications technology to engineering amp other
services to life sciences each sector relies on the availability of a skill-specific talent pool to meet
existing business demands and generate new growth ideas The technical skills required by the industry
are primarily developed at higher education institutions then nurtured within the industry The number of
degrees awarded in a province is therefore a useful measure of the technical talent available for firms
to draw on
While there has been an improvement in the granting of degrees in math and computer science in
BC relative to other provinces we continue to lag in the granting of degrees in other technical fields
BC fares particularly poorly in the architecture and engineering fields and underperforms the Canadian
average in life sciences Moreover BCrsquos performance has fallen relative to other OECD countries in the
granting of technical PhDs
Talent Availability
Undergraduate Degrees
Industry Input Indicators
Summary
Undergraduate Technology Degrees
Graduate Technology Degrees
Versus other Provincial Tech Sectors 2014
014 KPMG LLP a Canadian limit ed liability par tnership and a member firm of the KPMG network of independent member
s affiliated with KPMG International Cooperative (ldquoKPMG Internationalrdquo) a Swiss entity All rights reserved
copy 2014 KPMG LLP a Canadian limited liabi lity partnership and a member firm of the KPMG network of independent member
firms affiliated with KPMG International Cooperative (ldquoKPMG Internationalrdquo) a Swiss entity All rights reserved
British Columbia Technology Report Card 2014 British Columbia Technology Report Card
Industry Profile and Comparative Analysis Industry Profile and Comparative An
8102019 BC Technology Report Card 2014 Edition
httpslidepdfcomreaderfullbc-technology-report-card-2014-edition 1927
oing deeper
illed labour availability in BC as measured by the level of undergraduate degrees granted per capita
iled only Ontario in 2012 having grown steadily over the last three years13
Data for Queacutebec has been revised downwards significantly by BC Stats Undergraduate degrees per 100000 population was lower than the
evel in BC up to 2008 and remains that way till 2011
urce Profile of the British Columbia High Technology Sector BC Stats March 2014
0
0
0
0
0
0
0
20022001 2003 2004 2005 2006 2007 2008 2009 2010 2011
O ntar io Q ueacute be cBritish Columbia Alberta
ndergraduate Degrees per 100000 Population
nnual Undergraduate Degrees per 100000 Population 2011
owever in terms of the relevance of those degrees to the technology industry BC continues to
il other provinces on average For both undergraduate and graduate degrees BC is well behind the
nadian average and the degree rates of other provinces in the fields of architecture and engineering
e province is also behind the Canadian average in the granting of undergraduate and graduate degrees
the physical and life sciences disciplines Only in the fields of math computer science and information
ence has there been a positive trend since 2009 with BC now second only to Ontario in granting
th undergraduate and graduate degrees in these disciplines
Queacutebec Ont ario Alberta Brit ish ColumbiaCanada
0
0
0
0
0
0
0
0Undergraduate
Degrees ndash Architecture and
Engineering
Undergraduate
Degrees ndash Physical
and Life Sciences
Undergraduate
Degrees ndash Math Computer
and Information Science
BC produces thesecond highest
number ofundergraduateson a per capitabasis butcontinues to
trail Ontariosignificantly
Globally Canadarsquos rate of granting technology-related doctoral degrees per 1000 population in the
reference age cohort is well below the OECD average Since 2009 the level in Canada remained
the same at 12 percent while the OECD average improved slightly to 16 percent KPMG estimates
that BCrsquos rate of doctoral degrees of 06 percent also did not change since the last estimate in
2009 meaning a deficit of 60 percent versus other OECD jurisdictions More concerning yet is that
many of the countries that trailed Canada and British Columbia in 2000 had surpassed us by 2011
(eg Italy Iceland and Greece)
Source Profile of the British Columbia High Technology Sector BC Stats March 2014
Source KPMG Analysis and OECD Science Technology and Industry Scorecard 2013 OECD 2013
urce Profile of the British Columbia High Technology Sector BC Stats March 2014
Technology Related Doctoral Degrees as Percentage of Population in Reference Age Cohort
Annual Graduate Degrees per 100000 Population 2011
Queacutebec Ontario Alberta British ColumbiaCanada
300
250
200
150
100
50
00Graduate Degrees ndash
Architecture andEngineering
Graduate Degrees ndash Physicaland Life Sciences
Graduate Degrees ndash MathComputer and Information Science
014 KPMG LLP a Canadian limit ed liability par tnership and a member firm of the KPMG network of independent member
s affiliated with KPMG International Cooperative (ldquoKPMG Internationalrdquo) a Swiss entity All rights reserved
copy 2014 KPMG LLP a Canadian limit ed liability par tnership and a member firm of the KPMG network of independent member
firms affiliated with KPMG International Cooperative (ldquoKPMG Internationalrdquo) a Swiss entity All rights reserved
British Columbia Technology Report Card 2014 British Columbia Technology Report Card
Industry Profile and Comparative Analysis Industry Profile and Comparative An
8102019 BC Technology Report Card 2014 Edition
httpslidepdfcomreaderfullbc-technology-report-card-2014-edition 2027
Access to Capital
ccess to risk capital throughout the growth cycle is one of
e most significant determinants of tech sector success
has been empirically established that companies that
ceive risk capital have a significantly higher survival rate
perience stronger revenue employee wage and asset
owth and invest in higher levels of RampD 14
e BC technology industry has had a healthy growth in
gel investment which typically takes the form of seed
pital that helps in the emergence of start-ups However
rly stage venture capital investment ndash a necessary fuel
r growing start-ups into thriving companies ndash is deficient
BC and has been declining in recent years And of the
early stage venture capital that is invested there has
been a decline in the share invested by local funds which
deprives companies not only of adequate risk capital but
also of the guidance and networking opportunities that
are essential in early growth stages At the same time
BC companies attract a significant amount of foreign and
extra-provincial investment at the later stages of growth
Together these findings suggest that small technology firms
in BC are limited in their ability to access timely risk capital
that can propel their growth and firms that successfully
attract foreign venture capital may be at risk of relocating
outside BC
These findings can be explored in detail in the recent study by CVCA and Industry Canada titled ldquoThe Performance of Canadian Firms that
Received Venture Capital Financingrdquo published in June 2013
ccess to Capital
Access to Angel Investment
Summary
Access to Venture Capital
Are at Versus Other Provincial Tech Sectors 2014
Industry leaders almost universally agreed that access
to talent has become the most significant issue facing
their firms They cite a tightening of talent availability
over the past few years growing shortages in certain
key technical areas including software and web
development and a need to expand the available talent
pool in areas such as industrial technologies and sales
and marketing as critical issues
The challenges in talent availability have been exacerbated
by the arrival or impending arrival of several multinational
firms on the BC tech scene With a relatively constrained
talent pool the competition for available resources has
increased and with it compensation levels have risen
Several of the larger US-based multinationals are offering
compensation packages at significant premiums over the
average compensation levels in the BC market leading
to growing talent development attraction and retention
challenges for smaller BC companies In some cases this
has led to BC-based companies establishing or growing
their operations outside of BC where talent is less
expensive and more available
Leaders agreed that long-term industry success will
require an expanded talent pool developed by improving
the quantity and quality (job-readiness) of post-secondary
degree programs as well as by attracting talent from
outside of BC and Canada
The high cost of real estate was cited as a primary
barrier to attracting outside talent particularly where
mid- and senior-level management must be relocated
As a result companies are looking at alternative ways
of addressing relocation costs and at targeting talentmarkets where the cost differential or the expectation
of home ownership are less
Industry Insights on Talent Availability
In recent years the vast majority of venture capital invested in BC was in later stage financing Early
stage venture capital is significantly more limited and has been declining over the last few years
Capital by Stage of Investment
Venture Capital by Stage of Investment
Going deeper
BC has experienced steady growth in the level of angel investments in the province since the mid-2000s
Venture capital investment on the other hand has been more volatile
Source CVCA and BCTIA analysis of Thompson Reuters Data
Source CVCA and BCTIA analysis of Thompson Reuters Data
$0
$100
$200
$300
4
2003
$40
$110
2004
$31
$254
2005
$32
$226
2006
$54
$298
2007
$54
$316
2008
$64
$260
2009
$67
$141
2010
$72
$223
2011
$87
$233
2012
$97
$201
Ve ntur e C ap ital Ang el
$ m i l l i o n
$0
$100
$200
$300
$51
$172
$43
$190
$16
$185
2010 2011 2012
VC Later Stage VC Early Stage
$ m i l l i o n
014 KPMG LLP a Canadian limit ed liability par tnership and a member firm of the KPMG network of independent member
s affiliated with KPMG International Cooperative (ldquoKPMG Internationalrdquo) a Swiss entity All rights reserved
copy 2014 KPMG LLP a Canadian limit ed liability par tnership and a member firm of the KPMG network of independent member
firms affiliated with KPMG International Cooperative (ldquoKPMG Internationalrdquo) a Swiss entity All rights reserved
British Columbia Technology Report Card 2014 British Columbia Technology Report Card
Industry Profile and Comparative Analysis Industry Profile and Comparative An
8102019 BC Technology Report Card 2014 Edition
httpslidepdfcomreaderfullbc-technology-report-card-2014-edition 2127
verall BC placed second to last in the level of total venture capital invested among the 20 North
merican jurisdictions examined This is particularly concerning as the technology industry is inherently
obile and decisions regarding the location of operations can be significantly influenced by structural
ctors such as access to capital rather than the presence of local demand
e decline in locally sourced early stage capital is particularly concerning given its importance At the
me time a significant share of later stage investment originates from foreign sources which presents
potential risk that firms may subsequently relocate outside of BC
urce CVCA and BCTIA analysis of Thompson Reuters Data
urce KPMG Analysis of Thomson Reuters Data
$million
$33
$18
$11
$32
$0
$10
$20
$30
$40
2010 2011 2012
$3
$12
CanadianForeign
arly Stage VC Investment by Source
enture Capital Investments 2012
C a
l i f o r n
i a
M a s s e c
h u s e t t s
N e w
Y o r k
T e x a s
W a s
h i n g t o n
M a r y
l a n
d
U t a
h
O h i o
N e w
J e r s e y
O n t a r i o
V i r g i n i a
Q u e
b e c
B r i t i s
h C o
l u m
b i a
P e n n s y
l v a n
i a
I l l i n o
i s
A r i z o n a
C o
l o r a
d o
G e o r g
i a
M i n n e s o t a
M i c h i g a n
V C P e r
C a p
i t a -
$
$500
$450
$400
$350
$300
$250
$200
$150
$100
$50
$0
$6000
$5000
$4000
$3000
$2000
$1000
$0
VC per capita 2012Venture Capital 2012
Locallysourced earlystage VC
investmenthas beendeclining
Research and Development
RampD expenditure is the long-term investment in an industryrsquos future economic performance It measures
commitment to using innovation and knowledge creation to enhance productivity and improve competitiveness
Over the last few years there has been little increase in overall RampD investment in BC As such it
ranks below Ontario and Queacutebec However the composition of RampD spending has changed over time
with the share of business investment in RampD experiencing a steady decline The fact that the industry
is populated with small firms with fewer than 50 employees can help explain this trend BC is host to
very few large anchor companies that have the revenues and the capital to spend in significant ways
on research for the purposes of enhancing competitiveness
Research and Development
Summary
BERD as a Percentage of GDP
RampD as a Percentage of GDP
Versus other Provincial Tech Sectors 2014
The technology industry leaders interviewed recognized that there is a healthy local angel
network in BC However early stage venture capital financing in BC is seen as either absent
or modest making it difficult for small companies to grow There is a sense that attracting
venture capital from out-of-province is also challenging because physical proximity is an
important investment factor
Overall the opinion was that the limited presence of venture capital in BC leads to an absence
of investment competition which impacts competitive valuation and terms Industry leaders also
noted that local venture capital funds often take a revenue-based valuation approach Paradoxically
this may mean that a company can be valued higher by an angel investor prior to earning any
revenue than by an institutional investor once it starts generating revenue Since angel investors
typically expect high returns on initial investment this may make it difficult for small companies
to raise subsequent rounds of institutional financing often leaving them with prospects of
constrained growth due to limited capitalization or the option of selling early This lack of breadth
in the capital pool can lead to a vicious cycle of limited company growth and depressed valuations
of small companies seeking funding
Industry Insights on Risk Capital Investment
014 KPMG LLP a Canadian limit ed liability par tnership and a member firm of the KPMG network of independent member
s affiliated with KPMG International Cooperative (ldquoKPMG Internationalrdquo) a Swiss entity All rights reserved
copy 2014 KPMG LLP a Canadian limit ed liability par tnership and a member firm of the KPMG network of independent member
firms affiliated with KPMG International Cooperative (ldquoKPMG Internationalrdquo) a Swiss entity All rights reserved
British Columbia Technology Report Card 2014 British Columbia Technology Report Card
Industry Profile and Comparative Analysis Industry Profile and Comparative An
8102019 BC Technology Report Card 2014 Edition
httpslidepdfcomreaderfullbc-technology-report-card-2014-edition 2227
BC total RampD spending as a percent of GDP has remained relatively constant since 2008 Other
ovinces experienced a slight decline in this metric While BC remains higher than Alberta in this
gard it still makes up only 60 percent of the RampD expenditure levels in Ontario and Queacutebec
oing deeper
$3 billion there was no significant increase in the total RampD expenditure in BC since 2008 although
e composition of the spending changed The share of higher education and private non-profit
penditure continued to grow from 39 percent in 2008 to 43 percent in 2010 while that of business
terprise shrank by an equivalent amount to 53 percent in 2010
urce Profile of the British Columbia High Technology Sector BC Stats March 2014
urce Profile of the British Columbia High Technology Sector BC Stats March 2014
0
500
1000
1500
2000
2500
3000
3500
2000 2001 2002 2003 2004 2005 2006 2007 2008 2009 2010
Business Enterprise Higher Education amp Private Non-Profit
F ed er al Go vt P ro vin ci al Go ve rn me nt amp Re se ar ch In st it ut ion s
ampD Expenditures in British Columbia
ampD as a Percent of GDP
000
050
100
150
200
250
300
2007 2008 2009 2010
Ont ar io QueacutebecBritish Columbia Alberta
Overall RampDinvestment in
BC has beenconstant withan increase
in highereducation
spendingequal to thereductionin business
investmentin RampD
BCrsquos levelof RampD as apercentageof GDP has
been constantbut remains40 percent
lower thanOntario and
Queacutebec
Source KPMG Analysis of BC Stats Data and OECD Science Technology and Industry Scorecard 2013 OECD 2013
RampD Expenditure as a Percent of GDP
Since the last report card BC did not improve its global standing in RampD intensity as it continues
to perform 40 percent below the OECD average
I S R
K O R
F I N
J P N
S
W E
C H E
D N K
D E U
U S A
A U T
S V N
I S L
O E C D
E S T
F R A
C H N
B E L
O N
A U S
E
U 2 8
N L D
C Z E
G B R
L U X
C A N
I R L
N O R
P R T
B C
E S P
Z A F
I T A
H
U N
N Z L
R U S
M
E X
T U R
P O L
S V K
C H L
0
1
2
3
4
5
2011 2001
Q C
The BERD (business expenditures on RampD) ratio ndash which reflects the level of industry commitment
within the technology industry ndash has fallen for all provinces since 2008 BC still performs better than
Alberta with its businesses contributing 078 percent of GDP to RampD investment but remains well
below Queacutebec and Ontario which contribute 142 percent and 109 percent respectively
Source Profile of the British Columbia High Technology Sector BC Stats March 2014
Business Expenditure on RampD as a Percent of GDP
0
05
10
15
20
2007 2008 2009 2010
P e r c e n t o f G D P
CanadaOntario QueacutebecBritish Columbia Alberta
BusineRampD apercen
of GDPis 20 plower tCanad
BC fell below averageexpendpercent
014 KPMG LLP a Canadian limit ed liability par tnership and a member firm of the KPMG network of independent member
s affiliated with KPMG International Cooperative (ldquoKPMG Internationalrdquo) a Swiss entity All rights reserved
copy 2014 KPMG LLP a Canadian limit ed liability par tnership and a member firm of the KPMG network of independent member
firms affiliated with KPMG International Cooperative (ldquoKPMG Internationalrdquo) a Swiss entity All rights reserved
British Columbia Technology Report Card 2014 British Columbia Technology Report Card
Industry Profile and Comparative Analysis Industry Profile and Comparative An
8102019 BC Technology Report Card 2014 Edition
httpslidepdfcomreaderfullbc-technology-report-card-2014-edition 2327
0
0
0
0
0
0
0
0
0
I S R K O R F I N J
P N S W E C
H E D N K
D E U
U S A
A U T
S V N I S L
O E C D E
S T F R A
C H N B
E L A U S
E U 2 8 I R L C
Z E G B R
L U X
C A N N
L D N O R B C
H U N E
S P P R T I T A R
U S N Z L
Z A F
T U R
S V K
P O L
M E X
C H L
2011 2001
usiness Expenditure on RampD as a Percent of GDP
Crsquos BERD remained 50 percent below the OECD average and did not experience any change from the
01 level This means between 2001 and 2011 BC was surpassed by countries like China and Australia
their level of BERD investment as a p ercent of GDP
urce KPMG Analysis of BC Stats Data and OECD Science Technology and Industry Scorecard 2011 OECD 2011
BusinessRampD in BCis one-thirdthe level of
leading OECDcountries
Going deeper
Compared to other provinces with significant technology industries BC continues to trail in terms of both
the number of patents filed and the number of patents granted on both an absolute and per capita basis
Intellectual Property
Canadian Patents Filed and Granted
Source Canadian Patent Office
Intellectual Property
Intellectual property is a bellwether of the inventory of assets that can be commercialized to underwrite
future economic performance As measured by the number of patent applications submitted and
granted intellectual property reflects the success of RampD investment in the development of innovative
products provides an indication of the commercial viability of research and provides an indication of the
competitiveness of the technology industry as a whole Consistent with the findings of the 2012 report
card BC still ranks well below all other provinces with significant technology industries in the level of
patents awarded both on a per capita basis and as a percentage of applications filed
Patents Granted
Versus Other Provincial Tech Sectors 2014
Summary
0
500
1000
1500
2000
2500
Patents Filed ndash2011
Patents Filedndash2012
Patents Granted ndash2011
Patents Granted ndash2012
Ontario Queacutebec Alberta British Columbia
copy 2014 KPMG LLP a Canadian limit ed liability par tnership and a member firm of the KPMG network of independent member
firms affiliated with KPMG International Cooperative (ldquoKPMG Internationalrdquo) a Swiss entity All rights reserved
014 KPMG LLP a Canadian limited liabi lity partnership and a member firm of the KPMG network of independent member
s affiliated with KPMG International Cooperative (ldquoKPMG Internationalrdquo) a Swiss entity All rights reserved
British Columbia Technology Report Card 2014 British Columbia Technology Report Card
Industry Profile and Comparative Analysis Industry Profile and Comparative An
8102019 BC Technology Report Card 2014 Edition
httpslidepdfcomreaderfullbc-technology-report-card-2014-edition 2427
ore telling is the fact that BC has had the lowest level of patents awarded as a percent of applications
er the last decade
e prevalence of small firms in the BC technology sector has a direct impact on the capacity of
mpanies to successfully pursue patents Not only do they have limited capacity to invest in RampD to
velop patentable innovations but their capital constraints limit their ability to access the legal and
ministrative expertise needed to execute patent applications
atents Awarded per 100000 Population
atents Granted as a Percent of Patent Applications
urce Profile of the British Columbia High Technology Sector BC Stats March 2014
urce Profile of the British Columbia High Technology Sector BC Stats March 2014
00
00
00
00
00
00
00
00
00
2001 2002 2003 2004 2005 2006 2007 2008 2009 2010 2011
CanadaO ntar io Q ueacute be cBritish Columbia Alberta
2001 2002 2003 2004 2005 2006 2007 2008 2009 2010 2011
CanadaO ntar io Q ueacute be cBritish Columbia Alberta
BCrsquos patentperformancesignificantlytrails otherprovinces
Canada still ranks 18th well behind the worldrsquos leading countries in terms of the number of triadic
patent families per million population ndash a measure of patents taken at three major patent offices in
the world KPMGrsquos estimate for BC places it even further down the list than it was in 200815
Triadic Patent Families per Million Population 2010
Source KPMG Analysis of BC Stats Data and OECD Science Technology and Industry Scorecard 2013 OECD 2013
15 KPMG estimated BCrsquos ranking on the chart by considering the relative proportions of patents awarded in BC versus Canada as a whole on
a per capita basis
0
20
40
60
80
100
1
I D N
I N D
B R A
T U R
R U S
C H L
Z A F
C H N
P O L
S V K
G R C
C Z E
P R T
H U N
E S P
E S T
S V N
W L D
B C
I S L
N Z L
I T A
A U S
I R L
C A N
N O R
G B R
L U X
O E C D
B E L
F R A
K O R
I S R
U S A
A U T
N L D
D N K
F I N D E U
S W E
C H E
J P N
M E X
BCrsquos paperform
is one-the levleadingcountr
014 KPMG LLP a Canadian limit ed liability par tnership and a member firm of the KPMG network of independent member
s affiliated with KPMG International Cooperative (ldquoKPMG Internationalrdquo) a Swiss entity All rights reserved
copy 2014 KPMG LLP a Canadian limited liabi lity partnership and a member firm of the KPMG network of independent member
firms affiliated with KPMG International Cooperative (ldquoKPMG Internationalrdquo) a Swiss entity All rights reserved
British Columbia Technology Report Card 2014 British Columbia Technology Report Card
Industry Profile and Comparative Analysis Industry Profile and Comparative An
8102019 BC Technology Report Card 2014 Edition
httpslidepdfcomreaderfullbc-technology-report-card-2014-edition 2527
he technology industry not only generates GDP employment and income
ithin the technology sectors (referred to as direct impact) it also brings
dditional benefits to the overall BC economy by supporting suppliers to
e industry (indirect impact) and through the re-spending of labour income
arned in technology and supplier industries (induced impact)
ur economic impact analysis indicates that the overall impact of the technology industry on the BConomy is significantly magnified by the indirect and induced impacts We estimate that based on
rrent technology industry revenues of $23 billion the total contribution to the BC economy is
$23 ndash $26 billion in GDP
165000 ndash 188000 jobs created or sustained
$10 ndash $12 billion in total labour income
ese high levels of economic benefits are consistent with an industry that is high value-add employs
ghly skilled workers pays high wages and is well integrated in the economy 16
s noted earlier in the report while the technology industry has made a significant contribution to the
C economy our province still trails other Canadian provinces and US jurisdictions in this respect For
ample the BC technology ind ustry current ly comprises 76 percent of provincial GDP compared to
3 percent contribut ed by the US technology industry to US GDP So what would happen if the BC
chnology industry grew to comprise 103 percent of the provincial economy
ur analysis indicates that growing to 103 percent of the provincial economy would bring an additional
1B in BC technology industry revenues and an associated increase of $91B ndash 102B in total
DP 65K ndash 74K additional jobs created or sustained and a $41B ndash 46B increa se in labour
come These estimates include the combined benefits of the direct indirect and induced impacts
the economy
Economic ImpactAssessment
sti mating the technology industry economic impact is challenging due to the lack of standard technology industry classificati ons and
corresponding technology-specific impact multipliers To estimate the impact KPMG used weighted averages of standard industry sector impact
multipliers based on the definition of sectors comprising the tech industry We have chosen to represent the impacts as ranges using different
sectoral weights The use of ranges reflects the inherent variability in the technology industry caused by the diversity of sectors that it comprises
For example a dollar worth of output in the tech industry will have a different economic impact depending on whether it is generated by the
software publishing sector the telecommunication sector or the motion picture and post-production sector In our analysis of direct impacts we
have used figures reported by BC Stats To estimate the indirect and induced impacts we have used industry-standard multipliers developed by
Statistics Canada
Going deeper
Current BC Technology Industry Economic Impact
Given that the industry generated $23 billion in revenues we estimate that the industry contributed
$23 ndash $26 billion to total GDP created or sustained 165000 ndash 188000 jobs an d delivered $10 ndash $12 billion
to total labour income This impact breaks down in direct indirect and induced impact as follows
Current BC Tech Industry Impact
GDP
JOBS
LABOUR INCOME
$23 Bin Tech Industry
Revenues
Direct Impact Indirect Impact Induced Impact Total Impact
$15B
84K
$6B
$4B ndash 5B
43K ndash 52K
$4B ndash 6B
39K ndash 52K
$2B ndash 3B
$23B ndash 26B
165K ndash 188K
$10B ndash 12B$23B ndash 3B
BC Technology Industry Economic Impact Multipliers
In order to compare the technology industry to other industries as well as forecast the impact of
industry growth we have estimated the technology industry impact per dollar of revenue
We find that for each dollar of technology industry revenue the industry generates $1 ndash $112 in total
GDP and $045 ndash $05 in total labo ur income Further for each million dollars in te chnology industr y
revenue the industry generates or sustains seven to eight jobs in BC This impact breaks down in
direct indirect and induced impact as follows
Economic Impact Multiplier Estimates
GDP ($)
$1in Tech Revenues
For each
$1M in Tech Revenues
For each
Direct Impact Indirect Impact Induced Impact Total Impact
065 016 ndash 022 019 ndash 025 100 ndash 112
JOBS 362 186 ndash 228 168 ndash 226 716 ndash 817
LABOUR INCOME ($) 027 010 ndash 013 008 ndash 011 045 ndash 050
014 KPMG LLP a Canadian limit ed liability par tnership and a member firm of the KPMG network of independent member
s affiliated with KPMG International Cooperative (ldquoKPMG Internationalrdquo) a Swiss entity All rights reserved
copy 2014 KPMG LLP a Canadian limit ed liability par tnership and a member firm of the KPMG network of independent member
firms affiliated with KPMG International Cooperative (ldquoKPMG Internationalrdquo) a Swiss entity All rights reserved
British Columbia Technology Report Card
Economic Impact Assess
8102019 BC Technology Report Card 2014 Edition
httpslidepdfcomreaderfullbc-technology-report-card-2014-edition 2627
GDP
JOBS
LABOUR INCOME
$91 BTech Revenues
Additional
Direct Impact Indirect Impact Induced Impact Total Impact
$59B
33K
$25B
$15B ndash 2B
17K ndash 21K
$09B ndash 12B
$17B ndash 23B
15K ndash 21K
$07B ndash 10B
$91B ndash 102B
65K ndash 74K
$41B ndash 46B
Economic Impact of BC Technology Industry Growth
demonstrate the magnitude of potential economic benefit from growing the BC technology industry
e chose to estimate these benefits in the context of a specific growth figure As shown in the GDP
alysis section of this report BC trails significantly many US states as well as the US average in terms
the share of the technology industry to the economy as a whole We asked the question ndash what
ould be the economic impact if we caught up to the US average
e US technology industr y contributes 103 percen t to the overall US GDP as compared to 76 percent
ntributed by the BC technology industry to the BC economy To reach the current contribution level
the US the BC technology industr y will need to add an additional $6 B in GDP corresponding to an
ditional $9B in technology industry revenues (given current industry multipliers)
ur analysis indicates that growing to 103 percent of the provincial economy would bring an additional1B in BC technology indust ry revenues and an associ ated increase of $91B ndash 102B in total GDP
K ndash 74K additional jobs created or sustained and a $41B ndash 46B increase in labour income This
pact breaks down in direct indirect and induced impact as follows
conomic Impact of Growing the BC Technology Industry Contribution to Match the US
While this report card clearly demonstrates the tech
industryrsquos importance to BCrsquos economy itrsquos the possibilities
revealed that most command our attention And itrsquos in our
flaws that our future lies Despite the industryrsquos provincial
strength we trail our Canadian peers on a number of
metrics such as the availability of local venture capital
building field-specific talent pools and increasing firm size
But though these challenges are significant identifying
them ndash knowing what we have to do and where to apply our
resources investments and commitments ndash provides a clear
roadmap for improvement and sustainable success
Wersquore in a very good place The potential for BC tech to become
a major national and global player is right in front of us Indeed
a number of technology companies are already flourishing in
BC with significant operations owned or being built by
bull Canadarsquos largest defense company MDA
bull Canadarsquos largest cleantech company Westport
bull Worldrsquos largest machine-to-machine wireless company
Sierra Wireless
bull Canadarsquos largest social media management company
Hootsuite
bull The first commercial quantum computing company Dwave
bull And global leaders like Amazon Best Buy Boeing
Electronic Arts Microsoft IBM McKesson Sams
Schneider Electri c Sony Imageworks and SAP
As these and other companies have realized BC is o
the most vibrant start-up ecosystems anywhere in th
one that regularly translates great ideas creative tale
audacious vision into some of the hottest tech compaaround Itrsquos a dynamic environment teeming with bra
entrepreneurs who thrive on their peersrsquo global aspira
With this core of industry infrastructure top talent an
innovative thinking in place BC is well positioned to
the tech industryrsquos many emerging and evolving opp
Every powder keg however needs a fuse BC is a te
hot spot but we have to keep stoking the fires of in
ambition and talent to ensure the positive gains mad
2012 become major leaps the next time we take stoc
means we have to work together ndash emerging tech st
ups and major corporate players industry investors a
trend-setters policy makers and academic leaders al
we continue to improve in the key areas identified in
report we can keep building the momentum BC tech
to realize its provincial successes and gains on the n
and global scales
ConclusionTaking the next step together
AcknowledgementsKPMG would like to gratefully acknowledge the support of BC Stats in the development of this report
Our detailed statistical analysis would not have been possible without the rich collection of BC industry
data provided to us by BC Stats
014 KPMG LLP a Canadian limit ed liability par tnership and a member firm of the KPMG network of independent member
s affiliated with KPMG International Cooperative (ldquoKPMG Internationalrdquo) a Swiss entity All rights reserved
copy 2014 KPMG LLP a Canadian limit ed liability par tnership and a member firm of the KPMG network of independent member
firms affiliated with KPMG International Cooperative (ldquoKPMG Internationalrdquo) a Swiss entity All rights reserved
British Columbia Technology Report Card 2014 British Columbia Technology Report Card
Economic Impact Assessment Concl
8102019 BC Technology Report Card 2014 Edition
httpslidepdfcomreaderfullbc-technology-report-card-2014-edition 2727
KPMG in Canada provides Audit Tax and Advisory services We work closely with our clients
helping them to mitigate risks and grasp opportunities
KPMG in Canada is committed to our clients We have made considerable investments in regards to
personnel research and hard-won experience Through these investments we strive to be the best
in everything we do turning our experience and industry knowledge into real value for our clients
This is the KPMG Way
Contact us
For more information please contact your KPMG adviser or one of the following professionals
Anthony Lindsay
Partner Greater Vancouver Area Market Leader
Technology Media and Telecommunications
T 604-646-6379
E tdlindsaykpmgca
Slavi Diamandiev
Greater Vancouver Area
Economics Practice Leader
Management Consulting
T 604-673-4458
E sdiamandievkpmgca
Ed Zacharuk
Partner Greater Vancouver Area SRampED
Practice Leader
T 604-691-3201
E ezacharukkpmgca
Sukesh Kumar
Partner National Leader India Desk
T 604-527-3468
E skumarkpmgca
Walter Pela
Partner in Charge of Tax Services
Greater Vancouver Area
T 604-691-3193
E wpelakpmgca
Ian Wilshaw
Partner Greater Vancouver Area Market Leader
Private Equity
T 604-691-3557
E idwilshawkpmgca
The information contained herein is of a general nature and is not intended to address the circumstances of any particular individual or entity Although we endeavor to
provide accurate and timely information there can be no guarantee that such information is accurate as of the date it is received or that it will continue to be accurate in
the future No one should act on such information without appropriate professional advice after a thorough examination of the particular situation
kpmgcatmt
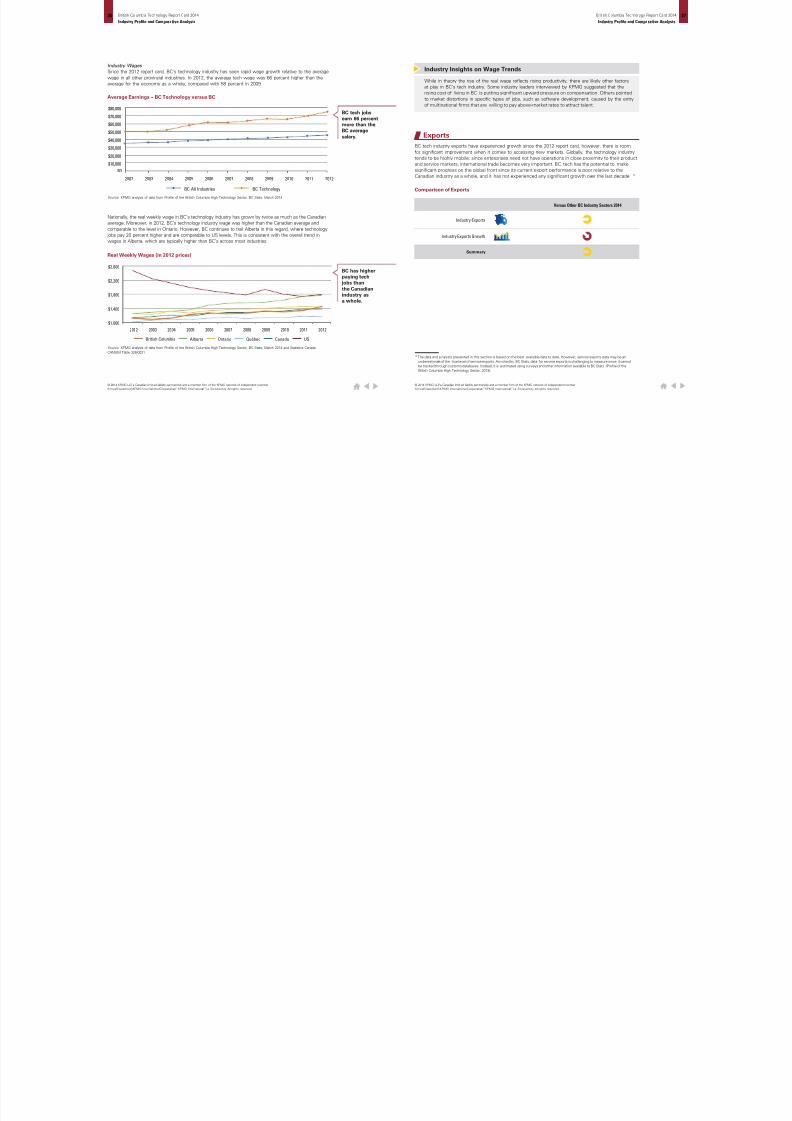
8102019 BC Technology Report Card 2014 Edition
httpslidepdfcomreaderfullbc-technology-report-card-2014-edition 1527
dustry Wages
nce the 2012 report card BCrsquos technology industry has seen rapid wage growth relative to the average
age in all other provincial industries In 2012 the average tech wage was 66 percent higher than the
erage for the economy as a whole compared with 58 percent in 2009
ationally the real weekly wage in BCrsquos technology industry has grown by twice as much as the Canadian
erage Moreover in 2012 BCrsquos technology industry wage was higher than the Canadian average and
mparable to the level in Ontario However BC continues to trail Alberta in this regard where technology
bs pay 20 percent higher and are comparable to US levels This is consistent with the overall trend in
ages in Alberta which are typically higher than BCrsquos across most industries
verage Earnings minus BC Technology versus BC
eal Weekly Wages (in 2012 prices)
0000
0000
0000
0000
0000
0000
0000
0000
2002 2003 2004 2005 2006 2007 2008 2009 2010 2011 2012
BC TechnologyBC All Industries
$0
urce KPMG analysis of data from Profile of the British Columbia High Technology Sector BC Stats March 2014
urce KPMG analysis of data from Profile of the British Columbia High Technology Sector BC Stats March 2014 and Statistics Canada
NSIM Table 326-0021
600
200
800
400
000
2002 2003 2004 2005 2006 2007 2008 2009 2010 2011 2012
CanadaQueacutebecOntarioAlbertaBritish Columbia US
BC tech jobsearn 66 percentmore than theBC average
salary
BC has higherpaying tech jobs than
the Canadianindustry asa whole
Exports
BC tech industry exports have experienced growth since the 2012 report card however there is room
for significant improvement when it comes to accessing new markets Globally the technology industrytends to be highly mobile since enterprises need not have operations in close proximity to their product
and service markets international trade becomes very important BC tech has the potential to make
significant progress on the global front since its current export performance is poor relative to the
Canadian industry as a whole and it has not experienced any significant growth over the last decade10
10 The data and a nalysis presented in this section is based on the best available data to date However service exports data may be an
underestimate of the true level of service exports As noted by BC Stats data for service exports is challenging to measure since it cannot
be tracked through customs databases Instead it is estimated using surveys and other information available to BC Stats (Profile of the
British Columbia High Technology Sector 2013)
Comparison of Exports
Industry Exports
Summary
Industry Exports Growth
Versus Other BC Industry Sectors 2014
While in theory the rise of the real wage reflects rising productivity there are likely other factors
at play in BCrsquos tech industry Some industry leaders interviewed by KPMG suggested that the
rising cost of living in BC is putting significant upward pressure on compensation Others pointed
to market distortions in specific types of jobs such as software development caused by the entry
of multinational firms that are willing to pay above-market rates to attract talent
Industry Insights on Wage Trends
014 KPMG LLP a Canadian limit ed liability par tnership and a member firm of the KPMG network of independent member
s affiliated with KPMG International Cooperative (ldquoKPMG Internationalrdquo) a Swiss entity All rights reserved
copy 2014 KPMG LLP a Canadian limit ed liability par tnership and a member firm of the KPMG network of independent member
firms affiliated with KPMG International Cooperative (ldquoKPMG Internationalrdquo) a Swiss entity All rights reserved
British Columbia Technology Report Card 2014 British Columbia Technology Report Card
Industry Profile and Comparative Analysis Industry Profile and Comparative An
8102019 BC Technology Report Card 2014 Edition
httpslidepdfcomreaderfullbc-technology-report-card-2014-edition 1627
oing deeper
2012 the BC technology industry exported $3 billion in goods and services with services accounting
r two-thirds of this amount ndash a ratio that has remained fairly constant over time11 Over the last
cade technology exports have grown very slowly and this growth has been notably poor in the
ars since the recession Between 2009 and 2012 while total exports from BC grew by 20 percent
C technology exports grew by only 5 percent
Data for BCrsquos technology services exports have been revised significantly downwards by BC Stats for the years since 2006 Therefore the
updated analysis of exports may not be consistent with the findings of the 2012 report card
500
000
500
000500
000
$500
$02 00 2 2 00 3
Goods Services
2004 2005 2006 2007 2008 2009 2010 2011 2012
C Technology Exports
urce Profile of the British Columbia High Technology Sector BC Stats July 2011
Exports of BC
tech goodsand serviceshave been
relativelystable
The technology industry comprises 65 percent of BCrsquos total exports ndash a figure relatively proportional
to its share of the provinci al GDP Of the total goods and ser vices exported the te ch industryrsquos share
of services is much higher than that of goods although its share has declined by 35 percent compared
to 2012 findings12
12 Based on the revised services export data published by BC Stats it is found that BC technologyrsquos share of total service exports in 2009 was
lower than the figure reported in the 2012 report card (it was 20 percent instead of 32 percent)
70
60
50
40
30
20
10
0
2001 2002 2003 2004 2005 2006 2007 2008 2009
B ri ti sh C ol um bi a C an ad a
Tech Exports (as a of Tech GDP)
Technol ogy O ther I ndustr ies
BC ExportShare
65
935
BC GDPShare
76
924
BC Goods Export Share
BC Services Export Share
13
3
87
97
$16 billion
$31 billion
Source Profile of the British Columbia High Technology Sector BC Stats March 2014
Source Profile of the British Columbia High Technology Sector BC Stats March 2014
However as a percentage of its output BC tech exports a smaller share than the Canadian tech
industry as a whole which implies that our export intensity is lower than that of tech industries in
other provinces
BC tecof provexport
proporto its sthe proeconom
BC tecexport28 perc
its totain 2009compa40 percoutput
exportethe Ca
technoindustr
copy 2014 KPMG LLP a Canadian limit ed liability par tnership and a member firm of the KPMG network of independent member
firms affiliated with KPMG International Cooperative (ldquoKPMG Internationalrdquo) a Swiss entity All rights reserved
014 KPMG LLP a Canadian limited liabi lity partnership and a member firm of the KPMG network of independent member
s affiliated with KPMG International Cooperative (ldquoKPMG Internationalrdquo) a Swiss entity All rights reserved
British Columbia Technology Report Card 2014 British Columbia Technology Report Card
Industry Profile and Comparative Analysis Industry Profile and Comparative An
8102019 BC Technology Report Card 2014 Edition
httpslidepdfcomreaderfullbc-technology-report-card-2014-edition 1727
om a trade balance perspective BC continues to be a significant net importer of technology goods
th the majority originating in the Pacific Rim The magnitude of these imports indicates there is local
mand for certain types of technology goods not being met by local supply
hile detailed trade data for technology services is lacking for BC a closer examination of technology
ods data reveals further insights
terms of exports while the US continues to be the largest consumer of BC technology goods there
s been a significant trend in market diversification towards the Pacific Rim and other countries over
e past decade
C Tech Goods Exports and Imports
urce Profile of the British Columbia High Technology Sector BC Stats March 2014
urce Profile of the British Columbia High Technology Sector BC Stats March 2014
Goods Exports Goods Imports
2002 2003 2004 2005 2006 2007 2008 2009 2010 2011 2012
$5000
$4000
$3000
$2000
$1000
$0
The share oftechnology
goods exportsfrom BC to theUS has beendeclining
BC imports$5 billionworth of
technologygoods whilegeneratingonly $1 billionin exports
Economic Performance Indicators ndash Summary
Current economic performance indicators largely confirm the findings of the 2012 report card
BC technology performs strongly compared to other provincial industries but continues to trail the
technology industries in other provinces To gain more perspective around the ldquowhyrdquo of these results
the following section analyzes inputs to the BC tech industry and highlights the root drivers of its
economic performance
Export readiness and the ability to successfully access new markets are closely correlated to firm
capacities Smaller companies often lack the resources capital and expertise necessary to readily
exploit new markets
The underperformance in BC tech exports relative to other provinces is likely related to the
overweighting of small and very small technology companies in BC Industry leaders observed
that smaller companies often require access to local early-adopter customers as a proving ground
before expanding to new markets As such both corporations and government agencies can play
an important role by helping improve product designmarketing processes and serving as a critical
reference customer
Despite this many BC tech companies find their productsservices are better received in foreign
markets than at home Even among leading companies very few indicate they have much or any
business with BC-based customers
Unlike the US there is as yet no funding set aside by provincial or federal governments to procure
locally from small businesses In fact in some cases the government procurement process has
minimum requirements that are beyond the capabilities of smaller companies
The tech industry is global and in many segments fiercely competitive Successfully growing
exports requires both financial capacity and management expertise ndash issues that BC tech
companies face regularly
Industry Insights on Exports and Market Access
014 KPMG LLP a Canadian limit ed liability par tnership and a member firm of the KPMG network of independent member
s affiliated with KPMG International Cooperative (ldquoKPMG Internationalrdquo) a Swiss entity All rights reserved
copy 2014 KPMG LLP a Canadian limit ed liability par tnership and a member firm of the KPMG network of independent member
firms affiliated with KPMG International Cooperative (ldquoKPMG Internationalrdquo) a Swiss entity All rights reserved
British Columbia Technology Report Card 2014 British Columbia Technology Report Card
Industry Profile and Comparative Analysis Industry Profile and Comparative An
8102019 BC Technology Report Card 2014 Edition
httpslidepdfcomreaderfullbc-technology-report-card-2014-edition 1827
art B Industry Input Indicatorshile the BC technology industry continues to perform well compared to other BC industries it continues
underperform relative to the technology industries in other provinces ndash although the gap is being
osed It is also generally behind the tech sectors of the countries in the Organization for Economic
o-operation and Development (OECD) particularly in the areas of t alent venture capital investment
d research and development (RampD) all of which are necessary growth drivers A closer assessment
BCrsquos technology industry inputs offers a glimpse into key areas of weakness and highlights areas
here appropriate targeted investment may serve to underwrite the sectorrsquos future performance
rt of the noted underperformance can be attributed to the capacity constraints of BC firms Populated
th small enterprises BC tech firms have a limited ability to raise capital investment invest in RampD
crease the available talent pool collaborate with post-secondary research institutes and build
ellectual property
C Technology Industry ndash 2014 Report Card
Talent Availability
Industr y Input Indicator s Ver sus O ther Provincial Tech Sectors 2014
Grade
Access to Capital
Research and Development
Intellectual Property
Cndash
bull Low talent availability ndash BC lags other provinces in granting engineering and sciences degrees
at both the undergraduate and graduate levels and is well below the OECD average in granting
technical doctoral degrees
bull Lack of venture capital investment ndash While BC has a relatively healthy level of angel
investment venture capital investment is largely lacking or insufficient
bull Lagging RampD investment ndash BC fares poorly compared to other provinces and OECD countries
on the level of RampD invested as a percentage of output Of particular concern is the declining
level of business expenditure on RampD which is already behind other jurisdictions
bull Fewer patents ndash BCrsquos level of patents granted lags other provinces and OECD countries on
both a per capita basis and as a percent of applications filed
Highlights
Talent Availability
Talent is a critical resource for the technology sector feeding the innovation and creativity that in turn
drive the global industry From information amp communications technology to engineering amp other
services to life sciences each sector relies on the availability of a skill-specific talent pool to meet
existing business demands and generate new growth ideas The technical skills required by the industry
are primarily developed at higher education institutions then nurtured within the industry The number of
degrees awarded in a province is therefore a useful measure of the technical talent available for firms
to draw on
While there has been an improvement in the granting of degrees in math and computer science in
BC relative to other provinces we continue to lag in the granting of degrees in other technical fields
BC fares particularly poorly in the architecture and engineering fields and underperforms the Canadian
average in life sciences Moreover BCrsquos performance has fallen relative to other OECD countries in the
granting of technical PhDs
Talent Availability
Undergraduate Degrees
Industry Input Indicators
Summary
Undergraduate Technology Degrees
Graduate Technology Degrees
Versus other Provincial Tech Sectors 2014
014 KPMG LLP a Canadian limit ed liability par tnership and a member firm of the KPMG network of independent member
s affiliated with KPMG International Cooperative (ldquoKPMG Internationalrdquo) a Swiss entity All rights reserved
copy 2014 KPMG LLP a Canadian limited liabi lity partnership and a member firm of the KPMG network of independent member
firms affiliated with KPMG International Cooperative (ldquoKPMG Internationalrdquo) a Swiss entity All rights reserved
British Columbia Technology Report Card 2014 British Columbia Technology Report Card
Industry Profile and Comparative Analysis Industry Profile and Comparative An
8102019 BC Technology Report Card 2014 Edition
httpslidepdfcomreaderfullbc-technology-report-card-2014-edition 1927
oing deeper
illed labour availability in BC as measured by the level of undergraduate degrees granted per capita
iled only Ontario in 2012 having grown steadily over the last three years13
Data for Queacutebec has been revised downwards significantly by BC Stats Undergraduate degrees per 100000 population was lower than the
evel in BC up to 2008 and remains that way till 2011
urce Profile of the British Columbia High Technology Sector BC Stats March 2014
0
0
0
0
0
0
0
20022001 2003 2004 2005 2006 2007 2008 2009 2010 2011
O ntar io Q ueacute be cBritish Columbia Alberta
ndergraduate Degrees per 100000 Population
nnual Undergraduate Degrees per 100000 Population 2011
owever in terms of the relevance of those degrees to the technology industry BC continues to
il other provinces on average For both undergraduate and graduate degrees BC is well behind the
nadian average and the degree rates of other provinces in the fields of architecture and engineering
e province is also behind the Canadian average in the granting of undergraduate and graduate degrees
the physical and life sciences disciplines Only in the fields of math computer science and information
ence has there been a positive trend since 2009 with BC now second only to Ontario in granting
th undergraduate and graduate degrees in these disciplines
Queacutebec Ont ario Alberta Brit ish ColumbiaCanada
0
0
0
0
0
0
0
0Undergraduate
Degrees ndash Architecture and
Engineering
Undergraduate
Degrees ndash Physical
and Life Sciences
Undergraduate
Degrees ndash Math Computer
and Information Science
BC produces thesecond highest
number ofundergraduateson a per capitabasis butcontinues to
trail Ontariosignificantly
Globally Canadarsquos rate of granting technology-related doctoral degrees per 1000 population in the
reference age cohort is well below the OECD average Since 2009 the level in Canada remained
the same at 12 percent while the OECD average improved slightly to 16 percent KPMG estimates
that BCrsquos rate of doctoral degrees of 06 percent also did not change since the last estimate in
2009 meaning a deficit of 60 percent versus other OECD jurisdictions More concerning yet is that
many of the countries that trailed Canada and British Columbia in 2000 had surpassed us by 2011
(eg Italy Iceland and Greece)
Source Profile of the British Columbia High Technology Sector BC Stats March 2014
Source KPMG Analysis and OECD Science Technology and Industry Scorecard 2013 OECD 2013
urce Profile of the British Columbia High Technology Sector BC Stats March 2014
Technology Related Doctoral Degrees as Percentage of Population in Reference Age Cohort
Annual Graduate Degrees per 100000 Population 2011
Queacutebec Ontario Alberta British ColumbiaCanada
300
250
200
150
100
50
00Graduate Degrees ndash
Architecture andEngineering
Graduate Degrees ndash Physicaland Life Sciences
Graduate Degrees ndash MathComputer and Information Science
014 KPMG LLP a Canadian limit ed liability par tnership and a member firm of the KPMG network of independent member
s affiliated with KPMG International Cooperative (ldquoKPMG Internationalrdquo) a Swiss entity All rights reserved
copy 2014 KPMG LLP a Canadian limit ed liability par tnership and a member firm of the KPMG network of independent member
firms affiliated with KPMG International Cooperative (ldquoKPMG Internationalrdquo) a Swiss entity All rights reserved
British Columbia Technology Report Card 2014 British Columbia Technology Report Card
Industry Profile and Comparative Analysis Industry Profile and Comparative An
8102019 BC Technology Report Card 2014 Edition
httpslidepdfcomreaderfullbc-technology-report-card-2014-edition 2027
Access to Capital
ccess to risk capital throughout the growth cycle is one of
e most significant determinants of tech sector success
has been empirically established that companies that
ceive risk capital have a significantly higher survival rate
perience stronger revenue employee wage and asset
owth and invest in higher levels of RampD 14
e BC technology industry has had a healthy growth in
gel investment which typically takes the form of seed
pital that helps in the emergence of start-ups However
rly stage venture capital investment ndash a necessary fuel
r growing start-ups into thriving companies ndash is deficient
BC and has been declining in recent years And of the
early stage venture capital that is invested there has
been a decline in the share invested by local funds which
deprives companies not only of adequate risk capital but
also of the guidance and networking opportunities that
are essential in early growth stages At the same time
BC companies attract a significant amount of foreign and
extra-provincial investment at the later stages of growth
Together these findings suggest that small technology firms
in BC are limited in their ability to access timely risk capital
that can propel their growth and firms that successfully
attract foreign venture capital may be at risk of relocating
outside BC
These findings can be explored in detail in the recent study by CVCA and Industry Canada titled ldquoThe Performance of Canadian Firms that
Received Venture Capital Financingrdquo published in June 2013
ccess to Capital
Access to Angel Investment
Summary
Access to Venture Capital
Are at Versus Other Provincial Tech Sectors 2014
Industry leaders almost universally agreed that access
to talent has become the most significant issue facing
their firms They cite a tightening of talent availability
over the past few years growing shortages in certain
key technical areas including software and web
development and a need to expand the available talent
pool in areas such as industrial technologies and sales
and marketing as critical issues
The challenges in talent availability have been exacerbated
by the arrival or impending arrival of several multinational
firms on the BC tech scene With a relatively constrained
talent pool the competition for available resources has
increased and with it compensation levels have risen
Several of the larger US-based multinationals are offering
compensation packages at significant premiums over the
average compensation levels in the BC market leading
to growing talent development attraction and retention
challenges for smaller BC companies In some cases this
has led to BC-based companies establishing or growing
their operations outside of BC where talent is less
expensive and more available
Leaders agreed that long-term industry success will
require an expanded talent pool developed by improving
the quantity and quality (job-readiness) of post-secondary
degree programs as well as by attracting talent from
outside of BC and Canada
The high cost of real estate was cited as a primary
barrier to attracting outside talent particularly where
mid- and senior-level management must be relocated
As a result companies are looking at alternative ways
of addressing relocation costs and at targeting talentmarkets where the cost differential or the expectation
of home ownership are less
Industry Insights on Talent Availability
In recent years the vast majority of venture capital invested in BC was in later stage financing Early
stage venture capital is significantly more limited and has been declining over the last few years
Capital by Stage of Investment
Venture Capital by Stage of Investment
Going deeper
BC has experienced steady growth in the level of angel investments in the province since the mid-2000s
Venture capital investment on the other hand has been more volatile
Source CVCA and BCTIA analysis of Thompson Reuters Data
Source CVCA and BCTIA analysis of Thompson Reuters Data
$0
$100
$200
$300
4
2003
$40
$110
2004
$31
$254
2005
$32
$226
2006
$54
$298
2007
$54
$316
2008
$64
$260
2009
$67
$141
2010
$72
$223
2011
$87
$233
2012
$97
$201
Ve ntur e C ap ital Ang el
$ m i l l i o n
$0
$100
$200
$300
$51
$172
$43
$190
$16
$185
2010 2011 2012
VC Later Stage VC Early Stage
$ m i l l i o n
014 KPMG LLP a Canadian limit ed liability par tnership and a member firm of the KPMG network of independent member
s affiliated with KPMG International Cooperative (ldquoKPMG Internationalrdquo) a Swiss entity All rights reserved
copy 2014 KPMG LLP a Canadian limit ed liability par tnership and a member firm of the KPMG network of independent member
firms affiliated with KPMG International Cooperative (ldquoKPMG Internationalrdquo) a Swiss entity All rights reserved
British Columbia Technology Report Card 2014 British Columbia Technology Report Card
Industry Profile and Comparative Analysis Industry Profile and Comparative An
8102019 BC Technology Report Card 2014 Edition
httpslidepdfcomreaderfullbc-technology-report-card-2014-edition 2127
verall BC placed second to last in the level of total venture capital invested among the 20 North
merican jurisdictions examined This is particularly concerning as the technology industry is inherently
obile and decisions regarding the location of operations can be significantly influenced by structural
ctors such as access to capital rather than the presence of local demand
e decline in locally sourced early stage capital is particularly concerning given its importance At the
me time a significant share of later stage investment originates from foreign sources which presents
potential risk that firms may subsequently relocate outside of BC
urce CVCA and BCTIA analysis of Thompson Reuters Data
urce KPMG Analysis of Thomson Reuters Data
$million
$33
$18
$11
$32
$0
$10
$20
$30
$40
2010 2011 2012
$3
$12
CanadianForeign
arly Stage VC Investment by Source
enture Capital Investments 2012
C a
l i f o r n
i a
M a s s e c
h u s e t t s
N e w
Y o r k
T e x a s
W a s
h i n g t o n
M a r y
l a n
d
U t a
h
O h i o
N e w
J e r s e y
O n t a r i o
V i r g i n i a
Q u e
b e c
B r i t i s
h C o
l u m
b i a
P e n n s y
l v a n
i a
I l l i n o
i s
A r i z o n a
C o
l o r a
d o
G e o r g
i a
M i n n e s o t a
M i c h i g a n
V C P e r
C a p
i t a -
$
$500
$450
$400
$350
$300
$250
$200
$150
$100
$50
$0
$6000
$5000
$4000
$3000
$2000
$1000
$0
VC per capita 2012Venture Capital 2012
Locallysourced earlystage VC
investmenthas beendeclining
Research and Development
RampD expenditure is the long-term investment in an industryrsquos future economic performance It measures
commitment to using innovation and knowledge creation to enhance productivity and improve competitiveness
Over the last few years there has been little increase in overall RampD investment in BC As such it
ranks below Ontario and Queacutebec However the composition of RampD spending has changed over time
with the share of business investment in RampD experiencing a steady decline The fact that the industry
is populated with small firms with fewer than 50 employees can help explain this trend BC is host to
very few large anchor companies that have the revenues and the capital to spend in significant ways
on research for the purposes of enhancing competitiveness
Research and Development
Summary
BERD as a Percentage of GDP
RampD as a Percentage of GDP
Versus other Provincial Tech Sectors 2014
The technology industry leaders interviewed recognized that there is a healthy local angel
network in BC However early stage venture capital financing in BC is seen as either absent
or modest making it difficult for small companies to grow There is a sense that attracting
venture capital from out-of-province is also challenging because physical proximity is an
important investment factor
Overall the opinion was that the limited presence of venture capital in BC leads to an absence
of investment competition which impacts competitive valuation and terms Industry leaders also
noted that local venture capital funds often take a revenue-based valuation approach Paradoxically
this may mean that a company can be valued higher by an angel investor prior to earning any
revenue than by an institutional investor once it starts generating revenue Since angel investors
typically expect high returns on initial investment this may make it difficult for small companies
to raise subsequent rounds of institutional financing often leaving them with prospects of
constrained growth due to limited capitalization or the option of selling early This lack of breadth
in the capital pool can lead to a vicious cycle of limited company growth and depressed valuations
of small companies seeking funding
Industry Insights on Risk Capital Investment
014 KPMG LLP a Canadian limit ed liability par tnership and a member firm of the KPMG network of independent member
s affiliated with KPMG International Cooperative (ldquoKPMG Internationalrdquo) a Swiss entity All rights reserved
copy 2014 KPMG LLP a Canadian limit ed liability par tnership and a member firm of the KPMG network of independent member
firms affiliated with KPMG International Cooperative (ldquoKPMG Internationalrdquo) a Swiss entity All rights reserved
British Columbia Technology Report Card 2014 British Columbia Technology Report Card
Industry Profile and Comparative Analysis Industry Profile and Comparative An
8102019 BC Technology Report Card 2014 Edition
httpslidepdfcomreaderfullbc-technology-report-card-2014-edition 2227
BC total RampD spending as a percent of GDP has remained relatively constant since 2008 Other
ovinces experienced a slight decline in this metric While BC remains higher than Alberta in this
gard it still makes up only 60 percent of the RampD expenditure levels in Ontario and Queacutebec
oing deeper
$3 billion there was no significant increase in the total RampD expenditure in BC since 2008 although
e composition of the spending changed The share of higher education and private non-profit
penditure continued to grow from 39 percent in 2008 to 43 percent in 2010 while that of business
terprise shrank by an equivalent amount to 53 percent in 2010
urce Profile of the British Columbia High Technology Sector BC Stats March 2014
urce Profile of the British Columbia High Technology Sector BC Stats March 2014
0
500
1000
1500
2000
2500
3000
3500
2000 2001 2002 2003 2004 2005 2006 2007 2008 2009 2010
Business Enterprise Higher Education amp Private Non-Profit
F ed er al Go vt P ro vin ci al Go ve rn me nt amp Re se ar ch In st it ut ion s
ampD Expenditures in British Columbia
ampD as a Percent of GDP
000
050
100
150
200
250
300
2007 2008 2009 2010
Ont ar io QueacutebecBritish Columbia Alberta
Overall RampDinvestment in
BC has beenconstant withan increase
in highereducation
spendingequal to thereductionin business
investmentin RampD
BCrsquos levelof RampD as apercentageof GDP has
been constantbut remains40 percent
lower thanOntario and
Queacutebec
Source KPMG Analysis of BC Stats Data and OECD Science Technology and Industry Scorecard 2013 OECD 2013
RampD Expenditure as a Percent of GDP
Since the last report card BC did not improve its global standing in RampD intensity as it continues
to perform 40 percent below the OECD average
I S R
K O R
F I N
J P N
S
W E
C H E
D N K
D E U
U S A
A U T
S V N
I S L
O E C D
E S T
F R A
C H N
B E L
O N
A U S
E
U 2 8
N L D
C Z E
G B R
L U X
C A N
I R L
N O R
P R T
B C
E S P
Z A F
I T A
H
U N
N Z L
R U S
M
E X
T U R
P O L
S V K
C H L
0
1
2
3
4
5
2011 2001
Q C
The BERD (business expenditures on RampD) ratio ndash which reflects the level of industry commitment
within the technology industry ndash has fallen for all provinces since 2008 BC still performs better than
Alberta with its businesses contributing 078 percent of GDP to RampD investment but remains well
below Queacutebec and Ontario which contribute 142 percent and 109 percent respectively
Source Profile of the British Columbia High Technology Sector BC Stats March 2014
Business Expenditure on RampD as a Percent of GDP
0
05
10
15
20
2007 2008 2009 2010
P e r c e n t o f G D P
CanadaOntario QueacutebecBritish Columbia Alberta
BusineRampD apercen
of GDPis 20 plower tCanad
BC fell below averageexpendpercent
014 KPMG LLP a Canadian limit ed liability par tnership and a member firm of the KPMG network of independent member
s affiliated with KPMG International Cooperative (ldquoKPMG Internationalrdquo) a Swiss entity All rights reserved
copy 2014 KPMG LLP a Canadian limit ed liability par tnership and a member firm of the KPMG network of independent member
firms affiliated with KPMG International Cooperative (ldquoKPMG Internationalrdquo) a Swiss entity All rights reserved
British Columbia Technology Report Card 2014 British Columbia Technology Report Card
Industry Profile and Comparative Analysis Industry Profile and Comparative An
8102019 BC Technology Report Card 2014 Edition
httpslidepdfcomreaderfullbc-technology-report-card-2014-edition 2327
0
0
0
0
0
0
0
0
0
I S R K O R F I N J
P N S W E C
H E D N K
D E U
U S A
A U T
S V N I S L
O E C D E
S T F R A
C H N B
E L A U S
E U 2 8 I R L C
Z E G B R
L U X
C A N N
L D N O R B C
H U N E
S P P R T I T A R
U S N Z L
Z A F
T U R
S V K
P O L
M E X
C H L
2011 2001
usiness Expenditure on RampD as a Percent of GDP
Crsquos BERD remained 50 percent below the OECD average and did not experience any change from the
01 level This means between 2001 and 2011 BC was surpassed by countries like China and Australia
their level of BERD investment as a p ercent of GDP
urce KPMG Analysis of BC Stats Data and OECD Science Technology and Industry Scorecard 2011 OECD 2011
BusinessRampD in BCis one-thirdthe level of
leading OECDcountries
Going deeper
Compared to other provinces with significant technology industries BC continues to trail in terms of both
the number of patents filed and the number of patents granted on both an absolute and per capita basis
Intellectual Property
Canadian Patents Filed and Granted
Source Canadian Patent Office
Intellectual Property
Intellectual property is a bellwether of the inventory of assets that can be commercialized to underwrite
future economic performance As measured by the number of patent applications submitted and
granted intellectual property reflects the success of RampD investment in the development of innovative
products provides an indication of the commercial viability of research and provides an indication of the
competitiveness of the technology industry as a whole Consistent with the findings of the 2012 report
card BC still ranks well below all other provinces with significant technology industries in the level of
patents awarded both on a per capita basis and as a percentage of applications filed
Patents Granted
Versus Other Provincial Tech Sectors 2014
Summary
0
500
1000
1500
2000
2500
Patents Filed ndash2011
Patents Filedndash2012
Patents Granted ndash2011
Patents Granted ndash2012
Ontario Queacutebec Alberta British Columbia
copy 2014 KPMG LLP a Canadian limit ed liability par tnership and a member firm of the KPMG network of independent member
firms affiliated with KPMG International Cooperative (ldquoKPMG Internationalrdquo) a Swiss entity All rights reserved
014 KPMG LLP a Canadian limited liabi lity partnership and a member firm of the KPMG network of independent member
s affiliated with KPMG International Cooperative (ldquoKPMG Internationalrdquo) a Swiss entity All rights reserved
British Columbia Technology Report Card 2014 British Columbia Technology Report Card
Industry Profile and Comparative Analysis Industry Profile and Comparative An
8102019 BC Technology Report Card 2014 Edition
httpslidepdfcomreaderfullbc-technology-report-card-2014-edition 2427
ore telling is the fact that BC has had the lowest level of patents awarded as a percent of applications
er the last decade
e prevalence of small firms in the BC technology sector has a direct impact on the capacity of
mpanies to successfully pursue patents Not only do they have limited capacity to invest in RampD to
velop patentable innovations but their capital constraints limit their ability to access the legal and
ministrative expertise needed to execute patent applications
atents Awarded per 100000 Population
atents Granted as a Percent of Patent Applications
urce Profile of the British Columbia High Technology Sector BC Stats March 2014
urce Profile of the British Columbia High Technology Sector BC Stats March 2014
00
00
00
00
00
00
00
00
00
2001 2002 2003 2004 2005 2006 2007 2008 2009 2010 2011
CanadaO ntar io Q ueacute be cBritish Columbia Alberta
2001 2002 2003 2004 2005 2006 2007 2008 2009 2010 2011
CanadaO ntar io Q ueacute be cBritish Columbia Alberta
BCrsquos patentperformancesignificantlytrails otherprovinces
Canada still ranks 18th well behind the worldrsquos leading countries in terms of the number of triadic
patent families per million population ndash a measure of patents taken at three major patent offices in
the world KPMGrsquos estimate for BC places it even further down the list than it was in 200815
Triadic Patent Families per Million Population 2010
Source KPMG Analysis of BC Stats Data and OECD Science Technology and Industry Scorecard 2013 OECD 2013
15 KPMG estimated BCrsquos ranking on the chart by considering the relative proportions of patents awarded in BC versus Canada as a whole on
a per capita basis
0
20
40
60
80
100
1
I D N
I N D
B R A
T U R
R U S
C H L
Z A F
C H N
P O L
S V K
G R C
C Z E
P R T
H U N
E S P
E S T
S V N
W L D
B C
I S L
N Z L
I T A
A U S
I R L
C A N
N O R
G B R
L U X
O E C D
B E L
F R A
K O R
I S R
U S A
A U T
N L D
D N K
F I N D E U
S W E
C H E
J P N
M E X
BCrsquos paperform
is one-the levleadingcountr
014 KPMG LLP a Canadian limit ed liability par tnership and a member firm of the KPMG network of independent member
s affiliated with KPMG International Cooperative (ldquoKPMG Internationalrdquo) a Swiss entity All rights reserved
copy 2014 KPMG LLP a Canadian limited liabi lity partnership and a member firm of the KPMG network of independent member
firms affiliated with KPMG International Cooperative (ldquoKPMG Internationalrdquo) a Swiss entity All rights reserved
British Columbia Technology Report Card 2014 British Columbia Technology Report Card
Industry Profile and Comparative Analysis Industry Profile and Comparative An
8102019 BC Technology Report Card 2014 Edition
httpslidepdfcomreaderfullbc-technology-report-card-2014-edition 2527
he technology industry not only generates GDP employment and income
ithin the technology sectors (referred to as direct impact) it also brings
dditional benefits to the overall BC economy by supporting suppliers to
e industry (indirect impact) and through the re-spending of labour income
arned in technology and supplier industries (induced impact)
ur economic impact analysis indicates that the overall impact of the technology industry on the BConomy is significantly magnified by the indirect and induced impacts We estimate that based on
rrent technology industry revenues of $23 billion the total contribution to the BC economy is
$23 ndash $26 billion in GDP
165000 ndash 188000 jobs created or sustained
$10 ndash $12 billion in total labour income
ese high levels of economic benefits are consistent with an industry that is high value-add employs
ghly skilled workers pays high wages and is well integrated in the economy 16
s noted earlier in the report while the technology industry has made a significant contribution to the
C economy our province still trails other Canadian provinces and US jurisdictions in this respect For
ample the BC technology ind ustry current ly comprises 76 percent of provincial GDP compared to
3 percent contribut ed by the US technology industry to US GDP So what would happen if the BC
chnology industry grew to comprise 103 percent of the provincial economy
ur analysis indicates that growing to 103 percent of the provincial economy would bring an additional
1B in BC technology industry revenues and an associated increase of $91B ndash 102B in total
DP 65K ndash 74K additional jobs created or sustained and a $41B ndash 46B increa se in labour
come These estimates include the combined benefits of the direct indirect and induced impacts
the economy
Economic ImpactAssessment
sti mating the technology industry economic impact is challenging due to the lack of standard technology industry classificati ons and
corresponding technology-specific impact multipliers To estimate the impact KPMG used weighted averages of standard industry sector impact
multipliers based on the definition of sectors comprising the tech industry We have chosen to represent the impacts as ranges using different
sectoral weights The use of ranges reflects the inherent variability in the technology industry caused by the diversity of sectors that it comprises
For example a dollar worth of output in the tech industry will have a different economic impact depending on whether it is generated by the
software publishing sector the telecommunication sector or the motion picture and post-production sector In our analysis of direct impacts we
have used figures reported by BC Stats To estimate the indirect and induced impacts we have used industry-standard multipliers developed by
Statistics Canada
Going deeper
Current BC Technology Industry Economic Impact
Given that the industry generated $23 billion in revenues we estimate that the industry contributed
$23 ndash $26 billion to total GDP created or sustained 165000 ndash 188000 jobs an d delivered $10 ndash $12 billion
to total labour income This impact breaks down in direct indirect and induced impact as follows
Current BC Tech Industry Impact
GDP
JOBS
LABOUR INCOME
$23 Bin Tech Industry
Revenues
Direct Impact Indirect Impact Induced Impact Total Impact
$15B
84K
$6B
$4B ndash 5B
43K ndash 52K
$4B ndash 6B
39K ndash 52K
$2B ndash 3B
$23B ndash 26B
165K ndash 188K
$10B ndash 12B$23B ndash 3B
BC Technology Industry Economic Impact Multipliers
In order to compare the technology industry to other industries as well as forecast the impact of
industry growth we have estimated the technology industry impact per dollar of revenue
We find that for each dollar of technology industry revenue the industry generates $1 ndash $112 in total
GDP and $045 ndash $05 in total labo ur income Further for each million dollars in te chnology industr y
revenue the industry generates or sustains seven to eight jobs in BC This impact breaks down in
direct indirect and induced impact as follows
Economic Impact Multiplier Estimates
GDP ($)
$1in Tech Revenues
For each
$1M in Tech Revenues
For each
Direct Impact Indirect Impact Induced Impact Total Impact
065 016 ndash 022 019 ndash 025 100 ndash 112
JOBS 362 186 ndash 228 168 ndash 226 716 ndash 817
LABOUR INCOME ($) 027 010 ndash 013 008 ndash 011 045 ndash 050
014 KPMG LLP a Canadian limit ed liability par tnership and a member firm of the KPMG network of independent member
s affiliated with KPMG International Cooperative (ldquoKPMG Internationalrdquo) a Swiss entity All rights reserved
copy 2014 KPMG LLP a Canadian limit ed liability par tnership and a member firm of the KPMG network of independent member
firms affiliated with KPMG International Cooperative (ldquoKPMG Internationalrdquo) a Swiss entity All rights reserved
British Columbia Technology Report Card
Economic Impact Assess
8102019 BC Technology Report Card 2014 Edition
httpslidepdfcomreaderfullbc-technology-report-card-2014-edition 2627
GDP
JOBS
LABOUR INCOME
$91 BTech Revenues
Additional
Direct Impact Indirect Impact Induced Impact Total Impact
$59B
33K
$25B
$15B ndash 2B
17K ndash 21K
$09B ndash 12B
$17B ndash 23B
15K ndash 21K
$07B ndash 10B
$91B ndash 102B
65K ndash 74K
$41B ndash 46B
Economic Impact of BC Technology Industry Growth
demonstrate the magnitude of potential economic benefit from growing the BC technology industry
e chose to estimate these benefits in the context of a specific growth figure As shown in the GDP
alysis section of this report BC trails significantly many US states as well as the US average in terms
the share of the technology industry to the economy as a whole We asked the question ndash what
ould be the economic impact if we caught up to the US average
e US technology industr y contributes 103 percen t to the overall US GDP as compared to 76 percent
ntributed by the BC technology industry to the BC economy To reach the current contribution level
the US the BC technology industr y will need to add an additional $6 B in GDP corresponding to an
ditional $9B in technology industry revenues (given current industry multipliers)
ur analysis indicates that growing to 103 percent of the provincial economy would bring an additional1B in BC technology indust ry revenues and an associ ated increase of $91B ndash 102B in total GDP
K ndash 74K additional jobs created or sustained and a $41B ndash 46B increase in labour income This
pact breaks down in direct indirect and induced impact as follows
conomic Impact of Growing the BC Technology Industry Contribution to Match the US
While this report card clearly demonstrates the tech
industryrsquos importance to BCrsquos economy itrsquos the possibilities
revealed that most command our attention And itrsquos in our
flaws that our future lies Despite the industryrsquos provincial
strength we trail our Canadian peers on a number of
metrics such as the availability of local venture capital
building field-specific talent pools and increasing firm size
But though these challenges are significant identifying
them ndash knowing what we have to do and where to apply our
resources investments and commitments ndash provides a clear
roadmap for improvement and sustainable success
Wersquore in a very good place The potential for BC tech to become
a major national and global player is right in front of us Indeed
a number of technology companies are already flourishing in
BC with significant operations owned or being built by
bull Canadarsquos largest defense company MDA
bull Canadarsquos largest cleantech company Westport
bull Worldrsquos largest machine-to-machine wireless company
Sierra Wireless
bull Canadarsquos largest social media management company
Hootsuite
bull The first commercial quantum computing company Dwave
bull And global leaders like Amazon Best Buy Boeing
Electronic Arts Microsoft IBM McKesson Sams
Schneider Electri c Sony Imageworks and SAP
As these and other companies have realized BC is o
the most vibrant start-up ecosystems anywhere in th
one that regularly translates great ideas creative tale
audacious vision into some of the hottest tech compaaround Itrsquos a dynamic environment teeming with bra
entrepreneurs who thrive on their peersrsquo global aspira
With this core of industry infrastructure top talent an
innovative thinking in place BC is well positioned to
the tech industryrsquos many emerging and evolving opp
Every powder keg however needs a fuse BC is a te
hot spot but we have to keep stoking the fires of in
ambition and talent to ensure the positive gains mad
2012 become major leaps the next time we take stoc
means we have to work together ndash emerging tech st
ups and major corporate players industry investors a
trend-setters policy makers and academic leaders al
we continue to improve in the key areas identified in
report we can keep building the momentum BC tech
to realize its provincial successes and gains on the n
and global scales
ConclusionTaking the next step together
AcknowledgementsKPMG would like to gratefully acknowledge the support of BC Stats in the development of this report
Our detailed statistical analysis would not have been possible without the rich collection of BC industry
data provided to us by BC Stats
014 KPMG LLP a Canadian limit ed liability par tnership and a member firm of the KPMG network of independent member
s affiliated with KPMG International Cooperative (ldquoKPMG Internationalrdquo) a Swiss entity All rights reserved
copy 2014 KPMG LLP a Canadian limit ed liability par tnership and a member firm of the KPMG network of independent member
firms affiliated with KPMG International Cooperative (ldquoKPMG Internationalrdquo) a Swiss entity All rights reserved
British Columbia Technology Report Card 2014 British Columbia Technology Report Card
Economic Impact Assessment Concl
8102019 BC Technology Report Card 2014 Edition
httpslidepdfcomreaderfullbc-technology-report-card-2014-edition 2727
KPMG in Canada provides Audit Tax and Advisory services We work closely with our clients
helping them to mitigate risks and grasp opportunities
KPMG in Canada is committed to our clients We have made considerable investments in regards to
personnel research and hard-won experience Through these investments we strive to be the best
in everything we do turning our experience and industry knowledge into real value for our clients
This is the KPMG Way
Contact us
For more information please contact your KPMG adviser or one of the following professionals
Anthony Lindsay
Partner Greater Vancouver Area Market Leader
Technology Media and Telecommunications
T 604-646-6379
E tdlindsaykpmgca
Slavi Diamandiev
Greater Vancouver Area
Economics Practice Leader
Management Consulting
T 604-673-4458
E sdiamandievkpmgca
Ed Zacharuk
Partner Greater Vancouver Area SRampED
Practice Leader
T 604-691-3201
E ezacharukkpmgca
Sukesh Kumar
Partner National Leader India Desk
T 604-527-3468
E skumarkpmgca
Walter Pela
Partner in Charge of Tax Services
Greater Vancouver Area
T 604-691-3193
E wpelakpmgca
Ian Wilshaw
Partner Greater Vancouver Area Market Leader
Private Equity
T 604-691-3557
E idwilshawkpmgca
The information contained herein is of a general nature and is not intended to address the circumstances of any particular individual or entity Although we endeavor to
provide accurate and timely information there can be no guarantee that such information is accurate as of the date it is received or that it will continue to be accurate in
the future No one should act on such information without appropriate professional advice after a thorough examination of the particular situation
kpmgcatmt
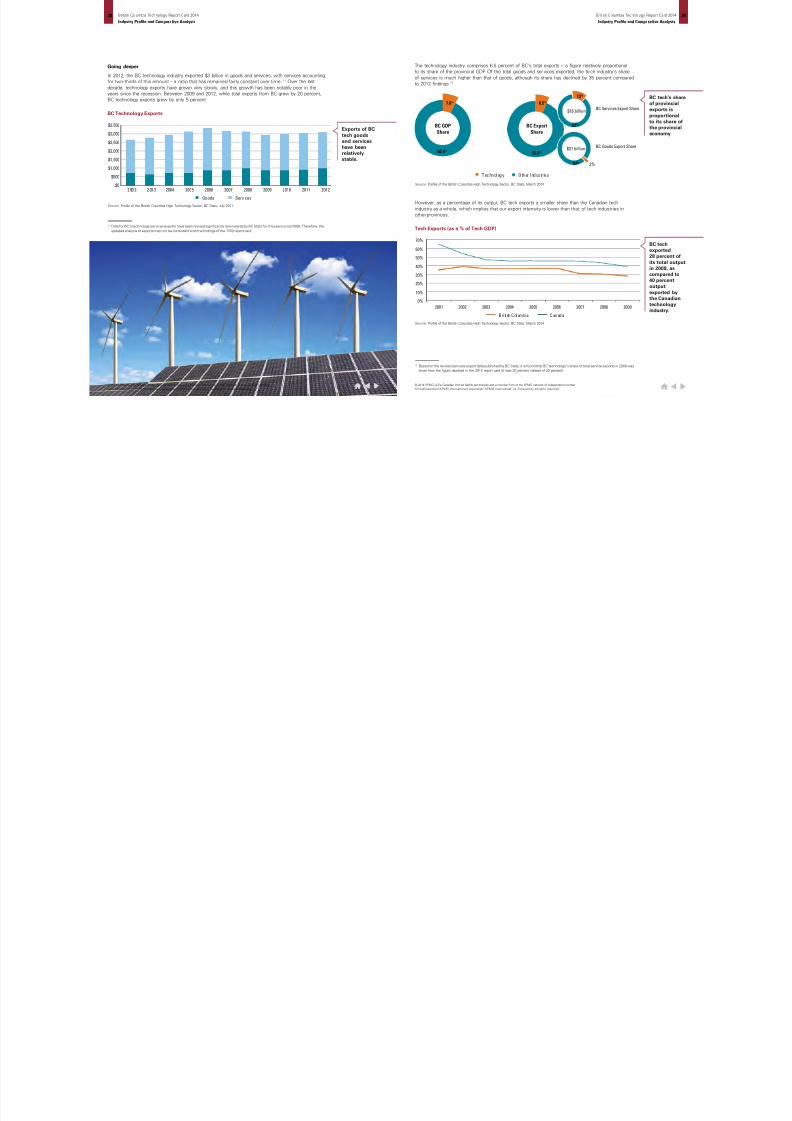
8102019 BC Technology Report Card 2014 Edition
httpslidepdfcomreaderfullbc-technology-report-card-2014-edition 1727
om a trade balance perspective BC continues to be a significant net importer of technology goods
th the majority originating in the Pacific Rim The magnitude of these imports indicates there is local
mand for certain types of technology goods not being met by local supply
hile detailed trade data for technology services is lacking for BC a closer examination of technology
ods data reveals further insights
terms of exports while the US continues to be the largest consumer of BC technology goods there
s been a significant trend in market diversification towards the Pacific Rim and other countries over
e past decade
C Tech Goods Exports and Imports
urce Profile of the British Columbia High Technology Sector BC Stats March 2014
urce Profile of the British Columbia High Technology Sector BC Stats March 2014
Goods Exports Goods Imports
2002 2003 2004 2005 2006 2007 2008 2009 2010 2011 2012
$5000
$4000
$3000
$2000
$1000
$0
The share oftechnology
goods exportsfrom BC to theUS has beendeclining
BC imports$5 billionworth of
technologygoods whilegeneratingonly $1 billionin exports
Economic Performance Indicators ndash Summary
Current economic performance indicators largely confirm the findings of the 2012 report card
BC technology performs strongly compared to other provincial industries but continues to trail the
technology industries in other provinces To gain more perspective around the ldquowhyrdquo of these results
the following section analyzes inputs to the BC tech industry and highlights the root drivers of its
economic performance
Export readiness and the ability to successfully access new markets are closely correlated to firm
capacities Smaller companies often lack the resources capital and expertise necessary to readily
exploit new markets
The underperformance in BC tech exports relative to other provinces is likely related to the
overweighting of small and very small technology companies in BC Industry leaders observed
that smaller companies often require access to local early-adopter customers as a proving ground
before expanding to new markets As such both corporations and government agencies can play
an important role by helping improve product designmarketing processes and serving as a critical
reference customer
Despite this many BC tech companies find their productsservices are better received in foreign
markets than at home Even among leading companies very few indicate they have much or any
business with BC-based customers
Unlike the US there is as yet no funding set aside by provincial or federal governments to procure
locally from small businesses In fact in some cases the government procurement process has
minimum requirements that are beyond the capabilities of smaller companies
The tech industry is global and in many segments fiercely competitive Successfully growing
exports requires both financial capacity and management expertise ndash issues that BC tech
companies face regularly
Industry Insights on Exports and Market Access
014 KPMG LLP a Canadian limit ed liability par tnership and a member firm of the KPMG network of independent member
s affiliated with KPMG International Cooperative (ldquoKPMG Internationalrdquo) a Swiss entity All rights reserved
copy 2014 KPMG LLP a Canadian limit ed liability par tnership and a member firm of the KPMG network of independent member
firms affiliated with KPMG International Cooperative (ldquoKPMG Internationalrdquo) a Swiss entity All rights reserved
British Columbia Technology Report Card 2014 British Columbia Technology Report Card
Industry Profile and Comparative Analysis Industry Profile and Comparative An
8102019 BC Technology Report Card 2014 Edition
httpslidepdfcomreaderfullbc-technology-report-card-2014-edition 1827
art B Industry Input Indicatorshile the BC technology industry continues to perform well compared to other BC industries it continues
underperform relative to the technology industries in other provinces ndash although the gap is being
osed It is also generally behind the tech sectors of the countries in the Organization for Economic
o-operation and Development (OECD) particularly in the areas of t alent venture capital investment
d research and development (RampD) all of which are necessary growth drivers A closer assessment
BCrsquos technology industry inputs offers a glimpse into key areas of weakness and highlights areas
here appropriate targeted investment may serve to underwrite the sectorrsquos future performance
rt of the noted underperformance can be attributed to the capacity constraints of BC firms Populated
th small enterprises BC tech firms have a limited ability to raise capital investment invest in RampD
crease the available talent pool collaborate with post-secondary research institutes and build
ellectual property
C Technology Industry ndash 2014 Report Card
Talent Availability
Industr y Input Indicator s Ver sus O ther Provincial Tech Sectors 2014
Grade
Access to Capital
Research and Development
Intellectual Property
Cndash
bull Low talent availability ndash BC lags other provinces in granting engineering and sciences degrees
at both the undergraduate and graduate levels and is well below the OECD average in granting
technical doctoral degrees
bull Lack of venture capital investment ndash While BC has a relatively healthy level of angel
investment venture capital investment is largely lacking or insufficient
bull Lagging RampD investment ndash BC fares poorly compared to other provinces and OECD countries
on the level of RampD invested as a percentage of output Of particular concern is the declining
level of business expenditure on RampD which is already behind other jurisdictions
bull Fewer patents ndash BCrsquos level of patents granted lags other provinces and OECD countries on
both a per capita basis and as a percent of applications filed
Highlights
Talent Availability
Talent is a critical resource for the technology sector feeding the innovation and creativity that in turn
drive the global industry From information amp communications technology to engineering amp other
services to life sciences each sector relies on the availability of a skill-specific talent pool to meet
existing business demands and generate new growth ideas The technical skills required by the industry
are primarily developed at higher education institutions then nurtured within the industry The number of
degrees awarded in a province is therefore a useful measure of the technical talent available for firms
to draw on
While there has been an improvement in the granting of degrees in math and computer science in
BC relative to other provinces we continue to lag in the granting of degrees in other technical fields
BC fares particularly poorly in the architecture and engineering fields and underperforms the Canadian
average in life sciences Moreover BCrsquos performance has fallen relative to other OECD countries in the
granting of technical PhDs
Talent Availability
Undergraduate Degrees
Industry Input Indicators
Summary
Undergraduate Technology Degrees
Graduate Technology Degrees
Versus other Provincial Tech Sectors 2014
014 KPMG LLP a Canadian limit ed liability par tnership and a member firm of the KPMG network of independent member
s affiliated with KPMG International Cooperative (ldquoKPMG Internationalrdquo) a Swiss entity All rights reserved
copy 2014 KPMG LLP a Canadian limited liabi lity partnership and a member firm of the KPMG network of independent member
firms affiliated with KPMG International Cooperative (ldquoKPMG Internationalrdquo) a Swiss entity All rights reserved
British Columbia Technology Report Card 2014 British Columbia Technology Report Card
Industry Profile and Comparative Analysis Industry Profile and Comparative An
8102019 BC Technology Report Card 2014 Edition
httpslidepdfcomreaderfullbc-technology-report-card-2014-edition 1927
oing deeper
illed labour availability in BC as measured by the level of undergraduate degrees granted per capita
iled only Ontario in 2012 having grown steadily over the last three years13
Data for Queacutebec has been revised downwards significantly by BC Stats Undergraduate degrees per 100000 population was lower than the
evel in BC up to 2008 and remains that way till 2011
urce Profile of the British Columbia High Technology Sector BC Stats March 2014
0
0
0
0
0
0
0
20022001 2003 2004 2005 2006 2007 2008 2009 2010 2011
O ntar io Q ueacute be cBritish Columbia Alberta
ndergraduate Degrees per 100000 Population
nnual Undergraduate Degrees per 100000 Population 2011
owever in terms of the relevance of those degrees to the technology industry BC continues to
il other provinces on average For both undergraduate and graduate degrees BC is well behind the
nadian average and the degree rates of other provinces in the fields of architecture and engineering
e province is also behind the Canadian average in the granting of undergraduate and graduate degrees
the physical and life sciences disciplines Only in the fields of math computer science and information
ence has there been a positive trend since 2009 with BC now second only to Ontario in granting
th undergraduate and graduate degrees in these disciplines
Queacutebec Ont ario Alberta Brit ish ColumbiaCanada
0
0
0
0
0
0
0
0Undergraduate
Degrees ndash Architecture and
Engineering
Undergraduate
Degrees ndash Physical
and Life Sciences
Undergraduate
Degrees ndash Math Computer
and Information Science
BC produces thesecond highest
number ofundergraduateson a per capitabasis butcontinues to
trail Ontariosignificantly
Globally Canadarsquos rate of granting technology-related doctoral degrees per 1000 population in the
reference age cohort is well below the OECD average Since 2009 the level in Canada remained
the same at 12 percent while the OECD average improved slightly to 16 percent KPMG estimates
that BCrsquos rate of doctoral degrees of 06 percent also did not change since the last estimate in
2009 meaning a deficit of 60 percent versus other OECD jurisdictions More concerning yet is that
many of the countries that trailed Canada and British Columbia in 2000 had surpassed us by 2011
(eg Italy Iceland and Greece)
Source Profile of the British Columbia High Technology Sector BC Stats March 2014
Source KPMG Analysis and OECD Science Technology and Industry Scorecard 2013 OECD 2013
urce Profile of the British Columbia High Technology Sector BC Stats March 2014
Technology Related Doctoral Degrees as Percentage of Population in Reference Age Cohort
Annual Graduate Degrees per 100000 Population 2011
Queacutebec Ontario Alberta British ColumbiaCanada
300
250
200
150
100
50
00Graduate Degrees ndash
Architecture andEngineering
Graduate Degrees ndash Physicaland Life Sciences
Graduate Degrees ndash MathComputer and Information Science
014 KPMG LLP a Canadian limit ed liability par tnership and a member firm of the KPMG network of independent member
s affiliated with KPMG International Cooperative (ldquoKPMG Internationalrdquo) a Swiss entity All rights reserved
copy 2014 KPMG LLP a Canadian limit ed liability par tnership and a member firm of the KPMG network of independent member
firms affiliated with KPMG International Cooperative (ldquoKPMG Internationalrdquo) a Swiss entity All rights reserved
British Columbia Technology Report Card 2014 British Columbia Technology Report Card
Industry Profile and Comparative Analysis Industry Profile and Comparative An
8102019 BC Technology Report Card 2014 Edition
httpslidepdfcomreaderfullbc-technology-report-card-2014-edition 2027
Access to Capital
ccess to risk capital throughout the growth cycle is one of
e most significant determinants of tech sector success
has been empirically established that companies that
ceive risk capital have a significantly higher survival rate
perience stronger revenue employee wage and asset
owth and invest in higher levels of RampD 14
e BC technology industry has had a healthy growth in
gel investment which typically takes the form of seed
pital that helps in the emergence of start-ups However
rly stage venture capital investment ndash a necessary fuel
r growing start-ups into thriving companies ndash is deficient
BC and has been declining in recent years And of the
early stage venture capital that is invested there has
been a decline in the share invested by local funds which
deprives companies not only of adequate risk capital but
also of the guidance and networking opportunities that
are essential in early growth stages At the same time
BC companies attract a significant amount of foreign and
extra-provincial investment at the later stages of growth
Together these findings suggest that small technology firms
in BC are limited in their ability to access timely risk capital
that can propel their growth and firms that successfully
attract foreign venture capital may be at risk of relocating
outside BC
These findings can be explored in detail in the recent study by CVCA and Industry Canada titled ldquoThe Performance of Canadian Firms that
Received Venture Capital Financingrdquo published in June 2013
ccess to Capital
Access to Angel Investment
Summary
Access to Venture Capital
Are at Versus Other Provincial Tech Sectors 2014
Industry leaders almost universally agreed that access
to talent has become the most significant issue facing
their firms They cite a tightening of talent availability
over the past few years growing shortages in certain
key technical areas including software and web
development and a need to expand the available talent
pool in areas such as industrial technologies and sales
and marketing as critical issues
The challenges in talent availability have been exacerbated
by the arrival or impending arrival of several multinational
firms on the BC tech scene With a relatively constrained
talent pool the competition for available resources has
increased and with it compensation levels have risen
Several of the larger US-based multinationals are offering
compensation packages at significant premiums over the
average compensation levels in the BC market leading
to growing talent development attraction and retention
challenges for smaller BC companies In some cases this
has led to BC-based companies establishing or growing
their operations outside of BC where talent is less
expensive and more available
Leaders agreed that long-term industry success will
require an expanded talent pool developed by improving
the quantity and quality (job-readiness) of post-secondary
degree programs as well as by attracting talent from
outside of BC and Canada
The high cost of real estate was cited as a primary
barrier to attracting outside talent particularly where
mid- and senior-level management must be relocated
As a result companies are looking at alternative ways
of addressing relocation costs and at targeting talentmarkets where the cost differential or the expectation
of home ownership are less
Industry Insights on Talent Availability
In recent years the vast majority of venture capital invested in BC was in later stage financing Early
stage venture capital is significantly more limited and has been declining over the last few years
Capital by Stage of Investment
Venture Capital by Stage of Investment
Going deeper
BC has experienced steady growth in the level of angel investments in the province since the mid-2000s
Venture capital investment on the other hand has been more volatile
Source CVCA and BCTIA analysis of Thompson Reuters Data
Source CVCA and BCTIA analysis of Thompson Reuters Data
$0
$100
$200
$300
4
2003
$40
$110
2004
$31
$254
2005
$32
$226
2006
$54
$298
2007
$54
$316
2008
$64
$260
2009
$67
$141
2010
$72
$223
2011
$87
$233
2012
$97
$201
Ve ntur e C ap ital Ang el
$ m i l l i o n
$0
$100
$200
$300
$51
$172
$43
$190
$16
$185
2010 2011 2012
VC Later Stage VC Early Stage
$ m i l l i o n
014 KPMG LLP a Canadian limit ed liability par tnership and a member firm of the KPMG network of independent member
s affiliated with KPMG International Cooperative (ldquoKPMG Internationalrdquo) a Swiss entity All rights reserved
copy 2014 KPMG LLP a Canadian limit ed liability par tnership and a member firm of the KPMG network of independent member
firms affiliated with KPMG International Cooperative (ldquoKPMG Internationalrdquo) a Swiss entity All rights reserved
British Columbia Technology Report Card 2014 British Columbia Technology Report Card
Industry Profile and Comparative Analysis Industry Profile and Comparative An
8102019 BC Technology Report Card 2014 Edition
httpslidepdfcomreaderfullbc-technology-report-card-2014-edition 2127
verall BC placed second to last in the level of total venture capital invested among the 20 North
merican jurisdictions examined This is particularly concerning as the technology industry is inherently
obile and decisions regarding the location of operations can be significantly influenced by structural
ctors such as access to capital rather than the presence of local demand
e decline in locally sourced early stage capital is particularly concerning given its importance At the
me time a significant share of later stage investment originates from foreign sources which presents
potential risk that firms may subsequently relocate outside of BC
urce CVCA and BCTIA analysis of Thompson Reuters Data
urce KPMG Analysis of Thomson Reuters Data
$million
$33
$18
$11
$32
$0
$10
$20
$30
$40
2010 2011 2012
$3
$12
CanadianForeign
arly Stage VC Investment by Source
enture Capital Investments 2012
C a
l i f o r n
i a
M a s s e c
h u s e t t s
N e w
Y o r k
T e x a s
W a s
h i n g t o n
M a r y
l a n
d
U t a
h
O h i o
N e w
J e r s e y
O n t a r i o
V i r g i n i a
Q u e
b e c
B r i t i s
h C o
l u m
b i a
P e n n s y
l v a n
i a
I l l i n o
i s
A r i z o n a
C o
l o r a
d o
G e o r g
i a
M i n n e s o t a
M i c h i g a n
V C P e r
C a p
i t a -
$
$500
$450
$400
$350
$300
$250
$200
$150
$100
$50
$0
$6000
$5000
$4000
$3000
$2000
$1000
$0
VC per capita 2012Venture Capital 2012
Locallysourced earlystage VC
investmenthas beendeclining
Research and Development
RampD expenditure is the long-term investment in an industryrsquos future economic performance It measures
commitment to using innovation and knowledge creation to enhance productivity and improve competitiveness
Over the last few years there has been little increase in overall RampD investment in BC As such it
ranks below Ontario and Queacutebec However the composition of RampD spending has changed over time
with the share of business investment in RampD experiencing a steady decline The fact that the industry
is populated with small firms with fewer than 50 employees can help explain this trend BC is host to
very few large anchor companies that have the revenues and the capital to spend in significant ways
on research for the purposes of enhancing competitiveness
Research and Development
Summary
BERD as a Percentage of GDP
RampD as a Percentage of GDP
Versus other Provincial Tech Sectors 2014
The technology industry leaders interviewed recognized that there is a healthy local angel
network in BC However early stage venture capital financing in BC is seen as either absent
or modest making it difficult for small companies to grow There is a sense that attracting
venture capital from out-of-province is also challenging because physical proximity is an
important investment factor
Overall the opinion was that the limited presence of venture capital in BC leads to an absence
of investment competition which impacts competitive valuation and terms Industry leaders also
noted that local venture capital funds often take a revenue-based valuation approach Paradoxically
this may mean that a company can be valued higher by an angel investor prior to earning any
revenue than by an institutional investor once it starts generating revenue Since angel investors
typically expect high returns on initial investment this may make it difficult for small companies
to raise subsequent rounds of institutional financing often leaving them with prospects of
constrained growth due to limited capitalization or the option of selling early This lack of breadth
in the capital pool can lead to a vicious cycle of limited company growth and depressed valuations
of small companies seeking funding
Industry Insights on Risk Capital Investment
014 KPMG LLP a Canadian limit ed liability par tnership and a member firm of the KPMG network of independent member
s affiliated with KPMG International Cooperative (ldquoKPMG Internationalrdquo) a Swiss entity All rights reserved
copy 2014 KPMG LLP a Canadian limit ed liability par tnership and a member firm of the KPMG network of independent member
firms affiliated with KPMG International Cooperative (ldquoKPMG Internationalrdquo) a Swiss entity All rights reserved
British Columbia Technology Report Card 2014 British Columbia Technology Report Card
Industry Profile and Comparative Analysis Industry Profile and Comparative An
8102019 BC Technology Report Card 2014 Edition
httpslidepdfcomreaderfullbc-technology-report-card-2014-edition 2227
BC total RampD spending as a percent of GDP has remained relatively constant since 2008 Other
ovinces experienced a slight decline in this metric While BC remains higher than Alberta in this
gard it still makes up only 60 percent of the RampD expenditure levels in Ontario and Queacutebec
oing deeper
$3 billion there was no significant increase in the total RampD expenditure in BC since 2008 although
e composition of the spending changed The share of higher education and private non-profit
penditure continued to grow from 39 percent in 2008 to 43 percent in 2010 while that of business
terprise shrank by an equivalent amount to 53 percent in 2010
urce Profile of the British Columbia High Technology Sector BC Stats March 2014
urce Profile of the British Columbia High Technology Sector BC Stats March 2014
0
500
1000
1500
2000
2500
3000
3500
2000 2001 2002 2003 2004 2005 2006 2007 2008 2009 2010
Business Enterprise Higher Education amp Private Non-Profit
F ed er al Go vt P ro vin ci al Go ve rn me nt amp Re se ar ch In st it ut ion s
ampD Expenditures in British Columbia
ampD as a Percent of GDP
000
050
100
150
200
250
300
2007 2008 2009 2010
Ont ar io QueacutebecBritish Columbia Alberta
Overall RampDinvestment in
BC has beenconstant withan increase
in highereducation
spendingequal to thereductionin business
investmentin RampD
BCrsquos levelof RampD as apercentageof GDP has
been constantbut remains40 percent
lower thanOntario and
Queacutebec
Source KPMG Analysis of BC Stats Data and OECD Science Technology and Industry Scorecard 2013 OECD 2013
RampD Expenditure as a Percent of GDP
Since the last report card BC did not improve its global standing in RampD intensity as it continues
to perform 40 percent below the OECD average
I S R
K O R
F I N
J P N
S
W E
C H E
D N K
D E U
U S A
A U T
S V N
I S L
O E C D
E S T
F R A
C H N
B E L
O N
A U S
E
U 2 8
N L D
C Z E
G B R
L U X
C A N
I R L
N O R
P R T
B C
E S P
Z A F
I T A
H
U N
N Z L
R U S
M
E X
T U R
P O L
S V K
C H L
0
1
2
3
4
5
2011 2001
Q C
The BERD (business expenditures on RampD) ratio ndash which reflects the level of industry commitment
within the technology industry ndash has fallen for all provinces since 2008 BC still performs better than
Alberta with its businesses contributing 078 percent of GDP to RampD investment but remains well
below Queacutebec and Ontario which contribute 142 percent and 109 percent respectively
Source Profile of the British Columbia High Technology Sector BC Stats March 2014
Business Expenditure on RampD as a Percent of GDP
0
05
10
15
20
2007 2008 2009 2010
P e r c e n t o f G D P
CanadaOntario QueacutebecBritish Columbia Alberta
BusineRampD apercen
of GDPis 20 plower tCanad
BC fell below averageexpendpercent
014 KPMG LLP a Canadian limit ed liability par tnership and a member firm of the KPMG network of independent member
s affiliated with KPMG International Cooperative (ldquoKPMG Internationalrdquo) a Swiss entity All rights reserved
copy 2014 KPMG LLP a Canadian limit ed liability par tnership and a member firm of the KPMG network of independent member
firms affiliated with KPMG International Cooperative (ldquoKPMG Internationalrdquo) a Swiss entity All rights reserved
British Columbia Technology Report Card 2014 British Columbia Technology Report Card
Industry Profile and Comparative Analysis Industry Profile and Comparative An
8102019 BC Technology Report Card 2014 Edition
httpslidepdfcomreaderfullbc-technology-report-card-2014-edition 2327
0
0
0
0
0
0
0
0
0
I S R K O R F I N J
P N S W E C
H E D N K
D E U
U S A
A U T
S V N I S L
O E C D E
S T F R A
C H N B
E L A U S
E U 2 8 I R L C
Z E G B R
L U X
C A N N
L D N O R B C
H U N E
S P P R T I T A R
U S N Z L
Z A F
T U R
S V K
P O L
M E X
C H L
2011 2001
usiness Expenditure on RampD as a Percent of GDP
Crsquos BERD remained 50 percent below the OECD average and did not experience any change from the
01 level This means between 2001 and 2011 BC was surpassed by countries like China and Australia
their level of BERD investment as a p ercent of GDP
urce KPMG Analysis of BC Stats Data and OECD Science Technology and Industry Scorecard 2011 OECD 2011
BusinessRampD in BCis one-thirdthe level of
leading OECDcountries
Going deeper
Compared to other provinces with significant technology industries BC continues to trail in terms of both
the number of patents filed and the number of patents granted on both an absolute and per capita basis
Intellectual Property
Canadian Patents Filed and Granted
Source Canadian Patent Office
Intellectual Property
Intellectual property is a bellwether of the inventory of assets that can be commercialized to underwrite
future economic performance As measured by the number of patent applications submitted and
granted intellectual property reflects the success of RampD investment in the development of innovative
products provides an indication of the commercial viability of research and provides an indication of the
competitiveness of the technology industry as a whole Consistent with the findings of the 2012 report
card BC still ranks well below all other provinces with significant technology industries in the level of
patents awarded both on a per capita basis and as a percentage of applications filed
Patents Granted
Versus Other Provincial Tech Sectors 2014
Summary
0
500
1000
1500
2000
2500
Patents Filed ndash2011
Patents Filedndash2012
Patents Granted ndash2011
Patents Granted ndash2012
Ontario Queacutebec Alberta British Columbia
copy 2014 KPMG LLP a Canadian limit ed liability par tnership and a member firm of the KPMG network of independent member
firms affiliated with KPMG International Cooperative (ldquoKPMG Internationalrdquo) a Swiss entity All rights reserved
014 KPMG LLP a Canadian limited liabi lity partnership and a member firm of the KPMG network of independent member
s affiliated with KPMG International Cooperative (ldquoKPMG Internationalrdquo) a Swiss entity All rights reserved
British Columbia Technology Report Card 2014 British Columbia Technology Report Card
Industry Profile and Comparative Analysis Industry Profile and Comparative An
8102019 BC Technology Report Card 2014 Edition
httpslidepdfcomreaderfullbc-technology-report-card-2014-edition 2427
ore telling is the fact that BC has had the lowest level of patents awarded as a percent of applications
er the last decade
e prevalence of small firms in the BC technology sector has a direct impact on the capacity of
mpanies to successfully pursue patents Not only do they have limited capacity to invest in RampD to
velop patentable innovations but their capital constraints limit their ability to access the legal and
ministrative expertise needed to execute patent applications
atents Awarded per 100000 Population
atents Granted as a Percent of Patent Applications
urce Profile of the British Columbia High Technology Sector BC Stats March 2014
urce Profile of the British Columbia High Technology Sector BC Stats March 2014
00
00
00
00
00
00
00
00
00
2001 2002 2003 2004 2005 2006 2007 2008 2009 2010 2011
CanadaO ntar io Q ueacute be cBritish Columbia Alberta
2001 2002 2003 2004 2005 2006 2007 2008 2009 2010 2011
CanadaO ntar io Q ueacute be cBritish Columbia Alberta
BCrsquos patentperformancesignificantlytrails otherprovinces
Canada still ranks 18th well behind the worldrsquos leading countries in terms of the number of triadic
patent families per million population ndash a measure of patents taken at three major patent offices in
the world KPMGrsquos estimate for BC places it even further down the list than it was in 200815
Triadic Patent Families per Million Population 2010
Source KPMG Analysis of BC Stats Data and OECD Science Technology and Industry Scorecard 2013 OECD 2013
15 KPMG estimated BCrsquos ranking on the chart by considering the relative proportions of patents awarded in BC versus Canada as a whole on
a per capita basis
0
20
40
60
80
100
1
I D N
I N D
B R A
T U R
R U S
C H L
Z A F
C H N
P O L
S V K
G R C
C Z E
P R T
H U N
E S P
E S T
S V N
W L D
B C
I S L
N Z L
I T A
A U S
I R L
C A N
N O R
G B R
L U X
O E C D
B E L
F R A
K O R
I S R
U S A
A U T
N L D
D N K
F I N D E U
S W E
C H E
J P N
M E X
BCrsquos paperform
is one-the levleadingcountr
014 KPMG LLP a Canadian limit ed liability par tnership and a member firm of the KPMG network of independent member
s affiliated with KPMG International Cooperative (ldquoKPMG Internationalrdquo) a Swiss entity All rights reserved
copy 2014 KPMG LLP a Canadian limited liabi lity partnership and a member firm of the KPMG network of independent member
firms affiliated with KPMG International Cooperative (ldquoKPMG Internationalrdquo) a Swiss entity All rights reserved
British Columbia Technology Report Card 2014 British Columbia Technology Report Card
Industry Profile and Comparative Analysis Industry Profile and Comparative An
8102019 BC Technology Report Card 2014 Edition
httpslidepdfcomreaderfullbc-technology-report-card-2014-edition 2527
he technology industry not only generates GDP employment and income
ithin the technology sectors (referred to as direct impact) it also brings
dditional benefits to the overall BC economy by supporting suppliers to
e industry (indirect impact) and through the re-spending of labour income
arned in technology and supplier industries (induced impact)
ur economic impact analysis indicates that the overall impact of the technology industry on the BConomy is significantly magnified by the indirect and induced impacts We estimate that based on
rrent technology industry revenues of $23 billion the total contribution to the BC economy is
$23 ndash $26 billion in GDP
165000 ndash 188000 jobs created or sustained
$10 ndash $12 billion in total labour income
ese high levels of economic benefits are consistent with an industry that is high value-add employs
ghly skilled workers pays high wages and is well integrated in the economy 16
s noted earlier in the report while the technology industry has made a significant contribution to the
C economy our province still trails other Canadian provinces and US jurisdictions in this respect For
ample the BC technology ind ustry current ly comprises 76 percent of provincial GDP compared to
3 percent contribut ed by the US technology industry to US GDP So what would happen if the BC
chnology industry grew to comprise 103 percent of the provincial economy
ur analysis indicates that growing to 103 percent of the provincial economy would bring an additional
1B in BC technology industry revenues and an associated increase of $91B ndash 102B in total
DP 65K ndash 74K additional jobs created or sustained and a $41B ndash 46B increa se in labour
come These estimates include the combined benefits of the direct indirect and induced impacts
the economy
Economic ImpactAssessment
sti mating the technology industry economic impact is challenging due to the lack of standard technology industry classificati ons and
corresponding technology-specific impact multipliers To estimate the impact KPMG used weighted averages of standard industry sector impact
multipliers based on the definition of sectors comprising the tech industry We have chosen to represent the impacts as ranges using different
sectoral weights The use of ranges reflects the inherent variability in the technology industry caused by the diversity of sectors that it comprises
For example a dollar worth of output in the tech industry will have a different economic impact depending on whether it is generated by the
software publishing sector the telecommunication sector or the motion picture and post-production sector In our analysis of direct impacts we
have used figures reported by BC Stats To estimate the indirect and induced impacts we have used industry-standard multipliers developed by
Statistics Canada
Going deeper
Current BC Technology Industry Economic Impact
Given that the industry generated $23 billion in revenues we estimate that the industry contributed
$23 ndash $26 billion to total GDP created or sustained 165000 ndash 188000 jobs an d delivered $10 ndash $12 billion
to total labour income This impact breaks down in direct indirect and induced impact as follows
Current BC Tech Industry Impact
GDP
JOBS
LABOUR INCOME
$23 Bin Tech Industry
Revenues
Direct Impact Indirect Impact Induced Impact Total Impact
$15B
84K
$6B
$4B ndash 5B
43K ndash 52K
$4B ndash 6B
39K ndash 52K
$2B ndash 3B
$23B ndash 26B
165K ndash 188K
$10B ndash 12B$23B ndash 3B
BC Technology Industry Economic Impact Multipliers
In order to compare the technology industry to other industries as well as forecast the impact of
industry growth we have estimated the technology industry impact per dollar of revenue
We find that for each dollar of technology industry revenue the industry generates $1 ndash $112 in total
GDP and $045 ndash $05 in total labo ur income Further for each million dollars in te chnology industr y
revenue the industry generates or sustains seven to eight jobs in BC This impact breaks down in
direct indirect and induced impact as follows
Economic Impact Multiplier Estimates
GDP ($)
$1in Tech Revenues
For each
$1M in Tech Revenues
For each
Direct Impact Indirect Impact Induced Impact Total Impact
065 016 ndash 022 019 ndash 025 100 ndash 112
JOBS 362 186 ndash 228 168 ndash 226 716 ndash 817
LABOUR INCOME ($) 027 010 ndash 013 008 ndash 011 045 ndash 050
014 KPMG LLP a Canadian limit ed liability par tnership and a member firm of the KPMG network of independent member
s affiliated with KPMG International Cooperative (ldquoKPMG Internationalrdquo) a Swiss entity All rights reserved
copy 2014 KPMG LLP a Canadian limit ed liability par tnership and a member firm of the KPMG network of independent member
firms affiliated with KPMG International Cooperative (ldquoKPMG Internationalrdquo) a Swiss entity All rights reserved
British Columbia Technology Report Card
Economic Impact Assess
8102019 BC Technology Report Card 2014 Edition
httpslidepdfcomreaderfullbc-technology-report-card-2014-edition 2627
GDP
JOBS
LABOUR INCOME
$91 BTech Revenues
Additional
Direct Impact Indirect Impact Induced Impact Total Impact
$59B
33K
$25B
$15B ndash 2B
17K ndash 21K
$09B ndash 12B
$17B ndash 23B
15K ndash 21K
$07B ndash 10B
$91B ndash 102B
65K ndash 74K
$41B ndash 46B
Economic Impact of BC Technology Industry Growth
demonstrate the magnitude of potential economic benefit from growing the BC technology industry
e chose to estimate these benefits in the context of a specific growth figure As shown in the GDP
alysis section of this report BC trails significantly many US states as well as the US average in terms
the share of the technology industry to the economy as a whole We asked the question ndash what
ould be the economic impact if we caught up to the US average
e US technology industr y contributes 103 percen t to the overall US GDP as compared to 76 percent
ntributed by the BC technology industry to the BC economy To reach the current contribution level
the US the BC technology industr y will need to add an additional $6 B in GDP corresponding to an
ditional $9B in technology industry revenues (given current industry multipliers)
ur analysis indicates that growing to 103 percent of the provincial economy would bring an additional1B in BC technology indust ry revenues and an associ ated increase of $91B ndash 102B in total GDP
K ndash 74K additional jobs created or sustained and a $41B ndash 46B increase in labour income This
pact breaks down in direct indirect and induced impact as follows
conomic Impact of Growing the BC Technology Industry Contribution to Match the US
While this report card clearly demonstrates the tech
industryrsquos importance to BCrsquos economy itrsquos the possibilities
revealed that most command our attention And itrsquos in our
flaws that our future lies Despite the industryrsquos provincial
strength we trail our Canadian peers on a number of
metrics such as the availability of local venture capital
building field-specific talent pools and increasing firm size
But though these challenges are significant identifying
them ndash knowing what we have to do and where to apply our
resources investments and commitments ndash provides a clear
roadmap for improvement and sustainable success
Wersquore in a very good place The potential for BC tech to become
a major national and global player is right in front of us Indeed
a number of technology companies are already flourishing in
BC with significant operations owned or being built by
bull Canadarsquos largest defense company MDA
bull Canadarsquos largest cleantech company Westport
bull Worldrsquos largest machine-to-machine wireless company
Sierra Wireless
bull Canadarsquos largest social media management company
Hootsuite
bull The first commercial quantum computing company Dwave
bull And global leaders like Amazon Best Buy Boeing
Electronic Arts Microsoft IBM McKesson Sams
Schneider Electri c Sony Imageworks and SAP
As these and other companies have realized BC is o
the most vibrant start-up ecosystems anywhere in th
one that regularly translates great ideas creative tale
audacious vision into some of the hottest tech compaaround Itrsquos a dynamic environment teeming with bra
entrepreneurs who thrive on their peersrsquo global aspira
With this core of industry infrastructure top talent an
innovative thinking in place BC is well positioned to
the tech industryrsquos many emerging and evolving opp
Every powder keg however needs a fuse BC is a te
hot spot but we have to keep stoking the fires of in
ambition and talent to ensure the positive gains mad
2012 become major leaps the next time we take stoc
means we have to work together ndash emerging tech st
ups and major corporate players industry investors a
trend-setters policy makers and academic leaders al
we continue to improve in the key areas identified in
report we can keep building the momentum BC tech
to realize its provincial successes and gains on the n
and global scales
ConclusionTaking the next step together
AcknowledgementsKPMG would like to gratefully acknowledge the support of BC Stats in the development of this report
Our detailed statistical analysis would not have been possible without the rich collection of BC industry
data provided to us by BC Stats
014 KPMG LLP a Canadian limit ed liability par tnership and a member firm of the KPMG network of independent member
s affiliated with KPMG International Cooperative (ldquoKPMG Internationalrdquo) a Swiss entity All rights reserved
copy 2014 KPMG LLP a Canadian limit ed liability par tnership and a member firm of the KPMG network of independent member
firms affiliated with KPMG International Cooperative (ldquoKPMG Internationalrdquo) a Swiss entity All rights reserved
British Columbia Technology Report Card 2014 British Columbia Technology Report Card
Economic Impact Assessment Concl
8102019 BC Technology Report Card 2014 Edition
httpslidepdfcomreaderfullbc-technology-report-card-2014-edition 2727
KPMG in Canada provides Audit Tax and Advisory services We work closely with our clients
helping them to mitigate risks and grasp opportunities
KPMG in Canada is committed to our clients We have made considerable investments in regards to
personnel research and hard-won experience Through these investments we strive to be the best
in everything we do turning our experience and industry knowledge into real value for our clients
This is the KPMG Way
Contact us
For more information please contact your KPMG adviser or one of the following professionals
Anthony Lindsay
Partner Greater Vancouver Area Market Leader
Technology Media and Telecommunications
T 604-646-6379
E tdlindsaykpmgca
Slavi Diamandiev
Greater Vancouver Area
Economics Practice Leader
Management Consulting
T 604-673-4458
E sdiamandievkpmgca
Ed Zacharuk
Partner Greater Vancouver Area SRampED
Practice Leader
T 604-691-3201
E ezacharukkpmgca
Sukesh Kumar
Partner National Leader India Desk
T 604-527-3468
E skumarkpmgca
Walter Pela
Partner in Charge of Tax Services
Greater Vancouver Area
T 604-691-3193
E wpelakpmgca
Ian Wilshaw
Partner Greater Vancouver Area Market Leader
Private Equity
T 604-691-3557
E idwilshawkpmgca
The information contained herein is of a general nature and is not intended to address the circumstances of any particular individual or entity Although we endeavor to
provide accurate and timely information there can be no guarantee that such information is accurate as of the date it is received or that it will continue to be accurate in
the future No one should act on such information without appropriate professional advice after a thorough examination of the particular situation
kpmgcatmt
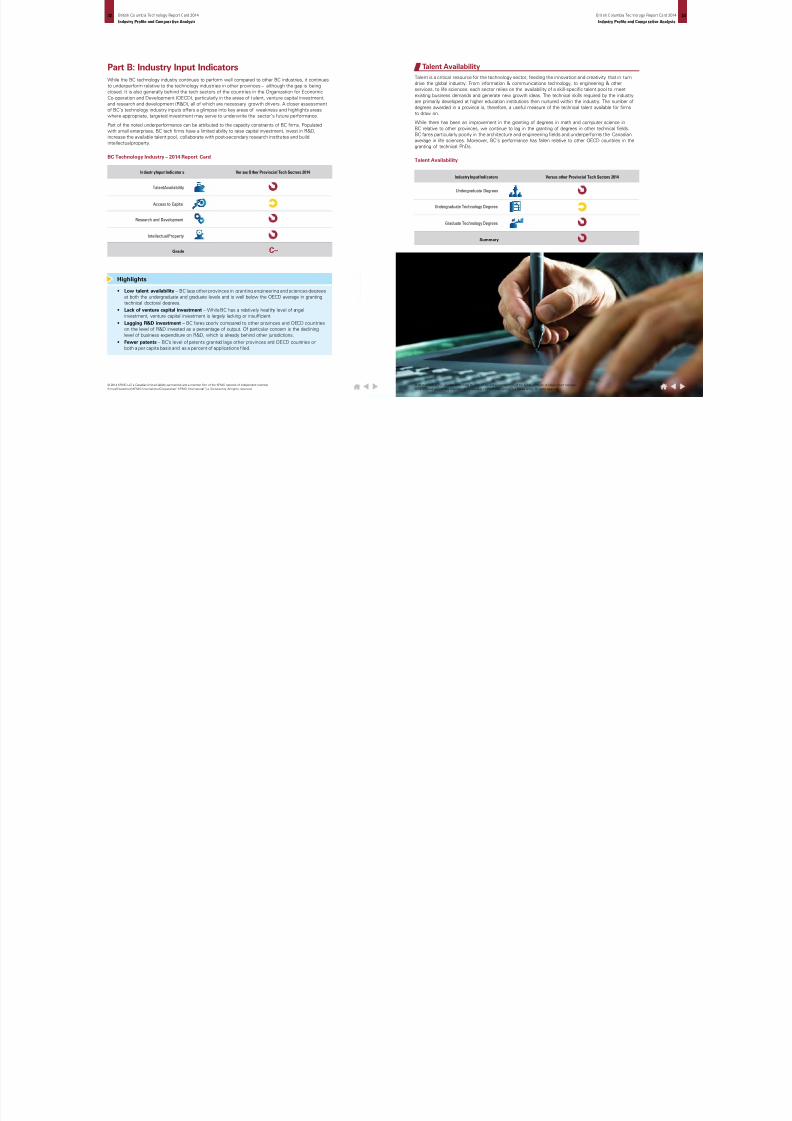
8102019 BC Technology Report Card 2014 Edition
httpslidepdfcomreaderfullbc-technology-report-card-2014-edition 1827
art B Industry Input Indicatorshile the BC technology industry continues to perform well compared to other BC industries it continues
underperform relative to the technology industries in other provinces ndash although the gap is being
osed It is also generally behind the tech sectors of the countries in the Organization for Economic
o-operation and Development (OECD) particularly in the areas of t alent venture capital investment
d research and development (RampD) all of which are necessary growth drivers A closer assessment
BCrsquos technology industry inputs offers a glimpse into key areas of weakness and highlights areas
here appropriate targeted investment may serve to underwrite the sectorrsquos future performance
rt of the noted underperformance can be attributed to the capacity constraints of BC firms Populated
th small enterprises BC tech firms have a limited ability to raise capital investment invest in RampD
crease the available talent pool collaborate with post-secondary research institutes and build
ellectual property
C Technology Industry ndash 2014 Report Card
Talent Availability
Industr y Input Indicator s Ver sus O ther Provincial Tech Sectors 2014
Grade
Access to Capital
Research and Development
Intellectual Property
Cndash
bull Low talent availability ndash BC lags other provinces in granting engineering and sciences degrees
at both the undergraduate and graduate levels and is well below the OECD average in granting
technical doctoral degrees
bull Lack of venture capital investment ndash While BC has a relatively healthy level of angel
investment venture capital investment is largely lacking or insufficient
bull Lagging RampD investment ndash BC fares poorly compared to other provinces and OECD countries
on the level of RampD invested as a percentage of output Of particular concern is the declining
level of business expenditure on RampD which is already behind other jurisdictions
bull Fewer patents ndash BCrsquos level of patents granted lags other provinces and OECD countries on
both a per capita basis and as a percent of applications filed
Highlights
Talent Availability
Talent is a critical resource for the technology sector feeding the innovation and creativity that in turn
drive the global industry From information amp communications technology to engineering amp other
services to life sciences each sector relies on the availability of a skill-specific talent pool to meet
existing business demands and generate new growth ideas The technical skills required by the industry
are primarily developed at higher education institutions then nurtured within the industry The number of
degrees awarded in a province is therefore a useful measure of the technical talent available for firms
to draw on
While there has been an improvement in the granting of degrees in math and computer science in
BC relative to other provinces we continue to lag in the granting of degrees in other technical fields
BC fares particularly poorly in the architecture and engineering fields and underperforms the Canadian
average in life sciences Moreover BCrsquos performance has fallen relative to other OECD countries in the
granting of technical PhDs
Talent Availability
Undergraduate Degrees
Industry Input Indicators
Summary
Undergraduate Technology Degrees
Graduate Technology Degrees
Versus other Provincial Tech Sectors 2014
014 KPMG LLP a Canadian limit ed liability par tnership and a member firm of the KPMG network of independent member
s affiliated with KPMG International Cooperative (ldquoKPMG Internationalrdquo) a Swiss entity All rights reserved
copy 2014 KPMG LLP a Canadian limited liabi lity partnership and a member firm of the KPMG network of independent member
firms affiliated with KPMG International Cooperative (ldquoKPMG Internationalrdquo) a Swiss entity All rights reserved
British Columbia Technology Report Card 2014 British Columbia Technology Report Card
Industry Profile and Comparative Analysis Industry Profile and Comparative An
8102019 BC Technology Report Card 2014 Edition
httpslidepdfcomreaderfullbc-technology-report-card-2014-edition 1927
oing deeper
illed labour availability in BC as measured by the level of undergraduate degrees granted per capita
iled only Ontario in 2012 having grown steadily over the last three years13
Data for Queacutebec has been revised downwards significantly by BC Stats Undergraduate degrees per 100000 population was lower than the
evel in BC up to 2008 and remains that way till 2011
urce Profile of the British Columbia High Technology Sector BC Stats March 2014
0
0
0
0
0
0
0
20022001 2003 2004 2005 2006 2007 2008 2009 2010 2011
O ntar io Q ueacute be cBritish Columbia Alberta
ndergraduate Degrees per 100000 Population
nnual Undergraduate Degrees per 100000 Population 2011
owever in terms of the relevance of those degrees to the technology industry BC continues to
il other provinces on average For both undergraduate and graduate degrees BC is well behind the
nadian average and the degree rates of other provinces in the fields of architecture and engineering
e province is also behind the Canadian average in the granting of undergraduate and graduate degrees
the physical and life sciences disciplines Only in the fields of math computer science and information
ence has there been a positive trend since 2009 with BC now second only to Ontario in granting
th undergraduate and graduate degrees in these disciplines
Queacutebec Ont ario Alberta Brit ish ColumbiaCanada
0
0
0
0
0
0
0
0Undergraduate
Degrees ndash Architecture and
Engineering
Undergraduate
Degrees ndash Physical
and Life Sciences
Undergraduate
Degrees ndash Math Computer
and Information Science
BC produces thesecond highest
number ofundergraduateson a per capitabasis butcontinues to
trail Ontariosignificantly
Globally Canadarsquos rate of granting technology-related doctoral degrees per 1000 population in the
reference age cohort is well below the OECD average Since 2009 the level in Canada remained
the same at 12 percent while the OECD average improved slightly to 16 percent KPMG estimates
that BCrsquos rate of doctoral degrees of 06 percent also did not change since the last estimate in
2009 meaning a deficit of 60 percent versus other OECD jurisdictions More concerning yet is that
many of the countries that trailed Canada and British Columbia in 2000 had surpassed us by 2011
(eg Italy Iceland and Greece)
Source Profile of the British Columbia High Technology Sector BC Stats March 2014
Source KPMG Analysis and OECD Science Technology and Industry Scorecard 2013 OECD 2013
urce Profile of the British Columbia High Technology Sector BC Stats March 2014
Technology Related Doctoral Degrees as Percentage of Population in Reference Age Cohort
Annual Graduate Degrees per 100000 Population 2011
Queacutebec Ontario Alberta British ColumbiaCanada
300
250
200
150
100
50
00Graduate Degrees ndash
Architecture andEngineering
Graduate Degrees ndash Physicaland Life Sciences
Graduate Degrees ndash MathComputer and Information Science
014 KPMG LLP a Canadian limit ed liability par tnership and a member firm of the KPMG network of independent member
s affiliated with KPMG International Cooperative (ldquoKPMG Internationalrdquo) a Swiss entity All rights reserved
copy 2014 KPMG LLP a Canadian limit ed liability par tnership and a member firm of the KPMG network of independent member
firms affiliated with KPMG International Cooperative (ldquoKPMG Internationalrdquo) a Swiss entity All rights reserved
British Columbia Technology Report Card 2014 British Columbia Technology Report Card
Industry Profile and Comparative Analysis Industry Profile and Comparative An
8102019 BC Technology Report Card 2014 Edition
httpslidepdfcomreaderfullbc-technology-report-card-2014-edition 2027
Access to Capital
ccess to risk capital throughout the growth cycle is one of
e most significant determinants of tech sector success
has been empirically established that companies that
ceive risk capital have a significantly higher survival rate
perience stronger revenue employee wage and asset
owth and invest in higher levels of RampD 14
e BC technology industry has had a healthy growth in
gel investment which typically takes the form of seed
pital that helps in the emergence of start-ups However
rly stage venture capital investment ndash a necessary fuel
r growing start-ups into thriving companies ndash is deficient
BC and has been declining in recent years And of the
early stage venture capital that is invested there has
been a decline in the share invested by local funds which
deprives companies not only of adequate risk capital but
also of the guidance and networking opportunities that
are essential in early growth stages At the same time
BC companies attract a significant amount of foreign and
extra-provincial investment at the later stages of growth
Together these findings suggest that small technology firms
in BC are limited in their ability to access timely risk capital
that can propel their growth and firms that successfully
attract foreign venture capital may be at risk of relocating
outside BC
These findings can be explored in detail in the recent study by CVCA and Industry Canada titled ldquoThe Performance of Canadian Firms that
Received Venture Capital Financingrdquo published in June 2013
ccess to Capital
Access to Angel Investment
Summary
Access to Venture Capital
Are at Versus Other Provincial Tech Sectors 2014
Industry leaders almost universally agreed that access
to talent has become the most significant issue facing
their firms They cite a tightening of talent availability
over the past few years growing shortages in certain
key technical areas including software and web
development and a need to expand the available talent
pool in areas such as industrial technologies and sales
and marketing as critical issues
The challenges in talent availability have been exacerbated
by the arrival or impending arrival of several multinational
firms on the BC tech scene With a relatively constrained
talent pool the competition for available resources has
increased and with it compensation levels have risen
Several of the larger US-based multinationals are offering
compensation packages at significant premiums over the
average compensation levels in the BC market leading
to growing talent development attraction and retention
challenges for smaller BC companies In some cases this
has led to BC-based companies establishing or growing
their operations outside of BC where talent is less
expensive and more available
Leaders agreed that long-term industry success will
require an expanded talent pool developed by improving
the quantity and quality (job-readiness) of post-secondary
degree programs as well as by attracting talent from
outside of BC and Canada
The high cost of real estate was cited as a primary
barrier to attracting outside talent particularly where
mid- and senior-level management must be relocated
As a result companies are looking at alternative ways
of addressing relocation costs and at targeting talentmarkets where the cost differential or the expectation
of home ownership are less
Industry Insights on Talent Availability
In recent years the vast majority of venture capital invested in BC was in later stage financing Early
stage venture capital is significantly more limited and has been declining over the last few years
Capital by Stage of Investment
Venture Capital by Stage of Investment
Going deeper
BC has experienced steady growth in the level of angel investments in the province since the mid-2000s
Venture capital investment on the other hand has been more volatile
Source CVCA and BCTIA analysis of Thompson Reuters Data
Source CVCA and BCTIA analysis of Thompson Reuters Data
$0
$100
$200
$300
4
2003
$40
$110
2004
$31
$254
2005
$32
$226
2006
$54
$298
2007
$54
$316
2008
$64
$260
2009
$67
$141
2010
$72
$223
2011
$87
$233
2012
$97
$201
Ve ntur e C ap ital Ang el
$ m i l l i o n
$0
$100
$200
$300
$51
$172
$43
$190
$16
$185
2010 2011 2012
VC Later Stage VC Early Stage
$ m i l l i o n
014 KPMG LLP a Canadian limit ed liability par tnership and a member firm of the KPMG network of independent member
s affiliated with KPMG International Cooperative (ldquoKPMG Internationalrdquo) a Swiss entity All rights reserved
copy 2014 KPMG LLP a Canadian limit ed liability par tnership and a member firm of the KPMG network of independent member
firms affiliated with KPMG International Cooperative (ldquoKPMG Internationalrdquo) a Swiss entity All rights reserved
British Columbia Technology Report Card 2014 British Columbia Technology Report Card
Industry Profile and Comparative Analysis Industry Profile and Comparative An
8102019 BC Technology Report Card 2014 Edition
httpslidepdfcomreaderfullbc-technology-report-card-2014-edition 2127
verall BC placed second to last in the level of total venture capital invested among the 20 North
merican jurisdictions examined This is particularly concerning as the technology industry is inherently
obile and decisions regarding the location of operations can be significantly influenced by structural
ctors such as access to capital rather than the presence of local demand
e decline in locally sourced early stage capital is particularly concerning given its importance At the
me time a significant share of later stage investment originates from foreign sources which presents
potential risk that firms may subsequently relocate outside of BC
urce CVCA and BCTIA analysis of Thompson Reuters Data
urce KPMG Analysis of Thomson Reuters Data
$million
$33
$18
$11
$32
$0
$10
$20
$30
$40
2010 2011 2012
$3
$12
CanadianForeign
arly Stage VC Investment by Source
enture Capital Investments 2012
C a
l i f o r n
i a
M a s s e c
h u s e t t s
N e w
Y o r k
T e x a s
W a s
h i n g t o n
M a r y
l a n
d
U t a
h
O h i o
N e w
J e r s e y
O n t a r i o
V i r g i n i a
Q u e
b e c
B r i t i s
h C o
l u m
b i a
P e n n s y
l v a n
i a
I l l i n o
i s
A r i z o n a
C o
l o r a
d o
G e o r g
i a
M i n n e s o t a
M i c h i g a n
V C P e r
C a p
i t a -
$
$500
$450
$400
$350
$300
$250
$200
$150
$100
$50
$0
$6000
$5000
$4000
$3000
$2000
$1000
$0
VC per capita 2012Venture Capital 2012
Locallysourced earlystage VC
investmenthas beendeclining
Research and Development
RampD expenditure is the long-term investment in an industryrsquos future economic performance It measures
commitment to using innovation and knowledge creation to enhance productivity and improve competitiveness
Over the last few years there has been little increase in overall RampD investment in BC As such it
ranks below Ontario and Queacutebec However the composition of RampD spending has changed over time
with the share of business investment in RampD experiencing a steady decline The fact that the industry
is populated with small firms with fewer than 50 employees can help explain this trend BC is host to
very few large anchor companies that have the revenues and the capital to spend in significant ways
on research for the purposes of enhancing competitiveness
Research and Development
Summary
BERD as a Percentage of GDP
RampD as a Percentage of GDP
Versus other Provincial Tech Sectors 2014
The technology industry leaders interviewed recognized that there is a healthy local angel
network in BC However early stage venture capital financing in BC is seen as either absent
or modest making it difficult for small companies to grow There is a sense that attracting
venture capital from out-of-province is also challenging because physical proximity is an
important investment factor
Overall the opinion was that the limited presence of venture capital in BC leads to an absence
of investment competition which impacts competitive valuation and terms Industry leaders also
noted that local venture capital funds often take a revenue-based valuation approach Paradoxically
this may mean that a company can be valued higher by an angel investor prior to earning any
revenue than by an institutional investor once it starts generating revenue Since angel investors
typically expect high returns on initial investment this may make it difficult for small companies
to raise subsequent rounds of institutional financing often leaving them with prospects of
constrained growth due to limited capitalization or the option of selling early This lack of breadth
in the capital pool can lead to a vicious cycle of limited company growth and depressed valuations
of small companies seeking funding
Industry Insights on Risk Capital Investment
014 KPMG LLP a Canadian limit ed liability par tnership and a member firm of the KPMG network of independent member
s affiliated with KPMG International Cooperative (ldquoKPMG Internationalrdquo) a Swiss entity All rights reserved
copy 2014 KPMG LLP a Canadian limit ed liability par tnership and a member firm of the KPMG network of independent member
firms affiliated with KPMG International Cooperative (ldquoKPMG Internationalrdquo) a Swiss entity All rights reserved
British Columbia Technology Report Card 2014 British Columbia Technology Report Card
Industry Profile and Comparative Analysis Industry Profile and Comparative An
8102019 BC Technology Report Card 2014 Edition
httpslidepdfcomreaderfullbc-technology-report-card-2014-edition 2227
BC total RampD spending as a percent of GDP has remained relatively constant since 2008 Other
ovinces experienced a slight decline in this metric While BC remains higher than Alberta in this
gard it still makes up only 60 percent of the RampD expenditure levels in Ontario and Queacutebec
oing deeper
$3 billion there was no significant increase in the total RampD expenditure in BC since 2008 although
e composition of the spending changed The share of higher education and private non-profit
penditure continued to grow from 39 percent in 2008 to 43 percent in 2010 while that of business
terprise shrank by an equivalent amount to 53 percent in 2010
urce Profile of the British Columbia High Technology Sector BC Stats March 2014
urce Profile of the British Columbia High Technology Sector BC Stats March 2014
0
500
1000
1500
2000
2500
3000
3500
2000 2001 2002 2003 2004 2005 2006 2007 2008 2009 2010
Business Enterprise Higher Education amp Private Non-Profit
F ed er al Go vt P ro vin ci al Go ve rn me nt amp Re se ar ch In st it ut ion s
ampD Expenditures in British Columbia
ampD as a Percent of GDP
000
050
100
150
200
250
300
2007 2008 2009 2010
Ont ar io QueacutebecBritish Columbia Alberta
Overall RampDinvestment in
BC has beenconstant withan increase
in highereducation
spendingequal to thereductionin business
investmentin RampD
BCrsquos levelof RampD as apercentageof GDP has
been constantbut remains40 percent
lower thanOntario and
Queacutebec
Source KPMG Analysis of BC Stats Data and OECD Science Technology and Industry Scorecard 2013 OECD 2013
RampD Expenditure as a Percent of GDP
Since the last report card BC did not improve its global standing in RampD intensity as it continues
to perform 40 percent below the OECD average
I S R
K O R
F I N
J P N
S
W E
C H E
D N K
D E U
U S A
A U T
S V N
I S L
O E C D
E S T
F R A
C H N
B E L
O N
A U S
E
U 2 8
N L D
C Z E
G B R
L U X
C A N
I R L
N O R
P R T
B C
E S P
Z A F
I T A
H
U N
N Z L
R U S
M
E X
T U R
P O L
S V K
C H L
0
1
2
3
4
5
2011 2001
Q C
The BERD (business expenditures on RampD) ratio ndash which reflects the level of industry commitment
within the technology industry ndash has fallen for all provinces since 2008 BC still performs better than
Alberta with its businesses contributing 078 percent of GDP to RampD investment but remains well
below Queacutebec and Ontario which contribute 142 percent and 109 percent respectively
Source Profile of the British Columbia High Technology Sector BC Stats March 2014
Business Expenditure on RampD as a Percent of GDP
0
05
10
15
20
2007 2008 2009 2010
P e r c e n t o f G D P
CanadaOntario QueacutebecBritish Columbia Alberta
BusineRampD apercen
of GDPis 20 plower tCanad
BC fell below averageexpendpercent
014 KPMG LLP a Canadian limit ed liability par tnership and a member firm of the KPMG network of independent member
s affiliated with KPMG International Cooperative (ldquoKPMG Internationalrdquo) a Swiss entity All rights reserved
copy 2014 KPMG LLP a Canadian limit ed liability par tnership and a member firm of the KPMG network of independent member
firms affiliated with KPMG International Cooperative (ldquoKPMG Internationalrdquo) a Swiss entity All rights reserved
British Columbia Technology Report Card 2014 British Columbia Technology Report Card
Industry Profile and Comparative Analysis Industry Profile and Comparative An
8102019 BC Technology Report Card 2014 Edition
httpslidepdfcomreaderfullbc-technology-report-card-2014-edition 2327
0
0
0
0
0
0
0
0
0
I S R K O R F I N J
P N S W E C
H E D N K
D E U
U S A
A U T
S V N I S L
O E C D E
S T F R A
C H N B
E L A U S
E U 2 8 I R L C
Z E G B R
L U X
C A N N
L D N O R B C
H U N E
S P P R T I T A R
U S N Z L
Z A F
T U R
S V K
P O L
M E X
C H L
2011 2001
usiness Expenditure on RampD as a Percent of GDP
Crsquos BERD remained 50 percent below the OECD average and did not experience any change from the
01 level This means between 2001 and 2011 BC was surpassed by countries like China and Australia
their level of BERD investment as a p ercent of GDP
urce KPMG Analysis of BC Stats Data and OECD Science Technology and Industry Scorecard 2011 OECD 2011
BusinessRampD in BCis one-thirdthe level of
leading OECDcountries
Going deeper
Compared to other provinces with significant technology industries BC continues to trail in terms of both
the number of patents filed and the number of patents granted on both an absolute and per capita basis
Intellectual Property
Canadian Patents Filed and Granted
Source Canadian Patent Office
Intellectual Property
Intellectual property is a bellwether of the inventory of assets that can be commercialized to underwrite
future economic performance As measured by the number of patent applications submitted and
granted intellectual property reflects the success of RampD investment in the development of innovative
products provides an indication of the commercial viability of research and provides an indication of the
competitiveness of the technology industry as a whole Consistent with the findings of the 2012 report
card BC still ranks well below all other provinces with significant technology industries in the level of
patents awarded both on a per capita basis and as a percentage of applications filed
Patents Granted
Versus Other Provincial Tech Sectors 2014
Summary
0
500
1000
1500
2000
2500
Patents Filed ndash2011
Patents Filedndash2012
Patents Granted ndash2011
Patents Granted ndash2012
Ontario Queacutebec Alberta British Columbia
copy 2014 KPMG LLP a Canadian limit ed liability par tnership and a member firm of the KPMG network of independent member
firms affiliated with KPMG International Cooperative (ldquoKPMG Internationalrdquo) a Swiss entity All rights reserved
014 KPMG LLP a Canadian limited liabi lity partnership and a member firm of the KPMG network of independent member
s affiliated with KPMG International Cooperative (ldquoKPMG Internationalrdquo) a Swiss entity All rights reserved
British Columbia Technology Report Card 2014 British Columbia Technology Report Card
Industry Profile and Comparative Analysis Industry Profile and Comparative An
8102019 BC Technology Report Card 2014 Edition
httpslidepdfcomreaderfullbc-technology-report-card-2014-edition 2427
ore telling is the fact that BC has had the lowest level of patents awarded as a percent of applications
er the last decade
e prevalence of small firms in the BC technology sector has a direct impact on the capacity of
mpanies to successfully pursue patents Not only do they have limited capacity to invest in RampD to
velop patentable innovations but their capital constraints limit their ability to access the legal and
ministrative expertise needed to execute patent applications
atents Awarded per 100000 Population
atents Granted as a Percent of Patent Applications
urce Profile of the British Columbia High Technology Sector BC Stats March 2014
urce Profile of the British Columbia High Technology Sector BC Stats March 2014
00
00
00
00
00
00
00
00
00
2001 2002 2003 2004 2005 2006 2007 2008 2009 2010 2011
CanadaO ntar io Q ueacute be cBritish Columbia Alberta
2001 2002 2003 2004 2005 2006 2007 2008 2009 2010 2011
CanadaO ntar io Q ueacute be cBritish Columbia Alberta
BCrsquos patentperformancesignificantlytrails otherprovinces
Canada still ranks 18th well behind the worldrsquos leading countries in terms of the number of triadic
patent families per million population ndash a measure of patents taken at three major patent offices in
the world KPMGrsquos estimate for BC places it even further down the list than it was in 200815
Triadic Patent Families per Million Population 2010
Source KPMG Analysis of BC Stats Data and OECD Science Technology and Industry Scorecard 2013 OECD 2013
15 KPMG estimated BCrsquos ranking on the chart by considering the relative proportions of patents awarded in BC versus Canada as a whole on
a per capita basis
0
20
40
60
80
100
1
I D N
I N D
B R A
T U R
R U S
C H L
Z A F
C H N
P O L
S V K
G R C
C Z E
P R T
H U N
E S P
E S T
S V N
W L D
B C
I S L
N Z L
I T A
A U S
I R L
C A N
N O R
G B R
L U X
O E C D
B E L
F R A
K O R
I S R
U S A
A U T
N L D
D N K
F I N D E U
S W E
C H E
J P N
M E X
BCrsquos paperform
is one-the levleadingcountr
014 KPMG LLP a Canadian limit ed liability par tnership and a member firm of the KPMG network of independent member
s affiliated with KPMG International Cooperative (ldquoKPMG Internationalrdquo) a Swiss entity All rights reserved
copy 2014 KPMG LLP a Canadian limited liabi lity partnership and a member firm of the KPMG network of independent member
firms affiliated with KPMG International Cooperative (ldquoKPMG Internationalrdquo) a Swiss entity All rights reserved
British Columbia Technology Report Card 2014 British Columbia Technology Report Card
Industry Profile and Comparative Analysis Industry Profile and Comparative An
8102019 BC Technology Report Card 2014 Edition
httpslidepdfcomreaderfullbc-technology-report-card-2014-edition 2527
he technology industry not only generates GDP employment and income
ithin the technology sectors (referred to as direct impact) it also brings
dditional benefits to the overall BC economy by supporting suppliers to
e industry (indirect impact) and through the re-spending of labour income
arned in technology and supplier industries (induced impact)
ur economic impact analysis indicates that the overall impact of the technology industry on the BConomy is significantly magnified by the indirect and induced impacts We estimate that based on
rrent technology industry revenues of $23 billion the total contribution to the BC economy is
$23 ndash $26 billion in GDP
165000 ndash 188000 jobs created or sustained
$10 ndash $12 billion in total labour income
ese high levels of economic benefits are consistent with an industry that is high value-add employs
ghly skilled workers pays high wages and is well integrated in the economy 16
s noted earlier in the report while the technology industry has made a significant contribution to the
C economy our province still trails other Canadian provinces and US jurisdictions in this respect For
ample the BC technology ind ustry current ly comprises 76 percent of provincial GDP compared to
3 percent contribut ed by the US technology industry to US GDP So what would happen if the BC
chnology industry grew to comprise 103 percent of the provincial economy
ur analysis indicates that growing to 103 percent of the provincial economy would bring an additional
1B in BC technology industry revenues and an associated increase of $91B ndash 102B in total
DP 65K ndash 74K additional jobs created or sustained and a $41B ndash 46B increa se in labour
come These estimates include the combined benefits of the direct indirect and induced impacts
the economy
Economic ImpactAssessment
sti mating the technology industry economic impact is challenging due to the lack of standard technology industry classificati ons and
corresponding technology-specific impact multipliers To estimate the impact KPMG used weighted averages of standard industry sector impact
multipliers based on the definition of sectors comprising the tech industry We have chosen to represent the impacts as ranges using different
sectoral weights The use of ranges reflects the inherent variability in the technology industry caused by the diversity of sectors that it comprises
For example a dollar worth of output in the tech industry will have a different economic impact depending on whether it is generated by the
software publishing sector the telecommunication sector or the motion picture and post-production sector In our analysis of direct impacts we
have used figures reported by BC Stats To estimate the indirect and induced impacts we have used industry-standard multipliers developed by
Statistics Canada
Going deeper
Current BC Technology Industry Economic Impact
Given that the industry generated $23 billion in revenues we estimate that the industry contributed
$23 ndash $26 billion to total GDP created or sustained 165000 ndash 188000 jobs an d delivered $10 ndash $12 billion
to total labour income This impact breaks down in direct indirect and induced impact as follows
Current BC Tech Industry Impact
GDP
JOBS
LABOUR INCOME
$23 Bin Tech Industry
Revenues
Direct Impact Indirect Impact Induced Impact Total Impact
$15B
84K
$6B
$4B ndash 5B
43K ndash 52K
$4B ndash 6B
39K ndash 52K
$2B ndash 3B
$23B ndash 26B
165K ndash 188K
$10B ndash 12B$23B ndash 3B
BC Technology Industry Economic Impact Multipliers
In order to compare the technology industry to other industries as well as forecast the impact of
industry growth we have estimated the technology industry impact per dollar of revenue
We find that for each dollar of technology industry revenue the industry generates $1 ndash $112 in total
GDP and $045 ndash $05 in total labo ur income Further for each million dollars in te chnology industr y
revenue the industry generates or sustains seven to eight jobs in BC This impact breaks down in
direct indirect and induced impact as follows
Economic Impact Multiplier Estimates
GDP ($)
$1in Tech Revenues
For each
$1M in Tech Revenues
For each
Direct Impact Indirect Impact Induced Impact Total Impact
065 016 ndash 022 019 ndash 025 100 ndash 112
JOBS 362 186 ndash 228 168 ndash 226 716 ndash 817
LABOUR INCOME ($) 027 010 ndash 013 008 ndash 011 045 ndash 050
014 KPMG LLP a Canadian limit ed liability par tnership and a member firm of the KPMG network of independent member
s affiliated with KPMG International Cooperative (ldquoKPMG Internationalrdquo) a Swiss entity All rights reserved
copy 2014 KPMG LLP a Canadian limit ed liability par tnership and a member firm of the KPMG network of independent member
firms affiliated with KPMG International Cooperative (ldquoKPMG Internationalrdquo) a Swiss entity All rights reserved
British Columbia Technology Report Card
Economic Impact Assess
8102019 BC Technology Report Card 2014 Edition
httpslidepdfcomreaderfullbc-technology-report-card-2014-edition 2627
GDP
JOBS
LABOUR INCOME
$91 BTech Revenues
Additional
Direct Impact Indirect Impact Induced Impact Total Impact
$59B
33K
$25B
$15B ndash 2B
17K ndash 21K
$09B ndash 12B
$17B ndash 23B
15K ndash 21K
$07B ndash 10B
$91B ndash 102B
65K ndash 74K
$41B ndash 46B
Economic Impact of BC Technology Industry Growth
demonstrate the magnitude of potential economic benefit from growing the BC technology industry
e chose to estimate these benefits in the context of a specific growth figure As shown in the GDP
alysis section of this report BC trails significantly many US states as well as the US average in terms
the share of the technology industry to the economy as a whole We asked the question ndash what
ould be the economic impact if we caught up to the US average
e US technology industr y contributes 103 percen t to the overall US GDP as compared to 76 percent
ntributed by the BC technology industry to the BC economy To reach the current contribution level
the US the BC technology industr y will need to add an additional $6 B in GDP corresponding to an
ditional $9B in technology industry revenues (given current industry multipliers)
ur analysis indicates that growing to 103 percent of the provincial economy would bring an additional1B in BC technology indust ry revenues and an associ ated increase of $91B ndash 102B in total GDP
K ndash 74K additional jobs created or sustained and a $41B ndash 46B increase in labour income This
pact breaks down in direct indirect and induced impact as follows
conomic Impact of Growing the BC Technology Industry Contribution to Match the US
While this report card clearly demonstrates the tech
industryrsquos importance to BCrsquos economy itrsquos the possibilities
revealed that most command our attention And itrsquos in our
flaws that our future lies Despite the industryrsquos provincial
strength we trail our Canadian peers on a number of
metrics such as the availability of local venture capital
building field-specific talent pools and increasing firm size
But though these challenges are significant identifying
them ndash knowing what we have to do and where to apply our
resources investments and commitments ndash provides a clear
roadmap for improvement and sustainable success
Wersquore in a very good place The potential for BC tech to become
a major national and global player is right in front of us Indeed
a number of technology companies are already flourishing in
BC with significant operations owned or being built by
bull Canadarsquos largest defense company MDA
bull Canadarsquos largest cleantech company Westport
bull Worldrsquos largest machine-to-machine wireless company
Sierra Wireless
bull Canadarsquos largest social media management company
Hootsuite
bull The first commercial quantum computing company Dwave
bull And global leaders like Amazon Best Buy Boeing
Electronic Arts Microsoft IBM McKesson Sams
Schneider Electri c Sony Imageworks and SAP
As these and other companies have realized BC is o
the most vibrant start-up ecosystems anywhere in th
one that regularly translates great ideas creative tale
audacious vision into some of the hottest tech compaaround Itrsquos a dynamic environment teeming with bra
entrepreneurs who thrive on their peersrsquo global aspira
With this core of industry infrastructure top talent an
innovative thinking in place BC is well positioned to
the tech industryrsquos many emerging and evolving opp
Every powder keg however needs a fuse BC is a te
hot spot but we have to keep stoking the fires of in
ambition and talent to ensure the positive gains mad
2012 become major leaps the next time we take stoc
means we have to work together ndash emerging tech st
ups and major corporate players industry investors a
trend-setters policy makers and academic leaders al
we continue to improve in the key areas identified in
report we can keep building the momentum BC tech
to realize its provincial successes and gains on the n
and global scales
ConclusionTaking the next step together
AcknowledgementsKPMG would like to gratefully acknowledge the support of BC Stats in the development of this report
Our detailed statistical analysis would not have been possible without the rich collection of BC industry
data provided to us by BC Stats
014 KPMG LLP a Canadian limit ed liability par tnership and a member firm of the KPMG network of independent member
s affiliated with KPMG International Cooperative (ldquoKPMG Internationalrdquo) a Swiss entity All rights reserved
copy 2014 KPMG LLP a Canadian limit ed liability par tnership and a member firm of the KPMG network of independent member
firms affiliated with KPMG International Cooperative (ldquoKPMG Internationalrdquo) a Swiss entity All rights reserved
British Columbia Technology Report Card 2014 British Columbia Technology Report Card
Economic Impact Assessment Concl
8102019 BC Technology Report Card 2014 Edition
httpslidepdfcomreaderfullbc-technology-report-card-2014-edition 2727
KPMG in Canada provides Audit Tax and Advisory services We work closely with our clients
helping them to mitigate risks and grasp opportunities
KPMG in Canada is committed to our clients We have made considerable investments in regards to
personnel research and hard-won experience Through these investments we strive to be the best
in everything we do turning our experience and industry knowledge into real value for our clients
This is the KPMG Way
Contact us
For more information please contact your KPMG adviser or one of the following professionals
Anthony Lindsay
Partner Greater Vancouver Area Market Leader
Technology Media and Telecommunications
T 604-646-6379
E tdlindsaykpmgca
Slavi Diamandiev
Greater Vancouver Area
Economics Practice Leader
Management Consulting
T 604-673-4458
E sdiamandievkpmgca
Ed Zacharuk
Partner Greater Vancouver Area SRampED
Practice Leader
T 604-691-3201
E ezacharukkpmgca
Sukesh Kumar
Partner National Leader India Desk
T 604-527-3468
E skumarkpmgca
Walter Pela
Partner in Charge of Tax Services
Greater Vancouver Area
T 604-691-3193
E wpelakpmgca
Ian Wilshaw
Partner Greater Vancouver Area Market Leader
Private Equity
T 604-691-3557
E idwilshawkpmgca
The information contained herein is of a general nature and is not intended to address the circumstances of any particular individual or entity Although we endeavor to
provide accurate and timely information there can be no guarantee that such information is accurate as of the date it is received or that it will continue to be accurate in
the future No one should act on such information without appropriate professional advice after a thorough examination of the particular situation
kpmgcatmt
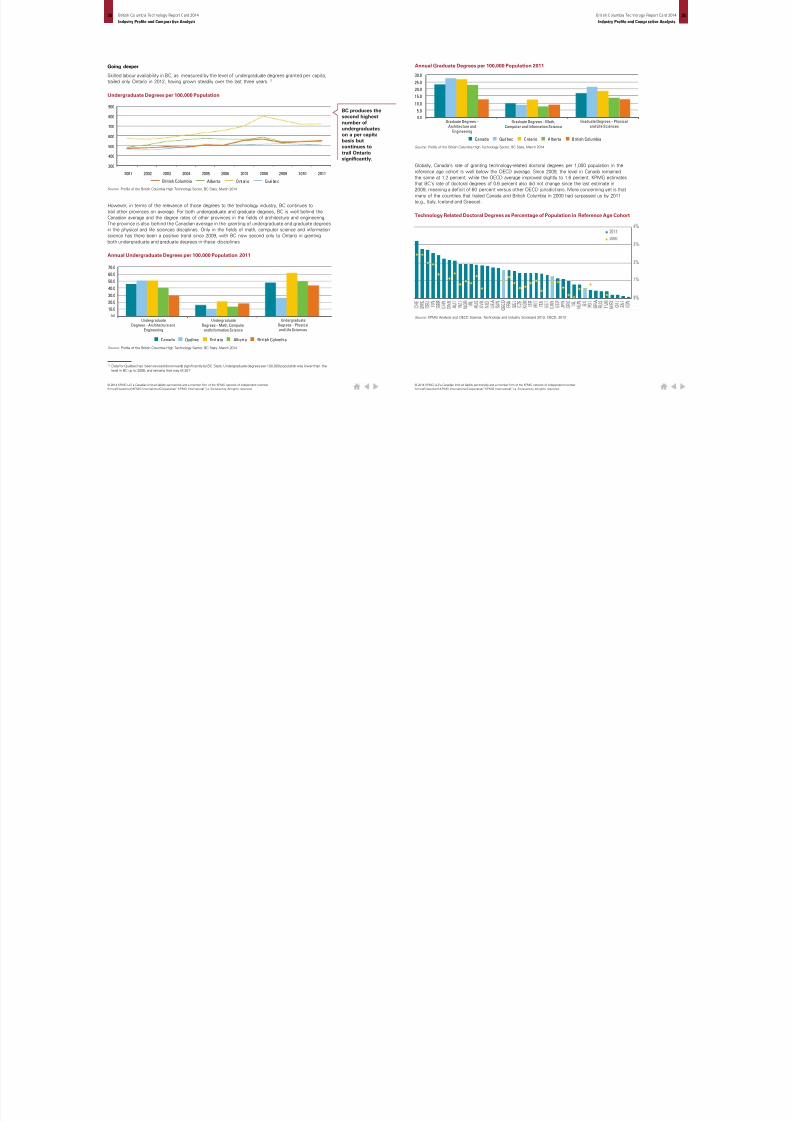
8102019 BC Technology Report Card 2014 Edition
httpslidepdfcomreaderfullbc-technology-report-card-2014-edition 1927
oing deeper
illed labour availability in BC as measured by the level of undergraduate degrees granted per capita
iled only Ontario in 2012 having grown steadily over the last three years13
Data for Queacutebec has been revised downwards significantly by BC Stats Undergraduate degrees per 100000 population was lower than the
evel in BC up to 2008 and remains that way till 2011
urce Profile of the British Columbia High Technology Sector BC Stats March 2014
0
0
0
0
0
0
0
20022001 2003 2004 2005 2006 2007 2008 2009 2010 2011
O ntar io Q ueacute be cBritish Columbia Alberta
ndergraduate Degrees per 100000 Population
nnual Undergraduate Degrees per 100000 Population 2011
owever in terms of the relevance of those degrees to the technology industry BC continues to
il other provinces on average For both undergraduate and graduate degrees BC is well behind the
nadian average and the degree rates of other provinces in the fields of architecture and engineering
e province is also behind the Canadian average in the granting of undergraduate and graduate degrees
the physical and life sciences disciplines Only in the fields of math computer science and information
ence has there been a positive trend since 2009 with BC now second only to Ontario in granting
th undergraduate and graduate degrees in these disciplines
Queacutebec Ont ario Alberta Brit ish ColumbiaCanada
0
0
0
0
0
0
0
0Undergraduate
Degrees ndash Architecture and
Engineering
Undergraduate
Degrees ndash Physical
and Life Sciences
Undergraduate
Degrees ndash Math Computer
and Information Science
BC produces thesecond highest
number ofundergraduateson a per capitabasis butcontinues to
trail Ontariosignificantly
Globally Canadarsquos rate of granting technology-related doctoral degrees per 1000 population in the
reference age cohort is well below the OECD average Since 2009 the level in Canada remained
the same at 12 percent while the OECD average improved slightly to 16 percent KPMG estimates
that BCrsquos rate of doctoral degrees of 06 percent also did not change since the last estimate in
2009 meaning a deficit of 60 percent versus other OECD jurisdictions More concerning yet is that
many of the countries that trailed Canada and British Columbia in 2000 had surpassed us by 2011
(eg Italy Iceland and Greece)
Source Profile of the British Columbia High Technology Sector BC Stats March 2014
Source KPMG Analysis and OECD Science Technology and Industry Scorecard 2013 OECD 2013
urce Profile of the British Columbia High Technology Sector BC Stats March 2014
Technology Related Doctoral Degrees as Percentage of Population in Reference Age Cohort
Annual Graduate Degrees per 100000 Population 2011
Queacutebec Ontario Alberta British ColumbiaCanada
300
250
200
150
100
50
00Graduate Degrees ndash
Architecture andEngineering
Graduate Degrees ndash Physicaland Life Sciences
Graduate Degrees ndash MathComputer and Information Science
014 KPMG LLP a Canadian limit ed liability par tnership and a member firm of the KPMG network of independent member
s affiliated with KPMG International Cooperative (ldquoKPMG Internationalrdquo) a Swiss entity All rights reserved
copy 2014 KPMG LLP a Canadian limit ed liability par tnership and a member firm of the KPMG network of independent member
firms affiliated with KPMG International Cooperative (ldquoKPMG Internationalrdquo) a Swiss entity All rights reserved
British Columbia Technology Report Card 2014 British Columbia Technology Report Card
Industry Profile and Comparative Analysis Industry Profile and Comparative An
8102019 BC Technology Report Card 2014 Edition
httpslidepdfcomreaderfullbc-technology-report-card-2014-edition 2027
Access to Capital
ccess to risk capital throughout the growth cycle is one of
e most significant determinants of tech sector success
has been empirically established that companies that
ceive risk capital have a significantly higher survival rate
perience stronger revenue employee wage and asset
owth and invest in higher levels of RampD 14
e BC technology industry has had a healthy growth in
gel investment which typically takes the form of seed
pital that helps in the emergence of start-ups However
rly stage venture capital investment ndash a necessary fuel
r growing start-ups into thriving companies ndash is deficient
BC and has been declining in recent years And of the
early stage venture capital that is invested there has
been a decline in the share invested by local funds which
deprives companies not only of adequate risk capital but
also of the guidance and networking opportunities that
are essential in early growth stages At the same time
BC companies attract a significant amount of foreign and
extra-provincial investment at the later stages of growth
Together these findings suggest that small technology firms
in BC are limited in their ability to access timely risk capital
that can propel their growth and firms that successfully
attract foreign venture capital may be at risk of relocating
outside BC
These findings can be explored in detail in the recent study by CVCA and Industry Canada titled ldquoThe Performance of Canadian Firms that
Received Venture Capital Financingrdquo published in June 2013
ccess to Capital
Access to Angel Investment
Summary
Access to Venture Capital
Are at Versus Other Provincial Tech Sectors 2014
Industry leaders almost universally agreed that access
to talent has become the most significant issue facing
their firms They cite a tightening of talent availability
over the past few years growing shortages in certain
key technical areas including software and web
development and a need to expand the available talent
pool in areas such as industrial technologies and sales
and marketing as critical issues
The challenges in talent availability have been exacerbated
by the arrival or impending arrival of several multinational
firms on the BC tech scene With a relatively constrained
talent pool the competition for available resources has
increased and with it compensation levels have risen
Several of the larger US-based multinationals are offering
compensation packages at significant premiums over the
average compensation levels in the BC market leading
to growing talent development attraction and retention
challenges for smaller BC companies In some cases this
has led to BC-based companies establishing or growing
their operations outside of BC where talent is less
expensive and more available
Leaders agreed that long-term industry success will
require an expanded talent pool developed by improving
the quantity and quality (job-readiness) of post-secondary
degree programs as well as by attracting talent from
outside of BC and Canada
The high cost of real estate was cited as a primary
barrier to attracting outside talent particularly where
mid- and senior-level management must be relocated
As a result companies are looking at alternative ways
of addressing relocation costs and at targeting talentmarkets where the cost differential or the expectation
of home ownership are less
Industry Insights on Talent Availability
In recent years the vast majority of venture capital invested in BC was in later stage financing Early
stage venture capital is significantly more limited and has been declining over the last few years
Capital by Stage of Investment
Venture Capital by Stage of Investment
Going deeper
BC has experienced steady growth in the level of angel investments in the province since the mid-2000s
Venture capital investment on the other hand has been more volatile
Source CVCA and BCTIA analysis of Thompson Reuters Data
Source CVCA and BCTIA analysis of Thompson Reuters Data
$0
$100
$200
$300
4
2003
$40
$110
2004
$31
$254
2005
$32
$226
2006
$54
$298
2007
$54
$316
2008
$64
$260
2009
$67
$141
2010
$72
$223
2011
$87
$233
2012
$97
$201
Ve ntur e C ap ital Ang el
$ m i l l i o n
$0
$100
$200
$300
$51
$172
$43
$190
$16
$185
2010 2011 2012
VC Later Stage VC Early Stage
$ m i l l i o n
014 KPMG LLP a Canadian limit ed liability par tnership and a member firm of the KPMG network of independent member
s affiliated with KPMG International Cooperative (ldquoKPMG Internationalrdquo) a Swiss entity All rights reserved
copy 2014 KPMG LLP a Canadian limit ed liability par tnership and a member firm of the KPMG network of independent member
firms affiliated with KPMG International Cooperative (ldquoKPMG Internationalrdquo) a Swiss entity All rights reserved
British Columbia Technology Report Card 2014 British Columbia Technology Report Card
Industry Profile and Comparative Analysis Industry Profile and Comparative An
8102019 BC Technology Report Card 2014 Edition
httpslidepdfcomreaderfullbc-technology-report-card-2014-edition 2127
verall BC placed second to last in the level of total venture capital invested among the 20 North
merican jurisdictions examined This is particularly concerning as the technology industry is inherently
obile and decisions regarding the location of operations can be significantly influenced by structural
ctors such as access to capital rather than the presence of local demand
e decline in locally sourced early stage capital is particularly concerning given its importance At the
me time a significant share of later stage investment originates from foreign sources which presents
potential risk that firms may subsequently relocate outside of BC
urce CVCA and BCTIA analysis of Thompson Reuters Data
urce KPMG Analysis of Thomson Reuters Data
$million
$33
$18
$11
$32
$0
$10
$20
$30
$40
2010 2011 2012
$3
$12
CanadianForeign
arly Stage VC Investment by Source
enture Capital Investments 2012
C a
l i f o r n
i a
M a s s e c
h u s e t t s
N e w
Y o r k
T e x a s
W a s
h i n g t o n
M a r y
l a n
d
U t a
h
O h i o
N e w
J e r s e y
O n t a r i o
V i r g i n i a
Q u e
b e c
B r i t i s
h C o
l u m
b i a
P e n n s y
l v a n
i a
I l l i n o
i s
A r i z o n a
C o
l o r a
d o
G e o r g
i a
M i n n e s o t a
M i c h i g a n
V C P e r
C a p
i t a -
$
$500
$450
$400
$350
$300
$250
$200
$150
$100
$50
$0
$6000
$5000
$4000
$3000
$2000
$1000
$0
VC per capita 2012Venture Capital 2012
Locallysourced earlystage VC
investmenthas beendeclining
Research and Development
RampD expenditure is the long-term investment in an industryrsquos future economic performance It measures
commitment to using innovation and knowledge creation to enhance productivity and improve competitiveness
Over the last few years there has been little increase in overall RampD investment in BC As such it
ranks below Ontario and Queacutebec However the composition of RampD spending has changed over time
with the share of business investment in RampD experiencing a steady decline The fact that the industry
is populated with small firms with fewer than 50 employees can help explain this trend BC is host to
very few large anchor companies that have the revenues and the capital to spend in significant ways
on research for the purposes of enhancing competitiveness
Research and Development
Summary
BERD as a Percentage of GDP
RampD as a Percentage of GDP
Versus other Provincial Tech Sectors 2014
The technology industry leaders interviewed recognized that there is a healthy local angel
network in BC However early stage venture capital financing in BC is seen as either absent
or modest making it difficult for small companies to grow There is a sense that attracting
venture capital from out-of-province is also challenging because physical proximity is an
important investment factor
Overall the opinion was that the limited presence of venture capital in BC leads to an absence
of investment competition which impacts competitive valuation and terms Industry leaders also
noted that local venture capital funds often take a revenue-based valuation approach Paradoxically
this may mean that a company can be valued higher by an angel investor prior to earning any
revenue than by an institutional investor once it starts generating revenue Since angel investors
typically expect high returns on initial investment this may make it difficult for small companies
to raise subsequent rounds of institutional financing often leaving them with prospects of
constrained growth due to limited capitalization or the option of selling early This lack of breadth
in the capital pool can lead to a vicious cycle of limited company growth and depressed valuations
of small companies seeking funding
Industry Insights on Risk Capital Investment
014 KPMG LLP a Canadian limit ed liability par tnership and a member firm of the KPMG network of independent member
s affiliated with KPMG International Cooperative (ldquoKPMG Internationalrdquo) a Swiss entity All rights reserved
copy 2014 KPMG LLP a Canadian limit ed liability par tnership and a member firm of the KPMG network of independent member
firms affiliated with KPMG International Cooperative (ldquoKPMG Internationalrdquo) a Swiss entity All rights reserved
British Columbia Technology Report Card 2014 British Columbia Technology Report Card
Industry Profile and Comparative Analysis Industry Profile and Comparative An
8102019 BC Technology Report Card 2014 Edition
httpslidepdfcomreaderfullbc-technology-report-card-2014-edition 2227
BC total RampD spending as a percent of GDP has remained relatively constant since 2008 Other
ovinces experienced a slight decline in this metric While BC remains higher than Alberta in this
gard it still makes up only 60 percent of the RampD expenditure levels in Ontario and Queacutebec
oing deeper
$3 billion there was no significant increase in the total RampD expenditure in BC since 2008 although
e composition of the spending changed The share of higher education and private non-profit
penditure continued to grow from 39 percent in 2008 to 43 percent in 2010 while that of business
terprise shrank by an equivalent amount to 53 percent in 2010
urce Profile of the British Columbia High Technology Sector BC Stats March 2014
urce Profile of the British Columbia High Technology Sector BC Stats March 2014
0
500
1000
1500
2000
2500
3000
3500
2000 2001 2002 2003 2004 2005 2006 2007 2008 2009 2010
Business Enterprise Higher Education amp Private Non-Profit
F ed er al Go vt P ro vin ci al Go ve rn me nt amp Re se ar ch In st it ut ion s
ampD Expenditures in British Columbia
ampD as a Percent of GDP
000
050
100
150
200
250
300
2007 2008 2009 2010
Ont ar io QueacutebecBritish Columbia Alberta
Overall RampDinvestment in
BC has beenconstant withan increase
in highereducation
spendingequal to thereductionin business
investmentin RampD
BCrsquos levelof RampD as apercentageof GDP has
been constantbut remains40 percent
lower thanOntario and
Queacutebec
Source KPMG Analysis of BC Stats Data and OECD Science Technology and Industry Scorecard 2013 OECD 2013
RampD Expenditure as a Percent of GDP
Since the last report card BC did not improve its global standing in RampD intensity as it continues
to perform 40 percent below the OECD average
I S R
K O R
F I N
J P N
S
W E
C H E
D N K
D E U
U S A
A U T
S V N
I S L
O E C D
E S T
F R A
C H N
B E L
O N
A U S
E
U 2 8
N L D
C Z E
G B R
L U X
C A N
I R L
N O R
P R T
B C
E S P
Z A F
I T A
H
U N
N Z L
R U S
M
E X
T U R
P O L
S V K
C H L
0
1
2
3
4
5
2011 2001
Q C
The BERD (business expenditures on RampD) ratio ndash which reflects the level of industry commitment
within the technology industry ndash has fallen for all provinces since 2008 BC still performs better than
Alberta with its businesses contributing 078 percent of GDP to RampD investment but remains well
below Queacutebec and Ontario which contribute 142 percent and 109 percent respectively
Source Profile of the British Columbia High Technology Sector BC Stats March 2014
Business Expenditure on RampD as a Percent of GDP
0
05
10
15
20
2007 2008 2009 2010
P e r c e n t o f G D P
CanadaOntario QueacutebecBritish Columbia Alberta
BusineRampD apercen
of GDPis 20 plower tCanad
BC fell below averageexpendpercent
014 KPMG LLP a Canadian limit ed liability par tnership and a member firm of the KPMG network of independent member
s affiliated with KPMG International Cooperative (ldquoKPMG Internationalrdquo) a Swiss entity All rights reserved
copy 2014 KPMG LLP a Canadian limit ed liability par tnership and a member firm of the KPMG network of independent member
firms affiliated with KPMG International Cooperative (ldquoKPMG Internationalrdquo) a Swiss entity All rights reserved
British Columbia Technology Report Card 2014 British Columbia Technology Report Card
Industry Profile and Comparative Analysis Industry Profile and Comparative An
8102019 BC Technology Report Card 2014 Edition
httpslidepdfcomreaderfullbc-technology-report-card-2014-edition 2327
0
0
0
0
0
0
0
0
0
I S R K O R F I N J
P N S W E C
H E D N K
D E U
U S A
A U T
S V N I S L
O E C D E
S T F R A
C H N B
E L A U S
E U 2 8 I R L C
Z E G B R
L U X
C A N N
L D N O R B C
H U N E
S P P R T I T A R
U S N Z L
Z A F
T U R
S V K
P O L
M E X
C H L
2011 2001
usiness Expenditure on RampD as a Percent of GDP
Crsquos BERD remained 50 percent below the OECD average and did not experience any change from the
01 level This means between 2001 and 2011 BC was surpassed by countries like China and Australia
their level of BERD investment as a p ercent of GDP
urce KPMG Analysis of BC Stats Data and OECD Science Technology and Industry Scorecard 2011 OECD 2011
BusinessRampD in BCis one-thirdthe level of
leading OECDcountries
Going deeper
Compared to other provinces with significant technology industries BC continues to trail in terms of both
the number of patents filed and the number of patents granted on both an absolute and per capita basis
Intellectual Property
Canadian Patents Filed and Granted
Source Canadian Patent Office
Intellectual Property
Intellectual property is a bellwether of the inventory of assets that can be commercialized to underwrite
future economic performance As measured by the number of patent applications submitted and
granted intellectual property reflects the success of RampD investment in the development of innovative
products provides an indication of the commercial viability of research and provides an indication of the
competitiveness of the technology industry as a whole Consistent with the findings of the 2012 report
card BC still ranks well below all other provinces with significant technology industries in the level of
patents awarded both on a per capita basis and as a percentage of applications filed
Patents Granted
Versus Other Provincial Tech Sectors 2014
Summary
0
500
1000
1500
2000
2500
Patents Filed ndash2011
Patents Filedndash2012
Patents Granted ndash2011
Patents Granted ndash2012
Ontario Queacutebec Alberta British Columbia
copy 2014 KPMG LLP a Canadian limit ed liability par tnership and a member firm of the KPMG network of independent member
firms affiliated with KPMG International Cooperative (ldquoKPMG Internationalrdquo) a Swiss entity All rights reserved
014 KPMG LLP a Canadian limited liabi lity partnership and a member firm of the KPMG network of independent member
s affiliated with KPMG International Cooperative (ldquoKPMG Internationalrdquo) a Swiss entity All rights reserved
British Columbia Technology Report Card 2014 British Columbia Technology Report Card
Industry Profile and Comparative Analysis Industry Profile and Comparative An
8102019 BC Technology Report Card 2014 Edition
httpslidepdfcomreaderfullbc-technology-report-card-2014-edition 2427
ore telling is the fact that BC has had the lowest level of patents awarded as a percent of applications
er the last decade
e prevalence of small firms in the BC technology sector has a direct impact on the capacity of
mpanies to successfully pursue patents Not only do they have limited capacity to invest in RampD to
velop patentable innovations but their capital constraints limit their ability to access the legal and
ministrative expertise needed to execute patent applications
atents Awarded per 100000 Population
atents Granted as a Percent of Patent Applications
urce Profile of the British Columbia High Technology Sector BC Stats March 2014
urce Profile of the British Columbia High Technology Sector BC Stats March 2014
00
00
00
00
00
00
00
00
00
2001 2002 2003 2004 2005 2006 2007 2008 2009 2010 2011
CanadaO ntar io Q ueacute be cBritish Columbia Alberta
2001 2002 2003 2004 2005 2006 2007 2008 2009 2010 2011
CanadaO ntar io Q ueacute be cBritish Columbia Alberta
BCrsquos patentperformancesignificantlytrails otherprovinces
Canada still ranks 18th well behind the worldrsquos leading countries in terms of the number of triadic
patent families per million population ndash a measure of patents taken at three major patent offices in
the world KPMGrsquos estimate for BC places it even further down the list than it was in 200815
Triadic Patent Families per Million Population 2010
Source KPMG Analysis of BC Stats Data and OECD Science Technology and Industry Scorecard 2013 OECD 2013
15 KPMG estimated BCrsquos ranking on the chart by considering the relative proportions of patents awarded in BC versus Canada as a whole on
a per capita basis
0
20
40
60
80
100
1
I D N
I N D
B R A
T U R
R U S
C H L
Z A F
C H N
P O L
S V K
G R C
C Z E
P R T
H U N
E S P
E S T
S V N
W L D
B C
I S L
N Z L
I T A
A U S
I R L
C A N
N O R
G B R
L U X
O E C D
B E L
F R A
K O R
I S R
U S A
A U T
N L D
D N K
F I N D E U
S W E
C H E
J P N
M E X
BCrsquos paperform
is one-the levleadingcountr
014 KPMG LLP a Canadian limit ed liability par tnership and a member firm of the KPMG network of independent member
s affiliated with KPMG International Cooperative (ldquoKPMG Internationalrdquo) a Swiss entity All rights reserved
copy 2014 KPMG LLP a Canadian limited liabi lity partnership and a member firm of the KPMG network of independent member
firms affiliated with KPMG International Cooperative (ldquoKPMG Internationalrdquo) a Swiss entity All rights reserved
British Columbia Technology Report Card 2014 British Columbia Technology Report Card
Industry Profile and Comparative Analysis Industry Profile and Comparative An
8102019 BC Technology Report Card 2014 Edition
httpslidepdfcomreaderfullbc-technology-report-card-2014-edition 2527
he technology industry not only generates GDP employment and income
ithin the technology sectors (referred to as direct impact) it also brings
dditional benefits to the overall BC economy by supporting suppliers to
e industry (indirect impact) and through the re-spending of labour income
arned in technology and supplier industries (induced impact)
ur economic impact analysis indicates that the overall impact of the technology industry on the BConomy is significantly magnified by the indirect and induced impacts We estimate that based on
rrent technology industry revenues of $23 billion the total contribution to the BC economy is
$23 ndash $26 billion in GDP
165000 ndash 188000 jobs created or sustained
$10 ndash $12 billion in total labour income
ese high levels of economic benefits are consistent with an industry that is high value-add employs
ghly skilled workers pays high wages and is well integrated in the economy 16
s noted earlier in the report while the technology industry has made a significant contribution to the
C economy our province still trails other Canadian provinces and US jurisdictions in this respect For
ample the BC technology ind ustry current ly comprises 76 percent of provincial GDP compared to
3 percent contribut ed by the US technology industry to US GDP So what would happen if the BC
chnology industry grew to comprise 103 percent of the provincial economy
ur analysis indicates that growing to 103 percent of the provincial economy would bring an additional
1B in BC technology industry revenues and an associated increase of $91B ndash 102B in total
DP 65K ndash 74K additional jobs created or sustained and a $41B ndash 46B increa se in labour
come These estimates include the combined benefits of the direct indirect and induced impacts
the economy
Economic ImpactAssessment
sti mating the technology industry economic impact is challenging due to the lack of standard technology industry classificati ons and
corresponding technology-specific impact multipliers To estimate the impact KPMG used weighted averages of standard industry sector impact
multipliers based on the definition of sectors comprising the tech industry We have chosen to represent the impacts as ranges using different
sectoral weights The use of ranges reflects the inherent variability in the technology industry caused by the diversity of sectors that it comprises
For example a dollar worth of output in the tech industry will have a different economic impact depending on whether it is generated by the
software publishing sector the telecommunication sector or the motion picture and post-production sector In our analysis of direct impacts we
have used figures reported by BC Stats To estimate the indirect and induced impacts we have used industry-standard multipliers developed by
Statistics Canada
Going deeper
Current BC Technology Industry Economic Impact
Given that the industry generated $23 billion in revenues we estimate that the industry contributed
$23 ndash $26 billion to total GDP created or sustained 165000 ndash 188000 jobs an d delivered $10 ndash $12 billion
to total labour income This impact breaks down in direct indirect and induced impact as follows
Current BC Tech Industry Impact
GDP
JOBS
LABOUR INCOME
$23 Bin Tech Industry
Revenues
Direct Impact Indirect Impact Induced Impact Total Impact
$15B
84K
$6B
$4B ndash 5B
43K ndash 52K
$4B ndash 6B
39K ndash 52K
$2B ndash 3B
$23B ndash 26B
165K ndash 188K
$10B ndash 12B$23B ndash 3B
BC Technology Industry Economic Impact Multipliers
In order to compare the technology industry to other industries as well as forecast the impact of
industry growth we have estimated the technology industry impact per dollar of revenue
We find that for each dollar of technology industry revenue the industry generates $1 ndash $112 in total
GDP and $045 ndash $05 in total labo ur income Further for each million dollars in te chnology industr y
revenue the industry generates or sustains seven to eight jobs in BC This impact breaks down in
direct indirect and induced impact as follows
Economic Impact Multiplier Estimates
GDP ($)
$1in Tech Revenues
For each
$1M in Tech Revenues
For each
Direct Impact Indirect Impact Induced Impact Total Impact
065 016 ndash 022 019 ndash 025 100 ndash 112
JOBS 362 186 ndash 228 168 ndash 226 716 ndash 817
LABOUR INCOME ($) 027 010 ndash 013 008 ndash 011 045 ndash 050
014 KPMG LLP a Canadian limit ed liability par tnership and a member firm of the KPMG network of independent member
s affiliated with KPMG International Cooperative (ldquoKPMG Internationalrdquo) a Swiss entity All rights reserved
copy 2014 KPMG LLP a Canadian limit ed liability par tnership and a member firm of the KPMG network of independent member
firms affiliated with KPMG International Cooperative (ldquoKPMG Internationalrdquo) a Swiss entity All rights reserved
British Columbia Technology Report Card
Economic Impact Assess
8102019 BC Technology Report Card 2014 Edition
httpslidepdfcomreaderfullbc-technology-report-card-2014-edition 2627
GDP
JOBS
LABOUR INCOME
$91 BTech Revenues
Additional
Direct Impact Indirect Impact Induced Impact Total Impact
$59B
33K
$25B
$15B ndash 2B
17K ndash 21K
$09B ndash 12B
$17B ndash 23B
15K ndash 21K
$07B ndash 10B
$91B ndash 102B
65K ndash 74K
$41B ndash 46B
Economic Impact of BC Technology Industry Growth
demonstrate the magnitude of potential economic benefit from growing the BC technology industry
e chose to estimate these benefits in the context of a specific growth figure As shown in the GDP
alysis section of this report BC trails significantly many US states as well as the US average in terms
the share of the technology industry to the economy as a whole We asked the question ndash what
ould be the economic impact if we caught up to the US average
e US technology industr y contributes 103 percen t to the overall US GDP as compared to 76 percent
ntributed by the BC technology industry to the BC economy To reach the current contribution level
the US the BC technology industr y will need to add an additional $6 B in GDP corresponding to an
ditional $9B in technology industry revenues (given current industry multipliers)
ur analysis indicates that growing to 103 percent of the provincial economy would bring an additional1B in BC technology indust ry revenues and an associ ated increase of $91B ndash 102B in total GDP
K ndash 74K additional jobs created or sustained and a $41B ndash 46B increase in labour income This
pact breaks down in direct indirect and induced impact as follows
conomic Impact of Growing the BC Technology Industry Contribution to Match the US
While this report card clearly demonstrates the tech
industryrsquos importance to BCrsquos economy itrsquos the possibilities
revealed that most command our attention And itrsquos in our
flaws that our future lies Despite the industryrsquos provincial
strength we trail our Canadian peers on a number of
metrics such as the availability of local venture capital
building field-specific talent pools and increasing firm size
But though these challenges are significant identifying
them ndash knowing what we have to do and where to apply our
resources investments and commitments ndash provides a clear
roadmap for improvement and sustainable success
Wersquore in a very good place The potential for BC tech to become
a major national and global player is right in front of us Indeed
a number of technology companies are already flourishing in
BC with significant operations owned or being built by
bull Canadarsquos largest defense company MDA
bull Canadarsquos largest cleantech company Westport
bull Worldrsquos largest machine-to-machine wireless company
Sierra Wireless
bull Canadarsquos largest social media management company
Hootsuite
bull The first commercial quantum computing company Dwave
bull And global leaders like Amazon Best Buy Boeing
Electronic Arts Microsoft IBM McKesson Sams
Schneider Electri c Sony Imageworks and SAP
As these and other companies have realized BC is o
the most vibrant start-up ecosystems anywhere in th
one that regularly translates great ideas creative tale
audacious vision into some of the hottest tech compaaround Itrsquos a dynamic environment teeming with bra
entrepreneurs who thrive on their peersrsquo global aspira
With this core of industry infrastructure top talent an
innovative thinking in place BC is well positioned to
the tech industryrsquos many emerging and evolving opp
Every powder keg however needs a fuse BC is a te
hot spot but we have to keep stoking the fires of in
ambition and talent to ensure the positive gains mad
2012 become major leaps the next time we take stoc
means we have to work together ndash emerging tech st
ups and major corporate players industry investors a
trend-setters policy makers and academic leaders al
we continue to improve in the key areas identified in
report we can keep building the momentum BC tech
to realize its provincial successes and gains on the n
and global scales
ConclusionTaking the next step together
AcknowledgementsKPMG would like to gratefully acknowledge the support of BC Stats in the development of this report
Our detailed statistical analysis would not have been possible without the rich collection of BC industry
data provided to us by BC Stats
014 KPMG LLP a Canadian limit ed liability par tnership and a member firm of the KPMG network of independent member
s affiliated with KPMG International Cooperative (ldquoKPMG Internationalrdquo) a Swiss entity All rights reserved
copy 2014 KPMG LLP a Canadian limit ed liability par tnership and a member firm of the KPMG network of independent member
firms affiliated with KPMG International Cooperative (ldquoKPMG Internationalrdquo) a Swiss entity All rights reserved
British Columbia Technology Report Card 2014 British Columbia Technology Report Card
Economic Impact Assessment Concl
8102019 BC Technology Report Card 2014 Edition
httpslidepdfcomreaderfullbc-technology-report-card-2014-edition 2727
KPMG in Canada provides Audit Tax and Advisory services We work closely with our clients
helping them to mitigate risks and grasp opportunities
KPMG in Canada is committed to our clients We have made considerable investments in regards to
personnel research and hard-won experience Through these investments we strive to be the best
in everything we do turning our experience and industry knowledge into real value for our clients
This is the KPMG Way
Contact us
For more information please contact your KPMG adviser or one of the following professionals
Anthony Lindsay
Partner Greater Vancouver Area Market Leader
Technology Media and Telecommunications
T 604-646-6379
E tdlindsaykpmgca
Slavi Diamandiev
Greater Vancouver Area
Economics Practice Leader
Management Consulting
T 604-673-4458
E sdiamandievkpmgca
Ed Zacharuk
Partner Greater Vancouver Area SRampED
Practice Leader
T 604-691-3201
E ezacharukkpmgca
Sukesh Kumar
Partner National Leader India Desk
T 604-527-3468
E skumarkpmgca
Walter Pela
Partner in Charge of Tax Services
Greater Vancouver Area
T 604-691-3193
E wpelakpmgca
Ian Wilshaw
Partner Greater Vancouver Area Market Leader
Private Equity
T 604-691-3557
E idwilshawkpmgca
The information contained herein is of a general nature and is not intended to address the circumstances of any particular individual or entity Although we endeavor to
provide accurate and timely information there can be no guarantee that such information is accurate as of the date it is received or that it will continue to be accurate in
the future No one should act on such information without appropriate professional advice after a thorough examination of the particular situation
kpmgcatmt
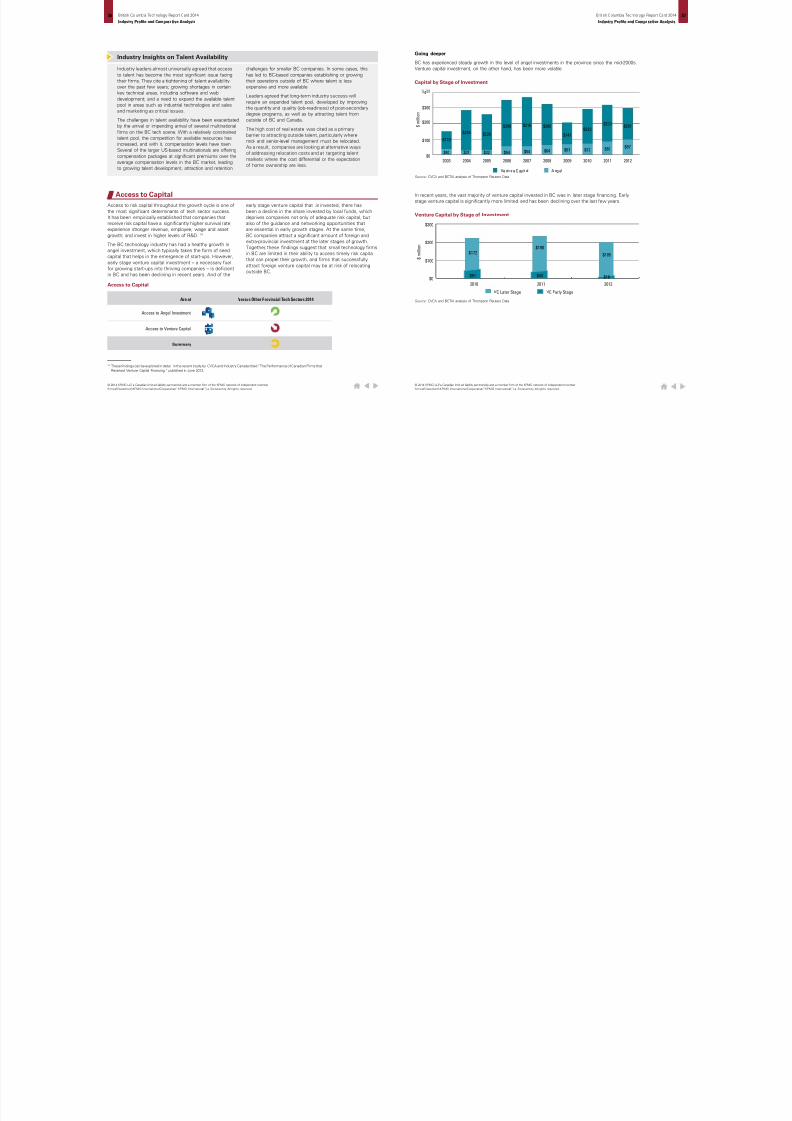
8102019 BC Technology Report Card 2014 Edition
httpslidepdfcomreaderfullbc-technology-report-card-2014-edition 2027
Access to Capital
ccess to risk capital throughout the growth cycle is one of
e most significant determinants of tech sector success
has been empirically established that companies that
ceive risk capital have a significantly higher survival rate
perience stronger revenue employee wage and asset
owth and invest in higher levels of RampD 14
e BC technology industry has had a healthy growth in
gel investment which typically takes the form of seed
pital that helps in the emergence of start-ups However
rly stage venture capital investment ndash a necessary fuel
r growing start-ups into thriving companies ndash is deficient
BC and has been declining in recent years And of the
early stage venture capital that is invested there has
been a decline in the share invested by local funds which
deprives companies not only of adequate risk capital but
also of the guidance and networking opportunities that
are essential in early growth stages At the same time
BC companies attract a significant amount of foreign and
extra-provincial investment at the later stages of growth
Together these findings suggest that small technology firms
in BC are limited in their ability to access timely risk capital
that can propel their growth and firms that successfully
attract foreign venture capital may be at risk of relocating
outside BC
These findings can be explored in detail in the recent study by CVCA and Industry Canada titled ldquoThe Performance of Canadian Firms that
Received Venture Capital Financingrdquo published in June 2013
ccess to Capital
Access to Angel Investment
Summary
Access to Venture Capital
Are at Versus Other Provincial Tech Sectors 2014
Industry leaders almost universally agreed that access
to talent has become the most significant issue facing
their firms They cite a tightening of talent availability
over the past few years growing shortages in certain
key technical areas including software and web
development and a need to expand the available talent
pool in areas such as industrial technologies and sales
and marketing as critical issues
The challenges in talent availability have been exacerbated
by the arrival or impending arrival of several multinational
firms on the BC tech scene With a relatively constrained
talent pool the competition for available resources has
increased and with it compensation levels have risen
Several of the larger US-based multinationals are offering
compensation packages at significant premiums over the
average compensation levels in the BC market leading
to growing talent development attraction and retention
challenges for smaller BC companies In some cases this
has led to BC-based companies establishing or growing
their operations outside of BC where talent is less
expensive and more available
Leaders agreed that long-term industry success will
require an expanded talent pool developed by improving
the quantity and quality (job-readiness) of post-secondary
degree programs as well as by attracting talent from
outside of BC and Canada
The high cost of real estate was cited as a primary
barrier to attracting outside talent particularly where
mid- and senior-level management must be relocated
As a result companies are looking at alternative ways
of addressing relocation costs and at targeting talentmarkets where the cost differential or the expectation
of home ownership are less
Industry Insights on Talent Availability
In recent years the vast majority of venture capital invested in BC was in later stage financing Early
stage venture capital is significantly more limited and has been declining over the last few years
Capital by Stage of Investment
Venture Capital by Stage of Investment
Going deeper
BC has experienced steady growth in the level of angel investments in the province since the mid-2000s
Venture capital investment on the other hand has been more volatile
Source CVCA and BCTIA analysis of Thompson Reuters Data
Source CVCA and BCTIA analysis of Thompson Reuters Data
$0
$100
$200
$300
4
2003
$40
$110
2004
$31
$254
2005
$32
$226
2006
$54
$298
2007
$54
$316
2008
$64
$260
2009
$67
$141
2010
$72
$223
2011
$87
$233
2012
$97
$201
Ve ntur e C ap ital Ang el
$ m i l l i o n
$0
$100
$200
$300
$51
$172
$43
$190
$16
$185
2010 2011 2012
VC Later Stage VC Early Stage
$ m i l l i o n
014 KPMG LLP a Canadian limit ed liability par tnership and a member firm of the KPMG network of independent member
s affiliated with KPMG International Cooperative (ldquoKPMG Internationalrdquo) a Swiss entity All rights reserved
copy 2014 KPMG LLP a Canadian limit ed liability par tnership and a member firm of the KPMG network of independent member
firms affiliated with KPMG International Cooperative (ldquoKPMG Internationalrdquo) a Swiss entity All rights reserved
British Columbia Technology Report Card 2014 British Columbia Technology Report Card
Industry Profile and Comparative Analysis Industry Profile and Comparative An
8102019 BC Technology Report Card 2014 Edition
httpslidepdfcomreaderfullbc-technology-report-card-2014-edition 2127
verall BC placed second to last in the level of total venture capital invested among the 20 North
merican jurisdictions examined This is particularly concerning as the technology industry is inherently
obile and decisions regarding the location of operations can be significantly influenced by structural
ctors such as access to capital rather than the presence of local demand
e decline in locally sourced early stage capital is particularly concerning given its importance At the
me time a significant share of later stage investment originates from foreign sources which presents
potential risk that firms may subsequently relocate outside of BC
urce CVCA and BCTIA analysis of Thompson Reuters Data
urce KPMG Analysis of Thomson Reuters Data
$million
$33
$18
$11
$32
$0
$10
$20
$30
$40
2010 2011 2012
$3
$12
CanadianForeign
arly Stage VC Investment by Source
enture Capital Investments 2012
C a
l i f o r n
i a
M a s s e c
h u s e t t s
N e w
Y o r k
T e x a s
W a s
h i n g t o n
M a r y
l a n
d
U t a
h
O h i o
N e w
J e r s e y
O n t a r i o
V i r g i n i a
Q u e
b e c
B r i t i s
h C o
l u m
b i a
P e n n s y
l v a n
i a
I l l i n o
i s
A r i z o n a
C o
l o r a
d o
G e o r g
i a
M i n n e s o t a
M i c h i g a n
V C P e r
C a p
i t a -
$
$500
$450
$400
$350
$300
$250
$200
$150
$100
$50
$0
$6000
$5000
$4000
$3000
$2000
$1000
$0
VC per capita 2012Venture Capital 2012
Locallysourced earlystage VC
investmenthas beendeclining
Research and Development
RampD expenditure is the long-term investment in an industryrsquos future economic performance It measures
commitment to using innovation and knowledge creation to enhance productivity and improve competitiveness
Over the last few years there has been little increase in overall RampD investment in BC As such it
ranks below Ontario and Queacutebec However the composition of RampD spending has changed over time
with the share of business investment in RampD experiencing a steady decline The fact that the industry
is populated with small firms with fewer than 50 employees can help explain this trend BC is host to
very few large anchor companies that have the revenues and the capital to spend in significant ways
on research for the purposes of enhancing competitiveness
Research and Development
Summary
BERD as a Percentage of GDP
RampD as a Percentage of GDP
Versus other Provincial Tech Sectors 2014
The technology industry leaders interviewed recognized that there is a healthy local angel
network in BC However early stage venture capital financing in BC is seen as either absent
or modest making it difficult for small companies to grow There is a sense that attracting
venture capital from out-of-province is also challenging because physical proximity is an
important investment factor
Overall the opinion was that the limited presence of venture capital in BC leads to an absence
of investment competition which impacts competitive valuation and terms Industry leaders also
noted that local venture capital funds often take a revenue-based valuation approach Paradoxically
this may mean that a company can be valued higher by an angel investor prior to earning any
revenue than by an institutional investor once it starts generating revenue Since angel investors
typically expect high returns on initial investment this may make it difficult for small companies
to raise subsequent rounds of institutional financing often leaving them with prospects of
constrained growth due to limited capitalization or the option of selling early This lack of breadth
in the capital pool can lead to a vicious cycle of limited company growth and depressed valuations
of small companies seeking funding
Industry Insights on Risk Capital Investment
014 KPMG LLP a Canadian limit ed liability par tnership and a member firm of the KPMG network of independent member
s affiliated with KPMG International Cooperative (ldquoKPMG Internationalrdquo) a Swiss entity All rights reserved
copy 2014 KPMG LLP a Canadian limit ed liability par tnership and a member firm of the KPMG network of independent member
firms affiliated with KPMG International Cooperative (ldquoKPMG Internationalrdquo) a Swiss entity All rights reserved
British Columbia Technology Report Card 2014 British Columbia Technology Report Card
Industry Profile and Comparative Analysis Industry Profile and Comparative An
8102019 BC Technology Report Card 2014 Edition
httpslidepdfcomreaderfullbc-technology-report-card-2014-edition 2227
BC total RampD spending as a percent of GDP has remained relatively constant since 2008 Other
ovinces experienced a slight decline in this metric While BC remains higher than Alberta in this
gard it still makes up only 60 percent of the RampD expenditure levels in Ontario and Queacutebec
oing deeper
$3 billion there was no significant increase in the total RampD expenditure in BC since 2008 although
e composition of the spending changed The share of higher education and private non-profit
penditure continued to grow from 39 percent in 2008 to 43 percent in 2010 while that of business
terprise shrank by an equivalent amount to 53 percent in 2010
urce Profile of the British Columbia High Technology Sector BC Stats March 2014
urce Profile of the British Columbia High Technology Sector BC Stats March 2014
0
500
1000
1500
2000
2500
3000
3500
2000 2001 2002 2003 2004 2005 2006 2007 2008 2009 2010
Business Enterprise Higher Education amp Private Non-Profit
F ed er al Go vt P ro vin ci al Go ve rn me nt amp Re se ar ch In st it ut ion s
ampD Expenditures in British Columbia
ampD as a Percent of GDP
000
050
100
150
200
250
300
2007 2008 2009 2010
Ont ar io QueacutebecBritish Columbia Alberta
Overall RampDinvestment in
BC has beenconstant withan increase
in highereducation
spendingequal to thereductionin business
investmentin RampD
BCrsquos levelof RampD as apercentageof GDP has
been constantbut remains40 percent
lower thanOntario and
Queacutebec
Source KPMG Analysis of BC Stats Data and OECD Science Technology and Industry Scorecard 2013 OECD 2013
RampD Expenditure as a Percent of GDP
Since the last report card BC did not improve its global standing in RampD intensity as it continues
to perform 40 percent below the OECD average
I S R
K O R
F I N
J P N
S
W E
C H E
D N K
D E U
U S A
A U T
S V N
I S L
O E C D
E S T
F R A
C H N
B E L
O N
A U S
E
U 2 8
N L D
C Z E
G B R
L U X
C A N
I R L
N O R
P R T
B C
E S P
Z A F
I T A
H
U N
N Z L
R U S
M
E X
T U R
P O L
S V K
C H L
0
1
2
3
4
5
2011 2001
Q C
The BERD (business expenditures on RampD) ratio ndash which reflects the level of industry commitment
within the technology industry ndash has fallen for all provinces since 2008 BC still performs better than
Alberta with its businesses contributing 078 percent of GDP to RampD investment but remains well
below Queacutebec and Ontario which contribute 142 percent and 109 percent respectively
Source Profile of the British Columbia High Technology Sector BC Stats March 2014
Business Expenditure on RampD as a Percent of GDP
0
05
10
15
20
2007 2008 2009 2010
P e r c e n t o f G D P
CanadaOntario QueacutebecBritish Columbia Alberta
BusineRampD apercen
of GDPis 20 plower tCanad
BC fell below averageexpendpercent
014 KPMG LLP a Canadian limit ed liability par tnership and a member firm of the KPMG network of independent member
s affiliated with KPMG International Cooperative (ldquoKPMG Internationalrdquo) a Swiss entity All rights reserved
copy 2014 KPMG LLP a Canadian limit ed liability par tnership and a member firm of the KPMG network of independent member
firms affiliated with KPMG International Cooperative (ldquoKPMG Internationalrdquo) a Swiss entity All rights reserved
British Columbia Technology Report Card 2014 British Columbia Technology Report Card
Industry Profile and Comparative Analysis Industry Profile and Comparative An
8102019 BC Technology Report Card 2014 Edition
httpslidepdfcomreaderfullbc-technology-report-card-2014-edition 2327
0
0
0
0
0
0
0
0
0
I S R K O R F I N J
P N S W E C
H E D N K
D E U
U S A
A U T
S V N I S L
O E C D E
S T F R A
C H N B
E L A U S
E U 2 8 I R L C
Z E G B R
L U X
C A N N
L D N O R B C
H U N E
S P P R T I T A R
U S N Z L
Z A F
T U R
S V K
P O L
M E X
C H L
2011 2001
usiness Expenditure on RampD as a Percent of GDP
Crsquos BERD remained 50 percent below the OECD average and did not experience any change from the
01 level This means between 2001 and 2011 BC was surpassed by countries like China and Australia
their level of BERD investment as a p ercent of GDP
urce KPMG Analysis of BC Stats Data and OECD Science Technology and Industry Scorecard 2011 OECD 2011
BusinessRampD in BCis one-thirdthe level of
leading OECDcountries
Going deeper
Compared to other provinces with significant technology industries BC continues to trail in terms of both
the number of patents filed and the number of patents granted on both an absolute and per capita basis
Intellectual Property
Canadian Patents Filed and Granted
Source Canadian Patent Office
Intellectual Property
Intellectual property is a bellwether of the inventory of assets that can be commercialized to underwrite
future economic performance As measured by the number of patent applications submitted and
granted intellectual property reflects the success of RampD investment in the development of innovative
products provides an indication of the commercial viability of research and provides an indication of the
competitiveness of the technology industry as a whole Consistent with the findings of the 2012 report
card BC still ranks well below all other provinces with significant technology industries in the level of
patents awarded both on a per capita basis and as a percentage of applications filed
Patents Granted
Versus Other Provincial Tech Sectors 2014
Summary
0
500
1000
1500
2000
2500
Patents Filed ndash2011
Patents Filedndash2012
Patents Granted ndash2011
Patents Granted ndash2012
Ontario Queacutebec Alberta British Columbia
copy 2014 KPMG LLP a Canadian limit ed liability par tnership and a member firm of the KPMG network of independent member
firms affiliated with KPMG International Cooperative (ldquoKPMG Internationalrdquo) a Swiss entity All rights reserved
014 KPMG LLP a Canadian limited liabi lity partnership and a member firm of the KPMG network of independent member
s affiliated with KPMG International Cooperative (ldquoKPMG Internationalrdquo) a Swiss entity All rights reserved
British Columbia Technology Report Card 2014 British Columbia Technology Report Card
Industry Profile and Comparative Analysis Industry Profile and Comparative An
8102019 BC Technology Report Card 2014 Edition
httpslidepdfcomreaderfullbc-technology-report-card-2014-edition 2427
ore telling is the fact that BC has had the lowest level of patents awarded as a percent of applications
er the last decade
e prevalence of small firms in the BC technology sector has a direct impact on the capacity of
mpanies to successfully pursue patents Not only do they have limited capacity to invest in RampD to
velop patentable innovations but their capital constraints limit their ability to access the legal and
ministrative expertise needed to execute patent applications
atents Awarded per 100000 Population
atents Granted as a Percent of Patent Applications
urce Profile of the British Columbia High Technology Sector BC Stats March 2014
urce Profile of the British Columbia High Technology Sector BC Stats March 2014
00
00
00
00
00
00
00
00
00
2001 2002 2003 2004 2005 2006 2007 2008 2009 2010 2011
CanadaO ntar io Q ueacute be cBritish Columbia Alberta
2001 2002 2003 2004 2005 2006 2007 2008 2009 2010 2011
CanadaO ntar io Q ueacute be cBritish Columbia Alberta
BCrsquos patentperformancesignificantlytrails otherprovinces
Canada still ranks 18th well behind the worldrsquos leading countries in terms of the number of triadic
patent families per million population ndash a measure of patents taken at three major patent offices in
the world KPMGrsquos estimate for BC places it even further down the list than it was in 200815
Triadic Patent Families per Million Population 2010
Source KPMG Analysis of BC Stats Data and OECD Science Technology and Industry Scorecard 2013 OECD 2013
15 KPMG estimated BCrsquos ranking on the chart by considering the relative proportions of patents awarded in BC versus Canada as a whole on
a per capita basis
0
20
40
60
80
100
1
I D N
I N D
B R A
T U R
R U S
C H L
Z A F
C H N
P O L
S V K
G R C
C Z E
P R T
H U N
E S P
E S T
S V N
W L D
B C
I S L
N Z L
I T A
A U S
I R L
C A N
N O R
G B R
L U X
O E C D
B E L
F R A
K O R
I S R
U S A
A U T
N L D
D N K
F I N D E U
S W E
C H E
J P N
M E X
BCrsquos paperform
is one-the levleadingcountr
014 KPMG LLP a Canadian limit ed liability par tnership and a member firm of the KPMG network of independent member
s affiliated with KPMG International Cooperative (ldquoKPMG Internationalrdquo) a Swiss entity All rights reserved
copy 2014 KPMG LLP a Canadian limited liabi lity partnership and a member firm of the KPMG network of independent member
firms affiliated with KPMG International Cooperative (ldquoKPMG Internationalrdquo) a Swiss entity All rights reserved
British Columbia Technology Report Card 2014 British Columbia Technology Report Card
Industry Profile and Comparative Analysis Industry Profile and Comparative An
8102019 BC Technology Report Card 2014 Edition
httpslidepdfcomreaderfullbc-technology-report-card-2014-edition 2527
he technology industry not only generates GDP employment and income
ithin the technology sectors (referred to as direct impact) it also brings
dditional benefits to the overall BC economy by supporting suppliers to
e industry (indirect impact) and through the re-spending of labour income
arned in technology and supplier industries (induced impact)
ur economic impact analysis indicates that the overall impact of the technology industry on the BConomy is significantly magnified by the indirect and induced impacts We estimate that based on
rrent technology industry revenues of $23 billion the total contribution to the BC economy is
$23 ndash $26 billion in GDP
165000 ndash 188000 jobs created or sustained
$10 ndash $12 billion in total labour income
ese high levels of economic benefits are consistent with an industry that is high value-add employs
ghly skilled workers pays high wages and is well integrated in the economy 16
s noted earlier in the report while the technology industry has made a significant contribution to the
C economy our province still trails other Canadian provinces and US jurisdictions in this respect For
ample the BC technology ind ustry current ly comprises 76 percent of provincial GDP compared to
3 percent contribut ed by the US technology industry to US GDP So what would happen if the BC
chnology industry grew to comprise 103 percent of the provincial economy
ur analysis indicates that growing to 103 percent of the provincial economy would bring an additional
1B in BC technology industry revenues and an associated increase of $91B ndash 102B in total
DP 65K ndash 74K additional jobs created or sustained and a $41B ndash 46B increa se in labour
come These estimates include the combined benefits of the direct indirect and induced impacts
the economy
Economic ImpactAssessment
sti mating the technology industry economic impact is challenging due to the lack of standard technology industry classificati ons and
corresponding technology-specific impact multipliers To estimate the impact KPMG used weighted averages of standard industry sector impact
multipliers based on the definition of sectors comprising the tech industry We have chosen to represent the impacts as ranges using different
sectoral weights The use of ranges reflects the inherent variability in the technology industry caused by the diversity of sectors that it comprises
For example a dollar worth of output in the tech industry will have a different economic impact depending on whether it is generated by the
software publishing sector the telecommunication sector or the motion picture and post-production sector In our analysis of direct impacts we
have used figures reported by BC Stats To estimate the indirect and induced impacts we have used industry-standard multipliers developed by
Statistics Canada
Going deeper
Current BC Technology Industry Economic Impact
Given that the industry generated $23 billion in revenues we estimate that the industry contributed
$23 ndash $26 billion to total GDP created or sustained 165000 ndash 188000 jobs an d delivered $10 ndash $12 billion
to total labour income This impact breaks down in direct indirect and induced impact as follows
Current BC Tech Industry Impact
GDP
JOBS
LABOUR INCOME
$23 Bin Tech Industry
Revenues
Direct Impact Indirect Impact Induced Impact Total Impact
$15B
84K
$6B
$4B ndash 5B
43K ndash 52K
$4B ndash 6B
39K ndash 52K
$2B ndash 3B
$23B ndash 26B
165K ndash 188K
$10B ndash 12B$23B ndash 3B
BC Technology Industry Economic Impact Multipliers
In order to compare the technology industry to other industries as well as forecast the impact of
industry growth we have estimated the technology industry impact per dollar of revenue
We find that for each dollar of technology industry revenue the industry generates $1 ndash $112 in total
GDP and $045 ndash $05 in total labo ur income Further for each million dollars in te chnology industr y
revenue the industry generates or sustains seven to eight jobs in BC This impact breaks down in
direct indirect and induced impact as follows
Economic Impact Multiplier Estimates
GDP ($)
$1in Tech Revenues
For each
$1M in Tech Revenues
For each
Direct Impact Indirect Impact Induced Impact Total Impact
065 016 ndash 022 019 ndash 025 100 ndash 112
JOBS 362 186 ndash 228 168 ndash 226 716 ndash 817
LABOUR INCOME ($) 027 010 ndash 013 008 ndash 011 045 ndash 050
014 KPMG LLP a Canadian limit ed liability par tnership and a member firm of the KPMG network of independent member
s affiliated with KPMG International Cooperative (ldquoKPMG Internationalrdquo) a Swiss entity All rights reserved
copy 2014 KPMG LLP a Canadian limit ed liability par tnership and a member firm of the KPMG network of independent member
firms affiliated with KPMG International Cooperative (ldquoKPMG Internationalrdquo) a Swiss entity All rights reserved
British Columbia Technology Report Card
Economic Impact Assess
8102019 BC Technology Report Card 2014 Edition
httpslidepdfcomreaderfullbc-technology-report-card-2014-edition 2627
GDP
JOBS
LABOUR INCOME
$91 BTech Revenues
Additional
Direct Impact Indirect Impact Induced Impact Total Impact
$59B
33K
$25B
$15B ndash 2B
17K ndash 21K
$09B ndash 12B
$17B ndash 23B
15K ndash 21K
$07B ndash 10B
$91B ndash 102B
65K ndash 74K
$41B ndash 46B
Economic Impact of BC Technology Industry Growth
demonstrate the magnitude of potential economic benefit from growing the BC technology industry
e chose to estimate these benefits in the context of a specific growth figure As shown in the GDP
alysis section of this report BC trails significantly many US states as well as the US average in terms
the share of the technology industry to the economy as a whole We asked the question ndash what
ould be the economic impact if we caught up to the US average
e US technology industr y contributes 103 percen t to the overall US GDP as compared to 76 percent
ntributed by the BC technology industry to the BC economy To reach the current contribution level
the US the BC technology industr y will need to add an additional $6 B in GDP corresponding to an
ditional $9B in technology industry revenues (given current industry multipliers)
ur analysis indicates that growing to 103 percent of the provincial economy would bring an additional1B in BC technology indust ry revenues and an associ ated increase of $91B ndash 102B in total GDP
K ndash 74K additional jobs created or sustained and a $41B ndash 46B increase in labour income This
pact breaks down in direct indirect and induced impact as follows
conomic Impact of Growing the BC Technology Industry Contribution to Match the US
While this report card clearly demonstrates the tech
industryrsquos importance to BCrsquos economy itrsquos the possibilities
revealed that most command our attention And itrsquos in our
flaws that our future lies Despite the industryrsquos provincial
strength we trail our Canadian peers on a number of
metrics such as the availability of local venture capital
building field-specific talent pools and increasing firm size
But though these challenges are significant identifying
them ndash knowing what we have to do and where to apply our
resources investments and commitments ndash provides a clear
roadmap for improvement and sustainable success
Wersquore in a very good place The potential for BC tech to become
a major national and global player is right in front of us Indeed
a number of technology companies are already flourishing in
BC with significant operations owned or being built by
bull Canadarsquos largest defense company MDA
bull Canadarsquos largest cleantech company Westport
bull Worldrsquos largest machine-to-machine wireless company
Sierra Wireless
bull Canadarsquos largest social media management company
Hootsuite
bull The first commercial quantum computing company Dwave
bull And global leaders like Amazon Best Buy Boeing
Electronic Arts Microsoft IBM McKesson Sams
Schneider Electri c Sony Imageworks and SAP
As these and other companies have realized BC is o
the most vibrant start-up ecosystems anywhere in th
one that regularly translates great ideas creative tale
audacious vision into some of the hottest tech compaaround Itrsquos a dynamic environment teeming with bra
entrepreneurs who thrive on their peersrsquo global aspira
With this core of industry infrastructure top talent an
innovative thinking in place BC is well positioned to
the tech industryrsquos many emerging and evolving opp
Every powder keg however needs a fuse BC is a te
hot spot but we have to keep stoking the fires of in
ambition and talent to ensure the positive gains mad
2012 become major leaps the next time we take stoc
means we have to work together ndash emerging tech st
ups and major corporate players industry investors a
trend-setters policy makers and academic leaders al
we continue to improve in the key areas identified in
report we can keep building the momentum BC tech
to realize its provincial successes and gains on the n
and global scales
ConclusionTaking the next step together
AcknowledgementsKPMG would like to gratefully acknowledge the support of BC Stats in the development of this report
Our detailed statistical analysis would not have been possible without the rich collection of BC industry
data provided to us by BC Stats
014 KPMG LLP a Canadian limit ed liability par tnership and a member firm of the KPMG network of independent member
s affiliated with KPMG International Cooperative (ldquoKPMG Internationalrdquo) a Swiss entity All rights reserved
copy 2014 KPMG LLP a Canadian limit ed liability par tnership and a member firm of the KPMG network of independent member
firms affiliated with KPMG International Cooperative (ldquoKPMG Internationalrdquo) a Swiss entity All rights reserved
British Columbia Technology Report Card 2014 British Columbia Technology Report Card
Economic Impact Assessment Concl
8102019 BC Technology Report Card 2014 Edition
httpslidepdfcomreaderfullbc-technology-report-card-2014-edition 2727
KPMG in Canada provides Audit Tax and Advisory services We work closely with our clients
helping them to mitigate risks and grasp opportunities
KPMG in Canada is committed to our clients We have made considerable investments in regards to
personnel research and hard-won experience Through these investments we strive to be the best
in everything we do turning our experience and industry knowledge into real value for our clients
This is the KPMG Way
Contact us
For more information please contact your KPMG adviser or one of the following professionals
Anthony Lindsay
Partner Greater Vancouver Area Market Leader
Technology Media and Telecommunications
T 604-646-6379
E tdlindsaykpmgca
Slavi Diamandiev
Greater Vancouver Area
Economics Practice Leader
Management Consulting
T 604-673-4458
E sdiamandievkpmgca
Ed Zacharuk
Partner Greater Vancouver Area SRampED
Practice Leader
T 604-691-3201
E ezacharukkpmgca
Sukesh Kumar
Partner National Leader India Desk
T 604-527-3468
E skumarkpmgca
Walter Pela
Partner in Charge of Tax Services
Greater Vancouver Area
T 604-691-3193
E wpelakpmgca
Ian Wilshaw
Partner Greater Vancouver Area Market Leader
Private Equity
T 604-691-3557
E idwilshawkpmgca
The information contained herein is of a general nature and is not intended to address the circumstances of any particular individual or entity Although we endeavor to
provide accurate and timely information there can be no guarantee that such information is accurate as of the date it is received or that it will continue to be accurate in
the future No one should act on such information without appropriate professional advice after a thorough examination of the particular situation
kpmgcatmt
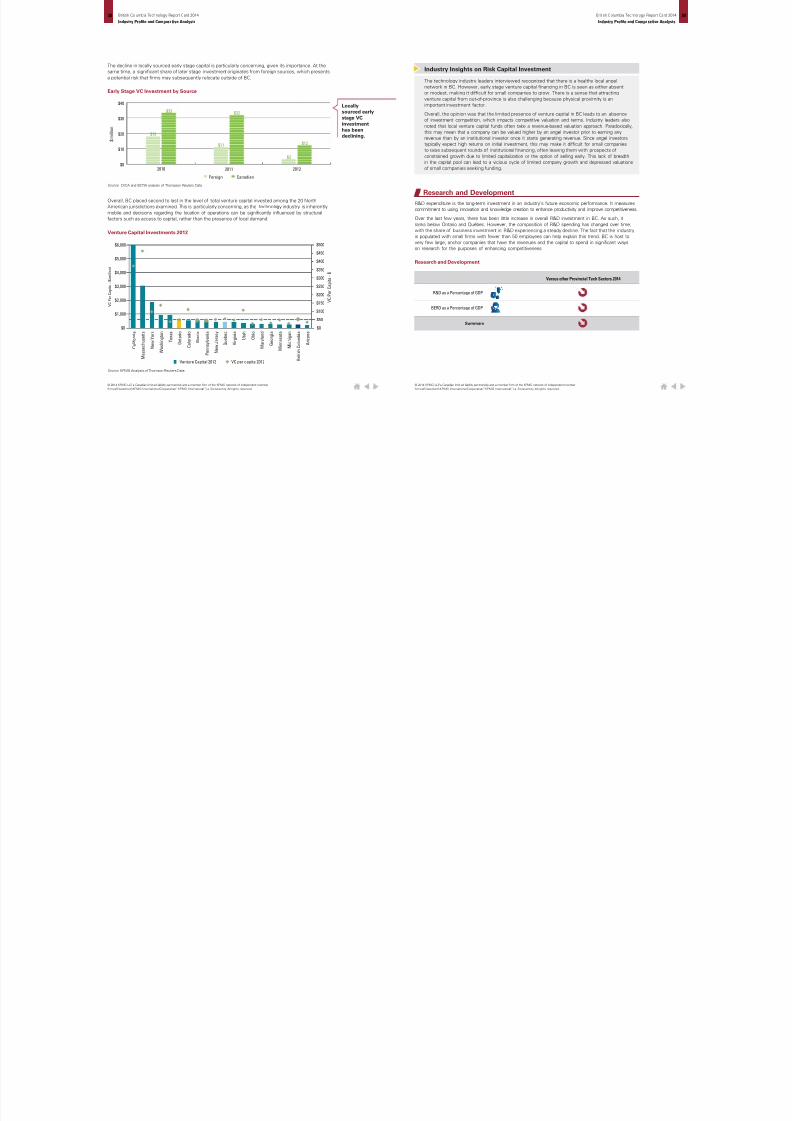
8102019 BC Technology Report Card 2014 Edition
httpslidepdfcomreaderfullbc-technology-report-card-2014-edition 2327
0
0
0
0
0
0
0
0
0
I S R K O R F I N J
P N S W E C
H E D N K
D E U
U S A
A U T
S V N I S L
O E C D E
S T F R A
C H N B
E L A U S
E U 2 8 I R L C
Z E G B R
L U X
C A N N
L D N O R B C
H U N E
S P P R T I T A R
U S N Z L
Z A F
T U R
S V K
P O L
M E X
C H L
2011 2001
usiness Expenditure on RampD as a Percent of GDP
Crsquos BERD remained 50 percent below the OECD average and did not experience any change from the
01 level This means between 2001 and 2011 BC was surpassed by countries like China and Australia
their level of BERD investment as a p ercent of GDP
urce KPMG Analysis of BC Stats Data and OECD Science Technology and Industry Scorecard 2011 OECD 2011
BusinessRampD in BCis one-thirdthe level of
leading OECDcountries
Going deeper
Compared to other provinces with significant technology industries BC continues to trail in terms of both
the number of patents filed and the number of patents granted on both an absolute and per capita basis
Intellectual Property
Canadian Patents Filed and Granted
Source Canadian Patent Office
Intellectual Property
Intellectual property is a bellwether of the inventory of assets that can be commercialized to underwrite
future economic performance As measured by the number of patent applications submitted and
granted intellectual property reflects the success of RampD investment in the development of innovative
products provides an indication of the commercial viability of research and provides an indication of the
competitiveness of the technology industry as a whole Consistent with the findings of the 2012 report
card BC still ranks well below all other provinces with significant technology industries in the level of
patents awarded both on a per capita basis and as a percentage of applications filed
Patents Granted
Versus Other Provincial Tech Sectors 2014
Summary
0
500
1000
1500
2000
2500
Patents Filed ndash2011
Patents Filedndash2012
Patents Granted ndash2011
Patents Granted ndash2012
Ontario Queacutebec Alberta British Columbia
copy 2014 KPMG LLP a Canadian limit ed liability par tnership and a member firm of the KPMG network of independent member
firms affiliated with KPMG International Cooperative (ldquoKPMG Internationalrdquo) a Swiss entity All rights reserved
014 KPMG LLP a Canadian limited liabi lity partnership and a member firm of the KPMG network of independent member
s affiliated with KPMG International Cooperative (ldquoKPMG Internationalrdquo) a Swiss entity All rights reserved
British Columbia Technology Report Card 2014 British Columbia Technology Report Card
Industry Profile and Comparative Analysis Industry Profile and Comparative An
8102019 BC Technology Report Card 2014 Edition
httpslidepdfcomreaderfullbc-technology-report-card-2014-edition 2427
ore telling is the fact that BC has had the lowest level of patents awarded as a percent of applications
er the last decade
e prevalence of small firms in the BC technology sector has a direct impact on the capacity of
mpanies to successfully pursue patents Not only do they have limited capacity to invest in RampD to
velop patentable innovations but their capital constraints limit their ability to access the legal and
ministrative expertise needed to execute patent applications
atents Awarded per 100000 Population
atents Granted as a Percent of Patent Applications
urce Profile of the British Columbia High Technology Sector BC Stats March 2014
urce Profile of the British Columbia High Technology Sector BC Stats March 2014
00
00
00
00
00
00
00
00
00
2001 2002 2003 2004 2005 2006 2007 2008 2009 2010 2011
CanadaO ntar io Q ueacute be cBritish Columbia Alberta
2001 2002 2003 2004 2005 2006 2007 2008 2009 2010 2011
CanadaO ntar io Q ueacute be cBritish Columbia Alberta
BCrsquos patentperformancesignificantlytrails otherprovinces
Canada still ranks 18th well behind the worldrsquos leading countries in terms of the number of triadic
patent families per million population ndash a measure of patents taken at three major patent offices in
the world KPMGrsquos estimate for BC places it even further down the list than it was in 200815
Triadic Patent Families per Million Population 2010
Source KPMG Analysis of BC Stats Data and OECD Science Technology and Industry Scorecard 2013 OECD 2013
15 KPMG estimated BCrsquos ranking on the chart by considering the relative proportions of patents awarded in BC versus Canada as a whole on
a per capita basis
0
20
40
60
80
100
1
I D N
I N D
B R A
T U R
R U S
C H L
Z A F
C H N
P O L
S V K
G R C
C Z E
P R T
H U N
E S P
E S T
S V N
W L D
B C
I S L
N Z L
I T A
A U S
I R L
C A N
N O R
G B R
L U X
O E C D
B E L
F R A
K O R
I S R
U S A
A U T
N L D
D N K
F I N D E U
S W E
C H E
J P N
M E X
BCrsquos paperform
is one-the levleadingcountr
014 KPMG LLP a Canadian limit ed liability par tnership and a member firm of the KPMG network of independent member
s affiliated with KPMG International Cooperative (ldquoKPMG Internationalrdquo) a Swiss entity All rights reserved
copy 2014 KPMG LLP a Canadian limited liabi lity partnership and a member firm of the KPMG network of independent member
firms affiliated with KPMG International Cooperative (ldquoKPMG Internationalrdquo) a Swiss entity All rights reserved
British Columbia Technology Report Card 2014 British Columbia Technology Report Card
Industry Profile and Comparative Analysis Industry Profile and Comparative An
8102019 BC Technology Report Card 2014 Edition
httpslidepdfcomreaderfullbc-technology-report-card-2014-edition 2527
he technology industry not only generates GDP employment and income
ithin the technology sectors (referred to as direct impact) it also brings
dditional benefits to the overall BC economy by supporting suppliers to
e industry (indirect impact) and through the re-spending of labour income
arned in technology and supplier industries (induced impact)
ur economic impact analysis indicates that the overall impact of the technology industry on the BConomy is significantly magnified by the indirect and induced impacts We estimate that based on
rrent technology industry revenues of $23 billion the total contribution to the BC economy is
$23 ndash $26 billion in GDP
165000 ndash 188000 jobs created or sustained
$10 ndash $12 billion in total labour income
ese high levels of economic benefits are consistent with an industry that is high value-add employs
ghly skilled workers pays high wages and is well integrated in the economy 16
s noted earlier in the report while the technology industry has made a significant contribution to the
C economy our province still trails other Canadian provinces and US jurisdictions in this respect For
ample the BC technology ind ustry current ly comprises 76 percent of provincial GDP compared to
3 percent contribut ed by the US technology industry to US GDP So what would happen if the BC
chnology industry grew to comprise 103 percent of the provincial economy
ur analysis indicates that growing to 103 percent of the provincial economy would bring an additional
1B in BC technology industry revenues and an associated increase of $91B ndash 102B in total
DP 65K ndash 74K additional jobs created or sustained and a $41B ndash 46B increa se in labour
come These estimates include the combined benefits of the direct indirect and induced impacts
the economy
Economic ImpactAssessment
sti mating the technology industry economic impact is challenging due to the lack of standard technology industry classificati ons and
corresponding technology-specific impact multipliers To estimate the impact KPMG used weighted averages of standard industry sector impact
multipliers based on the definition of sectors comprising the tech industry We have chosen to represent the impacts as ranges using different
sectoral weights The use of ranges reflects the inherent variability in the technology industry caused by the diversity of sectors that it comprises
For example a dollar worth of output in the tech industry will have a different economic impact depending on whether it is generated by the
software publishing sector the telecommunication sector or the motion picture and post-production sector In our analysis of direct impacts we
have used figures reported by BC Stats To estimate the indirect and induced impacts we have used industry-standard multipliers developed by
Statistics Canada
Going deeper
Current BC Technology Industry Economic Impact
Given that the industry generated $23 billion in revenues we estimate that the industry contributed
$23 ndash $26 billion to total GDP created or sustained 165000 ndash 188000 jobs an d delivered $10 ndash $12 billion
to total labour income This impact breaks down in direct indirect and induced impact as follows
Current BC Tech Industry Impact
GDP
JOBS
LABOUR INCOME
$23 Bin Tech Industry
Revenues
Direct Impact Indirect Impact Induced Impact Total Impact
$15B
84K
$6B
$4B ndash 5B
43K ndash 52K
$4B ndash 6B
39K ndash 52K
$2B ndash 3B
$23B ndash 26B
165K ndash 188K
$10B ndash 12B$23B ndash 3B
BC Technology Industry Economic Impact Multipliers
In order to compare the technology industry to other industries as well as forecast the impact of
industry growth we have estimated the technology industry impact per dollar of revenue
We find that for each dollar of technology industry revenue the industry generates $1 ndash $112 in total
GDP and $045 ndash $05 in total labo ur income Further for each million dollars in te chnology industr y
revenue the industry generates or sustains seven to eight jobs in BC This impact breaks down in
direct indirect and induced impact as follows
Economic Impact Multiplier Estimates
GDP ($)
$1in Tech Revenues
For each
$1M in Tech Revenues
For each
Direct Impact Indirect Impact Induced Impact Total Impact
065 016 ndash 022 019 ndash 025 100 ndash 112
JOBS 362 186 ndash 228 168 ndash 226 716 ndash 817
LABOUR INCOME ($) 027 010 ndash 013 008 ndash 011 045 ndash 050
014 KPMG LLP a Canadian limit ed liability par tnership and a member firm of the KPMG network of independent member
s affiliated with KPMG International Cooperative (ldquoKPMG Internationalrdquo) a Swiss entity All rights reserved
copy 2014 KPMG LLP a Canadian limit ed liability par tnership and a member firm of the KPMG network of independent member
firms affiliated with KPMG International Cooperative (ldquoKPMG Internationalrdquo) a Swiss entity All rights reserved
British Columbia Technology Report Card
Economic Impact Assess
8102019 BC Technology Report Card 2014 Edition
httpslidepdfcomreaderfullbc-technology-report-card-2014-edition 2627
GDP
JOBS
LABOUR INCOME
$91 BTech Revenues
Additional
Direct Impact Indirect Impact Induced Impact Total Impact
$59B
33K
$25B
$15B ndash 2B
17K ndash 21K
$09B ndash 12B
$17B ndash 23B
15K ndash 21K
$07B ndash 10B
$91B ndash 102B
65K ndash 74K
$41B ndash 46B
Economic Impact of BC Technology Industry Growth
demonstrate the magnitude of potential economic benefit from growing the BC technology industry
e chose to estimate these benefits in the context of a specific growth figure As shown in the GDP
alysis section of this report BC trails significantly many US states as well as the US average in terms
the share of the technology industry to the economy as a whole We asked the question ndash what
ould be the economic impact if we caught up to the US average
e US technology industr y contributes 103 percen t to the overall US GDP as compared to 76 percent
ntributed by the BC technology industry to the BC economy To reach the current contribution level
the US the BC technology industr y will need to add an additional $6 B in GDP corresponding to an
ditional $9B in technology industry revenues (given current industry multipliers)
ur analysis indicates that growing to 103 percent of the provincial economy would bring an additional1B in BC technology indust ry revenues and an associ ated increase of $91B ndash 102B in total GDP
K ndash 74K additional jobs created or sustained and a $41B ndash 46B increase in labour income This
pact breaks down in direct indirect and induced impact as follows
conomic Impact of Growing the BC Technology Industry Contribution to Match the US
While this report card clearly demonstrates the tech
industryrsquos importance to BCrsquos economy itrsquos the possibilities
revealed that most command our attention And itrsquos in our
flaws that our future lies Despite the industryrsquos provincial
strength we trail our Canadian peers on a number of
metrics such as the availability of local venture capital
building field-specific talent pools and increasing firm size
But though these challenges are significant identifying
them ndash knowing what we have to do and where to apply our
resources investments and commitments ndash provides a clear
roadmap for improvement and sustainable success
Wersquore in a very good place The potential for BC tech to become
a major national and global player is right in front of us Indeed
a number of technology companies are already flourishing in
BC with significant operations owned or being built by
bull Canadarsquos largest defense company MDA
bull Canadarsquos largest cleantech company Westport
bull Worldrsquos largest machine-to-machine wireless company
Sierra Wireless
bull Canadarsquos largest social media management company
Hootsuite
bull The first commercial quantum computing company Dwave
bull And global leaders like Amazon Best Buy Boeing
Electronic Arts Microsoft IBM McKesson Sams
Schneider Electri c Sony Imageworks and SAP
As these and other companies have realized BC is o
the most vibrant start-up ecosystems anywhere in th
one that regularly translates great ideas creative tale
audacious vision into some of the hottest tech compaaround Itrsquos a dynamic environment teeming with bra
entrepreneurs who thrive on their peersrsquo global aspira
With this core of industry infrastructure top talent an
innovative thinking in place BC is well positioned to
the tech industryrsquos many emerging and evolving opp
Every powder keg however needs a fuse BC is a te
hot spot but we have to keep stoking the fires of in
ambition and talent to ensure the positive gains mad
2012 become major leaps the next time we take stoc
means we have to work together ndash emerging tech st
ups and major corporate players industry investors a
trend-setters policy makers and academic leaders al
we continue to improve in the key areas identified in
report we can keep building the momentum BC tech
to realize its provincial successes and gains on the n
and global scales
ConclusionTaking the next step together
AcknowledgementsKPMG would like to gratefully acknowledge the support of BC Stats in the development of this report
Our detailed statistical analysis would not have been possible without the rich collection of BC industry
data provided to us by BC Stats
014 KPMG LLP a Canadian limit ed liability par tnership and a member firm of the KPMG network of independent member
s affiliated with KPMG International Cooperative (ldquoKPMG Internationalrdquo) a Swiss entity All rights reserved
copy 2014 KPMG LLP a Canadian limit ed liability par tnership and a member firm of the KPMG network of independent member
firms affiliated with KPMG International Cooperative (ldquoKPMG Internationalrdquo) a Swiss entity All rights reserved
British Columbia Technology Report Card 2014 British Columbia Technology Report Card
Economic Impact Assessment Concl
8102019 BC Technology Report Card 2014 Edition
httpslidepdfcomreaderfullbc-technology-report-card-2014-edition 2727
KPMG in Canada provides Audit Tax and Advisory services We work closely with our clients
helping them to mitigate risks and grasp opportunities
KPMG in Canada is committed to our clients We have made considerable investments in regards to
personnel research and hard-won experience Through these investments we strive to be the best
in everything we do turning our experience and industry knowledge into real value for our clients
This is the KPMG Way
Contact us
For more information please contact your KPMG adviser or one of the following professionals
Anthony Lindsay
Partner Greater Vancouver Area Market Leader
Technology Media and Telecommunications
T 604-646-6379
E tdlindsaykpmgca
Slavi Diamandiev
Greater Vancouver Area
Economics Practice Leader
Management Consulting
T 604-673-4458
E sdiamandievkpmgca
Ed Zacharuk
Partner Greater Vancouver Area SRampED
Practice Leader
T 604-691-3201
E ezacharukkpmgca
Sukesh Kumar
Partner National Leader India Desk
T 604-527-3468
E skumarkpmgca
Walter Pela
Partner in Charge of Tax Services
Greater Vancouver Area
T 604-691-3193
E wpelakpmgca
Ian Wilshaw
Partner Greater Vancouver Area Market Leader
Private Equity
T 604-691-3557
E idwilshawkpmgca
The information contained herein is of a general nature and is not intended to address the circumstances of any particular individual or entity Although we endeavor to
provide accurate and timely information there can be no guarantee that such information is accurate as of the date it is received or that it will continue to be accurate in
the future No one should act on such information without appropriate professional advice after a thorough examination of the particular situation
kpmgcatmt
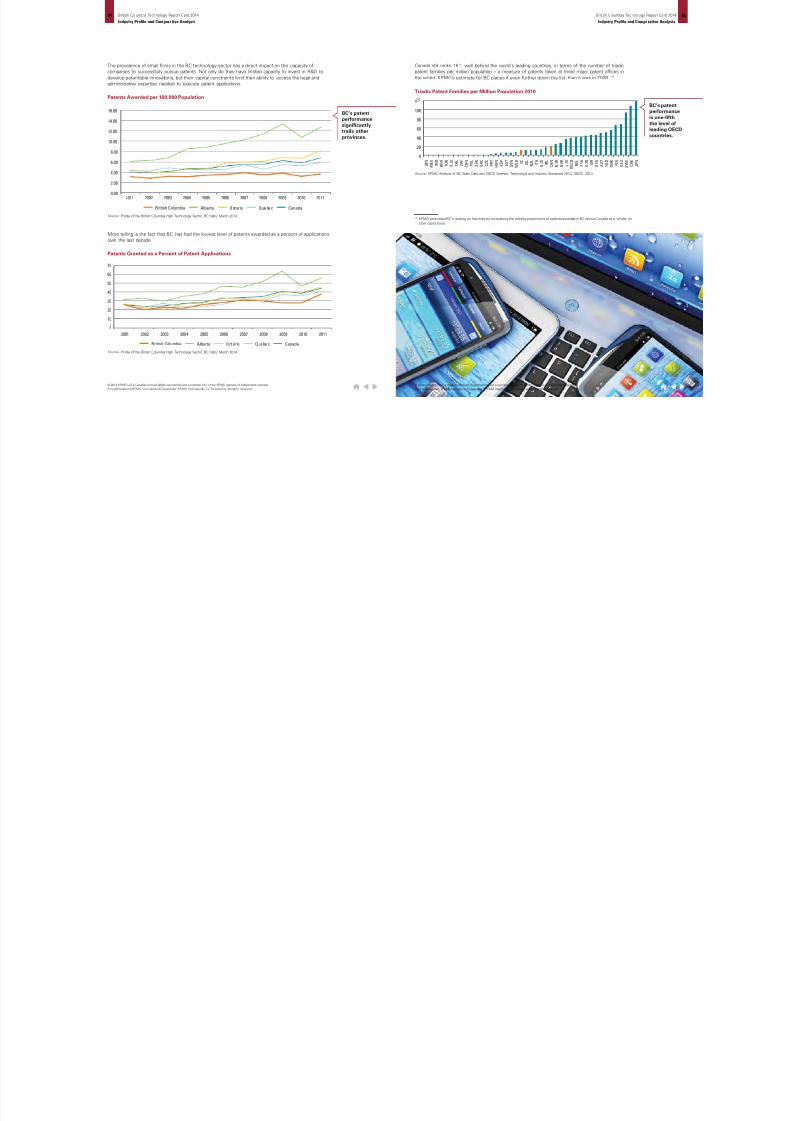
8102019 BC Technology Report Card 2014 Edition
httpslidepdfcomreaderfullbc-technology-report-card-2014-edition 2727
KPMG in Canada provides Audit Tax and Advisory services We work closely with our clients
helping them to mitigate risks and grasp opportunities
KPMG in Canada is committed to our clients We have made considerable investments in regards to
personnel research and hard-won experience Through these investments we strive to be the best
in everything we do turning our experience and industry knowledge into real value for our clients
This is the KPMG Way
Contact us
For more information please contact your KPMG adviser or one of the following professionals
Anthony Lindsay
Partner Greater Vancouver Area Market Leader
Technology Media and Telecommunications
T 604-646-6379
E tdlindsaykpmgca
Slavi Diamandiev
Greater Vancouver Area
Economics Practice Leader
Management Consulting
T 604-673-4458
E sdiamandievkpmgca
Ed Zacharuk
Partner Greater Vancouver Area SRampED
Practice Leader
T 604-691-3201
E ezacharukkpmgca
Sukesh Kumar
Partner National Leader India Desk
T 604-527-3468
E skumarkpmgca
Walter Pela
Partner in Charge of Tax Services
Greater Vancouver Area
T 604-691-3193
E wpelakpmgca
Ian Wilshaw
Partner Greater Vancouver Area Market Leader
Private Equity
T 604-691-3557
E idwilshawkpmgca
The information contained herein is of a general nature and is not intended to address the circumstances of any particular individual or entity Although we endeavor to
provide accurate and timely information there can be no guarantee that such information is accurate as of the date it is received or that it will continue to be accurate in
the future No one should act on such information without appropriate professional advice after a thorough examination of the particular situation
kpmgcatmt