bank of the philippine islands · bank of the philippine islands ... details of income attributable...
TRANSCRIPT

Bank of the Philippine Islands Financial Statements As at December 31, 2015 and 2014
and for each of the three years in the period ended December 31, 2015


BANK OF THE PHILIPPINE ISLANDS NOTES TO FINANCIAL STATEMENTS AS AT DECEMBER 31, 2015 AND 2014 AND FOR EACH OF THE THREE YEARS IN THE PERIOD ENDED DECEMBER 31, 2015 Note 1 - General Information Bank of the Philippine Islands (“BPI” or the “Parent Bank”) is a domestic commercial bank with an expanded banking license and has its registered office address, which is also its principal place of business, at BPI Building, Ayala Avenue corner Paseo de Roxas, Makati City. BPI and its subsidiaries as detailed in Note 32.3 (collectively referred to as the “BPI Group”) offer a whole breadth of financial services that include corporate banking, consumer banking, investment banking, asset management, corporate finance, securities distribution, and insurance services. At December 31, 2015, the BPI Group has 14,647 employees (2014 - 14,542 employees) and operates 823 branches and 2,760 ATMs (2014 - 825 branches and 2,575 ATMs) to support its delivery of services. The BPI Group also serves its customers through alternative electronic banking channels such as telephone, mobile phone and the internet. The Parent Bank was registered with the Securities and Exchange Commission (SEC) on January 4, 1943. This license was extended for another 50 years on January 4, 1993. The Parent Bank is considered a public company under Rule 3.1 of Implementing Rules and Regulations of the Securities Regulation Code, which, among others, defines a public company as any corporation with a class of equity securities listed on an exchange, or with assets of at least P50 million and having 200 or more shareholders, each of which holds at least 100 shares of its equity securities. The BPI shares have been traded in the Philippine Stock Exchange (PSE) since October 12, 1971. As at December 31, 2015, the Parent Bank has 11,754 common shareholders (2014: 11,858). These financial statements have been approved and authorized for issuance by the Board of Directors of the Parent Bank on February 17, 2016. Note 2 - Assets and Liabilities Attributable to Insurance Operations Details of assets and liabilities attributable to insurance operations at December 31 are as follow:
2015 2014
(In Millions of Pesos) Assets Cash and cash equivalents (Note 4) 306 215 Insurance balances receivable, net 4,889 4,810 Investment securities Available-for-sale 4,538 5,390 Held-to-maturity 3,143 3,765 Accounts receivable and other assets, net 3,286 2,121 Land, building and equipment 158 144
16,320 16,445
Liabilities Reserves and other balances 13,457 12,658 Accounts payable, accrued expenses and other payables 1,191 903
14,648 13,561

(2)
Details of income attributable to insurance operations before income tax and minority interest for the years ended December 31 are as follows:
2015 2014 2013
(In Millions of Pesos) Premiums earned and related income 3,071 2,868 3,020 Investment and other income 801 423 457
3,872 3,291 3,477
Benefits, claims and maturities 1,655 1,363 1,133 Decrease in actuarial reserve liabilities (159) (162) (80) Management and general expenses 575 515 452 Commissions 681 554 518 Other expenses 11 14 5
2,763 2,284 2,028
Income before income tax and minority interest 1,109 1,007 1,449
Note 3 - Business Segments Operating segments are reported in accordance with the internal reporting provided to the chief executive officer, who is responsible for allocating resources to the reportable segments and assessing their performance. All operating segments used by the BPI Group meet the definition of a reportable segment under PFRS 8, Operating Segments. The BPI Group has determined the operating segments based on the nature of the services provided and the different markets served representing a strategic business unit. The BPI Group’s main operating business segments follow: Consumer banking - this segment addresses the individual and retail markets. It covers deposit taking and
servicing, consumer lending such as home mortgages, auto loans and credit card finance as well as the remittance business. It includes the entire transaction processing and service delivery infrastructure consisting of the BPI and BPI Family Bank network of branches, ATMs and point-of-sale terminals as well as phone and internet-based banking platforms.
Corporate banking - this segment consists of the entire lending, leasing, trade and cash management services
provided by the BPI Group to corporate and institutional customers. These customers include both high-end corporations as well as various middle market clients.
Investment banking - this segment includes the various business groups operating in the investment markets and dealing in activities other than lending and deposit taking. These services cover corporate finance, securities distribution, asset management, trust and fiduciary services as well as proprietary trading and investment activities.
The performance of the Parent Bank is assessed as a single unit using financial information presented in the separate or Parent only financial statements. Likewise, the chief executive officer assesses the performance of its insurance business as a separate segment from its banking and allied financial undertakings. Information on the assets, liabilities and results of operations of the insurance business is fully disclosed in Note 2. The BPI Group and the Parent Bank mainly derive revenue (more than 90%) within the Philippines, accordingly, no geographical segment is presented. Revenues of the BPI Group’s segment operations are derived from interest (net interest income). The segment report forms part of management’s assessment of the performance of the segment, among other performance indicators.

(3)
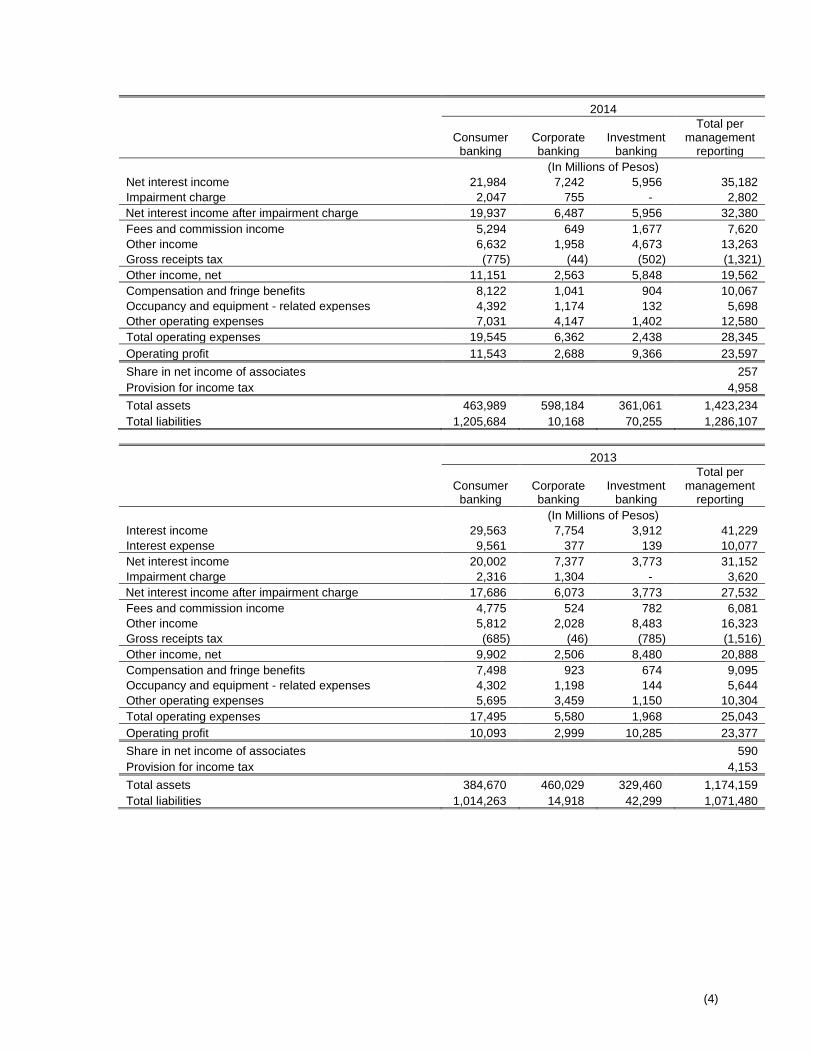
There were no changes in the reportable segments during the year. Transactions between the business segments are carried out at arm’s length. The revenue from external parties reported to management is measured in a manner consistent with that in profit or loss until 2013. Funds are ordinarily allocated between segments, resulting in funding cost transfers disclosed in inter-segment net interest income. Interest charged for these funds is based on the BPI Group’s cost of capital. The funds transfer pricing (FTP) prior to 2014 was computed on a gross basis. In 2014, the manner of reporting has changed, in which interest income and interest expense are no longer presented separately, considering that the calculation of FTP shifted from gross to net. In addition, majority of the segment’s revenues are from interest and the chief executive officer relies primarily on net interest income to assess the performance of the segments and to make decisions concerning the segments. Internal charges and transfer pricing adjustments have been reflected in the performance of each business. Revenue-sharing agreements are used to allocate external customer revenues to a business segment on a reasonable basis. Inter-segment revenues however, are deemed insignificant for financial reporting purposes, thus, not reported in segment analysis below. The BPI Group’s management reporting is based on a measure of operating profit comprising net interest income, impairment charge, fees and commission income, other income and other operating expenses. Segment assets and liabilities comprise majority of operating assets and liabilities, measured in a manner consistent with that shown in the statement of condition, but exclude items such as taxation. The segment assets, liabilities and results of operations of the reportable segments of the BPI Group as at and for the years ended December 31, 2015, 2014 and 2013 are as follows:
2015
Consumer banking
Corporate banking
Investment banking
Total per management
reporting
(In Millions of Pesos)
Net interest income 22,487 5,982 12,091 40,560
Impairment charge 2,552 1,195 72 3,819
Net interest income after impairment charge 19,935 4,787 12,019 36,741
Fees and commission income 6,026 582 1,135 7,743
Other income 6,657 1,616 5,330 13,603
Gross receipts tax (834) (58) (488) (1,380)
Other income, net 11,849 2,140 5,977 19,966
Compensation and fringe benefits 8,733 1,116 905 10,754
Occupancy and equipment - related expenses 4,435 1,170 80 5,685
Other operating expenses 9,826 2,239 1,312 13,377
Total operating expenses 22,994 4,525 2,297 29,816
Operating profit 8,790 2,402 15,699 26,891
Share in net income of associates 627
Provision for income tax 5,138
Total assets 506,593 634,840 348,058 1,489,491
Total liabilities 1,304,298 14,163 23,578 1,342,039
(4)
2014
Consumer
banking Corporate banking
Investment banking
Total per management
reporting
(In Millions of Pesos)
Net interest income 21,984 7,242 5,956 35,182
Impairment charge 2,047 755 - 2,802
Net interest income after impairment charge 19,937 6,487 5,956 32,380
Fees and commission income 5,294 649 1,677 7,620
Other income 6,632 1,958 4,673 13,263
Gross receipts tax (775) (44) (502) (1,321)
Other income, net 11,151 2,563 5,848 19,562
Compensation and fringe benefits 8,122 1,041 904 10,067
Occupancy and equipment - related expenses 4,392 1,174 132 5,698
Other operating expenses 7,031 4,147 1,402 12,580
Total operating expenses 19,545 6,362 2,438 28,345
Operating profit 11,543 2,688 9,366 23,597
Share in net income of associates 257
Provision for income tax 4,958
Total assets 463,989 598,184 361,061 1,423,234
Total liabilities 1,205,684 10,168 70,255 1,286,107
2013
Consumer
banking Corporate banking
Investment banking
Total per management
reporting
(In Millions of Pesos)
Interest income 29,563 7,754 3,912 41,229
Interest expense 9,561 377 139 10,077
Net interest income 20,002 7,377 3,773 31,152
Impairment charge 2,316 1,304 - 3,620
Net interest income after impairment charge 17,686 6,073 3,773 27,532
Fees and commission income 4,775 524 782 6,081
Other income 5,812 2,028 8,483 16,323
Gross receipts tax (685) (46) (785) (1,516)
Other income, net 9,902 2,506 8,480 20,888
Compensation and fringe benefits 7,498 923 674 9,095
Occupancy and equipment - related expenses 4,302 1,198 144 5,644
Other operating expenses 5,695 3,459 1,150 10,304
Total operating expenses 17,495 5,580 1,968 25,043
Operating profit 10,093 2,999 10,285 23,377
Share in net income of associates 590
Provision for income tax 4,153
Total assets 384,670 460,029 329,460 1,174,159
Total liabilities 1,014,263 14,918 42,299 1,071,480
(5)
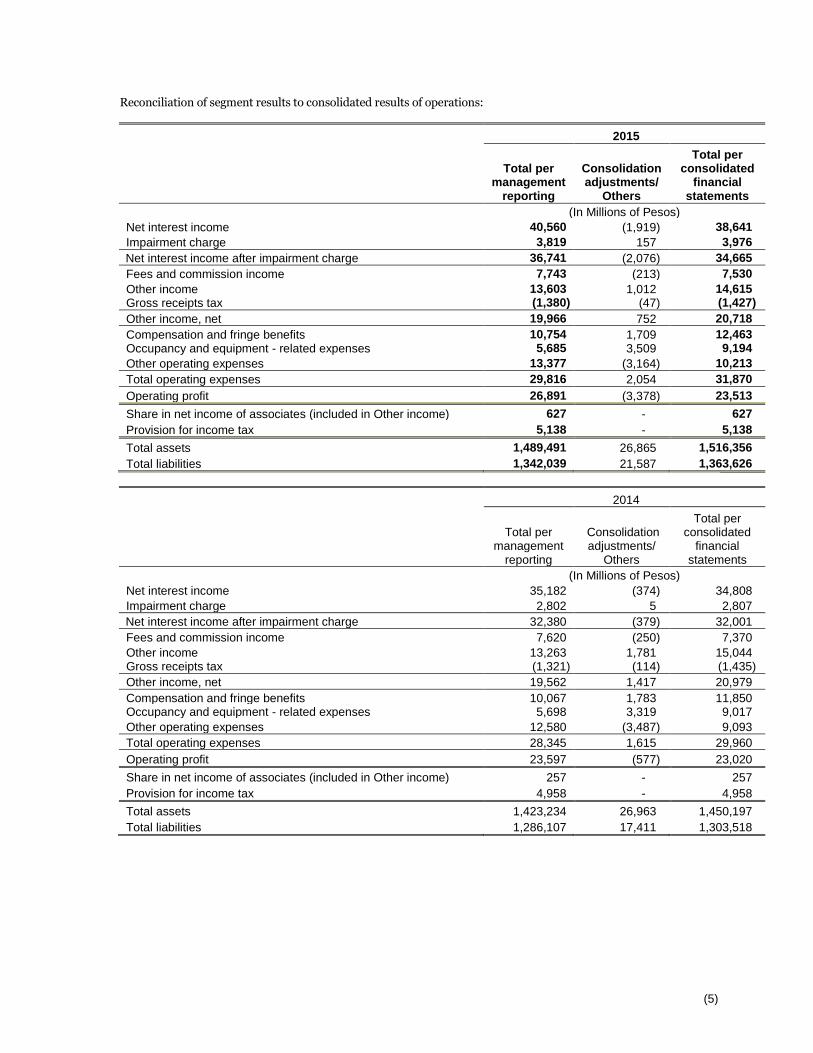
Reconciliation of segment results to consolidated results of operations:
2015
Total per management
reporting
Consolidation adjustments/
Others
Total per consolidated
financial statements
(In Millions of Pesos)
Net interest income 40,560 (1,919) 38,641
Impairment charge 3,819 157 3,976
Net interest income after impairment charge 36,741 (2,076) 34,665
Fees and commission income 7,743 (213) 7,530
Other income 13,603 1,012 14,615
Gross receipts tax (1,380) (47) (1,427)
Other income, net 19,966 752 20,718
Compensation and fringe benefits 10,754 1,709 12,463
Occupancy and equipment - related expenses 5,685 3,509 9,194
Other operating expenses 13,377 (3,164) 10,213
Total operating expenses 29,816 2,054 31,870
Operating profit 26,891 (3,378) 23,513
Share in net income of associates (included in Other income) 627 - 627
Provision for income tax 5,138 - 5,138
Total assets 1,489,491 26,865 1,516,356
Total liabilities 1,342,039 21,587 1,363,626
2014
Total per management
reporting
Consolidation adjustments/
Others
Total per consolidated
financial statements
(In Millions of Pesos)
Net interest income 35,182 (374) 34,808
Impairment charge 2,802 5 2,807
Net interest income after impairment charge 32,380 (379) 32,001
Fees and commission income 7,620 (250) 7,370
Other income 13,263 1,781 15,044 Gross receipts tax (1,321) (114) (1,435)
Other income, net 19,562 1,417 20,979
Compensation and fringe benefits 10,067 1,783 11,850 Occupancy and equipment - related expenses 5,698 3,319 9,017
Other operating expenses 12,580 (3,487) 9,093
Total operating expenses 28,345 1,615 29,960
Operating profit 23,597 (577) 23,020
Share in net income of associates (included in Other income) 257 - 257
Provision for income tax 4,958 - 4,958
Total assets 1,423,234 26,963 1,450,197
Total liabilities 1,286,107 17,411 1,303,518

(6)
2013
Total per management
reporting
Consolidation adjustments/
Others
Total per consolidated
financial statements
(In Millions of Pesos)
Interest income 41,229 (427) 40,802
Interest expense 10,077 401 10,478
Net interest income 31,152 (828) 30,324
Impairment charge 3,620 (972) 2,648
Net interest income after impairment charge 27,532 144 27,676
Fees and commission income 6,081 (196) 5,885
Other income 16,323 1,521 17,844 Gross receipts tax (1,516) (39) (1,555)
Other income, net 20,888 1,286 22,174
Compensation and fringe benefits 9,095 1,546 10,641 Occupancy and equipment - related expenses 5,644 2,396 8,040
Other operating expenses 10,304 (2,282) 8,022
Total operating expenses 25,043 1,660 26,703
Operating profit 23,377 (230) 23,147
Share in net income of associates (included in Other income) 590 - 590
Provision for income tax 4,153 - 4,153
Total assets 1,174,159 21,205 1,195,364
Total liabilities 1,071,480 18,077 1,089,557
“Consolidation adjustments/Others” pertain to balances of insurance operations, support units and inter-segment elimination in accordance with the BPI Group’s internal reporting. Note 4 - Cash and Cash Equivalents The account at December 31 consists of:
Consolidated Parent
2015 2014 2015 2014
(In Millions of Pesos) Cash and other cash items 35,681 38,427 34,797 37,292 Due from BSP 214,960 211,946 174,370 170,648 Due from other banks 22,238 22,227 17,181 15,429 Interbank loans receivable and securities
purchased under agreements to resell (Note 5) 8,566
743 2,033
241 Cash and cash equivalents attributable to
insurance operations (Note 2) 306
215 -
-
281,751 273,558 228,381 223,610
Cash and cash equivalents are classified as current.

(7)
Note 5 - Interbank Loans Receivable and Securities Purchased under Agreements to Resell (SPAR) The account at December 31 consists of transactions with:
Consolidated Parent
2015 2014 2015 2014
(In Millions of Pesos) BSP 6,513 500 - - Other banks 6,365 5,266 6,141 5,231
12,878 5,766 6,141 5,231 Accrued interest receivable 24 16 22 15
12,902 5,782 6,163 5,246
Interbank loans receivable and SPAR maturing within 90 days from the date of acquisition are classified as cash equivalents in the statement of cash flows (Note 4).
Consolidated Parent
2015 2014 2015 2014
(In Millions of Pesos) Current 12,332 2,905 5,767 2,369 Non-current 570 2,877 396 2,877
12,902 5,782 6,163 5,246
Government bonds are pledged by the Bangko Sentral ng Pilipinas (BSP) as collateral under reverse repurchase agreements. The face value of securities pledged is equivalent to the total balance of outstanding placements as at reporting date. All collateral agreements mature within 12 months. The range of average interest rates (%) of interbank loans receivable for the years ended December 31 follows:
Consolidated Parent
2015 2014 2015 2014
Peso-denominated 3.93 - 4.23 3.16 - 3.54 3.91 - 4.22 2.36 - 3.55 US dollar-denominated 1.21 - 2.83 0.07 - 0.13 1.21 - 2.83 0.07 - 0.13
Note 6 - Derivative Financial Instruments Derivatives held by the BPI Group for non-hedging purposes mainly consist of the following: Foreign exchange forwards represent commitments to purchase or sell one currency against another at an
agreed forward rate on a specified date in the future. Settlement can be made via full delivery of forward proceeds or via payment of the difference (non-deliverable forward) between the contracted forward rate and the prevailing market rate on maturity.
Foreign exchange swaps refer to spot purchase or sale of one currency against another with an agreement to
sell or purchase the same currency at an agreed forward rate in the future. Interest rate swaps refer to agreement to exchange fixed rate versus floating interest payments (or vice
versa) on a reference notional amount over an agreed period of time.
Cross currency swaps refer to spot exchange of notional amounts on two currencies at a given exchange rate and with an agreement to re-exchange the same notional amounts at a specified maturity date based on the original exchange rate. Parties on the transaction agree to pay a stated interest rate on the borrowed notional amount and receive a stated interest rate on the lent notional amount, payable or receivable periodically over the term of the transaction.
Credit-Linked Notes (CLNs) are structured notes whose value is derived from the creditworthiness of an
underlying reference entity. A CLN may be viewed as a bundled note that consists of a bond and a credit default swap, allowing the issuer to transfer the credit risk of a reference entity to the investor during the reference period.

(8)
The BPI Group’s credit risk represents the potential cost to replace the swap contracts if counterparties fail to fulfill their obligation. This risk is monitored on an ongoing basis with reference to the current fair value, a proportion of the notional amount of the contracts and the liquidity of the market. To control the level of credit risk taken, the BPI Group assesses counterparties using the same techniques as for its lending activities. The notional amounts of certain types of financial instruments provide a basis for comparison with instruments recognized on the statement of condition. They do not necessarily represent the amounts of future cash flows involved or the current fair values of the instruments and therefore are not indicative of the BPI Group’s exposure to credit or price risks. The derivative instruments become favorable (assets) or unfavorable (liabilities) as a result of fluctuations in market interest rates or foreign exchange rates relative to their terms. The aggregate contractual or notional amount of derivative financial instruments on hand and the extent at which the instruments can become favorable or unfavorable in fair values can fluctuate significantly from time to time. The contract/notional amount and fair values of derivative instruments held as at December 31 are set out below: Consolidated and Parent
Contract/ Fair Values
Notional Amount Assets Liabilities
2015 2014 2015 2014 2015 2014
(In Millions of Pesos) Free-standing derivatives Foreign exchange derivatives
Currency swaps 120,182 122,364 1,377 21,828 (513) (21,359) Currency forwards 266,663 101,657 2,519 1,487 (1,480) (652)
Interest rate swaps 111,796 87,499 564 12,544 (1,211) (12,791) Credit default swaps 1,411 1,342 - 28 (12) (44)
Embedded credit derivatives 3,059 5,009 69 94 - -
Total derivatives assets (liabilities) held for trading 503,111 317,871 4,529 35,981 (3,216) (34,846)
Note 7 - Trading Securities The account at December 31 consists of:
Consolidated Parent
2015 2014 2015 2014
(In Millions of Pesos) Debt securities
Government securities 7,672 14,537 5,425 6,085 Commercial papers of private companies 71 658 - 492
7,743 15,195 5,425 6,577 Accrued interest receivable 19 52 17 43
7,762 15,247 5,442 6,620 Equity securities - listed 322 615 - -
8,084 15,862 5,442 6,620
All trading securities are classified as current.

(9)
Note 8 - Available-for-Sale Securities The account at December 31 consists of:
Consolidated Parent
2015 2014 2015 2014
Debt securities (In Millions of Pesos) Government securities 26,254 28,046 25,072 23,650 Commercial papers of private companies 14,218 18,806 11,212 17,422
40,472 46,852 36,284 41,072 Accrued interest receivable 162 632 126 532
40,634 47,484 36,410 41,604
Equity securities Listed 1,490 2,474 367 355 Unlisted 481 1,663 114 113
1,971 4,137 481 468
42,605 51,621 36,891 42,072 Allowance for impairment (318) (312) (206) (206)
42,287 51,309 36,685 41,866
Consolidated Parent
2015 2014 2015 2014
(In Millions of Pesos) Current 24,039 5,295 23,253 2,992 Non-current 18,566 46,326 13,638 39,080
42,605 51,621 36,891 42,072
The reconciliation of the allowance for impairment at December 31 is summarized as follows:
Consolidated Parent
2015 2014 2015 2014
(In Millions of Pesos) At January 1 312 586 206 213
Provision for (reversal of) impairment losses 6 (274) - (7)
At December 31 318 312 206 206
The range of average interest rates (%) of available-for-sale debt securities for the years ended December 31 follows:
Consolidated Parent
2015 2014 2015 2014
Peso-denominated 2.67 - 3.06 2.84 - 3.18 3.48 - 3.74 3.56 - 3.76 Foreign currency-denominated 1.80 - 2.47 2.39 - 2.71 1.85 - 2.85 2.67 - 2.81
The movement in available-for-sale securities is summarized as follows:
Consolidated Parent
2015 2014 2015 2014
(In Millions of Pesos) At January 1 51,309 87,556 41,866 81,736 Additions 68,847 72,240 58,274 58,135 Disposals (70,322) (43,934) (56,302) (35,889) Reclassification to held-to-maturity securities (6,928) (63,453) (6,928) (61,034) Amortization of discount (premium), net 624 (2,365) 577 (2,252) Fair value adjustments (910) 1,831 (526) 1,525 Exchange differences 131 38 130 26 Net change in allowance for impairment 6 (274) - (7) Net change in accrued interest receivable (470) (330) (406) (374)
At December 31 42,287 51,309 36,685 41,866

(10)
On November 11, 2015, the BPI Group reclassified certain available-for-sale securities aggregating P6.9 billion to held-to-maturity category. The reclassification was triggered by management’s change in intention over the securities in the light of volatile market prices due to rising interest rate environment. Management believes that despite the market uncertainties, the BPI Group has the capability to hold those reclassified securities until maturity dates. The aggregate fair value loss of those securities at reclassification dates that were recognized in Accumulated other comprehensive income (under Capital funds), and which will be amortized over the remaining lives of the instruments using the effective interest rate method amounts to P505 million. Unamortized fair value loss as at December 31, 2015 amounts to P502 million. The net change in fair value reserve that would have been recognized in other comprehensive income if the available-for-sale securities had not been reclassified amounts to P224 million loss for the year ended December 31, 2015. There are no gains or losses recognized in profit or loss or other comprehensive income. On January 9, 2014, the BPI Group reclassified certain available-for-sale securities aggregating P63.5 billion to held-to-maturity category. The reclassification was triggered by management’s change in intention over the securities in the light of volatile market prices due to rising interest rate environment. Management believes that despite the market uncertainties, the BPI Group has the capability to hold those reclassified securities until maturity dates. The aggregate fair value loss of those securities at reclassification dates that were recognized in Accumulated other comprehensive income (under Capital funds), and which will be amortized over the remaining lives of the instruments using the effective interest rate method amounts to P4,534 million. Unamortized fair value loss as at December 31, 2015 amounts to P3,712 million (2014 - P4,201 million). The net change in fair value reserve that would have been recognized in other comprehensive income if the available-for-sale securities had not been reclassified amounts to P1,264 million loss for the year ended December 31, 2015 (2014 - fair value gain of P3,678 million). There are no gains or losses recognized in profit or loss or other comprehensive income. On October 22, 2008, the BPI Group reclassified certain available-for-sale securities aggregating P19.1 billion to held-to-maturity category. Likewise, on November 12, 2008, an additional portfolio of US dollar-denominated available-for-sale securities totaling US$171.6 million (or peso equivalent of P9.2 billion) was further reclassified from available-for-sale to held-to-maturity. The reclassification was triggered by management’s change in intention over the securities in the light of volatile market prices due to global economic downturn. Management believes that despite the market uncertainties, the BPI Group has the capability to hold those reclassified securities until maturity dates. The aggregate fair value loss of those securities at reclassification dates that were recognized in Accumulated other comprehensive income (under Capital funds), and which will be amortized over the remaining lives of the instruments using the effective interest rate method amounts to P1,757 million. Unamortized fair value loss as at December 31, 2015 amounts to P188 million (2014 - P269 million). The net change in fair value reserve that would have been recognized in other comprehensive income if the available-for-sale securities had not been reclassified amounts to P94 million loss for the year ended December 31, 2015 (2014 - P123 million loss). There are no gains or losses recognized in profit or loss or other comprehensive income. Note 9 - Held-to-Maturity Securities The account at December 31 consists of:
Consolidated Parent
2015 2014 2015 2014
(In Millions of Pesos) Government securities 211,152 195,779 193,911 180,547 Commercial papers of private companies 29,924 10,301 27,785 9,428
241,076 206,080 221,696 189,975 Accrued interest receivable 3,733 3,329 3,381 3,026
244,809 209,409 225,077 193,001

(11)
Consolidated Parent
2015 2014 2015 2014
(In Millions of Pesos) Current 23,305 8,625 22,581 7,571 Non-current 221,504 200,784 202,496 185,430
244,809 209,409 225,077 193,001
The range of average interest rates (%) of held-to-maturity securities for the years ended December 31 follows:
Consolidated Parent
2015 2014 2015 2014
Peso-denominated 3.89 - 4.19 4.27 - 4.98 3.86 - 4.16 4.26 - 4.98 Foreign currency-denominated 3.75 - 4.16 4.25 - 4.71 3.86 - 4.26 4.28 - 4.74
The movement in held-to-maturity securities is summarized as follows:
Consolidated Parent
2015 2014 2015 2014
(In Millions of Pesos) At January 1 209,409 96,172 193,001 85,900 Additions 53,347 127,125 46,968 118,981 Maturities (16,551) (13,580) (13,505) (11,843) Amortization of premium, net (1,971) (1,698) (1,893) (1,369) Exchange differences 171 58 151 43 Net change in accrued interest receivable 404 1,332 355 1,289
At December 31 244,809 209,409 225,077 193,001
Note 10 - Loans and Advances
Major classifications of this account at December 31 are as follows:
Consolidated Parent
2015 2014 2015 2014
Corporate entities (In Millions of Pesos) Large corporate customers 607,083 553,493 581,216 532,180 Small and medium enterprise 94,659 94,059 54,148 58,749 Retail customers Credit cards 35,879 31,010 35,313 30,931 Real estate mortgages 99,519 85,602 107 114 Auto loans 45,911 38,296 - - Others 5,473 10,912 3,743 7,585
888,524 813,372 674,527 629,559 Accrued interest receivable 3,278 2,753 2,312 1,973 Unearned discount/income (2,579) (2,249) (1,596) (913)
889,223 813,876 675,243 630,619 Allowance for impairment (16,362) (13,706) (10,624) (9,178)
872,861 800,170 664,619 621,441
The Parent balances above include amounts due from related parties (Note 27). The Consolidated balances above also include amounts due from related parties (Note 27) except for accounts considered as intercompany transactions.
Consolidated Parent
2015 2014 2015 2014
(In Millions of Pesos) Current 390,363 649,056 357,996 619,169 Non-current 498,860 164,820 317,247 11,450
889,223 813,876 675,243 630,619

(12)
The current loan and advances balances are those which are expected to be realized within 12 months after reporting date while non-current balances pertain to those expected to be collected beyond 12 months after reporting date. The amount of loans and advances above includes finance lease receivables as follows:
Consolidated
2015 2014
(In Millions of Pesos) Total future minimum lease collections 7,179 6,507 Unearned finance income (807) (817)
Present value of future minimum lease collections 6,372 5,690 Allowance for impairment (182) (132)
6,190 5,558
Details of future minimum lease collections follow:
Consolidated
2015 2014
(In Millions of Pesos) Not later than one year 1,441 3,578 Later than one year but not later than five years 5,738 2,929
7,179 6,507 Unearned finance income (807) (817)
6,372 5,690
The BPI Group, through BPI Leasing Century Tokyo Lease and Finance Corporation, mainly leases out vehicle and equipment under various finance lease agreements which typically run for a non-cancellable period of two to five years. The contracts generally include an option to purchase the leased asset after the lease period at a price that generally lies between 5% to 20% of the fair value of the asset at the inception of the lease. In the event that the residual value of the leased asset exceeds the guaranteed deposit liability at the end of the lease term, the BPI Group receives additional payment from the lessee prior to the transfer of the leased asset. On the other hand, the BPI Group sets up a liability to the lessee for any excess of the guaranteed deposit liability over residual value of the leased asset.
The Parent Bank has no finance lease receivables as at December 31, 2015 and 2014.
There is no contingent rent recognized as income during the years ended December 31, 2015 and 2014.
Details of the loans and advances portfolio of the BPI Group at December 31 are as follows: 1) As to industry/economic sector (in %)
Consolidated Parent
2015 2014 2015 2014
Consumer 9.75 9.38 5.66 5.34 Manufacturing 19.07 21.00 24.20 26.45 Real estate, renting and other related activities 22.03 22.45 12.62 14.06 Agriculture and forestry 1.82 2.15 2.28 2.68 Wholesale and retail trade 12.54 12.88 14.67 14.99 Financial institutions 12.20 11.95 15.80 15.09 Others 22.59 20.19 24.77 21.39
100.00 100.00 100.00 100.00
(13)
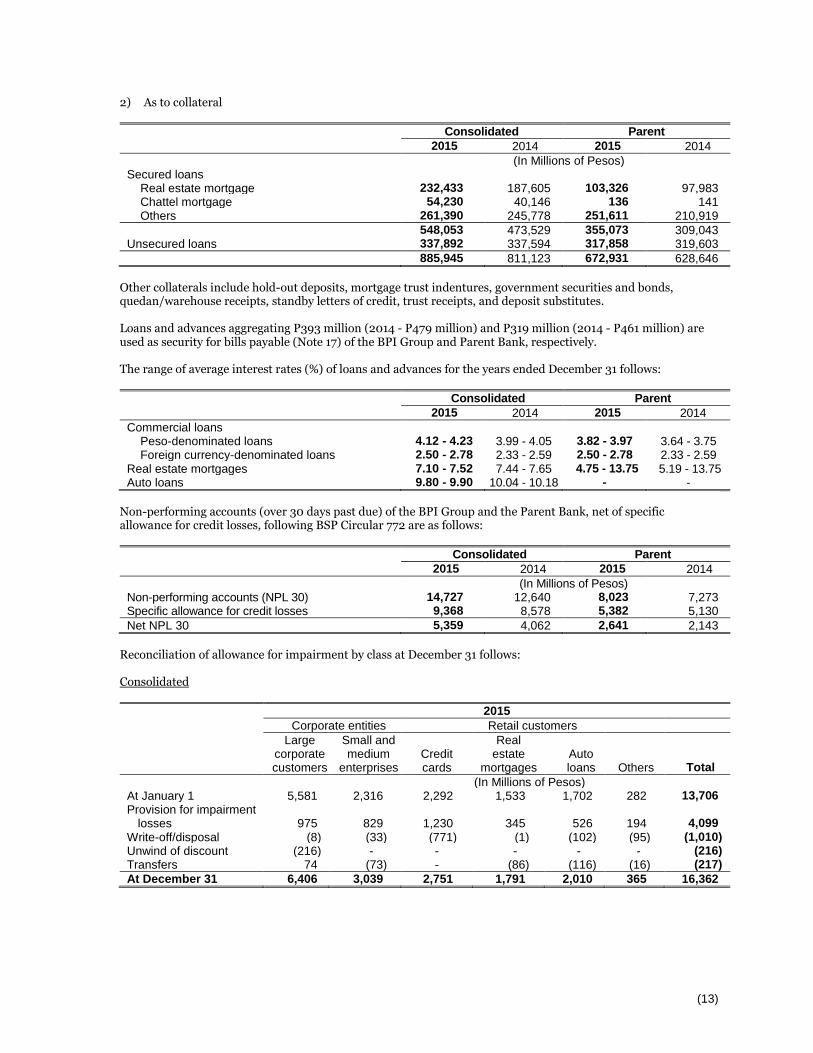
2) As to collateral
Consolidated Parent
2015 2014 2015 2014
(In Millions of Pesos) Secured loans Real estate mortgage 232,433 187,605 103,326 97,983 Chattel mortgage 54,230 40,146 136 141 Others 261,390 245,778 251,611 210,919
548,053 473,529 355,073 309,043 Unsecured loans 337,892 337,594 317,858 319,603
885,945 811,123 672,931 628,646
Other collaterals include hold-out deposits, mortgage trust indentures, government securities and bonds, quedan/warehouse receipts, standby letters of credit, trust receipts, and deposit substitutes. Loans and advances aggregating P393 million (2014 - P479 million) and P319 million (2014 - P461 million) are used as security for bills payable (Note 17) of the BPI Group and Parent Bank, respectively. The range of average interest rates (%) of loans and advances for the years ended December 31 follows:
Consolidated Parent
2015 2014 2015 2014
Commercial loans Peso-denominated loans 4.12 - 4.23 3.99 - 4.05 3.82 - 3.97 3.64 - 3.75 Foreign currency-denominated loans 2.50 - 2.78 2.33 - 2.59 2.50 - 2.78 2.33 - 2.59 Real estate mortgages 7.10 - 7.52 7.44 - 7.65 4.75 - 13.75 5.19 - 13.75 Auto loans 9.80 - 9.90 10.04 - 10.18 - -
Non-performing accounts (over 30 days past due) of the BPI Group and the Parent Bank, net of specific allowance for credit losses, following BSP Circular 772 are as follows:
Consolidated Parent
2015 2014 2015 2014
(In Millions of Pesos) Non-performing accounts (NPL 30) 14,727 12,640 8,023 7,273
Specific allowance for credit losses 9,368 8,578 5,382 5,130
Net NPL 30 5,359 4,062 2,641 2,143
Reconciliation of allowance for impairment by class at December 31 follows: Consolidated
2015
Corporate entities Retail customers
Large corporate customers
Small and medium
enterprises
Credit cards
Real estate
mortgages
Auto loans
Others
Total
(In Millions of Pesos) At January 1 5,581 2,316 2,292 1,533 1,702 282 13,706
Provision for impairment losses 975 829 1,230 345 526 194 4,099
Write-off/disposal (8) (33) (771) (1) (102) (95) (1,010)
Unwind of discount (216) - - - - - (216)
Transfers 74 (73) - (86) (116) (16) (217)
At December 31 6,406 3,039 2,751 1,791 2,010 365 16,362

(14)
2014
Corporate entities Retail customers
Large corporate customers
Small and medium
enterprises
Credit cards
Real estate
mortgages
Auto loans
Others
Total
(In Millions of Pesos) At January 1 5,059 2,154 2,390 1,476 1,339 199 12,617 Provision for impairment
losses 727 306 1,079 150 572 156 2,990 Write-off/disposal (152) (127) (1,179) - (104) (73) (1,635) Unwind of discount (76) (47) - - - - (123) Transfers 23 30 2 (93) (105) - (143)
At December 31 5,581 2,316 2,292 1,533 1,702 282 13,706
Parent
2015
Corporate entities Retail customers
Large corporate customers
Small and medium
enterprises
Credit cards
Real estate
mortgages
Auto loans
Others
Total
(In Millions of Pesos) At January 1 4,698 1,963 2,279 25 - 213 9,178
Provision for (reversal of) impairment losses 839 413 1,197 (1) - 138 2,586
Write-off/disposal (8) (32) (765) - - (95) (900)
Unwind of discount (216) - - - - - (216)
Transfers 93 (116) - - - (1) (24)
At December 31 5,406 2,228 2,711 24 - 255 10,624
2014
Corporate entities Retail customers
Large corporate customers
Small and medium
enterprises
Credit cards
Real estate
mortgages
Auto loans
Others
Total
(In Millions of Pesos) At January 1 4,307 1,923 2,390 62 - 181 8,863 Provision for (reversal
of) impairment losses 566 179 1,067 (4) - 106 1,914 Write-off/disposal (152) (99) (1,177) - - (74) (1,502) Unwind of discount (76) (47) - - - - (123) Transfers 53 7 (1) (33) - - 26
At December 31 4,698 1,963 2,279 25 - 213 9,178
Transfers pertain to reclassification of allowance for impairment between accounts.

(15)
Note 11 - Bank Premises, Furniture, Fixtures and Equipment The account at December 31 consists of: Consolidated
2015
Land
Buildings and leasehold
improvements
Furniture and
equipment
Equipment for lease
Total
(In Millions of Pesos) Cost
January 1, 2015 3,074 6,162 13,839 4,912 27,987
Additions - 573 1,627 1,658 3,858
Disposals (7) (5) (1,502) (1,849) (3,363)
Amortization - (152) - - (152)
Transfers - (19) - - (19)
Others 3 5 (3) - 5
December 31, 2015 3,070 6,564 13,961 4,721 28,316
Accumulated depreciation January 1, 2015 - 2,521 11,002 1,704 15,227
Depreciation - 263 1,417 1,092 2,772
Disposals/transfers - (2) (1,423) (1,084) (2,509)
Others - 2 (2) - -
December 31, 2015 - 2,784 10,994 1,712 15,490
Net book value, December 31, 2015 3,070 3,780 2,967 3,009 12,826
2014
Land
Buildings and leasehold
improvements
Furniture and
equipment
Equipment for lease
Total
(In Millions of Pesos) Cost
January 1, 2014 3,074 5,395 12,857 4,786 26,112 Additions - 946 1,494 1,797 4,237 Disposals (1) - (512) (1,671) (2,184) Amortization - (175) - - (175) Transfers 1 - - - 1 Others - (4) - - (4)
December 31, 2014 3,074 6,162 13,839 4,912 27,987
Accumulated depreciation January 1, 2014 - 2,253 10,027 1,628 13,908 Depreciation - 236 1,378 1,109 2,723 Disposals/transfers - 32 (402) (1,033) (1,403) Others - - (1) - (1)
December 31, 2014 - 2,521 11,002 1,704 15,227
Net book value, December 31, 2014 3,074 3,641 2,837 3,208 12,760

(16)
Parent
2015
Land
Buildings and leasehold
improvements
Furniture and
equipment
Total
(In Millions of Pesos) Cost January 1, 2015 2,664 5,389 12,811 20,864
Additions - 494 1,481 1,975
Disposals (7) (5) (1,426) (1,438)
Amortization - (101) - (101)
Transfers - (19) - (19)
December 31, 2015 2,657 5,758 12,866 21,281
Accumulated depreciation January 1, 2015 - 2,214 10,183 12,397
Depreciation - 228 1,316 1,544
Disposals/transfers - (2) (1,373) (1,375)
December 31, 2015 - 2,440 10,126 12,566
Net book value, December 31, 2015 2,657 3,318 2,740 8,715
2014
Land
Buildings and leasehold
improvements
Furniture and
equipment
Total
(In Millions of Pesos) Cost January 1, 2014 2,664 4,670 11,912 19,246 Additions - 848 1,331 2,179 Disposals (1) - (432) (433) Amortization - (129) - (129) Transfers 1 - - 1
December 31, 2014 2,664 5,389 12,811 20,864
Accumulated depreciation January 1, 2014 - 1,976 9,241 11,217 Depreciation - 206 1,289 1,495 Disposals/transfers - 32 (347) (315)
December 31, 2014 - 2,214 10,183 12,397
Net book value, December 31, 2014 2,664 3,175 2,628 8,467
Depreciation is included in Occupancy and equipment-related expenses in the statement of income. Note 12 - Investment Properties The account at December 31 consists of:
Consolidated Parent
2015 2014 2015 2014
(In Millions of Pesos) Land 97 97 97 97 Buildings 2,032 2,013 2,032 2,013
2,129 2,110 2,129 2,110 Accumulated depreciation (1,394) (1,300) (1,394) (1,300) Allowance for impairment (2) (2) (2) (2)
733 808 733 808

(17)
The movement in investment properties is summarized as follows:
Consolidated Parent
2015 2014 2015 2014
(In Millions of Pesos) At January 1 808 1,597 808 1,597 Additions - 157 - 157 Disposals - (866) - (866) Transfers 19 - 19 - Depreciation (94) (80) (94) (80)
At December 31 733 808 733 808
Investment properties have aggregate fair value of P3,050 million as at December 31, 2015 (2014 - P2,057 million). The fair value of investment property is determined on the basis of appraisal made by an internal or an external appraiser duly certified by the General Administrative and Shared Services Group. Valuation method employed by the appraisers mainly includes the market data approach. Depreciation is included in Occupancy and equipment-related expenses in the statement of income. All investment properties generate rental income. Rental income from investment properties recognized in the statement of income, as part of Other operating income, amounts to P262 million for the year ended December 31, 2015 (2014 - P298 million; 2013 - P255 million). Direct operating expenses (including repairs and maintenance) arising from these investment properties amount to P165 million for the year ended December 31, 2015 (2014 - P125 million; 2013 - P116 million). Note 13 - Investments in Subsidiaries and Associates This account at December 31 consists of investments in shares of stock:
Consolidated Parent
2015 2014 2015 2014
(In Millions of Pesos) Carrying value (net of impairment)
Investments at equity method 6,453 4,784 - - Investments at cost method - - 8,068 6,726
6,453 4,784 8,068 6,726
Investments in associates carried at equity method in the consolidated statement of condition follow:
Place of business/ country of
incorporation
Percentage of ownership interest
(%)
Acquisition cost
Measurement
method
Name of entity 2015 2014 2015 2014
BPI - Philamlife Assurance Corporation Philippines 47.67 47.67 371 371 Equity AF Payments, Inc. Philippines 20.00 20.00 460 300 Equity National Reinsurance Corporation* Philippines 13.69 13.69 204 204 Equity Beacon Property Ventures, Inc. Philippines 20.00 20.00 100 100 Equity Victoria 1552 Investments, LP Delaware, USA - 35.00 - 7 Equity CityTrust Realty Corporation Philippines 40.00 40.00 2 2 Equity Global Payments-Asia Pacific
Philippines Incorporated Philippines 49.00 - 1,342 - Equity
2,479 984 Allowance for impairment - (7)
2,479 977 *BPI Group has significant influence due to its representation on the governing body of National Reinsurance Corporation

(18)
For BPI-Philamlife Assurance Corporation, BPI acts as distribution channel for the former’s insurance products. In 2014, the distribution agreement with Philamlife has been extended for another twenty years or until November 27, 2039 unless earlier terminated. In August 2015, BPI subscribed to primary shares of Global Payments-Asia Pacific Philippines Incorporated for a total consideration of P1.3 billion; thereby acquiring a 49% stake in the entity. Details and movements of investments in associates carried at equity method in the consolidated financial statements follow:
2015 2014
(In Millions of Pesos) Acquisition cost At January 1 977 677 Addition 1,502 300 Allowance for impairment - -
At December 31 2,479 977
Accumulated equity in net income At January 1 2,024 1,968 Share in net income for the year 627 257 Dividends received - (201)
At December 31 2,651 2,024
Accumulated share in other comprehensive income At January 1 1,783 1,530 Share in other comprehensive (loss) income for the year (460) 253
At December 31 1,323 1,783
6,453 4,784
As the associates are not considered to be individually material to impact the financial statements of the BPI Group, the unaudited financial information of associates as at and for the years ended December 31 has been aggregated as follows:
2015 2014
(In Millions of Pesos) Total assets 95,029 79,092 Total liabilities 76,281 63,083 Total revenues 23,769 18,667 Total net income 1,138 480

(19)
The details of equity investments at cost method in the separate financial statements of the Parent Bank follow:
Acquisition cost
Allowance for impairment
Carrying value
2015 2014 2015 2014 2015 2014
(In Millions of Pesos) Subsidiaries
BPI Europe Plc. 1,910 1,910 - - 1,910 1,910 Ayala Plans, Inc. 863 863 - - 863 863 BPI Capital Corporation 623 623 - - 623 623 BPI Direct Savings Bank, Inc. 392 392 - - 392 392 BPI Century Tokyo Lease and
Finance Corporation (formerly BPI Leasing Corporation)
329
329
-
-
329
329 FGU Insurance Corporation 303 303 - - 303 303 BPI Globe BanKO, Inc. 607 607 - - 607 607 BPI Foreign Exchange Corp. 195 195 - - 195 195 BPI Express Remittance Corp. USA 191 191 - - 191 191 BPI Family Savings Bank, Inc. 150 150 - - 150 150 First Far-East Development
Corporation
91
91
-
-
91
91
Green Enterprises S.R.L. in Liquidation (formerly BPI Express Remittance Europe, S.p.A)
54
54
-
-
54
54 BPI Card Finance Corp. 50 50 - - 50 50 FEB Stock Brokers, Inc. 25 25 - - 25 25 BPI Computer Systems Corp. 23 23 - - 23 23 BPI Express Remittance Spain S.A 26 26 - - 26 26 Others 321 321 (104) (104) 217 217
Associates 2,019 677 - - 2,019 677
8,172 6,830 (104) (104) 8,068 6,726
In 2014, the Parent Bank made additional capital infusion to BPI Globe BanKO, Inc. amounting to P248 million. There is no individual subsidiary with non-controlling interest considered material to the Parent Bank. Note 14 - Deferred Income Taxes The significant components of deferred income tax assets and liabilities at December 31 are as follows:
Consolidated Parent
2015 2014 2015 2014
(In Millions of Pesos) Deferred income tax assets Allowance for impairment 6,466 5,919 4,116 3,901 Net operating loss carry over (NOLCO) 63 117 - - Minimum corporate income tax (MCIT) 1 1 - -
Pension liability 496 298 449 268 Others 74 1 8 -
Total deferred income tax assets 7,100 6,336 4,573 4,169
Deferred income tax liabilities Revaluation gain on properties (511) (543) (523) (543) Fair value gain on available-for-sale securities (39) (42) - -
Others (117) (33) (114) (31)
Total deferred income tax liabilities (667) (618) (637) (574)
6,433 5,718 3,936 3,595

(20)
Consolidated Parent
2015 2014 2015 2014
(In Millions of Pesos) Deferred income tax assets Amount to be recovered within 12 months 603 444 552 431 Amount to be recovered after 12 months 6,497 5,892 4,021 3,738
7,100 6,336 4,573 4,169
Deferred income tax liabilities Amount to be settled within 12 months 626 449 626 449 Amount to be settled after 12 months 41 169 11 125
667 618 637 574
The movement in the deferred income tax account is summarized as follows:
Consolidated Parent
2015 2014 2015 2014
(In Millions of Pesos) At January 1 5,718 6,176 3,595 4,296 Amounts credited to statement of income 598 416 238 138 Amounts credited to (charged against) other
comprehensive income 117 (874) 103 (839)
At December 31 6,433 5,718 3,936 3,595
The deferred tax charge (credit) in the statement of income comprises the following temporary differences:
Consolidated Parent
2015 2014 2013 2015 2014 2013
(In Millions of Pesos) Allowance for impairment (670) (298) (94) (322) (163) 191 NOLCO - (107) (3) - - - Pension 40 76 82 31 75 52 Others 32 (87) 21 53 (50) 2
(598) (416) 6 (238) (138) 245
The outstanding NOLCO at December 31 consists of:
Consolidated Parent
Year of Incurrence Year of Expiration 2015 2014 2015 2014
(In Millions of Pesos) 2015 2018 - - - - 2014 2017 361 361 - - 2013 2016 20 20 - - 2012 2015 10 10 - - 2011 2014 - 3 - -
391 394 - - Used portion/ expired during the year (10) (3) - - NOLCO not recognized (171) - - -
210 391 - - Tax rate 30% 30% 30% 30%
Deferred income tax asset on NOLCO 63 117 - -

(21)
The details of MCIT at December 31 are as follows:
Consolidated Parent
Year of Incurrence Year of Expiration 2015 2014 2015 2014
(In Millions of Pesos) 2015 2018 - - - - 2014 2017 1 1 - - 2013 2016 - - - - 2012 2015 - - - - 2011 2014 - 3
1 4 - - Used portion during the year - (3) - -
1 1 - -
Note 15 - Other Resources The account at December 31 consists of the following:
Consolidated Parent
2015 2014 2015 2014
(In Millions of Pesos) Accounts receivable 2,854 2,574 1,989 1,974 Intangible assets 2,054 2,334 2,009 2,282 Residual value of equipment for lease 1,952 1,974 - - Accrued trust and other fees 1,196 1,213 1,080 1,109 Prepaid expenses 906 732 483 508 Rental deposits 403 366 336 304 Creditable withholding tax 329 482 63 210 Sundry debits 15 3,196 8 2,310 Miscellaneous assets 2,602 2,158 1,655 1,291
12,311 15,029 7,623 9,988
Allowance for impairment (1,456) (1,478) (1,237) (1,330)
10,855 13,551 6,386 8,658
Intangible assets mainly pertain to computer software.
Sundry debits pertain to float items arising from timing differences in recording transactions which are expected to clear in one to two days.
Miscellaneous assets include returned checks, prepaid taxes and other office supplies.
The reconciliation of the allowance for impairment at December 31 is summarized as follows:
Consolidated Parent
2015 2014 2015 2014
(In Millions of Pesos) At January 1 1,478 1,759 1,330 1,600 Provision for (reversal of) impairment losses 7 (246) (66) (255) Write-off (29) (35) (27) (15)
At December 31 1,456 1,478 1,237 1,330
Consolidated Parent
2015 2014 2015 2014
(In Millions of Pesos) Current 8,270 10,646 5,604 7,685 Non-current 4,041 4,383 2,019 2,303
12,311 15,029 7,623 9,988
(22)
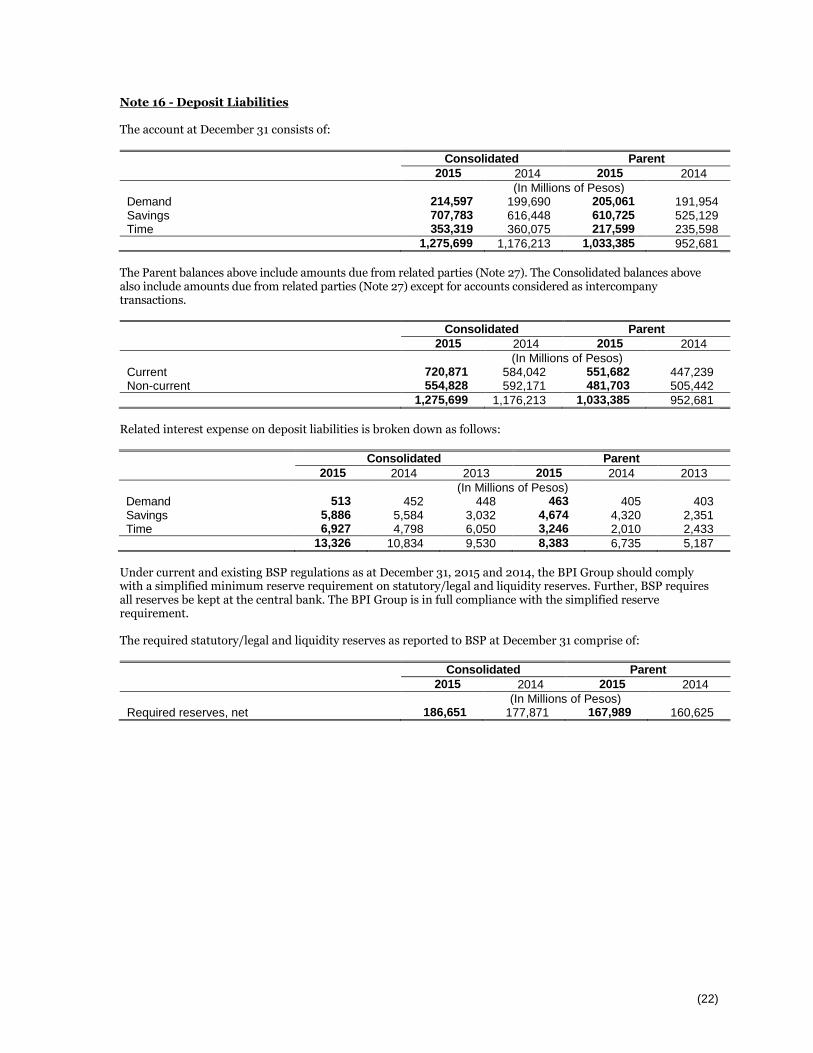
Note 16 - Deposit Liabilities The account at December 31 consists of:
Consolidated Parent
2015 2014 2015 2014
(In Millions of Pesos) Demand 214,597 199,690 205,061 191,954 Savings 707,783 616,448 610,725 525,129 Time 353,319 360,075 217,599 235,598
1,275,699 1,176,213 1,033,385 952,681
The Parent balances above include amounts due from related parties (Note 27). The Consolidated balances above also include amounts due from related parties (Note 27) except for accounts considered as intercompany transactions.
Consolidated Parent
2015 2014 2015 2014
(In Millions of Pesos) Current 720,871 584,042 551,682 447,239 Non-current 554,828 592,171 481,703 505,442
1,275,699 1,176,213 1,033,385 952,681
Related interest expense on deposit liabilities is broken down as follows:
Consolidated Parent
2015 2014 2013 2015 2014 2013
(In Millions of Pesos) Demand 513 452 448 463 405 403 Savings 5,886 5,584 3,032 4,674 4,320 2,351 Time 6,927 4,798 6,050 3,246 2,010 2,433
13,326 10,834 9,530 8,383 6,735 5,187
Under current and existing BSP regulations as at December 31, 2015 and 2014, the BPI Group should comply with a simplified minimum reserve requirement on statutory/legal and liquidity reserves. Further, BSP requires all reserves be kept at the central bank. The BPI Group is in full compliance with the simplified reserve requirement. The required statutory/legal and liquidity reserves as reported to BSP at December 31 comprise of:
Consolidated Parent
2015 2014 2015 2014
(In Millions of Pesos) Required reserves, net 186,651 177,871 167,989 160,625

(23)
Note 17 - Bills Payable The account at December 31 consists of:
Consolidated Parent
2015 2014 2015 2014
(In Millions of Pesos) Local banks 7,052 6,916 120 225 Foreign banks 13,889 26,077 12,706 26,063
20,941 32,993 12,826 26,288
The range of average interest rates (%) of bills payable for the years ended December 31 follows:
Consolidated Parent
2015 2014 2015 2014
Bangko Sentral ng Pilipinas 3.55 - 3.85 3.32 - 3.72 - 3.30 - 3.74 Private firms and local banks - Peso-denominated 3.34 - 3.60 3.06 - 3.43 4.35 - 5.32 4.75 - 6.60 Foreign banks - Foreign-currency denominated 0.92 - 1.15 0.90 - 1.05 0.92 - 1.15 0.90 - 1.05
Consolidated Parent
2015 2014 2013 2015 2014 2013
(In Millions of Pesos) Interest expense 332 350 545 115 138 194
Consolidated Parent
2015 2014 2015 2014
(In Millions of Pesos) Current 16,114 28,476 8,008 26,103 Non-current 4,827 4,517 4,818 185
20,941 32,993 12,826 26,288
Bills payable include funds borrowed from Land Bank of the Philippines (LBP), Development Bank of the Philippines (DBP) and BSP which were relent to customers of the BPI Group in accordance with the financing programs of LBP, DBP and BSP and credit balances of settlement bank accounts. The average payment term of these bills payable is 1.99 years (2014 - 1.03 years). Loans and advances of the BPI Group arising from these financing programs serve as security for the related bills payable (Note 10). Note 18 - Deferred Credits and Other Liabilities The account at December 31 consists of the following:
Consolidated Parent
2015 2014 2015 2014
(In Millions of Pesos) Bills purchased - contra 13,485 13,854 13,465 13,817 Accounts payable 4,483 4,787 2,594 3,554 Dividends payable 3,539 - 3,539 - Outstanding acceptances 2,494 947 2,494 947 Deposits on lease contracts 1,868 1,974 - - Withholding tax payable 517 545 380 435 Due to the Treasurer of the Philippines 467 301 414 270 Other deferred credits 343 419 108 92 Vouchers payable - 531 - 531 Miscellaneous liabilities 7,502 7,910 6,101 5,823
34,698 31,268 29,095 25,469
(24)
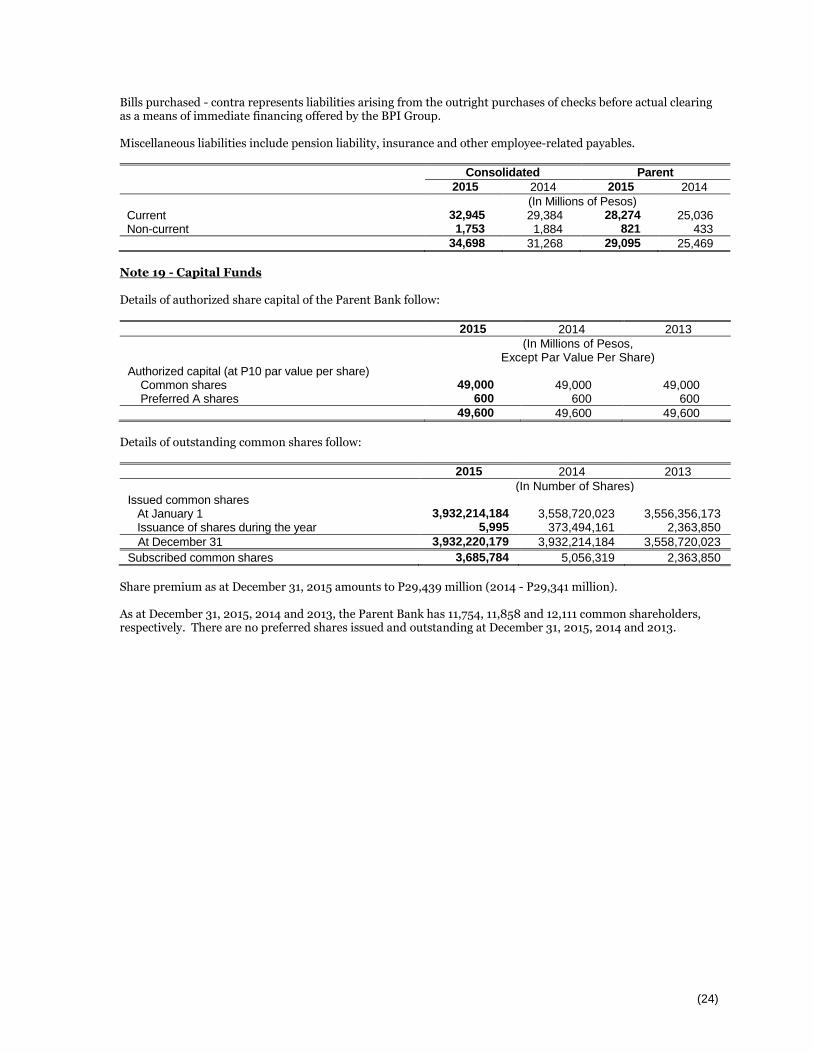
Bills purchased - contra represents liabilities arising from the outright purchases of checks before actual clearing as a means of immediate financing offered by the BPI Group. Miscellaneous liabilities include pension liability, insurance and other employee-related payables.
Consolidated Parent
2015 2014 2015 2014
(In Millions of Pesos) Current 32,945 29,384 28,274 25,036 Non-current 1,753 1,884 821 433
34,698 31,268 29,095 25,469
Note 19 - Capital Funds Details of authorized share capital of the Parent Bank follow:
2015 2014 2013 (In Millions of Pesos,
Except Par Value Per Share) Authorized capital (at P10 par value per share) Common shares 49,000 49,000 49,000 Preferred A shares 600 600 600
49,600 49,600 49,600
Details of outstanding common shares follow:
2015 2014 2013
(In Number of Shares) Issued common shares At January 1 3,932,214,184 3,558,720,023 3,556,356,173 Issuance of shares during the year 5,995 373,494,161 2,363,850
At December 31 3,932,220,179 3,932,214,184 3,558,720,023
Subscribed common shares 3,685,784 5,056,319 2,363,850
Share premium as at December 31, 2015 amounts to P29,439 million (2014 - P29,341 million). As at December 31, 2015, 2014 and 2013, the Parent Bank has 11,754, 11,858 and 12,111 common shareholders, respectively. There are no preferred shares issued and outstanding at December 31, 2015, 2014 and 2013.

(25)
Details of and movements in Accumulated other comprehensive income (loss) for the years ended December 31 follow:
Consolidated Parent
2015 2014 2013 2015 2014 2013
(In Millions of Pesos) Fair value reserve on available-for-sale
securities
At January 1 (3,855) (2,952) 1,030 (4,072) (3,029) 642 Unrealized fair value (loss) gain before tax (542) (1,153) (9,049) (217) (1,201) (8,196) Reclassification to Statement of Income (26) (253) 4,148 22 (324) 3,604 Deferred income tax effect 42 503 919 41 482 921
At December 31 (4,381) (3,855) (2,952) (4,226) (4,072) (3,029)
Share in other comprehensive income (loss) of insurance subsidiaries
At January 1 188 36 289 - - - Share in other comprehensive (loss)
income for the year, before tax (265) 157 (331) - - - Deferred income tax effect 10 (5) 78 - - -
At December 31 (67) 188 36 - - -
Share in other comprehensive income (loss) of associates At January 1 1,784 1,530 1,618 - - - Share in other comprehensive (loss)
income for the year (451) 254 (88) - - -
At December 31 1,333 1,784 1,530 - - -
Translation adjustment on foreign operations At January 1 (768) (703) (936) - - - Translation differences 77 (65) 233 - - -
At December 31 (691) (768) (703) - - -
Actuarial (losses) gains on defined benefit plan, net At January 1 (572) (1,072) (581) (429) (781) (365) Actuarial (losses) gains for the year (546) 713 (702) (322) 503 (594) Deferred income tax effect 160 (213) 211 97 (151) 178
At December 31 (958) (572) (1,072) (654) (429) (781)
(4,764) (3,223) (3,161) (4,880) (4,501) (3,810)
On December 18, 2015, the Board of Directors of the Parent Bank approved to grant to qualified beneficiaries/participants up to 3,575,000 shares for Executive Stock Option Plan (ESOP) and 8,000,000 shares for Executive Stock Purchase Plan (ESPP). On November 12, 2014, the Board of Directors of the Parent Bank approved to grant to qualified beneficiaries/participants up to 3,200,000 shares for ESOP and 4,100,000 shares for ESPP. On November 27, 2013, the Board of Directors of the Parent Bank approved to grant to qualified beneficiaries/ participants up to 3,500,000 shares for ESOP and up to 4,300,000 shares for ESPP. The ESOP has a three-year vesting period with 1/3 of the option being vested at the end of each year from grant date while the ESPP has a five-year payment period. The exercise price for ESOP is equal to the volume weighted average of BPI share price for the most recent previous 30-trading days from grant date. The weighted average fair value of options granted during 2015 determined using the Black-Scholes valuation model was P11.64 per option (2014 - P16.20; 2013 - P17.54).

(26)
Movements in the number of employee share options are as follows:
2015 2014 2013
At January 1 6,350,000 3,250,000 - Granted 3,575,000 3,175,000 3,250,000 Exercised (91,667) - - Cancelled (608,333) (75,000) -
At December 31 9,225,000 6,350,000 3,250,000
Exercisable 2,650,000 1,058,333 -
The subscription price for ESPP is equivalent to 15% below the volume weighted average of BPI share price for the most recent previous 30-trading days from grant date. The subscription dates for ESPP were on January 25, 2016, November 12, 2014 and December 23, 2013. The impact of ESOP is not considered material to the financial statements; thus, the disclosures were only limited to the information mentioned above. Details of and movements in Reserves for the years ended December 31 follow:
Consolidated Parent
2015 2014 2013 2015 2014 2013
(In Millions of Pesos)
Surplus reserves At January 1 2,098 1,680 1,603 2,095 1,680 1,603 Transfer from surplus 432 397 76 432 397 76
Executive stock plan amortization 33 21 1 28 18 1
At December 31 2,563 2,098 1,680 2,555 2,095 1,680
Surplus reserves consist of:
Consolidated Parent
2015 2014 2013 2015 2014 2013
(In Millions of Pesos) Reserve for trust business 2,474 2,043 1,645 2,474 2,043 1,645 Reserve for self-insurance 34 34 34 34 34 34 Executive stock option plan amortization 55 21 1 47 18 1
2,563 2,098 1,680 2,555 2,095 1,680
In compliance with existing BSP regulations, 10% of the Parent Bank’s income from trust business is appropriated to surplus reserve. This yearly appropriation is required until the surplus reserve for trust business reaches 20% of the Parent Bank’s regulatory net worth. Reserve for self-insurance represents the amount set aside to cover losses due to fire, defalcation by and other unlawful acts of personnel and third parties. Cash dividends declared by the Board of Directors of the Parent Bank during the years 2013 to 2015 follow:
Date declared
Date approved by the BSP
Amount of dividends
Per share
Total (In Millions of Pesos)
April 17, 2013 May 15, 2013 0.90 3,201 November 6, 2013 December 5, 2013 0.90 3,201 May 21, 2014 June 19, 2014 0.90 3,538 November 19, 2014 February 2, 2015 0.90 3,539 May 20, 2015 July 20, 2015 0.90 3,539 December 16, 2015 Not applicable, see below. 0.90 3,539
Prior to October 2015, cash dividends declared are payable to common shareholders of record as of 15th working day from receipt by the Parent Bank of the approval by the BSP and distributable on the 15th working day from the said record date.

(27)
In October 2015, BSP Circular No. 888, Amendments to Regulations on Dividend Declaration and Interest Payments on Tier 1 Capital Instruments, was issued which amends the section on recording of dividends. The liability for dividends declared shall be taken up in the bank’s books upon its declaration. Prior to the release of BSP Circular No. 888, the liability for recording dividends declared is taken up in the books upon receipt of BSP approval thereof or if no such approval is received, after thirty (30) banking/business days from the date the required report on dividend declaration was received by the appropriate department of the Supervision and Examination Sector, whichever comes earlier. The calculation of earnings per share (EPS) is shown below:
Consolidated Parent
2015 2014 2013 2015 2014 2013
(In Millions, Except Earnings Per Share Amounts) a) Net income attributable to equity holders
of the Parent Bank 18,234 18,039
18,811 12,063 13,270
14,468 b) Weighted average number of common
shares outstanding during the year 3,932
3,905
3,627 3,932
3,905
3,627 c) Basic EPS (a/b) 4.64 4.62 5.19 3.07 3.40 3.99
For 2013, the weighted average number of common shares outstanding during the year has been adjusted to take into consideration the rights issue approved by the Board of Directors on November 6, 2013. The Parent Bank offered for subscription a total of 370,370,370 common shares to eligible shareholders on a pre-emptive rights basis at P67.50 per share. The stock rights have been fully subscribed and listed on February 10, 2014. The proceeds from the rights offer amounting to P25 billion has increased the Parent Bank’s capital base. The basic and diluted EPS are the same for the years presented as the stock options outstanding is not significant to impact the weighted average number of common shares. Note 20 - Other Operating Income Details of other operating income follow:
Consolidated Parent
2015 2014 2013 2015 2014 2013
(In Millions of Pesos)
Trust and asset management fees 3,607 3,433 3,723 2,912 2,793 3,026 Gain on sale of assets 2,530 1,363 1,296 1,950 2,418 1,028 Rental income 1,729 1,796 1,830 382 439 425 Credit card income 1,537 1,550 1,359 1,529 1,548 1,359 Dividend income 48 22 28 389 572 1,923 Others 1,199 2,504 1,278 889 2,201 795
10,650 10,668 9,514 8,051 9,971 8,556
Trust and asset management fees arise from the BPI Group’s asset management and trust services and are based on agreed terms with various managed funds and investments. Rental income is earned by the BPI Group by leasing out its investment properties (Note 12) and other assets which consist mainly of fleet of vehicles. The BPI Group’s operating lease agreements typically pertain to cancellable leases with a period of two to five years. Gain on sale of assets arises mainly from the sale of assets pertaining to merchant acquiring business, disposals of properties (including equity investments), foreclosed collaterals and non-performing assets. Dividend income recognized by the Parent Bank substantially pertains to dividend distribution of subsidiaries. Other income includes recoveries on charged-off assets and revenues from service arrangements with customers and related parties.
(28)
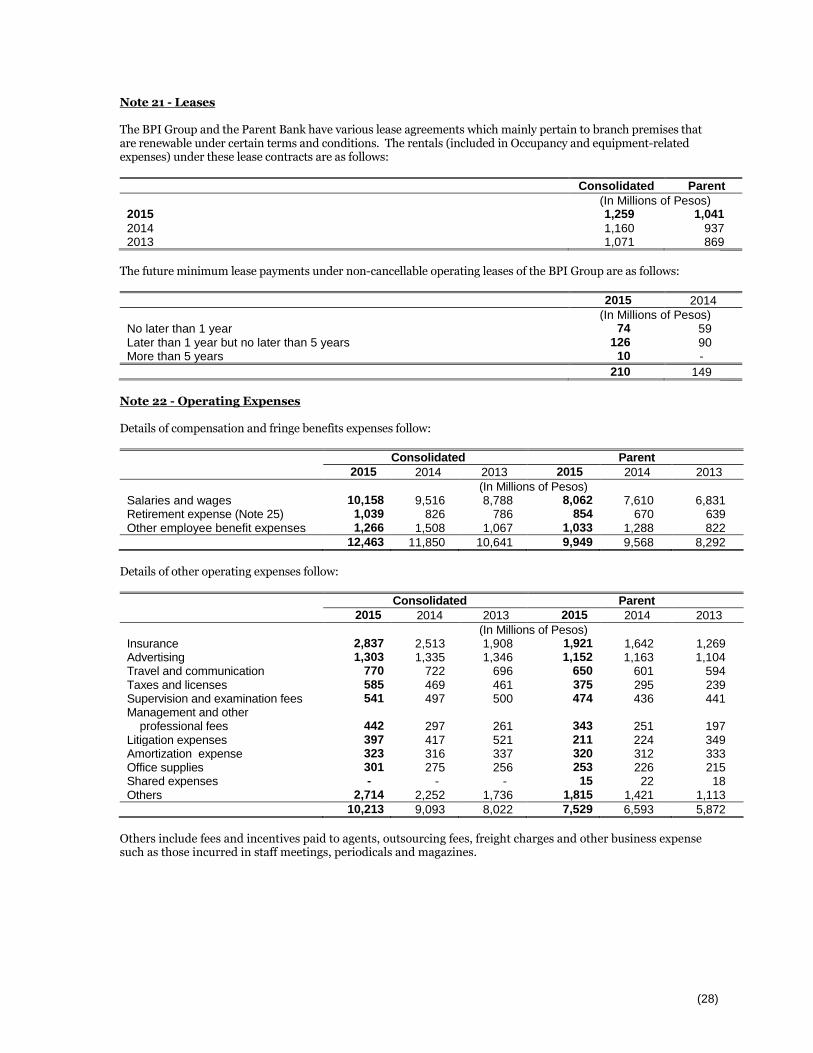
Note 21 - Leases The BPI Group and the Parent Bank have various lease agreements which mainly pertain to branch premises that are renewable under certain terms and conditions. The rentals (included in Occupancy and equipment-related expenses) under these lease contracts are as follows:
Consolidated Parent
(In Millions of Pesos) 2015 1,259 1,041
2014 1,160 937 2013 1,071 869
The future minimum lease payments under non-cancellable operating leases of the BPI Group are as follows:
2015 2014
(In Millions of Pesos) No later than 1 year 74 59 Later than 1 year but no later than 5 years 126 90 More than 5 years 10 -
210 149
Note 22 - Operating Expenses Details of compensation and fringe benefits expenses follow:
Consolidated Parent
2015 2014 2013 2015 2014 2013
(In Millions of Pesos) Salaries and wages 10,158 9,516 8,788 8,062 7,610 6,831 Retirement expense (Note 25) 1,039 826 786 854 670 639 Other employee benefit expenses 1,266 1,508 1,067 1,033 1,288 822
12,463 11,850 10,641 9,949 9,568 8,292
Details of other operating expenses follow:
Consolidated Parent
2015 2014 2013 2015 2014 2013
(In Millions of Pesos) Insurance 2,837 2,513 1,908 1,921 1,642 1,269 Advertising 1,303 1,335 1,346 1,152 1,163 1,104 Travel and communication 770 722 696 650 601 594 Taxes and licenses 585 469 461 375 295 239 Supervision and examination fees 541 497 500 474 436 441 Management and other professional fees 442 297 261 343 251 197 Litigation expenses 397 417 521 211 224 349 Amortization expense 323 316 337 320 312 333 Office supplies 301 275 256 253 226 215 Shared expenses - - - 15 22 18 Others 2,714 2,252 1,736 1,815 1,421 1,113
10,213 9,093 8,022 7,529 6,593 5,872
Others include fees and incentives paid to agents, outsourcing fees, freight charges and other business expense such as those incurred in staff meetings, periodicals and magazines.

(29)
Note 23 - Income Taxes A reconciliation between the provision for income tax at the statutory tax rate and the actual provision for income tax for the years ended December 31 follows:
Consolidated
2015 2014 2013
Amount
Rate (%) Amount
Rate (%)
Amount
Rate (%)
(In Millions of Pesos) Statutory income tax 7,054 30.00 6,906 30.00 6,944 30.00 Effect of items not subject to statutory tax rate: Income subjected to lower tax rates (886) (3.77) (1,571) (6.82) (689) (2.98) Tax-exempt income (1,515) (6.44) (2,062) (8.96) (2,938) (12.69) Others, net 485 2.06 1,685 7.31 836 3.61
Actual income tax 5,138 21.85 4,958 21.53 4,153 17.94
Parent
2015 2014 2013
Amount
Rate (%) Amount
Rate (%)
Amount
Rate (%)
(In Millions of Pesos) Statutory income tax 4,828 30.00 5,067 30.00 5,207 30.00 Effect of items not subject to statutory tax rate: Income subjected to lower tax rates (792) (4.92) (1,491) (8.83) (645) (3.72) Tax-exempt income (340) (2.11) (1,035) (6.13) (1,993) (11.48) Others, net 335 2.08 1,080 6.39 320 1.85
Actual income tax 4,031 25.05 3,621 21.43 2,889 16.65
Note 24 - Basic Quantitative Indicators of Financial Performance The key financial performance indicators follow (in %):
Consolidated Parent
2015 2014 2015 2014
Return on average equity 12.33 13.75 11.04 13.37 Return on average assets 1.30 1.44 1.08 1.33 Net interest margin 2.98 3.03 2.69 2.73
Note 25 - Retirement Plans BPI and its subsidiaries, and a non-life insurance subsidiary have separate trusteed, noncontributory retirement benefit plans covering all qualified officers and employees. The description of the plans follows: BPI BPI has a unified plan which includes its subsidiaries other than insurance companies. Under this plan, the normal retirement age is 60 years. Normal retirement benefit consists of a lump sum benefit equivalent to 200% of the basic monthly salary of the employee at the time of his retirement for each year of service, if he has rendered at least 10 years of service, or to 150% of his basic monthly salary, if he has rendered less than 10 years of service. For voluntary retirement, the benefit is equivalent to 112.50% of the employee’s basic monthly salary for a minimum of 10 years of service with the rate factor progressing to a maximum of 200% of basic monthly salary for service years of 25 or more. Death or disability benefit, on the other hand, shall be determined on the same basis as in voluntary retirement. The net defined benefit cost and contributions to be paid by the entities within the BPI Group are determined by an independent actuary. Plan assets are held in trusts, governed by local regulations and practice in the Philippines.

(30)
Non-life insurance subsidiary BPI/MS has a separate trusteed defined benefit plan. Under the plan, the normal retirement age is 60 years or the employee should have completed at least 10 years of service, whichever is earlier. The normal retirement benefit is equal to 150% of the final basic monthly salary for each year of service for below 10 years and 175% of the final basic monthly salary for each year of service for 10 years and above. Death or disability benefit for all employees of the non-life insurance subsidiary shall be determined on the same basis as in normal or voluntary retirement as the case may be. Following are the amounts recognized based on recent actuarial valuations: (a) Pension liability as at December 31 recognized in the statement of condition
Consolidated
2015 2014
(In Millions of Pesos) Present value of defined benefit obligations 11,991 11,541 Fair value of plan assets (10,953) (11,133)
Pension liability recognized in the statement of condition 1,038 408
Parent
2015 2014
(In Millions of Pesos) Present value of defined benefit obligations 9,849 9,498 Fair value of plan assets (9,106) (9,165)
Pension liability recognized in the statement of condition 743 333
Pension liability is shown as part of “Miscellaneous liabilities” within Deferred credits and other liabilities (Note 18). The movement in plan assets is summarized as follows:
Consolidated Parent
2015 2014 2015 2014
(In Millions of Pesos) At January 1 11,133 10,261 9,165 8,332 Fund transfer due to transferred employees from a
subsidiary - - - 108 Interest income 469 544 388 448 Contributions 942 942 766 766 Benefit payments (1,208) (1,110) (896) (897) Remeasurement - return on plan assets (383) 496 (317) 408
At December 31 10,953 11,133 9,106 9,165
The carrying value of the plan assets of the BPI Group as at December 31, 2015 is equivalent to the fair value of P10,953 million (2014 - P11,133 million). The carrying value of the plan assets of the Parent Bank as at December 31, 2015 is equivalent to the fair value of P9,106 million (2014 - P9,165 million). The plan assets are comprised of the following:
Consolidated Parent
2015 2014 2015 2014
Amount % Amount % Amount % Amount %
(In Millions of Pesos Except for Rates) Debt securities 4,859 44 5,940 53 4,039 44 4,890 53 Equity securities 4,857 44 5,177 47 4,038 44 4,262 47 Others 1,237 12 16 - 1,029 12 13 -
10,953 100 11,133 100 9,106 100 9,165 100

(31)
Pension plan assets of the unified retirement plan include investment in BPI’s common shares with carrying amount of P164 million (2014 - P958 million) and fair value of P362 million at December 31, 2015 (2014 - P2,365 million). Realized and unrealized gains coming from BPI’s common shares amount to P1,248 million and P197 million in 2015, respectively (2014 - P489 million and P1,407 million). The actual return on plan assets of the BPI Group was P85 million in 2015 (2014 - P1,040 million). An officer of the Parent Bank exercises the voting rights over the plan’s investment in BPI’s common shares. The movement in the present value of defined benefit obligation is summarized as follows:
Consolidated Parent
2015 2014 2015 2014
(In Millions of Pesos) At January 1 11,541 11,495 9,498 9,277 Present value of defined benefit obligation for transferred
employees from a subsidiary - - - 95 Current service cost 1,016 759 837 621 Interest cost 492 611 405 497 Benefit payments (1,208) (1,110) (896) (897) Remeasurement - change in assumptions and experience
adjustment 150 (214) 5 (95)
At December 31 11,991 11,541 9,849 9,498
The BPI Group has no other transactions with the plan other than the contributions presented above for the years ended December 31, 2015 and 2014. (b) Expense recognized in the statement of income
Consolidated Parent
2015 2014 2013 2015 2014 2013
(In Millions of Pesos) Current service cost 1,016 759 764 837 621 618 Net interest cost 23 67 33 17 49 21 Past service cost - - (11) - - -
1,039 826 786 854 670 639
The principal assumptions used for the actuarial valuations of the unified plan of the BPI Group are as follows:
2015 2014
Discount rate 4.98% 4.26% Future salary increases 5.00% 5.00%
Assumptions regarding future mortality and disability experience are based on published statistics generally used for local actuarial valuation purposes. The defined benefit plan typically exposes the BPI Group to a number of risks such as investment risk, interest rate risk and salary risk. The most significant of which relate to investment and interest rate risk. The present value of the defined benefit obligation is determined by discounting the estimated future cash outflows using interest rates of government bonds that are denominated in the currency in which the benefits will be paid, and that have terms to maturity approximating the terms of the related pension liability. A decrease in government bond yields will increase the defined benefit obligation although this will also be partially offset by an increase in the value of the plan’s fixed income holdings. Hence, the present value of defined benefit obligation is directly affected by the discount rate to be applied by the BPI Group. However, the BPI Group believes that due to the long-term nature of the pension liability and the strength of the BPI Group itself, the mix of debt and equity securities holdings of the plan is an appropriate element of the BPI Group’s long term strategy to manage the plan efficiently.

(32)
The BPI Group ensures that the investment positions are managed within an asset-liability matching framework that has been developed to achieve long-term investments that are in line with the obligations under the plan. The BPI Group’s main objective is to match assets to the defined benefit obligation by investing primarily in long-term debt securities with maturities that match the benefit payments as they fall due. The asset-liability matching is being monitored on a regular basis and potential change in investment mix is being discussed with the trustor, as necessary to better ensure the appropriate asset-liability matching. The average remaining service life of employees under the BPI unified retirement plan as at December 31, 2015 is 13 years (2014 - 12 years). The BPI Group contributes to the plan depending on the suggested funding contribution as calculated by an independent actuary. The expected contribution for the year ending December 31, 2015 for the BPI Group and Parent amounts to P618 million and P510 million, respectively. The projected maturity analysis of retirement benefit payments as at December 31 are as follows: Consolidated
(In Millions of Pesos) 2015 2014
Less than a year 996 868 Between 1 to 5 years 3,323 3,485 Between 5 to 10 years 5,554 4,829 Between 10 to 15 years 10,057 8,623 Between 15 to 20 years 13,359 12,962 Over 20 years 78,502 74,609
Parent
(In Millions of Pesos) 2015 2014
Less than a year 639 637 Between 1 to 5 years 2,582 2,709 Between 5 to 10 years 4,815 4,000 Between 10 to 15 years 8,651 7,558 Between 15 to 20 years 11,259 10,873 Over 20 years 62,274 54,499
The sensitivity of the defined benefit obligation as at December 31 to changes in the weighted principal assumptions follows:
Consolidated 2015
Impact on defined benefit obligation
Change in assumption
Increase in assumption Decrease in assumption
Discount rate 0.5% Decrease by 1.28% Increase by 1.32% Salary growth rate 1.0% Increase by 2.24% Decrease by 2.14%
2014
Impact on defined benefit obligation
Change in assumption
Increase in assumption Decrease in assumption
Discount rate 0.5% Decrease by 0.94% Increase by 1.52% Salary growth rate 1.0% Increase by 3.92% Decrease by 1.60%

(33)
Parent 2015
Impact on defined benefit obligation
Change in assumption
Increase in assumption Decrease in assumption
Discount rate 0.5% Decrease by 1.29% Increase by 1.32% Salary growth rate 1.0% Increase by 2.24% Decrease by 2.14%
2014
Impact on defined benefit obligation
Change in assumption
Increase in assumption Decrease in assumption
Discount rate 0.5% Decrease by 0.95% Increase by 1.55% Salary growth rate 1.0% Increase by 3.99% Decrease by 1.61%
The above sensitivity analyses are based on a change in an assumption while holding all other assumptions constant. In practice, this is unlikely to occur, and changes in some of the assumptions may be correlated. When calculating the sensitivity of the defined benefit obligation to significant actuarial assumptions, the same method (present value of the defined benefit obligation calculated with the projected unit credit method at the end of the reporting period) has been applied as when calculating the retirement liability recognized within the statement of condition. Note 26 - Trust Assets At December 31, 2015, the net asset value of trust and fund assets administered by the BPI Group amounts to P635 billion (2014 - P619 billion). Government securities deposited by the BPI Group and the Parent Bank with the BSP in compliance with the requirements of the General Banking Act relative to the trust functions follow:
Consolidated Parent
2015 2014 2015 2014
(In Millions of Pesos) Government securities 5,459 9,425 5,455 5,386
Note 27 - Related Party Transactions In the normal course of business, the Parent Bank transacts with related parties consisting of its subsidiaries and associates. Likewise, the BPI Group has transactions with Ayala Corporation (AC) and its subsidiaries (Ayala Group), where all transactions are dealt with on an arm's length basis. AC is a substantial stockholder of BPI as at reporting date. These transactions such as loans and advances, deposit arrangements, trading of government securities and commercial papers, sale of assets, lease of bank premises, investment advisory/management, service arrangements and advances for operating expenses are made in the normal banking activities and have terms and conditions that are generally comparable to those offered to non-related parties or to similar transactions in the market.
The Parent Bank has a Board-level Related Party Transaction Committee that vets and endorses all significant related party transactions, including those involving DOSRI, for which the latter shall require final Board approval. The Committee consists of four directors, three of whom are independent directors including the Chairman, and two non-voting members from management, namely, the Chief Audit Executive and the Chief Compliance Officer.

(34)
Significant related party transactions, which represent movements in the account balance, and outstanding balances as at and for the years ended December 31 are summarized below (transactions with subsidiaries have been eliminated in the consolidated financial statements): Consolidated
2015
Transactions
Outstanding balances
Terms and conditions
(In Millions of Pesos) Loans and advances from:
Subsidiaries 41 72 These are loans and advances granted to related parties that are generally secured with interest rates ranging from 1.05% to 7.60% (including those pertaining to foreign currency-denominated loans) and with maturity periods ranging from 5 days to 11 years. Additional information on DOSRI loans are discussed below.
Associates - -
AC (142) 14,108
Subsidiaries of AC 507 15,088
Key management personnel - -
Other related parties 583 1,446
989 30,714
Deposits from: Subsidiaries 1,066 7,092 These are demand, savings and time
deposits bearing the following average interest rates: Demand - 0.23% to 0.27% Savings - 0.81% to 0.82% Time - 2.00% to 2.11%
Associates (276) 713 Ayala Group (20,030) 11,361 Key management personnel (836) 1,885
(20,076) 21,051
2014
Transactions
Outstanding balances
Terms and conditions
(In Millions of Pesos) Loans and advances from:
Subsidiaries (163) 31 These are loans and advances granted to related parties that are generally secured with interest rates ranging from 0.99% to 5.49% (including those pertaining to foreign currency-denominated loans) and with maturity periods ranging from 23 days to 10 years. Additional information on DOSRI loans are discussed below.
Associates - -
AC 8,000 14,250
Subsidiaries of AC (1,484) 14,581
Key management personnel - -
Other related parties 863 863
7,216 29,725
Deposits from: Subsidiaries (910) 6,026 These are demand, savings and time
deposits bearing the following average interest rates: Demand - 0.23% to 0.24% Savings - 0.83% to 0.86% Time - 1.70% to 1.76%
Associates 317 989 Ayala Group 10,232 31,391 Key management personnel 1,707 2,721
11,346 41,127

(35)
2013
Transactions
Outstanding balances
Terms and conditions
(In Millions of Pesos) Loans and advances from:
Subsidiaries (202) 194 These are loans and advances granted to related parties that are generally secured with interest rates ranging from 0.65% to 8.04% (including those pertaining to foreign currency-denominated loans) and with maturity periods ranging from 8 days to 12 years. Additional information on DOSRI loans are discussed below.
Associates - -
AC - 6,250
Subsidiaries of AC 11,403 16,065
Key management personnel - -
11,201 22,509
Deposits from: Subsidiaries 2,885 6,936 These are demand, savings and time
deposits bearing the following average interest rates: Demand - 0.28% to 0.36% Savings - 0.70% to 0.98% Time - 2.20% to 3.25%
Associates 613 672 Ayala Group (17,910) 21,159 Key management personnel 704 1,014
(13,708) 29,781
Parent
2015
Transactions
Outstanding balances
Terms and conditions
(In Millions of Pesos) Loans and advances from:
Subsidiaries 41 72 These are loans and advances granted to related parties that are generally secured with interest rates ranging from 1.05% to 7.60% (including those pertaining to foreign currency-denominated loans) and with maturity periods ranging from 5 days to 11 years. Additional information on DOSRI loans are discussed below.
Associates - -
AC (142) 14,108
Subsidiaries of AC 507 15,088
Key management personnel - -
Other related parties 583 1,446
989 30,714
Deposits from: Subsidiaries 1,059 7,004 These are demand, savings and time
deposits bearing the following average interest rates: Demand - 0.21% to 0.26% Savings - 0.75% to 0.76% Time - 0.73% to 0.98%
Associates (264) 711 Ayala Group (19,696) 10,749 Key management personnel (695) 1,773
(19,596) 20,237
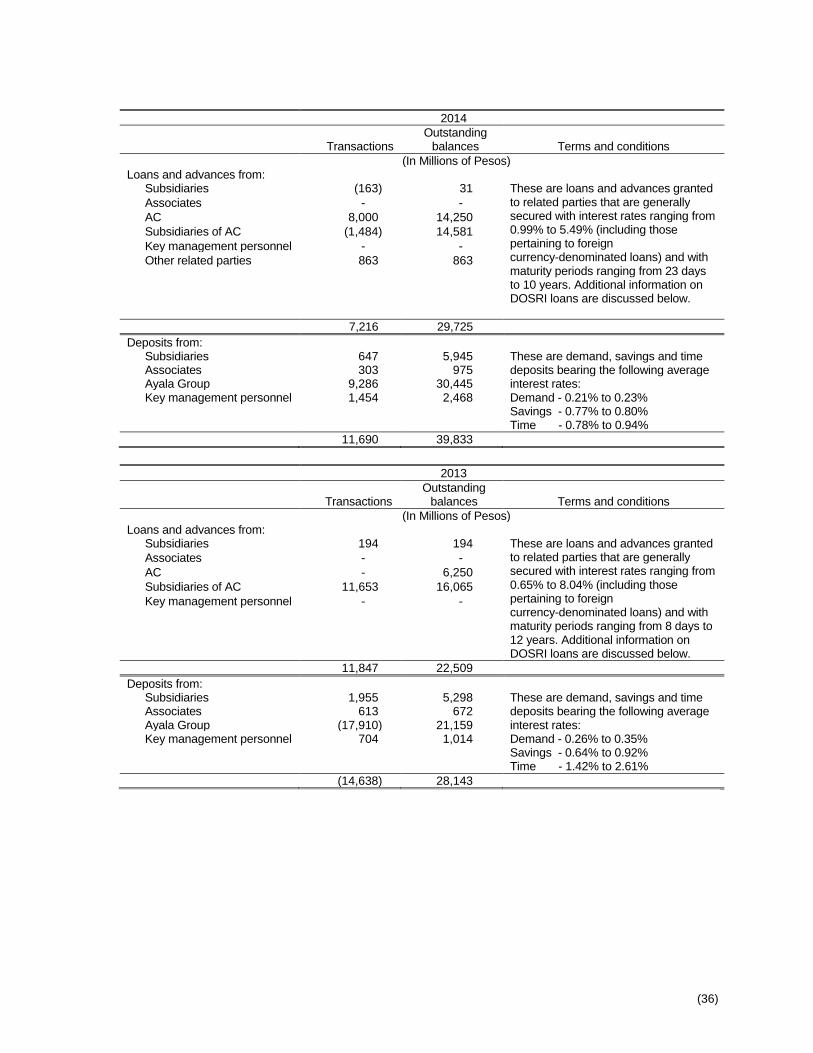
(36)
2014
Transactions
Outstanding balances
Terms and conditions
(In Millions of Pesos) Loans and advances from:
Subsidiaries (163) 31 These are loans and advances granted to related parties that are generally secured with interest rates ranging from 0.99% to 5.49% (including those pertaining to foreign currency-denominated loans) and with maturity periods ranging from 23 days to 10 years. Additional information on DOSRI loans are discussed below.
Associates - -
AC 8,000 14,250
Subsidiaries of AC (1,484) 14,581
Key management personnel - -
Other related parties 863 863
7,216 29,725
Deposits from: Subsidiaries 647 5,945 These are demand, savings and time
deposits bearing the following average interest rates: Demand - 0.21% to 0.23% Savings - 0.77% to 0.80% Time - 0.78% to 0.94%
Associates 303 975 Ayala Group 9,286 30,445 Key management personnel 1,454 2,468
11,690 39,833
2013
Transactions
Outstanding balances
Terms and conditions
(In Millions of Pesos) Loans and advances from:
Subsidiaries 194 194 These are loans and advances granted to related parties that are generally secured with interest rates ranging from 0.65% to 8.04% (including those pertaining to foreign currency-denominated loans) and with maturity periods ranging from 8 days to 12 years. Additional information on DOSRI loans are discussed below.
Associates - -
AC - 6,250
Subsidiaries of AC 11,653 16,065
Key management personnel - -
11,847 22,509
Deposits from: Subsidiaries 1,955 5,298 These are demand, savings and time
deposits bearing the following average interest rates: Demand - 0.26% to 0.35% Savings - 0.64% to 0.92% Time - 1.42% to 2.61%
Associates 613 672 Ayala Group (17,910) 21,159 Key management personnel 704 1,014
(14,638) 28,143

(37)
The aggregate amounts included in the determination of income before income tax that resulted from transactions with each class of related parties are as follows: Consolidated
2015 2014 2013
(In Millions of Pesos) Interest income
Subsidiaries 4 10 5 Associates - - - AC 474 384 127 Subsidiaries of AC 493 495 368 Key management personnel - - - Other related parties 34 16 -
1,005 905 500
Other income Subsidiaries 923 817 1,018 Associates 900 - 577 AC - 37 16 Subsidiaries of AC 12 798 (75) Key management personnel - - -
1,835 1,652 1,536
Interest expense Subsidiaries 12 10 5 Associates 2 2 3 Ayala Group 38 118 68 Key management personnel 17 20 5
69 150 81
Other expenses Subsidiaries 813 101 1,003 Associates - - - AC 81 116 175 Subsidiaries of AC 74 277 42 Key management personnel - - -
968 494 1,220
Retirement benefits Key management personnel 42 58 33
Salaries, allowances and other short-term benefits Key management personnel 602 673 701 Directors’ remuneration 74 69 57

(38)
Parent
2015 2014 2013
(In Millions of Pesos) Interest income
Subsidiaries 1 1 2 Associates - - - AC 474 384 127 Subsidiaries of AC 493 495 368 Key management personnel - - - Other related parties 34 16 -
1,002 896 497
Other income Subsidiaries 820 708 585 Associates 773 - 577 AC - - - Subsidiaries of AC 1 729 (131) Key management personnel - - -
1,594 1,437 1,031
Interest expense Subsidiaries 12 9 5 Associates 2 2 3 Ayala Group 33 115 68 Key management personnel 12 15 5
59 141 81
Other expenses Subsidiaries 80 45 900 Associates - - - AC 63 116 175 Subsidiaries of AC 74 51 42 Key management personnel - - -
217 212 1,117
Retirement benefits Key management personnel 32 49 29
Salaries, allowances and other short-term benefits Key management personnel 504 570 570 Directors’ remuneration 64 61 50
Other income mainly consists of rental income and revenue from service arrangements with related parties. Also, in November 2014, an investment property was sold to a related party for P1.59 billion resulting in a gain of P729 million. In March 2013, a loss arising from sale of an impaired investment property was recognized. Other expenses mainly consist of rental expenses and management fees. Based on the objective assessment done on related party balances, provisions have been recognized against receivables from related parties, as deemed applicable.

(39)
Details of DOSRI loans are as follows:
Consolidated Parent
2015 2014 2015 2014
(In Millions of Pesos) Outstanding DOSRI loans 15,554 18,276 15,520 18,245
In percentages (%)
Consolidated Parent
2015 2014 2015 2014
% to total outstanding loans and advances 1.76 2.25 2.31 2.90 % to total outstanding DOSRI loans Unsecured DOSRI loans 12.12 10.60 12.14 10.61 Past due DOSRI loans 0.01 0.06 0.01 0.06 Non-performing DOSRI loans - 0.05 - 0.05
At December 31, 2015 and 2014, the BPI Group is in full compliance with the General Banking Act and the BSP regulations on DOSRI loans.
Note 28 - Critical Accounting Estimates and Judgments The BPI Group makes estimates and assumptions that affect the reported amounts of assets and liabilities. Estimates and judgments are continually evaluated and are based on historical experience and other factors, including expectations of future events that are believed to be reasonable under the circumstances. It is reasonably possible that the outcomes within the next financial year could differ from assumptions made at reporting date and could result in the adjustment to the carrying amount of affected assets or liabilities. A. Critical accounting estimates (i) Impairment losses on loans and advances (Note 10) The BPI Group reviews its loan portfolios to assess impairment on a regular basis. In determining whether an impairment loss should be recorded in profit or loss, the BPI Group makes judgments as to whether there is any observable data indicating that there is a measurable decrease in the estimated future cash flows from a portfolio of loans before the decrease can be identified with an individual loan in that portfolio. This evidence may include observable data indicating that there has been an adverse change in the payment status of borrowers in a group, or national or local economic conditions that correlate with defaults on assets in the group. Management uses estimates based on historical loss experience for loans with credit risk characteristics and objective evidence of impairment similar to those in the portfolio when scheduling its future cash flows. The methodology and assumptions used for estimating both the amount and timing of future cash flows are reviewed regularly to reduce any differences between loss estimates and actual loss experience. To the extent that the net present value of estimated cash flows of individually impaired accounts and the estimated impairment for collectively assessed accounts differs by +/- 5%, impairment provision for the year ended December 31, 2015 would be an estimated P431 million (2014 - P524 million) higher or lower. (ii) Fair value of derivatives and other financial instruments (Notes 6 and 29.4) The fair values of financial instruments that are not quoted in active markets are determined by using generally accepted valuation techniques. Where valuation techniques (for example, discounted cash flow models) are used to determine fair values, they are validated and periodically reviewed by qualified personnel independent of the area that created them. Inputs used in these models are from observable data and quoted market prices in respect of similar financial instruments. All models are approved by the Board of Directors before they are used, and models are calibrated to ensure that outputs reflect actual data and comparative market prices. Changes in assumptions about these factors could affect reported fair value of financial instruments. The BPI Group considers that it is impracticable to disclose with sufficient reliability the possible effects of sensitivities surrounding the fair value of financial instruments that are not quoted in active markets.

(40)
(iii) Pension liability on defined benefit plan (Note 25) The BPI Group estimates its pension benefit obligation and expense for defined benefit pension plans based on the selection of certain assumptions used by actuaries in calculating such amounts. Those assumptions are described in Note 25 and include, among others, the discount rate and future salary increases. The BPI Group determines the appropriate discount rate at the end of each year. This is the interest rate that should be used to determine the present value of estimated future cash outflows expected to be required to settle the retirement obligations. The present value of the defined benefit obligations of the BPI Group at December 31, 2015 and 2014 are determined using the market yields on Philippine government bonds with terms consistent with the expected payments of employee benefits. Plan assets are invested in either equity securities, debt securities or other forms of investments. Equity markets may experience volatility, which could affect the value of pension plan assets. This volatility may make it difficult to estimate the long-term rate of return on plan assets. Actual results that differ from the BPI Group’s assumptions are reflected as remeasurements in other comprehensive income. The BPI Group’s assumptions are based on actual historical experience and external data regarding compensation and discount rate trends. The sensitivity analysis on key assumptions is disclosed in Note 25. (iv) Valuation of assets held for sale In determining the fair value of assets held for sale, the BPI Group analyzed the sales prices by applying appropriate units of comparison, adjusted by differences between the subject asset or property and related market data. Should there be a subsequent write-down of the asset to fair value less cost to sell, such write-down is recognized as impairment loss in the statement of income. In 2015, the BPI Group has recognized reversal of impairment loss on its foreclosed assets amounting to P308 million as a result of improvement in fair market values of properties (2014 - provision of P65 million due to reduction in fair market values). The BPI Group considers that it is impracticable to disclose with sufficient reliability the possible effects of sensitivities surrounding the fair value of assets held for sale. B. Critical accounting judgments (i) Impairment of available-for-sale securities (Note 8) The BPI Group follows the guidance of PAS 39 to determine when an available-for-sale security is impaired. This determination requires significant judgment. In making this judgment, the BPI Group evaluates, among other factors, the duration and extent to which the fair value of an investment is less than its cost; and the financial health and near-term business outlook of the issuer, including factors such as industry and sector performance, changes in technology and operational and financing cash flows. (ii) Classification of held-to-maturity securities (Note 9) The BPI Group follows the guidance of PAS 39 in classifying non-derivative financial assets with fixed or determinable payments and fixed maturity as held-to-maturity. This classification requires significant judgment. In making this judgment, the BPI Group evaluates its intention and ability to hold such investments to maturity. If the BPI Group fails to keep these investments to maturity other than for the specific circumstances - for example selling an insignificant amount close to maturity - it will be required to reclassify the entire class as available-for-sale. The investments would therefore be measured at fair value and not at amortized cost. (iii) Classification of assets held for sale Management follows the principles in PFRS 5 in classifying certain foreclosed assets (consisting of real estate and auto or chattel) as assets held for sale when the carrying amount of the assets will be recovered principally through sale. Management is committed to a plan to sell these foreclosed assets and the assets are actively marketed for sale at a price that is reasonable in relation to their current fair value. (iv) Realization of deferred income tax assets (Note 14) Management reviews at each reporting date the carrying amounts of deferred tax assets. The carrying amount of deferred tax assets is reduced to the extent that the related tax assets cannot be utilized due to insufficient taxable profit against which the deferred tax losses will be applied. Management believes that sufficient taxable profit will be generated to allow all or part of the deferred income tax assets to be utilized.

(41)
Note 29 - Financial Risk and Capital Management Risk management in the BPI Group covers all perceived areas of risk exposure, even as it continuously endeavors to identify and manage new and emerging risks. Capital management is understood to be a facet of risk management. The primary objective of the BPI Group is the generation of recurring acceptable returns to shareholders’ capital. To this end, the BPI Group’s policies, business strategies and activities are directed towards the generation of cash flows that are in excess of its fiduciary and contractual obligations to its depositors, and to its various funders and stakeholders. To generate acceptable returns to its shareholders’ capital, the BPI Group understands that it has to bear risk, and that risk-taking is inherent in its business. Risk is understood by the BPI Group as the uncertainty in its future income - an uncertainty that emanates from the possibility of incurring losses that are due to unplanned and unexpected drops in revenues, increases in expenses, impairment of asset values, or increases in liabilities. The possibility of incurring losses is, however, compensated by the possibility of earning more than expected income. Risk-taking is, therefore, not entirely negative to be avoided. Risk-taking actions present opportunities if risks are fully identified and accounted, deliberately taken, and are kept within prudent and rationalized limits. Enterprise Risk Management Framework BPI espouses a comprehensive risk management and capital management framework, which integrates the management of all its financial and non-financial risk exposures. The framework conforms not only to BPI’s own rigorous standards, but also to BSP’s directives in promoting an effective Internal Capital Adequacy Assessment Process (ICAAP) and other risk management processes. The framework also ensures that BPI has adequate liquidity and capital to mitigate risks. The framework focuses on three key components consisting of: Sound risk management governance;
Effective processes, information systems, and controls; and
Timely and reliable risk data. The Board of Directors carries out its risk management function through the Risk Management Committee (RMC) of the Board. The RMC is tasked with nurturing a culture of risk management across the enterprise. The RMC sets the risk appetite; proposes and approves risk management policies, frameworks, and guidelines; and regularly reviews risk management structures, metrics, limits, and issues across the BPI Group, in order to meet and comply with regulatory and international standards on risk measurement and management. At the management level, the Risk Management Office is headed by the Chief Risk Officer (CRO). The CRO is ultimately responsible in leading the formulation of risk management policies and methodologies in alignment with the overall business strategy of BPI, ensuring that risks are prudently and rationally undertaken and within its risk appetite, as well as commensurate and disciplined to maximize returns on shareholders' capital. Risk management is carried out by a dedicated team of skilled risk managers and senior officers who have extensive prior operational experience. BPI’s risk managers regularly monitor key risk indicators and report exposures against carefully established financial and business risk metrics and limits approved by the RMC. Finally, independent reviews are regularly conducted by the Internal Audit group, regulatory examiners, and external auditors to ensure that risk controls and mitigants are in place and functioning effectively as intended. The most important risks that the BPI Group manages are credit risk, liquidity risk, market risk and operational and information technology (IT) risks.

(42)
29.1 Credit risk The BPI Group takes on exposure to credit risk, which is the risk that a counterparty will cause a financial loss to the BPI Group by failing to discharge an obligation. Significant changes in the economy, or in the prospects of a particular industry segment that may represent a concentration in the BPI Group’s portfolio, could result in losses that are different from those provided for at the reporting date. Management therefore carefully manages its exposure to credit risk. Credit exposures arise principally in loans and advances, debt securities and other bills. There is also credit risk in off-balance sheet financial arrangements. The Credit Policy and Risk Management Division supports the Credit Committee in managing credit risk, and reports are regularly provided to the Board of Directors. 29.1.1 Credit risk management
(a) Loans and advances
In measuring credit risk of loans and advances at a counterparty level, the BPI Group considers three components: (i) the probability of default by the client or counterparty on its contractual obligations; (ii) current exposures to the counterparty and its likely future development; and (iii) the likely recovery ratio on the defaulted obligations. In the evaluation process, the BPI Group also considers the conditions of the industry/sector to which the counterparty is exposed, other existing exposures to the group where the counterparty may be related, as well as the client and the BPI Group’s fallback position assuming the worst-case scenario. Outstanding and potential credit exposures are reviewed to likewise ensure that they conform to existing internal credit policies.
The BPI Group assesses the probability of default of individual counterparties using internal rating tools tailored to the various categories of counterparty. The BPI Group has internal credit risk rating systems, designed for corporate, small and medium-sized enterprises (SMEs), and retail accounts, that measure the borrower's credit risk based on quantitative and qualitative factors. The ratings of individual exposures may subsequently migrate between classes as the assessment of their probabilities of default changes. For retail, the consumer credit scoring system is a formula-based model for evaluating each credit application against a set of characteristics that experience has shown to be relevant in predicting repayment. The BPI Group regularly validates the performance of the rating systems and their predictive power with regard to default events, and enhances them if necessary. The BPI Group's internal ratings are mapped to the following standard BSP classifications: Unclassified - these are loans that do not have a greater-than-normal risk and do not possess the
characteristics of loans classified below. The counterparty has the ability to satisfy the obligation in full and therefore minimal loss, if any, is anticipated.
Loans especially mentioned - these are loans that have potential weaknesses that deserve management’s close attention. These potential weaknesses, if left uncorrected, may affect the repayment of the loan and thus increase the credit risk of the BPI Group.
Substandard - these are loans which appear to involve a substantial degree of risk to the BPI Group because
of unfavorable record or unsatisfactory characteristics. Further, these are loans with well-defined weaknesses which may include adverse trends or development of a financial, managerial, economic or political nature, or a significant deterioration in collateral.
Doubtful - these are loans which have the weaknesses similar to those of the substandard classification with added characteristics that existing facts, conditions, and values make collection or liquidation in full highly improbable and substantial loss is probable.
Loss - these are loans which are considered uncollectible and of such little value that their continuance as bankable assets is not warranted although the loans may have some recovery or salvage value.
(b) Debt securities and other bills
For debt securities and other bills, external ratings such as Standard & Poor’s, Moody’s and Fitch’s ratings or their equivalents are used by the BPI Group for managing credit risk exposures. Investments in these securities and bills are viewed as a way to gain better credit quality mix and at the same time, maintain a readily available source to meet funding requirements.

(43)
29.1.2 Risk limit control and mitigation policies The BPI Group manages, limits and controls concentrations of credit risk wherever they are identified - in particular, to individual counterparties and groups, to industries and sovereigns. The BPI Group structures the levels of credit risk it undertakes by placing limits on the amount of risk accepted in relation to one borrower, or groups of borrowers, and to geographical and industry segments. Such risks are monitored on a regular basis and subjected to annual or more frequent review, when considered necessary. Limits on large exposures and credit concentration are approved by the Board of Directors. The exposure to any one borrower is further restricted by sub-limits covering on- and off-balance sheet exposures. Actual exposures against limits are monitored regularly. Exposure to credit risk is also managed through regular analysis of the ability of existing and potential borrowers to meet interest and capital repayment obligations and by changing these lending limits where appropriate. Settlement risk arises in any situation where a payment in cash, securities, foreign exchange currencies, or equities is made in the expectation of a corresponding receipt in cash, securities, foreign exchange currencies, or equities. Daily settlement limits are established for each counterparty to cover the aggregate of all settlement risk arising from the BPI Group’s market transactions on any single day. The introduction of the delivery versus payment facility in the local market has brought down settlement risk significantly. The BPI Group employs a range of policies and practices to mitigate credit risk. Some of these specific control and mitigation measures are outlined below. (a) Collateral
One of the most traditional and common practice in mitigating credit risk is requiring security particularly for loans and advances. The BPI Group implements guidelines on the acceptability of specific classes of collateral for credit risk mitigation. The principal collateral types for loans and advances are: Mortgages over real estate properties and chattels; and
Hold-out on financial instruments such as debt securities deposits, and equities In order to minimize credit loss, the BPI Group seeks additional collateral from the counterparty when impairment indicators are observed for the relevant individual loans and advances.
(b) Derivatives The BPI Group maintains strict market limits on net open derivative positions (i.e., the difference between purchase and sale contracts). Credit risk is limited to the net current fair value of instruments, which in relation to derivatives is only a small fraction of the contract, or notional values used to express the volume of instruments outstanding. This credit risk exposure is managed as part of the overall lending limits with customers, together with potential exposures from market movements. Collateral or other security is not usually obtained for credit risk exposures on these instruments (except where the BPI Group requires margin deposits from counterparties).
(c) Master netting arrangements The BPI Group further restricts its exposure to credit losses by entering into master netting arrangements with counterparties with which it undertakes a significant volume of transactions. Master netting arrangements do not generally result in an offset of balance sheet assets and liabilities, as transactions are usually settled on a gross basis. However, the credit risk associated with favorable contracts (asset position) is reduced by a master netting arrangement to the extent that if a default occurs, all amounts with the counterparty are terminated and settled on a net basis. The BPI Group’s overall exposure to credit risk on derivative instruments subject to master netting arrangements can change substantially within a short period, as it is affected by each transaction subject to the arrangement.

(44)
(d) Credit-related commitments The primary purpose of these instruments is to ensure that funds are available to a customer as required. Standby letters of credit carry the same credit risk as loans. Documentary and commercial letters of credit - which are written undertakings by the BPI Group on behalf of a customer authorizing a third party to draw drafts on the BPI Group up to a stipulated amount under specific terms and conditions - are collateralized by the underlying shipments of goods to which they relate and therefore carry less risk than a direct loan. Commitments to extend credit represent unused portions of authorizations to extend credit in the form of loans, or letters of credit. With respect to credit risk on commitments to extend credit, the BPI Group is potentially exposed to loss in an amount equal to the total unused commitments. However, the likely amount of loss is less than the total unused commitments, as most commitments to extend credit are contingent upon customers maintaining specific credit standards. The BPI Group monitors the term to maturity of credit commitments because longer-term commitments generally have a greater degree of credit risk than shorter-term commitments. 29.1.3 Impairment and provisioning policies As described in Note 29.1.1, the BPI Group’s credit-quality mapping on loans and advances is based on the standard BSP loan classifications. Impairment provisions are recognized for financial reporting purposes based on objective evidence of impairment (Note 32.9). The table below shows the percentage of the BPI Group’s loans and advances and the related allowance for impairment.
Consolidated
2015 2014
Loans and
advances (%)
Allowance for
impairment (%)
Loans and
advances (%)
Allowance for
impairment (%)
Unclassified 98.12 0.91 98.14 0.77
Loans especially mentioned 0.20 5.03 0.26 5.35
Substandard 0.69 21.19 0.64 21.19
Doubtful 0.54 63.75 0.45 63.85
Loss 0.45 100.00 0.51 100.00
100.00 100.00
Parent
2015 2014
Loans and
advances (%)
Allowance for
impairment (%)
Loans and
advances (%)
Allowance for
impairment (%)
Unclassified 98.67 0.85 98.61 0.75
Loans especially mentioned 0.11 6.59 0.16 6.75
Substandard 0.58 22.53 0.55 21.23
Doubtful 0.15 72.56 0.25 72.32
Loss 0.49 100.00 0.43 100.00
100.00 100.00

(45)
29.1.4 Maximum exposure to credit risk before collateral held or other credit enhancements Credit risk exposures relating to significant on-balance sheet financial assets are as follows:
Consolidated Parent
2015 2014 2015 2014
(In Millions of Pesos) Due from BSP 214,960 211,946 174,370 170,648 Due from other banks 22,238 22,227 17,181 15,429 Interbank loans receivable and securities
purchased under agreements to resell (SPAR) 12,902 5,782 6,163 5,246 Financial assets at fair value through profit or loss Derivative financial assets 4,529 35,981 4,529 35,981 Trading securities - debt securities 7,762 15,247 5,442 6,620 Available-for-sale - debt securities 40,634 47,484 36,410 41,604 Held-to-maturity securities 244,809 209,409 225,077 193,001 Loans and advances, net 872,861 800,170 664,619 621,441 Other financial assets Accounts receivable, net 1,784 1,489 1,130 1,063 Other accrued interest and fees receivable 704 661 644 613 Sales contracts receivable, net - 39 - -
Rental deposits 403 366 336 304 Others, net 402 425 353 387
1,423,988 1,351,226 1,136,254 1,092,337
Credit risk exposures relating to off-balance sheet items are as follows:
Consolidated Parent
2015 2014 2015 2014
(In Millions of Pesos) Undrawn loan commitments 108,104 154,257 97,418 148,215 Bills for collection 14,341 13,686 14,338 13,679 Unused letters of credit 10,953 12,196 10,953 12,196 Others 948 1,213 948 1,213
134,346 181,352 123,657 175,303
The preceding table represents the maximum credit risk exposure at December 31, 2015 and 2014, without taking into account any collateral held or other credit enhancements. For on-balance-sheet assets, the exposures set out above are based on net carrying amounts as reported in the statement of condition. Management is confident in its ability to continue to control and sustain minimal exposure to credit risk of the BPI Group resulting from its loan and advances portfolio based on the following:
98% of the loans and advances portfolio is considered to be neither past due nor impaired (2014 - 98%);
Mortgage loans are backed by collateral; and
The BPI Group continues to implement stringent selection process of granting loans and advances.

(46)
29.1.5 Credit quality of loans and advances Loans and advances are summarized as follows:
Consolidated Parent
2015 2014 2015 2014
(In Millions of Pesos) Neither past due nor impaired 868,886 793,702 663,514 617,395 Past due but not impaired 3,530 5,407 2,824 4,454 Impaired 16,807 14,767 8,905 8,770
889,223 813,876 675,243 630,619 Allowance for impairment (16,362) (13,706) (10,624) (9,178)
872,861 800,170 664,619 621,441
Impaired category as shown in the table above includes loan accounts which are individually (Note 29.1.5c) and collectively assessed for impairment. The total consolidated impairment provision for loans and advances is P4,099 million (2014 - P2,990 million), of which P649 million (2014 - P1,703 million) represents provision for individually impaired loans and the remaining amount of P3,450 million (2014 - P1,287 million) represents the portfolio provision. Further information of the impairment allowance for loans and advances is provided in Note 10.
When entering into new markets or new industries, the BPI Group focuses on corporate accounts and retail customers with good credit rating and customers providing sufficient collateral, where appropriate or necessary. Collaterals held as security for Loans and advances are described in Note 10. (a) Loans and advances neither past due nor impaired Loans and advances that were neither past due nor impaired consist mainly of accounts with Unclassified rating and those loan accounts in a portfolio to which an impairment has been allocated on a collective basis. Details of these accounts follow:
Consolidated Parent
2015 2014 2015 2014
(In Millions of Pesos) Corporate entities:
Large corporate customers 605,940 554,372 578,779 534,073 Small and medium enterprises 87,902 88,178 51,725 55,258
Retail customers: Credit cards 29,987 25,712 29,501 25,367 Real estate mortgages 96,484 83,237 24 26 Auto loans 43,537 36,395 - -
Others 5,036 5,808 3,485 2,671
868,886 793,702 663,514 617,395
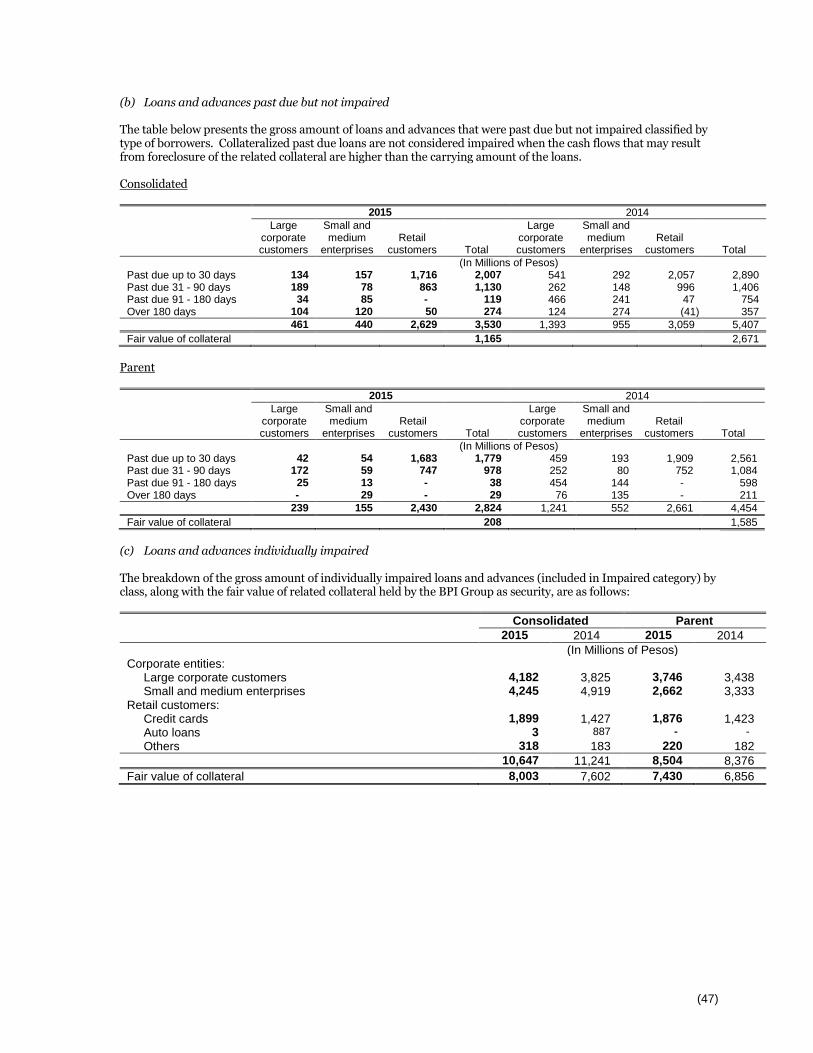
(47)
(b) Loans and advances past due but not impaired The table below presents the gross amount of loans and advances that were past due but not impaired classified by type of borrowers. Collateralized past due loans are not considered impaired when the cash flows that may result from foreclosure of the related collateral are higher than the carrying amount of the loans. Consolidated
2015 2014
Large corporate customers
Small and medium
enterprises
Retail
customers
Total
Large corporate customers
Small and medium
enterprises
Retail
customers
Total
(In Millions of Pesos) Past due up to 30 days 134 157 1,716 2,007 541 292 2,057 2,890 Past due 31 - 90 days 189 78 863 1,130 262 148 996 1,406 Past due 91 - 180 days 34 85 - 119 466 241 47 754 Over 180 days 104 120 50 274 124 274 (41) 357
461 440 2,629 3,530 1,393 955 3,059 5,407
Fair value of collateral 1,165 2,671
Parent
2015 2014
Large corporate customers
Small and medium
enterprises
Retail
customers
Total
Large corporate customers
Small and medium
enterprises
Retail
customers
Total
(In Millions of Pesos) Past due up to 30 days 42 54 1,683 1,779 459 193 1,909 2,561 Past due 31 - 90 days 172 59 747 978 252 80 752 1,084 Past due 91 - 180 days 25 13 - 38 454 144 - 598 Over 180 days - 29 - 29 76 135 - 211
239 155 2,430 2,824 1,241 552 2,661 4,454
Fair value of collateral 208 1,585
(c) Loans and advances individually impaired The breakdown of the gross amount of individually impaired loans and advances (included in Impaired category) by class, along with the fair value of related collateral held by the BPI Group as security, are as follows:
Consolidated Parent
2015 2014 2015 2014
(In Millions of Pesos) Corporate entities:
Large corporate customers 4,182 3,825 3,746 3,438 Small and medium enterprises 4,245 4,919 2,662 3,333
Retail customers: Credit cards 1,899 1,427 1,876 1,423 Auto loans 3 887 - -
Others 318 183 220 182
10,647 11,241 8,504 8,376
Fair value of collateral 8,003 7,602 7,430 6,856

(48)
29.1.6 Credit quality of other financial assets (a) Due from BSP
Due from BSP are considered fully performing at December 31, 2015 and 2014. This account consists of:
Consolidated Parent
2015 2014 2015 2014
(In Millions of Pesos) Clearing account 194,507 173,954 174,370 156,348 Special deposit accounts (SDA) 20,453 37,992 - 14,300
214,960 211,946 174,370 170,648
(b) Due from other banks Due from other banks are considered fully performing at December 31, 2015 and 2014. The table below presents the credit ratings of counterparty banks based on Standard & Poor’s.
Consolidated Parent
2015 2014 2015 2014
(In Millions of Pesos) AA- to AA+ 2,524 2,954 2,524 2,954 A- to A+ 15,641 15,818 11,755 11,628 Lower than A- 1,808 45 1,777 44 Unrated 2,265 3,410 1,125 803
22,238 22,227 17,181 15,429
(c) Interbank loans receivable and securities purchased under agreement to resell Interbank loans receivable are considered fully performing at December 31, 2015 and 2014. The table below presents the credit ratings of counterparty banks based on Standard & Poor’s.
Consolidated Parent
2015 2014 2015 2014
(In Millions of Pesos) A- to A+ 1,882 - 1,882 - Lower than A- - - - - Unrated 4,507 5,282 4,281 5,246
6,389 5,282 6,163 5,246
Securities purchased under agreements to resell includes reverse repurchase agreements amounting to P6,513 million and nil for the BPI Group and Parent Bank, respectively (2014 - P500 million and nil for the BPI Group and Parent Bank respectively), which are made with a sovereign counterparty and are considered fully performing.

(49)
(d) Derivative financial assets The table below presents the Standard & Poor’s credit ratings of counterparties for derivative financial assets at December 31, 2015 and 2014 presented in the consolidated and parent financial statements.
Consolidated and Parent
2015 2014
(In Millions of Pesos)
AA- to AA+ 1,217 383
A- to A+ 2,904 35,536
Lower than A- 91 33
Unrated 317 29
4,529 35,981
(e) Debt securities, treasury bills and other government securities
The table below presents the ratings of debt securities, treasury bills and other government securities at December 31, 2015 and 2014 based on Standard & Poor’s:
Consolidated Parent
Trading
securities
Available-
for-sale
Held-to-
maturity
Total
Trading
securities
Available-
for-sale
Held-to-
maturity
Total
(In Millions of Pesos)
AAA 72 105 785 962 - - 785 785
AA- to AA+ 6,814 27,186 4,831 38,831 4,698 26,518 3,979 35,195
A- to A+ - 5,757 19,089 24,846 - 5,009 19,089 24,098
Lower than A- 876 5,605 218,856 225,337 744 4,883 199,977 205,604
Unrated - 1,981 1,248 3,229 - - 1,247 1,247
At December 31, 2015 7,762 40,634 244,809 293,205 5,442 36,410 225,077 266,929
Consolidated Parent
Trading
securities
Available-
for-sale
Held-to-
maturity
Total
Trading
securities
Available-
for-sale
Held-to-
maturity
Total
(In Millions of Pesos)
AAA 1,521 212 280 2,013 1,521 194 173 1,888
AA- to AA+ 1,251 6,011 5,438 12,700 1,251 5,887 5,153 12,291
A- to A+ 122 6,327 4,845 11,294 122 5,395 4,351 9,868
Lower than A- 12,090 32,962 196,608 241,660 3,632 28,369 181,379 213,380
Unrated 263 1,972 2,238 4,473 94 1,759 1,945 3,798
At December 31, 2014 15,247 47,484 209,409 272,140 6,620 41,604 193,001 241,225
(f) Other financial assets The BPI Group’s other financial assets (shown under Other resources) at December 31, 2015 and 2014 consist mainly of sales contracts receivable, accounts receivable, accrued interest and fees receivable from various unrated counterparties with good credit standing.
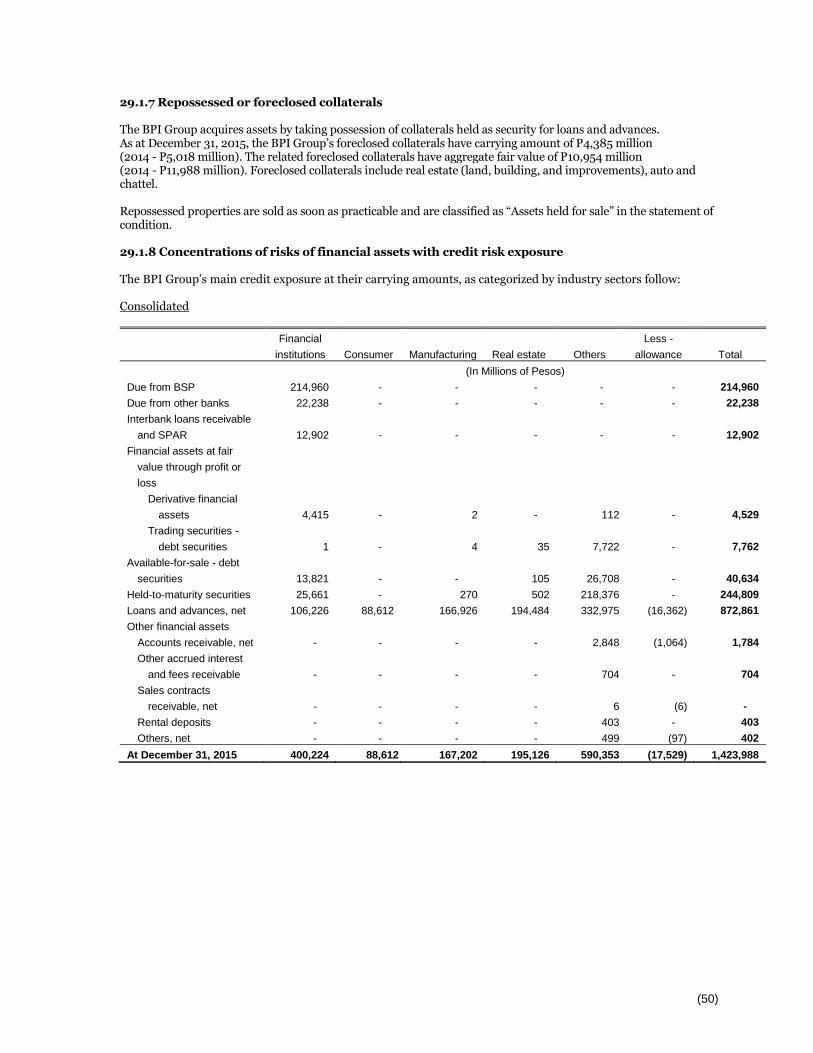
(50)
29.1.7 Repossessed or foreclosed collaterals The BPI Group acquires assets by taking possession of collaterals held as security for loans and advances. As at December 31, 2015, the BPI Group’s foreclosed collaterals have carrying amount of P4,385 million (2014 - P5,018 million). The related foreclosed collaterals have aggregate fair value of P10,954 million (2014 - P11,988 million). Foreclosed collaterals include real estate (land, building, and improvements), auto and chattel. Repossessed properties are sold as soon as practicable and are classified as “Assets held for sale” in the statement of condition. 29.1.8 Concentrations of risks of financial assets with credit risk exposure The BPI Group’s main credit exposure at their carrying amounts, as categorized by industry sectors follow: Consolidated
Financial
institutions Consumer Manufacturing Real estate Others
Less -
allowance Total
(In Millions of Pesos)
Due from BSP 214,960 - - - - - 214,960
Due from other banks 22,238 - - - - - 22,238
Interbank loans receivable
and SPAR 12,902 - - - - - 12,902
Financial assets at fair
value through profit or
loss
Derivative financial
assets 4,415 - 2 - 112 - 4,529
Trading securities -
debt securities 1 - 4 35 7,722 - 7,762
Available-for-sale - debt
securities 13,821 - - 105 26,708 - 40,634
Held-to-maturity securities 25,661 - 270 502 218,376 - 244,809
Loans and advances, net 106,226 88,612 166,926 194,484 332,975 (16,362) 872,861
Other financial assets
Accounts receivable, net - - - - 2,848 (1,064) 1,784
Other accrued interest
and fees receivable - - - - 704 - 704
Sales contracts
receivable, net - - - - 6 (6) -
Rental deposits - - - - 403 - 403
Others, net - - - - 499 (97) 402
At December 31, 2015 400,224 88,612 167,202 195,126 590,353 (17,529) 1,423,988

(51)
Financial
institutions Consumer Manufacturing Real estate Others
Less -
allowance Total
(In Millions of Pesos)
Due from BSP 211,946 - - - - - 211,946
Due from other banks 22,227 - - - - - 22,227
Interbank loans receivable
and SPAR 5,782 - - - - - 5,782
Financial assets at fair
value through profit or
loss
Derivative financial
assets 35,941 - 10 - 30 - 35,981
Trading securities -
debt securities 372 - 6 36 14,833 - 15,247
Available-for-sale - debt
securities 14,814 92 - 209 32,369 - 47,484
Held-to-maturity securities 7,953 - - 502 200,954 - 209,409
Loans and advances, net 95,550 74,991 167,908 179,477 295,950 (13,706) 800,170
Other financial assets
Accounts receivable, net - - - - 2,526 (1,037) 1,489
Other accrued interest
and fees receivable - - - - 661 - 661
Sales contracts
receivable, net - - - - 49 (10) 39
Rental deposits - - - - 366 - 366
Others, net - - - - 523 (98) 425
At December 31, 2014 394,585 75,083 167,924 180,224 548,261 (14,851) 1,351,226

(52)
Parent
Financial
institutions Consumer Manufacturing Real estate Others
Less -
allowance Total
(In Millions of Pesos)
Due from BSP 174,370 - - - - - 174,370
Due from other banks 17,181 - - - - - 17,181
Interbank loans receivable
and SPAR 6,163 - - - - - 6,163
Financial assets at fair
value through profit or
loss
Derivative financial
assets 4,415 - 2 - 112 - 4,529
Trading securities -
debt securities - - - - 5,442 - 5,442
Available-for-sale - debt
securities 10,947 - - - 25,463 - 36,410
Held-to-maturity securities 23,711 - 270 502 200,594 - 225,077
Loans and advances, net 104,446 38,208 160,751 84,730 287,108 (10,624) 664,619
Other financial assets
Accounts receivable, net - - - - 1,983 (853) 1,130
Other accrued interest
and fees receivable - - - - 644 - 644
Sales contracts
receivable, net - - - - 6 (6) -
Rental deposits - - - - 336 - 336
Others, net - - - - 443 (90) 353
At December 31, 2015 341,233 38,208 161,023 85,232 522,131 (11,573) 1,136,254

(53)
Financial
institutions Consumer Manufacturing Real estate Others
Less -
allowance Total
(In Millions of Pesos)
Due from BSP 170,648 - - - - - 170,648
Due from other banks 15,429 - - - - - 15,429
Interbank loans receivable
and SPAR 5,246 - - - - - 5,246
Financial assets at fair
value through profit or
loss
Derivative financial
assets 35,941 - 10 - 30 - 35,981
Trading securities -
debt securities 351 - - - 6,269 - 6,620
Available-for-sale - debt
securities 13,562 92 - 199 27,751 - 41,604
Held-to-maturity securities 6,826 - - 502 185,673 193,001
Loans and advances, net 93,098 32,940 163,173 86,753 254,655 (9,178) 621,441
Other financial assets
Accounts receivable, net - - - - 1,964 (901) 1,063
Other accrued interest
and fees receivable - - - - 613 - 613
Sales contracts
receivable, net - - - - 10 (10) -
Rental deposits - - - - 304 - 304
Others, net - - - - 477 (90) 387
At December 31, 2014 341,101 33,032 163,183 87,454 477,746 (10,179) 1,092,337
Trading, available-for-sale and held-to-maturity securities under “Others” category include local and US treasury bills. Likewise, Loans and advances under the same category pertain to loans granted to individual and retail borrowers belonging to various industry sectors. 29.2 Market risk The BPI Group is exposed to market risk - the risk that the fair value or future cash flows of a financial instrument will fluctuate because of changes in market prices. Market risk is managed by the RMO guided by policies and procedures approved by the RMC and confirmed by the Executive Committee/Board of Directors. Market risk management Market risk management is incumbent on the Board of Directors through the RMC. Market risk management in BPI covers managing exposures to trading risk, foreign exchange risk, counterparty credit risk, interest rate risk of the banking book and liquidity risk. At the management level, the Bank’s market risk exposures are managed by the Risk Management Office (RMO), headed by the Bank’s Chief Risk Officer (CRO) who reports directly to the RMC. In addition, Internal Audit is responsible for the independent review of risk assessment measures and procedures and the control environment. The BPI Group reviews and controls market risk exposures of both its trading and non-trading portfolios. Trading portfolios include those positions arising from the BPI Group’s market-making transactions. Non-trading portfolios primarily arise from the interest rate management of the BPI Group’s retail and commercial banking assets and liabilities. As part of the management of market risk, the BPI Group undertakes various hedging strategies. The BPI Group also enters into interest rate swaps to match the interest rate risk associated with fixed-rate long-term debt securities.

(54)
Value-at-Risk (VaR) measurement is an integral part of the BPI Group’s market risk control system. This metric estimates, at 99% confidence level, the maximum loss that a trading portfolio may incur over a trading day. This metric indicates as well that there is 1% statistical probability that the trading portfolios’ actual loss would be greater than the computed VaR. In order to ensure model soundness, the VaR is periodically subject to model validation and back testing. VaR is supplemented by other risk metrics and measurements that would provide preliminary signals to Treasury and to the management to assess the vulnerability of Bank’s positions. To control the risk, the RMC sets risk limits for trading portfolios which are consistent with the Bank’s goals, objectives, risk appetite, and strategies. Stress tests indicate the potential losses that could arise in extreme conditions that would have detrimental effect to the Bank’s positions. The Bank periodically performs stress testing (price risk and liquidity risk) to assess the Bank’s condition on assumed stress scenarios. Contingency plans are frequently reviewed to ensure the Bank’s preparedness in the event of real stress. Results of stress tests are reviewed by Senior Management and by the RMC. The average daily VaR for the trading portfolios are as follows:
Consolidated Parent
2015 2014 2015 2014
(In Millions of Pesos)
Local fixed-income 171 230 150 206
Foreign fixed-income 118 66 102 63
Foreign exchange 70 44 42 14
Derivatives 54 75 54 75
Equity securities 42 26 - -
Mutual fund 4 19 - -
459 460 348 358

(55)
29.2.1 Foreign exchange risk Foreign exchange risk is the risk that the fair value or future cash flows of financial instrument will fluctuate because of changes in foreign exchange rates. It arises on financial instruments that are denominated in a foreign currency other than the functional currency which they are measured. Foreign currency risk does not arise from financial instruments that are non-monetary items or from financial instruments denominated in an entity's functional currency. The BPI Group takes on exposure to the effects of fluctuations in the prevailing exchange rates on its foreign currency financial position and cash flows. The table below summarizes the BPI Group’s exposure to more material foreign currency exchange rate risk at December 31, 2015 and 2014. Included in the table are the BPI Group’s financial instruments at carrying amounts, categorized by currency. Consolidated
USD
JPY
EUR
GBP
Less -
allowance
Total
(In Millions of Pesos)
As at December 31, 2015
Financial Assets
Cash and other cash items 1,912 102 119 22 - 2,155
Due from other banks 14,691 1,312 1,836 1,331 - 19,170
Interbank loans receivable and
SPAR 4,985 - - 323 - 5,308
Financial assets at fair value
through profit or loss
Derivative financial assets 2,783 - 41 37 - 2,861
Trading securities 7,534 - - - - 7,534
Available-for-sale securities 37,313 - 5 - - 37,318
Held-to-maturity securities 59,182 - 1,509 915 - 61,606
Loans and advances, net 91,311 340 310 31 (469) 91,523
Others financial assets
Accounts receivable, net 78 - 11 4 (15) 78
Other accrued interest and
fees receivable 246 - 97
43 - 386
Others - - - - - -
Total financial assets 220,035 1,754 3,928 2,706 (484) 227,939
Financial Liabilities
Deposit liabilities 199,776 1,381 3,570 1,375 - 206,102
Derivative financial liabilities 1,820 - 39 40 - 1,899
Bills payable 13,889 - 41 - - 13,930
Due to BSP and other banks 224 - - - - 224
Manager’s checks and demand
drafts outstanding 21 - 12 1 - 34
Other financial liabilities
Accounts payable 119 - 12 1 - 132
Others - - - - - -
Total financial liabilities 215,849 1,381 3,674 1,417 - 222,321
Net on-balance sheet financial
position (in Philippine Peso) 4,186 373 254 1,289 (484) 5,618

(56)
USD
JPY
EUR
GBP
Less -
allowance
Total
(In Millions of Pesos)
As at December 31, 2014
Financial Assets
Cash and other cash items 1,815 72 79 16 - 1,982
Due from other banks 13,520 755 2,957 1,980 - 19,212
Interbank loans receivable and
SPAR 2,705 - - - - 2,705
Financial assets at fair value
through profit or loss
Derivative financial assets 4,777 - 161 636 - 5,574
Trading securities 1,565 - 55 375 - 1,995
Available-for-sale securities 22,239 - 1,193 107 - 23,539
Held-to-maturity securities 37,382 - 1,530 980 - 39,892
Loans and advances, net 97,772 650 69 20 (451) 98,060
Others financial assets
Accounts receivable, net 79 - 15 5 (11) 88 Other accrued interest and
fees receivable 149 - 125 47 - 321
Others - - - - - -
Total financial assets 182,003 1,477 6,184 4,166 (462) 193,368
Financial Liabilities
Deposit liabilities 154,687 1,152 3,390 1,029 - 160,258
Derivative financial liabilities 3,699 - 171 641 - 4,511
Bills payable 26,077 - - - - 26,077
Due to BSP and other banks 70 - - - - 70
Manager’s checks and demand
drafts outstanding 181 - 15 - - 196
Other financial liabilities
Accounts payable 119 - 38 1 - 158
Others - - - - - -
Total financial liabilities 184,833 1,152 3,614 1,671 - 191,270
Net on-balance sheet financial
position (in Philippine Peso) (2,830) 325 2,570 2,495 (462) 2,098

(57)
Parent
USD
JPY
EUR
GBP
Less -
allowance
Total
(In Millions of Pesos)
As at December 31, 2015
Financial Assets
Cash and other cash items 1,750 102 112 19 - 1,983
Due from other banks 10,367 1,309 1,672 1,047 - 14,395
Interbank loans receivable and
SPAR 4,252 - - - - 4,252
Financial assets at fair value
through profit or loss
Derivative financial assets 2,783 - 41 37 - 2,861
Trading securities 5,417 - - - - 5,417
Available-for-sale securities 35,768 - 5 - - 35,773
Held-to-maturity securities 52,200 - 1,509 - - 53,709
Loans and advances, net 91,063 340 223 1 (468) 91,159
Other financial assets
Accounts receivable, net 75 - - - (15) 60
Other accrued interest and
fees receivable 242 - 97 24 - 363
Others - - - - - -
Total financial assets 203,917 1,751 3,659 1,128 (483) 209,972
Financial Liabilities
Deposit liabilities 185,462 1,381 3,376 1,064 - 191,283
Derivative financial liabilities 1,820 - 39 39 - 1,898
Bills payable 12,706 - - - - 12,706
Due to BSP and other banks 224 - - - - 224
Manager’s checks and demand
drafts outstanding 20 - 12 1 - 33
Other financial liabilities
Accounts payable 99 - 1 - - 100
Others - - - - - -
Total financial liabilities 200,331 1,381 3,428 1,104 - 206,244
Net on-balance sheet financial
position (in Philippine Peso) 3,586 370 231 24 (483) 3,728

(58)
USD
JPY
EUR
GBP
Less -
allowance
Total
(In Millions of Pesos)
As at December 31, 2014
Financial Assets
Cash and other cash items 1,659 71 71 14 - 1,815
Due from other banks 8,063 751 2,779 1,445 - 13,038
Interbank loans receivable and
SPAR 2,705 - - - - 2,705
Financial assets at fair value
through profit or loss
Derivative financial assets 4,777 - 161 636 - 5,574
Trading securities 1,565 - 55 375 - 1,995
Available-for-sale securities 18,264 - 1,193 107 - 19,564
Held-to-maturity securities 34,630 - 1,530 - - 36,160
Loans and advances, net 97,593 650 69 - (449) 97,863
Other financial assets
Accounts receivable, net 79 - - - (11) 68
Other accrued interest and
fees receivable 149 - 125 32 - 306
Others - - - - - -
Total financial assets 169,484 1,472 5,983 2,609 (460) 179,088
Financial Liabilities
Deposit liabilities 142,702 1,152 3,270 720 - 147,844
Derivative financial liabilities 3,699 - 171 641 - 4,511
Bills payable 26,063 - - - - 26,063
Due to BSP and other banks 70 - - - - 70
Manager’s checks and demand
drafts outstanding 180 - 15 - - 195
Other financial liabilities
Accounts payable 116 - 20 - - 136
Others - - - - - -
Total financial liabilities 172,830 1,152 3,476 1,361 - 178,819
Net on-balance sheet financial
position (in Philippine Peso) (3,346) 320 2,507 1,248 (460) 269

(59)
29.2.2 Interest rate risk Interest rate risk is the risk that the BPI Group will experience deterioration in its financial position brought about by movements in the absolute level of interest rates. Interest rate risk in the banking book arises from the BPI Group’s core banking activities. The main source of this type of interest rate risk is re-pricing risk, which reflects the fact that the BPI Group’s assets and liabilities have different maturities and are re-priced at different interest rates. The Bank employs two methods to measure the potential impact of interest rate risk in Group’s financial positions – (i) one that focuses on the economic value of the banking book, and (ii) one that focuses on net interest earnings. The RMC sets limits on the two interest rate risk metrics which are monitored monthly by the Market Risk Division of the Risk Management Office. First, the BPI Group employs the Balance Sheet Value-at-Risk (BSVaR) metric to measure the impact of interest rate movements on the economic value of banking book. The BSVaR is founded on re-pricing gaps, or the difference between the amounts of rate-sensitive assets and the amounts of rate-sensitive liabilities. The BSVaR, therefore, estimates the “riskiness of the balance sheet” and compares the degree of risk taking activity in the banking books from one period to the next. The BSVaR assumes a static balance sheet, i.e., there will be no new transactions moving forward and no portfolio rebalancing will be undertaken in response to future changes in market rates. In consideration of the static framework and the fact that incomes from the banking book is accrued rather than generated from marking-to-market, the probable loss that is estimated by the BSVaR is not realized in accounting income. The Bank sets limits for BPI Group and each legal entity based on estimated equity duration, assumed movement of market rates (in basis points) and estimated equity value. As of end December, 2015, the average BSVaR for the banking or non-trading book are as follows:
Consolidated Parent
2015 2014 2015 2014
(In Millions of Pesos) BSVaR 2,315 1,932 1,923 1,627
The second re-pricing risk metric used by the Bank is Earnings-at-Risk (EaR). This metric measures the potential deterioration in the Bank’s net interest income due to changes in interest rates. The Bank’s earnings are affected when movements in borrowing and lending rates are not perfectly synchronized, which create a gap due to such mismatch. Based on the banking book positions as at particular valuation dates, the Group projects interest receivables out of its assets, and interest payables on its liabilities, in the next 12 months. Net interest income – the difference between interest receipts and payments – is projected in this exercise. BPI, on a group level, is positively gapped hence increase in rates becomes beneficial to the Bank. As of end-December 2015, the net interest income impact of movement of interest rates was measured as P473 million.

(60)
The table below summarizes the BPI Group’s exposure to interest rate risk, categorized by the earlier of contractual repricing or maturity dates. Consolidated
Repricing
Up to 1 year
Over 1 up to
3 years
Over 3 years
Non-
repricing
Total
(In Millions of Pesos)
As at December 31, 2015
Financial Assets
Cash and other cash items 35,681 - - - 35,681
Due from BSP - - - 214,960 214,960
Due from other banks - - - 22,238 22,238
Interbank loans receivable and SPAR - - - 12,902 12,902
Financial assets at fair value through
profit or loss
Derivative financial assets 3,791 422 316 - 4,529
Trading securities - debt securities - - - 7,762 7,762
Available-for-sale - debt securities 4,497 - - 36,137 40,634
Held-to-maturity securities - 3 - 244,806 244,809
Loans and advances, net 612,854 74,234 126,292 59,481 872,861
Other financial assets
Accounts receivable, net - - - 1,784 1,784
Other accrued interest and fees
receivable - - - 704 704
Sales contracts receivable, net - - - - -
Rental deposits - - - 403 403
Others, net - - - 402 402
Total financial assets 656,823 74,659 126,608 601,579 1,459,669
Financial Liabilities
Deposit liabilities 438,832 242,198 593,022 1,647 1,275,699
Derivative financial liabilities 2,601 364 251 - 3,216
Bills payable - - - 20,941 20,941
Due to BSP and other banks - - - 431 431
Manager’s checks and demand drafts
outstanding - - - 8,308 8,308
Other financial liabilities
Accounts payable - - - 4,483 4,483
Outstanding acceptances - - - 2,494 2,494
Deposits on lease contracts - - - 1,868 1,868
Dividends payable - - - 3,539 3,539
Others - - - 1,161 1,161
Total financial liabilities 441,433 242,562 593,273 44,872 1,322,140
Total interest gap 215,390 (167,903) (466,665) 556,707 137,529

(61)
Repricing
Up to 1 year
Over 1 up to
3 years
Over 3 years
Non-
repricing
Total
(In Millions of Pesos)
As at December 31, 2014
Financial Assets
Cash and other cash items 38,427 - - - 38,427
Due from BSP - - - 211,946 211,946
Due from other banks - - - 22,227 22,227
Interbank loans receivable and SPAR - - - 5,782 5,782
Financial assets at fair value through
profit or loss
Derivative financial assets 12,607 20,224 3,150 - 35,981
Trading securities - debt securities - - - 15,247 15,247
Available-for-sale - debt securities 6,938 - - 40,546 47,484
Held-to-maturity securities 4 - - 209,405 209,409
Loans and advances, net 611,809 43,678 81,386 63,297 800,170
Other financial assets
Accounts receivable, net - - - 1,489 1,489
Other accrued interest and fees
receivable - - - 661 661
Sales contracts receivable, net - - - 39 39
Rental deposits - - - 366 366
Others, net - - - 425 425
Total financial assets 669,785 63,902 84,536 571,430 1,389,653
Financial Liabilities
Deposit liabilities 584,042 509,929 9,440 72,802 1,176,213
Derivative financial liabilities 839 21,769 12,238 - 34,846
Bills payable - - - 32,993 32,993
Due to BSP and other banks - - - 687 687
Manager’s checks and demand drafts
outstanding - - - 8,353 8,353
Other financial liabilities
Accounts payable - - - 4,787 4,787
Outstanding acceptances - - - 947 947
Deposits on lease contracts - - - 1,974 1,974
Dividends payable - - - - -
Others - - - 1,838 1,838
Total financial liabilities 584,881 531,698 21,678 124,381 1,262,638
Total interest gap 84,904 (467,796) 62,858 447,049 127,015

(62)
Parent
Repricing
Up to 1 year
Over 1 up to
3 years
Over 3 years
Non-
repricing
Total
(In Millions of Pesos)
As at December 31, 2015
Financial Assets
Cash and other cash items 34,797 - - - 34,797
Due from BSP - - - 174,370 174,370
Due from other banks - - - 17,181 17,181
Interbank loans receivable and SPAR - - - 6,163 6,163
Financial assets at fair value through
profit or loss
Derivative financial assets 3,791 422 316 - 4,529
Trading securities - debt securities - - - 5,442 5,442
Available-for-sale - debt securities - 4,497 - 31,913 36,410
Held-to-maturity securities - 3 - 225,074 225,077
Loans and advances, net 534,063 38,152 78,033 14,371 664,619
Other financial assets
Accounts receivable, net - - - 1,130 1,130
Other accrued interest and fees receivable - - - 644 644
Sales contracts receivable, net - - - - -
Rental deposits - - - 336 336
Others, net - - - 353 353
Total financial assets 572,651 43,074 78,349 476,977 1,171,051
Financial Liabilities
Deposit liabilities 551,682 394,382 87,321 - 1,033,385
Derivative financial liabilities 2,601 364 251 - 3,216
Bills payable - - - 12,826 12,826
Due to BSP and other banks - - - 431 431
Manager’s checks and demand drafts
outstanding - - - 6,693 6,693
Other financial liabilities
Accounts payable - - - 2,594 2,594
Outstanding acceptances - - - 2,494 2,494
Deposits on lease contracts - - - - -
Dividends payable - - - 3,539 3,539
Others - - - 1,043 1,043
Total financial liabilities 554,283 394,746 87,572 29,620 1,066,221
Total interest gap 18,368 (351,672) (9,223) 447,357 104,830
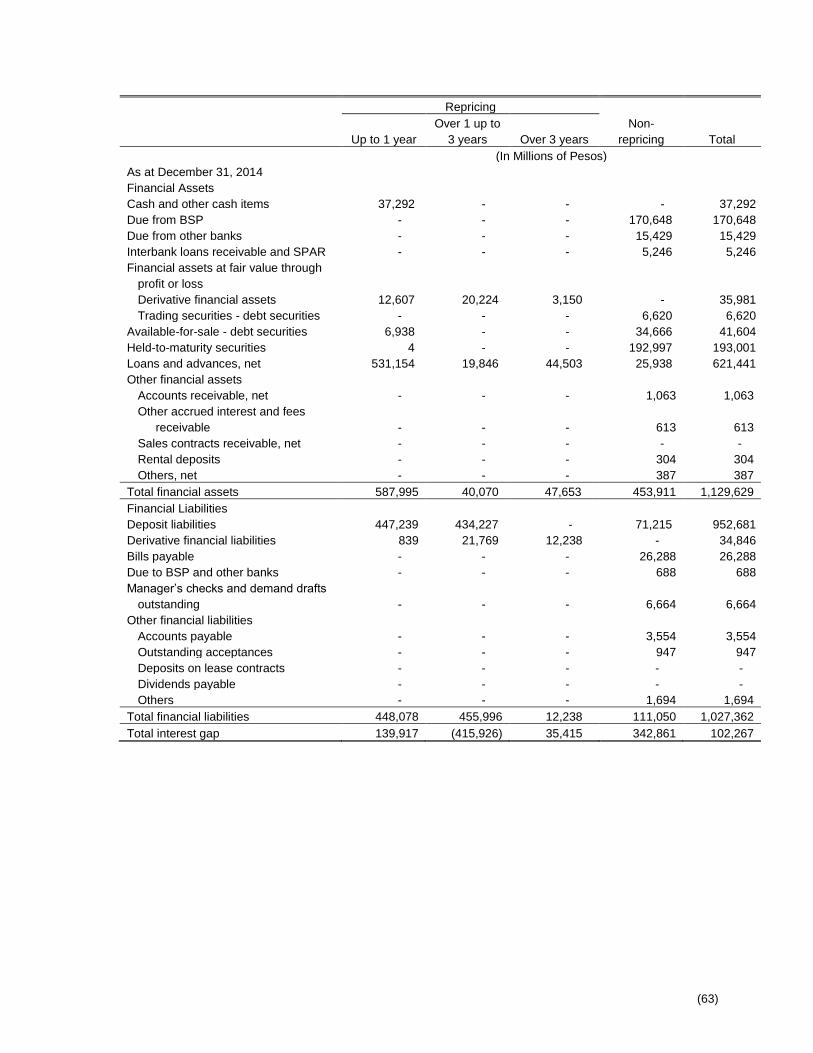
(63)
Repricing
Up to 1 year
Over 1 up to
3 years
Over 3 years
Non-
repricing
Total
(In Millions of Pesos)
As at December 31, 2014
Financial Assets
Cash and other cash items 37,292 - - - 37,292
Due from BSP - - - 170,648 170,648
Due from other banks - - - 15,429 15,429
Interbank loans receivable and SPAR - - - 5,246 5,246
Financial assets at fair value through
profit or loss
Derivative financial assets 12,607 20,224 3,150 - 35,981
Trading securities - debt securities - - - 6,620 6,620
Available-for-sale - debt securities 6,938 - - 34,666 41,604
Held-to-maturity securities 4 - - 192,997 193,001
Loans and advances, net 531,154 19,846 44,503 25,938 621,441
Other financial assets
Accounts receivable, net - - - 1,063 1,063
Other accrued interest and fees
receivable - - - 613 613
Sales contracts receivable, net - - - - -
Rental deposits - - - 304 304
Others, net - - - 387 387
Total financial assets 587,995 40,070 47,653 453,911 1,129,629
Financial Liabilities
Deposit liabilities 447,239 434,227 - 71,215 952,681
Derivative financial liabilities 839 21,769 12,238 - 34,846
Bills payable - - - 26,288 26,288
Due to BSP and other banks - - - 688 688
Manager’s checks and demand drafts
outstanding - - - 6,664 6,664
Other financial liabilities
Accounts payable - - - 3,554 3,554
Outstanding acceptances - - - 947 947
Deposits on lease contracts - - - - -
Dividends payable - - - - -
Others - - - 1,694 1,694
Total financial liabilities 448,078 455,996 12,238 111,050 1,027,362
Total interest gap 139,917 (415,926) 35,415 342,861 102,267

(64)
29.3 Liquidity risk Liquidity risk is the risk that the BPI Group will be unable to meet its payment obligations associated with its financial liabilities when they fall due and to replace funds when they are withdrawn. The consequence may be the failure to meet obligations to repay depositors and fulfill commitments to lend. The Bank’s liquidity profile is observed and monitored through its metric, the Minimum Cumulative Liquidity Gap (MCLG). The MCLG is the smallest net cumulative cash inflow (if positive) or the largest net cumulative cash outflow (if negative) over the next three (3) months. The MCLG indicates the biggest funding requirement in the short term and the degree of liquidity risk present in the current cash flow profile of the Bank. MCLG is computed monthly and reported in the RMC meetings. A red flag is immediately raised and reported to Management and the RMC when the MCLG level projected over the next 3 months breaches the RMC-prescribed MCLG limit.
29.3.1 Liquidity risk management process
The BPI Group’s liquidity management process, as carried out within the BPI Group and monitored by the RMC
includes:
Day-to-day funding, managed by monitoring future cash flows to ensure that requirements can be met. This
includes replenishment of funds as they mature or as borrowed by customers;
Maintaining a portfolio of highly marketable assets that can easily be liquidated as protection against any
unforeseen interruption to cash flow;
Monitoring liquidity gaps against internal and regulatory requirements (Note 16);
Managing the concentration and profile of debt maturities; and
Performing periodic liquidity stress testing on the BPI Group’s liquidity position by assuming a faster rate of
withdrawals in its deposit base.
Monitoring and reporting take the form of cash flow measurement and projections for the next day, week and
month as these are key periods for liquidity management. The starting point for these projections is an analysis
of the contractual maturity of the financial liabilities (Notes 29.3.3 and 29.3.4) and the expected collection date of
the financial assets. The BPI Group also monitors unmatched medium-term assets, the level and type of undrawn lending commitments, the usage of overdraft facilities and the impact of contingent liabilities such as standby letters of credit.
29.3.2 Funding approach Sources of liquidity are regularly reviewed by the BPI Group to maintain a wide diversification by currency, geography, counterparty, product and term.

(65)
29.3.3 Non-derivative cash flows The table below presents the maturity profile of non-derivative financial instruments based on undiscounted cash flows, including interest, which the BPI Group uses to manage the inherent liquidity risk. The maturity analysis is based on the remaining period from the end of the reporting period to the contractual maturity date or, if earlier, the expected date the financial asset will be realized or the financial liability will be settled. Consolidated
Up to 1 year
Over 1 up to
3 years
Over 3 years
Total
(In Millions of Pesos)
As at December 31, 2015
Financial Assets
Cash and other cash items 35,681 - - 35,681
Due from BSP 214,976 - - 214,976
Due from other banks 22,238 - - 22,238
Interbank loans receivable and
securities under agreements to
resell (SPAR) 12,526 61 636 13,223
Financial assets at fair value through
profit or loss
Trading securities - debt securities 2,266 316 5,991 8,573
Available-for-sale securities - debt
securities 24,691 6,763 9,059 40,513
Held-to-maturity securities 38,288 67,963 211,233 317,484
Loans and advances, net 497,093 147,604 353,432 998,129
Other financial assets
Accounts receivable, net 1,784 - - 1,784
Other accrued interest and fees
receivable 704 - - 704
Sales contracts receivable, net - - - -
Rental deposits 403 - - 403
Others, net 402 - - 402
Total financial assets 851,052 222,707 580,351 1,654,110
Financial Liabilities
Deposit liabilities 729,638 529,520 29,826 1,288,984
Bills payable 21,106 4,896 54 26,056
Due to BSP and other banks 431 - - 431
Manager’s checks and demand drafts
outstanding 8,308 - - 8,308
Other financial liabilities
Accounts payable 4,483 - - 4,483
Outstanding acceptances 2,494 - - 2,494
Deposits on lease contracts 1,868 - - 1,868
Dividends payable 3,539 - - 3,539
Others 1,161 - - 1,161
Total financial liabilities 773,028 534,416 29,880 1,337,324
Total maturity gap 78,024 (311,709) 550,471 316,786

(66)
Up to 1 year
Over 1 up to
3 years
Over 3 years
Total
(In Millions of Pesos)
As at December 31, 2014
Financial Assets
Cash and other cash items 38,427 - - 38,427
Due from BSP 211,971 - - 211,971
Due from other banks 22,227 - - 22,227
Interbank loans receivable and
securities under agreements to
resell (SPAR) 3,045 2,733 225 6,003
Financial assets at fair value through
profit or loss
Trading securities - debt securities 10,280 380 7,356 18,016
Available-for-sale securities - debt
securities 7,933 8,709 45,581 62,223
Held-to-maturity securities 28,853 73,239 186,025 288,117
Loans and advances, net 391,288 101,131 314,765 807,184
Other financial assets
Accounts receivable, net 1,489 - - 1,489
Other accrued interest and fees
receivable 661 - - 661
Sales contracts receivable, net 39 - - 39
Rental deposits 366 - - 366
Others, net 425 - - 425
Total financial assets 717,004 186,192 553,952 1,457,148
Financial Liabilities
Deposit liabilities 660,774 513,147 9,762 1,183,683
Bills payable 36,109 4,968 428 41,505
Due to BSP and other banks 687 - - 687
Manager’s checks and demand drafts
outstanding 8,353 - - 8,353
Other financial liabilities
Accounts payable 4,735 - - 4,735
Outstanding acceptances 947 - - 947
Deposits on lease contracts 1,974 - - 1,974
Dividends payable - - - -
Others 1,838 - - 1,838
Total financial liabilities 715,417 518,115 10,190 1,243,722
Total maturity gap 1,587 (331,923) 543,762 213,426

(67)
Parent
Up to 1 year
Over 1 up to
3 years
Over 3 years
Total
(In Millions of Pesos)
As at December 31, 2015
Financial Assets
Cash and other cash items 34,797 - - 34,797
Due from BSP 174,370 - - 174,370
Due from other banks 17,181 - - 17,181
Interbank loans receivable and
securities under agreements to
resell (SPAR) 5,949 44 417 6,410
Financial assets at fair value through
profit or loss
Trading securities - debt securities 136 236 5,821 6,193
Available-for-sale - debt securities 23,838 6,372 7,799 38,009
Held-to-maturity securities 36,145 63,977 191,407 291,529
Loans and advances, net 420,353 63,065 210,711 694,129
Other financial assets, net
Accounts receivable, net 1,130 - - 1,130
Other accrued interest and fees
receivable 644 - - 644
Sales contracts receivable, net - - - -
Rental deposits 336 - - 336
Others, net 353 - - 353
Total financial assets 715,232 133,694 416,155 1,265,081
Financial Liabilities
Deposit liabilities 583,615 450,782 50 1,034,447
Bills payable 8,073 4,895 - 12,968
Due to BSP and other banks 431 - - 431
Manager’s checks and demand drafts
outstanding 6,693 - - 6,693
Other financial liabilities
Accounts payable 2,594 - - 2,594
Outstanding acceptances 2,494 - - 2,494
Deposits on lease contracts - -
Dividends payable 3,539 - - 3,539
Others 1,043 - - 1,043
Total financial liabilities 608,482 455,677 50 1,064,209
Total maturity gap 106,750 (321,983) 416,105 200,872

(68)
Up to 1 year
Over 1 up to
3 years
Over 3 years
Total
(In Millions of Pesos)
As at December 31, 2014
Financial Assets
Cash and other cash items 37,292 - - 37,292
Due from BSP 170,655 - - 170,655
Due from other banks 15,429 - - 15,429
Interbank loans receivable and
securities under agreements to
resell (SPAR) 2,493 2,733 225 5,451
Financial assets at fair value through
profit or loss
Trading securities - debt securities 2,088 327 6,670 9,085
Available-for-sale - debt securities 5,152 7,305 42,829 55,286
Held-to-maturity securities 20,678 69,723 169,533 259,934
Loans and advances, net 376,748 87,261 166,217 630,226
Other financial assets, net
Accounts receivable, net 1,063 - - 1,063
Other accrued interest and fees
receivable 613 - - 613
Sales contracts receivable, net - - - -
Rental deposits 304 - - 304
Others, net 387 - - 387
Total financial assets 632,902 167,349 385,474 1,185,725
Financial Liabilities
Deposit liabilities 517,730 435,571 - 953,301
Bills payable 27,991 439 396 28,826
Due to BSP and other banks 688 - - 688
Manager’s checks and demand drafts
outstanding
6,664 - -
6,664
Other financial liabilities
Accounts payable 3,502 - - 3,502
Outstanding acceptances 947 - - 947
Deposits on lease contracts - - - -
Dividends payable - - - -
Others 1,694 - - 1,694
Total financial liabilities 559,216 436,010 396 995,622
Total maturity gap 73,686 (268,661) 385,078 190,103

(69)
29.3.4 Derivative cash flows
(a) Derivatives settled on a net basis
The BPI Group’s derivatives that are settled on a net basis consist of interest rate swaps, non-deliverable forwards and non-deliverable swaps. The table below presents the contractual undiscounted cash flows of interest rate swaps based on the remaining period from December 31 to the contractual maturity dates that are subject to offsetting, enforceable master netting arrangements and similar agreements.
Consolidated and Parent
Up to 1 year
Over 1 up to
3 years
Over 3
years
Total
2015 (In Millions of Pesos)
Interest rate swap contracts - held for trading
- Inflow 7,830 1,542 457 9,829
- Outflow (8,503) (1,586) (392) (10,481)
- Net inflow (outflow) (673) (44) 65 (652)
Non-deliverable forwards and swaps - held for trading
- Inflow 20,507 2,320 - 22,827
- Outflow (19,545) (2,258) - (21,803)
- Net inflow 962 62 - 1,024
Up to 1 year
Over 1 up to
3 years
Over 3
years
Total
2014 (In Millions of Pesos)
Interest rate swap contracts - held for trading
- Inflow 41 9,718 2,815 12,574
- Outflow (58) (9,951) (2,813) (12,822)
- Net inflow (outflow) (17) (233) 2 (248)
Non-deliverable forwards and swaps - held for trading
- Inflow 32,824 8,731 - 41,555
- Outflow (32,836) (8,456) - (41,292)
- Net inflow (12) 275 - 263
(b) Derivatives settled on a gross basis
The BPI Group’s derivatives that are settled on a gross basis include foreign exchange derivatives mainly currency forwards and currency swaps. The table below presents the contractual undiscounted cash flows of foreign exchange derivatives based on the remaining period from reporting date to the contractual maturity dates.
Consolidated and Parent
Up to 1 year
Over 1 up to
3 years
Over 3
years Total
(In Millions of Pesos)
Foreign exchange derivatives - held for trading
2015
- Inflow 199,834 5,288 - 205,122
- Outflow (198,941) (5,296) - (204,237)
- Net inflow (outflow) 893 (8) - 885
2014
- Inflow 110,902 12,501 - 123,403
- Outflow (110,954) (11,396) - (122,350)
- Net inflow (outflow) (52) 1,105 - 1,053

(70)
29.4 Fair value of financial assets and liabilities The table below summarizes the carrying amount and fair value of those significant financial assets and liabilities not presented on the statement of condition at fair value at December 31. Consolidated
Carrying amount Fair value
2015 2014 2015 2014
(In Millions of Pesos)
Financial assets
Cash and other cash items 35,681 38,427 35,681 38,427
Due from BSP 214,960 211,946 214,960 211,946
Due from other banks 22,238 22,227 22,238 22,227
Interbank loans receivable and SPAR 12,902 5,782 12,902 5,782
Held-to-maturity securities 244,809 209,409 248,866 220,292
Loans and advances, net 872,861 800,170 882,112 815,038
Other financial assets
Accounts receivable, net 1,784 1,489 1,784 1,489
Other accrued interest and fees receivable 704 661 704 661
Sales contracts receivable, net - 39 - 39
Rental deposits 403 366 403 366
Others, net 402 425 402 425
Financial liabilities
Deposit liabilities 1,275,699 1,176,213 1,289,099 1,175,367
Bills payable 20,941 32,993 20,878 32,985
Due to BSP and other banks 431 687 431 687
Manager’s checks and demand drafts
outstanding 8,308 8,353 8,308 8,353
Other financial liabilities
Accounts payable 4,483 4,787 4,483 4,787
Outstanding acceptances 2,494 947 2,494 947
Deposits on lease contracts 1,868 1,974 1,868 1,974
Dividends payable 3,539 - 3,539 -
Others 1,161 1,838 1,161 1,838
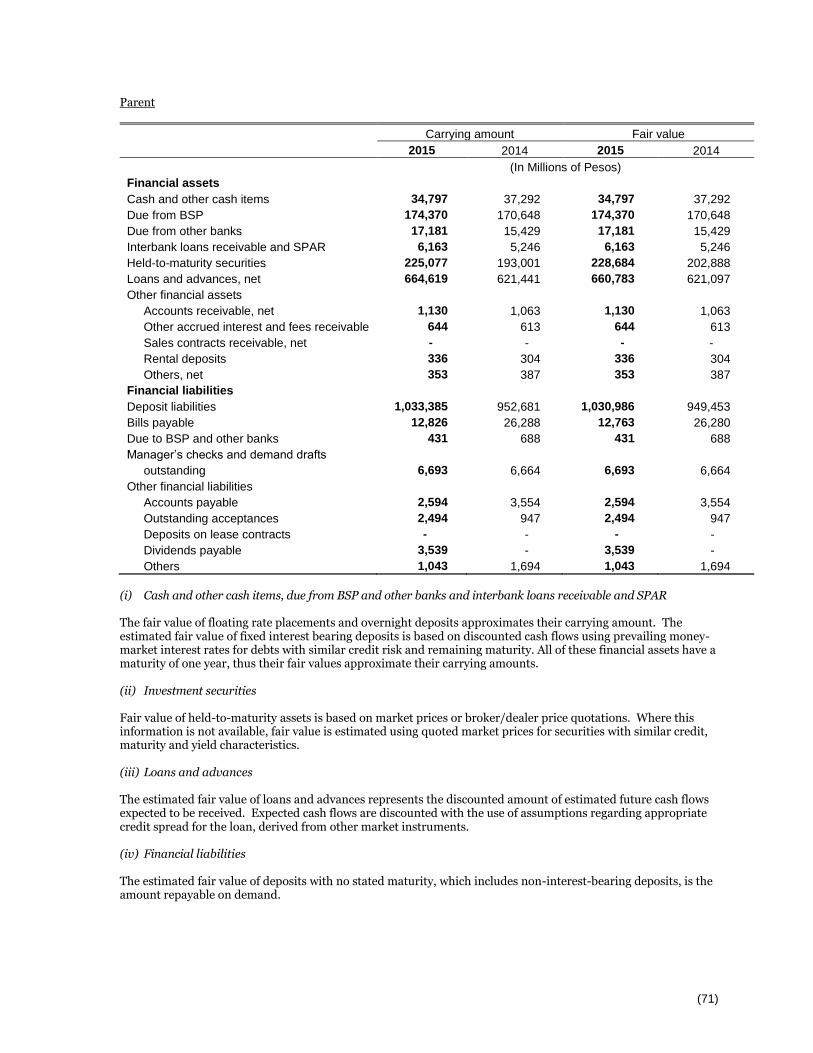
(71)
Parent
Carrying amount Fair value
2015 2014 2015 2014
(In Millions of Pesos)
Financial assets
Cash and other cash items 34,797 37,292 34,797 37,292
Due from BSP 174,370 170,648 174,370 170,648
Due from other banks 17,181 15,429 17,181 15,429
Interbank loans receivable and SPAR 6,163 5,246 6,163 5,246
Held-to-maturity securities 225,077 193,001 228,684 202,888
Loans and advances, net 664,619 621,441 660,783 621,097
Other financial assets
Accounts receivable, net 1,130 1,063 1,130 1,063
Other accrued interest and fees receivable 644 613 644 613
Sales contracts receivable, net - - - -
Rental deposits 336 304 336 304
Others, net 353 387 353 387
Financial liabilities
Deposit liabilities 1,033,385 952,681 1,030,986 949,453
Bills payable 12,826 26,288 12,763 26,280
Due to BSP and other banks 431 688 431 688
Manager’s checks and demand drafts
outstanding 6,693
6,664 6,693
6,664
Other financial liabilities
Accounts payable 2,594 3,554 2,594 3,554
Outstanding acceptances 2,494 947 2,494 947
Deposits on lease contracts - - - -
Dividends payable 3,539 - 3,539 -
Others 1,043 1,694 1,043 1,694
(i) Cash and other cash items, due from BSP and other banks and interbank loans receivable and SPAR The fair value of floating rate placements and overnight deposits approximates their carrying amount. The estimated fair value of fixed interest bearing deposits is based on discounted cash flows using prevailing money-market interest rates for debts with similar credit risk and remaining maturity. All of these financial assets have a maturity of one year, thus their fair values approximate their carrying amounts. (ii) Investment securities Fair value of held-to-maturity assets is based on market prices or broker/dealer price quotations. Where this information is not available, fair value is estimated using quoted market prices for securities with similar credit, maturity and yield characteristics. (iii) Loans and advances The estimated fair value of loans and advances represents the discounted amount of estimated future cash flows expected to be received. Expected cash flows are discounted with the use of assumptions regarding appropriate credit spread for the loan, derived from other market instruments. (iv) Financial liabilities The estimated fair value of deposits with no stated maturity, which includes non-interest-bearing deposits, is the amount repayable on demand.

(72)
The estimated fair value of fixed interest-bearing deposits and other borrowings not quoted in an active market is based on discounted cash flows using market interest rates for new debts with similar remaining maturity. (v) Other financial assets / liabilities Carrying amounts of other financial assets / liabilities which have no definite repayment dates are assumed to be their fair values. 29.5 Fair value hierarchy
The following table presents the fair value hierarchy of the BPI Group’s assets and liabilities at December 31: Consolidated
Fair value
2015 Level 1 Level 2 Total
Recurring measurements (In Millions of Pesos)
Financial assets Financial assets at fair value through profit or loss
Derivative financial assets - 4,529 4,529
Trading securities
- Debt securities 7,690 72 7,762
- Equity securities 322 - 322
Available-for-sale financial assets
- Debt securities 37,677 2,957 40,634
- Equity securities 1,338 1 1,339
47,027 7,559 54,586
Financial liabilities
Derivative financial liabilities - 3,216 3,216
Non-recurring measurements
Assets held for sale, net - 2,762 2,762

(73)
Fair value
2015 Level 1 Level 2 Total
Fair values disclosed
Financial assets
Cash and other cash items - 35,681 35,681
Due from BSP - 214,960 214,960
Due from other banks - 22,238 22,238
Interbank loans receivable and SPAR - 12,902 12,902
Held-to-maturity securities 248,087 779 248,866
Loans and advances, net - 882,112 882,112
Other financial assets
Accounts receivable, net - 1,784 1,784
Other accrued interest and fees receivable - 704 704
Sales contracts receivable, net - - -
Rental deposits - 403 403
Others, net - 402 402
Financial liabilities
Deposit liabilities - 1,289,099 1,289,099
Bills payable - 20,878 20,878
Due to BSP and other banks - 431 431
Manager’s checks and demand drafts outstanding - 8,308 8,308
Other financial liabilities
Accounts payable - 4,483 4,483
Outstanding acceptances - 2,494 2,494
Deposits on lease contracts - 1,868 1,868
Dividends payable - 3,539 3,539
Others - 1,161 1,161
Non-financial assets
Investment properties - 3,050 3,050
Fair value
2014 Level 1 Level 2 Total
Recurring measurements (In Millions of Pesos)
Financial assets Financial assets at fair value through profit or loss Derivative financial assets - 35,981 35,981 Trading securities - Debt securities 14,932 315 15,247 - Equity securities 615 - 615
Available-for-sale financial assets - Debt securities 43,750 3,734 47,484 - Equity securities 2,216 1,514 3,730
61,513 41,544 103,057
Financial liabilities Derivative financial liabilities - 34,846 34,846
Non-recurring measurements Assets held for sale, net - 3,033 3,033

(74)
Fair value
2014 Level 1 Level 2 Total
Fair values disclosed
Financial assets
Cash and other cash items - 38,427 38,427
Due from BSP - 211,946 211,946
Due from other banks - 22,227 22,227
Interbank loans receivable and SPAR - 5,782 5,782
Held-to-maturity securities 219,648 644 220,292
Loans and advances, net - 815,038 815,038
Other financial assets
Accounts receivable, net - 1,489 1,489
Other accrued interest and fees receivable - 661 661
Sales contracts receivable, net - 39 39
Rental deposits - 366 366
Others, net - 425 425
Financial liabilities
Deposit liabilities - 1,175,367 1,175,367
Bills payable - 32,985 32,985
Due to BSP and other banks - 687 687
Manager’s checks and demand drafts outstanding - 8,353 8,353
Other financial liabilities
Accounts payable - 4,787 4,787
Outstanding acceptances - 947 947
Deposits on lease contracts - 1,974 1,974
Dividends payable - - -
Others - 1,838 1,838
Non-financial assets
Investment properties - 2,057 2,057
Parent
Level 1 Level 2 Total
2015 (In Millions of Pesos) Financial assets
Financial assets at fair value through profit or loss
Derivative financial assets - 4,529 4,529
Trading securities - debt securities 5,442 - 5,442
Available-for-sale financial assets
- Debt securities 35,942 469 36,411
- Equity securities 215 - 215
41,599 4,998 46,597
Financial liabilities
Derivative financial liabilities - 3,216 3,216
Non-recurring measurements
Assets held for sale, net - 1,599 1,599

(75)
Fair value
2015 Level 1 Level 2 Total
Fair values disclosed
Financial assets
Cash and other cash items - 34,797 34,797
Due from BSP - 174,370 174,370
Due from other banks - 17,181 17,181
Interbank loans receivable and SPAR - 6,163 6,163
Held-to-maturity securities 228,057 627 228,684
Loans and advances, net - 660,783 660,783
Other financial assets
Accounts receivable, net - 1,130 1,130
Other accrued interest and fees receivable - 644 644
Sales contracts receivable, net - - -
Rental deposits - 336 336
Others, net - 353 353
Financial liabilities
Deposit liabilities - 1,030,986 1,030,986
Bills payable - 12,763 12,763
Due to BSP and other banks - 431 431
Manager’s checks and demand drafts outstanding - 6,693 6,693
Other financial liabilities
Accounts payable - 2,594 2,594
Outstanding acceptances - 2,494 2,494
Deposits on lease contracts - - -
Dividends payable - 3,539 3,539
Others - 1,043 1,043
Non-financial assets
Investment properties - 3,050 3,050
Level 1 Level 2 Total
2014 (In Millions of Pesos) Financial assets Financial assets at fair value through profit or loss
Derivative financial assets - 35,981 35,981 Trading securities - debt securities 6,475 145 6,620
Available-for-sale financial assets - Debt securities 38,435 3,169 41,604 - Equity securities 203 - 203
45,113 39,295 84,408
Financial liabilities
Derivative financial liabilities - 34,846 34,846
Non-recurring measurements
Assets held for sale, net - 1,865 1,865

(76)
Fair value
2014 Level 1 Level 2 Total
Fair values disclosed
Financial assets
Cash and other cash items - 37,292 37,292
Due from BSP - 170,648 170,648
Due from other banks - 15,429 15,429
Interbank loans receivable and SPAR - 5,246 5,246
Held-to-maturity securities 202,244 644 202,888
Loans and advances, net - 621,097 621,097
Other financial assets
Accounts receivable, net - 1,063 1,063
Other accrued interest and fees receivable - 613 613
Sales contracts receivable, net - - -
Rental deposits - 294 294
Others, net - 387 387
Financial liabilities
Deposit liabilities - 949,453 949,453
Bills payable - 26,280 26,280
Due to BSP and other banks - 688 688
Manager’s checks and demand drafts outstanding - 6,664 6,664
Other financial liabilities
Accounts payable - 3,554 3,554
Outstanding acceptances - 947 947
Deposits on lease contracts - - -
Dividends payable - - -
Others - 1,694 1,694
Non-financial assets
Investment properties - 2,057 2,057
The BPI Group has no financial instruments, other assets or liabilities with non-recurring fair value measurements or with fair values disclosed that fall under the Level 3 category as at December 31, 2015 and 2014. There were no transfers between Level 1 and Level 2 during the years ended December 31, 2015 and 2014. 29.6 Insurance risk management The non-life insurance entities decide on the retention, or the absolute amount that they are ready to assume insurance risk from one event. The retention amount is a function of capital, experience, actuarial study and risk appetite or aversion. In excess of the retention, these entities arrange reinsurances either thru treaties or facultative placements. They also accredit reinsurers based on certain criteria and set limits as to what can be reinsured. The reinsurance treaties and the accreditation of reinsurers require Board of Directors’ approval.
29.7 Capital management
Cognizant of its exposure to risks, the BPI Group understands that it must maintain sufficient capital to absorb unexpected losses, to stay in business for the long haul, and to satisfy regulatory requirements. The BPI Group further understands that its performance, as well as the performance of its various units, should be measured in terms of returns generated vis-à-vis allocated capital and the amount of risk borne in the conduct of business.
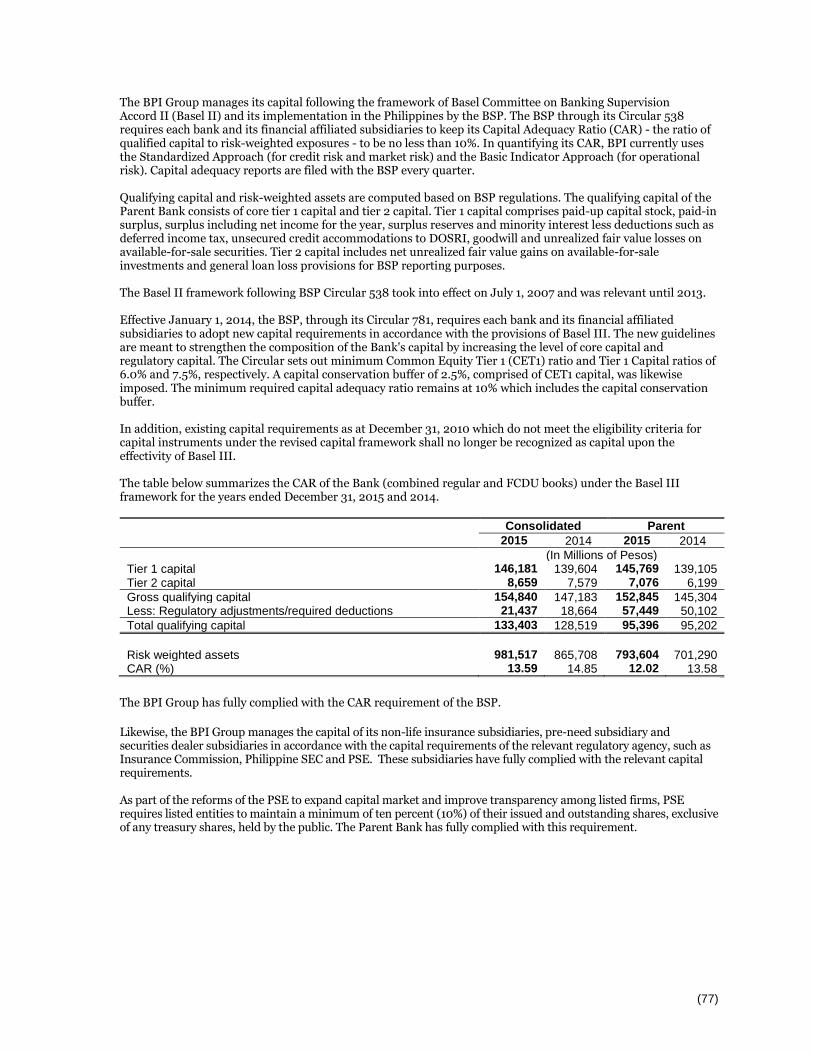
(77)
The BPI Group manages its capital following the framework of Basel Committee on Banking Supervision Accord II (Basel II) and its implementation in the Philippines by the BSP. The BSP through its Circular 538 requires each bank and its financial affiliated subsidiaries to keep its Capital Adequacy Ratio (CAR) - the ratio of qualified capital to risk-weighted exposures - to be no less than 10%. In quantifying its CAR, BPI currently uses the Standardized Approach (for credit risk and market risk) and the Basic Indicator Approach (for operational risk). Capital adequacy reports are filed with the BSP every quarter. Qualifying capital and risk-weighted assets are computed based on BSP regulations. The qualifying capital of the Parent Bank consists of core tier 1 capital and tier 2 capital. Tier 1 capital comprises paid-up capital stock, paid-in surplus, surplus including net income for the year, surplus reserves and minority interest less deductions such as deferred income tax, unsecured credit accommodations to DOSRI, goodwill and unrealized fair value losses on available-for-sale securities. Tier 2 capital includes net unrealized fair value gains on available-for-sale investments and general loan loss provisions for BSP reporting purposes. The Basel II framework following BSP Circular 538 took into effect on July 1, 2007 and was relevant until 2013. Effective January 1, 2014, the BSP, through its Circular 781, requires each bank and its financial affiliated subsidiaries to adopt new capital requirements in accordance with the provisions of Basel III. The new guidelines are meant to strengthen the composition of the Bank's capital by increasing the level of core capital and regulatory capital. The Circular sets out minimum Common Equity Tier 1 (CET1) ratio and Tier 1 Capital ratios of 6.0% and 7.5%, respectively. A capital conservation buffer of 2.5%, comprised of CET1 capital, was likewise imposed. The minimum required capital adequacy ratio remains at 10% which includes the capital conservation buffer. In addition, existing capital requirements as at December 31, 2010 which do not meet the eligibility criteria for capital instruments under the revised capital framework shall no longer be recognized as capital upon the effectivity of Basel III. The table below summarizes the CAR of the Bank (combined regular and FCDU books) under the Basel III framework for the years ended December 31, 2015 and 2014.
Consolidated Parent
2015 2014 2015 2014
(In Millions of Pesos) Tier 1 capital 146,181 139,604 145,769 139,105 Tier 2 capital 8,659 7,579 7,076 6,199
Gross qualifying capital 154,840 147,183 152,845 145,304 Less: Regulatory adjustments/required deductions 21,437 18,664 57,449 50,102
Total qualifying capital 133,403 128,519 95,396 95,202
Risk weighted assets 981,517 865,708 793,604 701,290 CAR (%) 13.59 14.85 12.02 13.58
The BPI Group has fully complied with the CAR requirement of the BSP.
Likewise, the BPI Group manages the capital of its non-life insurance subsidiaries, pre-need subsidiary and securities dealer subsidiaries in accordance with the capital requirements of the relevant regulatory agency, such as Insurance Commission, Philippine SEC and PSE. These subsidiaries have fully complied with the relevant capital requirements. As part of the reforms of the PSE to expand capital market and improve transparency among listed firms, PSE requires listed entities to maintain a minimum of ten percent (10%) of their issued and outstanding shares, exclusive of any treasury shares, held by the public. The Parent Bank has fully complied with this requirement.

(78)
Note 30 - Commitments and Contingencies
At present, there are lawsuits, claims and tax assessments pending against the BPI Group. In the opinion of management, after reviewing all actions and proceedings and court decisions with legal counsels, the aggregate liability or loss, if any, arising therefrom will not have a material effect on the BPI Group’s financial position or financial performance.
BPI and some of its subsidiaries are defendants in legal actions arising from normal business activities. Management believes that these actions are without merit or that the ultimate liability, if any, resulting from them will not materially affect the financial statements.
In the normal course of business, the BPI Group makes various commitments (Note 29.1.4) that are not presented in the financial statements. The BPI Group does not anticipate any material losses from these commitments.
Note 31 - Events After the Reporting Date
On January 20, 2016, the Board of Directors of Parent Bank approved the change in the retirement plan from a defined benefit plan to a defined contribution plan with effective date of January 1, 2016.
Note 32 - Summary of Significant Accounting Policies
The principal accounting policies applied in the preparation of these financial statements are set out below. These policies have been consistently applied to all the years presented, unless otherwise stated.
32.1 Basis of preparation
The financial statements of the BPI Group have been prepared in accordance with Philippine Financial Reporting Standards (PFRS). The term PFRS in general includes all applicable PFRS, Philippine Accounting Standards (PAS), and interpretations of the Philippine Interpretations Committee (PIC), Standing Interpretations Committee (SIC) and International Financial Reporting Interpretations Committee (IFRIC) which have been approved by the Financial Reporting Standards Council (FRSC) and adopted by the SEC.
As allowed by the SEC, the pre-need subsidiary of the Parent Bank continues to follow the provisions of the Pre-Need Uniform Chart of Accounts (PNUCA) prescribed by the SEC and adopted by the Insurance Commission.
The financial statements comprise the statement of condition, statement of income and statement of total comprehensive income shown as two statements, statement of changes in capital funds, statement of cash flows and the notes.
These financial statements have been prepared under the historical cost convention, as modified by the revaluation of trading securities, available-for-sale financial assets and all derivative contracts.
The preparation of financial statements in conformity with PFRS requires the use of certain critical accounting estimates. It also requires management to exercise its judgment in the process of applying the BPI Group’s accounting policies. Changes in assumptions may have a significant impact on the financial statements in the period the assumptions changed. Management believes that the underlying assumptions are appropriate and that the financial statements therefore fairly present the financial position and results of the BPI Group. The areas involving a higher degree of judgment or complexity, or areas where assumptions and estimates are significant to the financial statements are disclosed in Note 28.
32.2 Changes in accounting policy and disclosures
(a) New and amended standards adopted by the BPI Group
The following standards have been adopted by the BPI Group effective January 1, 2015:
Amendment to PFRS 2, ‘Share-based payment’ on the definition of vesting condition. This amendment clarifies the definition of ‘vesting condition’ and now distinguishes between ‘performance condition’ and ‘service condition’. The amendment did not have a significant effect on the BPI Group’s financial statements.
Amendment to PFRS 8, ‘Operating Segments’ on the aggregation of operating segments and reconciliation of the reportable segments’ assets to the entity’s assets. This amendment requires disclosure of the judgments made by management in aggregating operating segments. The amendment also clarifies that a reconciliation of segment assets must only be disclosed if segment assets are reported. The amendment did not have a significant effect on the BPI Group’s financial statements.

(79)
Amendment to PFRS 13, ‘Fair value measurement’ on short-term receivables and payables and portfolio exception. This amendment confirms that short-term receivables and payables can continue to be measured at invoice amounts if the impact of discounting is immaterial. The amendment also clarifies that the portfolio exception in PFRS 13 (measuring the fair value of a group of financial assets and financial liabilities on a net basis) applies to all contracts within the scope of PAS 39 ‘Financial instruments: Recognition and measurement’. The amendment did not have a significant effect on the BPI Group’s financial statements.
Amendment to PAS 16, ‘Property, plant and equipment’ and PAS 38 ‘Intangible assets’ on proportionate restatement of accumulated depreciation using the revaluation method. This amendment clarifies how the gross carrying amount and accumulated depreciation are treated where an entity measures its assets at revalued amounts. The amendment did not have a significant effect on the BPI Group’s financial statements.
Amendments to PAS 24, ‘Related party disclosures’ on key management personnel. This amendment clarifies that where an entity receives management personnel services from a third party (a management entity), the fees paid for those services must be disclosed by the reporting entity, but not the compensation paid by the management entity to its employees or directors. The amendment did not have a significant effect on the BPI Group’s financial statements.
Amendments to PAS 40, ‘Investment property’ on mutual exclusivity of PAS 40 and PFRS 3, ‘Business combinations’. This amendment clarifies that PAS 40 and PFRS 3 are not mutually exclusive when distinguishing between investment property and owner- occupied property and determining whether the acquisition of an investment property is a business combination. The amendment did not have a significant effect on the BPI Group’s financial statements.
Other standards, amendments and interpretations which are effective for the financial year beginning on January 1, 2015 are considered not relevant to the BPI Group.
(b) New standards, amendments and interpretations not yet adopted
A number of new standards and amendments to standards and interpretations are effective for annual periods beginning after January 1, 2015, and have not been applied in preparing these financial statements. None of these standards are expected to have a significant effect on the financial statements of the BPI Group, except the following as set out below:
PFRS 9, ‘Financial instruments’ will replace the multiple classification and measurement models in PAS 39 ‘Financial instruments: Recognition and measurement’ with a single model that has initially only two classification categories: amortized cost and fair value. Classification of debt assets will be driven by the entity’s business model for managing the financial assets and the contractual cash flow characteristics of the financial assets. A debt instrument is measured at amortized cost if: a) the objective of the business model is to hold the financial asset for the collection of the contractual cash flows, and b) the contractual cash flows under the instrument solely represent payments of principal and interest. All other debt and equity instruments, including investments in complex debt instruments and equity investments, must be recognized at fair value. All fair value movements on financial assets are taken through the statement of profit or loss, except for equity investments that are not held for trading, which may be recorded in the statement of profit or loss or in reserves (without subsequent recycling to profit or loss). For financial liabilities that are measured under the fair value option, entities will need to recognize the part of the fair value change that is due to changes in their own credit risk in other comprehensive income rather than profit or loss. The new hedge accounting rules (released in December 2013) align hedge accounting more closely with common risk management practices. As a general rule, it will be easier to apply hedge accounting going forward. The new standard also introduces expanded disclosure requirements and changes in presentation. In December 2014, the International Accounting Standards Board (IASB) made further changes to the classification and measurement rules and also introduced a new impairment model. With these amendments, PFRS 9 is now complete. The changes introduce: (1) a third measurement category (FVOCI) for certain financial assets that are debt instruments, and (2) a new expected credit loss (ECL) model which involves a three-stage approach whereby financial assets move through the three stages as their credit quality changes. The stage dictates how an entity measures impairment losses and applies the effective interest rate method. A simplified approach is permitted for financial assets that do not have a significant financing component (e.g. trade receivables). On initial recognition, entities will record a day-1 loss equal to the 12-month ECL (or lifetime ECL for trade receivables), unless the assets are considered credit impaired.

(80)
For financial years commencing before February 1, 2015, entities can elect to apply PFRS 9 early for any of the following: (1) the own credit risk requirements for financial liabilities, (2) classification and measurement (C&M) requirements for financial assets, (3) C&M requirements for financial assets and financial liabilities, or (4) C&M requirements for financial assets and liabilities and hedge accounting. After February 1, 2015, the new rules must be adopted in their entirety. The standard is effective for accounting periods beginning on or after January 1, 2018. Early adoption is permitted. The BPI Group is assessing the full impact of PFRS 9.
PFRS 15, ‘Revenue from contracts with customers’ will replace PAS 18, ‘Revenue’ which covers contracts for goods and services and PAS 11, ‘Construction contracts’ which covers construction contracts. The new standard is based on the principle that revenue is recognized when control of a good or service transfers to a customer – so the notion of control replaces the existing notion of risks and rewards. A new five-step process must be applied before revenue can be recognized: (1) identify contracts with customers, (2) identify the separate performance obligation, (3) determine the transaction price of the contract, (4) allocate the transaction price to each of the separate performance obligations, and (5) recognize the revenue as each performance obligation is satisfied. Key changes to current practice are: (1) Any bundled goods or services that are distinct must be separately recognized, and any discounts or rebates on the contract price must generally be allocated to the separate elements; (2) Revenue may be recognized earlier than under current standards if the consideration varies for any reasons (such as for incentives, rebates, performance fees, royalties, and success of an outcome) – minimum amounts must be recognized if they are not at significant risk of reversal; (3) The point at which revenue is able to be recognized may shift: some revenue which is currently recognized at a point in time at the end of a contract may have to be recognized over the contract term and vice versa; (4) There are new specific rules on licenses, warranties, non-refundable upfront fees and, consignment arrangements, to name a few; and (5) As with any new standard, there are also increased disclosures. These accounting changes may have flow-on effects on the entity’s business practices regarding systems, processes and controls, compensation and bonus plans, contracts, tax planning and investor communications. The standard is effective for annual periods beginning on or after January 1, 2018 and earlier application is permitted. Entities will have a choice of full retrospective application, or prospective application with additional disclosures. The BPI Group is assessing the impact of PFRS 15.
IFRS 16, ‘Leases’ will replace the current guidance in PAS 17, ‘Leases’. This will require far-reaching changes in accounting by lessees in particular. Under PAS 17, lessees are required to make a distinction between a finance lease (on balance sheet) and an operating lease (off-balance sheet). IFRS 16 will require lessees to recognize a lease liability reflecting future lease payments and a ‘right-of-use asset’ for virtually all lease contracts. The IASB has included an optional exemption for certain short-term leases and leases of low-value assets; however, this exemption can only be applied by lessees. For lessors, the accounting stays almost the same. However, as the IASB has updated the guidance on the definition of a lease (as well as the guidance on the combination and separation of contracts), lessors will also be affected by the new standard. Under the new standard, a contract is, or contains, a lease if the contract conveys the right to control the use of an identified asset for a period of time in exchange for consideration. At the very least, the new accounting model for lessees is expected to impact negotiations between lessors and lessees. The standard is effective for annual reporting periods beginning on or after January 1, 2019. Earlier application is permitted, but only in conjunction with PFRS 15. In order to facilitate transition, entities can choose a ‘simplified approach’ that includes certain reliefs related to the measurement of the right of-use asset and the lease liability, rather than full retrospective application; furthermore, the ‘simplified approach’ does not require a restatement of comparatives. In addition, as a practical expedient entities are not required to reassess whether a contract is, or contains, a lease at the date of initial application (that is, such contracts are “grandfathered”). The BPI Group is assessing the impact of IFRS 16.
There are no other standards, amendments or interpretations that are not yet effective that have a material impact on the BPI Group.

(81)
32.3 Consolidation The consolidated financial statements comprise the financial statements of the BPI Group as at December 31, 2015 and 2014. The subsidiaries financial statements are prepared for the same reporting year as the Parent Bank. The consolidated financial statements include the financial statements of the Parent Bank and the following subsidiaries as at December 31:
Subsidiaries
Country of incorporation Principal activities
% of ownership
2015 2014
BPI Family Savings Bank, Inc. Philippines Banking 100 100
BPI Capital Corporation Philippines Investment house 100 100
BPI Direct Savings Bank, Inc. Philippines Banking 100 100
BPI International Finance Limited Hong Kong Financing 100 100
BPI Europe Plc. England and Wales Banking (deposit) 100 100
BPI Securities Corp. Philippines Securities dealer 100 100
BPI Card Finance Corp. Philippines Financing 100 100
Filinvest Algo Financial Corp. Philippines Financing 100 100
BPI Investment Management Inc. Philippines Investment management 100 100
Santiago Land Dev. Corp. Philippines Land holding 100 100
BPI Operations Management Corp. Philippines Operations management 100 100
BPI Computer Systems Corp. Philippines Business systems service 100 100
BPI Foreign Exchange Corp. Philippines Foreign exchange 100 100
BPI Express Remittance Corp. USA USA Remittance 100 100
BPI Express Remittance Corp. Nevada USA Remittance - 100
BPI Express Remittance Center HK (Ltd.) Hong Kong Remittance 100 100
Green Enterprises S. R. L. in Liquidation (formerly BPI Express Remittance Europe, S.p.A.) Italy Remittance 100 100
First Far - East Development Corporation Philippines Real estate 100 100
FEB Stock Brokers, Inc. Philippines Securities dealer 100 100
BPI Express Remittance Spain S.A Spain Remittance 100 100
FEB Speed International Philippines Remittance 100 100
AF Holdings and Management Corp. Philippines Financial management
consultancy 100 100
Ayala Plans, Inc. Philippines Pre-need 98.67 98.67
FGU Insurance Corporation Philippines Non-life insurance 94.62 94.62
BPI Century Tokyo Lease and Finance Corporation (formerly BPI Leasing Corporation) Philippines Leasing 51 51
BPI Century Tokyo Rental Corporation (formerly BPI Rental Corporation) Philippines Rental 51 51
CityTrust Securities Corporation Philippines Securities dealer 51 51
BPI/MS Insurance Corporation Philippines Non-life insurance 50.85 50.85
BPI Globe BanKO, Inc. Philippines Banking 40 40
BPI has control over BPI Globe BanKO, Inc. since BPI directs the relevant activities of the latter and has the decision making rights on BPI Globe BanKO, Inc.

(82)
On December 23, 2014, BPI sold its 49% interest in BPI Leasing Corporation to Century Tokyo Leasing Corporation for a total consideration of P1,744 million, thereby bringing its remaining ownership interest to 51%. The BPI Group recognized an increase in non-controlling interest of P1,231 million and an increase in equity attributable to owners of the Parent Bank of P336 million. The name of BPI Leasing has also been changed to BPI Century Tokyo Lease and Finance Corporation as a consequence of the sale. In addition, the Parent Bank’s effective ownership in BPI Century Tokyo Rental Corporation and CityTrust Securities Corporation, both wholly-owned subsidiaries of BPI Century Tokyo Lease and Finance Corporation, has been reduced to 51% each as at December 31, 2014. The effect of change in the ownership interest in BPI Century Tokyo Lease and Finance Corporation on the equity attributable to owners of BPI Parent as at December 31, 2014 is summarized as follows:
(In Millions of Pesos)
Consideration received from non-controlling interest 1,744 Carrying amount of non-controlling interest sold, including related cost 1,408
Excess of consideration received recognized in equity 336
At BPI Parent, the gain from sale recognized in the statement of income for the year ended December 31, 2014 amounts to P1,428 million. (a) Subsidiaries Subsidiaries are all entities over which the BPI Group has control. The BPI Group controls an entity when it is exposed to, or has rights to, variable returns from its involvement with the entity and has the ability to affect those returns through its power over the entity. The BPI Group also assesses existence of control where it does not have more than 50% of the voting power but is able to govern the financial and operating policies by virtue of de-facto control. De-facto control may arise in circumstances where the size of the BPI Group’s voting rights relative to the size and dispersion of holdings of other shareholders give the BPI Group the power to govern the financial and operating policies. Subsidiaries are fully consolidated from the date on which control is transferred to the BPI Group. They are de-consolidated from the date that control ceases. The BPI Group applies the acquisition method of accounting to account for business combinations. The consideration transferred for the acquisition of a subsidiary is the fair values of the assets transferred, the liabilities incurred to the former owners of the acquiree and the equity interests issued by the BPI Group. The consideration transferred includes the fair value of any asset or liability resulting from a contingent consideration arrangement. Acquisition-related costs are expensed as incurred. Identifiable assets acquired and liabilities and contingent liabilities assumed in a business combination are measured initially at their fair values at the acquisition date. On an acquisition-by-acquisition basis, the BPI Group recognizes any non-controlling interest in the acquiree either at fair value or at the non-controlling interest’s proportionate share of the acquiree’s identifiable net assets. Acquisition-related costs are expensed as incurred. If the business combination is achieved in stages, the acquisition date carrying value of the acquirer’s previously held equity interest in the acquiree is remeasured to fair value at the acquisition date through profit or loss. Any contingent consideration to be transferred by the BPI Group is recognized at fair value at the acquisition date. Subsequent changes to the fair value of the contingent consideration that is deemed to be an asset or liability is recognized in accordance with PAS 39 either in profit or loss or as a change to other comprehensive income. Contingent consideration that is classified as equity is not re-measured, and its subsequent settlement is not accounted for within equity. The excess of the aggregate of the consideration transferred, the amount of any non-controlling interest in the acquiree and the acquisition-date fair value of any previous equity interest in the acquiree over the fair value of the BPI Group’s share of the identifiable net assets acquired is recorded as goodwill. If the total of consideration transferred, non-controlling interest recognized and previously held interest measured is less than the fair value of the net assets of the subsidiary acquired in the case of a bargain purchase, the difference is recognized directly in profit or loss.

(83)
Inter-company transactions, balances and unrealized gains on transactions between group companies are eliminated. Unrealized losses are also eliminated. Accounting policies of subsidiaries have been changed where necessary to ensure consistency with the policies adopted by the BPI Group, except for the pre-need subsidiary which follows the provisions of the PNUCA as allowed by the SEC. When the BPI Group ceases to have control, any retained interest in the entity is re-measured to its fair value at the date when control is lost, with the change in carrying amount recognized in profit or loss. The fair value is the initial carrying amount for purposes of subsequently accounting for the retained interest as an associate, joint venture or financial asset. In addition, any amounts previously recognized in other comprehensive income in respect of that entity are accounted for as if the BPI Group had directly disposed of the related assets or liabilities. This may mean that amounts previously recognized in other comprehensive income are reclassified to profit or loss. (b) Transactions with non-controlling interests Transactions with non-controlling interests that do not result in loss of control are accounted for as equity transactions - that is, as transactions with the owners in their capacity as owners. For purchases from non-controlling interests, the difference between any consideration paid and the relevant share acquired of the carrying value of net assets of the subsidiary is recorded in equity. Gains or losses on disposals to non-controlling interests are also recorded in equity. Interests in the equity of subsidiaries not attributable to the Parent Bank are reported in consolidated equity as non-controlling interests. Profits or losses attributable to non-controlling interests are reported in the statement of income as net income (loss) attributable to non-controlling interests. (c) Associates Associates are all entities over which the BPI Group has significant influence but not control, generally accompanying a shareholding of between 20% and 50% of the voting rights. Investments in associates in the consolidated financial statements are accounted for using the equity method of accounting. Under the equity method, the investment is initially recognized at cost and the carrying amount is increased or decreased to recognize the investor’s share of the profit or loss of the investee after the date of acquisition. The BPI Group’s investment in associates includes goodwill identified on acquisition (net of any accumulated impairment loss). If the ownership interest in an associate is reduced but significant influence is retained, a proportionate share of the amounts previously recognized in other comprehensive income is reclassified to profit or loss where appropriate. The BPI Group’s share of its associates’ post-acquisition profits or losses is recognized in profit or loss, and its share of post-acquisition movements in reserves is recognized in other comprehensive income. The cumulative post-acquisition movements are adjusted against the carrying amount of the investment. When the BPI Group’s share of losses in an associate equals or exceeds its interest in the associate, including any other unsecured receivables, the BPI Group does not recognize further losses, unless it has incurred legal or constructive obligations or made payments on behalf of the associate. The BPI Group determines at each reporting date whether there is any objective evidence that the investment in the associate is impaired. If this is the case, the BPI Group calculates the amount of impairment as the difference between the recoverable amount of the associate and its carrying value and recognizes the amount adjacent to ‘share of profit (loss) of an associate’ in profit or loss. Unrealized gains on transactions between the BPI Group and its associates are eliminated to the extent of the BPI Group’s interest in the associates. Unrealized losses are also eliminated unless the transaction provides evidence of an impairment of the asset transferred. Accounting policies of associates have been changed where necessary to ensure consistency with the policies adopted by the BPI Group.

(84)
32.4 Investments in subsidiaries and associates Investments in subsidiaries and associates in the Parent Bank’s separate financial statements are accounted for using the cost method in accordance with PAS 27. Under this method, income from investment is recognized in profit or loss only to the extent that the investor receives distributions from accumulated profits of the investee arising after the acquisition date. Distributions received in excess of such profits are regarded as a recovery of investment and are recognized as reduction of the cost of the investment. The Parent Bank recognizes a dividend from a subsidiary or associate in profit or loss in its separate financial statements when its right to receive the dividend is established. The Parent Bank determines at each reporting date whether there is any indicator of impairment that the investment in the subsidiary or associate is impaired. If this is the case, the Parent Bank calculates the amount of impairment as the difference between the recoverable amount and carrying value and the difference is recognized in profit or loss. Investments in subsidiaries and associates are derecognized upon disposal or when no future economic benefits are expected to be derived from the subsidiaries and associates at which time the cost and the related accumulated impairment loss are removed in the statement of condition. Any gains and losses on disposal is determined by comparing the proceeds with the carrying amount of the investment and recognized in profit or loss. 32.5 Segment reporting Operating segments are reported in a manner consistent with the internal reporting provided to the chief executive officer who allocates resources to, and assesses the performance of the operating segments of the BPI Group. All transactions between business segments are conducted on an arm´s length basis, with intra-segment revenue and costs being eliminated upon consolidation. Income and expenses directly associated with each segment are included in determining business segment performance. In accordance with PFRS 8, the BPI Group has the following main banking business segments: consumer banking, corporate banking and investment banking. Its insurance business is assessed separately from these banking business segments (Note 3). 32.6 Cash and cash equivalents Cash and cash equivalents consist of Cash and other cash items, Due from BSP, Due from other banks, and Interbank loans receivable and securities purchased under agreements to resell with maturities of less than three months from the date of acquisition and that are subject to insignificant risk of changes in value. 32.7 Repurchase and reverse repurchase agreements Securities sold subject to repurchase agreements (‘repos’) are reclassified in the financial statements as pledged assets when the transferee has the right by contract or custom to sell or repledge the collateral; the counterparty liability is included in deposits from banks or deposits from customers, as appropriate. The difference between sale and repurchase price is treated as interest and accrued over the life of the agreements using the effective interest method. Securities purchased under agreements to resell (‘reverse repos’) are recorded as loans and advances to other banks and customers and included in the statement of condition under “Interbank loans receivable and securities purchased under agreements to resell”. Securities lent to counterparties are also retained in the financial statements.
(85)
32.8 Financial assets 32.8.1 Classification The BPI Group classifies its financial assets in the following categories: financial assets at fair value through profit or loss, loans and receivables, held-to-maturity securities and available-for-sale securities. The classification depends on the purpose for which the financial assets are acquired. Management determines the classification of its financial assets at initial recognition. (a) Financial assets at fair value through profit or loss This category has two sub-categories: financial assets held for trading and those designated at fair value through profit or loss at inception. A financial asset is classified as held for trading if it is acquired principally for the purpose of selling or repurchasing it in the near term or if it is part of a portfolio of identified financial instruments that are managed together and for which there is evidence of a recent actual pattern of short-term profit-taking. Financial assets held for trading (other than derivatives) are shown as “Trading securities” in the statement of condition. Derivatives are also categorized as held for trading unless they are designated as hedging instruments. Financial assets designated at fair value through profit or loss at inception are those that are managed and their performance is evaluated on a fair value basis, in accordance with a documented investment strategy. Information about these financial assets is provided internally on a fair value basis to the BPI Group’s key management personnel. The BPI Group has no financial assets that are specifically designated at fair value through profit or loss. (b) Loans and receivables Loans and receivables are non-derivative financial assets with fixed or determinable payments: (i) that are not quoted in an active market, (ii) with no intention of being traded, and (iii) that are not designated as available-for-sale. Significant accounts falling under this category include loans and advances, cash and other cash items, due from BSP and other banks, interbank loans receivable and securities purchased under agreements to resell and accounts receivable included under other resources. (c) Held-to-maturity securities Held-to-maturity securities are non-derivative financial assets with fixed or determinable payments and fixed maturities that the BPI Group’s management has the positive intention and ability to hold to maturity. If the BPI Group were to sell other than an insignificant amount of held-to-maturity assets, the entire category would be tainted and reclassified as available-for-sale. (d) Available-for-sale securities Available-for-sale securities are non-derivative financial assets that are either designated in this category or not classified in any of the other categories. 32.8.2 Recognition and measurement
(a) Initial recognition and measurement Regular-way purchases and sales of financial assets at fair value through profit or loss, held-to-maturity securities and available-for-sale securities are recognized on trade date, the date on which the BPI Group commits to purchase or sell the asset. Loans and receivables are recognized upon origination when cash is advanced to the borrowers or when the right to receive payment is established. Financial assets not carried at fair value through profit or loss are initially recognized at fair value plus transaction costs. Financial assets carried at fair value through profit or loss are initially recognized at fair value; and transaction costs are recognized in profit or loss.

(86)
(b) Subsequent measurement Available-for-sale securities and financial assets at fair value through profit or loss are subsequently carried at fair value. Loans and receivables and held-to-maturity securities are subsequently carried at amortized cost. Amortized cost is the amount at which the financial instrument was recognized at initial recognition less any principal repayments, plus accrued interest, and for financial assets less any write-down for incurred impairment losses. Accrued interest includes amortization of transaction costs deferred at initial recognition and of any premium or discount to maturity amount using the effective interest method. Accrued interest income, including both accrued coupon and amortized discount or premium (including fees deferred at origination, if any), are not presented separately and are included in the carrying values of the related items in the statement of condition. Gains and losses arising from changes in the fair value of financial assets at fair value through profit or loss are included in the statement of income (as “Trading gain/loss on securities”) in the year in which they arise. Changes in the fair value of monetary and non-monetary securities classified as available-for-sale are recognized directly in other comprehensive income, until the financial asset is derecognized or impaired at which time the cumulative fair value adjustments previously recognized in other comprehensive income should be recognized in profit or loss. However, interest is calculated on these securities using the effective interest method and foreign currency gains and losses on monetary assets classified as available-for-sale are recognized in profit or loss. Dividends on equity instruments are recognized in profit or loss when the BPI Group’s right to receive payment is established. 32.8.3 Reclassification The BPI Group may choose to reclassify a non-derivative financial asset held for trading out of the held-for-trading category if the financial asset is no longer held for the purpose of selling it in the near term. Financial assets other than loans and receivables are permitted to be reclassified out of the held-for-trading category only in rare circumstances arising from a single event that is unusual and highly unlikely to recur in the near term. In addition, the BPI Group may choose to reclassify financial assets that would meet the definition of loans and receivables out of the held-for-trading or available-for-sale categories if the BPI Group has the intention and ability to hold these financial assets for the foreseeable future or until maturity at the date of reclassification. Reclassifications are made at fair value as of the reclassification date. Fair value becomes the new cost or amortized cost as applicable, and no reversals of fair value gains or losses recorded before reclassification date are subsequently made. Effective interest rates for financial assets reclassified to loans and receivables and held-to-maturity categories are determined at the reclassification date. Further increases in estimates of cash flows adjust effective interest rates prospectively. 32.8.4 Derecognition Financial assets are derecognized when the contractual rights to receive the cash flows from these assets have ceased to exist or the assets have been transferred and substantially all the risks and rewards of ownership of the assets are also transferred (that is, if substantially all the risks and rewards have not been transferred, the BPI Group tests control to ensure that continuing involvement on the basis of any retained powers of control does not prevent derecognition). 32.9 Impairment of financial assets (a) Assets carried at amortized cost The BPI Group assesses at each reporting date whether there is objective evidence that a financial asset or group of financial assets is impaired. A financial asset or a group of financial assets is impaired and impairment losses are incurred only if there is objective evidence of impairment as a result of one or more events that occurred after the initial recognition of the asset (a ‘loss event’) and that loss event (or events) has an impact on the estimated future cash flows of the financial asset or group of financial assets that can be reliably estimated.

(87)
The criteria that the BPI Group uses to determine that there is objective evidence of an impairment loss include:
Delinquency in contractual payments of principal or interest;
Cash flow difficulties experienced by the borrower;
Breach of loan covenants or conditions;
Initiation of bankruptcy proceedings;
Deterioration of the borrower’s competitive position; and
Deterioration in the value of collateral.
The BPI Group first assesses whether objective evidence of impairment exists individually for financial assets that are individually significant, and collectively for financial assets that are not individually significant. If the BPI Group determines that no objective evidence of impairment exists for an individually assessed financial asset, whether significant or not, it includes the asset in a group of financial assets with similar credit risk characteristics and collectively assesses them for impairment. Financial assets that are individually assessed for impairment and for which an impairment loss is or continues to be recognized are not included in a collective assessment of impairment. The amount of impairment loss is measured as the difference between the asset’s carrying amount and the present value of estimated future cash flows (excluding future credit losses that have not been incurred) discounted at the financial asset’s original effective interest rate (recoverable amount). The calculation of recoverable amount of a collateralized financial asset reflects the cash flows that may result from foreclosure less costs of obtaining and selling the collateral, whether or not foreclosure is probable. If a loan or held-to-maturity investment has a variable interest rate, the discount rate for measuring any impairment loss is the current effective interest rate determined under the contract. The carrying amount of the asset is reduced through the use of an allowance account and the amount of loss is recognized in profit or loss. For purposes of a collective evaluation of impairment, financial assets are grouped on the basis of similar credit risk characteristics (i.e., on the basis of the BPI Group’s grading process that considers asset type, industry, geographical location, collateral type, past-due status and other relevant factors). Those characteristics are relevant to the estimation of future cash flows for groups of such assets by being indicative of the debtors’ ability to pay all amounts due according to the contractual terms of the assets being evaluated. Future cash flows in a group of financial assets that are collectively evaluated for impairment are estimated on the basis of the contractual cash flows of the assets in the BPI Group and historical loss experience for assets with credit risk characteristics similar to those in the BPI Group. Historical loss experience is adjusted on the basis of current observable data to reflect the effects of current conditions that did not affect the period on which the historical loss experience is based and to remove the effects of conditions in the historical period that do not currently exist. The methodology and assumptions used for estimating future cash flows are reviewed regularly to reduce any differences between loss estimates and actual loss experience. When a loan is uncollectible, it is written off against the related allowance for loan impairment. Such loans are written off after all the necessary procedures have been completed and the amount of loss has been determined. If in a subsequent period, the amount of impairment loss decreases and the decrease can be related objectively to an event occurring after the impairment was recognized (such as an improvement in the debtor’s credit rating), the previously recognized impairment loss is reversed by adjusting the allowance account. Subsequent recoveries of amounts previously written-off are credited to impairment loss in the statement of income. (b) Assets classified as available-for-sale The BPI Group assesses at each reporting date whether there is an objective evidence that a security classified as available-for-sale is impaired. For debt securities, the BPI Group uses the criteria mentioned in (a) above. For an equity security classified as available-for-sale, a significant or prolonged decline in the fair value below cost is considered in determining whether the securities are impaired. Generally, the BPI Group treats ‘significant’ as 20% or more and ‘prolonged’ as greater than twelve months. The cumulative loss (difference between the acquisition cost and the current fair value less any impairment loss on that financial asset previously recognized in profit or loss) is removed from other comprehensive income and recognized in profit or loss when the asset is determined to be impaired. If in a subsequent period, the fair value of a debt instrument previously impaired increases and the increase can be objectively related to an event occurring after the impairment loss was recognized, the impairment loss is reversed through profit or loss. Reversal of impairment losses recognized previously on equity instruments is made directly to other comprehensive income.

(88)
(c) Renegotiated loans Loans that are either subject to individual or collective impairment assessment and whose terms have been renegotiated are no longer considered to be past due but are treated as new loans. 32.10 Financial liabilities 32.10.1 Classification The BPI Group classifies its financial liabilities in the following categories: financial liabilities at fair value through profit or loss and financial liabilities at amortized cost. (a) Financial liabilities at fair value through profit or loss This category comprises two sub-categories: financial liabilities classified as held for trading, and financial liabilities designated by the BPI Group as at fair value through profit or loss upon initial recognition. A financial liability is classified as held for trading if it is acquired or incurred principally for the purpose of selling or repurchasing it in the near term or if it is part of a portfolio of identified financial instruments that are managed together and for which there is evidence of a recent actual pattern of short-term profit-taking. Derivatives are also categorized as held for trading unless they are designated and effective as hedging instruments. Gains and losses arising from changes in fair value of financial liabilities classified as held for trading are included in the statement of income and are reported as “Trading gains/losses”. The BPI Group has no financial liabilities that are designated at fair value through profit loss. (b) Other liabilities measured at amortized cost Financial liabilities that are not classified as at fair value through profit or loss fall into this category and are measured at amortized cost. Financial liabilities measured at amortized cost include deposits from customers and banks, bills payable, amounts due to BSP and other banks, manager’s checks and demand drafts outstanding, subordinated notes and other financial liabilities under deferred credits and other liabilities. 32.10.2 Recognition and measurement
(a) Initial recognition and measurement Financial liabilities not carried at fair value through profit or loss are initially recognized at fair value plus transaction costs. Financial liabilities carried at fair value through profit or loss are initially recognized at fair value; and transaction costs are recognized as expense in profit or loss.
(b) Subsequent measurement
Financial liabilities at fair value through profit or loss are subsequently carried at fair value. Other liabilities are measured at amortized cost using the effective interest method.
32.10.3 Derecognition Financial liabilities are derecognized when they have been redeemed or otherwise extinguished (i.e. when the obligation is discharged or is cancelled or has expired). Collateral (shares and bonds) furnished by the BPI Group under standard repurchase agreements and securities lending and borrowing transactions is not derecognized because the BPI Group retains substantially all the risks and rewards on the basis of the predetermined repurchase price, and the criteria for derecognition are therefore not met. 32.11 Fair value measurement Fair value is the price that would be received to sell an asset or paid to transfer a liability in an orderly transaction between market participants at the measurement date. The fair value of a non-financial asset is measured based on its highest and best use. The asset’s current use is presumed to be its highest and best use.

(89)
The fair value of financial and non-financial liabilities takes into account non-performance risk, which is the risk that the entity will not fulfill an obligation. The BPI Group classifies its fair value measurements using a fair value hierarchy that reflects the significance of the inputs used in making the measurements. The fair value hierarchy has the following levels: Level 1 - Quoted prices (unadjusted) in active markets for identical assets or liabilities. This level includes
listed equity securities and debt instruments on exchanges (for example, Philippine Stock Exchange, Inc., Philippine Dealing and Exchange Corp., etc.).
Level 2 - Inputs other than quoted prices included within Level 1 that are observable for the asset or liability,
either directly (that is, as prices) or indirectly (that is, derived from prices). This level includes the majority of the over-the-counter (“OTC”) derivative contracts. The primary source of input parameters like LIBOR yield curve or counterparty credit risk is Bloomberg.
Level 3 - Inputs for the asset or liability that are not based on observable market data (unobservable inputs). This level includes equity investments and debt instruments with significant unobservable components. This hierarchy requires the use of observable market data when available. The BPI Group considers relevant and observable market prices in its valuations where possible. The BPI Group has no assets or liabilities classified under Level 3 as at December 31, 2015 and 2014.
The appropriate level is determined on the basis of the lowest level input that is significant to the fair value measurement. (a) Financial instruments For financial instruments traded in active markets, the determination of fair values of financial assets and financial liabilities is based on quoted market prices or dealer price quotations. This includes listed equity securities and quoted debt instruments on major exchanges and broker quotes mainly from Bloomberg. A financial instrument is regarded as quoted in an active market if quoted prices are readily and regularly available from an exchange, dealer, broker, industry group, pricing service or regulatory agency, and those prices represent actual and regularly occurring market transactions on an arm’s length basis. If the above criteria are not met, the market is regarded as being inactive. Indications that a market is inactive are when there is a wide bid-offer spread or significant increase in the bid-offer spread or there are few recent transactions. For all other financial instruments, fair value is determined using valuation techniques. In these techniques, fair values are estimated from observable data in respect of similar financial instruments, using models to estimate the present value of expected future cash flows or other valuation techniques, using inputs (for example, LIBOR yield curve, FX rates, volatilities and counterparty spreads) existing at reporting dates. The BPI Group uses widely recognized valuation models for determining fair values of non-standardized financial instruments of lower complexity, such as options or interest rate and currency swaps. For these financial instruments, inputs into models are generally market observable. For more complex instruments, the BPI Group uses internally developed models, which are usually based on valuation methods and techniques generally recognized as standard within the industry. Valuation models are used primarily to value derivatives transacted in the OTC market, unlisted debt securities (including those with embedded derivatives) and other debt instruments for which markets were or have become illiquid. Some of the inputs to these models may not be market observable and are therefore estimated based on assumptions. The fair value of OTC derivatives is determined using valuation methods that are commonly accepted in the financial markets, such as present value techniques and option pricing models. The fair value of foreign exchange forwards is generally based on current forward exchange rates, with the resulting value discounted back to present value. In cases when the fair value of unlisted equity instruments cannot be determined reliably, the instruments are carried at cost less impairment. The fair value for loans and advances as well as liabilities to banks and customers are determined using a present value model on the basis of contractually agreed cash flows, taking into account credit quality, liquidity and costs. The fair values of contingent liabilities and irrevocable loan commitments correspond to their carrying amounts.

(90)
(b) Non-financial assets or liabilities The BPI Group uses valuation techniques that are appropriate in the circumstances and applies the technique consistently. Commonly used valuation techniques are as follows: Market approach - A valuation technique that uses observable inputs, such as prices, broker quotes and
other relevant information generated by market transactions involving identical or comparable assets or group of assets.
Income approach - A valuation technique that converts future amounts (e.g., cash flows or income and expenses) to a single current (i.e., discounted) amount. The fair value measurement is determined on the basis of the value indicated by current market expectations about those future amounts.
Cost approach - A valuation technique that reflects the amount that would be required currently to replace
the service capacity of an asset (often referred to as current replacement cost). The fair values were determined in reference to observable market inputs reflecting orderly transactions, i.e. market listings, published broker quotes and transacted deals from similar and comparable assets, adjusted to determine the point within the range that is most representative of the fair value under current market conditions. The fair values of BPI Group’s investment properties and foreclosed assets (shown as Assets held for sale) fall under level 2 of the fair value hierarchy. The BPI Group has no non-financial assets or liabilities classified under Level 3 as at December 31, 2015 and 2014.

(91)
32.12 Classes of financial instruments The BPI Group classifies the financial instruments into classes that reflect the nature of information and take into account the characteristics of those financial instruments. The classification made can be seen in the table below:
Classes (as determined by the BPI Group)
Categories (as defined by PAS 39) Main classes Sub-classes
Financial assets Financial assets at fair value
through profit or loss - Trading securities
- Debt securities
- Equity securities
- Derivative financial assets
- Cash and other cash items
Loans and receivables
- Loans and advances to banks
- Due from BSP
- Due from other banks
- Interbank loans receivable and securities purchased under agreements to resell
- Loans and advances to customers
- Loans to individuals (retail)
- Real estate mortgages
- Auto loans
- Credit cards
- Others
- Loans to corporate entities
- Large corporate customers
- Small and medium-sized enterprises
- Others - Accounts receivables - Sales contracts receivable - Rental deposits - Other accrued interest and fees receivable
Held-to-maturity investments - Investment securities
(debt securities) - Government - Others
Available-for-sale financial assets
- Investment securities (debt securities)
- Government - Others
- Investment securities (equity securities)
- Listed - Unlisted
Financial liabilities Financial liabilities at fair value through profit or loss
- Derivative financial liabilities
Financial liabilities at amortized cost
- Deposits from customers
- Demand
- Savings
- Time
- Deposits from banks
- Bills payable
- Due to BSP and other banks
- Manager’s check and demand drafts outstanding
- Interest payable
- Unsecured subordinated debt
- Other liabilities - Accounts payable
- Outstanding acceptances
- Dividend payable
Off-balance sheet financial instruments
Loan commitments
Guarantees, acceptances and other financial facilities

(92)
32.13 Offsetting of financial instruments Financial assets and liabilities are offset and the net amount reported in the statement of condition when there is a legally enforceable right to offset the recognized amounts and there is an intention to settle on a net basis, or realize the asset and settle the liability simultaneously. As at December 31, 2015 and 2014, there are no financial assets and liabilities that have been offset. 32.14 Derivative financial instruments Derivatives are initially recognized at fair value on the date on which a derivative contract is entered into and are subsequently re-measured at their fair value. Fair values are obtained from quoted market prices in active markets including recent market transactions, and valuation techniques (for example for structured notes), including discounted cash flow models and options pricing models, as appropriate. All derivatives are carried as assets when fair value is positive and as liabilities when fair value is negative. Certain derivatives embedded in other financial instruments are treated as separate derivatives when their economic characteristics and risks are not closely related to those of the host contract and the host contract is not carried at fair value through profit or loss. The assessment of whether an embedded derivative is required to be separated from the host contract is done when the BPI Group first becomes a party to the contract. Reassessment of embedded derivative is only done when there are changes in the contract that significantly modify the contractual cash flows. The embedded derivatives are measured at fair value with changes in fair value recognized in profit or loss. The BPI Group’s derivative instruments do not qualify for hedge accounting. Changes in the fair value of any derivative instrument that does not qualify for hedge accounting are recognized immediately in the statement of income under “Trading gain/loss on securities”. 32.15 Bank premises, furniture, fixtures and equipment Land and buildings comprise mainly of branches and offices. All bank premises, furniture, fixtures and equipment are stated at historical cost less accumulated depreciation. Historical cost includes expenditure that is directly attributable to the acquisition of an asset which comprises its purchase price, import duties and any directly attributable costs of bringing the asset to its working condition and location for its intended use. Subsequent costs are included in the asset’s carrying amount or are recognized as a separate asset, as appropriate, only when it is probable that future economic benefits associated with the item will flow to the BPI Group and the cost of the item can be measured reliably. All other repairs and maintenance are charged to profit or loss during the year in which they are incurred. Land is not depreciated. Depreciation for buildings and furniture and equipment is calculated using the straight-line method to allocate cost or residual values over the estimated useful lives of the assets, as follows: Building 25-50 years Furniture and equipment 3-5 years Equipment for lease 2-8 years Leasehold improvements are depreciated over the shorter of the lease term (ranges from 5 to 10 years) and the useful life of the related improvement (ranges from 5 to 10 years). Major renovations are depreciated over the remaining useful life of the related asset. The assets’ residual values and useful lives are reviewed, and adjusted if appropriate, at each reporting date. Assets are reviewed for impairment whenever events or changes in circumstances indicate that the carrying amount may not be recoverable. An asset’s carrying amount is written down immediately to its recoverable amount if the asset’s carrying amount is greater than its estimated recoverable amount. The recoverable amount is the higher of an asset’s fair value less costs to sell and value in use. Bank premises, furniture, fixtures and equipment with carrying value of nil were fully impaired as at December 31, 2015 (2014 - P69 million).
(93)
An item of Bank premises, furniture, fixtures and equipment is derecognized upon disposal or when no future economic benefits are expected to arise from the continued use of the asset. Any gain or loss arising on derecognition of the asset (calculated as the difference between the net disposal proceeds and the carrying amount of the item) is included in profit or loss in the period the item is derecognized. 32.16 Investment properties Properties that are held either to earn rental income or for capital appreciation or both, and that are not significantly occupied by the BPI Group are classified as investment properties. Transfers to, and from, investment property are made when, and only when, there is a change in use, evidenced by: (a) Commencement of owner-occupation, for a transfer from investment property to owner-occupied property; (b) Commencement of development with a view of sale, for a transfer from investment property to real
properties held-for-sale and development; (c) End of owner occupation, for a transfer from owner-occupied property to investment property; or (d) Commencement of an operating lease to another party, for a transfer from real properties held-for-sale and
development to investment property. Transfers to and from investment property do not result in gain or loss. Investment properties comprise land and building. Investment properties are measured initially at cost, including transaction costs. Subsequent to initial recognition, investment properties are stated at cost less accumulated depreciation and impairment losses, if any. Depreciation on investment property is determined using the same policy as applied to Bank premises, furniture, fixtures, and equipment. Impairment test is conducted when there is an indication that the carrying amount of the asset may not be recovered. An impairment loss is recognized for the amount by which the property’s carrying amount exceeds its recoverable amount, which is the higher of the property’s fair value less costs to sell and value in use. An item of investment property is derecognized upon disposal or when no future economic benefits are expected to arise from the continued use of the asset. Any gains and losses arising on derecognition of the asset (calculated as the difference between the net disposal proceeds and the carrying amount of the item) is included in profit or loss in the period the item is derecognized. 32.17 Foreclosed assets Assets foreclosed shown as Assets held for sale in the statement of condition are accounted for at the lower of cost and fair value less cost to sell similar to the principles of PFRS 5. The cost of assets foreclosed includes the carrying amount of the related loan less allowance for impairment at the time of foreclosure. Impairment loss is recognized for any subsequent write-down of the asset to fair value less cost to sell. Foreclosed assets not classified as Assets held for sale are accounted for in any of the following classification using the measurement basis appropriate to the asset as follows: (a) Investment property is accounted for using the cost model under PAS 40; (b) Bank-occupied property is accounted for using the cost model under PAS 16; and (c) Financial assets are classified as available-for-sale. 32.18 Intangible assets (a) Goodwill Goodwill represents the excess of the cost of an acquisition over the fair value of the BPI Group’s share in the net identifiable assets of the acquired subsidiary/associate at the date of acquisition. Goodwill on acquisitions of subsidiaries is included under Other resources in the statement of condition. Goodwill on acquisitions of associates is included in Investments in subsidiaries and associates. Separately recognized goodwill is carried at cost less accumulated impairment losses. Gains and losses on the disposal of a subsidiary/associate include carrying amount of goodwill relating to the subsidiary/associate sold. Goodwill is an indefinite-lived intangible asset and hence not subject to amortization.

(94)
Goodwill is allocated to cash-generating units for the purpose of impairment testing. Each cash-generating unit is represented by each primary reporting segment. Goodwill impairment reviews are undertaken annually or more frequently if events or changes in circumstances indicate a potential impairment. The carrying value of goodwill is compared to the recoverable amount, which is the higher of value in use and the fair value less costs to sell. Any impairment is recognized immediately as an expense and is not subsequently reversed. (b) Contractual customer relationships Contractual customer relationships acquired in a business combination are recognized at fair value at the acquisition date. The contractual customer relationships have finite useful lives and are carried at cost less accumulated amortization. Amortization is calculated using the straight-line method over the expected life of the customer relationship. Contractual customer relationship is nil as at December 31, 2015 and 2014. (c) Computer software Acquired computer software licenses are capitalized on the basis of the costs incurred to acquire and bring to use the specific software. These costs are amortized on a straight-line basis over the expected useful lives (three to five years). Computer software is included under Other resources in the statement of condition. Costs associated with maintaining computer software programs are recognized as an expense as incurred. Development costs that are directly attributable to the design and testing of identifiable and unique software products controlled by the BPI Group are recognized as intangible assets when the following criteria are met: it is technically feasible to complete the software product so that it will be available for use;
management intends to complete the software product and use or sell it;
there is an ability to use or sell the software product;
it can be demonstrated how the software product will generate probable future economic benefits;
adequate technical, financial and other resources to complete the development and to use or sell the software product are available; and
the expenditure attributable to the software product during its development can be reliably measured.
Directly attributable costs that are capitalized as part of the software product include the software development employee costs and an appropriate portion of relevant overheads. Other development expenditures that do not meet these criteria are recognized as an expense when incurred. Development costs previously recognized as an expense are not recognized as an asset in a subsequent period.
32.19 Impairment of non-financial assets Assets that have indefinite useful lives - for example, goodwill or intangible assets not ready for use - are not subject to amortization and are tested annually for impairment and more frequently if there are indicators of impairment. Assets that have definite useful lives are subject to amortization and are reviewed for impairment whenever events or changes in circumstances indicate that the carrying amount may not be recoverable. An impairment loss is recognized for the amount by which the asset’s carrying amount exceeds its recoverable amount. The recoverable amount is the higher of an asset’s fair value less costs to sell and value in use. For purposes of assessing impairment, assets are grouped at the lowest levels for which there are separately identifiable cash flows (cash-generating units). Non-financial assets other than goodwill that suffered impairment are reviewed for possible reversal of impairment at each reporting date. 32.20 Borrowings and borrowing costs The BPI Group’s borrowings consist mainly of bills payable and unsecured subordinated debt. Borrowings are recognized initially at fair value, being their issue proceeds, net of transaction costs incurred. Borrowings are subsequently carried at amortized cost; any difference between the proceeds (net of transaction costs) and the redemption value is recognized in profit or loss over the period of the borrowings using the effective interest method. Borrowing costs that are directly attributable to the acquisition, construction or production of a qualifying asset are capitalized as part of the cost of the asset. All other borrowing costs are expensed as incurred. The BPI Group has no qualifying asset as at December 31, 2015 and 2014.

(95)
32.21 Interest income and expense Interest income and expense are recognized in profit or loss for all interest-bearing financial instruments using the effective interest method. The effective interest method is a method of calculating the amortized cost of a financial asset or a financial liability and of allocating the interest income or interest expense over the relevant period. The effective interest rate is the rate that exactly discounts estimated future cash payments or receipts through the expected life of the financial instrument or, when appropriate, a shorter period to the net carrying amount of the financial asset or financial liability. When calculating the effective interest rate, the BPI Group estimates cash flows considering all contractual terms of the financial instrument but does not consider future credit losses. The calculation includes all fees paid or received between parties to the contract that are an integral part of the effective interest rate, transaction costs and all other premiums or discounts. Once a financial asset or a group of similar financial assets has been written down as a result of an impairment loss, interest income is recognized using the rate of interest used to discount the future cash flows for the purpose of measuring impairment loss. 32.22 Fees and commission income Fees and commissions are generally recognized on an accrual basis when the service has been provided. Commission and fees arising from negotiating or participating in the negotiation of a transaction for a third party (i.e. the arrangement of the acquisition of shares or other securities, or the purchase or sale of businesses) are recognized on completion of underlying transactions. Portfolio and other management advisory and service fees are recognized based on the applicable service contracts, usually on a time-proportionate basis. Asset management fees related to investment funds are recognized ratably over the period in which the service is provided. 32.23 Dividend income Dividend income is recognized in profit or loss when the BPI Group’s right to receive payment is established. 32.24 Credit card income Credit card income is recognized upon receipt from merchants of charges arising from credit card transactions. These are computed based on rates agreed with merchants and are deducted from the payments to establishments. 32.25 Foreign currency translation (a) Functional and presentation currency Items in the financial statements of each entity in the BPI Group are measured using the currency of the primary economic environment in which the entity operates (the “functional currency”). The financial statements are presented in Philippine Peso, which is the Parent Bank’s functional and presentation currency.

(96)
(b) Transactions and balances Foreign currency transactions are translated into the functional currency using the exchange rates prevailing at the dates of the transactions or valuation where items are remeasured. Foreign exchange gains and losses resulting from the settlement of such transactions and from the translation at year-end exchange rates of monetary assets and liabilities denominated in foreign currencies are recognized in profit or loss. Non-monetary items measured at historical cost denominated in a foreign currency are translated at exchange rates as at the date of initial recognition. Non-monetary items in a foreign currency that are measured at fair value are translated using the exchange rates at the date when the fair value is determined. Changes in the fair value of monetary securities denominated in foreign currency classified as available-for-sale are analyzed between translation differences resulting from changes in the amortized cost of the security, and other changes in the carrying amount of the security. Translation differences are recognized in profit or loss, and other changes in carrying amount are recognized in other comprehensive income. Translation differences on non-monetary financial instruments, such as equities held at fair value through profit or loss, are reported as part of the fair value gain or loss recognized under “Trading gain (loss)” in the statement of income. Translation differences on non-monetary financial instruments, such as equities classified as available-for-sale, are included in Accumulated other comprehensive income (loss) in the capital funds. (c) Foreign subsidiaries The results and financial position of BPI’s foreign subsidiaries (none of which has the currency of a hyperinflationary economy) that have a functional currency different from the presentation currency are translated into the presentation currency as follows: (i) assets and liabilities are translated at the closing rate at reporting date; (ii) income and expenses are translated at average exchange rates (unless this average is not a reasonable
approximation of the cumulative effect of the rates prevailing on the transaction dates, in which case income and expenses are translated at the dates of the transactions); and
(iii) all resulting exchange differences are recognized as a separate component (Translation adjustments) of
Accumulated other comprehensive income (loss) in the capital funds. When a foreign operation is sold, such exchange differences are recognized in profit or loss as part of the gain or loss on sale.
32.26 Accrued expenses and other liabilities Accrued expenses and other liabilities are recognized in the period in which the related money, goods or services are received or when a legally enforceable claim against the BPI Group is established. 32.27 Provisions for legal or contractual obligations Provisions are recognized when all of the following conditions are met: (i) the BPI Group has a present legal or constructive obligation as a result of past events; (ii) it is probable that an outflow of resources will be required to settle the obligation; and (iii) the amount has been reliably estimated. Provisions are not recognized for future operating losses. Where there are a number of similar obligations, the likelihood that an outflow will be required in settlement is determined by considering the class of obligations as a whole. A provision is recognized even if the likelihood of an outflow with respect to any one item is included in the same class of obligations may be small. Provisions are measured at the present value of the expenditures expected to be required to settle the obligation using a pre-tax rate that reflects the current market assessments of the time value of money and the risk specific to the obligation. The increase in the provision due to the passage of time is recognized as interest expense.

(97)
32.28 Income taxes (a) Current income tax Income tax payable is calculated on the basis of the applicable tax law in the respective jurisdiction and is recognized as an expense for the year except to the extent that current tax is related to items (for example, current tax on available-for-sale investments) that are charged or credited in other comprehensive income or directly to capital funds. The BPI Group has substantial income from its investment in government securities subject to final withholding tax. Such income is presented at its gross amount and the final tax paid or withheld is included in Provision for income tax - Current. (b) Deferred income tax
Deferred income tax is recognized on temporary differences arising between the tax bases of assets and liabilities and their carrying amounts in the financial statements. The deferred income tax is not accounted for if it arises from initial recognition of an asset or liability in a transaction, other than a business combination, that at the time of the transaction affects neither accounting nor taxable profit or loss. Deferred income tax is determined using tax rates (and laws) that have been enacted or substantively enacted at the reporting date and are expected to apply when the related deferred income tax asset is realized or the deferred income tax liability is settled. Deferred income tax assets are recognized for all deductible temporary differences, carry-forward of unused tax losses (net operating loss carryover or NOLCO) and unused tax credits (excess minimum corporate income tax or MCIT) to the extent that it is probable that future taxable profit will be available against which the temporary differences, unused tax losses and unused tax credits can be utilized. Deferred income tax liabilities are recognized in full for all taxable temporary differences except to the extent that the deferred tax liability arises from the initial recognition of goodwill. The BPI Group reassesses at each reporting date the need to recognize a previously unrecognized deferred income tax asset. Deferred income tax assets are recognized on deductible temporary differences arising from investments in subsidiaries, and associates and joint arrangements only to the extent that it is probable the temporary difference will reverse in the future and there is sufficient taxable profit available against which the temporary difference can be utilized. Deferred income tax liabilities are provided on taxable temporary differences arising from investments in subsidiaries, and associates and joint arrangements, except for deferred income tax liability where the timing of the reversal of the temporary difference is controlled by the BPI Group and it is probable that the temporary difference will not reverse in the foreseeable future. Generally the BPI Group is unable to control the reversal of the temporary difference for associates except when there is an agreement in place that gives the BPI Group the ability to control the reversal of the temporary difference. Deferred income tax assets and liabilities are offset when there is a legally enforceable right to offset current tax assets against current tax liabilities and when the deferred income taxes assets and liabilities relate to income taxes levied by the same taxation authority on either the taxable entity or different taxable entities where there is an intention to settle the balances on a net basis.
32.29 Employee benefits (a) Pension obligations The BPI Group has a defined benefit plan that shares risks among entities within the group. A defined benefit plan is a pension plan that defines an amount of pension benefit that an employee will receive on retirement, usually dependent on one or more factors such as age, years of service and compensation.

(98)
The liability recognized in the statement of condition in respect of defined benefit pension plan is the present value of the defined benefit obligation at the reporting date less the fair value of plan assets. The defined benefit obligation is calculated annually by independent actuaries using the projected unit credit method. The present value of the defined benefit obligation is determined by discounting the estimated future cash outflows using interest rates of government bonds that are denominated in the currency in which the benefits will be paid, and that have terms to maturity approximating the terms of the related pension liability. Actuarial gains and losses arising from experience adjustments and changes in actuarial assumptions are charged or credited to equity in other comprehensive income in the period in which they arise. Past-service costs are recognized immediately in profit or loss. For individual financial reporting purposes, the unified plan assets are allocated among the BPI Group entities based on the level of the defined benefit obligation attributable to each entity to arrive at the net liability or asset that should be recognized in the individual financial statements.
(b) Share-based compensation The BPI Group engages in equity-settled share-based payment transactions in respect of services received from certain employees. The fair value of the services received is measured by reference to the fair value of the shares or share options granted on the date of the grant. The cost of employee services received in respect of the shares or share options granted is recognized in profit or loss (with a corresponding increase in reserve in capital funds) over the period that the services are received, which is the vesting period. The fair value of the options granted is determined using option pricing models which take into account the exercise price of the option, the current share price, the risk-free interest rate, the expected volatility of the share price over the life of the option and other relevant factors. When the stock options are exercised, the proceeds received, net of any directly attributable transaction costs, are credited to share capital (par value) and share premium for the excess of exercise price over par value. (c) Profit sharing and bonus plans The BPI Group recognizes a liability and an expense for bonuses and profit-sharing, based on a formula that takes into consideration the profit attributable to the Parent Bank’s shareholders after certain adjustments. The BPI Group recognizes a provision where contractually obliged or where there is a past practice that has created a constructive obligation. 32.30 Capital funds Common shares and preferred shares are classified as share capital. Share premium includes any premiums or consideration received in excess of par value on the issuance of share capital. Incremental costs directly attributable to the issue of new shares or options are shown in capital funds as a deduction from the proceeds, net of tax. 32.31 Earnings per share (EPS) Basic EPS is calculated by dividing income applicable to common shares by the weighted average number of common shares outstanding during the year with retroactive adjustments for stock dividends. In case of a rights issue, an adjustment factor is being considered for the weighted average number of shares outstanding for all periods before the rights issue. Diluted EPS is computed in the same manner as basic EPS, however, net income attributable to common shares and the weighted average number of shares outstanding are adjusted for the effects of all dilutive potential common shares.

(99)
32.32 Dividends on common shares Dividends on common shares are recognized as a liability in the BPI Group’s financial statements in the period in which the dividends are approved by the Board of Directors and the BSP. 32.33 Fiduciary activities The BPI Group commonly acts as trustee and in other fiduciary capacities that result in the holding or placing of assets on behalf of individuals, trusts, retirement benefit plans and other institutions. These assets and income arising thereon are excluded from these financial statements, as they are not assets of the BPI Group (Note 26). 32.34 Leases (a) BPI Group is the lessee
(i) Operating lease
Leases in which a significant portion of the risks and rewards of ownership are retained by another party, the lessor, are classified as operating leases. Payments, including prepayments, made under operating leases (net of any incentives received from the lessor) are charged to “Occupancy and equipment-related expenses” in the statement of income on a straight-line basis over the period of the lease. When an operating lease is terminated before the lease period has expired, any payment required to be made to the lessor by way of penalty is recognized as an expense in the period in which the termination takes place.
(ii) Finance lease
Leases of assets, where the BPI Group has substantially all the risks and rewards of ownership, are classified as finance leases. Finance leases are capitalized at the commencement of the lease at the lower of the fair value of the leased property and the present value of the minimum lease payments. Each lease payment is allocated between the liability and finance charges so as to achieve a constant rate on the finance balance outstanding. The interest element of the finance cost is charged to profit or loss over the lease period so as to produce a constant periodic rate of interest on the remaining balance of the liability for each period.
(b) BPI Group is the lessor
(i) Operating lease
Properties (land and building) leased out under operating leases are included in “Investment properties” in the statement of condition. Rental income under operating leases is recognized in profit or loss on a straight-line basis over the period of the lease.
(ii) Finance lease
When assets are leased out under a finance lease, the present value of the lease payments is recognized as a receivable. The difference between the gross receivable and the present value of the receivable is recognized as unearned finance income. Lease income under finance lease is recognized over the term of the lease using the net investment method before tax, which reflects a constant periodic rate of return.

(100)
32.35 Insurance and pre-need operations (a) Non-life insurance The more significant accounting policies observed by the non-life insurance subsidiaries follow: (a) gross premiums written from short-term insurance contracts are recognized at the inception date of the risks underwritten and are earned over the period of cover in accordance with the incidence of risk using the 24th method; (b) acquisition costs are deferred and charged to expense in proportion to the premium revenue recognized; reinsurance commissions are deferred and deducted from the applicable deferred acquisition costs, subject to the same amortization method as the related acquisition costs; (c) a liability adequacy test is performed which compares the subsidiaries’ reported insurance contract liabilities against current best estimates of all contractual future cash flows and claims handling, and policy administration expenses as well as investment income backing up such liabilities, with any deficiency immediately charged to profit or loss; (d) amounts recoverable from reinsurers and loss adjustment expenses are classified as assets, with an allowance for estimated uncollectible amounts; and (e) financial assets and liabilities are measured following the classification and valuation provisions of PAS 39. (b) Pre-need The more significant provisions of the PNUCA as applied by the pre-need subsidiary follow: (a) premium income from sale of pre-need plans is recognized as earned when collected; (b) costs of contracts issued and other direct costs and expenses are recognized as expense when incurred; (c) pre-need reserves which represent the accrued net liabilities of the subsidiary to its plan holders are actuarially computed based on standards and guidelines set forth by the Insurance Commission; the increase or decrease in the account is charged or credited to other costs of contracts issued in profit or loss; and (d) insurance premium reserves which represent the amount that must be set aside by the subsidiary to pay for premiums for insurance coverage of fully paid plan holders, are actuarially computed based on standards and guidelines set forth by the Insurance Commission. 32.36 Related party relationships and transactions Related party relationship exists when one party has the ability to control, directly, or indirectly through one or more intermediaries, the other party or exercises significant influence over the other party in making financial and operating decisions. Such relationship also exists between and/or among entities which are under common control with the reporting enterprise, or between and/or among the reporting enterprise and its key management personnel, directors, or its shareholders. In considering each possible related party relationship, attention is directed to the substance of the relationship, and not merely the legal form. 32.37 Comparatives Except when a standard or an interpretation permits or requires otherwise, all amounts are reported or disclosed with comparative information. Where PAS 8 applies, comparative figures have been adjusted to conform with changes in presentation in the current year. There were no changes to the presentation made during the year. 32.38 Reclassification Certain amounts have been reclassified in the statement of condition to conform with the current year’s presentation. This is not considered material and did not change the amount of total resources as at December 31, 2015 and 2014. 32.39 Subsequent events (or Events after the reporting date) Post year-end events that provide additional information about the BPI Group’s financial position at the reporting date (adjusting events) are reflected in the financial statements. Post year-end events that are not adjusting events are disclosed in the notes to financial statements when material.

(101)
Note 33 - Supplementary information required by the Bureau of Internal Revenue Supplementary information required by Revenue Regulations No. 15-2010 On December 28, 2010, Revenue Regulations (RR) No. 15-2010 became effective and amended certain provisions of RR No. 21-2002 prescribing the manner of compliance with any documentary and/or procedural requirements in connection with the preparation and submission of financial statements and income tax returns. Section 2 of RR No. 21-2002 was further amended to include in the Notes to Financial Statements information on taxes, duties and license fees paid or accrued during the year in addition to what is mandated by PFRS. Below is the additional information required by RR No. 15-2010 that is relevant to the Parent Bank. This information is presented for purposes of filing with the Bureau of Internal Revenue (BIR) and is not a required part of the basic financial statements. (i) Documentary stamp tax
Documentary stamp taxes paid for the year ended December 31, 2015 consist of:
(In Millions of Pesos) Amount
Deposit and loan documents 3,385 Trade finance documents 244 Mortgage documents 141 Others 3
3,773
(ii) Withholding taxes
Withholding taxes paid/accrued and/or withheld for the year ended December 31, 2015 consist of:
(In Millions of Pesos)
Amount
Paid Accrued Total
Income taxes withheld on compensation 1,730 181 1,911
Final income taxes withheld on interest on deposits and yield on deposit substitutes
1,142 137 1,279
Final income taxes withheld on income payment 651 21 672
Creditable income taxes withheld (expanded) 587 33 620
Fringe benefit tax 70 16 86
VAT withholding tax 47 8 55
4,227 396 4,623
(iii) All other local and national taxes
All other local and national taxes paid/accrued for the year ended December 31, 2015 consist of:
(In Millions of Pesos)
Amount
Paid Accrued Total
Gross receipts tax 2,451 224 2,675
Real property tax 96 - 96
Municipal taxes 89 - 89
Others 34 - 34
2,670 224 2,894
(iv) Tax cases and assessments
As at reporting date, the Parent Bank has outstanding cases filed in courts against local government units contesting certain local tax assessments and with the tax authorities contesting certain tax assessments and issuances and for various claims for tax refund. Management is of the opinion that the ultimate outcome of these cases will not have a material impact on the financial statements of the Parent Bank.