bank indonesia strengthening external resilience ......1 bbb / stable baa2 / stable bbb / stable apr...
TRANSCRIPT
July 2019
Bank Indonesia
Strengthening External Resilience, Maintaining Stability
1
BBB / Stable
Baa2 / Stable
BBB / Stable
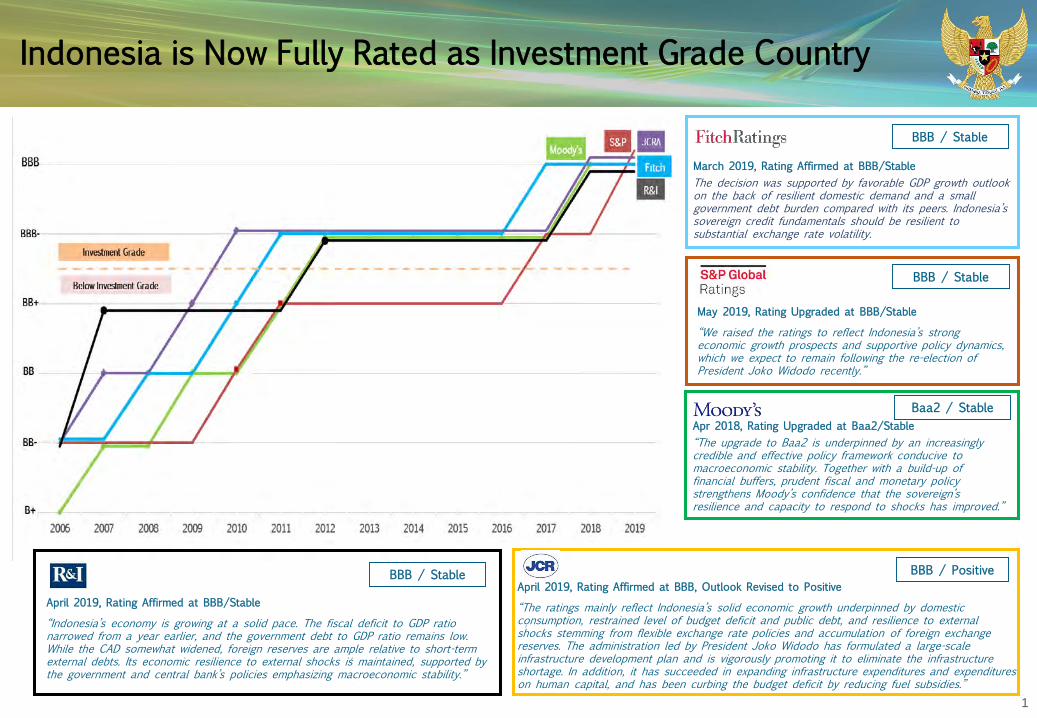
Apr 2018, Rating Upgraded at Baa2/Stable“The upgrade to Baa2 is underpinned by an increasingly credible and effective policy framework conducive to macroeconomic stability. Together with a build-up of financial buffers, prudent fiscal and monetary policy strengthens Moody’s confidence that the sovereign’s resilience and capacity to respond to shocks has improved.”
May 2019, Rating Upgraded at BBB/Stable
“We raised the ratings to reflect Indonesia’s strong economic growth prospects and supportive policy dynamics, which we expect to remain following the re-election of President Joko Widodo recently.”
March 2019, Rating Affirmed at BBB/StableThe decision was supported by favorable GDP growth outlook on the back of resilient domestic demand and a small government debt burden compared with its peers. Indonesia’s sovereign credit fundamentals should be resilient to substantial exchange rate volatility.
BBB / PositiveApril 2019, Rating Affirmed at BBB, Outlook Revised to Positive
“The ratings mainly reflect Indonesia’s solid economic growth underpinned by domestic consumption, restrained level of budget deficit and public debt, and resilience to external shocks stemming from flexible exchange rate policies and accumulation of foreign exchange reserves. The administration led by President Joko Widodo has formulated a large-scale infrastructure development plan and is vigorously promoting it to eliminate the infrastructure shortage. In addition, it has succeeded in expanding infrastructure expenditures and expenditures on human capital, and has been curbing the budget deficit by reducing fuel subsidies.”
BBB / Stable
April 2019, Rating Affirmed at BBB/Stable
“Indonesia’s economy is growing at a solid pace. The fiscal deficit to GDP ratio narrowed from a year earlier, and the government debt to GDP ratio remains low. While the CAD somewhat widened, foreign reserves are ample relative to short-term external debts. Its economic resilience to external shocks is maintained, supported by the government and central bank’s policies emphasizing macroeconomic stability.”
Indonesia is Now Fully Rated as Investment Grade Country
2
Indonesia’s Strong GDP
Growth Prospect
Strong GDP Growth1
%
Institutions 2019 GDP growth (%YoY)
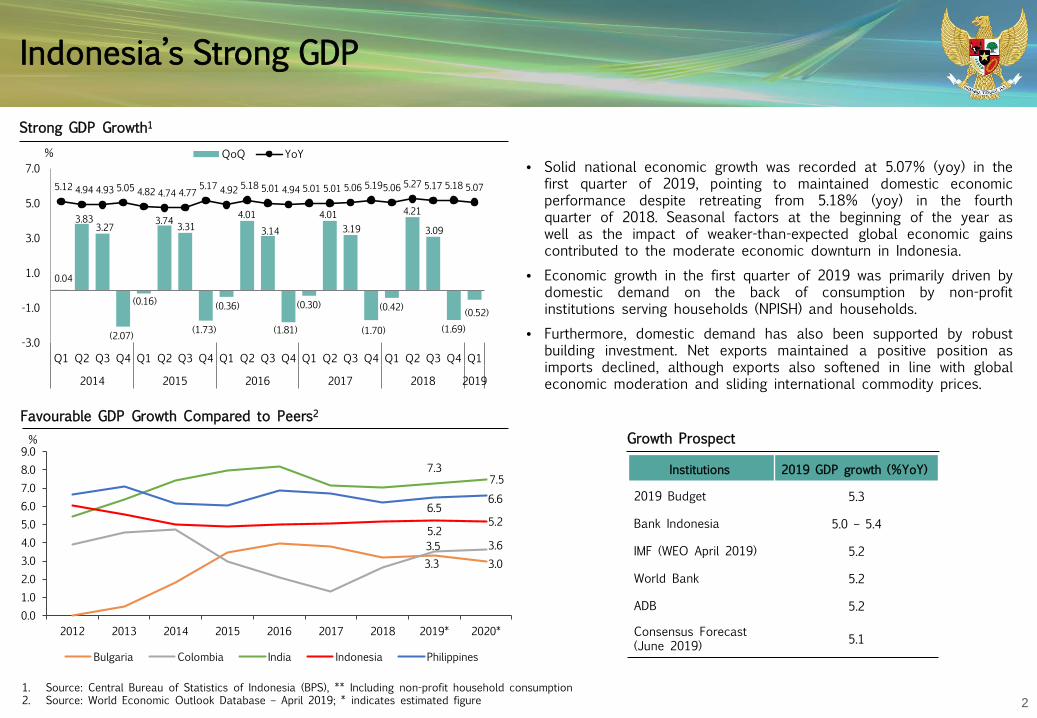
2019 Budget 5.3
Bank Indonesia 5.0 – 5.4
IMF (WEO April 2019) 5.2
World Bank 5.2
ADB 5.2
Consensus Forecast (June 2019) 5.1
Favourable GDP Growth Compared to Peers2
1. Source: Central Bureau of Statistics of Indonesia (BPS), ** Including non-profit household consumption2. Source: World Economic Outlook Database – April 2019; * indicates estimated figure
%
• Solid national economic growth was recorded at 5.07% (yoy) in thefirst quarter of 2019, pointing to maintained domestic economicperformance despite retreating from 5.18% (yoy) in the fourthquarter of 2018. Seasonal factors at the beginning of the year aswell as the impact of weaker-than-expected global economic gainscontributed to the moderate economic downturn in Indonesia.
• Economic growth in the first quarter of 2019 was primarily driven bydomestic demand on the back of consumption by non-profitinstitutions serving households (NPISH) and households.
• Furthermore, domestic demand has also been supported by robustbuilding investment. Net exports maintained a positive position asimports declined, although exports also softened in line with globaleconomic moderation and sliding international commodity prices.
0.04
3.83 3.27
(2.07)
(0.16)
3.74 3.31
(1.73)
(0.36)
4.01 3.14
(1.81)
(0.30)
4.01 3.19
(1.70)
(0.42)
4.21
3.09
(1.69)(0.52)
5.12 4.94 4.93 5.05 4.82 4.74 4.77 5.17 4.92 5.18 5.01 4.94 5.01 5.01 5.06 5.19 5.06 5.27 5.17 5.18 5.07
-3.0
-1.0
1.0
3.0
5.0
7.0
Q1 Q2 Q3 Q4 Q1 Q2 Q3 Q4 Q1 Q2 Q3 Q4 Q1 Q2 Q3 Q4 Q1 Q2 Q3 Q4 Q1
2014 2015 2016 2017 2018 2019
QoQ YoY
3.3 3.03.5 3.6
7.37.5
5.25.2
6.56.6
0.01.02.03.04.05.06.07.08.09.0
2012 2013 2014 2015 2016 2017 2018 2019* 2020*
Bulgaria Colombia India Indonesia Philippines
3
GDP Growth Breakdown
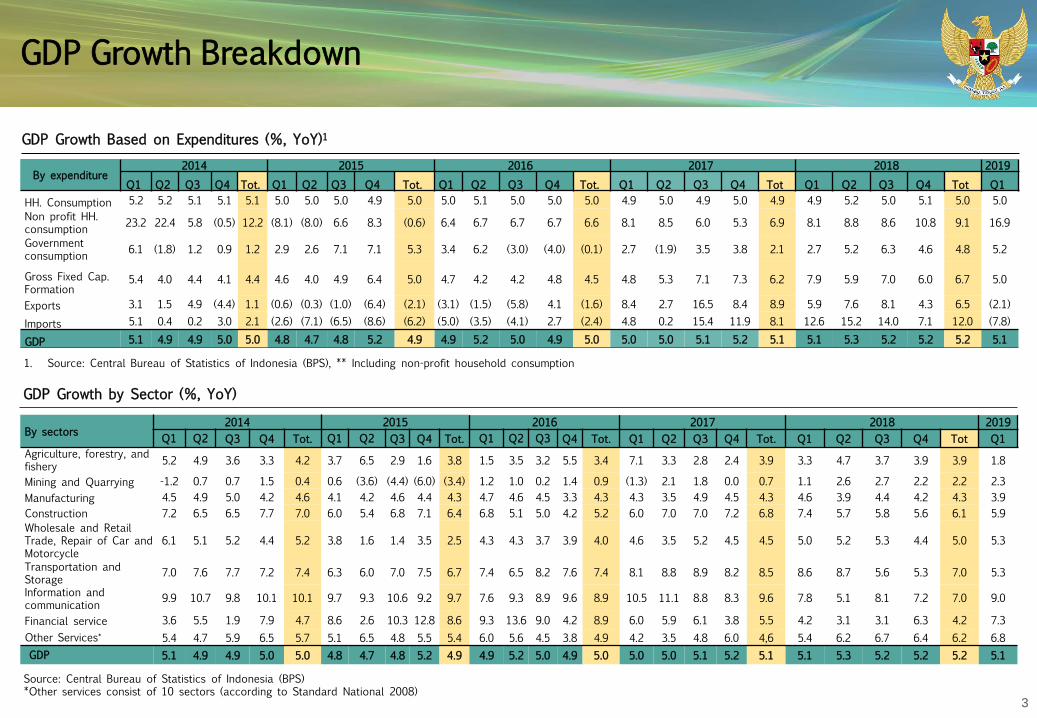
GDP Growth by Sector (%, YoY)
By sectors2014 2015 2016 2017 2018 2019
Q1 Q2 Q3 Q4 Tot. Q1 Q2 Q3 Q4 Tot. Q1 Q2 Q3 Q4 Tot. Q1 Q2 Q3 Q4 Tot. Q1 Q2 Q3 Q4 Tot Q1Agriculture, forestry, and fishery 5.2 4.9 3.6 3.3 4.2 3.7 6.5 2.9 1.6 3.8 1.5 3.5 3.2 5.5 3.4 7.1 3.3 2.8 2.4 3.9 3.3 4.7 3.7 3.9 3.9 1.8
Mining and Quarrying -1.2 0.7 0.7 1.5 0.4 0.6 (3.6) (4.4) (6.0) (3.4) 1.2 1.0 0.2 1.4 0.9 (1.3) 2.1 1.8 0.0 0.7 1.1 2.6 2.7 2.2 2.2 2.3Manufacturing 4.5 4.9 5.0 4.2 4.6 4.1 4.2 4.6 4.4 4.3 4.7 4.6 4.5 3.3 4.3 4.3 3.5 4.9 4.5 4.3 4.6 3.9 4.4 4.2 4.3 3.9Construction 7.2 6.5 6.5 7.7 7.0 6.0 5.4 6.8 7.1 6.4 6.8 5.1 5.0 4.2 5.2 6.0 7.0 7.0 7.2 6.8 7.4 5.7 5.8 5.6 6.1 5.9Wholesale and Retail Trade, Repair of Car and Motorcycle
6.1 5.1 5.2 4.4 5.2 3.8 1.6 1.4 3.5 2.5 4.3 4.3 3.7 3.9 4.0 4.6 3.5 5.2 4.5 4.5 5.0 5.2 5.3 4.4 5.0 5.3
Transportation and Storage 7.0 7.6 7.7 7.2 7.4 6.3 6.0 7.0 7.5 6.7 7.4 6.5 8.2 7.6 7.4 8.1 8.8 8.9 8.2 8.5 8.6 8.7 5.6 5.3 7.0 5.3
Information and communication 9.9 10.7 9.8 10.1 10.1 9.7 9.3 10.6 9.2 9.7 7.6 9.3 8.9 9.6 8.9 10.5 11.1 8.8 8.3 9.6 7.8 5.1 8.1 7.2 7.0 9.0
Financial service 3.6 5.5 1.9 7.9 4.7 8.6 2.6 10.3 12.8 8.6 9.3 13.6 9.0 4.2 8.9 6.0 5.9 6.1 3.8 5.5 4.2 3.1 3.1 6.3 4.2 7.3Other Services* 5.4 4.7 5.9 6.5 5.7 5.1 6.5 4.8 5.5 5.4 6.0 5.6 4.5 3.8 4.9 4.2 3.5 4.8 6.0 4,6 5.4 6.2 6.7 6.4 6.2 6.8GDP 5.1 4.9 4.9 5.0 5.0 4.8 4.7 4.8 5.2 4.9 4.9 5.2 5.0 4.9 5.0 5.0 5.0 5.1 5.2 5.1 5.1 5.3 5.2 5.2 5.2 5.1
Source: Central Bureau of Statistics of Indonesia (BPS)*Other services consist of 10 sectors (according to Standard National 2008)
GDP Growth Based on Expenditures (%, YoY)1
By expenditure2014 2015 2016 2017 2018 2019
Q1 Q2 Q3 Q4 Tot. Q1 Q2 Q3 Q4 Tot. Q1 Q2 Q3 Q4 Tot. Q1 Q2 Q3 Q4 Tot Q1 Q2 Q3 Q4 Tot Q1HH. Consumption 5.2 5.2 5.1 5.1 5.1 5.0 5.0 5.0 4.9 5.0 5.0 5.1 5.0 5.0 5.0 4.9 5.0 4.9 5.0 4.9 4.9 5.2 5.0 5.1 5.0 5.0Non profit HH. consumption 23.2 22.4 5.8 (0.5) 12.2 (8.1) (8.0) 6.6 8.3 (0.6) 6.4 6.7 6.7 6.7 6.6 8.1 8.5 6.0 5.3 6.9 8.1 8.8 8.6 10.8 9.1 16.9
Government consumption 6.1 (1.8) 1.2 0.9 1.2 2.9 2.6 7.1 7.1 5.3 3.4 6.2 (3.0) (4.0) (0.1) 2.7 (1.9) 3.5 3.8 2.1 2.7 5.2 6.3 4.6 4.8 5.2
Gross Fixed Cap. Formation
5.4 4.0 4.4 4.1 4.4 4.6 4.0 4.9 6.4 5.0 4.7 4.2 4.2 4.8 4.5 4.8 5.3 7.1 7.3 6.2 7.9 5.9 7.0 6.0 6.7 5.0
Exports 3.1 1.5 4.9 (4.4) 1.1 (0.6) (0.3) (1.0) (6.4) (2.1) (3.1) (1.5) (5.8) 4.1 (1.6) 8.4 2.7 16.5 8.4 8.9 5.9 7.6 8.1 4.3 6.5 (2.1)
Imports 5.1 0.4 0.2 3.0 2.1 (2.6) (7.1) (6.5) (8.6) (6.2) (5.0) (3.5) (4.1) 2.7 (2.4) 4.8 0.2 15.4 11.9 8.1 12.6 15.2 14.0 7.1 12.0 (7.8)
GDP 5.1 4.9 4.9 5.0 5.0 4.8 4.7 4.8 5.2 4.9 4.9 5.2 5.0 4.9 5.0 5.0 5.0 5.1 5.2 5.1 5.1 5.3 5.2 5.2 5.2 5.1
1. Source: Central Bureau of Statistics of Indonesia (BPS), ** Including non-profit household consumption
4
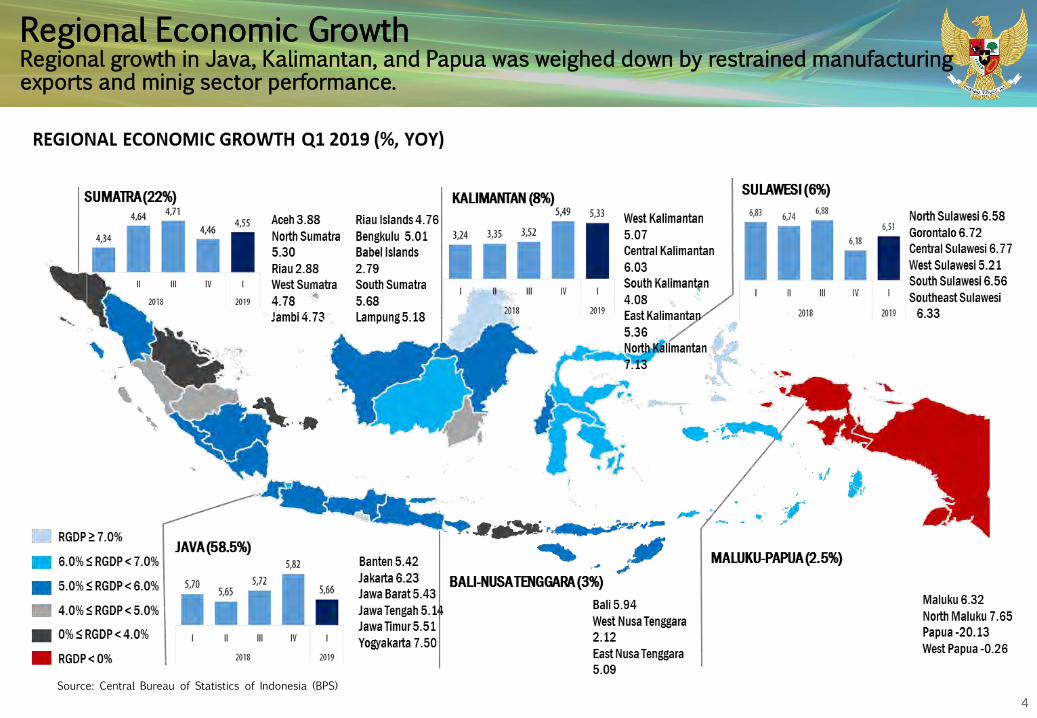
Regional Economic GrowthRegional growth in Java, Kalimantan, and Papua was weighed down by restrained manufacturingexports and minig sector performance.
Source: Central Bureau of Statistics of Indonesia (BPS)
External Factor:Improved External Resilience
Section 1
6
1.87
(8.10)
(1.79)
1.06
(6.97)
-12-10-8-6-4-202468
Q1 Q2 Q3 Q4 Q1 Q2 Q3 Q4 Q1 Q2 Q3 Q4 Q1 Q2 Q3 Q4 Q1 Q2 Q3 Q4 Q1*Q2*Q3*Q4*Q1**
2013 2014 2015 2016 2017 2018* 2019**
Goods Services Primary Income Secondary Income Current Account
US$bn
- 1 2 3 4 5 6 7 8 9 10 11 12 13 14 15
50
60
70
80
90
100
110
120
130
1 3 5 7 911
1 3 5 7 911
1 3 5 7 911
1 3 5 7 911
1 3 5 7 911
1 3 5 7 911
1 3 5
2013 2014 2015 2016 2017 2018 2019
FX Reserves (LHS) Month of Import & Debt Service (RHS) MonthUS$bn
-3.00
-2.00
-1.00
0.00
1.00
2.00
3.00
1 3 5 7 9 11 1 3 5 7 9 11 1 3 5 7 9 11 1 3 5 7 9 11 1 3 5 7 9 11 1 3 5 7 9 11 1 3 5
2013 2014 2015 2016 2017 2018 2019
OG Non-OG Total
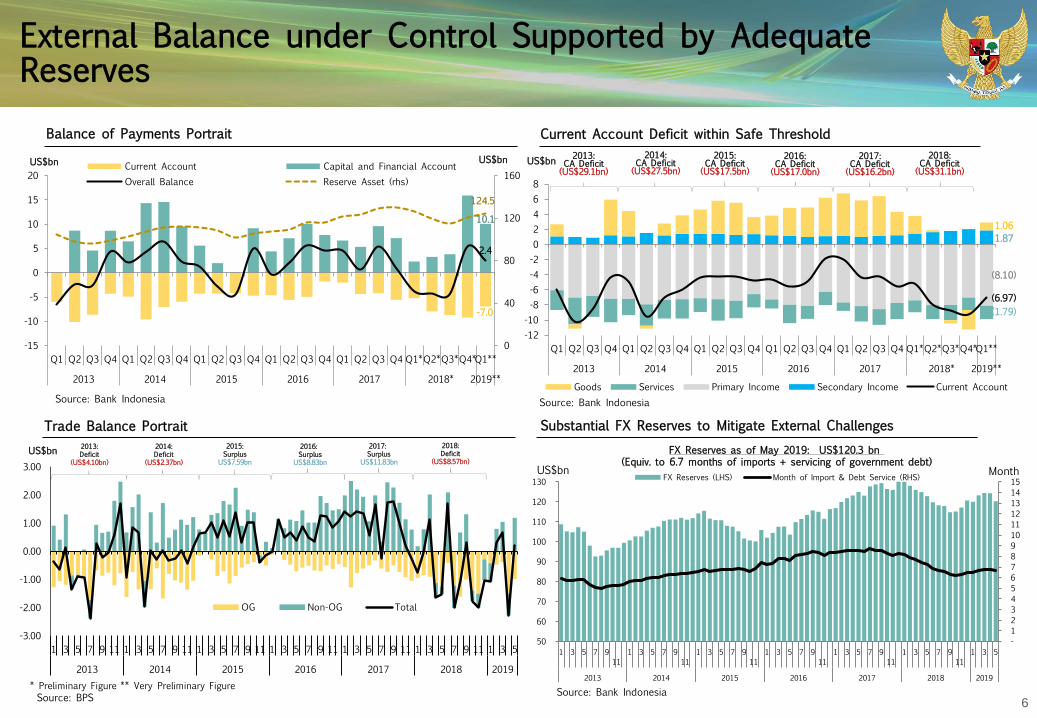
External Balance under Control Supported by Adequate Reserves
Current Account Deficit within Safe ThresholdBalance of Payments Portrait
Substantial FX Reserves to Mitigate External ChallengesTrade Balance Portrait
Source: Bank IndonesiaSource: Bank Indonesia
Source: BPS* Preliminary Figure ** Very Preliminary Figure
2015:Surplus
US$7.59bn
2013:Deficit
(US$4.10bn)
2014:Deficit
(US$2.37bn)
2016: Surplus
US$8.83bn
2017: Surplus
US$11.83bn
Source: Bank Indonesia
FX Reserves as of May 2019: US$120.3 bn (Equiv. to 6.7 months of imports + servicing of government debt)
US$bn
2015:CA Deficit(US$17.5bn)
2013:CA Deficit(US$29.1bn)
2014:CA Deficit(US$27.5bn)
2016:CA Deficit(US$17.0bn)
2017:CA Deficit(US$16.2bn)
2018:Deficit
(US$8.57bn)
2018:CA Deficit(US$31.1bn)
-7.0
10.1
2.4
124.5
0
40
80
120
160
-15
-10
-5
0
5
10
15
20
Q1 Q2 Q3 Q4 Q1 Q2 Q3 Q4 Q1 Q2 Q3 Q4 Q1 Q2 Q3 Q4 Q1 Q2 Q3 Q4 Q1*Q2*Q3*Q4*Q1**
2013 2014 2015 2016 2017 2018* 2019**
Current Account Capital and Financial AccountOverall Balance Reserve Asset (rhs)
US$bn US$bn

7
2.08
0.20
0.83
0.37
-4.73
-2.32
-2.26
-0.69
-1.91
-6.33
-4.49
-3.71
-13.18
3.51
1.51
1.28
0.77
0.54
0.06
-0.37
-0.38
-0.93
-1.09
-2.16
-5.53
-9.77
-16.0 -14.0 -12.0 -10.0 -8.0 -6.0 -4.0 -2.0 0.0 2.0 4.0 6.0
THBJPYPHPIDRBRLINRCNYSGDMYRZAREURKRWTRY
point-to-point average
%Data as of June 19th, 2019
Exchange Rate In Line with Fundamentals
Movement of Rupiah
Rupiah Exchange Rate Fared Relatively Well Compared to Peers
IDR/US$ In general, rupiah exchange rate stability has been maintained. In May 2019,the rupiah depreciated 0.18% (ptp) compared with the position recorded at theend of April 2019. The latest developments are linked to the recent furtheranceof international trade tensions, which triggered risk-off sentiment in the globalfinancial markets. The rupiah regained momentum in June 2019, however,appreciating 0.04% (ptp) as of 19th June 2019 compared with the raterecorded at the end of May 2019, or by an average of 0.69% compared withthe May 2019 average. The rupiah strengthened in June 2019 on the back of asolid domestic economic outlook, including the recent improvement inIndonesia’s sovereign rating affirmed by Standard & Poor’s (S&P), in addition toa global loosening of monetary policy. Such dynamics are expected to attractforeign capital flows back to Indonesia and appreciate the value of the rupiah.Moving forward, Bank Indonesia expects to maintain rupiah exchange ratestability in line with market mechanisms. Meanwhile, to enhance theeffectiveness of exchange rate policy and reinforce domestic financing, BankIndonesia will continue to accelerate financial market deepening, targeting themoney market and foreign exchange market in particular.
Source: Bank Indonesia
YTD 2019 vs 2018
Rupiah Exchange Rate Volatilty
14270
13576
13952
14601
14798
1413414269
13,378
14,409
15,176
14,207
14,381 14,282
13,000
13,500
14,000
14,500
15,000
15,500
1-Jan 1-Feb1-Mar 1-Apr 1-May 1-Jun 1-Jul 1-Aug 1-Sep 1-Oct 1-Nov1-Dec 1-Jan 1-Feb1-Mar 1-Apr 1-May 1-Jun
IDR/USDQuarterly AverageMonthly Average
Data as of May June 19th, 2019
14.2
12.0
19.3
9.4 11.0
6.8 5.0
6.5
4.4
6.2
19.5
13.2
22.1
6.65.2
9.4
4.8 5.36.4
5.6
-
5
10
15
20
25
BRL ZAR TRY IDR KRW THB MYR INR SGD PHP
May-19 Jun-19
% Data as of June 19th, 2019
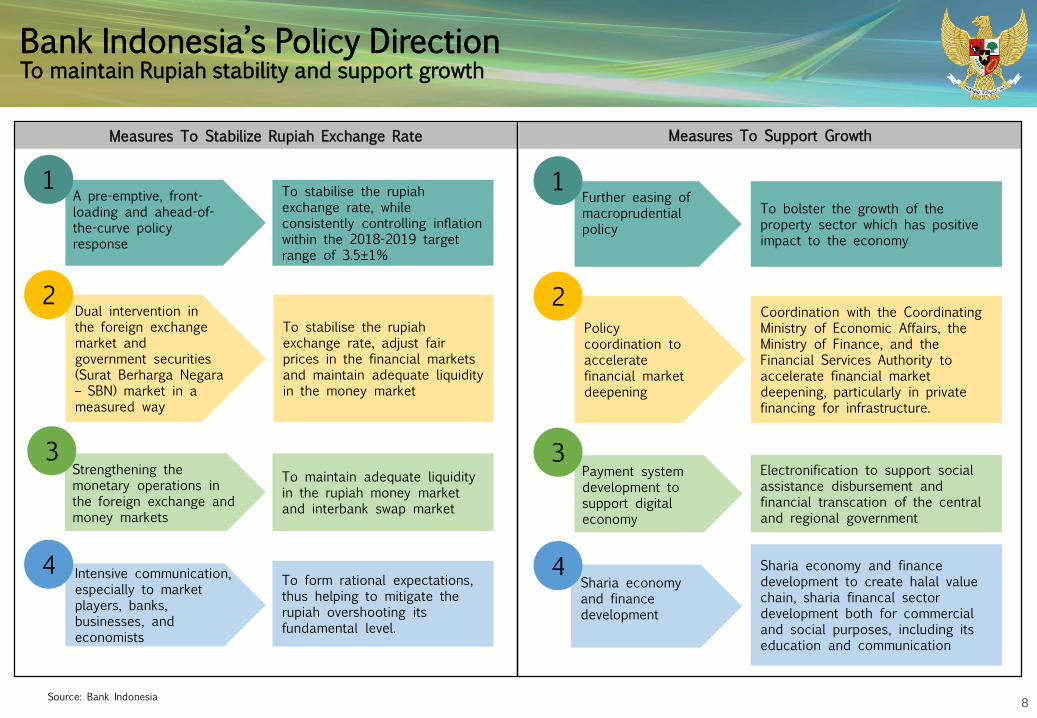
8
Bank Indonesia’s Policy DirectionTo maintain Rupiah stability and support growth
A pre-emptive, front-loading and ahead-of-the-curve policy response
Strengthening the monetary operations in the foreign exchange and money markets
To stabilise the rupiah exchange rate, while consistently controlling inflation within the 2018-2019 target range of 3.5±1%
To stabilise the rupiah exchange rate, adjust fair prices in the financial markets and maintain adequate liquidity in the money market
To maintain adequate liquidity in the rupiah money market and interbank swap market
To form rational expectations, thus helping to mitigate the rupiah overshooting its fundamental level.
Dual intervention in the foreign exchange market and government securities (Surat Berharga Negara – SBN) market in a measured way
Intensive communication, especially to market players, banks, businesses, and economists
4
3
2
Measures To Stabilize Rupiah Exchange Rate Measures To Support Growth
Further easing of macroprudential policy
Payment system development to support digital economy
To bolster the growth of the property sector which has positive impact to the economy
Coordination with the Coordinating Ministry of Economic Affairs, the Ministry of Finance, and the Financial Services Authority to accelerate financial market deepening, particularly in private financing for infrastructure.
Electronification to support social assistance disbursement and financial transcation of the central and regional government
Sharia economy and finance development to create halal valuechain, sharia financal sector development both for commercial and social purposes, including its education and communication
Policy coordination to accelerate financial market deepening
Sharia economy and finance development
4
3
2
11
Source: Bank Indonesia
9
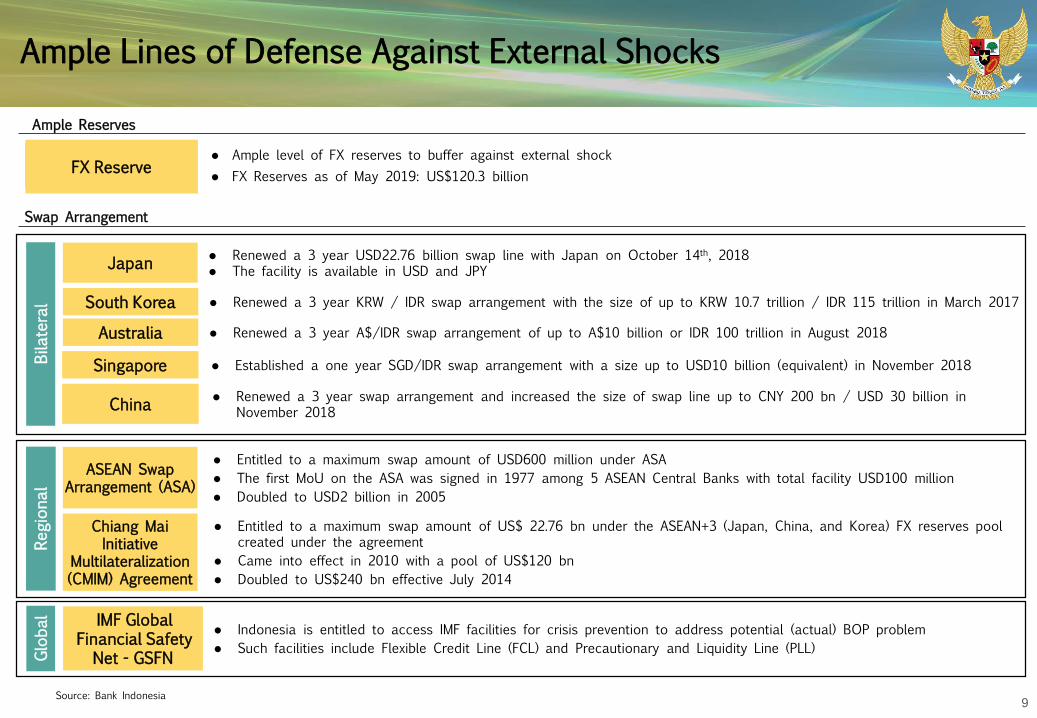
Ample Lines of Defense Against External Shocks
Ample level of FX reserves to buffer against external shock FX Reserves as of May 2019: US$120.3 billion
South Korea Renewed a 3 year KRW / IDR swap arrangement with the size of up to KRW 10.7 trillion / IDR 115 trillion in March 2017
Australia Renewed a 3 year A$/IDR swap arrangement of up to A$10 billion or IDR 100 trillion in August 2018
Chiang Mai Initiative
Multilateralization (CMIM) Agreement
Entitled to a maximum swap amount of US$ 22.76 bn under the ASEAN+3 (Japan, China, and Korea) FX reserves pool created under the agreement
Came into effect in 2010 with a pool of US$120 bn Doubled to US$240 bn effective July 2014
Japan Renewed a 3 year USD22.76 billion swap line with Japan on October 14th, 2018 The facility is available in USD and JPY
IMF Global Financial Safety
Net - GSFN
Indonesia is entitled to access IMF facilities for crisis prevention to address potential (actual) BOP problem Such facilities include Flexible Credit Line (FCL) and Precautionary and Liquidity Line (PLL)
Bilateral
Region
alGlob
al
FX Reserve
Ample Reserves
Swap Arrangement
Source: Bank Indonesia
ASEAN Swap Arrangement (ASA)
Entitled to a maximum swap amount of USD600 million under ASA The first MoU on the ASA was signed in 1977 among 5 ASEAN Central Banks with total facility USD100 million Doubled to USD2 billion in 2005
Singapore Established a one year SGD/IDR swap arrangement with a size up to USD10 billion (equivalent) in November 2018
China Renewed a 3 year swap arrangement and increased the size of swap line up to CNY 200 bn / USD 30 billion in November 2018
10
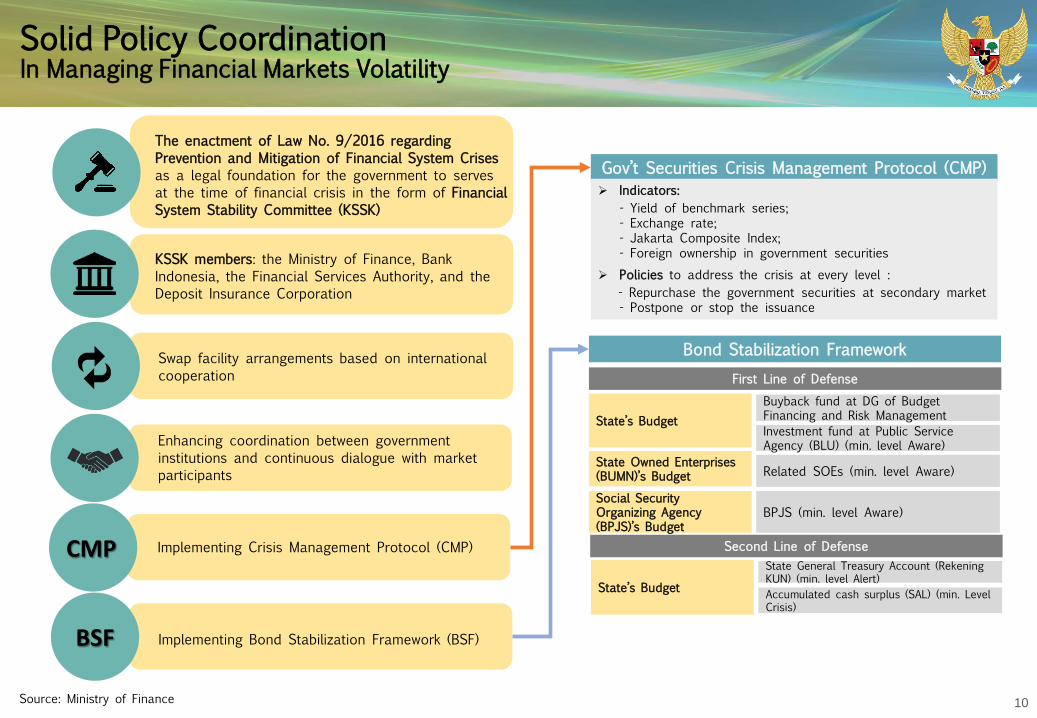
Solid Policy Coordination In Managing Financial Markets Volatility
Source: Ministry of Finance
First Line of Defense
State’s BudgetBuyback fund at DG of Budget Financing and Risk ManagementInvestment fund at Public Service Agency (BLU) (min. level Aware)
State Owned Enterprises (BUMN)’s Budget Related SOEs (min. level Aware)
Social Security Organizing Agency (BPJS)’s Budget
BPJS (min. level Aware)
Second Line of Defense
State’s Budget
State General Treasury Account (Rekening KUN) (min. level Alert)Accumulated cash surplus (SAL) (min. Level Crisis)
Gov’t Securities Crisis Management Protocol (CMP) Indicators:
- Yield of benchmark series;- Exchange rate;- Jakarta Composite Index;- Foreign ownership in government securities
Policies to address the crisis at every level :- Repurchase the government securities at secondary market- Postpone or stop the issuance
Bond Stabilization Framework
The enactment of Law No. 9/2016 regarding Prevention and Mitigation of Financial System Crises as a legal foundation for the government to serves at the time of financial crisis in the form of Financial System Stability Committee (KSSK)
KSSK members: the Ministry of Finance, Bank Indonesia, the Financial Services Authority, and the Deposit Insurance Corporation
Swap facility arrangements based on internationalcooperation
Enhancing coordination between government institutions and continuous dialogue with market participants
Implementing Crisis Management Protocol (CMP)CMP
Implementing Bond Stabilization Framework (BSF)BSF
11
23.3
34.8
20.3
39.6
68.8
21.9
35.2
19.5
40
63.5
20.8
34.4
21.5
39.6
62.7
0 10 20 30 40 50 60 70 80
Philippines
Indonesia
India
Colombia
Bulgaria
2019F 2018F 2017
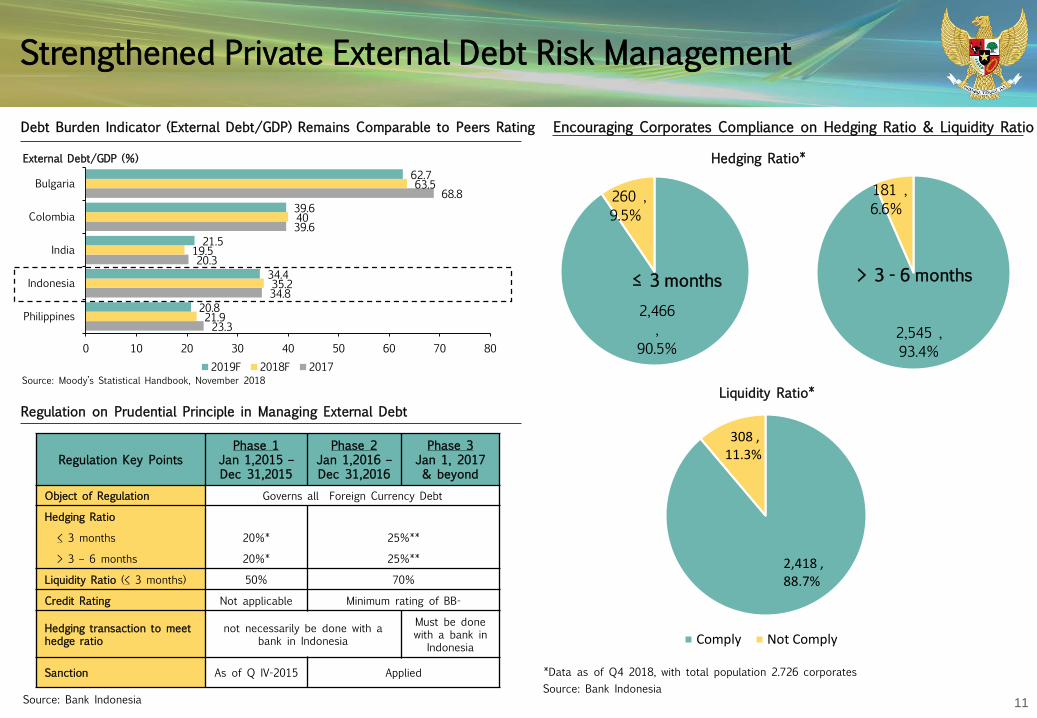
Strengthened Private External Debt Risk Management
Regulation Key PointsPhase 1
Jan 1,2015 –Dec 31,2015
Phase 2Jan 1,2016 –Dec 31,2016
Phase 3Jan 1, 2017 & beyond
Object of Regulation Governs all Foreign Currency Debt
Hedging Ratio
< 3 months 20%* 25%**
> 3 – 6 months 20%* 25%**
Liquidity Ratio (< 3 months) 50% 70%
Credit Rating Not applicable Minimum rating of BB-
Hedging transaction to meet hedge ratio
not necessarily be done with a bank in Indonesia
Must be done with a bank in
Indonesia
Sanction As of Q IV-2015 Applied
External Debt/GDP (%)
Debt Burden Indicator (External Debt/GDP) Remains Comparable to Peers Rating Encouraging Corporates Compliance on Hedging Ratio & Liquidity Ratio
Source: Bank Indonesia
Liquidity Ratio*
Hedging Ratio*
*Data as of Q4 2018, with total population 2.726 corporates
Regulation on Prudential Principle in Managing External Debt
Source: Bank Indonesia
Source: Moody’s Statistical Handbook, November 2018
2,466 ,
90.5%
260 , 9.5%
≤ 3 months
2,545 , 93.4%
181 , 6.6%
> 3 - 6 months
2,418 , 88.7%
308 , 11.3%
Comply Not Comply
12
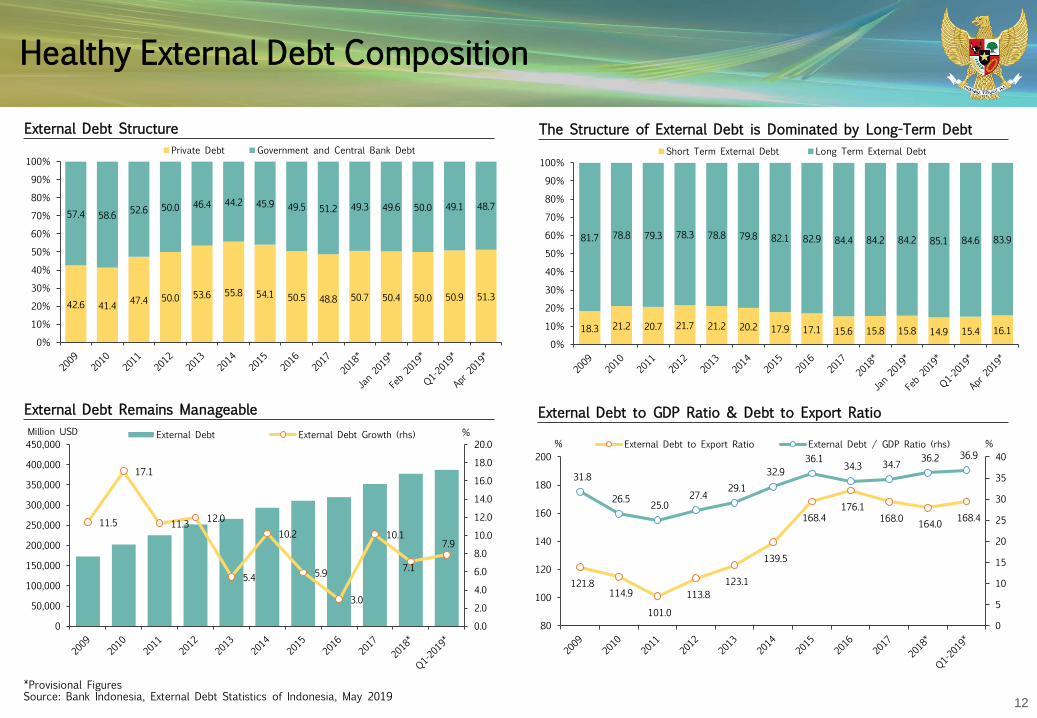
Healthy External Debt Composition
External Debt Structure
Source: Bank Indonesia, External Debt Statistics of Indonesia, May 2019*Provisional Figures
The Structure of External Debt is Dominated by Long-Term Debt
External Debt Remains Manageable External Debt to GDP Ratio & Debt to Export Ratio
11.5
17.1
11.3 12.0
5.4
10.2
5.9
3.0
10.1
7.1
7.9
0.0
2.0
4.0
6.0
8.0
10.0
12.0
14.0
16.0
18.0
20.0
0
50,000
100,000
150,000
200,000
250,000
300,000
350,000
400,000
450,000%Million USD External Debt External Debt Growth (rhs)
121.8 114.9
101.0
113.8 123.1
139.5
168.4 176.1
168.0 164.0 168.4
31.8
26.5 25.0 27.4
29.1 32.9
36.1 34.3 34.7 36.2 36.9
0
5
10
15
20
25
30
35
40
80
100
120
140
160
180
200%% External Debt to Export Ratio External Debt / GDP Ratio (rhs)
18.3 21.2 20.7 21.7 21.2 20.2 17.9 17.1 15.6 15.8 15.8 14.9 15.4 16.1
81.7 78.8 79.3 78.3 78.8 79.8 82.1 82.9 84.4 84.2 84.2 85.1 84.6 83.9
0%
10%
20%
30%
40%
50%
60%
70%
80%
90%
100%Short Term External Debt Long Term External Debt
42.6 41.4 47.4 50.0 53.6 55.8 54.1 50.5 48.8 50.7 50.4 50.0 50.9 51.3
57.4 58.6 52.6 50.0 46.4 44.2 45.9 49.5 51.2 49.3 49.6 50.0 49.1 48.7
0%
10%
20%
30%
40%
50%
60%
70%
80%
90%
100%Private Debt Government and Central Bank Debt
13
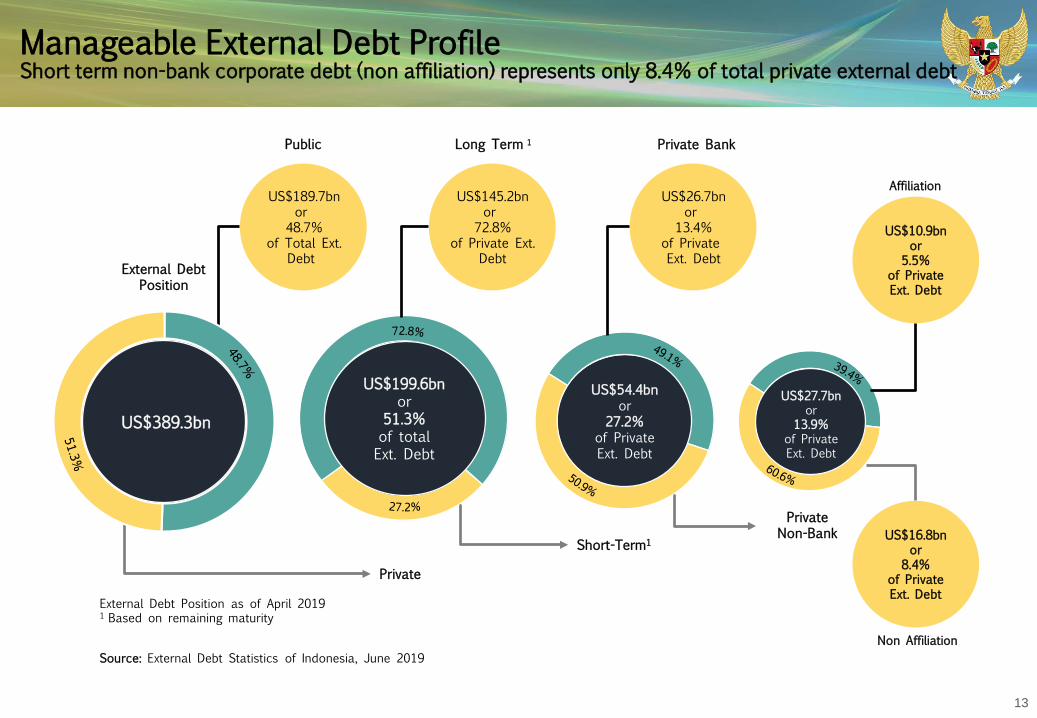
Manageable External Debt ProfileShort term non-bank corporate debt (non affiliation) represents only 8.4% of total private external debt
Private
Short-Term1
Private Non-Bank
External DebtPosition
Affiliation
Non Affiliation
US$145.2bnor
72.8%of Private Ext.
Debt
US$26.7bnor
13.4%of Private Ext. Debt
US$10.9bnor
5.5%of Private Ext. Debt
US$16.8bnor
8.4%of Private Ext. Debt
Public Long Term 1 Private Bank
US$27.7bnor
13.9%of Private Ext. Debt
US$199.6bnor
51.3%of total Ext. Debt
US$54.4bnor
27.2%of Private Ext. Debt
External Debt Position as of April 20191 Based on remaining maturity
Source: External Debt Statistics of Indonesia, June 2019
US$389.3bn
US$189.7bnor
48.7%of Total Ext.
Debt
Monetary and Financial Factor:Credible Monetary Policy Track Record and Favourable Financial Sector
Section 2
15
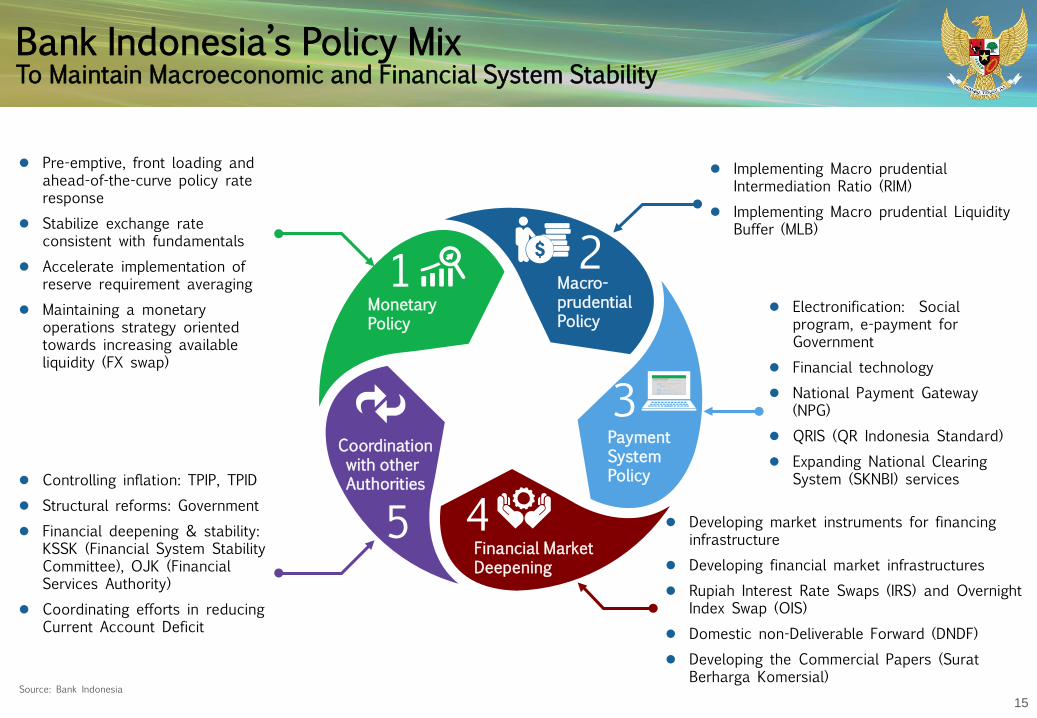
Bank Indonesia’s Policy MixTo Maintain Macroeconomic and Financial System Stability
Source: Bank Indonesia
Implementing Macro prudential Intermediation Ratio (RIM)
Implementing Macro prudential Liquidity Buffer (MLB)
Electronification: Social program, e-payment for Government
Financial technology National Payment Gateway
(NPG) QRIS (QR Indonesia Standard) Expanding National Clearing
System (SKNBI) services
Developing market instruments for financing infrastructure
Developing financial market infrastructures Rupiah Interest Rate Swaps (IRS) and Overnight
Index Swap (OIS) Domestic non-Deliverable Forward (DNDF) Developing the Commercial Papers (Surat
Berharga Komersial)
Controlling inflation: TPIP, TPID Structural reforms: Government Financial deepening & stability:
KSSK (Financial System Stability Committee), OJK (Financial Services Authority)
Coordinating efforts in reducing Current Account Deficit
Pre-emptive, front loading and ahead-of-the-curve policy rate response
Stabilize exchange rate consistent with fundamentals
Accelerate implementation of reserve requirement averaging
Maintaining a monetary operations strategy oriented towards increasing available liquidity (FX swap)
MonetaryPolicy
Coordinationwith otherAuthorities
Financial MarketDeepening
Macro-prudentialPolicy
PaymentSystem Policy
1 2
3
45
16
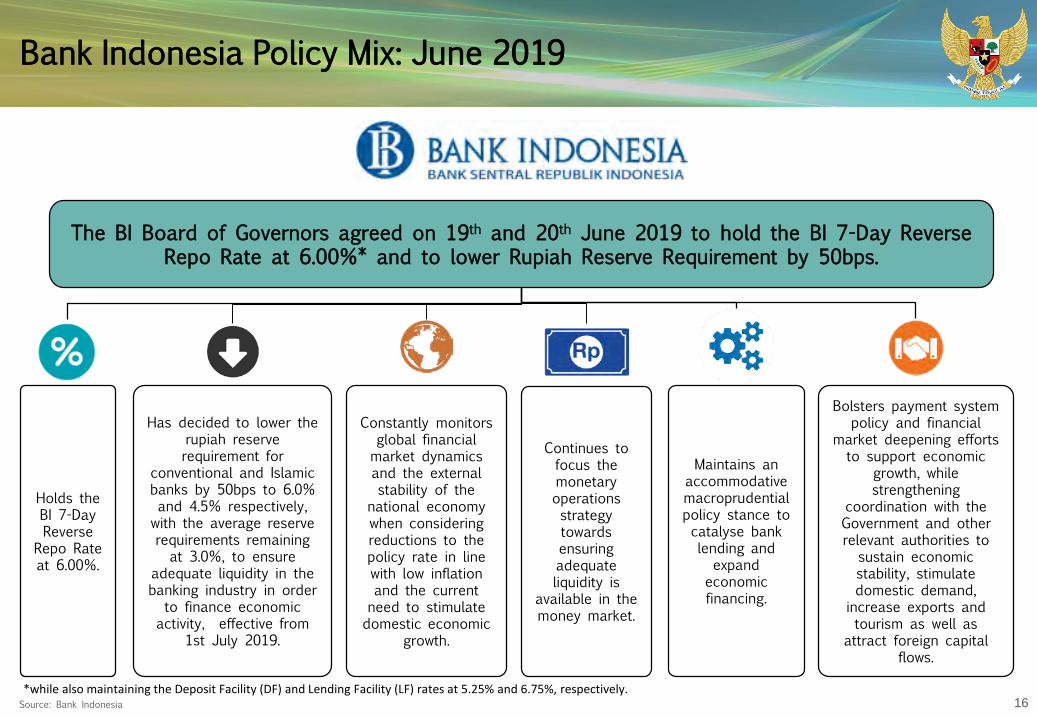
Bank Indonesia Policy Mix: June 2019
The BI Board of Governors agreed on 19th and 20th June 2019 to hold the BI 7-Day Reverse Repo Rate at 6.00%* and to lower Rupiah Reserve Requirement by 50bps.
Constantly monitors global financial market dynamics and the external stability of the
national economy when considering reductions to the policy rate in line with low inflation and the current need to stimulate domestic economic
growth.
Holds the BI 7-DayReverse
Repo Rate at 6.00%.
Bolsters payment system policy and financial
market deepening efforts to support economic
growth, while strengthening
coordination with the Government and other relevant authorities to
sustain economic stability, stimulate domestic demand,
increase exports and tourism as well as
attract foreign capital flows.
Source: Bank Indonesia
Continues to focus the monetary operations strategy towards ensuring adequate liquidity is
available in the money market.
Maintains an accommodative macroprudentialpolicy stance to catalyse bank lending and
expand economic financing.
Has decided to lower the rupiah reserve requirement for
conventional and Islamic banks by 50bps to 6.0% and 4.5% respectively,
with the average reserve requirements remaining at 3.0%, to ensure
adequate liquidity in the banking industry in order
to finance economic activity, effective from
1st July 2019.
*while also maintaining the Deposit Facility (DF) and Lending Facility (LF) rates at 5.25% and 6.75%, respectively.
17
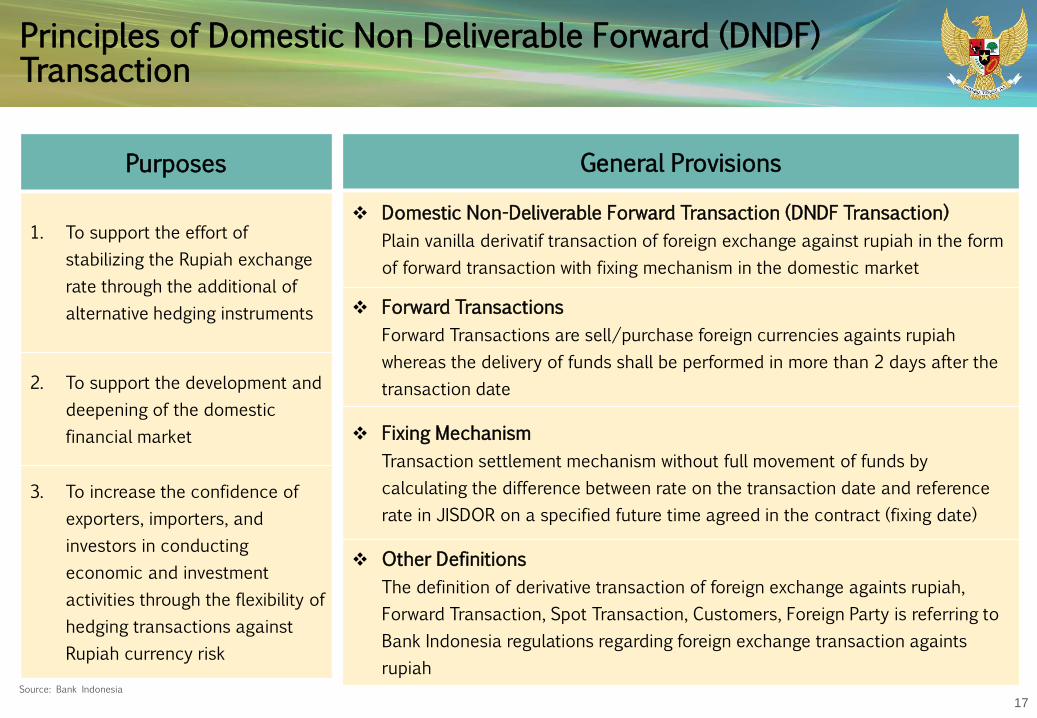
Principles of Domestic Non Deliverable Forward (DNDF) Transaction
Purposes
1. To support the effort of stabilizing the Rupiah exchange rate through the additional of alternative hedging instruments
2. To support the development and deepening of the domestic financial market
3. To increase the confidence of exporters, importers, and investors in conducting economic and investment activities through the flexibility of hedging transactions against Rupiah currency risk
General Provisions
Domestic Non-Deliverable Forward Transaction (DNDF Transaction)Plain vanilla derivatif transaction of foreign exchange against rupiah in the form of forward transaction with fixing mechanism in the domestic market
Forward TransactionsForward Transactions are sell/purchase foreign currencies againts rupiah whereas the delivery of funds shall be performed in more than 2 days after the transaction date
Fixing MechanismTransaction settlement mechanism without full movement of funds by calculating the difference between rate on the transaction date and reference rate in JISDOR on a specified future time agreed in the contract (fixing date)
Other DefinitionsThe definition of derivative transaction of foreign exchange againts rupiah, Forward Transaction, Spot Transaction, Customers, Foreign Party is referring to Bank Indonesia regulations regarding foreign exchange transaction againtsrupiah
Source: Bank Indonesia
18
Principles of Domestic Non Deliverable Forward (DNDF) Transaction
Bank can perform DNDF Transactions as follows:
Bank – Customer
Bank – Foreign Party
Bank – Bank
Transaction between:
Can only be performed to hedge rupiah exchange rate
risk.
1. Must have Underlying Transactions:
Including all following activities :a. Trade of goods and servicesb. Investments, loans, capital, and other
investements.c. Banks credit or financing in foreign currencies
(specifically for transactions between bank and customers)
Excluding following activities:a. Bank Indonesia certificates;b. Placement of funds with bank;c. Unwithdrawn credit facilities;d. Documents of foreign currencies sales againts
rupiah;e. Money transfer by fund transfer companiesf. Intercompany loang. Money changer activities.
2. Nominal of DNDF Transactions ≤ Nominal of Underlying Transactions
3. Tenor of DNDF Transactions ≤ Tenor of Underlying Transactions
Source: Bank Indonesia
19
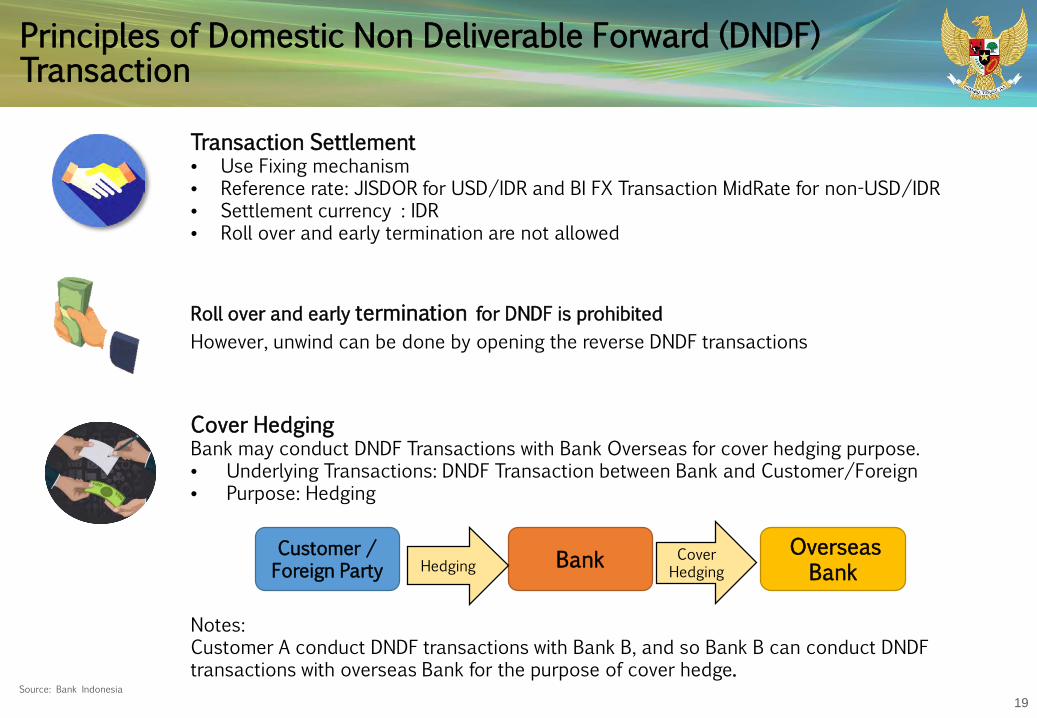
Principles of Domestic Non Deliverable Forward (DNDF) Transaction
Transaction Settlement• Use Fixing mechanism• Reference rate: JISDOR for USD/IDR and BI FX Transaction MidRate for non-USD/IDR• Settlement currency : IDR• Roll over and early termination are not allowed
Roll over and early termination for DNDF is prohibitedHowever, unwind can be done by opening the reverse DNDF transactions
Cover HedgingBank may conduct DNDF Transactions with Bank Overseas for cover hedging purpose.• Underlying Transactions: DNDF Transaction between Bank and Customer/Foreign • Purpose: Hedging
Customer / Foreign Party Bank Overseas
BankHedging
Notes:Customer A conduct DNDF transactions with Bank B, and so Bank B can conduct DNDFtransactions with overseas Bank for the purpose of cover hedge.
Cover Hedging
Source: Bank Indonesia
20
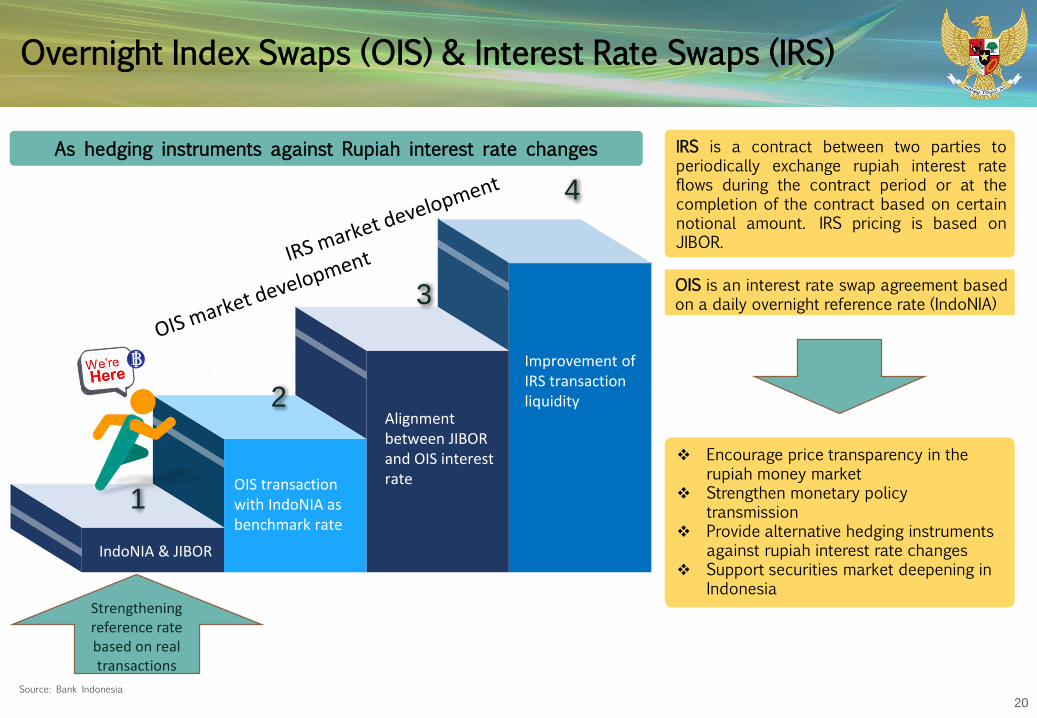
Overnight Index Swaps (OIS) & Interest Rate Swaps (IRS)
Source: Bank Indonesia
As hedging instruments against Rupiah interest rate changes IRS is a contract between two parties toperiodically exchange rupiah interest rateflows during the contract period or at thecompletion of the contract based on certainnotional amount. IRS pricing is based onJIBOR.
OIS is an interest rate swap agreement basedon a daily overnight reference rate (IndoNIA)
Encourage price transparency in the rupiah money market
Strengthen monetary policy transmission
Provide alternative hedging instruments against rupiah interest rate changes
Support securities market deepening in Indonesia
1
2
3
4
IndoNIA & JIBOR
OIS transaction with IndoNIA as benchmark rate
Alignment between JIBOR and OIS interest rate
Improvement of IRS transaction liquidity
Strengthening reference rate based on realtransactions
21
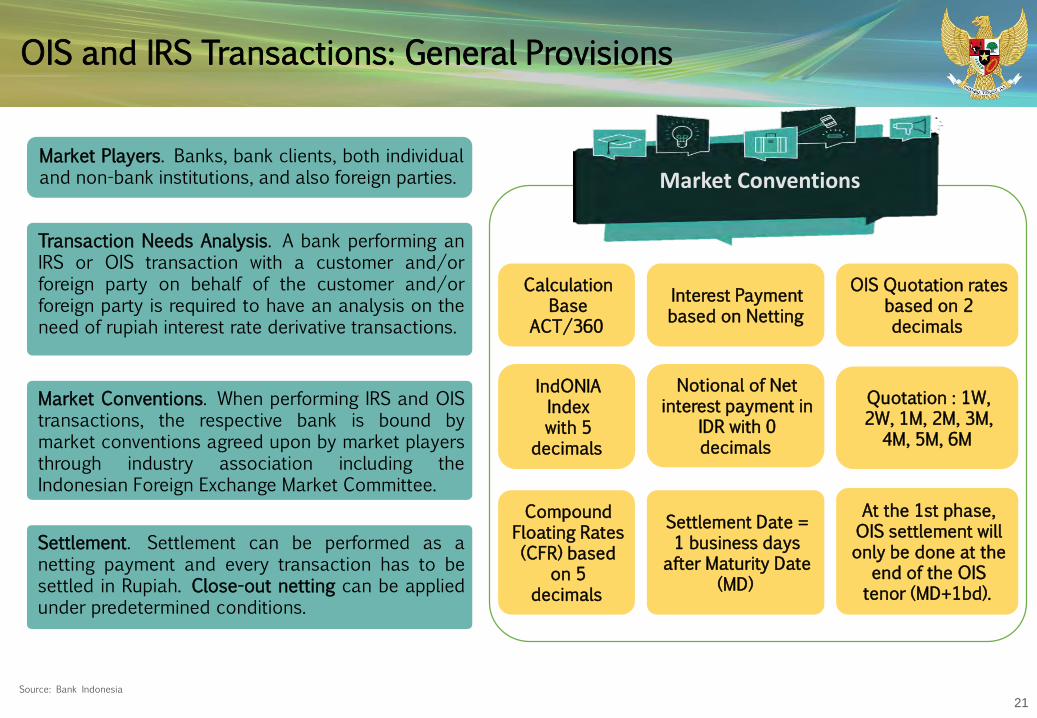
OIS and IRS Transactions: General Provisions
Source: Bank Indonesia
Market Players. Banks, bank clients, both individualand non-bank institutions, and also foreign parties.
Transaction Needs Analysis. A bank performing anIRS or OIS transaction with a customer and/orforeign party on behalf of the customer and/orforeign party is required to have an analysis on theneed of rupiah interest rate derivative transactions.
Market Conventions. When performing IRS and OIStransactions, the respective bank is bound bymarket conventions agreed upon by market playersthrough industry association including theIndonesian Foreign Exchange Market Committee.
Settlement. Settlement can be performed as anetting payment and every transaction has to besettled in Rupiah. Close-out netting can be appliedunder predetermined conditions.
Market Conventions
Calculation Base
ACT/360
IndONIAIndex with 5
decimals
Compound Floating Rates (CFR) based
on 5 decimals
Interest Payment based on Netting
Notional of Net interest payment in
IDR with 0 decimals
Settlement Date = 1 business days
after Maturity Date (MD)
OIS Quotation rates based on 2 decimals
Quotation : 1W, 2W, 1M, 2M, 3M,
4M, 5M, 6M
At the 1st phase, OIS settlement will only be done at the
end of the OIS tenor (MD+1bd).
22
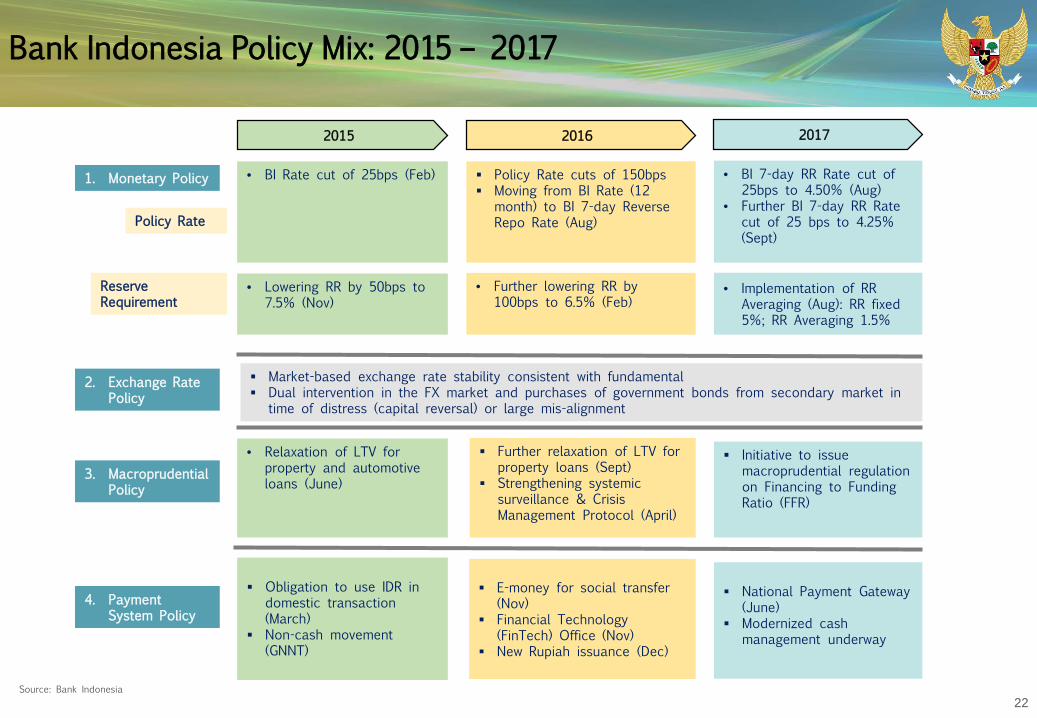
Bank Indonesia Policy Mix: 2015 – 2017
Further relaxation of LTV for property loans (Sept)
Strengthening systemic surveillance & Crisis Management Protocol (April)
E-money for social transfer (Nov)
Financial Technology (FinTech) Office (Nov)
New Rupiah issuance (Dec)
Obligation to use IDR in domestic transaction (March)
Non-cash movement (GNNT)
Market-based exchange rate stability consistent with fundamental Dual intervention in the FX market and purchases of government bonds from secondary market in
time of distress (capital reversal) or large mis-alignment
• BI 7-day RR Rate cut of 25bps to 4.50% (Aug)
• Further BI 7-day RR Rate cut of 25 bps to 4.25% (Sept)
• Further lowering RR by 100bps to 6.5% (Feb)
• Lowering RR by 50bps to 7.5% (Nov)
Policy Rate cuts of 150bps Moving from BI Rate (12
month) to BI 7-day Reverse Repo Rate (Aug)
1. Monetary Policy
Policy Rate
Reserve Requirement
2. Exchange Rate Policy
3. Macroprudential Policy
• Relaxation of LTV for property and automotive loans (June)
• BI Rate cut of 25bps (Feb)
• Implementation of RR Averaging (Aug): RR fixed 5%; RR Averaging 1.5%
Initiative to issue macroprudential regulation on Financing to Funding Ratio (FFR)
4. Payment System Policy
National Payment Gateway (June)
Modernized cash management underway
2015 2016 2017
Source: Bank Indonesia

23
3.00
4.00
5.00
6.00
7.00
8.00
Stable Monetary Environment Despite Challenges
Rupiah Exchange Rate Remains Comparable to Peers
Well Maintained Inflation Ensured Price Stability Strengthened Monetary Policy Framework
Credit Growth Profile
BI 7Day RR Rate: 6.00
(%)
LF Rate: 7.00LF Rate: 6.75
BI Rate: 6.50
DF Rate: 5.25
19 August 2016
The New MonetaryOperation Framework
Source: Bank Indonesia
YTD 2019 vs 2018
8.38 8.36
3.35 3.02 3.613.13 2.82
2.57 2.482.83
3.32
0.00
1.00
2.00
3.00
4.00
5.00
6.00
7.00
8.00
9.00
-2
0
2
4
6
8
10
12
14
16
18
20
2013 2014 2015 2016 2017 2018 Jan-19 Feb-19 Mar-19 Apr-19 May-19
(%)
CPI (%, yoy) - rhsVolatile Food (%, yoy) - lhsAdministered (%, yoy) - lhsCore (%, yoy) - lhs
11.010.5
14.3
9.1
0
2
4
6
8
10
12
14
16
18
20
1 3 5 7 9 11 1 3 5 7 9 11 1 3 5 7 9 11 1 3 5 7 9 11 1 3
2015 2016 2017 2018 2019
%,yoyTotal GrowthWorking Capital LoansInvestment LoansConsumption Loans
2.08
0.20
0.83
0.37
-4.73
-2.32
-2.26
-0.69
-1.91
-6.33
-4.49
-3.71
-13.18
3.51
1.51
1.28
0.77
0.54
0.06
-0.37
-0.38
-0.93
-1.09
-2.16
-5.53
-9.77
-16.0 -14.0 -12.0 -10.0 -8.0 -6.0 -4.0 -2.0 0.0 2.0 4.0 6.0
THBJPYPHPIDRBRLINRCNYSGDMYRZAREURKRWTRY
point-to-point average
%Data as of June 19th, 2019
24
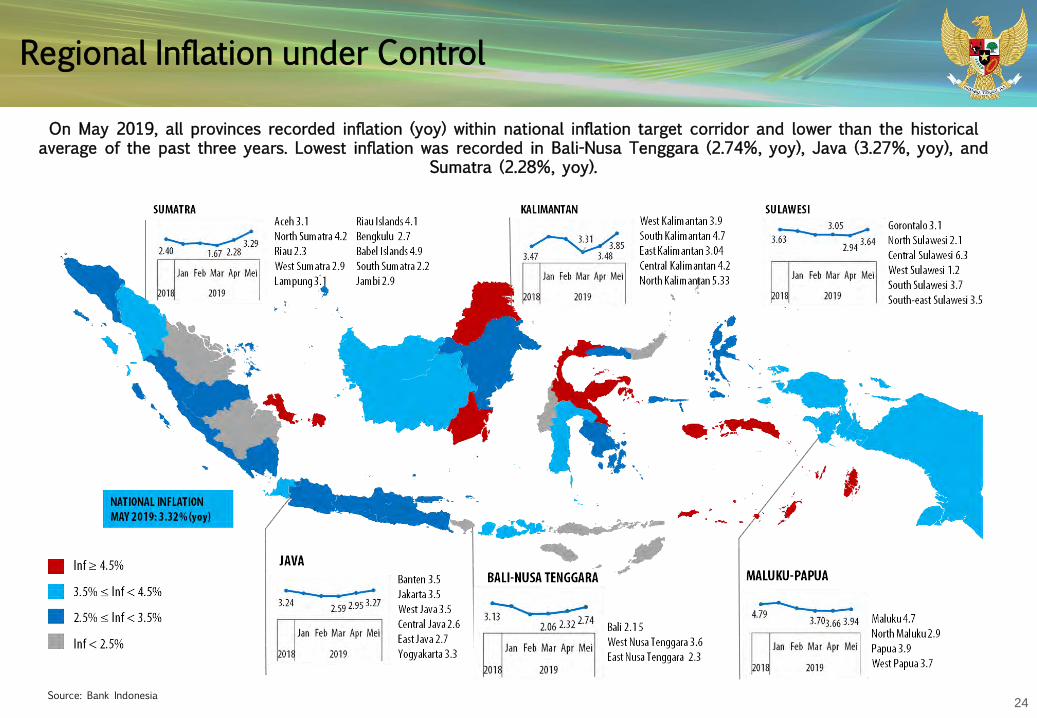
Regional Inflation under Control
On May 2019, all provinces recorded inflation (yoy) within national inflation target corridor and lower than the historical average of the past three years. Lowest inflation was recorded in Bali-Nusa Tenggara (2.74%, yoy), Java (3.27%, yoy), and
Sumatra (2.28%, yoy).
Source: Bank Indonesia
25
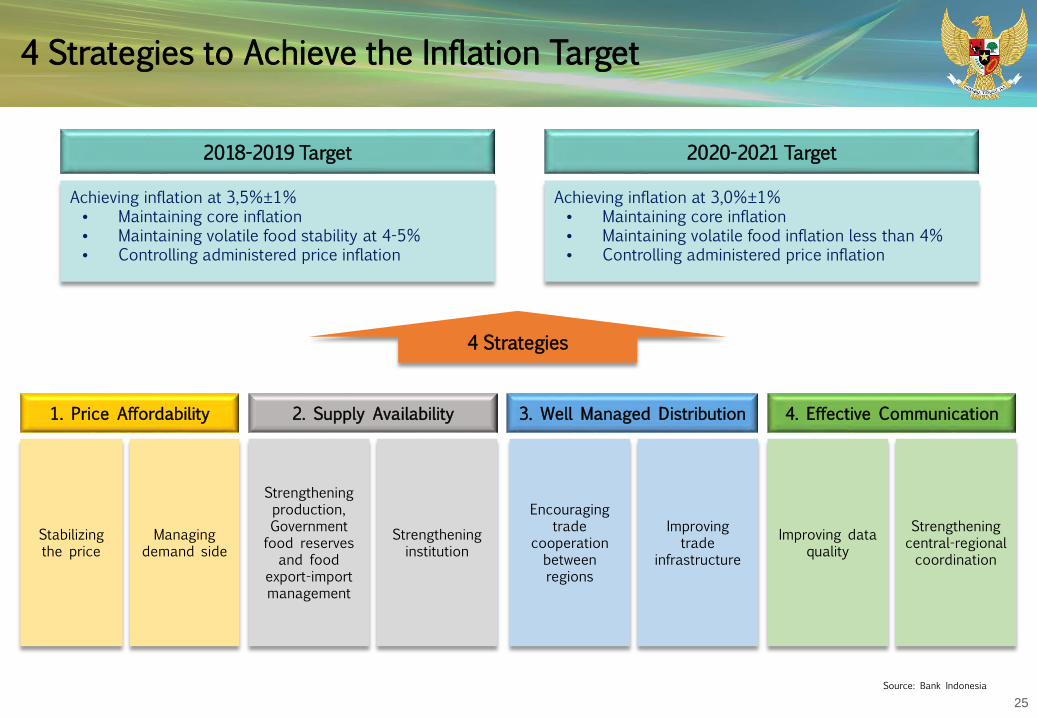
4 Strategies to Achieve the Inflation Target
Achieving inflation at 3,5%±1%• Maintaining core inflation• Maintaining volatile food stability at 4-5%• Controlling administered price inflation
2018-2019 Target
Stabilizing the price
1. Price Affordability
Achieving inflation at 3,0%±1%• Maintaining core inflation• Maintaining volatile food inflation less than 4%• Controlling administered price inflation
2020-2021 Target
Managing demand side
Strengthening production, Government food reserves
and food export-import management
2. Supply Availability
Strengthening institution
Encouraging trade
cooperation between regions
3. Well Managed Distribution
Improving trade
infrastructureImproving data
quality
4. Effective Communication
Strengthening central-regional coordination
Source: Bank Indonesia
4 Strategies
26
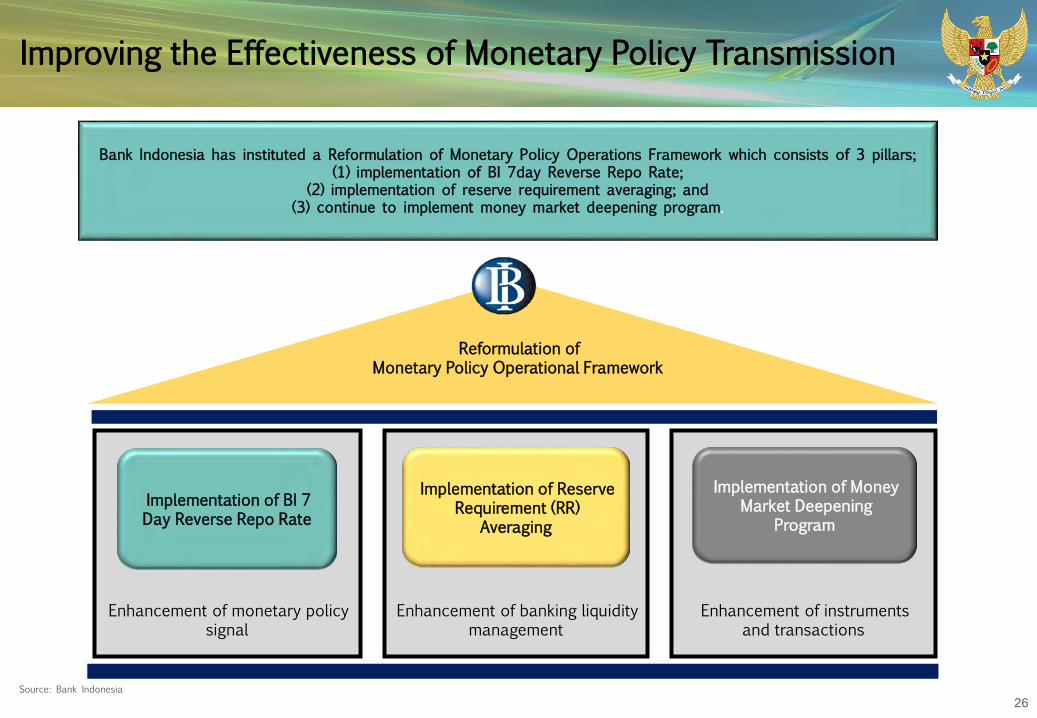
Improving the Effectiveness of Monetary Policy Transmission
Bank Indonesia has instituted a Reformulation of Monetary Policy Operations Framework which consists of 3 pillars; (1) implementation of BI 7day Reverse Repo Rate;
(2) implementation of reserve requirement averaging; and (3) continue to implement money market deepening program.
Enhancement of monetary policy signal
Enhancement of banking liquidity management
Implementation of BI 7 Day Reverse Repo Rate
Implementation of Reserve Requirement (RR)
Averaging
Reformulation of Monetary Policy Operational Framework
Enhancement of instruments and transactions
Implementation of Money Market Deepening
Program
Source: Bank Indonesia
27
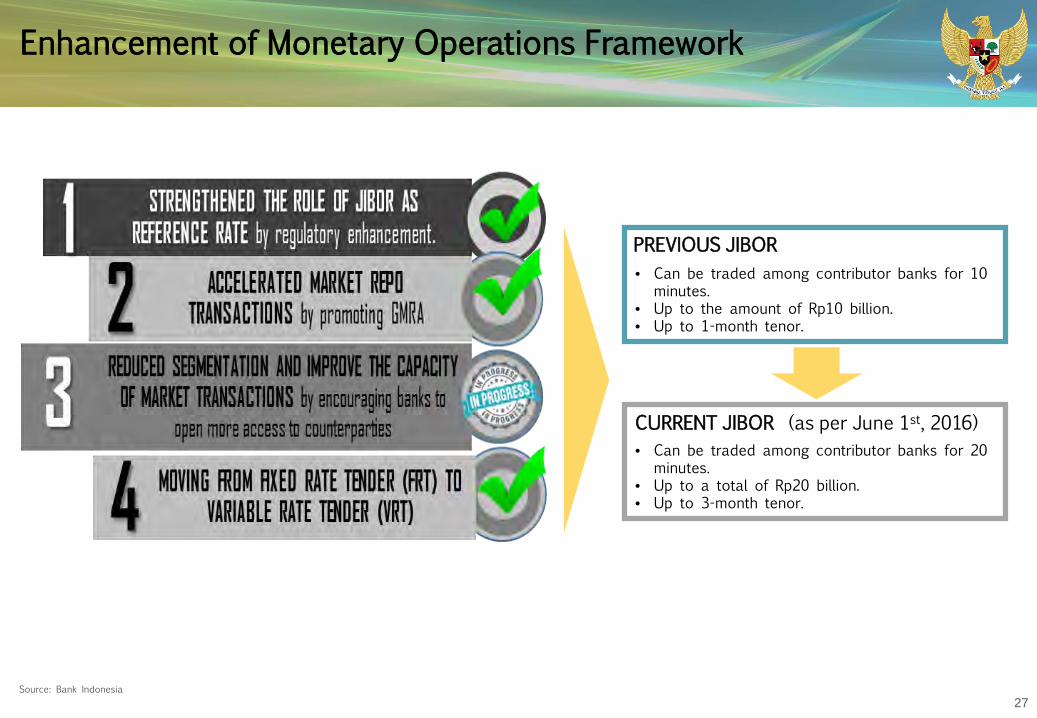
Enhancement of Monetary Operations Framework
• Can be traded among contributor banks for 10 minutes.
• Up to the amount of Rp10 billion.• Up to 1-month tenor.
• Can be traded among contributor banks for 20 minutes.
• Up to a total of Rp20 billion.• Up to 3-month tenor.
CURRENT JIBOR (as per June 1st, 2016)
PREVIOUS JIBOR
Source: Bank Indonesia
28
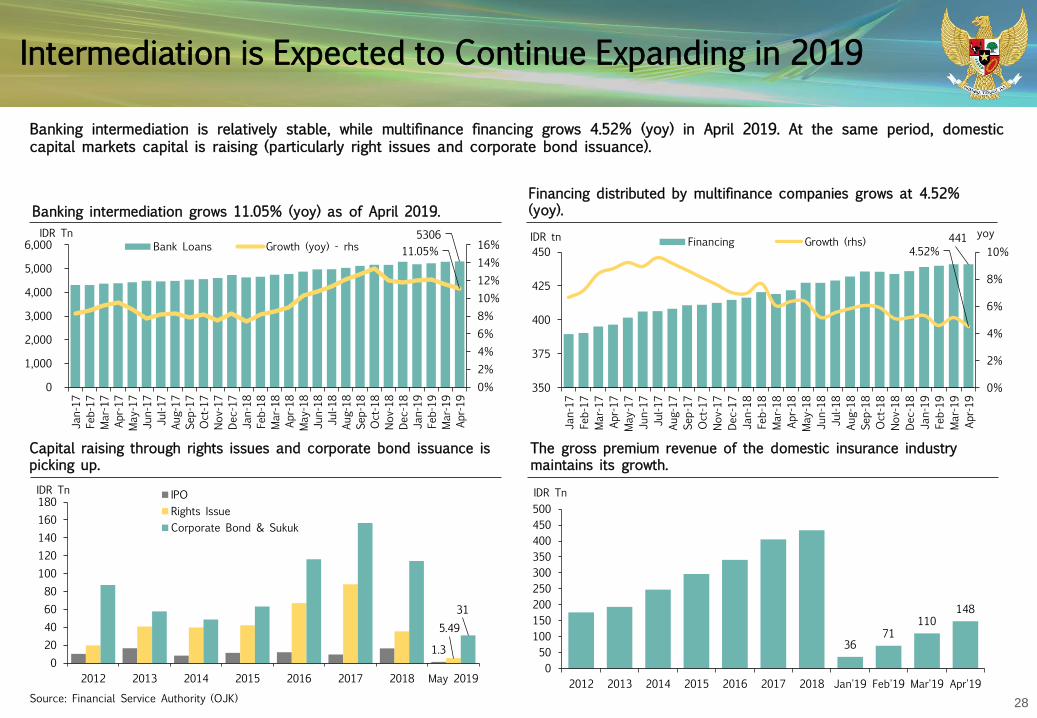
Intermediation is Expected to Continue Expanding in 2019
Banking intermediation is relatively stable, while multifinance financing grows 4.52% (yoy) in April 2019. At the same period, domesticcapital markets capital is raising (particularly right issues and corporate bond issuance).
Source: Financial Service Authority (OJK)
Financing distributed by multifinance companies grows at 4.52% (yoy).
The gross premium revenue of the domestic insurance industry maintains its growth.
Capital raising through rights issues and corporate bond issuance is picking up.
Banking intermediation grows 11.05% (yoy) as of April 2019.5306
11.05%
0%2%4%6%8%10%12%14%16%
0
1,000
2,000
3,000
4,000
5,000
6,000
Jan-17
Feb-17
Mar-17
Apr-17
May
-17
Jun-17
Jul-1
7Au
g-17
Sep-17
Oct-17
Nov-17
Dec-17
Jan-18
Feb-18
Mar-18
Apr-18
May
-18
Jun-18
Jul-1
8Au
g-18
Sep-18
Oct-18
Nov-18
Dec-18
Jan-19
Feb-19
Mar-19
Apr-19
IDR TnBank Loans Growth (yoy) - rhs
1.3
5.4931
020406080
100120140160180
2012 2013 2014 2015 2016 2017 2018 May 2019
IDR Tn IPORights IssueCorporate Bond & Sukuk
3671
110148
050
100150200250300350400450500
2012 2013 2014 2015 2016 2017 2018 Jan'19 Feb'19 Mar'19 Apr'19
IDR Tn
441 4.52%
0%
2%
4%
6%
8%
10%
350
375
400
425
450
Jan-17
Feb-17
Mar-17
Apr-17
May
-17
Jun-17
Jul-1
7Au
g-17
Sep-17
Oct-17
Nov-17
Dec-17
Jan-18
Feb-18
Mar-18
Apr-18
May
-18
Jun-18
Jul-1
8Au
g-18
Sep-18
Oct-18
Nov-18
Dec-18
Jan-19
Feb-19
Mar-19
Apr-19
yoyIDR tn Financing Growth (rhs)
29
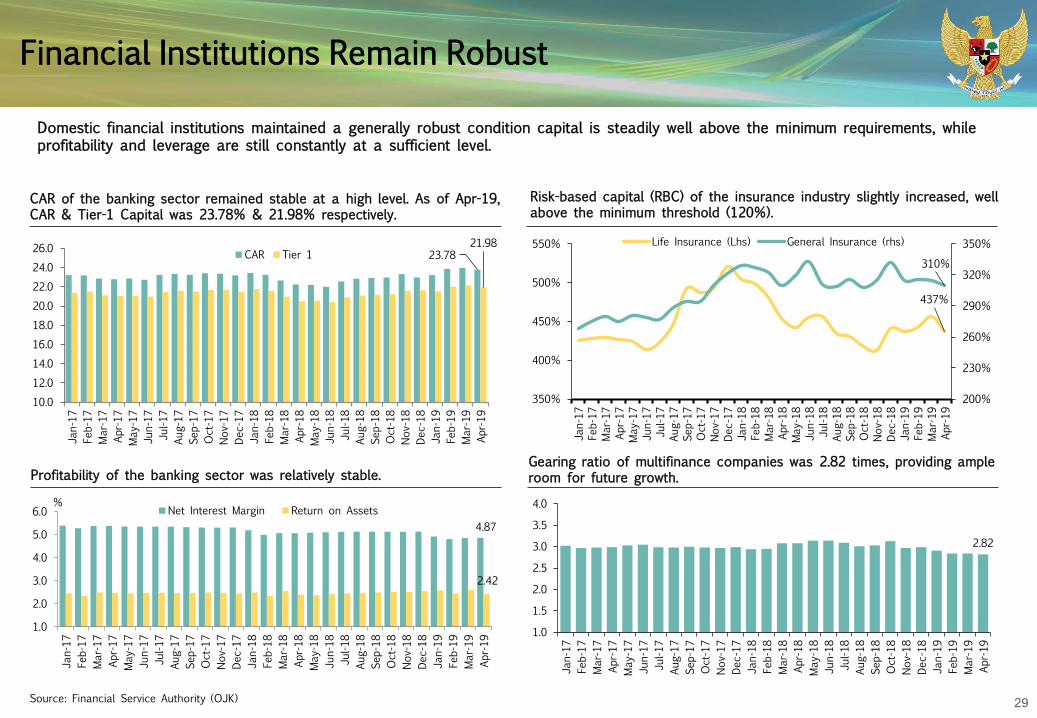
Financial Institutions Remain Robust
CAR of the banking sector remained stable at a high level. As of Apr-19, CAR & Tier-1 Capital was 23.78% & 21.98% respectively.
Risk-based capital (RBC) of the insurance industry slightly increased, well above the minimum threshold (120%).
Gearing ratio of multifinance companies was 2.82 times, providing ample room for future growth.Profitability of the banking sector was relatively stable.
Domestic financial institutions maintained a generally robust condition capital is steadily well above the minimum requirements, while profitability and leverage are still constantly at a sufficient level.
Source: Financial Service Authority (OJK)
23.7821.98
10.0
12.0
14.0
16.0
18.0
20.0
22.0
24.0
26.0
Jan-17
Feb-17
Mar-17
Apr-17
May
-17
Jun-17
Jul-1
7Au
g-17
Sep-17
Oct-17
Nov-17
Dec-17
Jan-18
Feb-18
Mar-18
Apr-18
May
-18
Jun-18
Jul-1
8Au
g-18
Sep-18
Oct-18
Nov-18
Dec-18
Jan-19
Feb-19
Mar-19
Apr-19
CAR Tier 1
4.87
2.42
1.0
2.0
3.0
4.0
5.0
6.0
Jan-17
Feb-17
Mar-17
Apr-17
May
-17
Jun-17
Jul-1
7Au
g-17
Sep-17
Oct-17
Nov-17
Dec-17
Jan-18
Feb-18
Mar-18
Apr-18
May
-18
Jun-18
Jul-1
8Au
g-18
Sep-18
Oct-18
Nov-18
Dec-18
Jan-19
Feb-19
Mar-19
Apr-19
%Net Interest Margin Return on Assets
2.82
1.0
1.5
2.0
2.5
3.0
3.5
4.0
Jan-17
Feb-17
Mar-17
Apr-17
May
-17
Jun-17
Jul-1
7Au
g-17
Sep-17
Oct-17
Nov-17
Dec-17
Jan-18
Feb-18
Mar-18
Apr-18
May
-18
Jun-18
Jul-1
8Au
g-18
Sep-18
Oct-18
Nov-18
Dec-18
Jan-19
Feb-19
Mar-19
Apr-19
437%
310%
200%
230%
260%
290%
320%
350%
350%
400%
450%
500%
550%
Jan-17
Feb-17
Mar-17
Apr-17
May
-17
Jun-17
Jul-1
7Au
g-17
Sep-17
Oct-17
Nov-17
Dec-17
Jan-18
Feb-18
Mar-18
Apr-18
May
-18
Jun-18
Jul-1
8Au
g-18
Sep-18
Oct-18
Nov-18
Dec-18
Jan-19
Feb-19
Mar-19
Apr-19
Life Insurance (Lhs) General Insurance (rhs)

30
Manageable Credit Risks with Sufficient Liquidity
Banks are equipped with sufficient liquid assets. Meanwhile, insurance industry also demonstrates adequate level of investment. Creditrisk is also managed at a low level as non-performing loan and non-performing financing remains below the threshold.
The ratio of liquid assets to deposit and LA/NCD in the banking sector was maintained at a sufficient level.
As of Apr-19, the gross & net NPL ratios of the banking sector were 2.57% & 1.15% respectively, still well maintained below the threshold. NPF ratio of the multifinance industry remained low at 2.76% as of Apr-19.
Investment adequacy ratio in the insurance industry was steadly above 100%.
Source: Financial Service Authority (OJK)
96.51
20.15
6
10
14
18
22
26
30
60708090
100110120130140
Jan-17
Feb-17
Mar-17
Apr-17
May
-17
Jun-17
Jul-1
7Au
g-17
Sep-17
Oct-17
Nov-17
Dec-17
Jan-18
Feb-18
Mar-18
Apr-18
May
-18
Jun-18
Jul-1
8Au
g-18
Sep-18
Oct-18
Nov-18
Dec-18
Jan-19
Feb-19
Mar-19
Apr-19
%% Liquid Assets to Non-Core Deposits (lhs)Liquid Assets to Deposit (rhs)
1.15
2.57
0.0
0.5
1.0
1.5
2.0
2.5
3.0
3.5
Jan-17
Feb-17
Mar-17
Apr-17
May
-17
Jun-17
Jul-1
7Au
g-17
Sep-17
Oct-17
Nov-17
Dec-17
Jan-18
Feb-18
Mar-18
Apr-18
May
-18
Jun-18
Jul-1
8Au
g-18
Sep-18
Oct-18
Nov-18
Dec-18
Jan-19
Feb-19
Mar-19
Apr-19
%NPL Net NPL Gross
2.76%
0.0%
0.5%
1.0%
1.5%
2.0%
2.5%
3.0%
3.5%
4.0%
Jan-17
Feb-17
Mar-17
Apr-17
May
-17
Jun-17
Jul-1
7Au
g-17
Sep-17
Oct-17
Nov-17
Dec-17
Jan-18
Feb-18
Mar-18
Apr-18
May
-18
Jun-18
Jul-1
8Au
g-18
Sep-18
Oct-18
Nov-18
Dec-18
Jan-19
Feb-19
Mar-19
Apr-19
116.94
173.76
90
110
130
150
170
190
210
Jan-18
Feb-18
Mar-18
Apr-18
May
-18
Jun-18
Jul-1
8
Aug-18
Sep-18
Oct-18
Nov-18
Dec-18
Jan-19
Feb-19
Mar-19
Apr-19
% Life Insurance General Insurance
31
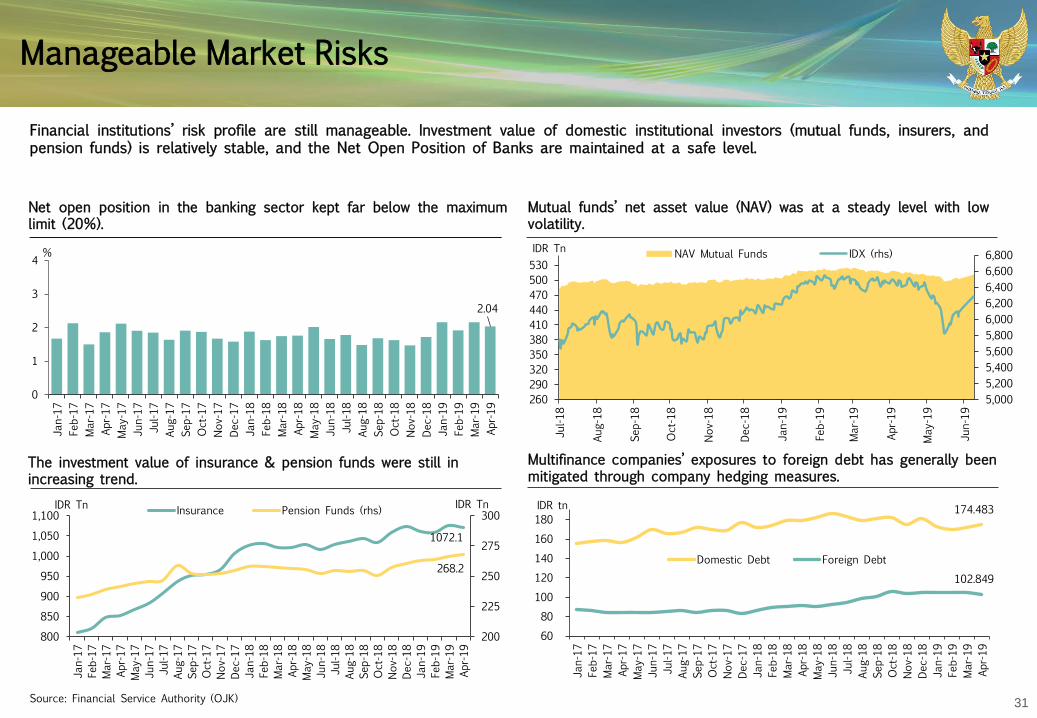
Manageable Market Risks
Financial institutions’ risk profile are still manageable. Investment value of domestic institutional investors (mutual funds, insurers, andpension funds) is relatively stable, and the Net Open Position of Banks are maintained at a safe level.
Net open position in the banking sector kept far below the maximumlimit (20%).
The investment value of insurance & pension funds were still in increasing trend.
Multifinance companies’ exposures to foreign debt has generally been mitigated through company hedging measures.
Mutual funds’ net asset value (NAV) was at a steady level with lowvolatility.
Source: Financial Service Authority (OJK)
2.04
0
1
2
3
4
Jan-17
Feb-17
Mar-17
Apr-17
May
-17
Jun-17
Jul-1
7Au
g-17
Sep-17
Oct-17
Nov-17
Dec-17
Jan-18
Feb-18
Mar-18
Apr-18
May
-18
Jun-18
Jul-1
8Au
g-18
Sep-18
Oct-18
Nov-18
Dec-18
Jan-19
Feb-19
Mar-19
Apr-19
%
1072.1
268.2
200
225
250
275
300
800
850
900
950
1,000
1,050
1,100
Jan-17
Feb-17
Mar-17
Apr-17
May
-17
Jun-17
Jul-1
7Au
g-17
Sep-17
Oct-17
Nov-17
Dec-17
Jan-18
Feb-18
Mar-18
Apr-18
May
-18
Jun-18
Jul-1
8Au
g-18
Sep-18
Oct-18
Nov-18
Dec-18
Jan-19
Feb-19
Mar-19
Apr-19
IDR TnIDR Tn Insurance Pension Funds (rhs) 174.483
102.849
60
80
100
120
140
160
180
Jan-17
Feb-17
Mar-17
Apr-17
May
-17
Jun-17
Jul-1
7Au
g-17
Sep-17
Oct-17
Nov-17
Dec-17
Jan-18
Feb-18
Mar-18
Apr-18
May
-18
Jun-18
Jul-1
8Au
g-18
Sep-18
Oct-18
Nov-18
Dec-18
Jan-19
Feb-19
Mar-19
Apr-19
IDR tn
Domestic Debt Foreign Debt
5,0005,2005,4005,6005,8006,0006,2006,4006,6006,800
260290320350380410440470500530
Jul-1
8
Aug-18
Sep-18
Oct-18
Nov-18
Dec-18
Jan-19
Feb-19
Mar-19
Apr-19
May
-19
Jun-19
IDR Tn NAV Mutual Funds IDX (rhs)
32
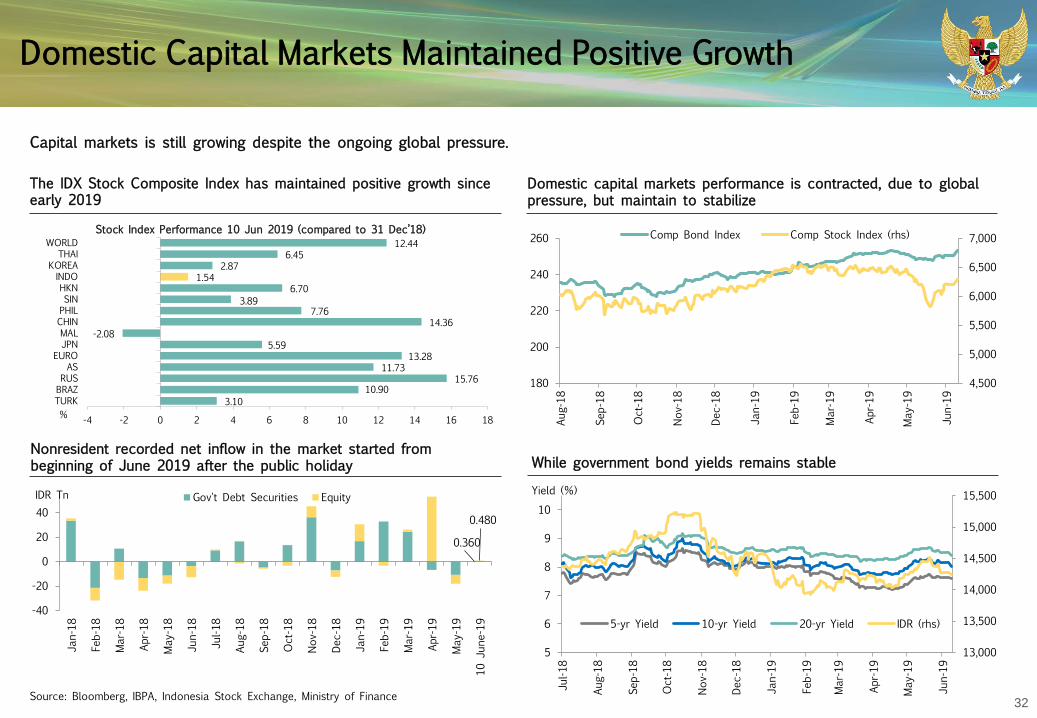
Domestic Capital Markets Maintained Positive Growth
Capital markets is still growing despite the ongoing global pressure.
Source: Bloomberg, IBPA, Indonesia Stock Exchange, Ministry of Finance
Domestic capital markets performance is contracted, due to global pressure, but maintain to stabilize
Nonresident recorded net inflow in the market started from beginning of June 2019 after the public holiday
The IDX Stock Composite Index has maintained positive growth since early 2019
While government bond yields remains stable
Stock Index Performance 10 Jun 2019 (compared to 31 Dec’18)
3.1010.90
15.7611.73
13.285.59
-2.0814.36
7.763.89
6.701.54
2.876.45
12.44
-4 -2 0 2 4 6 8 10 12 14 16 18
TURKBRAZRUSAS
EUROJPNMALCHINPHILSINHKNINDO
KOREATHAI
WORLD
%
0.360
0.480
-40
-20
0
20
40
Jan-18
Feb-18
Mar-18
Apr-18
May
-18
Jun-18
Jul-1
8
Aug-18
Sep-18
Oct-18
Nov-18
Dec-18
Jan-19
Feb-19
Mar-19
Apr-19
May
-19
10 J
une-19
IDR Tn Gov't Debt Securities Equity
4,500
5,000
5,500
6,000
6,500
7,000
180
200
220
240
260
Aug-18
Sep-18
Oct-18
Nov-18
Dec-18
Jan-19
Feb-19
Mar-19
Apr-19
May
-19
Jun-19
Comp Bond Index Comp Stock Index (rhs)
13,000
13,500
14,000
14,500
15,000
15,500
5
6
7
8
9
10
Jul-1
8
Aug-18
Sep-18
Oct-18
Nov-18
Dec-18
Jan-19
Feb-19
Mar-19
Apr-19
May
-19
Jun-19
Yield (%)
5-yr Yield 10-yr Yield 20-yr Yield IDR (rhs)
33
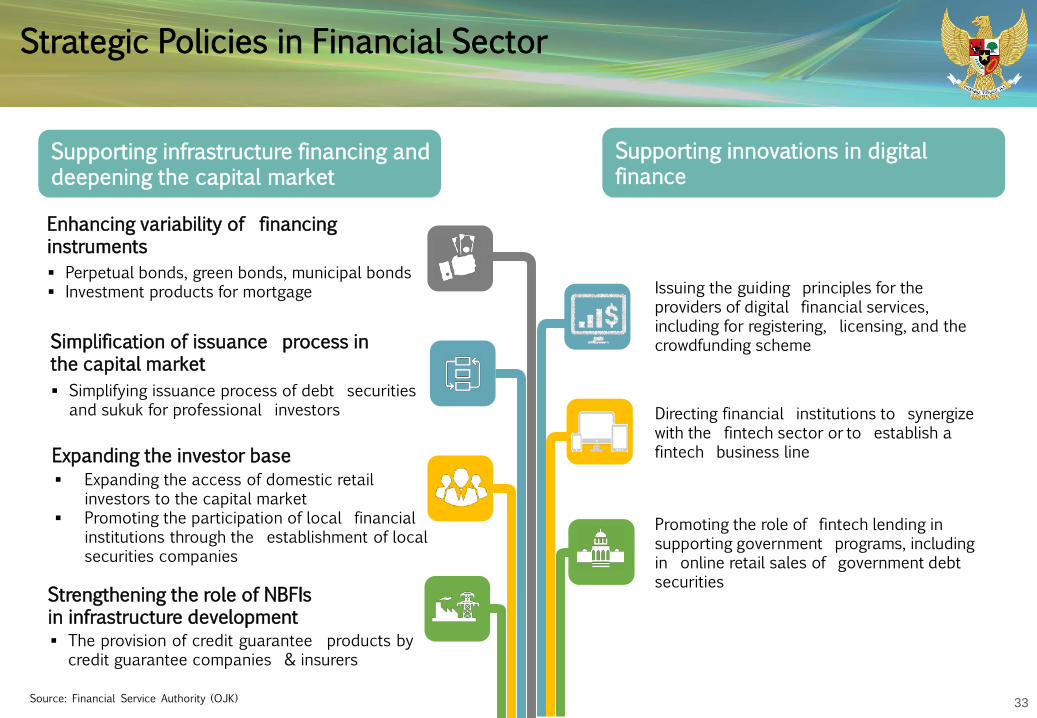
Strategic Policies in Financial Sector
Source: Financial Service Authority (OJK)
Supporting infrastructure financing anddeepening the capital market
Enhancing variability of financing instruments Perpetual bonds, green bonds, municipal bonds Investment products for mortgage
Simplification of issuance process in the capital market Simplifying issuance process of debt securities
and sukuk for professional investors
Expanding the investor base Expanding the access of domestic retail
investors to the capital market Promoting the participation of local financial
institutions through the establishment of local securities companies
Strengthening the role of NBFIsin infrastructure development The provision of credit guarantee products by
credit guarantee companies & insurers
Supporting innovations in digital finance
Issuing the guiding principles for the providers of digital financial services, including for registering, licensing, and the crowdfunding scheme
Directing financial institutions to synergize with the fintech sector or to establish a fintech business line
Promoting the role of fintech lending in supporting government programs, including in online retail sales of government debt securities
34
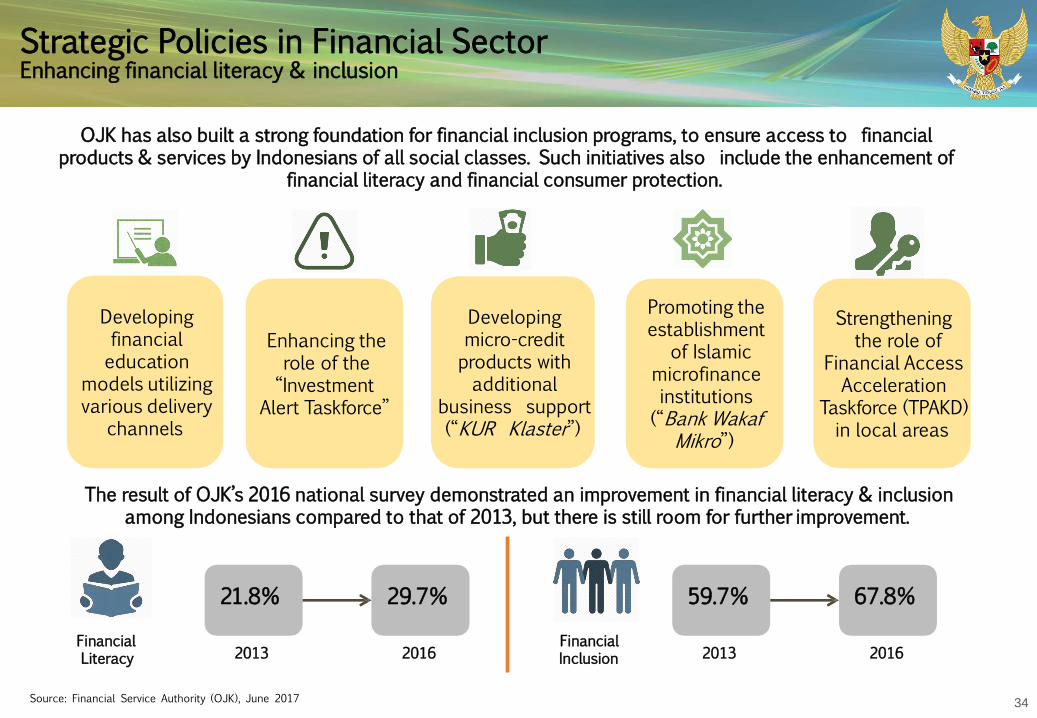
Strategic Policies in Financial SectorEnhancing financial literacy & inclusion
Source: Financial Service Authority (OJK), June 2017
OJK has also built a strong foundation for financial inclusion programs, to ensure access to financial products & services by Indonesians of all social classes. Such initiatives also include the enhancement of
financial literacy and financial consumer protection.
Developing financial education
models utilizing various delivery
channels
Enhancing the role of the “Investment
Alert Taskforce”
The result of OJK’s 2016 national survey demonstrated an improvement in financial literacy & inclusion among Indonesians compared to that of 2013, but there is still room for further improvement.
Financial Literacy
Financial Inclusion
21.8% 29.7%
2013 2016
59.7% 67.8%
2013 2016
Developing micro-credit products with additional
business support(“KUR Klaster”)
Promoting the establishment
of Islamic microfinance institutions (“Bank Wakaf
Mikro”)
Strengthening the role of
Financial Access Acceleration
Taskforce (TPAKD) in local areas
35
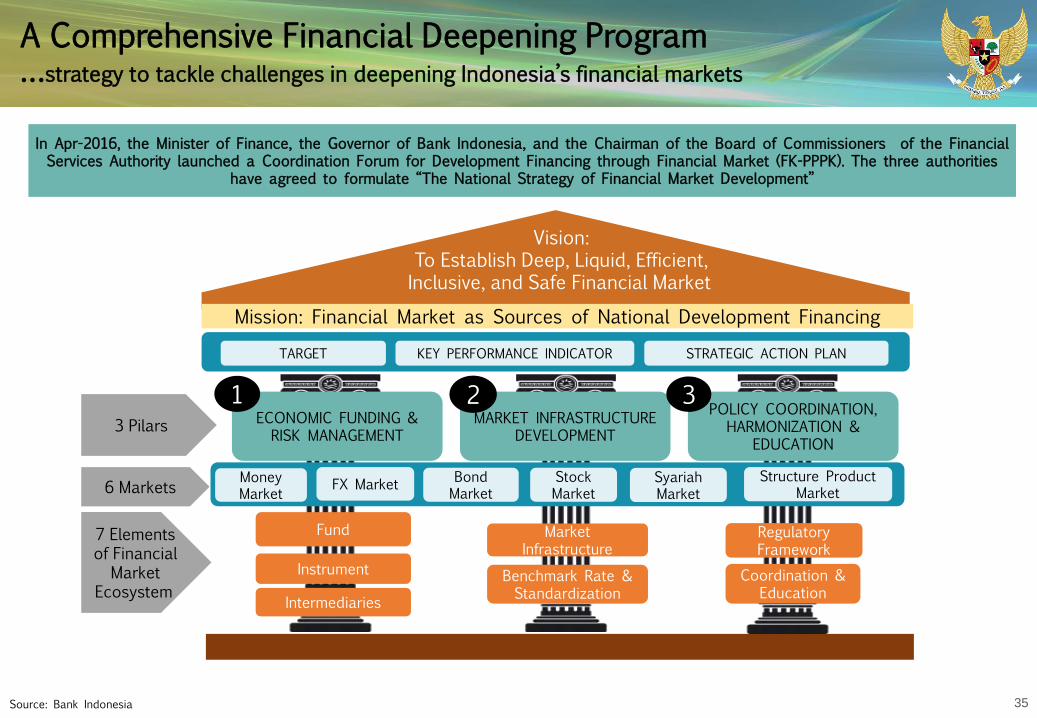
A Comprehensive Financial Deepening Program…strategy to tackle challenges in deepening Indonesia’s financial markets
Source: Bank Indonesia
In Apr-2016, the Minister of Finance, the Governor of Bank Indonesia, and the Chairman of the Board of Commissioners of the Financial Services Authority launched a Coordination Forum for Development Financing through Financial Market (FK-PPPK). The three authorities
have agreed to formulate “The National Strategy of Financial Market Development”
Vision: To Establish Deep, Liquid, Efficient, Inclusive, and Safe Financial Market
ECONOMIC FUNDING & RISK MANAGEMENT
MARKET INFRASTRUCTUREDEVELOPMENT
POLICY COORDINATION, HARMONIZATION &
EDUCATION
Benchmark Rate & Standardization
Instrument
Fund Regulatory Framework
Market Infrastructure
Intermediaries
Coordination & Education
Mission: Financial Market as Sources of National Development Financing
1 2 3
Money Market FX Market Bond
MarketStock Market
SyariahMarket
Structure Product Market
3 Pilars
6 Markets
7 Elements of Financial
Market Ecosystem
TARGET KEY PERFORMANCE INDICATOR STRATEGIC ACTION PLAN

36
Continuous Program on Capital Market Deepening…continuously strengthened, including through capital market deepening initiatives
Strengthening market infrastructure
Expansion of Single Investor Identification (SID) coverage Development of electronic trading platform (ETP) in the
debt market Development of Integrated Investment Management
System (S-INVEST) Enhancing the clearing and settlement process Enhancement of capital market data warehouse Development of Extensible Business Reporting Language
(XBRL) for issuers
Enhancing the supply-side
Simplification of public-offering requirements and procedures
Development of debt market Development of mutual fund industry Development of other products, including those to
support infrastructure development (private equity funds, REITs, ABS)
Development of Islamic capital market Development of municipal bonds
Enhancing the demand-side Strengthening governance
Development of market players’ capacity Enhancement of GCG for publicly-listed companies Development of repo regulations and infrastructure
Source: Financial Service Authority (OJK)
Enhancing the role of the domestic institutional investors (insurers & pension funds) in capital markets
Development of the domestic investor base (conducting investor education programs)
Expansion of distribution channels of market products
37
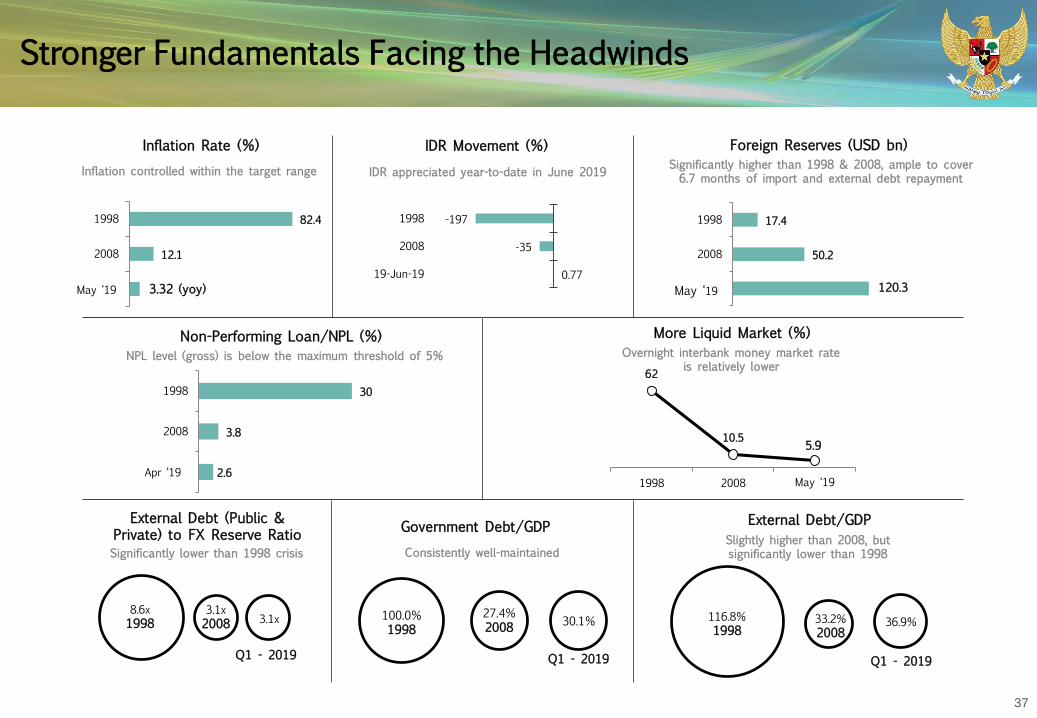
Stronger Fundamentals Facing the Headwinds
82.4
12.1
6.8
1998
2008
Sep-15
30
3.8
2.8
1998
2008
Aug-15
17.4
50.2
1998
2008
Sep-15
Inflation Rate (%) IDR Movement (%)
Non-Performing Loan/NPL (%)
Government Debt/GDP
Foreign Reserves (USD bn)
100.0%1998
27.4%2008 30.1%
Q1 - 2019
8.6x1998
3.1x2008 3.1x
Q1 - 2019
116.8%1998
33.2%2008
36.9%
Q1 - 2019
More Liquid Market (%)
External Debt (Public & Private) to FX Reserve Ratio
External Debt/GDP
Inflation controlled within the target range IDR appreciated year-to-date in June 2019
NPL level (gross) is below the maximum threshold of 5%
Consistently well-maintained
Significantly higher than 1998 & 2008, ample to cover 6.7 months of import and external debt repayment
Significantly lower than 1998 crisisSlightly higher than 2008, but significantly lower than 1998
May ‘19 120.3May ‘19 3.32 (yoy)
Apr ‘19 2.6
62
10.5 5.7
1998 2008 Jul-15
Overnight interbank money market rate is relatively lower
May ‘19
5.9
(ytd) 0.77
-35
-197
19-Jun-19
2008
1998
38
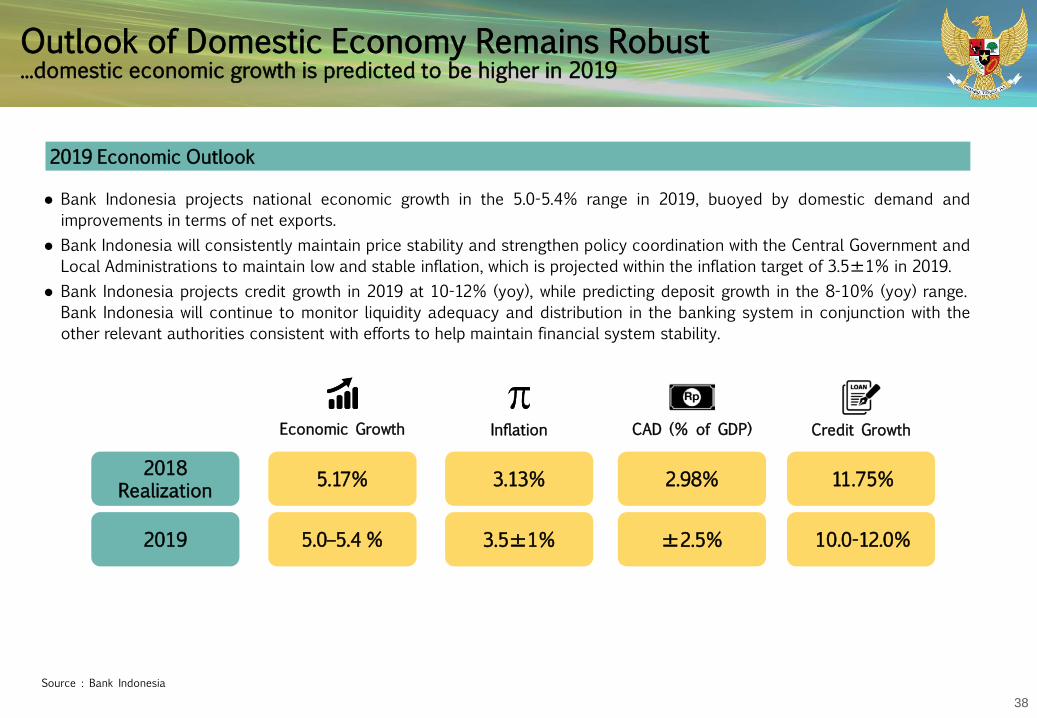
Outlook of Domestic Economy Remains Robust...domestic economic growth is predicted to be higher in 2019
2019 Economic Outlook
Bank Indonesia projects national economic growth in the 5.0-5.4% range in 2019, buoyed by domestic demand andimprovements in terms of net exports.
Bank Indonesia will consistently maintain price stability and strengthen policy coordination with the Central Government andLocal Administrations to maintain low and stable inflation, which is projected within the inflation target of 3.5±1% in 2019.
Bank Indonesia projects credit growth in 2019 at 10-12% (yoy), while predicting deposit growth in the 8-10% (yoy) range.Bank Indonesia will continue to monitor liquidity adequacy and distribution in the banking system in conjunction with theother relevant authorities consistent with efforts to help maintain financial system stability.
Economic Growth Inflation CAD (% of GDP) Credit Growth
Source : Bank Indonesia
2018Realization 5.17% 3.13% 2.98% 11.75%
2019 5.0–5.4 % 3.5±1% ±2.5% 10.0-12.0%
39
40