overview of goldman sachs · 4 fitch moody's s&p goldman sachs group inc. short-term debt...
TRANSCRIPT
May 9, 2018
Overview of Goldman Sachs
1
Cautionary Note on Forward-Looking Statements
This presentation includes forward-looking statements. These statements are not historical facts, but instead represent only the Firm’s
beliefs regarding future events, many of which, by their nature, are inherently uncertain and outside of the Firm’s control. Forward-
looking statements include statements about the effect of the Tax Cuts and Jobs Act (“Tax Legislation”). It is possible that the Firm’s
actual results and financial condition may differ, possibly materially, from the anticipated results and financial condition indicated in
these forward-looking statements.
For a discussion of some of the risks and important factors that could affect the Firm’s future results and financial condition, see “Risk
Factors” in our Annual Report on Form 10-K (“Form 10-K”) for the year ended December 31, 2017. You should also read the forward-
looking disclaimers in our Form 10-Q for the period ended March 31, 2018, and information on the calculation of non-GAAP financial
measures that is posted on the Investor Relations portion of our website: www.gs.com. See the appendix for more information about
non-GAAP financial measures in this presentation.
The financial and other information provided herein is provided for the periods ended, or the dates, indicated on the relevant slide. No
information is provided for a date or period ended more recent than May 9, 2018.
2
Key Credit Strengths
Regulatory
Capital
Ratios and
Balance Sheet
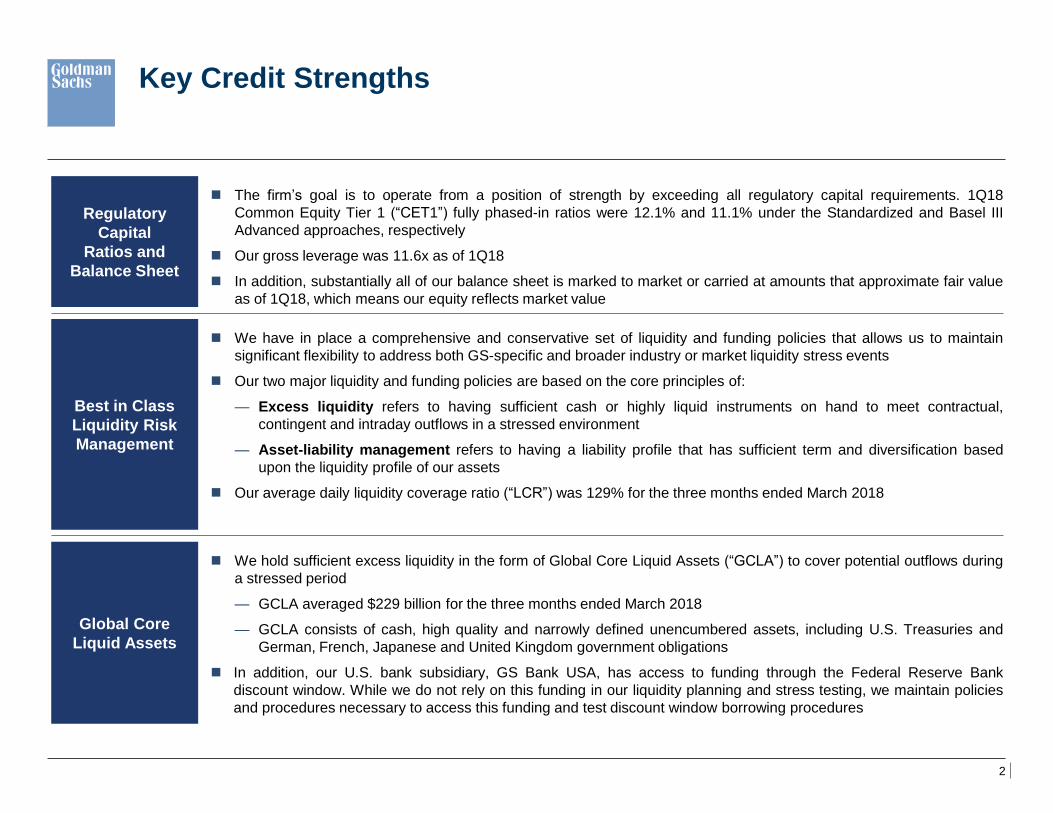
The firm’s goal is to operate from a position of strength by exceeding all regulatory capital requirements. 1Q18
Common Equity Tier 1 (“CET1”) fully phased-in ratios were 12.1% and 11.1% under the Standardized and Basel III
Advanced approaches, respectively
Our gross leverage was 11.6x as of 1Q18
In addition, substantially all of our balance sheet is marked to market or carried at amounts that approximate fair value
as of 1Q18, which means our equity reflects market value
Best in Class
Liquidity Risk
Management
We have in place a comprehensive and conservative set of liquidity and funding policies that allows us to maintain
significant flexibility to address both GS-specific and broader industry or market liquidity stress events
Our two major liquidity and funding policies are based on the core principles of:
— Excess liquidity refers to having sufficient cash or highly liquid instruments on hand to meet contractual,
contingent and intraday outflows in a stressed environment
— Asset-liability management refers to having a liability profile that has sufficient term and diversification based
upon the liquidity profile of our assets
Our average daily liquidity coverage ratio (“LCR”) was 129% for the three months ended March 2018
Global Core
Liquid Assets
We hold sufficient excess liquidity in the form of Global Core Liquid Assets (“GCLA”) to cover potential outflows during
a stressed period
— GCLA averaged $229 billion for the three months ended March 2018
— GCLA consists of cash, high quality and narrowly defined unencumbered assets, including U.S. Treasuries and
German, French, Japanese and United Kingdom government obligations
In addition, our U.S. bank subsidiary, GS Bank USA, has access to funding through the Federal Reserve Bank
discount window. While we do not rely on this funding in our liquidity planning and stress testing, we maintain policies
and procedures necessary to access this funding and test discount window borrowing procedures
3
Key Credit Strengths (cont’d)
Conservative
Asset-Liability
Management
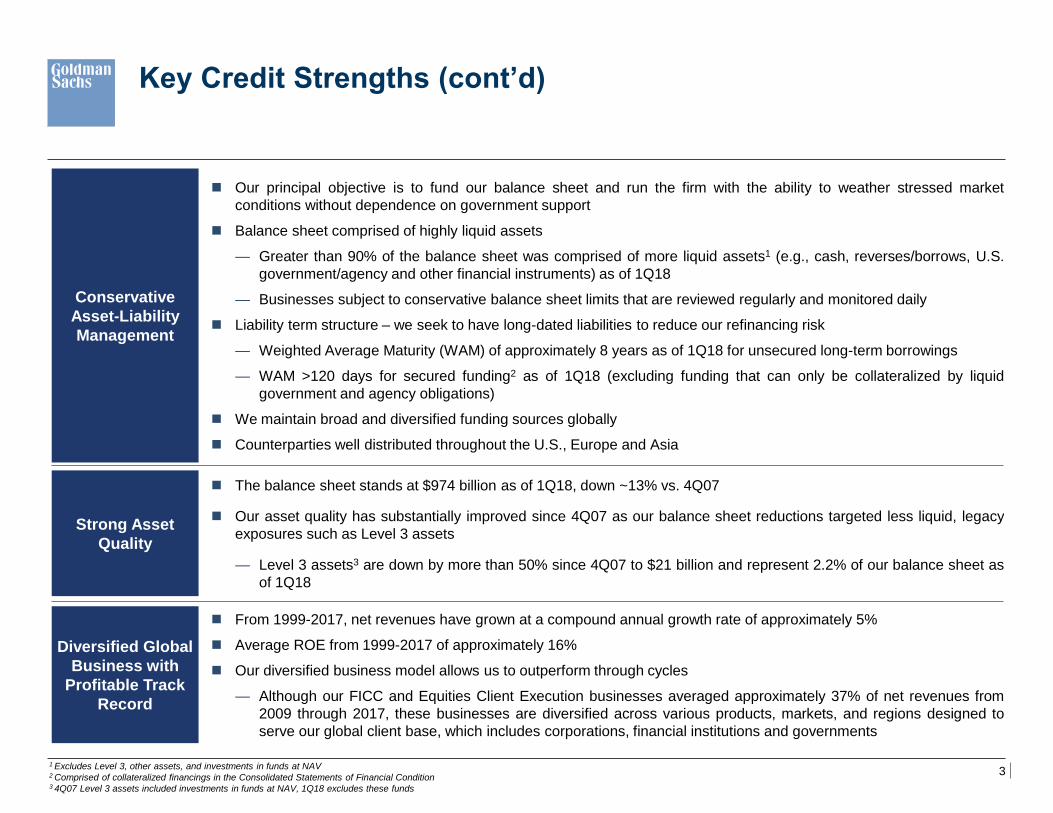
Our principal objective is to fund our balance sheet and run the firm with the ability to weather stressed market
conditions without dependence on government support
Balance sheet comprised of highly liquid assets
— Greater than 90% of the balance sheet was comprised of more liquid assets1 (e.g., cash, reverses/borrows, U.S.
government/agency and other financial instruments) as of 1Q18
— Businesses subject to conservative balance sheet limits that are reviewed regularly and monitored daily
Liability term structure – we seek to have long-dated liabilities to reduce our refinancing risk
— Weighted Average Maturity (WAM) of approximately 8 years as of 1Q18 for unsecured long-term borrowings
— WAM >120 days for secured funding2 as of 1Q18 (excluding funding that can only be collateralized by liquid
government and agency obligations)
We maintain broad and diversified funding sources globally
Counterparties well distributed throughout the U.S., Europe and Asia
Strong Asset
Quality
The balance sheet stands at $974 billion as of 1Q18, down ~13% vs. 4Q07
Our asset quality has substantially improved since 4Q07 as our balance sheet reductions targeted less liquid, legacy
exposures such as Level 3 assets
— Level 3 assets3 are down by more than 50% since 4Q07 to $21 billion and represent 2.2% of our balance sheet as
of 1Q18
Diversified Global
Business with
Profitable Track
Record
From 1999-2017, net revenues have grown at a compound annual growth rate of approximately 5%
Average ROE from 1999-2017 of approximately 16%
Our diversified business model allows us to outperform through cycles
— Although our FICC and Equities Client Execution businesses averaged approximately 37% of net revenues from
2009 through 2017, these businesses are diversified across various products, markets, and regions designed to
serve our global client base, which includes corporations, financial institutions and governments
1 Excludes Level 3, other assets, and investments in funds at NAV 2 Comprised of collateralized financings in the Consolidated Statements of Financial Condition 3 4Q07 Level 3 assets included investments in funds at NAV, 1Q18 excludes these funds
4
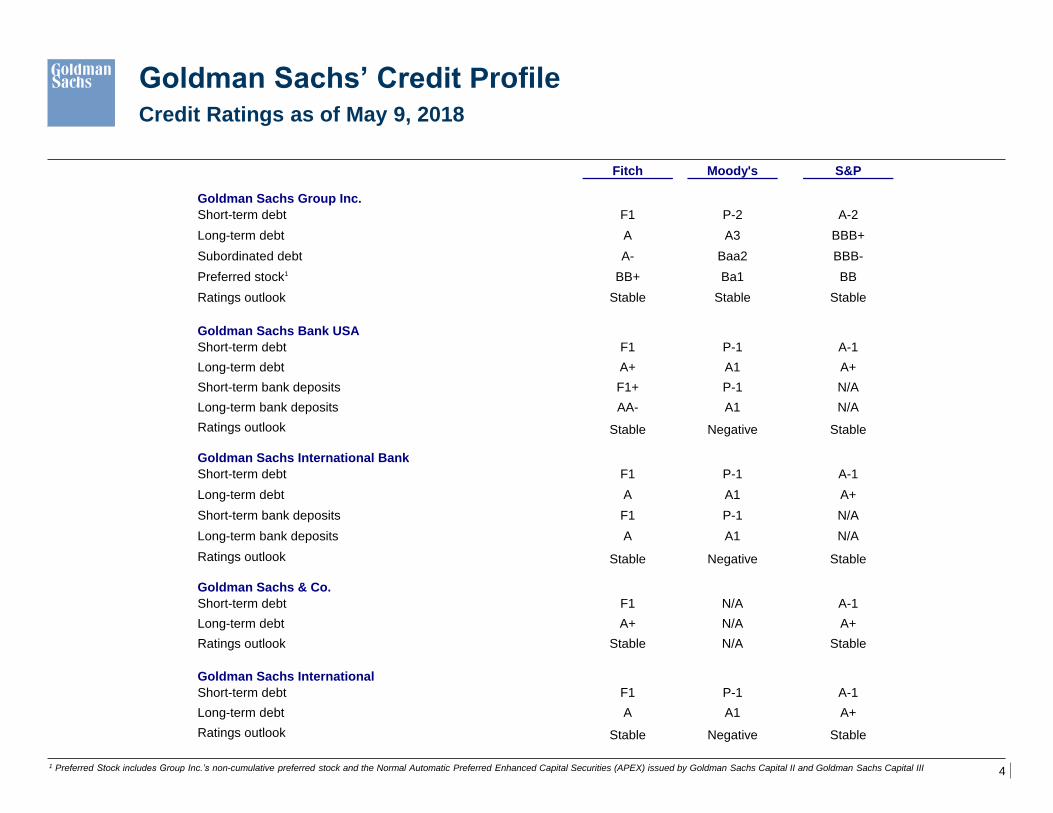
Fitch Moody's S&P
Goldman Sachs Group Inc.
Short-term debt F1 P-2 A-2
Long-term debt A A3 BBB+
Subordinated debt A- Baa2 BBB-
Preferred stock1 BB+ Ba1 BB
Ratings outlook Stable Stable Stable
Goldman Sachs Bank USA
Short-term debt F1 P-1 A-1
Long-term debt A+ A1 A+
Short-term bank deposits F1+ P-1 N/A
Long-term bank deposits AA- A1 N/A
Ratings outlook Stable Negative Stable
Goldman Sachs International Bank
Short-term debt F1 P-1 A-1
Long-term debt A A1 A+
Short-term bank deposits F1 P-1 N/A
Long-term bank deposits A A1 N/A
Ratings outlook Stable Negative Stable
Goldman Sachs & Co.
Short-term debt F1 N/A A-1
Long-term debt A+ N/A A+
Ratings outlook Stable N/A Stable
Goldman Sachs International
Short-term debt F1 P-1 A-1
Long-term debt A A1 A+
Ratings outlook Stable Negative Stable
Goldman Sachs’ Credit Profile Credit Ratings as of May 9, 2018
1 Preferred Stock includes Group Inc.’s non-cumulative preferred stock and the Normal Automatic Preferred Enhanced Capital Securities (APEX) issued by Goldman Sachs Capital II and Goldman Sachs Capital III

5
Americas 58%
EMEA 26%
Asia 16%
Diversified Net Revenue Mix
Our goal is to continue to have leading, diverse franchise businesses
Diversified by Business
Average 2009 – 2017 Diversified by Geography
Average 2009 – 2017
Investment Banking
17%
FICC Client Execution
29%
Equities Client Execution
8%
Commissions and Fees
9%
Securities Services
5%
Investment Management
16%
Investing & Lending
16%
6
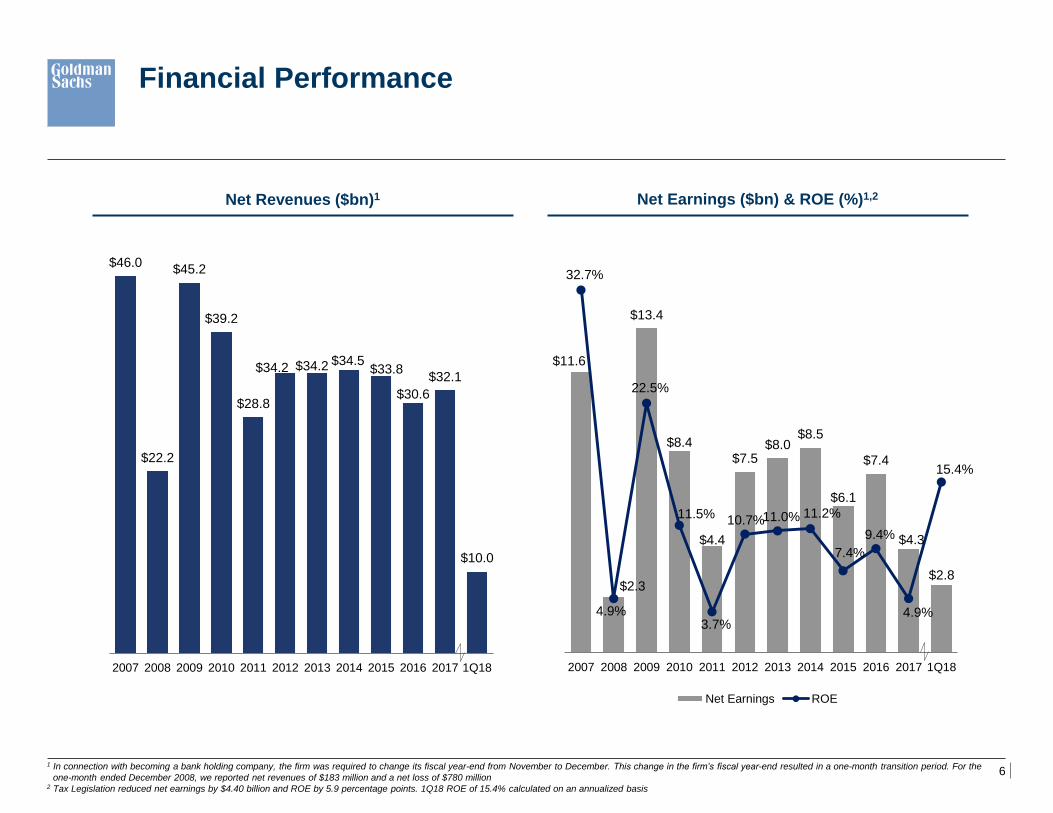
$11.6
$2.3
$13.4
$8.4
$4.4
$7.5 $8.0
$8.5
$6.1
$7.4
$4.3
$2.8
32.7%
4.9%
22.5%
11.5%
3.7%
10.7% 11.0% 11.2%
7.4%
9.4%
4.9%
15.4%
2007 2008 2009 2010 2011 2012 2013 2014 2015 2016 2017 1Q18
Net Earnings ROE
Financial Performance
Net Revenues ($bn)1 Net Earnings ($bn) & ROE (%)1,2
1 In connection with becoming a bank holding company, the firm was required to change its fiscal year-end from November to December. This change in the firm’s fiscal year-end resulted in a one-month transition period. For the
one-month ended December 2008, we reported net revenues of $183 million and a net loss of $780 million 2 Tax Legislation reduced net earnings by $4.40 billion and ROE by 5.9 percentage points. 1Q18 ROE of 15.4% calculated on an annualized basis
$46.0
$22.2
$45.2
$39.2
$28.8
$34.2 $34.2 $34.5 $33.8
$30.6
$32.1
$10.0
2007 2008 2009 2010 2011 2012 2013 2014 2015 2016 2017 1Q18
7
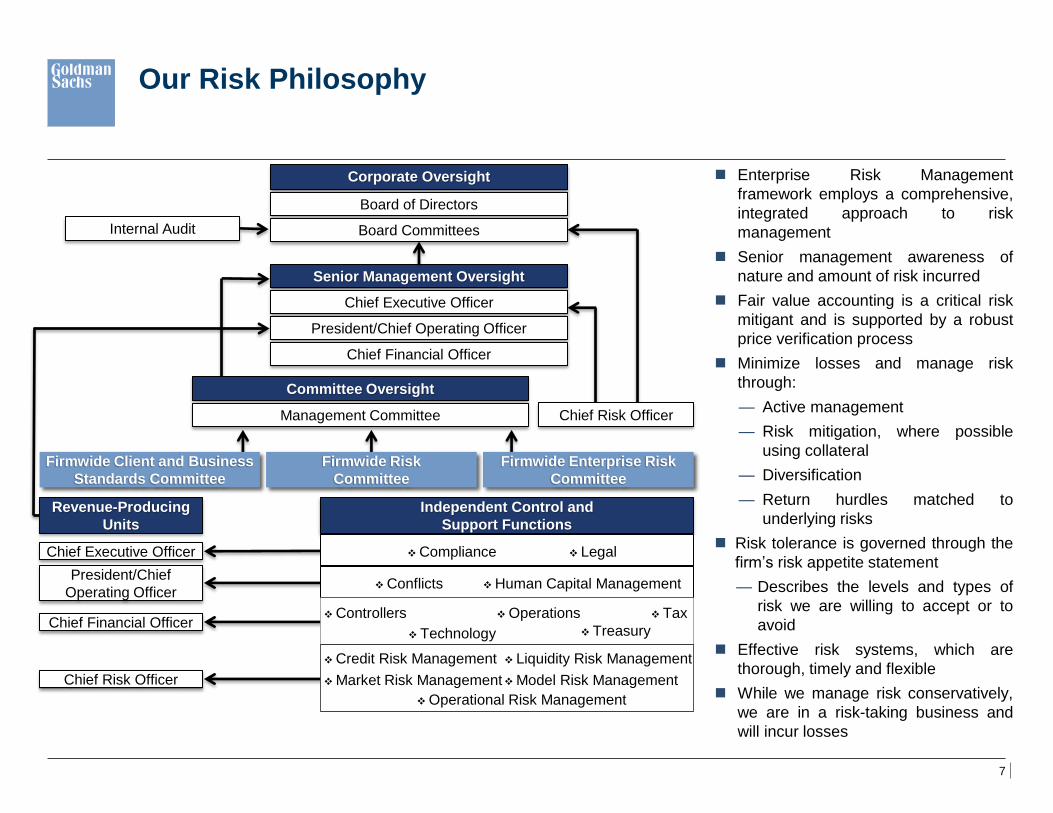
Enterprise Risk Management
framework employs a comprehensive,
integrated approach to risk
management
Senior management awareness of
nature and amount of risk incurred
Fair value accounting is a critical risk
mitigant and is supported by a robust
price verification process
Minimize losses and manage risk
through:
— Active management
— Risk mitigation, where possible
using collateral
— Diversification
— Return hurdles matched to
underlying risks
Risk tolerance is governed through the
firm’s risk appetite statement
— Describes the levels and types of
risk we are willing to accept or to
avoid
Effective risk systems, which are
thorough, timely and flexible
While we manage risk conservatively,
we are in a risk-taking business and
will incur losses
Corporate Oversight
Board of Directors
Senior Management Oversight
Committee Oversight
Management Committee
Independent Control and
Support Functions
Revenue-Producing
Units
Firmwide Client and Business
Standards Committee
Internal Audit
Chief Risk Officer
Board Committees
Chief Executive Officer
President/Chief Operating Officer
Chief Financial Officer
Firmwide Risk
Committee
Chief Executive Officer
President/Chief
Operating Officer
Chief Financial Officer
Chief Risk Officer
Compliance
Conflicts
Legal
Human Capital Management
Controllers Tax
Treasury
Operations
Technology
Credit Risk Management
Market Risk Management
Operational Risk Management
Liquidity Risk Management
Model Risk Management
Our Risk Philosophy
Firmwide Enterprise Risk
Committee
8
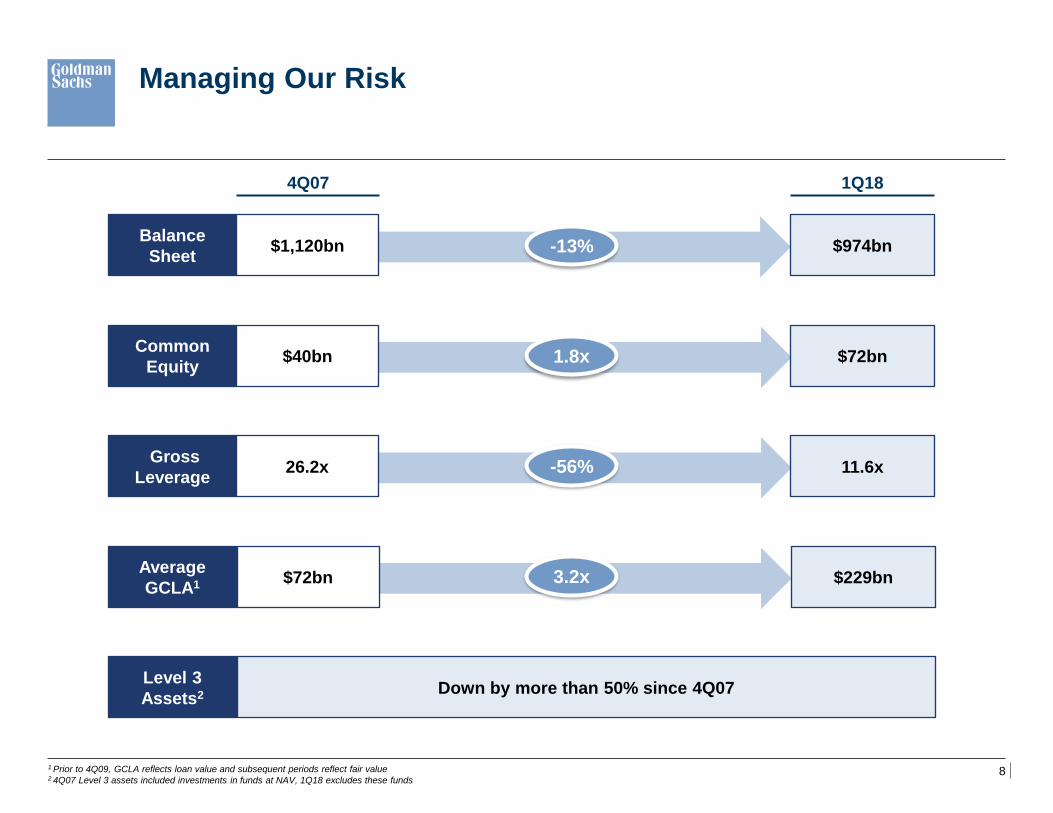
Down by more than 50% since 4Q07
Managing Our Risk
Balance
Sheet
Common
Equity
Gross
Leverage
Average
GCLA1
Level 3
Assets2
4Q07
$1,120bn
$40bn
26.2x
$72bn
$974bn
$72bn
11.6x
$229bn
1Q18
1 Prior to 4Q09, GCLA reflects loan value and subsequent periods reflect fair value 2 4Q07 Level 3 assets included investments in funds at NAV, 1Q18 excludes these funds
-13%
1.8x
-56%
3.2x
9
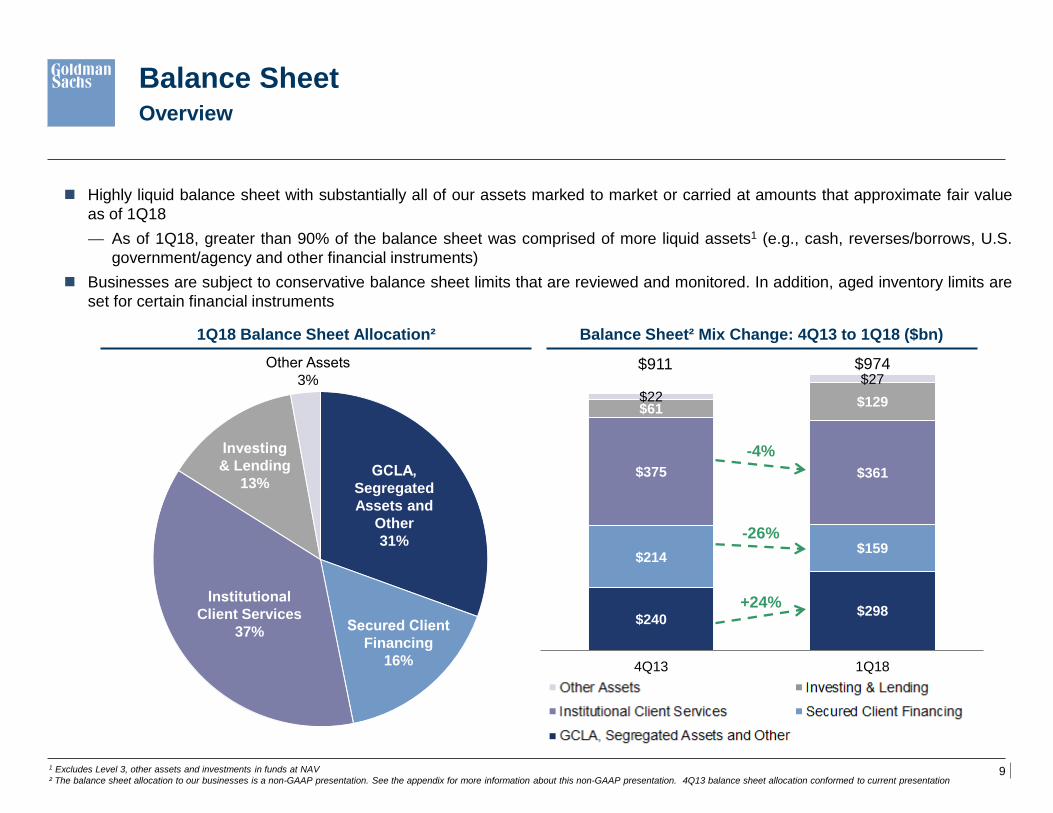
$240 $298
$214 $159
$375 $361
$61 $129 $22
$27 $911 $974
4Q13 1Q18
Balance Sheet Overview
1 Excludes Level 3, other assets and investments in funds at NAV
² The balance sheet allocation to our businesses is a non-GAAP presentation. See the appendix for more information about this non-GAAP presentation. 4Q13 balance sheet allocation conformed to current presentation
1Q18 Balance Sheet Allocation²
Highly liquid balance sheet with substantially all of our assets marked to market or carried at amounts that approximate fair value
as of 1Q18
— As of 1Q18, greater than 90% of the balance sheet was comprised of more liquid assets1 (e.g., cash, reverses/borrows, U.S.
government/agency and other financial instruments)
Businesses are subject to conservative balance sheet limits that are reviewed and monitored. In addition, aged inventory limits are
set for certain financial instruments
Balance Sheet² Mix Change: 4Q13 to 1Q18 ($bn)
+24%
-4%
-26%
GCLA,
Segregated
Assets and
Other
31%
Secured Client
Financing
16%
Institutional
Client Services
37%
Investing
& Lending
13%
Other Assets
3%
10
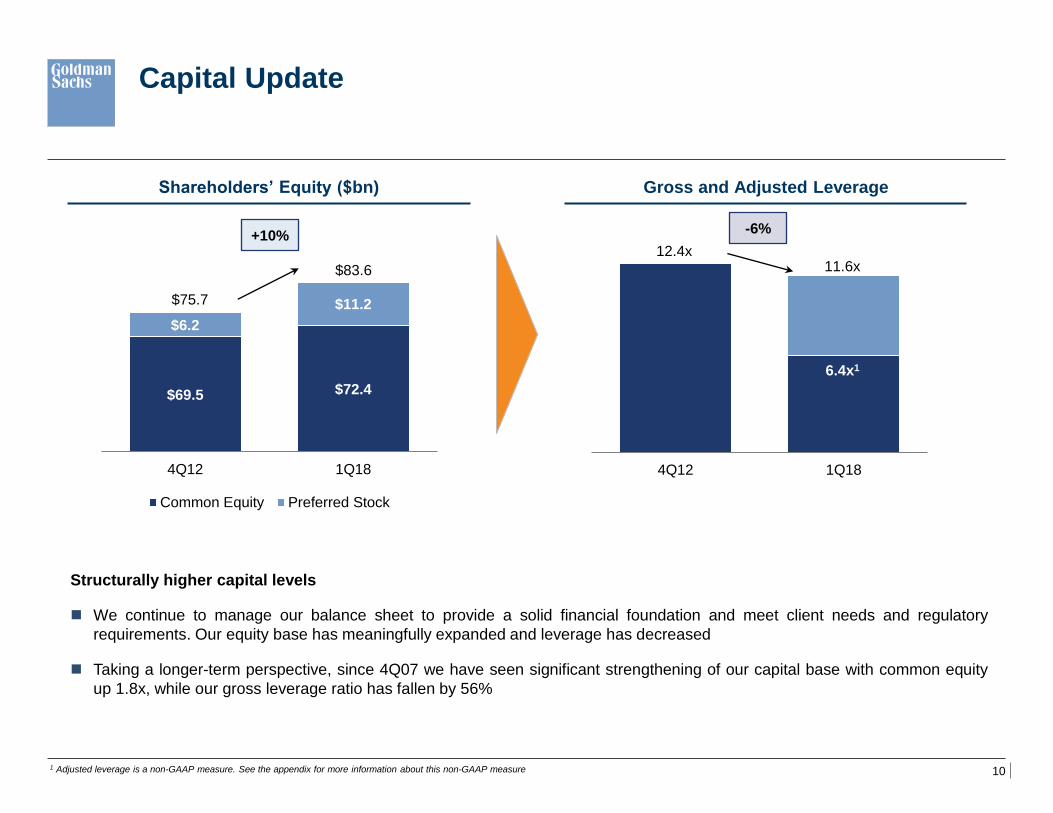
Capital Update
+10%
Structurally higher capital levels
We continue to manage our balance sheet to provide a solid financial foundation and meet client needs and regulatory
requirements. Our equity base has meaningfully expanded and leverage has decreased
Taking a longer-term perspective, since 4Q07 we have seen significant strengthening of our capital base with common equity
up 1.8x, while our gross leverage ratio has fallen by 56%
Shareholders’ Equity ($bn) Gross and Adjusted Leverage
-6%
1 Adjusted leverage is a non-GAAP measure. See the appendix for more information about this non-GAAP measure
$69.5 $72.4
$6.2
$11.2
4Q12 1Q18
Common Equity Preferred Stock
$75.7
$83.6
12.4x 11.6x
4Q12 1Q18
6.4x1
11
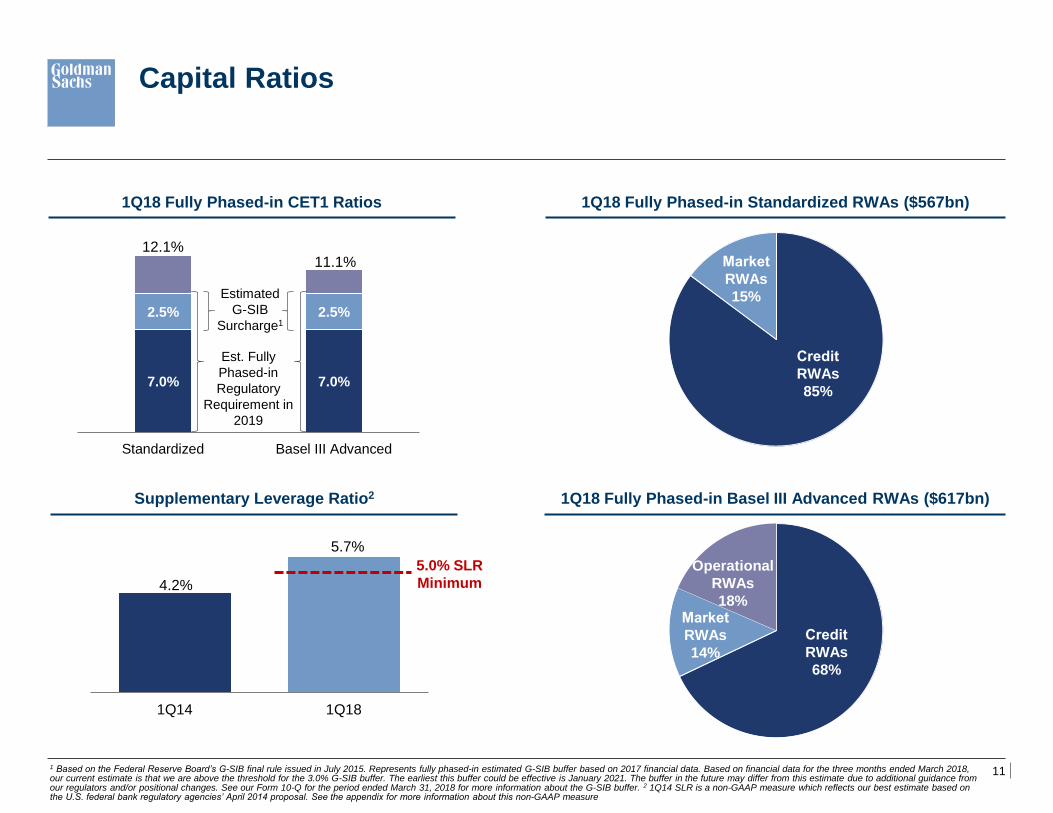
7.0% 7.0%
2.5% 2.5%
12.1% 11.1%
Standardized Basel III Advanced
Estimated
G-SIB
Surcharge1
Supplementary Leverage Ratio2
1 Based on the Federal Reserve Board’s G-SIB final rule issued in July 2015. Represents fully phased-in estimated G-SIB buffer based on 2017 financial data. Based on financial data for the three months ended March 2018, our current estimate is that we are above the threshold for the 3.0% G-SIB buffer. The earliest this buffer could be effective is January 2021. The buffer in the future may differ from this estimate due to additional guidance from our regulators and/or positional changes. See our Form 10-Q for the period ended March 31, 2018 for more information about the G-SIB buffer. 2 1Q14 SLR is a non-GAAP measure which reflects our best estimate based on the U.S. federal bank regulatory agencies’ April 2014 proposal. See the appendix for more information about this non-GAAP measure
1Q18 Fully Phased-in CET1 Ratios 1Q18 Fully Phased-in Standardized RWAs ($567bn)
1Q18 Fully Phased-in Basel III Advanced RWAs ($617bn)
Est. Fully
Phased-in
Regulatory
Requirement in
2019
Capital Ratios
4.2%
5.7%
1Q14 1Q18
Credit
RWAs
85%
Market
RWAs
15%
Credit
RWAs
68%
Market
RWAs
14%
Operational
RWAs
18%
5.0% SLR
Minimum
12
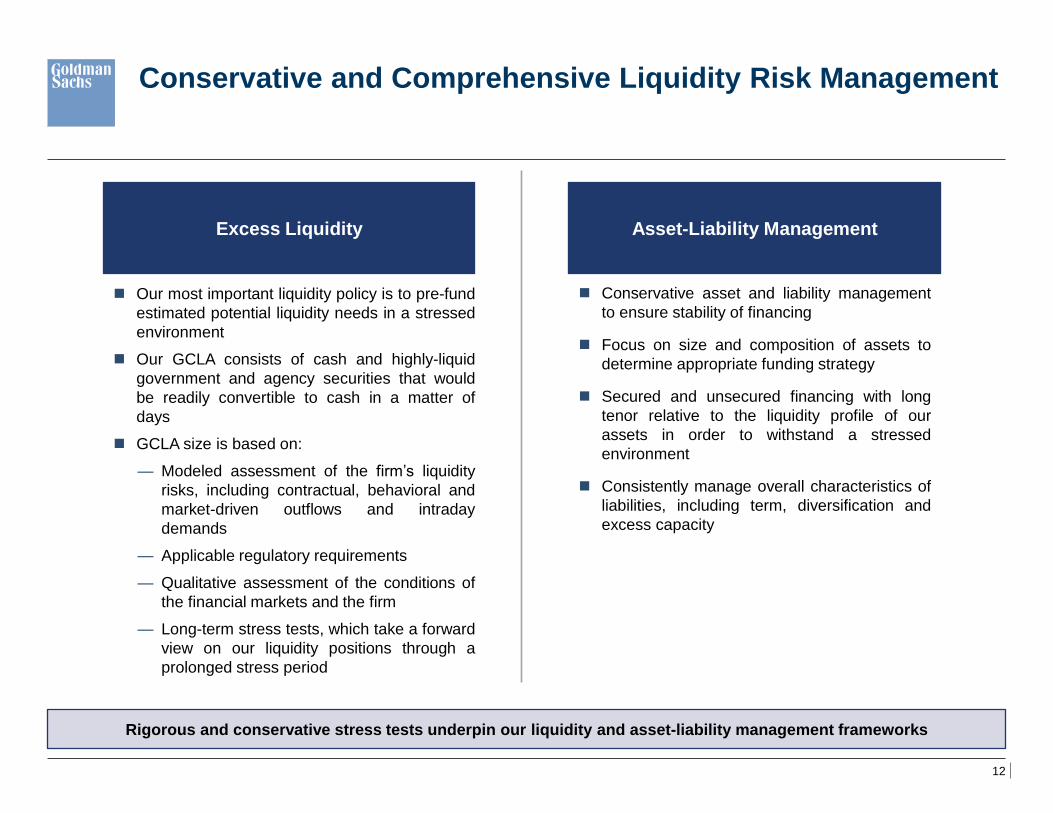
Conservative and Comprehensive Liquidity Risk Management
Excess Liquidity Asset-Liability Management
Our most important liquidity policy is to pre-fund
estimated potential liquidity needs in a stressed
environment
Our GCLA consists of cash and highly-liquid
government and agency securities that would
be readily convertible to cash in a matter of
days
GCLA size is based on:
— Modeled assessment of the firm’s liquidity
risks, including contractual, behavioral and
market-driven outflows and intraday
demands
— Applicable regulatory requirements
— Qualitative assessment of the conditions of
the financial markets and the firm
— Long-term stress tests, which take a forward
view on our liquidity positions through a
prolonged stress period
Conservative asset and liability management
to ensure stability of financing
Focus on size and composition of assets to
determine appropriate funding strategy
Secured and unsecured financing with long
tenor relative to the liquidity profile of our
assets in order to withstand a stressed
environment
Consistently manage overall characteristics of
liabilities, including term, diversification and
excess capacity
Rigorous and conservative stress tests underpin our liquidity and asset-liability management frameworks
13
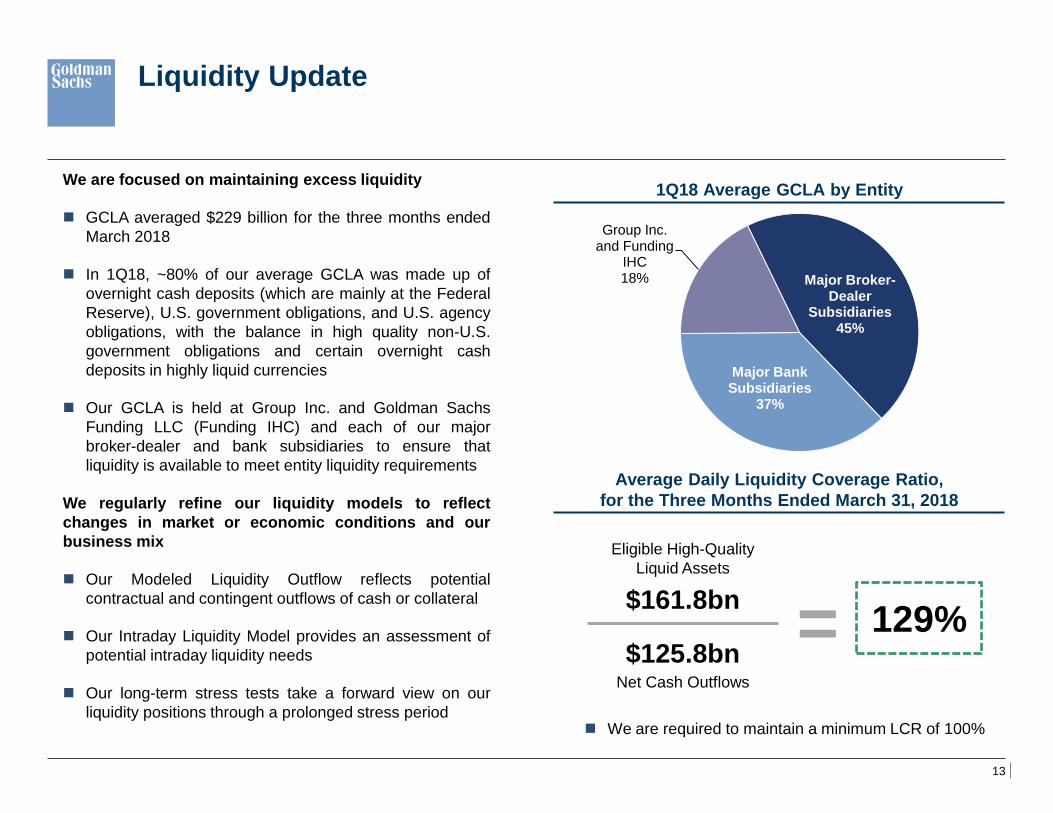
We are focused on maintaining excess liquidity
GCLA averaged $229 billion for the three months ended
March 2018
In 1Q18, ~80% of our average GCLA was made up of
overnight cash deposits (which are mainly at the Federal
Reserve), U.S. government obligations, and U.S. agency
obligations, with the balance in high quality non-U.S.
government obligations and certain overnight cash
deposits in highly liquid currencies
Our GCLA is held at Group Inc. and Goldman Sachs
Funding LLC (Funding IHC) and each of our major
broker-dealer and bank subsidiaries to ensure that
liquidity is available to meet entity liquidity requirements
We regularly refine our liquidity models to reflect
changes in market or economic conditions and our
business mix
Our Modeled Liquidity Outflow reflects potential
contractual and contingent outflows of cash or collateral
Our Intraday Liquidity Model provides an assessment of
potential intraday liquidity needs
Our long-term stress tests take a forward view on our
liquidity positions through a prolonged stress period
1Q18 Average GCLA by Entity
Liquidity Update
Average Daily Liquidity Coverage Ratio,
for the Three Months Ended March 31, 2018
Eligible High-Quality
Liquid Assets
Net Cash Outflows
$161.8bn
$125.8bn 129% =
We are required to maintain a minimum LCR of 100%
Major Broker-Dealer
Subsidiaries 45%
Major Bank Subsidiaries
37%
Group Inc. and Funding
IHC 18%
14
Asset-Liability Management
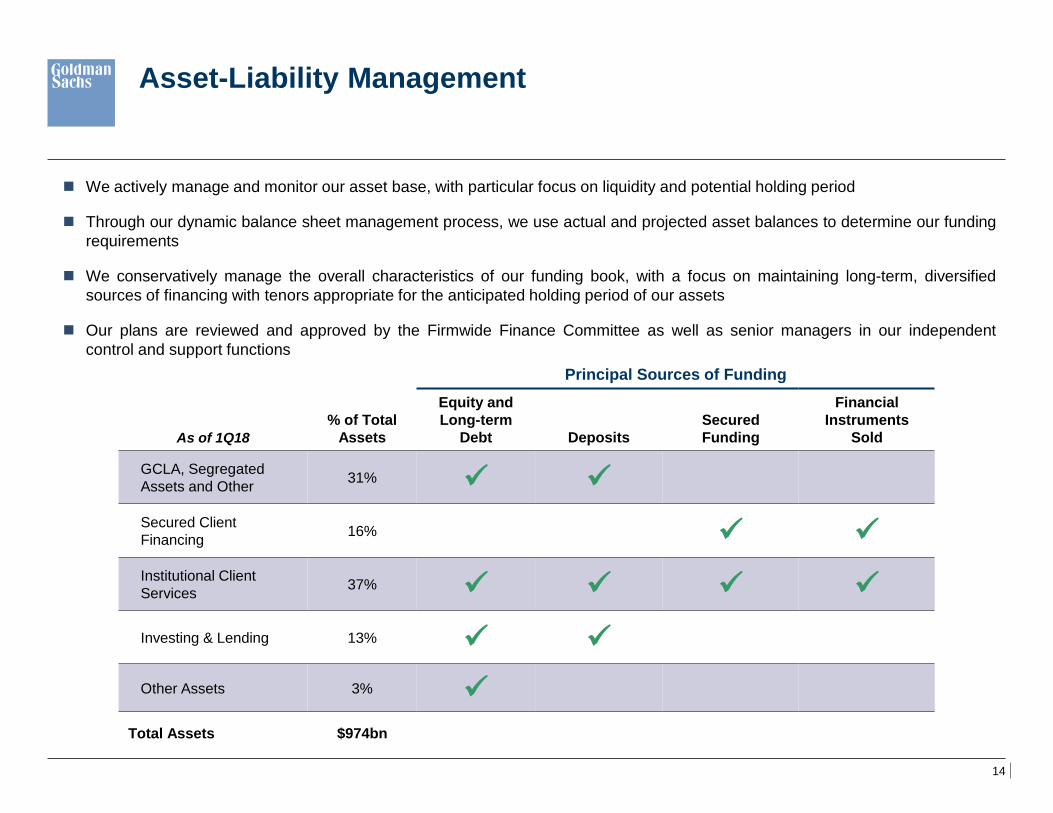
We actively manage and monitor our asset base, with particular focus on liquidity and potential holding period
Through our dynamic balance sheet management process, we use actual and projected asset balances to determine our funding
requirements
We conservatively manage the overall characteristics of our funding book, with a focus on maintaining long-term, diversified
sources of financing with tenors appropriate for the anticipated holding period of our assets
Our plans are reviewed and approved by the Firmwide Finance Committee as well as senior managers in our independent
control and support functions
Principal Sources of Funding
As of 1Q18
% of Total
Assets
Equity and
Long-term
Debt Deposits
Secured
Funding
Financial
Instruments
Sold
GCLA, Segregated
Assets and Other 31%
Secured Client
Financing 16%
Institutional Client
Services 37%
Investing & Lending 13%
Other Assets 3%
Total Assets $974bn
15
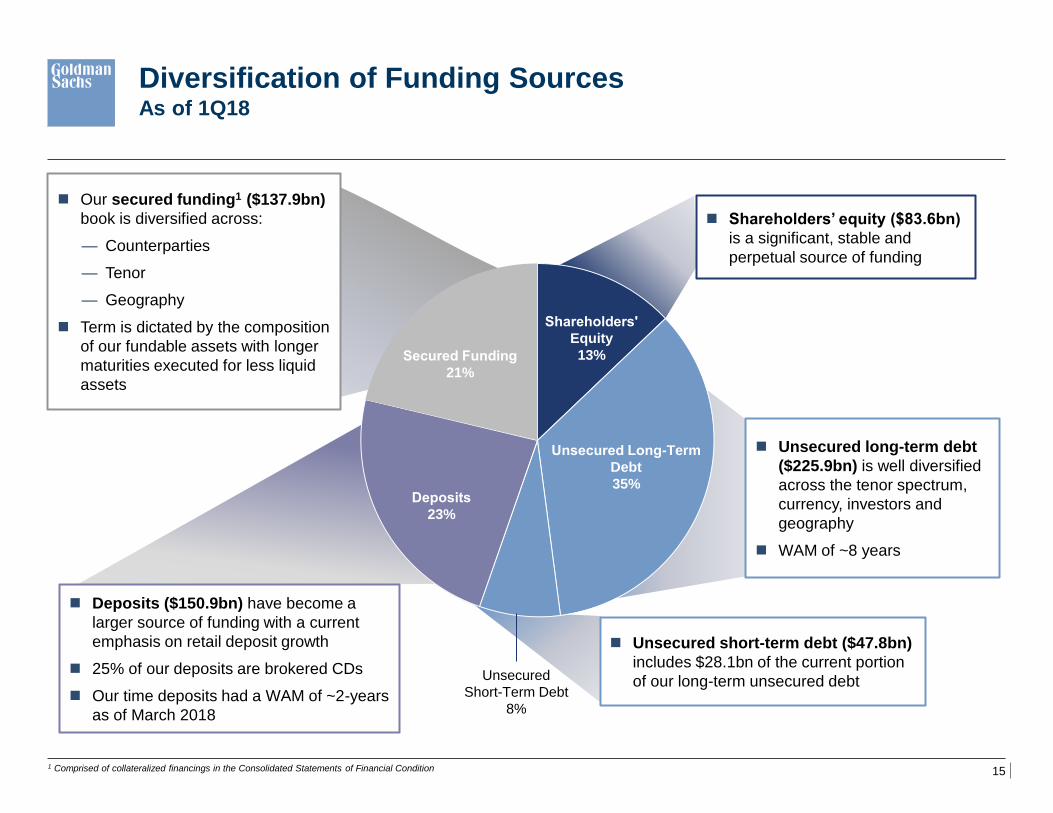
Shareholders’ equity ($83.6bn)
is a significant, stable and
perpetual source of funding
Unsecured long-term debt
($225.9bn) is well diversified
across the tenor spectrum,
currency, investors and
geography
WAM of ~8 years
Diversification of Funding Sources As of 1Q18
Deposits ($150.9bn) have become a
larger source of funding with a current
emphasis on retail deposit growth
25% of our deposits are brokered CDs
Our time deposits had a WAM of ~2-years
as of March 2018
Our secured funding1 ($137.9bn)
book is diversified across:
— Counterparties
— Tenor
— Geography
Term is dictated by the composition
of our fundable assets with longer
maturities executed for less liquid
assets
1 Comprised of collateralized financings in the Consolidated Statements of Financial Condition
Unsecured short-term debt ($47.8bn)
includes $28.1bn of the current portion
of our long-term unsecured debt Unsecured
Short-Term Debt
8%
1
Shareholders'
Equity
13%
Unsecured Long-Term
Debt
35% Deposits
23%
Secured Funding
21%
16
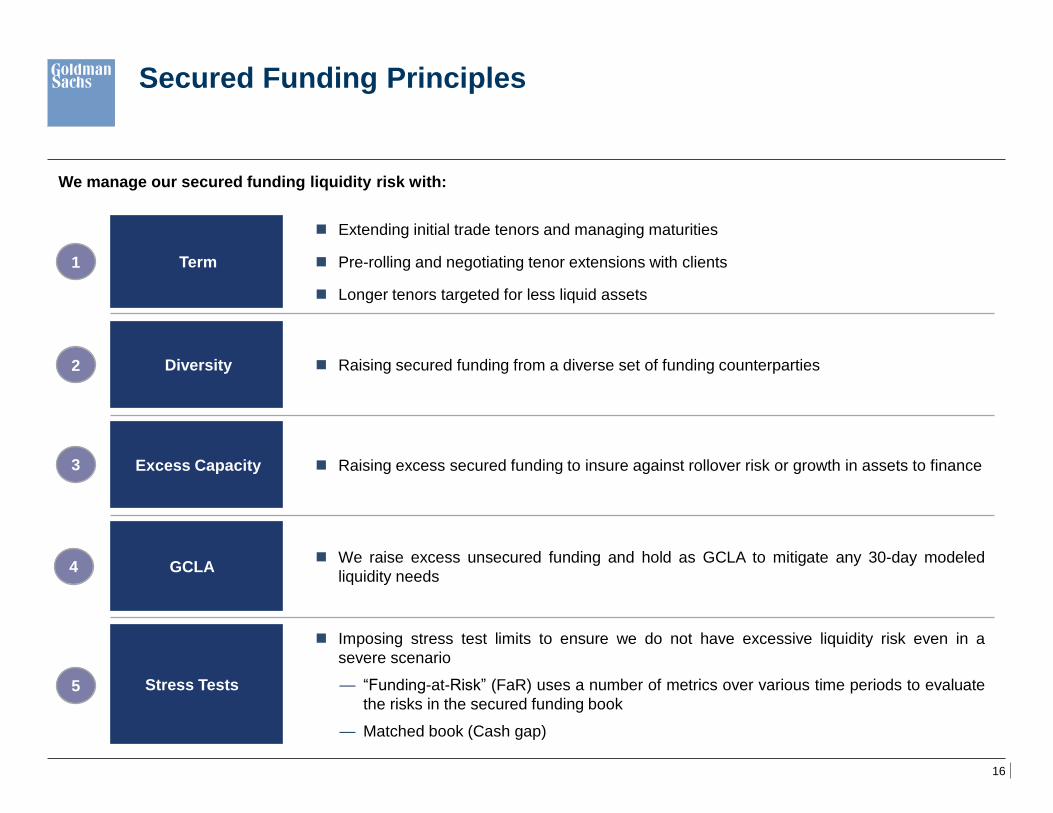
Secured Funding Principles
We manage our secured funding liquidity risk with:
1
2
3
4
5
Term
Extending initial trade tenors and managing maturities
Pre-rolling and negotiating tenor extensions with clients
Longer tenors targeted for less liquid assets
Diversity Raising secured funding from a diverse set of funding counterparties
Excess Capacity Raising excess secured funding to insure against rollover risk or growth in assets to finance
GCLA We raise excess unsecured funding and hold as GCLA to mitigate any 30-day modeled
liquidity needs
Stress Tests
Imposing stress test limits to ensure we do not have excessive liquidity risk even in a
severe scenario
— “Funding-at-Risk” (FaR) uses a number of metrics over various time periods to evaluate
the risks in the secured funding book
— Matched book (Cash gap)
17
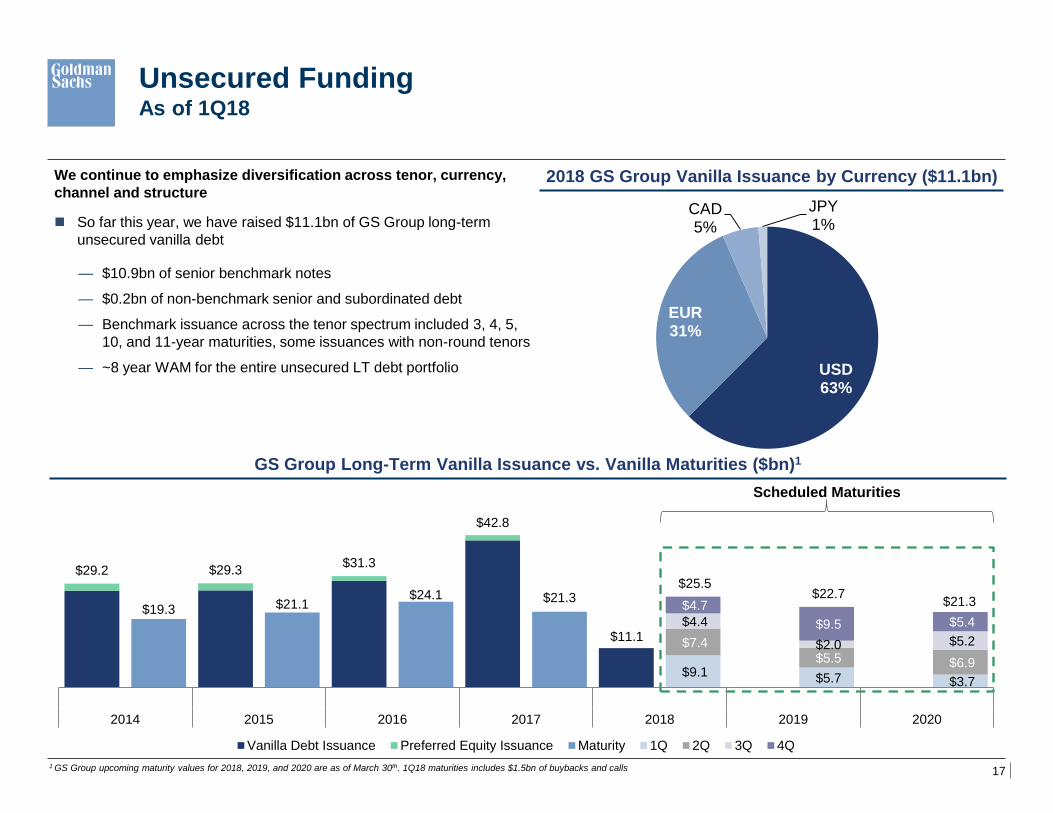
GS Group Long-Term Vanilla Issuance vs. Vanilla Maturities ($bn)1
Scheduled Maturities
1 GS Group upcoming maturity values for 2018, 2019, and 2020 are as of March 30th. 1Q18 maturities includes $1.5bn of buybacks and calls
We continue to emphasize diversification across tenor, currency,
channel and structure
So far this year, we have raised $11.1bn of GS Group long-term
unsecured vanilla debt
— $10.9bn of senior benchmark notes
— $0.2bn of non-benchmark senior and subordinated debt
— Benchmark issuance across the tenor spectrum included 3, 4, 5,
10, and 11-year maturities, some issuances with non-round tenors
— ~8 year WAM for the entire unsecured LT debt portfolio
2018 GS Group Vanilla Issuance by Currency ($11.1bn)
Unsecured Funding As of 1Q18
USD 63%
EUR 31%
CAD 5%
JPY 1%
$19.3 $21.1$24.1 $21.3
$29.2 $29.3$31.3
$42.8
$11.1
$9.1 $5.7 $3.7
$7.4 $5.5 $6.9
$4.4
$2.0 $5.2
$4.7
$9.5 $5.4
$25.5 $22.7
$21.3
2014 2015 2016 2017 2018 2019 2020
Vanilla Debt Issuance Preferred Equity Issuance Maturity 1Q 2Q 3Q 4Q
18
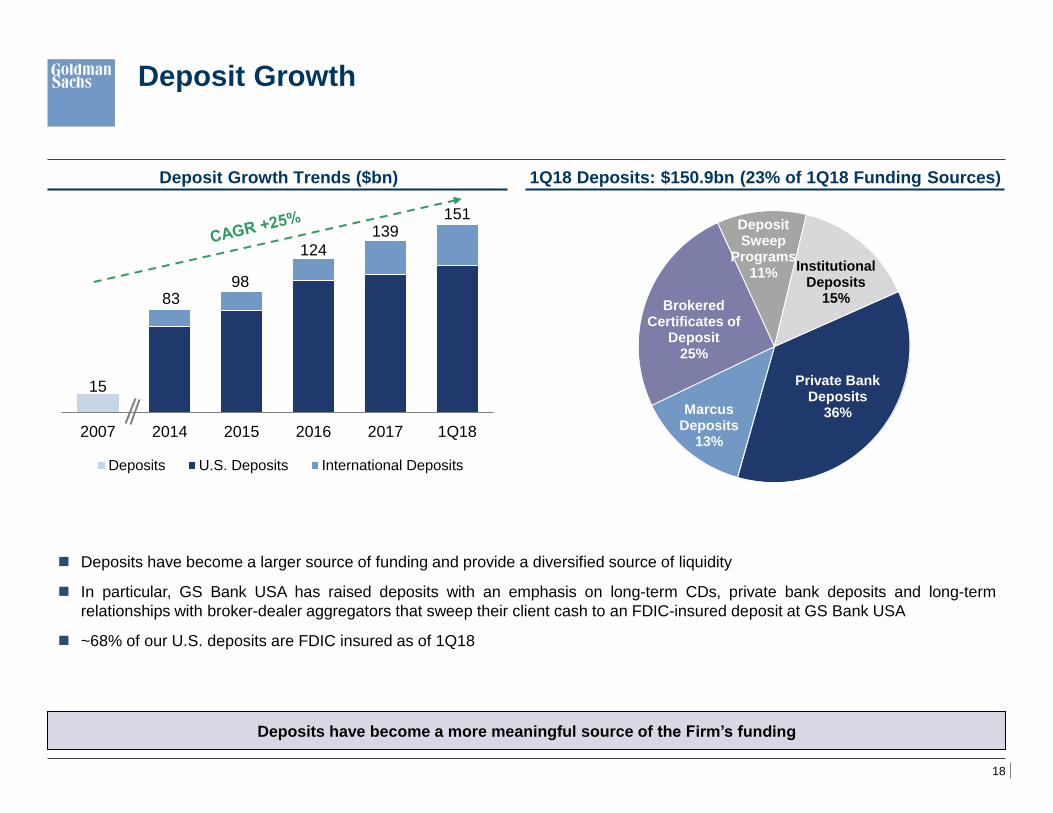
1Q18 Deposits: $150.9bn (23% of 1Q18 Funding Sources) Deposit Growth Trends ($bn)
Deposit Growth
Deposits have become a more meaningful source of the Firm’s funding
Deposits have become a larger source of funding and provide a diversified source of liquidity
In particular, GS Bank USA has raised deposits with an emphasis on long-term CDs, private bank deposits and long-term
relationships with broker-dealer aggregators that sweep their client cash to an FDIC-insured deposit at GS Bank USA
~68% of our U.S. deposits are FDIC insured as of 1Q18
15
83 98
124
139 151
2007 2014 2015 2016 2017 1Q18
Deposits U.S. Deposits International Deposits
Private Bank Deposits
36% Marcus Deposits
13%
Brokered Certificates of
Deposit 25%
Deposit Sweep
Programs 11%
Institutional Deposits
15%
19
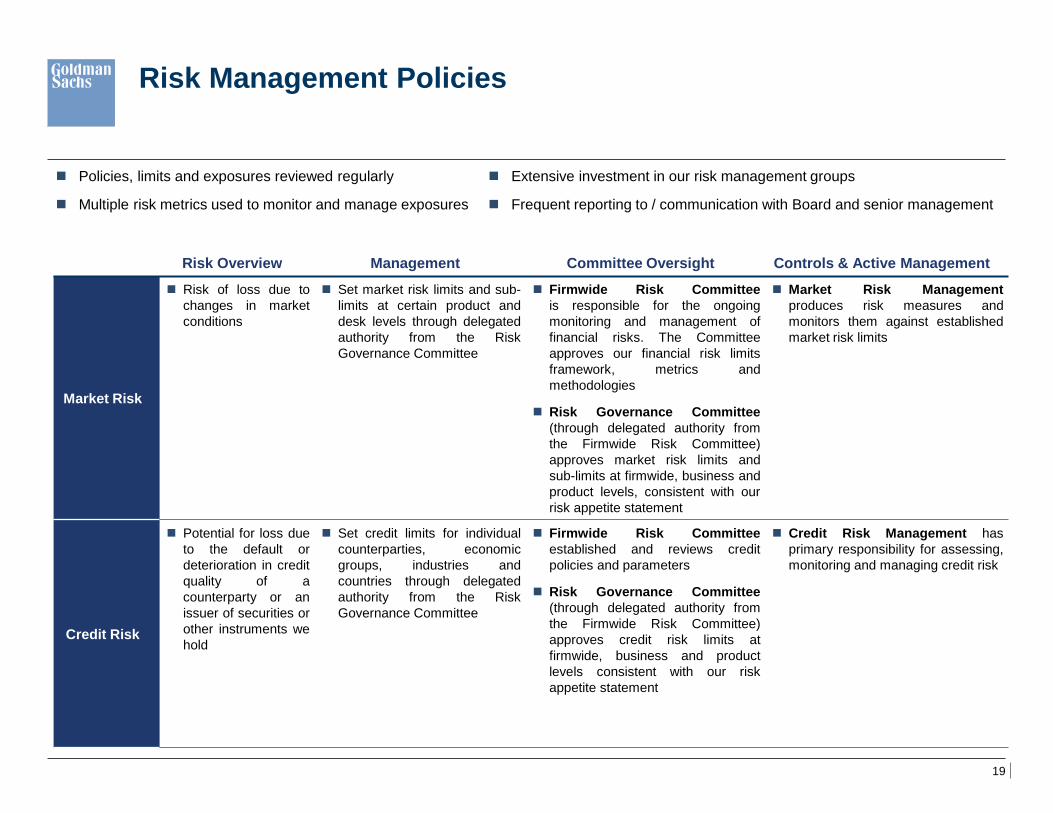
Risk Management Policies
Policies, limits and exposures reviewed regularly
Multiple risk metrics used to monitor and manage exposures
Extensive investment in our risk management groups
Frequent reporting to / communication with Board and senior management
Risk Overview Management Committee Oversight Controls & Active Management
Market Risk
Risk of loss due to
changes in market
conditions
Set market risk limits and sub-
limits at certain product and
desk levels through delegated
authority from the Risk
Governance Committee
Firmwide Risk Committee
is responsible for the ongoing
monitoring and management of
financial risks. The Committee
approves our financial risk limits
framework, metrics and
methodologies
Risk Governance Committee
(through delegated authority from
the Firmwide Risk Committee)
approves market risk limits and
sub-limits at firmwide, business and
product levels, consistent with our
risk appetite statement
Market Risk Management
produces risk measures and
monitors them against established
market risk limits
Credit Risk
Potential for loss due
to the default or
deterioration in credit
quality of a
counterparty or an
issuer of securities or
other instruments we
hold
Set credit limits for individual
counterparties, economic
groups, industries and
countries through delegated
authority from the Risk
Governance Committee
Firmwide Risk Committee
established and reviews credit
policies and parameters
Risk Governance Committee
(through delegated authority from
the Firmwide Risk Committee)
approves credit risk limits at
firmwide, business and product
levels consistent with our risk
appetite statement
Credit Risk Management has
primary responsibility for assessing,
monitoring and managing credit risk
20
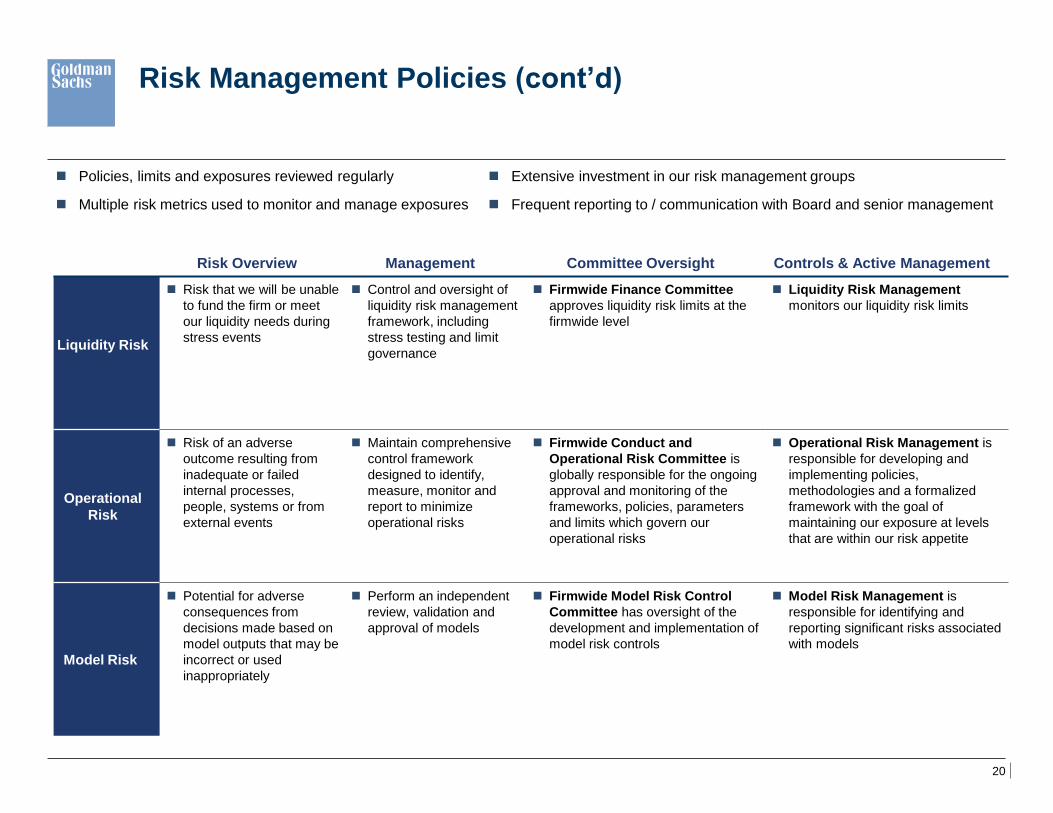
Risk Management Policies (cont’d)
Risk Overview Management Committee Oversight Controls & Active Management
Liquidity Risk
Risk that we will be unable
to fund the firm or meet
our liquidity needs during
stress events
Control and oversight of
liquidity risk management
framework, including
stress testing and limit
governance
Firmwide Finance Committee
approves liquidity risk limits at the
firmwide level
Liquidity Risk Management
monitors our liquidity risk limits
Operational
Risk
Risk of an adverse
outcome resulting from
inadequate or failed
internal processes,
people, systems or from
external events
Maintain comprehensive
control framework
designed to identify,
measure, monitor and
report to minimize
operational risks
Firmwide Conduct and
Operational Risk Committee is
globally responsible for the ongoing
approval and monitoring of the
frameworks, policies, parameters
and limits which govern our
operational risks
Operational Risk Management is
responsible for developing and
implementing policies,
methodologies and a formalized
framework with the goal of
maintaining our exposure at levels
that are within our risk appetite
Model Risk
Potential for adverse
consequences from
decisions made based on
model outputs that may be
incorrect or used
inappropriately
Perform an independent
review, validation and
approval of models
Firmwide Model Risk Control
Committee has oversight of the
development and implementation of
model risk controls
Model Risk Management is
responsible for identifying and
reporting significant risks associated
with models
Policies, limits and exposures reviewed regularly
Multiple risk metrics used to monitor and manage exposures
Extensive investment in our risk management groups
Frequent reporting to / communication with Board and senior management
21
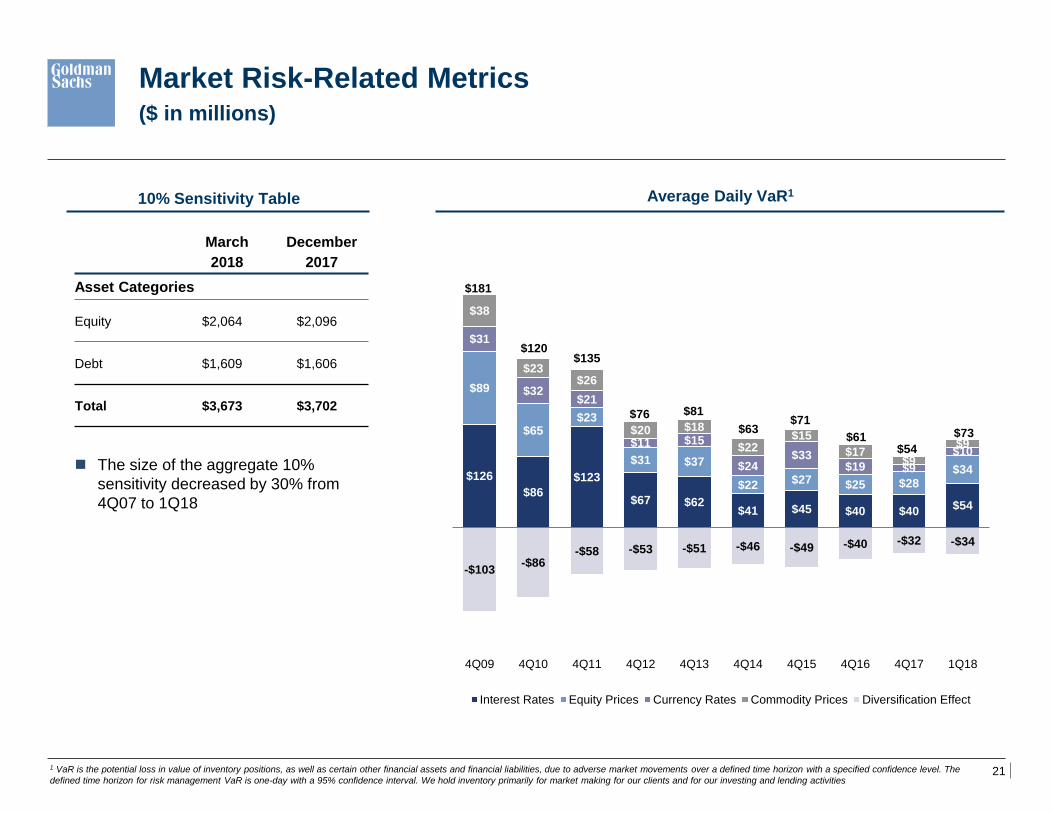
Market Risk-Related Metrics ($ in millions)
10% Sensitivity Table Average Daily VaR1
March
2018
December
2017
Asset Categories
Equity $2,064 $2,096
Debt $1,609 $1,606
Total $3,673 $3,702
The size of the aggregate 10%
sensitivity decreased by 30% from
4Q07 to 1Q18
1 VaR is the potential loss in value of inventory positions, as well as certain other financial assets and financial liabilities, due to adverse market movements over a defined time horizon with a specified confidence level. The
defined time horizon for risk management VaR is one-day with a 95% confidence interval. We hold inventory primarily for market making for our clients and for our investing and lending activities
$126
$86
$123
$67 $62 $41 $45 $40 $40
$54
$89
$65 $23
$31 $37
$22 $27 $25 $28 $34
$31
$32 $21
$11 $15
$24 $33
$19 $9
$10
$38
$23 $26
$20 $18
$22 $15
$17 $9
$9
-$103 -$86
-$58 -$53 -$51 -$46 -$49 -$40 -$32 -$34
4Q09 4Q10 4Q11 4Q12 4Q13 4Q14 4Q15 4Q16 4Q17 1Q18
Interest Rates Equity Prices Currency Rates Commodity Prices Diversification Effect
$181
$120 $135
$76 $81
$63 $71
$61 $54
$73
22
As of 1Q14, the supplementary leverage ratio was a non-GAAP measure as it was not a required regulatory disclosure at that time.
We believe that this ratio is meaningful because it is a measure that we, our regulators and investors use to assess our ability to
meet future regulatory capital requirements. This ratio was based on our interpretation, expectations and understanding of the
revised risk-based capital and leverage regulations of the Federal Reserve Board, subject to certain transition provisions. For a
further discussion of the methodology used to calculate the firm’s regulatory ratios, see Note 20 to the condensed consolidated
financial statements in Part I, Item 1 “Financial Statements (Unaudited)” and “Equity Capital Management and Regulatory Capital”
in Part I, Item 2 “Management’s Discussion and Analysis of Financial Condition and Results of Operations” in the firm’s Quarterly
Report on Form 10-Q for the period ended March 31, 2018.
Appendix Non-GAAP Measures
23
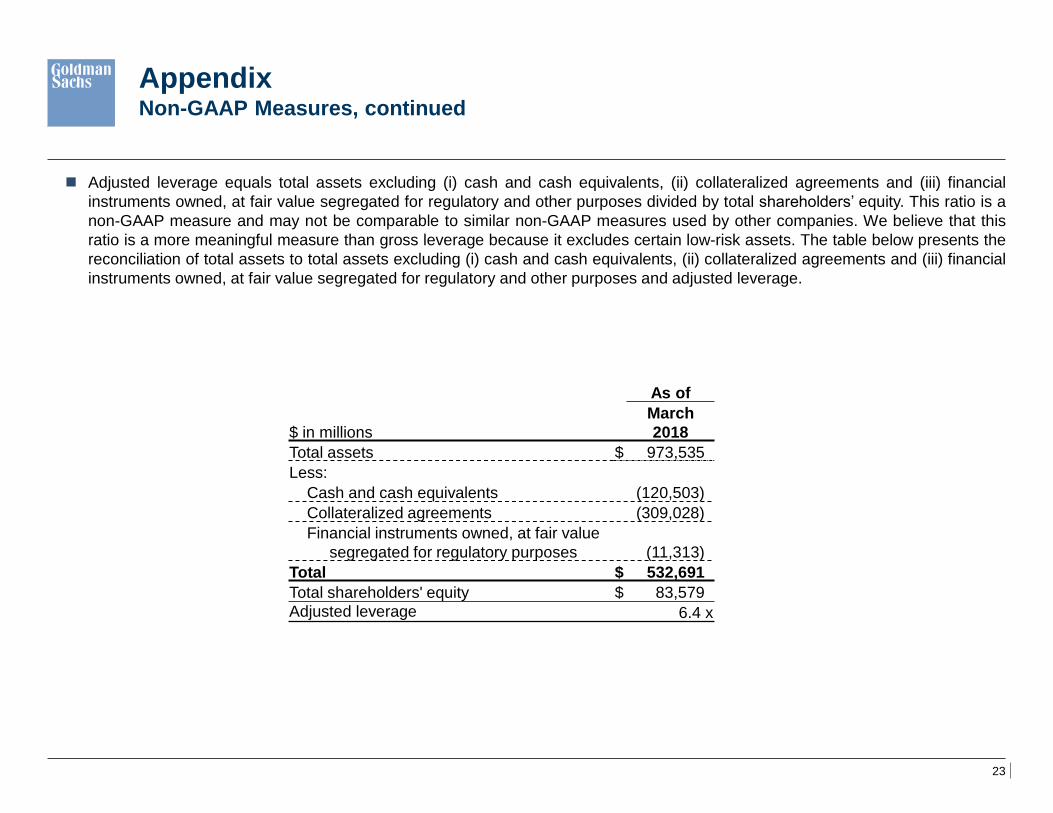
Appendix Non-GAAP Measures, continued
Adjusted leverage equals total assets excluding (i) cash and cash equivalents, (ii) collateralized agreements and (iii) financial
instruments owned, at fair value segregated for regulatory and other purposes divided by total shareholders’ equity. This ratio is a
non-GAAP measure and may not be comparable to similar non-GAAP measures used by other companies. We believe that this
ratio is a more meaningful measure than gross leverage because it excludes certain low-risk assets. The table below presents the
reconciliation of total assets to total assets excluding (i) cash and cash equivalents, (ii) collateralized agreements and (iii) financial
instruments owned, at fair value segregated for regulatory and other purposes and adjusted leverage.
As of
$ in millions
March
2018
Total assets $ 973,535
Less:
Cash and cash equivalents (120,503)
Collateralized agreements (309,028)
Financial instruments owned, at fair value
segregated for regulatory purposes (11,313)
Total $ 532,691
Total shareholders' equity $ 83,579
Adjusted leverage 6.4 x
24
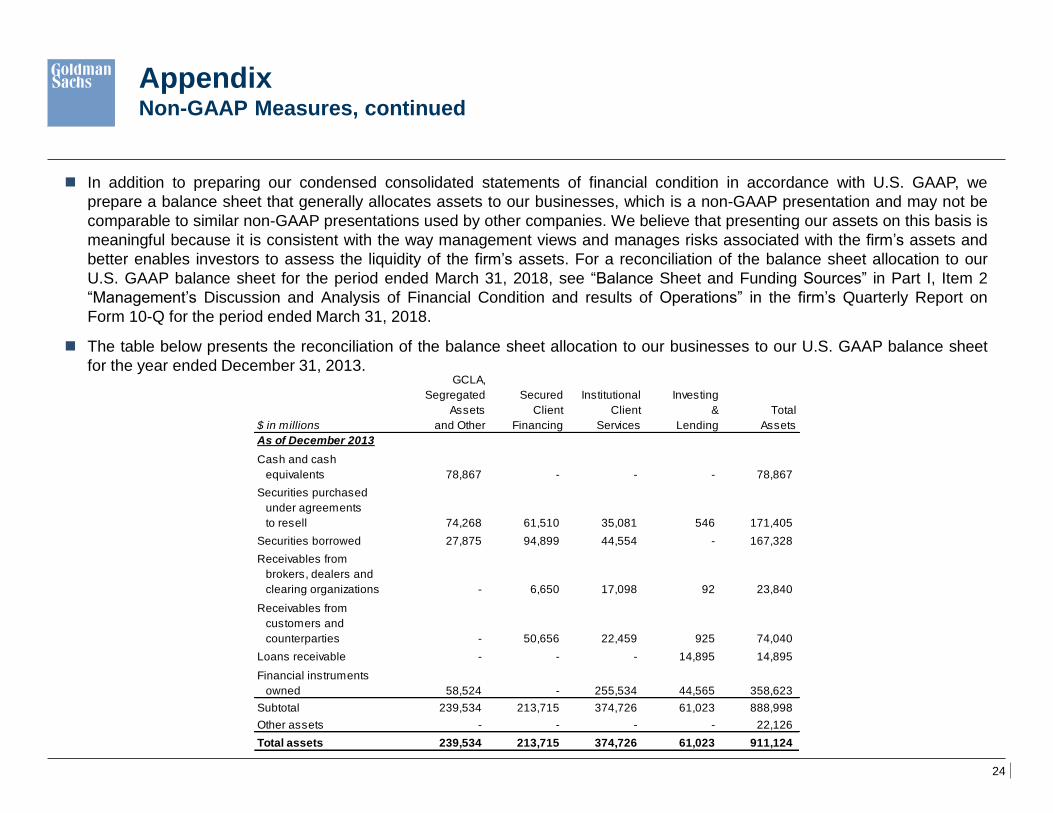
GCLA,
Segregated Secured Institutional Investing
Assets Client Client & Total
$ in millions and Other Financing Services Lending Assets
As of December 2013
Cash and cash
equivalents 78,867 - - - 78,867
Securities purchased
under agreements
to resell 74,268 61,510 35,081 546 171,405
Securities borrowed 27,875 94,899 44,554 - 167,328
Receivables from
brokers, dealers and
clearing organizations - 6,650 17,098 92 23,840
Receivables from
customers and
counterparties - 50,656 22,459 925 74,040
Loans receivable - - - 14,895 14,895
Financial instruments
owned 58,524 - 255,534 44,565 358,623
Subtotal 239,534 213,715 374,726 61,023 888,998
Other assets - - - - 22,126
Total assets 239,534 213,715 374,726 61,023 911,124
In addition to preparing our condensed consolidated statements of financial condition in accordance with U.S. GAAP, we
prepare a balance sheet that generally allocates assets to our businesses, which is a non-GAAP presentation and may not be
comparable to similar non-GAAP presentations used by other companies. We believe that presenting our assets on this basis is
meaningful because it is consistent with the way management views and manages risks associated with the firm’s assets and
better enables investors to assess the liquidity of the firm’s assets. For a reconciliation of the balance sheet allocation to our
U.S. GAAP balance sheet for the period ended March 31, 2018, see “Balance Sheet and Funding Sources” in Part I, Item 2
“Management’s Discussion and Analysis of Financial Condition and results of Operations” in the firm’s Quarterly Report on
Form 10-Q for the period ended March 31, 2018.
The table below presents the reconciliation of the balance sheet allocation to our businesses to our U.S. GAAP balance sheet
for the year ended December 31, 2013.
Appendix Non-GAAP Measures, continued