average monthly alcohol-related call- outs · average monthly alcohol-related call-outs year 10...
TRANSCRIPT

Average monthly
alcohol-related call-
outs
Year 10 pupils drinking
alcohol in the last 7 days
East Sussex Public Health
October 2016

2 East Sussex Public Health, 2016
Contents Executive Summary ................................................................................................................................. 3
Introduction ............................................................................................................................................ 5
Alcohol consumption – young people .................................................................................................... 6
Alcohol consumption - adults ................................................................................................................. 7
Why do people find alcohol attractive? .................................................................................................. 9
Understanding units and safe drinking limits ....................................................................................... 10
A&E attendances between 8pm and 4am due to assault..................................................................... 11
Alcohol-related ambulance call-outs .................................................................................................... 14
Alcohol-related hospital admissions ..................................................................................................... 18
Dependent drinkers .............................................................................................................................. 24
Alcohol-related deaths .......................................................................................................................... 26
Alcohol and inequality in life expectancy ............................................................................................. 27
Alcohol-related road traffic accidents .................................................................................................. 30
Claimants of benefits due to alcoholism .............................................................................................. 31
Key findings ........................................................................................................................................... 32
What does this mean for local action? ................................................................................................. 34
Appendix I – alcohol-related admissions and alcohol-specific deaths definition ................................. 36
Appendix II – alcohol-related deaths definition ................................................................................... 39
Appendix III – alcohol harm and influencing factors ............................................................................ 40
Clare Brown Public Health Information Specialist

3 East Sussex Public Health, 2016
Executive Summary
This report provides an update to the report Alcohol related health harm in East
Sussex, February 2015.
The key findings from this year’s report are as follows:
Consumption
Young people (15 year olds) in East Sussex have significantly higher alcohol
consumption compared to the England average. Year 10 pupils reporting that
they had had a drink in the last 7 days was highest in Wealden and Hastings.
Over a third of adults drink alcohol every week. Notable differences between
males and females – more males drink alcohol, more regularly and at higher
risk – 1 in 3 males compared to 1 in 10 females who drink are drinking at
higher risk.
Reasons for drinking
The reasons local people give on why they find alcohol attractive include: low
mood/depression; boredom; coping mechanism; peer pressure; availability
and affordability and boosts confidence.
Levels of understanding of safe drinking
There is confusion around safe drinking limits with both adults and young
people not understanding how to measure the units they are consuming.
Although limited, there is some awareness of health risks but this is not a
deterrent, with young people in particular feeling confident that health
problems won’t happen to them.
Alcohol-related harm
Alcohol-related health harms (admissions and deaths) are significantly worse
than England in Hastings. Eastbourne generally has similar levels of alcohol-
related health harm to England, with Lewes, Rother and Wealden either
similar too or significantly better compared to the national average. Alcohol
health harm is higher for males.
Impact on health services
A&E attendances during the night-time economy due to assaults are higher
for males and for 15-24 year olds. Attendance rates are significantly higher

4 East Sussex Public Health, 2016
than the county average in Eastbourne and Hastings. There are higher rates
for persons from more deprived areas.
Alcohol-related ambulance call-outs have seen a 17% increase in 2015/16
compared to 2014/15. Half are between 8pm and 4am with a further 1 in 5
between 4pm and 8pm. Numbers are highest in Eastbourne and Hastings
town centres and in the month of August.
Inequality in life expectancy
Deaths from alcohol contribute to the gap in life expectancy between the
most and least deprived areas within districts and boroughs. In East Sussex
the largest impact is on males living in the most deprived parts of Hastings.

5 East Sussex Public Health, 2016
Introduction
The overarching aim of the East Sussex Alcohol Strategy 2014-2019 is to make East
Sussex a safer and healthier place; it has 3 priority areas:
1. Develop individual and collective knowledge, skills and awareness towards
alcohol
2. Provide early help, intervention and support for people affected by harmful
drinking
3. Create better and safer socialising
This report focuses on the health aspects of alcohol and pulls together information
on alcohol-related behaviours and health outcomes in East Sussex. It provides an
update to Alcohol related health harm in East Sussex, February 2015. Updates
include: alcohol consumption in East Sussex, A&E attendances due to assaults,
alcohol suspected ambulance call-outs, alcohol-related hospital admissions and
deaths from alcohol. Where there is no new data, it has been stated within the
report and information from the previous report has been presented.
The report draws on local and nationally produced data from lifestyle surveys, the
‘East Sussex Drink Debate’, ambulance call-outs, A&E attendances, hospital inpatient
admissions and mortality data. Due to the complexity of the issues and limitations of
data (despite using a range of data sources) it cannot capture the full extent of the
burden that alcohol places on health in East Sussex, but only that which can be
measured. Within each section the relevant key objective or outcome from the
alcohol strategy has been highlighted.

6 East Sussex Public Health, 2016
Alcohol consumption – young people Key strategy outcome: reduce number of young people & adults drinking above safe limits (priority 1)
70% of 15-year olds in East Sussex have ever had an alcoholic drink. This is
significantly higher than the England average of 62%
8% of 15-year olds in East Sussex report drinking regularly,
significantly higher than the England average of 6%
1 in 5 15-year olds in East Sussex have been drunk in the last 4 weeks,
significantly higher than 1 in 7 for England.
Year 10 pupils reporting they had had an alcoholic drink in the last 7 days ranges
from 28% in Eastbourne to 39% in Hastings and Wealden (Figure 1).
Figure 1
Data source: What about
YOUth? survey, 2014/15.
Public Health England.
Data source: The Schools Health
Education Unit. Young People in
East Sussex Schools: A report on
the health behaviour of young
people aged 14-15 in 2012
(85% of Year 10 pupils
participated).

7 East Sussex Public Health, 2016
Alcohol consumption - adults Key strategy outcome: reduce number of young people & adults drinking above safe limits (priority 1)
Based on the Local Alcohol Consumption Survey, for East Sussex adults:
20% never drink alcohol
35% drink alcohol every week
There are clear differences in the frequency of drinking between males and females
with a higher proportion of males drinking alcohol and drinking it more regularly.
Figure 2
Almost 1 in 4 (23%) males are drinking 4 or more times a week compared to
fewer than 1 in 10 (8%) females. These are higher proportions compared to the
survey averages (17% and 7% respectively).
The Local Alcohol Consumption Survey sampled adults in 25 local authorities. East Sussex data is based on 346 postal
survey responses and 305 face-to-face interviews during 29th Feb – 25th April 2016. Analyses are based on data weighted
by gender, age and ethnicity.
Data source: Local Alcohol
Consumption Survey
undertaken by Ipsos-MORI
on behalf of Public Health
England, 2016

8 East Sussex Public Health, 2016
For East Sussex males who drink,
32% are doing so at higher risk
compared to 10% for females
Of those who report consuming alcohol, 1 in 5 are
doing so at higher risk.
Figure 3
more than half the time people are doing so at home
Data source: AUDIT (Alcohol
Use Disorders Identification
Test) score from Local
Alcohol Consumption Survey,
2016
Low risk = Zone 1 from AUDIT (lower risk)
Higher risk = Zone 2, 3 & 4 from AUDIT (increasing risk, higher risk and possible dependent)
For further information about AUDIT http://www.talkingalcohol.com/files/pdfs/WHO_audit.pdf
Of adults who drink alcohol:

9 East Sussex Public Health, 2016
Why do people find alcohol attractive? *NO UPDATE*
Key strategy outcome: reduce number of young people & adults drinking above safe levels (priority 1)
The main reasons participants gave for drinking alcohol
Data source: East Sussex Drink Debate
Report 2013: Report on qualitative research,
Abacus Insight
East Sussex Safer Communities Partnership conducted the East Sussex Drink Debate for 6 weeks from April 2013. The
Debate asked people how alcohol features in the lives of individuals, families and communities. Responses were elicited online or in printed forms. Residents and stakeholders were engaged in an open discussion on a range of alcohol-related
issues through qualitative research with 136 participants in focus groups and telephone interviews.

10 East Sussex Public Health, 2016
Understanding units and safe drinking limits *NO UPDATE*
Key strategy objective: increase knowledge, understanding and awareness of healthy drinking limits (priority 1)
Local research shows that although a few adults were able to cite recommended safe limits, there is a widespread lack of understanding for both adults and young people about how people measure the units they are consuming.
Data source: East Sussex Drink Debate
Report 2013: Report on
qualitative research, Abacus Insight
“You get different quantities and strengths of drink when home and out. It’s impossible to keep count of units” (Adult)
“I don’t even think about them” (Young person)
“People don’t know what a unit is. We’re working with clients to explain the recommended guidelines and we are working with the police who pick up people who are drunk and disorderly. We try to educate.” (Frontline worker)
Although limited, there was some awareness of health risks and young people in
particular were confident that health problems wouldn’t happen to them so
knowledge of some of the health consequences doesn’t deter them.
11 East Sussex Public Health, 2016
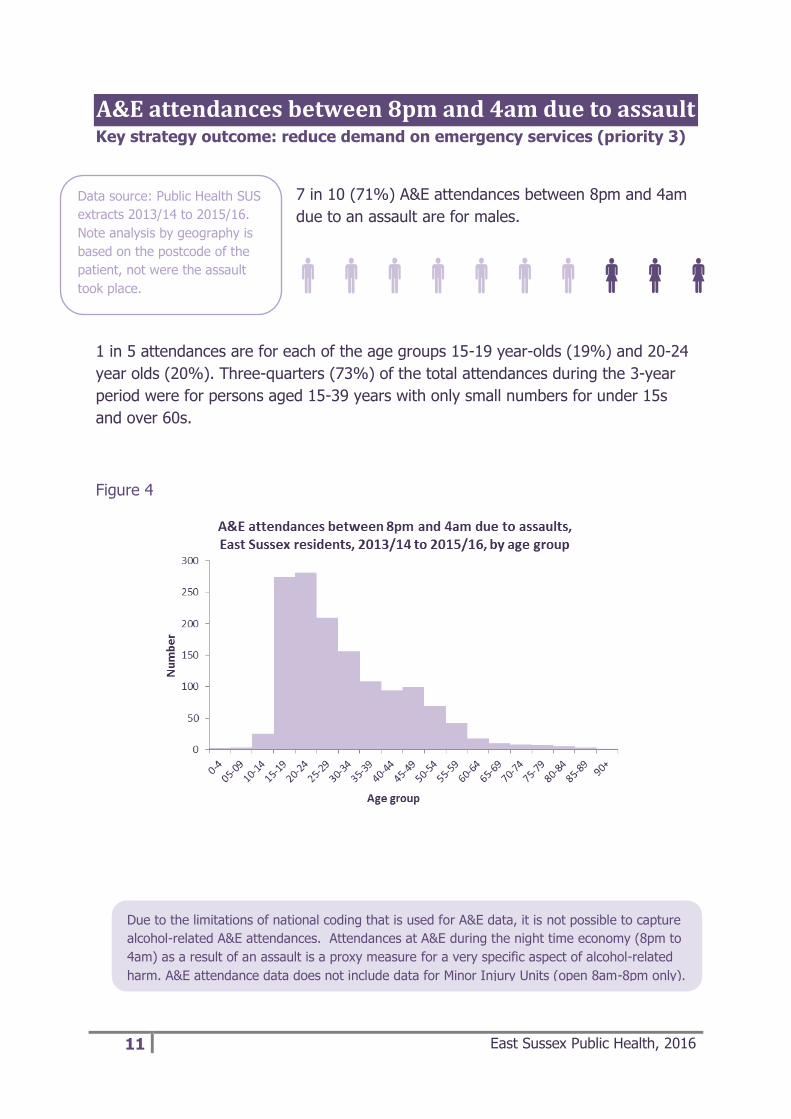
A&E attendances between 8pm and 4am due to assault Key strategy outcome: reduce demand on emergency services (priority 3)
7 in 10 (71%) A&E attendances between 8pm and 4am
due to an assault are for males.
1 in 5 attendances are for each of the age groups 15-19 year-olds (19%) and 20-24
year olds (20%). Three-quarters (73%) of the total attendances during the 3-year
period were for persons aged 15-39 years with only small numbers for under 15s
and over 60s. Figure 4
Data source: Public Health SUS
extracts 2013/14 to 2015/16.
Note analysis by geography is
based on the postcode of the
patient, not were the assault
took place.
Due to the limitations of national coding that is used for A&E data, it is not possible to capture
alcohol-related A&E attendances. Attendances at A&E during the night time economy (8pm to
4am) as a result of an assault is a proxy measure for a very specific aspect of alcohol-related
harm. A&E attendance data does not include data for Minor Injury Units (open 8am-8pm only).
12 East Sussex Public Health, 2016
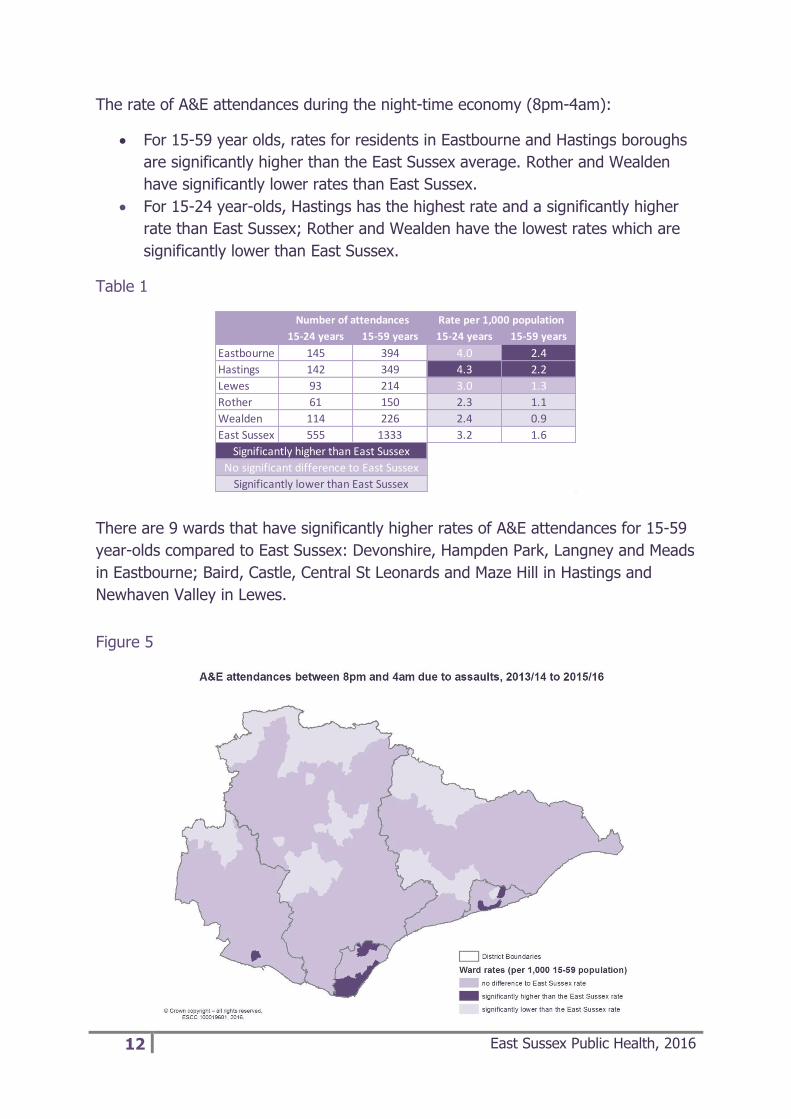
The rate of A&E attendances during the night-time economy (8pm-4am):
For 15-59 year olds, rates for residents in Eastbourne and Hastings boroughs
are significantly higher than the East Sussex average. Rother and Wealden
have significantly lower rates than East Sussex.
For 15-24 year-olds, Hastings has the highest rate and a significantly higher
rate than East Sussex; Rother and Wealden have the lowest rates which are
significantly lower than East Sussex.
Table 1
There are 9 wards that have significantly higher rates of A&E attendances for 15-59
year-olds compared to East Sussex: Devonshire, Hampden Park, Langney and Meads
in Eastbourne; Baird, Castle, Central St Leonards and Maze Hill in Hastings and
Newhaven Valley in Lewes. Figure 5
15-24 years 15-59 years 15-24 years 15-59 years
Eastbourne 145 394 4.0 2.4
Hastings 142 349 4.3 2.2
Lewes 93 214 3.0 1.3
Rother 61 150 2.3 1.1
Wealden 114 226 2.4 0.9
East Sussex 555 1333 3.2 1.6
Number of attendances Rate per 1,000 population
Significantly higher than East Sussex
No significant difference to East Sussex
Significantly lower than East Sussex

13 East Sussex Public Health, 2016
There is an association between A&E attendances for assault during the night-time
economy (NTE) and the deprivation profile of the area where patients live. Figure 6
shows that the least deprived wards have the lower rates and the most deprived
ward (Central St Leonards) has the highest rate in all of East Sussex.
Figure 6
The number of assault attendances during the NTE slightly decreased in 2014/15
from 2013/14 but increased in 2015/16 to the highest number during the 3-year
period with the highest increase in the 25-39 years age band.
Figure 7

14 East Sussex Public Health, 2016
Alcohol-related ambulance call-outs Key strategy outcome: reduce demand on emergency services (priority 3)
During 2014/15 there were 3,834 alcohol-
related ambulance call-outs and in 2015/16 this
increased to 4,485 (a 17% increase) (Figure 8).
In both years numbers were highest in August.
Figure 8
Half of the alcohol-related call-outs are during the night-time economy (20:00 –
04:00); a further 21% are between 16:00 and 20:00. There are more alcohol-related
call-outs during some hours not in the night-time economy (17:00, 18:00 and 19:00)
than in some that are (02:00 and 03:00). Of the night-time economy alcohol-related
call-outs around a quarter (26%) are on a Saturday night and a further fifth (21%)
on a Friday night. (Figure 9 and 10)
Data source: South East Coast
Ambulance 2014/15 and 2015/16.
Note call out data relates to incidents
that were attended to in East Sussex,
and therefore do not necessarily
relate to East Sussex residents.
Ambulance patient clinical records (PCR) contain an indicator for whether the crew on the scene suspect that alcohol
has been involved with the incident, and since March 2013 there is a crew condition code for an alcohol-related call-
out. There is an element of the crew on the scene making a judgement call as to the involvement of alcohol and as
the PCR relates to the patient, not the perpetrator in the case of an assault for example, it is very likely to under-
estimate call outs that are attributable to alcohol.

15 East Sussex Public Health, 2016
Figure 9
Figure 10
Table 2 shows the main reasons/problems for an alcohol-related call-out during the
two-year period 2014/15 and 2015/16. Around 1 in 10 call-outs were for each of:
mental health problems, trauma, unconscious/faint and falls<12ft.

16 East Sussex Public Health, 2016
Table 2
Figure 11 is a map showing the areas with the highest numbers of alcohol-related
ambulance call-outs during 2014/15 to 2015/16. Numbers are based on lower super
output area1 (LSOA) with the darker the area the higher the number. Numbers are
generally highest in Eastbourne and Hastings town centres (see figures 12 and 13).
Figure 11
1 Lower Super Output Areas (LSOAs) are statistical geographies with an average resident population of 1,500
Reason/problem% call-
outs
Mental Health Issues 11%
Trauma 11%
Unconscious/Faint 10%
Falls <12ft 9%
NHS 111 7%
Generally Unwell 6%
Alcohol Intoxication/Related 6%
Chest Pain/Cardiac Prob 6%
Limb/Pain Injury 4%

17 East Sussex Public Health, 2016
Figure 12
Figure 13

18 East Sussex Public Health, 2016
Alcohol-related hospital admissions Key strategy outcome: reduced alcohol related hospital admissions (priority 2)
At an East Sussex level the alcohol-related hospital
admission rate largely follows the national trend. At a
district and borough level, Lewes, Rother and Wealden
districts have always had lower rates than the national
average and Lewes and Wealden have also always had lower rates than East
Sussex. Hastings has always had the highest rate and consistently higher than the
national average and East Sussex. (Figure 14)
Figure 14
Data source: Local Alcohol
Profiles for England, PHE.
There are different ways to capture alcohol related hospital admissions from looking at alcohol specific reasons
only (such as alcoholic liver disease), to diseases and injuries where alcohol can play a part (such as breast
cancer or falls). In this report the definition for alcohol related hospitals admission is as per the Public Health
Outcomes Framework indicator, a ‘narrow measure’, and includes admissions where the primary reason for
admission is an alcohol specific or alcohol-attributable condition. See Appendix for further details.

19 East Sussex Public Health, 2016
60% of alcohol-related hospital admissions (narrow measure)
are for males.
At a district/borough level, Hastings (44%) has the largest
proportion of admissions for females and Lewes (34%) the
smallest.
The most recent data (2014/15) shows that for both males and females the alcohol-
related hospital admission rates in Hastings are significantly higher than England and
in Wealden they are significantly lower. In Lewes, admission rates for females are
significantly lower than England. (Figure 15)
Across the county the age profile of these admissions varies with Hastings
admissions comprising a younger age profile compared to the rest of East Sussex. In
Wealden almost half of admissions for males are for those aged 65 years and over.
Admissions for females have a slightly younger age profile compared to males.
(Figure 16 and 17)
Figure 15

20 East Sussex Public Health, 2016
Figure 16
Figure 17
Public Health England produces Local Alcohol Profiles for England (LAPE) which
contain a range of indicators around the harm and impact of alcohol. Table 3 is a
summary of hospital admission indicators from the profiles for East Sussex and its
districts and boroughs.

21 East Sussex Public Health, 2016
Eastbourne has similar rates to England for all indicators; Hastings is significantly
worse than England for most indicators and Wealden significantly better. Lewes and
Rother districts are either similar to or significantly better than England.
Admissions for under 18s are significantly higher than England in both Hastings and
Lewes although numbers are small (relates to around 11 young people per year
being admitted in each authority).
Table 3
Figures 18 and 19 show the proportion of alcohol-related admissions that were due
to accidents and injuries, mental and behavioural disorders and alcohol poisoning for
both males and females in each district/borough. In all districts and boroughs the
highest percentages of alcohol-related admissions in both males and females are for
accidents and injuries, except for females in Hastings where alcohol poisoning made
up the highest percentage.
Alcohol-related accidents and injuries make up a larger proportion of admissions in
males and alcohol poisoning a larger proportion of admissions in females.
The percentages of alcohol-related admissions due to accidents and injuries are
highest in Wealden and the percentages due to mental and behavioural disorders
highest in Hastings and Eastbourne. Alcohol poisoning is highest amongst males in
Hastings comprising over 1 in 10 admissions, and amongst females in Lewes,
comprising 1 in 6 admissions.
Alcohol hospital admissions indicator England East Sussex Eastbourne Hastings Lewes Rother Wealden
Persons admitted for alcohol-specific conditions 364 302 372 503 270 266 181
Males admitted for alcohol-specific conditions 502 405 528 679 368 331 237
Females admitted for alcohol-specific conditions 235 209 232 341 183 205 130
Persons admitted for alcohol-related conditions 438 405 462 526 382 384 325
Males admitted for alcohol-related conditions 586 538 614 685 523 515 428
Females admitted for alcohol-related conditions 306 290 332 388 257 270 237
Admission episodes for alcohol-related conditions 641 571 663 776 512 569 436
Admission episodes for alcohol-related conditions - Males 827 721 822 924 705 731 546
Admission episodes for alcohol-related conditions - Females 474 442 527 650 339 428 343
Persons under 18 admitted to hospital for alcohol-specific conditions 37 44 49 56 58 37 30
Under 40s - admission episodes for alcohol-related conditions 151 147 157 199 138 151 101
Under 40s admission episodes for alcohol-related conditions - Males 181 172 199 215 164 176 119
Under 40s admission episodes for alcohol-related conditions - Females 120 123 116 184 113 127 85
40-64 yrs admission episodes for alcohol-related conditions 300 248 305 367 213 241 176
40-64yrs admission episodes for alcohol-related conditions - Males 371 297 340 421 300 306 194
40-64 yrs admission episodes for alcohol-related conditions - Females 230 203 274 317 130 181 160
Over 65s admission episodes for alcohol-related conditions 191 177 202 209 161 177 158
Over 65s admission episodes for alcohol-related conditions - Males 275 253 282 287 241 249 233
Over 65s admission episodes for alcohol-related conditions - Females 124 116 138 149 96 120 99
Significantly worse compared to England
No significant difference compared to England
Significantly better compared to England
All indicators (except admissions for under 18s) are directly age-standardised per 100,000 and for 2014/15
Admissions for under 18s are 3 years pooled (2012/13-2014/15) and is a crude rate
All alcohol-related admissions are as per the narrow measure Source: Local Alcohol Profiles for England, PHE

22 East Sussex Public Health, 2016
Figure 18
Figure 19
Compared to England, the alcohol-related admission rate for mental and behavioural
disorders is significantly lower for males in Lewes, Wealden and in Rother; the rate
is significantly higher for females in Hastings. Admissions for alcohol poisoning are
significantly higher for both males and females in Hastings but significantly lower for
males in Wealden. (Table 4)

23 East Sussex Public Health, 2016
Table 4
Alcohol-related admissions also include diseases where alcohol can play a part.
Previous analysis of 2013/14 admissions data showed that half of alcohol-related
admissions in East Sussex were due to alcohol-attributable cancers, circulatory
diseases and digestive diseases.
Figure 20
Alcohol hospital admissions indicator England East Sussex Eastbourne Hastings Lewes Rother Wealden
Admissions for alcohol-related unintentional injuries 140 131 130 146 124 141 125
Admissions for alcohol-related unintentional injuries - Males 212 200 194 226 195 216 184
Admissions for alcohol-related unintentional injuries - Females 74 71 73 74 60 74 73
Admissions for mental & behavioural disorders due to use of alcohol 84 56 79 96 50 46 29
Admissions for mental & behavioural disorders due to use of alcohol - Males 120 74 105 112 79 60 40
Admissions for mental & behavioural disorders due to use of alcohol - Females 50 40 57 84 24 33 18
Admissions for intentional self-poisoning by/& exposure to alcohol 52 54 52 98 48 43 35
Admissions for intentional self-poisoning by/& exposure to alcohol - Males 45 48 49 99 31 40 25
Admissions for intentional self-poisoning by/& exposure to alcohol - Females 59 61 55 96 65 46 45
Significantly worse compared to England
No significant difference compared to England
Significantly better compared to England
All indicators are directly age-standardised per 100,000 and for 2014/15
All alcohol-related admissions are as per the narrow measure
Source: Local Alcohol Profiles for England, PHE

24 East Sussex Public Health, 2016
Dependent drinkers Key strategy outcome: local people who need help from alcohol misuse can quickly access treatment (priority 2)
It is estimated that around 5% of
dependent drinkers are in treatment. There
is variation across the districts and
boroughs.
Figure 21
Data source: Adults – alcohol JSNA
support pack: key data, PHE 2016.
Alcohol-use disorders: alcohol
dependence; costing template,
NICE. ONS Mid-Year Estimates
2015. CGL/NDTMS.
Estimated
17,100 adult
dependent
drinkers
The previous alcohol health harm report suggested an estimate of 6,600 dependent drinkers in East Sussex.
This estimate was based on the JSNA support pack for strategic partners – data for alcohol - East Sussex, 2013.
NICE (The National Institute for Health and Care Excellence) suggest that 3.8% of the adult population are
dependent drinkers (17,100) with 84% of these mildly dependent (14,400), 14% moderately dependent (2,400)
and 2% severely dependent (300) (based on data from the Adult Psychiatric Morbidity Survey 2007). These
prevalence estimates have been used for the updated figures presented in this report.

25 East Sussex Public Health, 2016
The majority of the adult in-treatment population are males (60%). In terms of age,
1 in 10 (10%) of the adult in-treatment population are aged under 30 years, a third
(32%) aged 40-49 years and 1 in 7 (15%) aged 60 years or over.
Of adults entering treatment during 2015/16 (new presentations):
21% live with children (own or other), this compares to 24% nationally.
21% are parents not living with children, this compares to 27% nationally.
During 2015/16 there were 215 children living with adults who were receiving
alcohol treatment.

26 East Sussex Public Health, 2016
Alcohol-related deaths
There are on average around 68 alcohol-
related deaths per year in East Sussex
ranging from an average of 11 per year in
Lewes to 17 per year in Hastings. During
2011-2015, 63% of deaths were due to
alcoholic liver disease, 22% from fibrosis and
cirrhosis of the liver, 7% from mental and
behavioural disorders due to alcohol use and 4% from accidental alcohol poisoning.
Table 5
Two-thirds (67%) of alcohol-related deaths are for males. Around 1 in 10 (11%) are
for persons aged under 45 years with the majority being for persons aged 45-74
years.
Table 6
The Local Alcohol Profiles for England (LAPE, Source: Public Health England) show
that across East Sussex mortality rates from alcohol-specific causes, alcohol-related
causes and from chronic liver disease are generally similar to the England rates
except in Hastings which has significantly higher rates of alcohol-specific mortality
and chronic liver disease, particularly in males.
2011 2012 2013 2014 2015 Grand Total
Eastbourne 15 8 12 15 15 65
Hastings 14 17 17 18 17 83
Lewes 11 10 9 13 12 55
Rother 13 16 9 19 8 65
Wealden 14 12 24 13 9 72
Grand Total 67 63 71 78 61 340
Alcohol-related deaths by year of death (2011-2015)
Age group Males Females Total %
Under 45s 24 14 38 11%
45-54 57 27 84 25%
55-64 62 32 94 28%
65-74 53 19 72 21%
75+ 32 20 52 15%
Grand Total 228 112 340 100%
Alcohol-related deaths (2011-2015)
Data source: ONS Public Health
Mortality Files. ONS national
statistics definition used – includes
causes regarded as being most
directly due to alcohol consumption,
differs from definition used in local
alcohol profiles. (See appendix)

27 East Sussex Public Health, 2016
Alcohol and inequality in life expectancy
Inequalities exist within districts and boroughs
with the most deprived areas experiencing lower
life expectancies compared to the least deprived
areas. Public Health England have developed a
tool that breaks down the life expectancy gap by
cause of death and have identified the contribution of alcohol-specific deaths to gaps
in life expectancy at a local authority level.
Figures 23 and 24 show the life expectancy at birth for males and females in the
most and least deprived quintiles (20%) for each local authority area, as well as the
contribution to the gap from alcohol-specific mortality.
Figure 22 explains how the data has been presented.
Figure 22
For example, for males in Rother, the life expectancy in the least deprived quintile is
83 years and in the most deprived quintile it is 76.5 years, so there is a gap of 6.5
years, identified by the length of the whole arrow bar (both light and dark purple).
The dark purple block at the end of the arrow is the potential gain in life expectancy
in the most deprived area if it experienced the same alcohol-specific mortality as the
least deprived area which for males in Rother this is 0.3 years. The light purple bar
is the gap in life expectancy if the males in the most deprived areas had the same
alcohol-specific mortality rate as the males in the least deprived areas (6.2 years).
Data source: The Segment Tool
– segmenting life expectancy
gaps by cause of death, May
2016, PHE.

28 East Sussex Public Health, 2016
Figure 23
Figure 24
For both males and females the contribution of alcohol to the gap in life expectancy
is greatest for those living in the most deprived areas of Hastings, with a potential
gain in life expectancy of one year for males and half a year for females if they
experienced the same alcohol-specific mortality rates as males and females living in
the least deprived areas. For males in Lewes there is no potential gain (i.e. alcohol-
specific deaths do not contribute to the gap and it is due to other causes of death).

29 East Sussex Public Health, 2016
Whilst Eastbourne has the second largest potential gain in life expectancy for males,
it has the least for females.
Comparing the alcohol-specific death rates in the least deprived areas with the most
deprived areas allows the number of ‘excess deaths’ to be calculated. For example,
in 2012-14 in Eastbourne there were an ‘extra’ nine deaths due to alcohol-specific
causes in the most deprived areas compared to the least deprived areas, eight for
males and one for females. If these areas experienced exactly the same rates of
alcohol-specific mortality the excess deaths would be zero.
Over the three-year period Lewes (4) had the fewest excess deaths due to alcohol-
specific causes in its most deprived areas and Hastings (22) had the most.
Eastbourne and Rother both had nine excess deaths but there were more for males
in Eastbourne.
Figure 25

30 East Sussex Public Health, 2016
Alcohol-related road traffic accidents
Compared to England, alcohol-related road traffic accidents are significantly higher
in Wealden and Rother districts. (Source: Local Alcohol Profiles for England, PHE
2016)
Figure 26
31 East Sussex Public Health, 2016
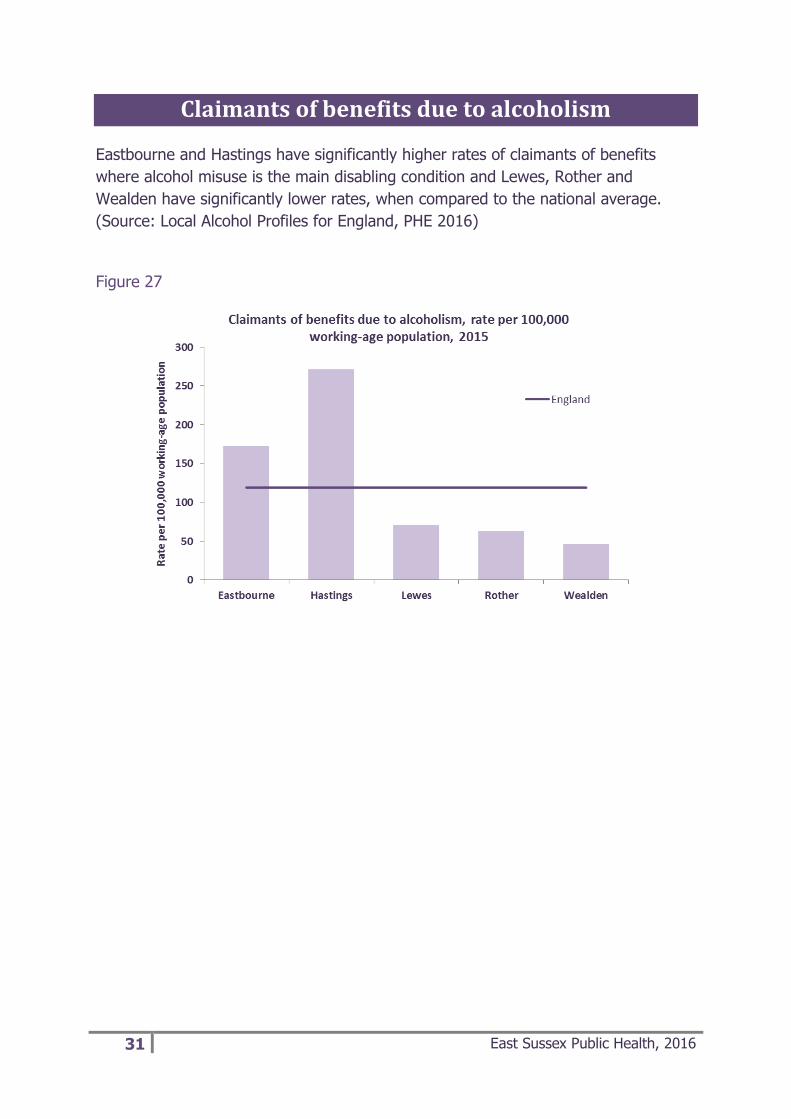
Claimants of benefits due to alcoholism
Eastbourne and Hastings have significantly higher rates of claimants of benefits
where alcohol misuse is the main disabling condition and Lewes, Rother and
Wealden have significantly lower rates, when compared to the national average.
(Source: Local Alcohol Profiles for England, PHE 2016)
Figure 27

32 East Sussex Public Health, 2016
Key findings
Consumption
Young people (15 year olds) in East Sussex have significantly higher alcohol
consumption compared to the England average. Year 10 pupils reporting that
they had had a drink in the last 7 days was highest in Wealden and Hastings.
Over a third of adults drink alcohol every week. Notable differences between
males and females – more males drink alcohol, more regularly and at higher
risk – 1 in 3 males compared to 1 in 10 females who drink are drinking at
higher risk.
Reasons for drinking
The reasons local people give on why they find alcohol attractive include: low
mood/depression; boredom; coping mechanism; peer pressure; availability
and affordability and boosts confidence. NO UPDATE
Levels of understanding of safe drinking
There is confusion around safe drinking limits with both adults and young
people not understanding how to measure the units they are consuming. NO
UPDATE
Although limited, there is some awareness of health risks but this is not a
deterrent, with young people in particular feeling confident that health
problems won’t happen to them. NO UPDATE
Alcohol-related harm
Alcohol-related health harms (admissions and deaths) are significantly worse
than England in Hastings across a range of indicators. Eastbourne generally
has similar levels of alcohol-related health harm to England, with Lewes,
Rother and Wealden either similar too or significantly better than the national
average. Alcohol health harm is higher for males than females.
33 East Sussex Public Health, 2016
Impact on health services
A&E attendances during the night-time economy due to assaults are higher
for males and for 15-24 year olds. Attendance rates are significantly higher
than the county average in Eastbourne and Hastings. There are higher rates
for persons from more deprived areas.
Alcohol-related ambulance call-outs have seen a 17% increase in 2015/16
compared to 2014/15. Half are between 8pm and 4am with a further 1 in 5
between 4pm and 8pm. Numbers are highest in Eastbourne and Hastings
town centres and in the month of August.
Inequality in life expectancy
Deaths from alcohol contribute to the gap in life expectancy between the
most and least deprived areas within districts and boroughs. In East Sussex
the largest impact is on males living in the most deprived parts of Hastings.
34 East Sussex Public Health, 2016
What does this mean for local action?
The findings of this report indicate that local action needs to focus on the following:
Delaying onset of drinking and reducing alcohol consumption in young people
Helping people to understand safe drinking limits in line with Chief Medical
Officer guidelines
Reducing alcohol-related harm where need is greatest, that is, in Hastings
Borough where interventions need to be targeted in the more deprived areas
and with a particular focus on men.
Working to address the underlying reasons why people use alcohol as a
coping mechanism and enabling those who are drinking at unsafe levels due
to mental health issues to access other means of support and intervention.
Addressing alcohol-related A&E attendances and ambulance call-outs in
Hastings and Eastbourne town centres both during the night-time economy
and early evening, particularly on Friday and Saturday nights with the month
of August requiring particular attention. Particular attention to be given to
reducing levels of accidents and injuries.
Encouraging dependent drinkers to access treatment and health professionals
to raise the issue of alcohol intake with their patients, making every contact
count.
Targeting drink-driving in the rural areas of Rother and Wealden.
All interventions to tackle alcohol-related harm should be based on the best available
evidence. The international evidence on the prevention of drug and alcohol use
(PHE, 2015) can be used as a guide. This classifies interventions as:
‘Universal’, where they address an entire population (e.g. TV audience, local
community, school pupils);
‘Selective’, where they serve specific sub-populations (e.g. individuals, groups,
families and communities, whose risk of substance misuse is known to be
higher than average, either imminently or over a lifetime) and
Indicated, where prevention is aimed at people who are already using
substances, are not yet experiencing dependence, but who may be showing

35 East Sussex Public Health, 2016
signs of problematic use (e.g. falling grades at school, absenteeism from
work, antisocial behaviour, mental health problems).
When designing interventions, it is important to bear in mind that:
The social, economic and environmental circumstances within which people
live and work impact on their vulnerability and exposure to problems or
stressful life events, which in turn influence alcohol-related health harm. (See
appendix III for further detail)
Many of the prevention interventions that influence alcohol use may not be
alcohol-specific and may already exist as broader interventions (such as
parenting programmes, education in schools around personal and social skills,
increasing social support to people who are isolated and lonely).
Evidence and good practice guidance indicates that communities should be
involved in the co-production of solutions to address alcohol issues in their
own area (an important consideration for work in Hastings).
In tackling alcohol misuse and associated harm and disorder, partnership
work is key as it requires education, awareness-raising, enforcement, industry
involvement, community initiatives, and care and treatment provision.
Interventions should be carefully monitored and evaluated to assess they are
meeting identified need and achieving intended outcomes.

36 East Sussex Public Health, 2016
Appendix I – alcohol-related admissions and alcohol-
specific deaths definition https://publichealthmatters.blog.gov.uk/2014/01/15/understanding-alcohol-related-hospital-
admissions/
Alcohol causes, or can contribute to the development of, many health conditions.
Academics have been able to use high quality research evidence to estimate what
proportion of cases of a health condition are alcohol-related. Conditions such as
alcoholic liver disease where alcohol is the sole cause are known as alcohol-specific
or wholly alcohol-attributable conditions and their alcohol-attributable fraction is 1.0
(100 per cent). For other conditions, where alcohol has a proven relationship but it is
one of a range of causative factors, an estimate of the contribution alcohol makes is
calculated. For example, it is estimated that alcohol plays a causative role in 25-33
per cent of cardiac arrhythmias. These are the partially alcohol-attributable
conditions and the alcohol-attributable fractions would be 0.25-0.33. Fractions differ
slightly for men and women. Some external cause codes also have an alcohol-
attributable fraction (for example, 27 per cent of assaults are estimated to be
alcohol-related and therefore the alcohol-attributable fraction is 0.27).
The total number of alcohol-related hospital admissions, as described by the
indicator, is not a number of actual people or a number of actual admissions
but an estimated number of admissions calculated by adding up all of the
fractions we have identified.
In this report, alcohol related admissions are the number of admissions involving an
alcohol-related primary diagnosis or an alcohol-related external cause (referred to as
a narrow measure, and is used in the Public Health Outcomes Framework). The
indicator is a directly age-standardised rate per 100,000 population, standardised to
the 2013 European Standard population (2013 ESP).
See the Local Alcohol Profiles for England (LAPE) user guide for further details:
http://www.lape.org.uk/downloads/Lape_guidance_and_methods.pdf

37 East Sussex Public Health, 2016
Alcohol-attributable fractions used to calculate alcohol-related hospital admissions
*note for alcohol-specific deaths and inequality in life expectancy definition uses all wholly
attributable conditions except T51.0 and T51.1

38 East Sussex Public Health, 2016
39 East Sussex Public Health, 2016
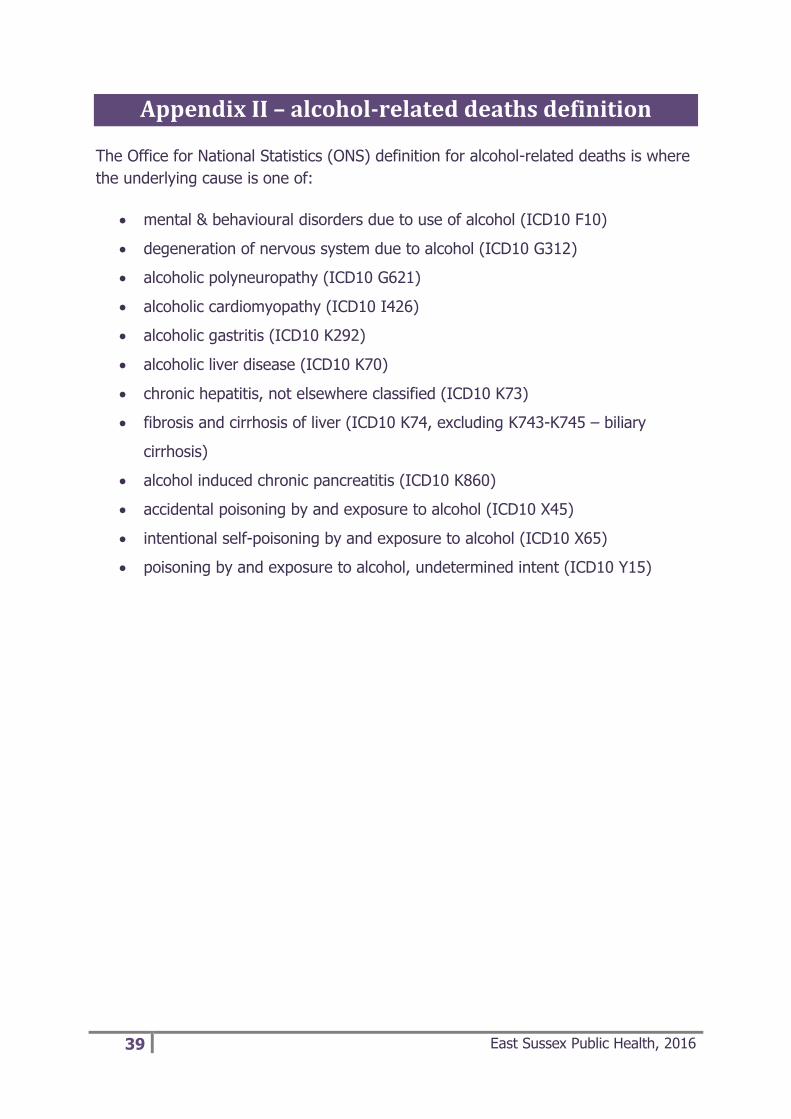
Appendix II – alcohol-related deaths definition The Office for National Statistics (ONS) definition for alcohol-related deaths is where
the underlying cause is one of:
mental & behavioural disorders due to use of alcohol (ICD10 F10)
degeneration of nervous system due to alcohol (ICD10 G312)
alcoholic polyneuropathy (ICD10 G621)
alcoholic cardiomyopathy (ICD10 I426)
alcoholic gastritis (ICD10 K292)
alcoholic liver disease (ICD10 K70)
chronic hepatitis, not elsewhere classified (ICD10 K73)
fibrosis and cirrhosis of liver (ICD10 K74, excluding K743-K745 – biliary
cirrhosis)
alcohol induced chronic pancreatitis (ICD10 K860)
accidental poisoning by and exposure to alcohol (ICD10 X45)
intentional self-poisoning by and exposure to alcohol (ICD10 X65)
poisoning by and exposure to alcohol, undetermined intent (ICD10 Y15)

40 East Sussex Public Health, 2016
Appendix III – alcohol harm and influencing factors Source: Public Health England, Health matters: harmful drinking and alcohol
dependence, January 2016
Although the volume of alcohol consumed is a clear indicator of potential harm to
health, other factors affect the relationship. The impact of harmful drinking and
alcohol dependence is much greater for those in the lowest income bracket and
those experiencing the highest levels of deprivation. The reasons for this are not
fully understood. People on low income do not tend to consume more alcohol than
people from higher socio-economic groups. The increased risk is likely to relate to
the effects of other issues affecting people in lower socio-economic groups.
For further detail on the impact of social determinants and alcohol harm please see Alcohol and inequities. Guidance for addressing the inequities in alcohol-related harm. World Health Organization (WHO), 2014.