atlantic subtropical storms. part ii:...
TRANSCRIPT
Atlantic Subtropical Storms. Part II: Climatology
MARK P. GUISHARD* AND JENNI L. EVANS
Department of Meteorology, The Pennsylvania State University, University Park, Pennsylvania
ROBERT E. HART
Department of Meteorology, The Florida State University, Tallahassee, Florida
(Manuscript received 27 November 2007, in final form 2 December 2008)
ABSTRACT
A 45-yr climatology of subtropical cyclones (ST) for the North Atlantic is presented and analyzed. The STs
pose a warm-season forecasting problem for subtropical locations such as Bermuda and the southern United
States because of the potentially rapid onset of gale-force winds close to land. Criteria for identification of ST
have been developed based on an accompanying case-study analysis. These criteria are applied here to the
40-yr European Centre for Medium-Range Weather Forecasts Re-Analysis (ERA-40) to construct a con-
sistent historical database of 197 North Atlantic ST in 45 yr.
Because ST may eventually evolve into tropical cyclones, sea surface temperatures (SST) and vertical wind
shear conditions for tropical cyclogenesis are contrasted with the conditions for ST genesis identified here.
Around 60% of the 197 ST formed over SST in excess of 258C in a region of weak static stability. Further, the
mean environmental vertical wind shear at formation for these storms is 10.7 m s21, a magnitude generally
considered to be unfavorable for tropical cyclogenesis.
The STs have hybrid structure, so the potential for baroclinic and thermodynamic development is explored
through the baroclinic zone (characterized by the Eady growth rate s) and SST field. Seasonal evolution in
the location and frequency of ST formation in the basin is demonstrated to correspond well to the changing
region of overlap between SST . 258C and s . 0.1 day21.
This climatology is contrasted with two alternative ST datasets. The STs contribute to 12% of tropical
cyclones (TC) in the current National Hurricane Center (NHC) Hurricane Database (HURDAT); this
equivalent to about 1 in 8 genesis events from an incipient ST disturbance. However, with the addition of
144 ST that are newly identified in this climatology (and not presently in HURDAT) and the reclassification
(as not ST) of 65 existing storms in HURDAT, 197/597 storms (33%) in the newly combined database are ST,
which emphasizes the potential importance of these warm-season storms.
1. Background
At around 2300 Bermuda LT on Friday 12 October
2001 (0000 UTC 13 October), the storm that would
eventually become Hurricane Karen passed close to the
west end of the island. Maximum 10-min sustained
surface winds were measured at 30 m s21 (67 mph), with
gusts to 40 m s21 (90 mph) at the airport and a minimum
recorded pressure of 992 hPa. Instruments at Bermuda
Rescue Coordination/Bermuda Harbour Radio (at an
elevation of 92 m above mean sea level) reported a
sustained wind of 34 m s21 with a gust to 47 m s21 (76 mph
gusting to 105 mph; Williams 2002). Convective bands
wrapping around the central low were evident in the
satellite imagery, as the storm continued its transi-
tion into a tropical system. At 2200 LT (2100 UTC) on
13 October, the U.S. National Hurricane Center desig-
nated the system ‘‘Subtropical Storm #1’’—later to be-
come Hurricane Karen, as it continued to track north
toward the Canadian Maritimes (Stewart 2001). In spite
of the fact that both gale and storm warnings had been
issued by the Bermuda Weather Service, the media re-
ported this event as a ‘‘surprise storm that caught ev-
eryone off guard’’ (Breen and Mallon 2001). The 23 000
* Current affiliation: Bermuda Weather Service, St. George’s,
Bermuda.
Corresponding author address: Mark P. Guishard, Bermuda
Weather Service, BAS-Serco Ltd., P.O. Box GE123, St. George’s
GE BX, Bermuda.
E-mail: [email protected]
3574 J O U R N A L O F C L I M A T E VOLUME 22
DOI: 10.1175/2008JCLI2346.1
� 2009 American Meteorological Society
electricity customers who had lost power were not
convinced that they had been well served. Such was the
dichotomy between public perception and meteorolo-
gical reality—this storm did not yet have purely tropical
characteristics, but it did have both intense winds and
accompanying rain—that the public perceived it to be a
poorly forecast tropical storm.
Oceanic storms with ambiguous origins and/or struc-
tures have often been operationally classified as sub-
tropical. The operational definitions of cyclone types
relevant to this study are a follows (as published by the
U.S. National Weather Service; OFCM 2007):
Subtropical cyclone. A nonfrontal low pressure sys-
tem that has characteristics of both tropical and
extratropical cyclones. This system is typically an
upper-level cold low with circulation extending to
the surface layer and maximum sustained winds
generally occurring at a radius of about 100 miles or
more from the center. In comparison to tropical
cyclones, such systems have a relatively broad zone
of maximum winds that is located farther from the
center, and typically have a less symmetric wind
field and distribution of convection.
Subtropical storm. A subtropical cyclone in which the
maximum sustained surface wind speed (1-min
mean) is 34 kt (39 mph) or higher.
Tropical cyclone. A warm-core, nonfrontal synoptic-
scale cyclone, originating over tropical or subtrop-
ical waters, with organized deep convection and a
closed surface wind circulation about a well-defined
center.
Extratropical cyclone. A synoptic scale low pressure
system whose primary energy source is baroclinic.
When observing and forecasting subtropical cyclones
(ST), an ambiguity often exists regarding the extent of
their tropical or extratropical characteristics, despite the
fact that descriptions of the characteristics of individual
cases in the Atlantic have been documented in the lit-
erature for over 30 yr. Members of the public recognize
no real distinctions between the effects of ST and weak
tropical cyclones (TC) because the weather produced
by both is similar. Indeed, the transition of systems from
ST to TC is one mode of tropical cyclogenesis (Davis
and Bosart 2003). For these reasons, operational fore-
casters have recently begun to assign names to Atlantic
warm-season ST from the same list that TC are named.
The intent of this study is to clarify the physical aspects
of subtropical storms to aid forecasters in the detection,
identification, tracking, and forecasting of ST. In the
pursuit of this, we will investigate characteristics com-
mon to all ST that are not described in the operational
definition (OFCM 2007), such as thermal structure and
environmental controls on development.
Clearly, the process of naming ST requires an un-
ambiguous assessment of storm type. In the remainder
of this section we review historical assessments of ST in
the North Atlantic. This provides context for our new
approach to determination of ST, which is the subject of
this paper.
a. Hebert and Poteat (1975) satellite classificationtechnique
In spite of the TC-like impacts of ST, there is very
little about Atlantic ST in the literature—and not much
more written on the Pacific (or Kona) storms. As a
complement to the Dvorak technique for TC intensity
classification (Dvorak 1975), the U.S. National Weather
Service (NWS) implemented a satellite recognition tech-
nique for estimating ST intensity (Hebert and Poteat
1975, hereafter HP75). HP75 distinguished three sub-
categories of ST: (1) ST originating from upper-level
cold lows or ‘‘cutoffs’’, (2) nonfrontal lows that form
east of upper troughs, and (3) frontal waves—these last
two both having low-level baroclinic origins. An ex-
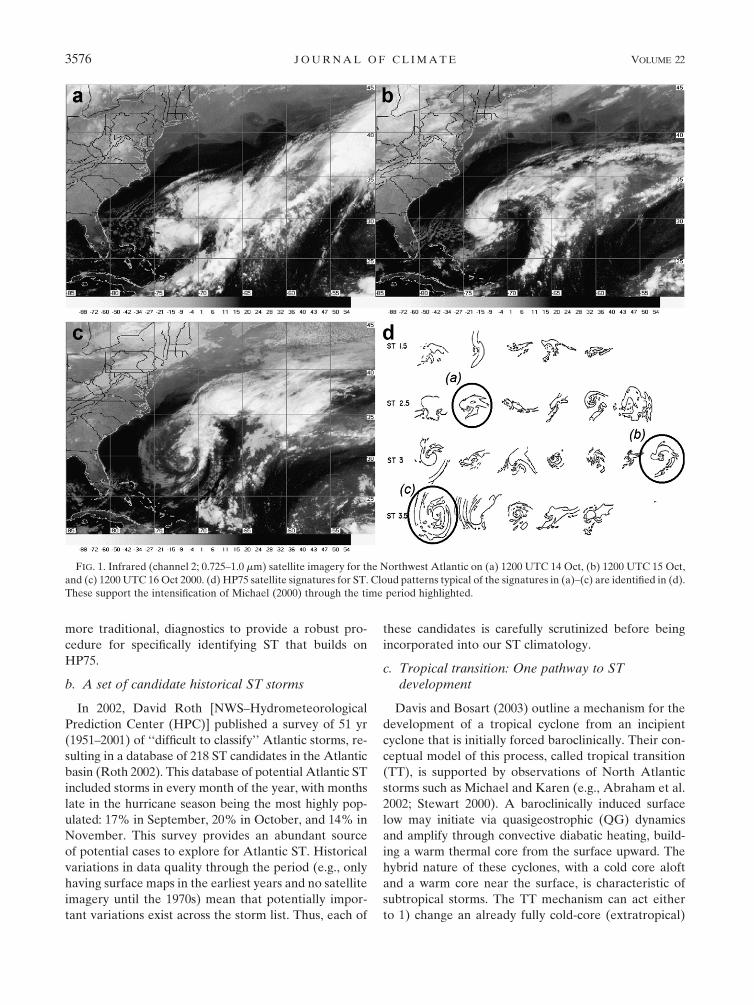
ample of the application of the HP75 technique to de-
termine ST storm intensity for the case of Hurricane
Michael (2000) is presented in Fig. 1; schematics of IR
satellite imagery taken from patterns in HP75 and ex-
amples of analyses are shown in Fig. 1, along with IR
satellite images taken during the life cycle of Michael. It
should be noted that there are significant elements of
subjectivity to this type of categorization of subtropical
storms, and the method outlined in HP75 is intended for
forecasters experienced in using similar satellite classi-
fication techniques, such as the Dvorak tropical cyclone
classification (Dvorak 1975). The evolution of Michael
through various stages in the HP75 method is evident.
HP75 developed the first objective technique for iden-
tification of ST. Although satellite resolution has im-
proved vastly since this technique was developed, the
HP75 method provides the only guidance for remote
sensing of different intensities of subtropical cyclone.
Satellite imagery from the online National Oceanic and
Atmospheric Administration (NOAA) Geostationary
Operational Environmental Satellite (GOES) archive
[National Climatic Data Center Global International
Satellite Cloud Climatology Project B1 Browse System
(GIBBS); available online at http://www.ncdc.noaa.gov/
gibbs/] is used for the HP75 analyses of the storms in our
climatology. Over the years, additional tools [e.g., sat-
ellite soundings, cyclone phase space (CPS)] for dis-
tinguishing between cyclone types have become avail-
able and are being used in operational centers. This
study brings together some of these new tools and other,
1 JULY 2009 G U I S H A R D E T A L . 3575
more traditional, diagnostics to provide a robust pro-
cedure for specifically identifying ST that builds on
HP75.
b. A set of candidate historical ST storms
In 2002, David Roth [NWS–Hydrometeorological
Prediction Center (HPC)] published a survey of 51 yr
(1951–2001) of ‘‘difficult to classify’’ Atlantic storms, re-
sulting in a database of 218 ST candidates in the Atlantic
basin (Roth 2002). This database of potential Atlantic ST
included storms in every month of the year, with months
late in the hurricane season being the most highly pop-
ulated: 17% in September, 20% in October, and 14% in
November. This survey provides an abundant source
of potential cases to explore for Atlantic ST. Historical
variations in data quality through the period (e.g., only
having surface maps in the earliest years and no satellite
imagery until the 1970s) mean that potentially impor-
tant variations exist across the storm list. Thus, each of
these candidates is carefully scrutinized before being
incorporated into our ST climatology.
c. Tropical transition: One pathway to STdevelopment
Davis and Bosart (2003) outline a mechanism for the
development of a tropical cyclone from an incipient
cyclone that is initially forced baroclinically. Their con-
ceptual model of this process, called tropical transition
(TT), is supported by observations of North Atlantic
storms such as Michael and Karen (e.g., Abraham et al.
2002; Stewart 2000). A baroclinically induced surface
low may initiate via quasigeostrophic (QG) dynamics
and amplify through convective diabatic heating, build-
ing a warm thermal core from the surface upward. The
hybrid nature of these cyclones, with a cold core aloft
and a warm core near the surface, is characteristic of
subtropical storms. The TT mechanism can act either
to 1) change an already fully cold-core (extratropical)
FIG. 1. Infrared (channel 2; 0.725–1.0 mm) satellite imagery for the Northwest Atlantic on (a) 1200 UTC 14 Oct, (b) 1200 UTC 15 Oct,
and (c) 1200 UTC 16 Oct 2000. (d) HP75 satellite signatures for ST. Cloud patterns typical of the signatures in (a)–(c) are identified in (d).
These support the intensification of Michael (2000) through the time period highlighted.
3576 J O U R N A L O F C L I M A T E VOLUME 22
system into a fully warm-core (tropical) system or 2)
induce a hybrid cyclone in situ (Davis and Bosart 2004).
Davis and Bosart do not distinguish between extra-
tropical storms that develop warm cores and systems
that develop a hybrid structure prior to the production
of gale-force winds (i.e., ST). In the current study we are
interested in the forecast problem associated with a
rapidly intensifying hybrid storm (e.g., Karen in 2001).
Thus, our study begins at the conclusion of TT-based
generation of an in situ hybrid cyclone.
A uniform methodology for identifying ST over a
long period of record is proposed here. This consistent
methodology is necessary for the development of an
unambiguous and uniform climatology of Atlantic ST.
The uniform data source needed for this study is pro-
vided by the 40-yr European Centre for Medium-Range
Weather Forecasts (ECMWF) Re-Analysis (ERA-40)
at 1.1258 3 1.1258 resolution (Uppala et al. 2005) for the
period of September 1957–August 2002.
Although this study necessarily focuses primarily on
model reanalyses of ST, examination of satellite ob-
servations, where available, supplements our analyses
to ensure wherever possible that the storms identified
here could not be classified as tropical. In addition to
the HP75 technique described above, imagery from the
Advanced Microwave Sounding Unit (AMSU; avail-
able online at http://amsu.cira.colostate.edu) on the
NOAA polar orbiters is used to verify the thermal
structure (i.e., cold core, warm core, or hybrid thermal
anomaly) of systems for which these data are available—
selected ST candidates from 1999–2002 were examined
using AMSU.
2. Identification of Atlantic subtropical cyclones inthe ERA-40 reanalyses
The ECMWF ERA-40 is freely available from the
U.S. National Center for Atmospheric Research (NCAR)
for research purposes. These model reanalyses are uti-
lized for their temporal coverage (September 1957–
August 2002), and high resolution relative to the Na-
tional Centers for Environmental Prediction (NCEP)
2.58 3 2.58 reanalyses (also freely available). The ERA-
40 data provide gridded model reanalyses with hori-
zontal resolutions of 1.1258 3 1.1258. The ERA-40 wind
data at the time were, however, only available for
analysis and display on a 1.48 3 1.48 resolution. Vertical
resolution is fixed at 14 pressure levels plus the surface
(Uppala et al. 2005). This dataset was chosen because it
provided an acceptable compromise between spatial
resolution of individual events (e.g., Hart et al. 2006),
and the 45-yr reanalysis period allows exploration of
interannual and longer variations in ST activity.
a. General approach for identification of ST
Utilizing high-resolution operational analyses and a
variety of observational data sources, a consistent set of
ST criteria has been documented that uniquely and
consistently identify a set of contemporary ST over the
period 1998–2002 (these criteria are enumerated shortly).
Details of the development of these criteria are pre-
sented in Evans and Guishard (2009, hereafter Part I).
These criteria were then employed in an examination
of the same set of systems in the ERA-40 reanalyses,
with a view to attaining a typical ST signature in the
ERA-40. This ERA-40 ‘‘ST template’’ is then applied to
the identification of ST back to September 1957. This
enables extending this climatology to times lacking re-
mote sensing, high-resolution numerical models, or
relevant ground-truth observations for our ST cases. In
addition to the benefits of using reanalyses to extend the
available data on cyclones, there are disadvantages to
using the ERA-40, as outlined by Manning and Hart
(2007); resolution and ground-truth observation data
availability are issues that the reader should be aware
of. However, the advantages of using a reanalysis da-
taset that resolves the three-dimensional structure of
historical cyclones toward their further classification far
outweigh the pitfalls inherent in using such a dataset.
Although ERA-40 does not constitute a perfect repre-
sentation of reality, the inclusion of observational and
remote sensing data in its composition makes it the
obvious choice for making meaningful conclusions about
the nature of historical cyclones with societal impacts.
Ongoing discussions and debates are vital to this pro-
cess, and the procedure is necessarily iterative in na-
ture. Indeed, the first author is incorporating this ap-
proach to provide supplementary ST information for the
current National Hurricane Center (NHC) Hurricane
Dataset (HURDAT) reanalysis of historical warm-season
Atlantic storms (Guishard 2006).
b. Automated storm tracker
This study necessitates the development of a sizeable
dataset of cyclone records. This is achieved via appli-
cation of an automated detection and tracking algo-
rithm (discussed in Hart 2003). The algorithm detects
and tracks minima in the sea level pressure (SLP)
analysis inside the (08–608N, 08–1008W) domain of in-
terest. The automated tracking algorithm also allows
for the detection of gale-force winds (.17 m s21, or
.38 mph) at 925 hPa, plus the calculation of minimum
central pressure and the CPS variables of Hart (2003).
The use of 925-hPa gales as a criterion for inclusion of
a cyclone is consistent with previous cyclone studies
involving the CPS (Hart 2003; Evans and Hart 2003;
1 JULY 2009 G U I S H A R D E T A L . 3577
Arnott 2004). Although this method is at odds with
the operational definitions, which indicate that surface
winds are used as a discriminator between subtropi-
cal cyclones and subtropical storms, 925 hPa is the low-
est standard model level that is above the surface for
most cyclones. However, this may make direct compar-
isons with datasets such as HURDAT problematic. The
methods outlined above are described in detail in the
following sections.
c. The CPS
The CPS is a three-dimensional descriptor of cyclone
structure (Hart 2003). Structure types are classified by
symmetry and strength and vertical depth of the tem-
perature anomaly associated with the system. The CPS
implies a continuum of cyclone types, typified by regimes
of symmetry/asymmetry and core height anomalies (Hart
2003). The advantages of this type of diagnostic tool are
evident when it is used in conjunction with synoptic
fields, satellite imagery, and other analysis tools.
The CPS thermal symmetry parameter is denoted by
B and is evaluated via
B 5 h[(Z600hPa � Z900hPa)R � (Z600hPa � Z900hPa)L]
where h 5 21 for the Southern Hemisphere and h 5 11
for the Northern Hemisphere. Two thermal wind pa-
rameters complete the CPS description. These are eval-
uated over layers in the lower (L; 900–600 hPa) and
upper (U; 600–300 hPa) troposphere as follows:
2 VLT 5
›(DZ)
› ln p
����600hPa
900hPa
and
2 VUT 5
›(DZ)
› ln p
����300hPa
600hPa
.
In the present analysis, the CPS is used to characterize
storm structure and so to differentiate ST from other
cyclone types. (Real-time CPS diagnostics are available
online at http://moe.met.fsu.edu/cyclonephase.)
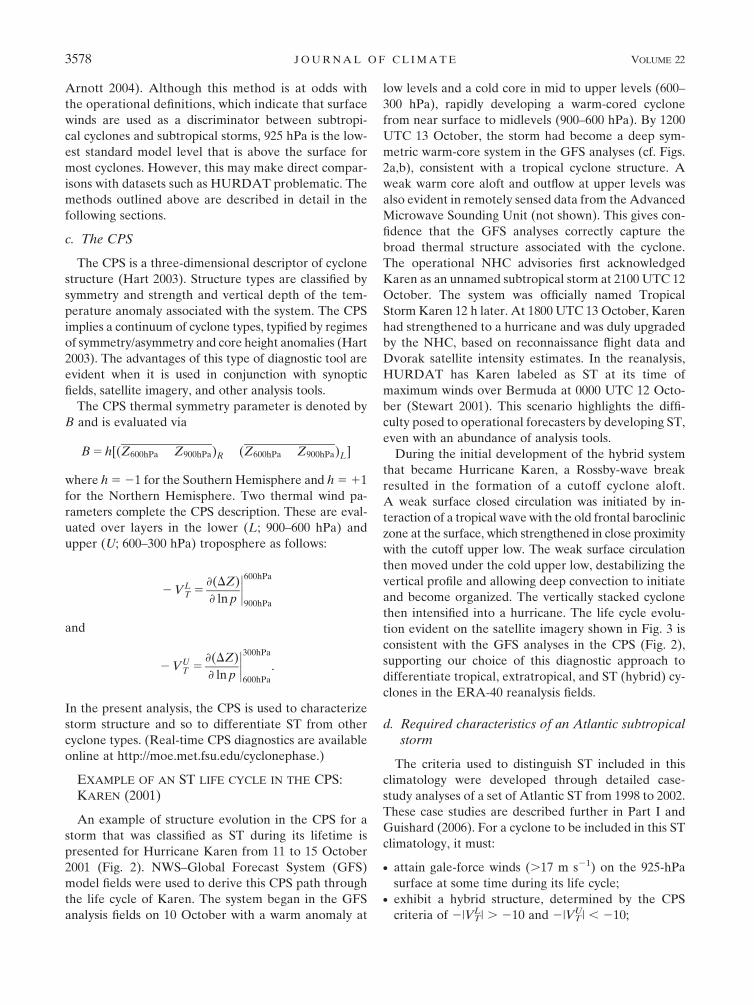
EXAMPLE OF AN ST LIFE CYCLE IN THE CPS:KAREN (2001)
An example of structure evolution in the CPS for a
storm that was classified as ST during its lifetime is
presented for Hurricane Karen from 11 to 15 October
2001 (Fig. 2). NWS–Global Forecast System (GFS)
model fields were used to derive this CPS path through
the life cycle of Karen. The system began in the GFS
analysis fields on 10 October with a warm anomaly at
low levels and a cold core in mid to upper levels (600–
300 hPa), rapidly developing a warm-cored cyclone
from near surface to midlevels (900–600 hPa). By 1200
UTC 13 October, the storm had become a deep sym-
metric warm-core system in the GFS analyses (cf. Figs.
2a,b), consistent with a tropical cyclone structure. A
weak warm core aloft and outflow at upper levels was
also evident in remotely sensed data from the Advanced
Microwave Sounding Unit (not shown). This gives con-
fidence that the GFS analyses correctly capture the
broad thermal structure associated with the cyclone.
The operational NHC advisories first acknowledged
Karen as an unnamed subtropical storm at 2100 UTC 12
October. The system was officially named Tropical
Storm Karen 12 h later. At 1800 UTC 13 October, Karen
had strengthened to a hurricane and was duly upgraded
by the NHC, based on reconnaissance flight data and
Dvorak satellite intensity estimates. In the reanalysis,
HURDAT has Karen labeled as ST at its time of
maximum winds over Bermuda at 0000 UTC 12 Octo-
ber (Stewart 2001). This scenario highlights the diffi-
culty posed to operational forecasters by developing ST,
even with an abundance of analysis tools.
During the initial development of the hybrid system
that became Hurricane Karen, a Rossby-wave break
resulted in the formation of a cutoff cyclone aloft.
A weak surface closed circulation was initiated by in-
teraction of a tropical wave with the old frontal baroclinic
zone at the surface, which strengthened in close proximity
with the cutoff upper low. The weak surface circulation
then moved under the cold upper low, destabilizing the
vertical profile and allowing deep convection to initiate
and become organized. The vertically stacked cyclone
then intensified into a hurricane. The life cycle evolu-
tion evident on the satellite imagery shown in Fig. 3 is
consistent with the GFS analyses in the CPS (Fig. 2),
supporting our choice of this diagnostic approach to
differentiate tropical, extratropical, and ST (hybrid) cy-
clones in the ERA-40 reanalysis fields.
d. Required characteristics of an Atlantic subtropicalstorm
The criteria used to distinguish ST included in this
climatology were developed through detailed case-
study analyses of a set of Atlantic ST from 1998 to 2002.
These case studies are described further in Part I and
Guishard (2006). For a cyclone to be included in this ST
climatology, it must:
d attain gale-force winds (.17 m s21) on the 925-hPa
surface at some time during its life cycle;d exhibit a hybrid structure, determined by the CPS
criteria of 2|VTL| . 210 and 2|VT
U| , 210;
3578 J O U R N A L O F C L I M A T E VOLUME 22
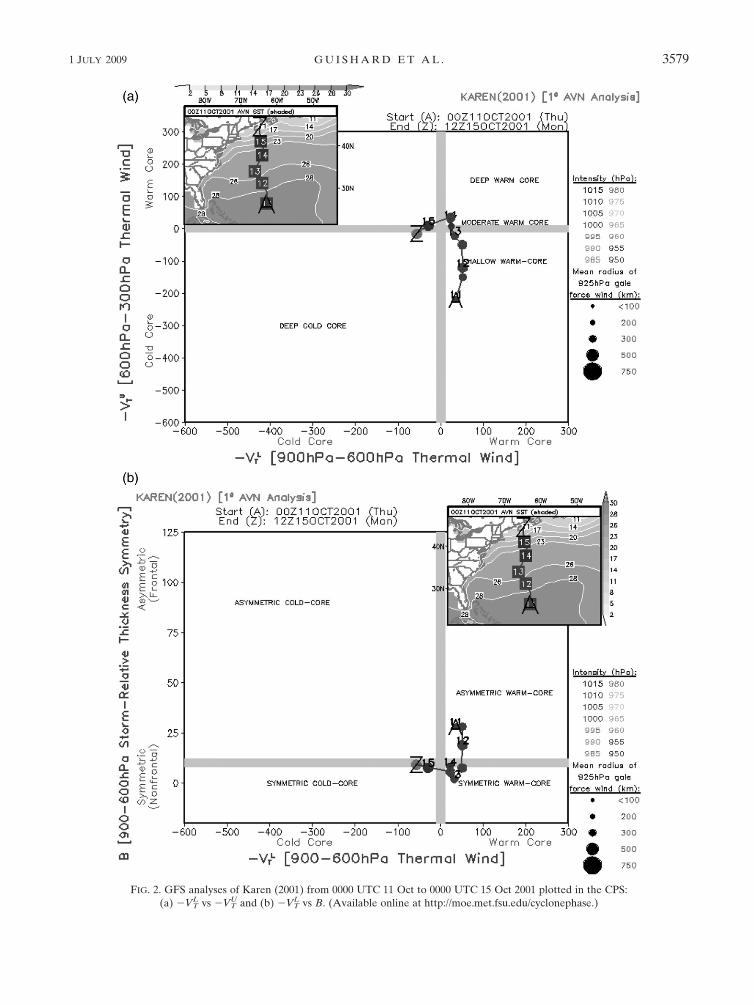
FIG. 2. GFS analyses of Karen (2001) from 0000 UTC 11 Oct to 0000 UTC 15 Oct 2001 plotted in the CPS:
(a) 2VTL vs 2VT
U and (b) 2VTL vs B. (Available online at http://moe.met.fsu.edu/cyclonephase.)
1 JULY 2009 G U I S H A R D E T A L . 3579
d persist in its hybrid form for at least 36 h (i.e., more
than one diurnal cycle);d attain gales in the 208–408N latitude band to reduce
the possibility of tropical and extratropical systems
being introduced into the dataset; andd become subtropical (i.e., attain hybrid structure)
within 24 h if identified first as a purely cold- or warm-
cored system.
The intent here is to identify only systems that are
clearly ST, so there is a need to exclude storms that are
of an ambiguous nature, hence the criteria that limit the
consideration of storms that are outside of the lat-
itudinal band prescribed, over land, or have a deep
warm- or cold-core structure. Systems that begin as ro-
bust tropical or extratropical cyclones have been re-
jected because they are deemed in this methodology to
only be able to attain the hybrid structure via extra-
tropical transition (ET; Hart and Evans 2001) or tropi-
cal transition (Davis and Bosart 2003), respectively.
This is entirely consistent with the perspective of a
continuum of cyclone types.
This last criterion results from operational forecasting
considerations. As alluded to above, Davis and Bosart
(2003, 2004) have identified mechanisms by which At-
lantic extratropical systems may transition into tropical
cyclones after moving south into the subtropics. The same
mechanism operates in the transition from a subtropical
to tropical cyclone, but the difference in origin is im-
portant. An extratropical storm that drifts into the
subtropics and becomes warm cored—or a TC under-
going extratropical transition (and thereby gaining a
hybrid structure)—may already have gale-force winds.
Thus, these systems are already likely to be monitored
by forecasters, limiting the chance of a ‘‘surprise’’
storm. This is the rationale for restricting the cases
studied here to essentially in situ formation of an ST
(hybrid structure with gales); storms initially identified
FIG. 3. Infrared imagery from GOES east of Hurricane Karen (2001) at the following times: (a) 1800 UTC 10 Oct, (b) 1800 UTC 11 Oct,
(c) 1800 UTC 12 Oct, and (d) 1800 UTC 13 Oct 2001.
3580 J O U R N A L O F C L I M A T E VOLUME 22
as purely cold- or warm-cored were retained in the da-
taset only if they developed a hybrid structure in less
then one diurnal period (i.e., ,24 h).
3. Diagnostics of processes potentially important toST genesis and maintenance
Given that ST appear to develop in an environment
that has aspects of both tropical and extratropical forcing
(see this in later sections), a range of diagnostics is used
to assess the relative likely importance of both ‘‘tropical’’
and ‘‘baroclinic’’ forcings in the developing ST system.
a. Maintenance of deep convection
In light of the importance of sea surface temperature
(SST) to tropical cyclones, this study will also investi-
gate the effects of SST on subtropical cyclogenesis. It is
postulated here that the sustenance of deep convection
is key to the process of subtropical cyclogenesis. The
development of airmass cumulonimbi is partially lim-
ited by SST over the oceans (Graham and Barnett
1987). As a result, warm SST had been well documented
as a necessary (but not sufficient) condition for tropical
cyclogenesis, which depends on abundant convection
(Ooyama 1963; Gray 1968; McBride and Zehr 1981;
Emanuel 1986, 1995). Davis and Bosart (2003) indicate
that tropical cyclogenesis of baroclinic origin is most
prevalent over SST . 268C.
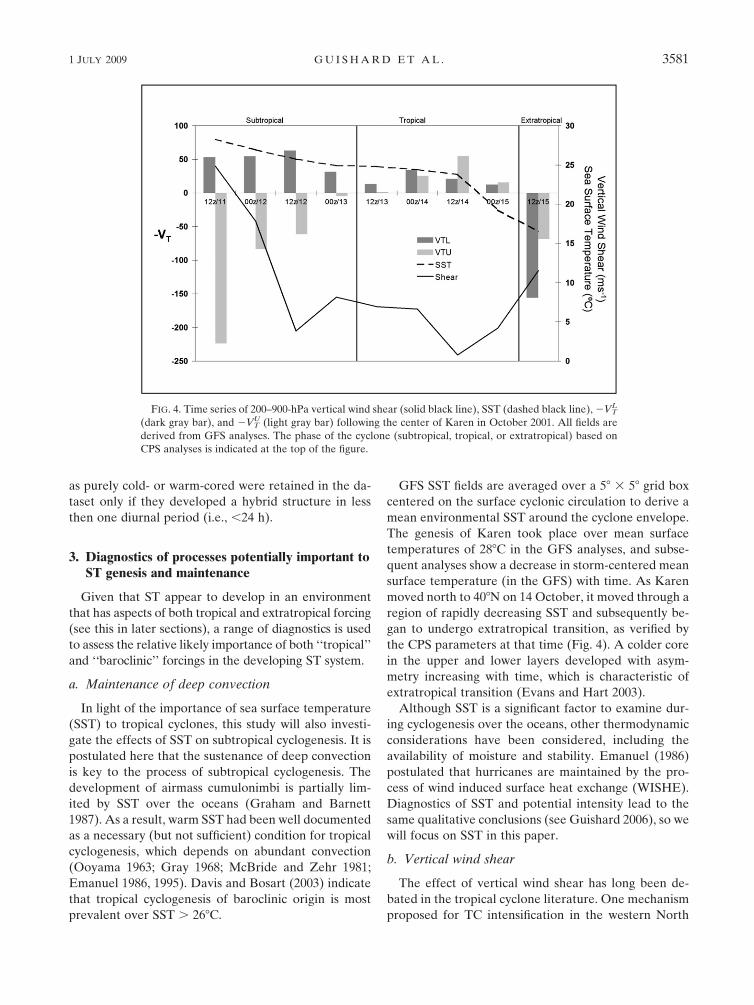
GFS SST fields are averaged over a 58 3 58 grid box
centered on the surface cyclonic circulation to derive a
mean environmental SST around the cyclone envelope.
The genesis of Karen took place over mean surface
temperatures of 288C in the GFS analyses, and subse-
quent analyses show a decrease in storm-centered mean
surface temperature (in the GFS) with time. As Karen
moved north to 408N on 14 October, it moved through a
region of rapidly decreasing SST and subsequently be-
gan to undergo extratropical transition, as verified by
the CPS parameters at that time (Fig. 4). A colder core
in the upper and lower layers developed with asym-
metry increasing with time, which is characteristic of
extratropical transition (Evans and Hart 2003).
Although SST is a significant factor to examine dur-
ing cyclogenesis over the oceans, other thermodynamic
considerations have been considered, including the
availability of moisture and stability. Emanuel (1986)
postulated that hurricanes are maintained by the pro-
cess of wind induced surface heat exchange (WISHE).
Diagnostics of SST and potential intensity lead to the
same qualitative conclusions (see Guishard 2006), so we
will focus on SST in this paper.
b. Vertical wind shear
The effect of vertical wind shear has long been de-
bated in the tropical cyclone literature. One mechanism
proposed for TC intensification in the western North
FIG. 4. Time series of 200–900-hPa vertical wind shear (solid black line), SST (dashed black line), 2VTL
(dark gray bar), and 2VTU (light gray bar) following the center of Karen in October 2001. All fields are
derived from GFS analyses. The phase of the cyclone (subtropical, tropical, or extratropical) based on
CPS analyses is indicated at the top of the figure.
1 JULY 2009 G U I S H A R D E T A L . 3581
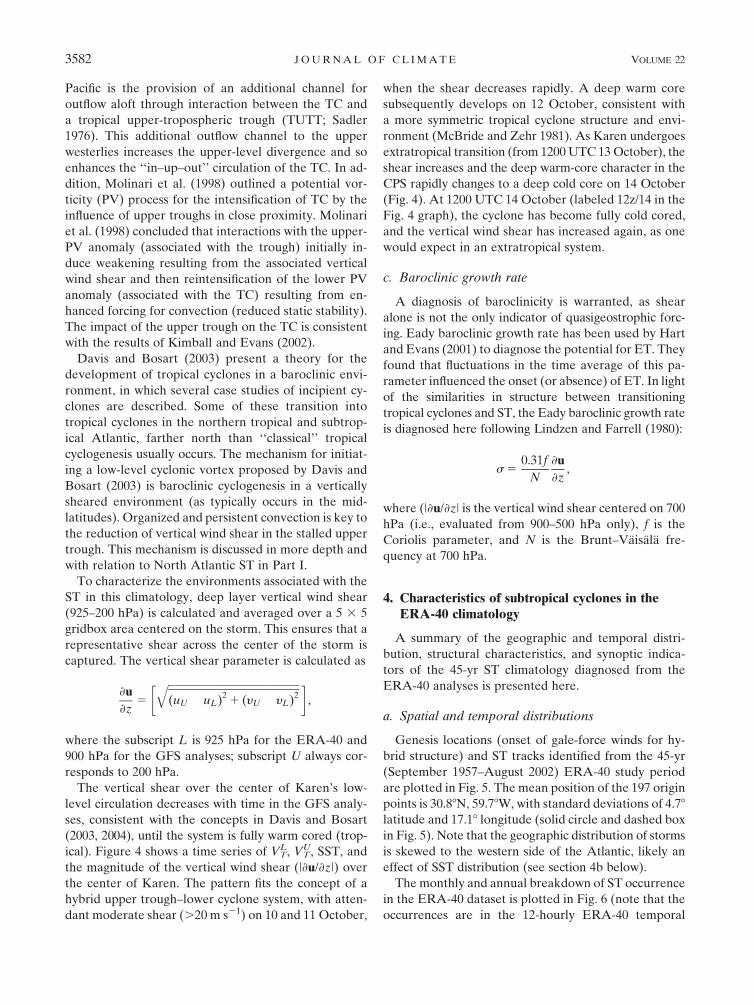
Pacific is the provision of an additional channel for
outflow aloft through interaction between the TC and
a tropical upper-tropospheric trough (TUTT; Sadler
1976). This additional outflow channel to the upper
westerlies increases the upper-level divergence and so
enhances the ‘‘in–up–out’’ circulation of the TC. In ad-
dition, Molinari et al. (1998) outlined a potential vor-
ticity (PV) process for the intensification of TC by the
influence of upper troughs in close proximity. Molinari
et al. (1998) concluded that interactions with the upper-
PV anomaly (associated with the trough) initially in-
duce weakening resulting from the associated vertical
wind shear and then reintensification of the lower PV
anomaly (associated with the TC) resulting from en-
hanced forcing for convection (reduced static stability).
The impact of the upper trough on the TC is consistent
with the results of Kimball and Evans (2002).
Davis and Bosart (2003) present a theory for the
development of tropical cyclones in a baroclinic envi-
ronment, in which several case studies of incipient cy-
clones are described. Some of these transition into
tropical cyclones in the northern tropical and subtrop-
ical Atlantic, farther north than ‘‘classical’’ tropical
cyclogenesis usually occurs. The mechanism for initiat-
ing a low-level cyclonic vortex proposed by Davis and
Bosart (2003) is baroclinic cyclogenesis in a vertically
sheared environment (as typically occurs in the mid-
latitudes). Organized and persistent convection is key to
the reduction of vertical wind shear in the stalled upper
trough. This mechanism is discussed in more depth and
with relation to North Atlantic ST in Part I.
To characterize the environments associated with the
ST in this climatology, deep layer vertical wind shear
(925–200 hPa) is calculated and averaged over a 5 3 5
gridbox area centered on the storm. This ensures that a
representative shear across the center of the storm is
captured. The vertical shear parameter is calculated as
›u
›z5
ffiffiffiffiffiffiffiffiffiffiffiffiffiffiffiffiffiffiffiffiffiffiffiffiffiffiffiffiffiffiffiffiffiffiffiffiffiffiffiffiffiffiffiffiffiffiffiffiffiffi(uU � uL)2
1 (yU � yL)2
q� �,
where the subscript L is 925 hPa for the ERA-40 and
900 hPa for the GFS analyses; subscript U always cor-
responds to 200 hPa.
The vertical shear over the center of Karen’s low-
level circulation decreases with time in the GFS analy-
ses, consistent with the concepts in Davis and Bosart
(2003, 2004), until the system is fully warm cored (trop-
ical). Figure 4 shows a time series of VTL, VT
U, SST, and
the magnitude of the vertical wind shear (|›u/›z|) over
the center of Karen. The pattern fits the concept of a
hybrid upper trough–lower cyclone system, with atten-
dant moderate shear (.20 m s21) on 10 and 11 October,
when the shear decreases rapidly. A deep warm core
subsequently develops on 12 October, consistent with
a more symmetric tropical cyclone structure and envi-
ronment (McBride and Zehr 1981). As Karen undergoes
extratropical transition (from 1200 UTC 13 October), the
shear increases and the deep warm-core character in the
CPS rapidly changes to a deep cold core on 14 October
(Fig. 4). At 1200 UTC 14 October (labeled 12z/14 in the
Fig. 4 graph), the cyclone has become fully cold cored,
and the vertical wind shear has increased again, as one
would expect in an extratropical system.
c. Baroclinic growth rate
A diagnosis of baroclinicity is warranted, as shear
alone is not the only indicator of quasigeostrophic forc-
ing. Eady baroclinic growth rate has been used by Hart
and Evans (2001) to diagnose the potential for ET. They
found that fluctuations in the time average of this pa-
rameter influenced the onset (or absence) of ET. In light
of the similarities in structure between transitioning
tropical cyclones and ST, the Eady baroclinic growth rate
is diagnosed here following Lindzen and Farrell (1980):
s 50.31f
N
›u
›z,
where (|›u/›z| is the vertical wind shear centered on 700
hPa (i.e., evaluated from 900–500 hPa only), f is the
Coriolis parameter, and N is the Brunt–Vaisala fre-
quency at 700 hPa.
4. Characteristics of subtropical cyclones in theERA-40 climatology
A summary of the geographic and temporal distri-
bution, structural characteristics, and synoptic indica-
tors of the 45-yr ST climatology diagnosed from the
ERA-40 analyses is presented here.
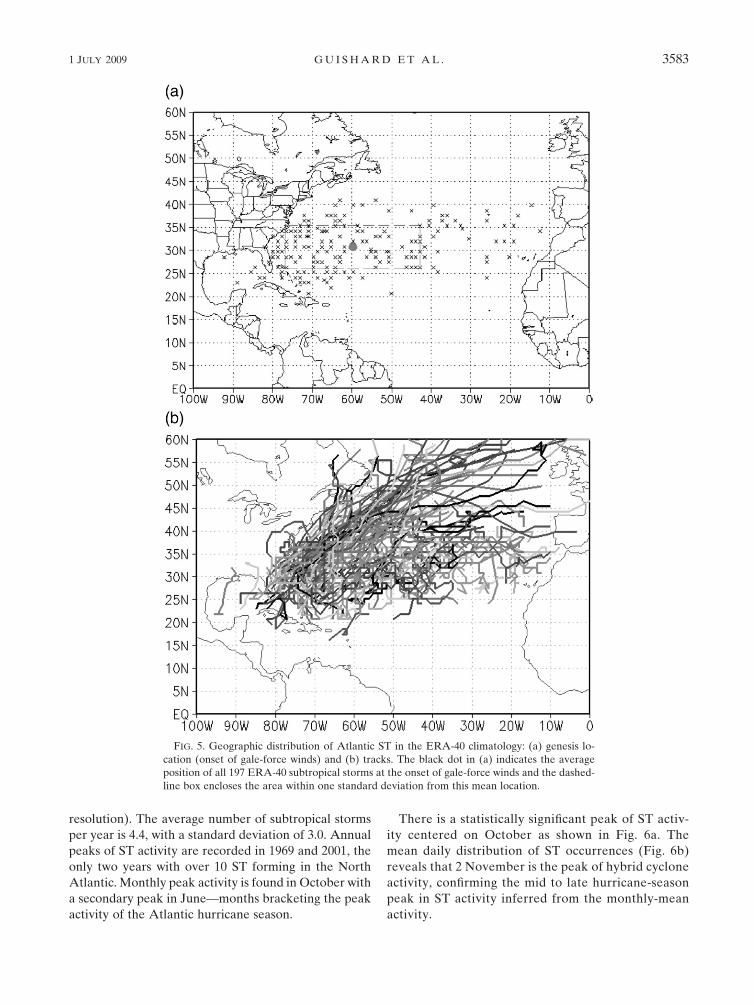
a. Spatial and temporal distributions
Genesis locations (onset of gale-force winds for hy-
brid structure) and ST tracks identified from the 45-yr
(September 1957–August 2002) ERA-40 study period
are plotted in Fig. 5. The mean position of the 197 origin
points is 30.88N, 59.78W, with standard deviations of 4.78
latitude and 17.18 longitude (solid circle and dashed box
in Fig. 5). Note that the geographic distribution of storms
is skewed to the western side of the Atlantic, likely an
effect of SST distribution (see section 4b below).
The monthly and annual breakdown of ST occurrence
in the ERA-40 dataset is plotted in Fig. 6 (note that the
occurrences are in the 12-hourly ERA-40 temporal
3582 J O U R N A L O F C L I M A T E VOLUME 22
resolution). The average number of subtropical storms
per year is 4.4, with a standard deviation of 3.0. Annual
peaks of ST activity are recorded in 1969 and 2001, the
only two years with over 10 ST forming in the North
Atlantic. Monthly peak activity is found in October with
a secondary peak in June—months bracketing the peak
activity of the Atlantic hurricane season.
There is a statistically significant peak of ST activ-
ity centered on October as shown in Fig. 6a. The
mean daily distribution of ST occurrences (Fig. 6b)
reveals that 2 November is the peak of hybrid cyclone
activity, confirming the mid to late hurricane-season
peak in ST activity inferred from the monthly-mean
activity.
FIG. 5. Geographic distribution of Atlantic ST in the ERA-40 climatology: (a) genesis lo-
cation (onset of gale-force winds) and (b) tracks. The black dot in (a) indicates the average
position of all 197 ERA-40 subtropical storms at the onset of gale-force winds and the dashed-
line box encloses the area within one standard deviation from this mean location.
1 JULY 2009 G U I S H A R D E T A L . 3583

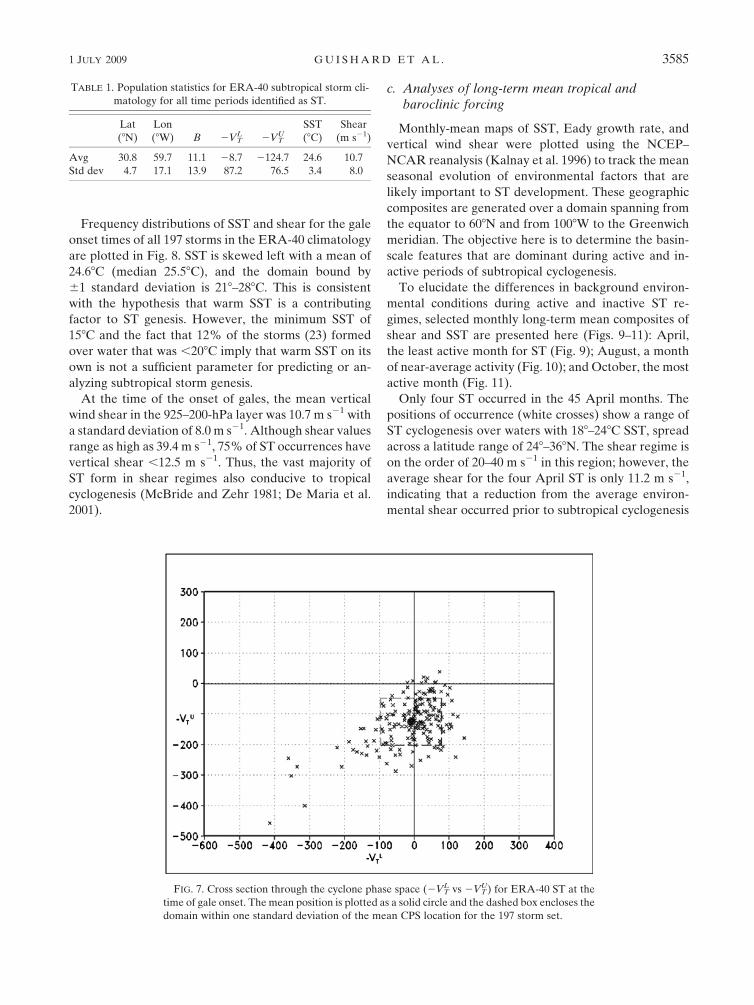
b. CPS, SST, and shear characteristics
Statistics of the temporal, spatial, CPS, shear, and SST
characteristics of all storms in the ERA-40 climatology
are presented in Table 1. The CPS thermal wind pa-
rameters for the genesis times of all 197 ST detected in
the ERA-40 reanalyses are plotted in Fig. 7, along with
the mean and the domain of 61 standard deviation. The
mean thermal signature of these cyclones is that of a
neutral lower-tropospheric anomaly and a cold upper
troposphere. The number of warm-lower-core structure
cyclones is 113, accounting for 57% of the total. Despite
this, the mean cyclone structure has a 2VTL value of 28.7
because it is heavily influenced by several outliers evi-
dent in Fig. 7, including one system that had gales form
with both 2VTL and 2VT
U less than 2400, indicating a
deep cold core. These outliers were retained in the da-
taset because they developed a hybrid structure in less
than one diurnal period (i.e., ,24 h) and obtained gale-
force winds while in their hybrid phase.
FIG. 6. Temporal distribution of ST occurrence: (a) Year vs month gridded plot of occurrence
of subtropical storms. Monthly and annual histogram distributions are plotted below and to the
left of the main plot, respectively. (b) Daily distribution of all ST occurrences in the 45-yr
dataset (histogram) and 5-day running average (black line).
3584 J O U R N A L O F C L I M A T E VOLUME 22
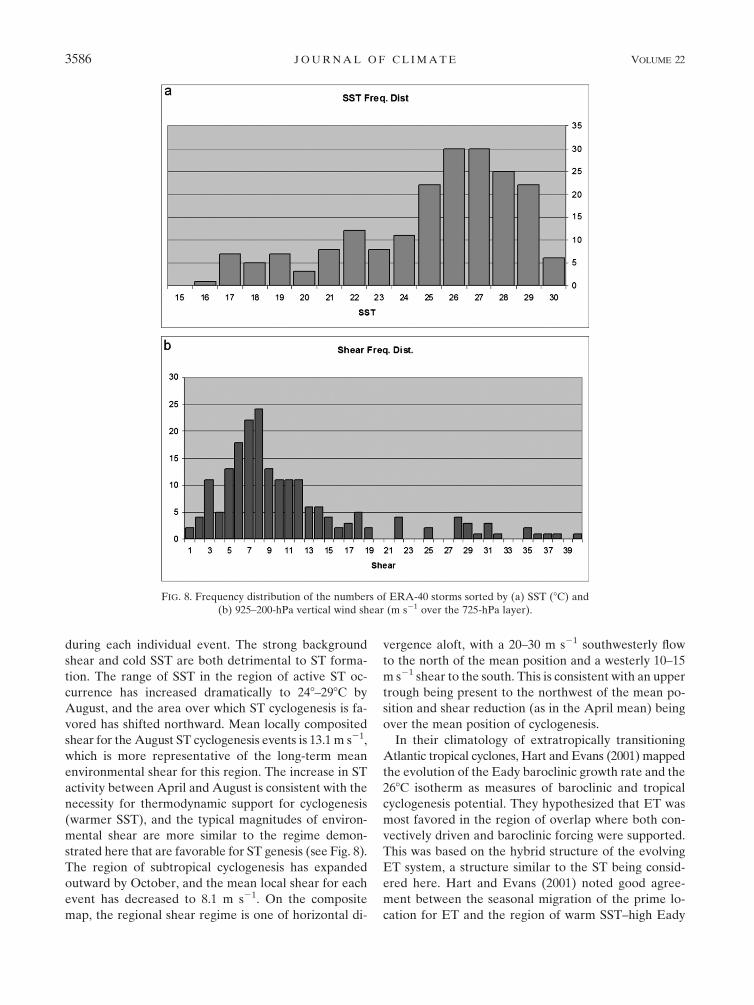
Frequency distributions of SST and shear for the gale
onset times of all 197 storms in the ERA-40 climatology
are plotted in Fig. 8. SST is skewed left with a mean of
24.68C (median 25.58C), and the domain bound by
61 standard deviation is 218–288C. This is consistent
with the hypothesis that warm SST is a contributing
factor to ST genesis. However, the minimum SST of
158C and the fact that 12% of the storms (23) formed
over water that was ,208C imply that warm SST on its
own is not a sufficient parameter for predicting or an-
alyzing subtropical storm genesis.
At the time of the onset of gales, the mean vertical
wind shear in the 925–200-hPa layer was 10.7 m s21 with
a standard deviation of 8.0 m s21. Although shear values
range as high as 39.4 m s21, 75% of ST occurrences have
vertical shear ,12.5 m s21. Thus, the vast majority of
ST form in shear regimes also conducive to tropical
cyclogenesis (McBride and Zehr 1981; De Maria et al.
2001).
c. Analyses of long-term mean tropical andbaroclinic forcing
Monthly-mean maps of SST, Eady growth rate, and
vertical wind shear were plotted using the NCEP–
NCAR reanalysis (Kalnay et al. 1996) to track the mean
seasonal evolution of environmental factors that are
likely important to ST development. These geographic
composites are generated over a domain spanning from
the equator to 608N and from 1008W to the Greenwich
meridian. The objective here is to determine the basin-
scale features that are dominant during active and in-
active periods of subtropical cyclogenesis.
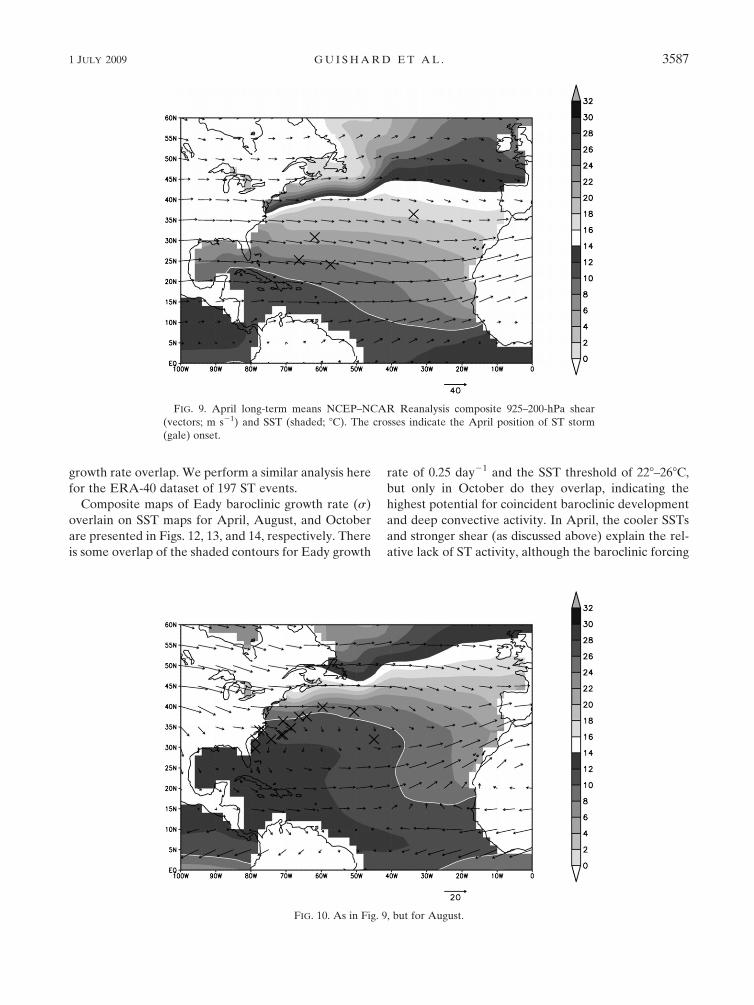
To elucidate the differences in background environ-
mental conditions during active and inactive ST re-
gimes, selected monthly long-term mean composites of
shear and SST are presented here (Figs. 9–11): April,
the least active month for ST (Fig. 9); August, a month
of near-average activity (Fig. 10); and October, the most
active month (Fig. 11).
Only four ST occurred in the 45 April months. The
positions of occurrence (white crosses) show a range of
ST cyclogenesis over waters with 188–248C SST, spread
across a latitude range of 248–368N. The shear regime is
on the order of 20–40 m s21 in this region; however, the
average shear for the four April ST is only 11.2 m s21,
indicating that a reduction from the average environ-
mental shear occurred prior to subtropical cyclogenesis
TABLE 1. Population statistics for ERA-40 subtropical storm cli-
matology for all time periods identified as ST.
Lat
(8N)
Lon
(8W) B 2VTL 2VT
USST
(8C)
Shear
(m s21)
Avg 30.8 59.7 11.1 28.7 2124.7 24.6 10.7
Std dev 4.7 17.1 13.9 87.2 76.5 3.4 8.0
FIG. 7. Cross section through the cyclone phase space (2VTL vs 2VT
U) for ERA-40 ST at the
time of gale onset. The mean position is plotted as a solid circle and the dashed box encloses the
domain within one standard deviation of the mean CPS location for the 197 storm set.
1 JULY 2009 G U I S H A R D E T A L . 3585
during each individual event. The strong background
shear and cold SST are both detrimental to ST forma-
tion. The range of SST in the region of active ST oc-
currence has increased dramatically to 248–298C by
August, and the area over which ST cyclogenesis is fa-
vored has shifted northward. Mean locally composited
shear for the August ST cyclogenesis events is 13.1 m s21,
which is more representative of the long-term mean
environmental shear for this region. The increase in ST
activity between April and August is consistent with the
necessity for thermodynamic support for cyclogenesis
(warmer SST), and the typical magnitudes of environ-
mental shear are more similar to the regime demon-
strated here that are favorable for ST genesis (see Fig. 8).
The region of subtropical cyclogenesis has expanded
outward by October, and the mean local shear for each
event has decreased to 8.1 m s21. On the composite
map, the regional shear regime is one of horizontal di-
vergence aloft, with a 20–30 m s21 southwesterly flow
to the north of the mean position and a westerly 10–15
m s21 shear to the south. This is consistent with an upper
trough being present to the northwest of the mean po-
sition and shear reduction (as in the April mean) being
over the mean position of cyclogenesis.
In their climatology of extratropically transitioning
Atlantic tropical cyclones, Hart and Evans (2001) mapped
the evolution of the Eady baroclinic growth rate and the
268C isotherm as measures of baroclinic and tropical
cyclogenesis potential. They hypothesized that ET was
most favored in the region of overlap where both con-
vectively driven and baroclinic forcing were supported.
This was based on the hybrid structure of the evolving
ET system, a structure similar to the ST being consid-
ered here. Hart and Evans (2001) noted good agree-
ment between the seasonal migration of the prime lo-
cation for ET and the region of warm SST–high Eady
FIG. 8. Frequency distribution of the numbers of ERA-40 storms sorted by (a) SST (8C) and
(b) 925–200-hPa vertical wind shear (m s21 over the 725-hPa layer).
3586 J O U R N A L O F C L I M A T E VOLUME 22
growth rate overlap. We perform a similar analysis here
for the ERA-40 dataset of 197 ST events.
Composite maps of Eady baroclinic growth rate (s)
overlain on SST maps for April, August, and October
are presented in Figs. 12, 13, and 14, respectively. There
is some overlap of the shaded contours for Eady growth
rate of 0.25 day21 and the SST threshold of 228–268C,
but only in October do they overlap, indicating the
highest potential for coincident baroclinic development
and deep convective activity. In April, the cooler SSTs
and stronger shear (as discussed above) explain the rel-
ative lack of ST activity, although the baroclinic forcing
FIG. 9. April long-term means NCEP–NCAR Reanalysis composite 925–200-hPa shear
(vectors; m s21) and SST (shaded; 8C). The crosses indicate the April position of ST storm
(gale) onset.
FIG. 10. As in Fig. 9, but for August.
1 JULY 2009 G U I S H A R D E T A L . 3587
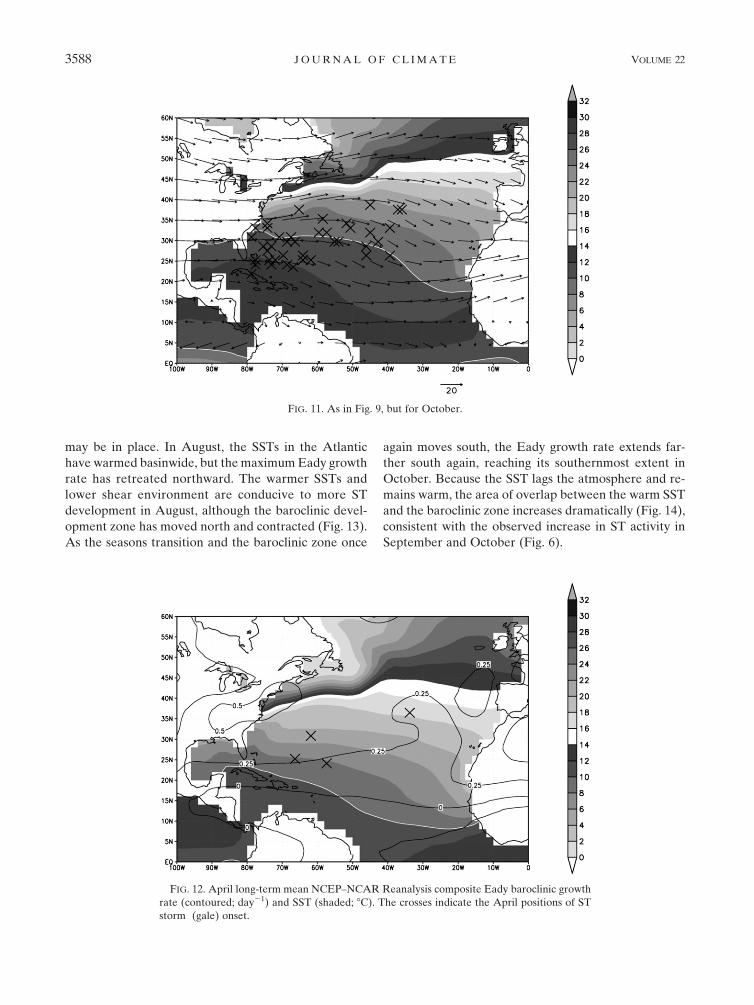
may be in place. In August, the SSTs in the Atlantic
have warmed basinwide, but the maximum Eady growth
rate has retreated northward. The warmer SSTs and
lower shear environment are conducive to more ST
development in August, although the baroclinic devel-
opment zone has moved north and contracted (Fig. 13).
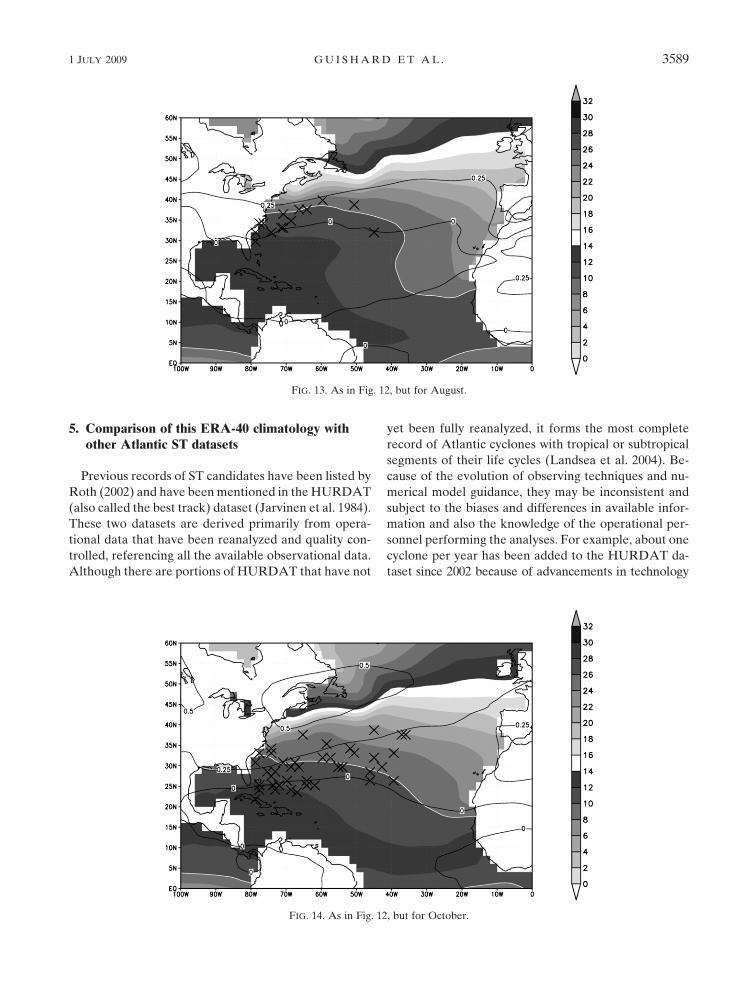
As the seasons transition and the baroclinic zone once
again moves south, the Eady growth rate extends far-
ther south again, reaching its southernmost extent in
October. Because the SST lags the atmosphere and re-
mains warm, the area of overlap between the warm SST
and the baroclinic zone increases dramatically (Fig. 14),
consistent with the observed increase in ST activity in
September and October (Fig. 6).
FIG. 11. As in Fig. 9, but for October.
FIG. 12. April long-term mean NCEP–NCAR Reanalysis composite Eady baroclinic growth
rate (contoured; day21) and SST (shaded; 8C). The crosses indicate the April positions of ST
storm (gale) onset.
3588 J O U R N A L O F C L I M A T E VOLUME 22
5. Comparison of this ERA-40 climatology withother Atlantic ST datasets
Previous records of ST candidates have been listed by
Roth (2002) and have been mentioned in the HURDAT
(also called the best track) dataset (Jarvinen et al. 1984).
These two datasets are derived primarily from opera-
tional data that have been reanalyzed and quality con-
trolled, referencing all the available observational data.
Although there are portions of HURDAT that have not
yet been fully reanalyzed, it forms the most complete
record of Atlantic cyclones with tropical or subtropical
segments of their life cycles (Landsea et al. 2004). Be-
cause of the evolution of observing techniques and nu-
merical model guidance, they may be inconsistent and
subject to the biases and differences in available infor-
mation and also the knowledge of the operational per-
sonnel performing the analyses. For example, about one
cyclone per year has been added to the HURDAT da-
taset since 2002 because of advancements in technology
FIG. 13. As in Fig. 12, but for August.
FIG. 14. As in Fig. 12, but for October.
1 JULY 2009 G U I S H A R D E T A L . 3589
and analysis methods (Landsea et al. 2007). Although the
NOAA–NWS policy for classification of ST may have
been the same since 1975 (HP75), the policy for naming
or issuing advisories on them has not been consistent.
Indeed, there are no named storms corresponding to ST
found in the ERA-40 analyses for 11 out of 43 active ST
years and, at most, 2/3 of the ERA-40 ST correspond to
storms recorded in HURDAT in any year (Guishard
2006). However, it should be noted that the criteria for
inclusion in each dataset mentioned here are different.
The intent of this study is to use model reanalyses and
the CPS to isolate cyclones that are unambiguously ST
via an objective, consistent, and largely automated
method. The techniques used for the reanalysis of
HURDAT are not the same, and therefore it is to be
expected that the overlap between the two datasets is
not perfect. However, as a reference dataset, HURDAT
is the most appropriate to make comparisons against.
It is not the intention of the authors to criticize the
efforts by operational forecasters and observers to an-
alyze and predict a rapidly evolving real-time system
accurately. Ongoing efforts to reanalyze the historical
tropical cyclone dataset in the Atlantic (Landsea et al.
2004) and efforts to normalize satellite-based records of
tropical cyclone winds (Kossin et al. 2007) aim to ad-
dress the inconsistencies in methodology that may have
impacted the current historical record. The methodol-
ogy presented here for identifying and classifying ST is
being incorporated into the Atlantic HURDAT rean-
alysis process.
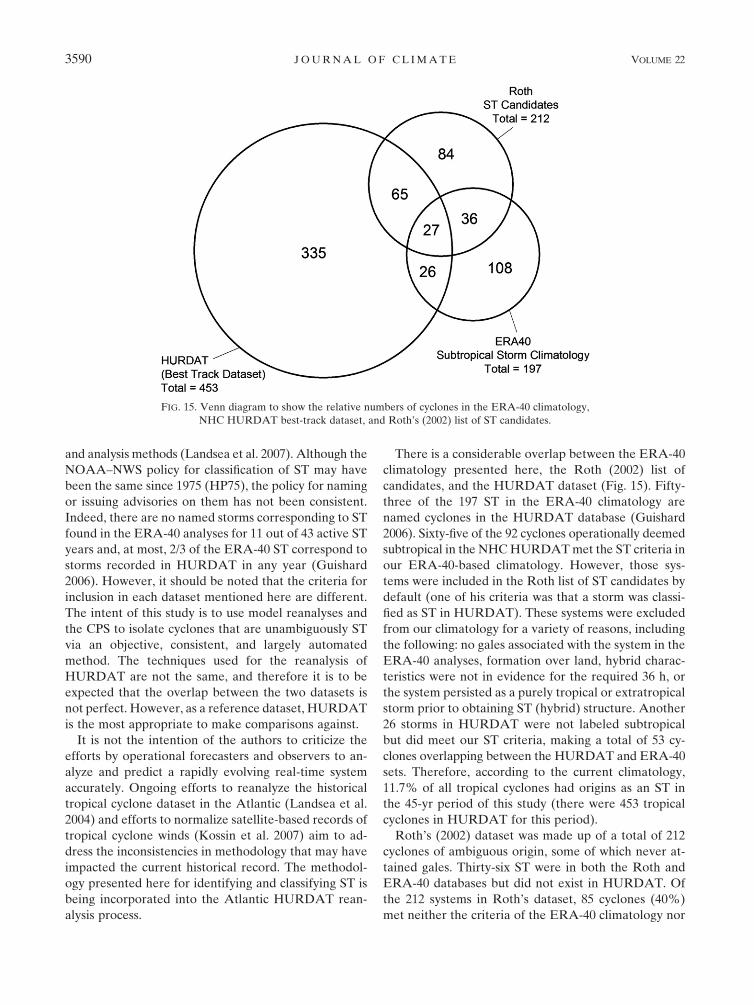
There is a considerable overlap between the ERA-40
climatology presented here, the Roth (2002) list of
candidates, and the HURDAT dataset (Fig. 15). Fifty-
three of the 197 ST in the ERA-40 climatology are
named cyclones in the HURDAT database (Guishard
2006). Sixty-five of the 92 cyclones operationally deemed
subtropical in the NHC HURDAT met the ST criteria in
our ERA-40-based climatology. However, those sys-
tems were included in the Roth list of ST candidates by
default (one of his criteria was that a storm was classi-
fied as ST in HURDAT). These systems were excluded
from our climatology for a variety of reasons, including
the following: no gales associated with the system in the
ERA-40 analyses, formation over land, hybrid charac-
teristics were not in evidence for the required 36 h, or
the system persisted as a purely tropical or extratropical
storm prior to obtaining ST (hybrid) structure. Another
26 storms in HURDAT were not labeled subtropical
but did meet our ST criteria, making a total of 53 cy-
clones overlapping between the HURDAT and ERA-40
sets. Therefore, according to the current climatology,
11.7% of all tropical cyclones had origins as an ST in
the 45-yr period of this study (there were 453 tropical
cyclones in HURDAT for this period).
Roth’s (2002) dataset was made up of a total of 212
cyclones of ambiguous origin, some of which never at-
tained gales. Thirty-six ST were in both the Roth and
ERA-40 databases but did not exist in HURDAT. Of
the 212 systems in Roth’s dataset, 85 cyclones (40%)
met neither the criteria of the ERA-40 climatology nor
FIG. 15. Venn diagram to show the relative numbers of cyclones in the ERA-40 climatology,
NHC HURDAT best-track dataset, and Roth’s (2002) list of ST candidates.
3590 J O U R N A L O F C L I M A T E VOLUME 22
the criteria of the HURDAT. Considering that Roth’s
list includes some cyclones gleaned from the surface
analyses in the absence of satellite imagery (in the pre-
satellite era), some classified from satellite imagery in
areas of sparse surface or upper-air observations, and all
HURDAT ST, it is unsurprising that a largely automated
and consistent method should filter out such a high pro-
portion of the cyclones in that dataset. The overlap for all
three datasets was only 27 storms (Fig. 15).
In the context of the historical ST record, the objec-
tive ERA-40 climatology presented here leads to sev-
eral conclusions. The HURDAT records include 118
systems that were acknowledged as ST of the 453 total
storms recorded for this 45-yr period; however, the
analyses presented here imply that 65 of these ST are
not identified in the ERA-40 ST dataset (mainly be-
cause of the lack of a hybrid structure), leaving only
53/453, or 12%, of the ST identified in both the HURDAT
and the current ERA-40 study. Inclusion of the 144
newly identified ST in the ERA-40 climatology changes
this statistic dramatically: now 197 ST are recorded in a
total storm set of 597 (the original 453 best-track storms
and the additional 144 ST newly identified here). This
amounts to 33% of the revised (HURDAT plus inde-
pendent ERA-40 cases) storm set being classified as
ST—certainly a nonnegligible fraction of the warm-
season storms in the Atlantic basin!
6. Subtropical cyclones as a tropical cyclogenesissource
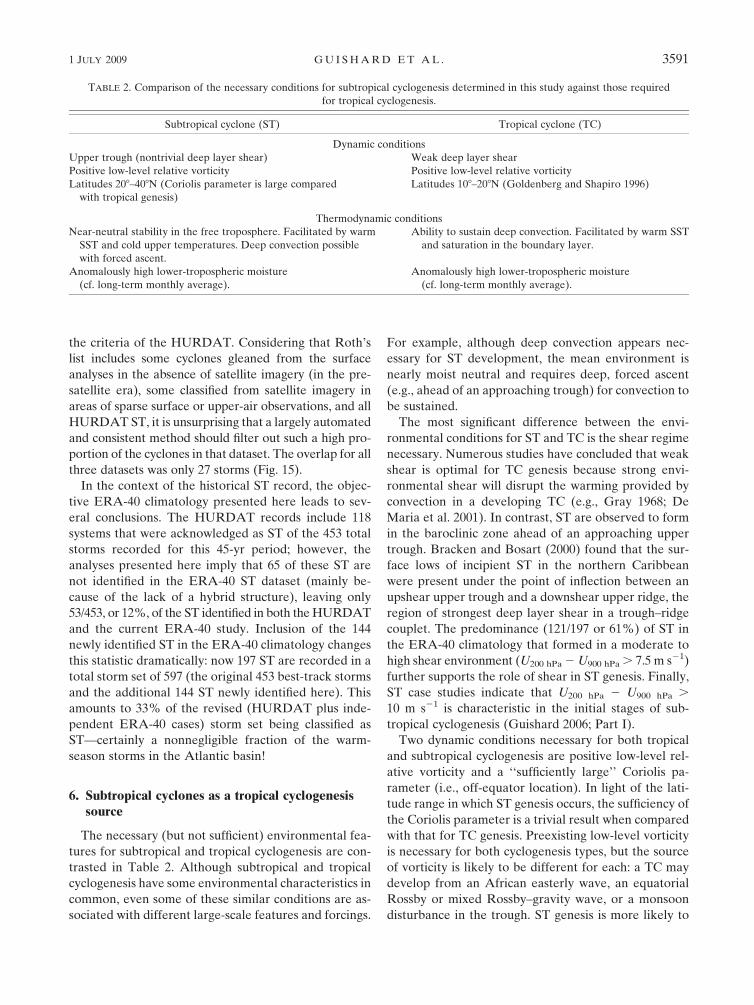
The necessary (but not sufficient) environmental fea-
tures for subtropical and tropical cyclogenesis are con-
trasted in Table 2. Although subtropical and tropical
cyclogenesis have some environmental characteristics in
common, even some of these similar conditions are as-
sociated with different large-scale features and forcings.
For example, although deep convection appears nec-
essary for ST development, the mean environment is
nearly moist neutral and requires deep, forced ascent
(e.g., ahead of an approaching trough) for convection to
be sustained.
The most significant difference between the envi-
ronmental conditions for ST and TC is the shear regime
necessary. Numerous studies have concluded that weak
shear is optimal for TC genesis because strong envi-
ronmental shear will disrupt the warming provided by
convection in a developing TC (e.g., Gray 1968; De
Maria et al. 2001). In contrast, ST are observed to form
in the baroclinic zone ahead of an approaching upper
trough. Bracken and Bosart (2000) found that the sur-
face lows of incipient ST in the northern Caribbean
were present under the point of inflection between an
upshear upper trough and a downshear upper ridge, the
region of strongest deep layer shear in a trough–ridge
couplet. The predominance (121/197 or 61%) of ST in
the ERA-40 climatology that formed in a moderate to
high shear environment (U200 hPa 2 U900 hPa . 7.5 m s21)
further supports the role of shear in ST genesis. Finally,
ST case studies indicate that U200 hPa 2 U900 hPa .
10 m s21 is characteristic in the initial stages of sub-
tropical cyclogenesis (Guishard 2006; Part I).
Two dynamic conditions necessary for both tropical
and subtropical cyclogenesis are positive low-level rel-
ative vorticity and a ‘‘sufficiently large’’ Coriolis pa-
rameter (i.e., off-equator location). In light of the lati-
tude range in which ST genesis occurs, the sufficiency of
the Coriolis parameter is a trivial result when compared
with that for TC genesis. Preexisting low-level vorticity
is necessary for both cyclogenesis types, but the source
of vorticity is likely to be different for each: a TC may
develop from an African easterly wave, an equatorial
Rossby or mixed Rossby–gravity wave, or a monsoon
disturbance in the trough. ST genesis is more likely to
TABLE 2. Comparison of the necessary conditions for subtropical cyclogenesis determined in this study against those required
for tropical cyclogenesis.
Subtropical cyclone (ST) Tropical cyclone (TC)
Dynamic conditions
Upper trough (nontrivial deep layer shear) Weak deep layer shear
Positive low-level relative vorticity Positive low-level relative vorticity
Latitudes 208–408N (Coriolis parameter is large compared
with tropical genesis)
Latitudes 108–208N (Goldenberg and Shapiro 1996)
Thermodynamic conditions
Near-neutral stability in the free troposphere. Facilitated by warm
SST and cold upper temperatures. Deep convection possible
with forced ascent.
Ability to sustain deep convection. Facilitated by warm SST
and saturation in the boundary layer.
Anomalously high lower-tropospheric moisture
(cf. long-term monthly average).
Anomalously high lower-tropospheric moisture
(cf. long-term monthly average).
1 JULY 2009 G U I S H A R D E T A L . 3591
occur on a shear zone associated with an old frontal
boundary linked to the upper trough, which is forcing
the cyclogenesis. Combined with the higher levels of
planetary vorticity ( f is on the order of 1024 s21 in the
subtropics), this represents an increase of up to an order
in magnitude in preexisting absolute vorticity in ST
versus TC genesis environments. Further, the incipient
vortex in the ST genesis is larger in scale than the in-
cipient TC (Guishard 2006).
In their study, Hendricks et al. (2004) investigate the
role of ‘‘vortical’’ hot towers during the development of
Hurricane Diana in 1984, a well-documented storm of
baroclinic origin (Davis and Bosart 2001, 2002; Bosart
and Bartlo 1991). They conclude that the vortical hot
towers associated with cumulonimbus convection play
dual roles in the genesis of Diana: 1) preconditioning of
the environment by generating positive low-level PV as
they pulse and 2) direct contribution to the mean vor-
ticity of the incipient cyclone through vortex merger.
This view of cyclogenesis is appropriate for both TC and
ST; as foreshadowed above, the difference is the forcing
for the convection. In the case of TC, warm SST allow
enough convection through the generation of localized
CAPE by near-surface parcel heating and moistening
and the absence of disrupting deep layer vertical shear.
In the case of ST genesis, large-scale mass ascent of the
moist boundary layer air is induced through quasigeo-
strophic dynamic processes in the moderate vertical
shear ahead of an upper trough in the genesis region.
The associated forced ascent over relatively warm water
is associated with a region of weak static stability (and
large Rossby penetration depth), facilitating the devel-
opment of deep convection.
7. Summary
Application of a consistent set of criteria for ST in the
ERA-40 reanalyses has resulted in the identification of
197 North Atlantic ST in the 45-yr climatology. Sixty-
two percent of these ST were documented to form over
SST in excess of 258C. It is proposed that warm SSTs
contribute to the potential for ST cyclogenesis but the
associated SST threshold is lower than that for tropical
cyclogenesis (Gray 1968; Evans 1993). Warm SST is used
here as a proxy for the ability to sustain deep convection.
The convection is not only a source of warming, as it is in
TC, but also a means of reducing the vertical shear (Davis
and Bosart 2003) and increasing the Rossby penetration
depth so that the low-level warm core of the system may
be intensified. The mechanism for this reduction of shear
is described later in this section, from a PV perspective,
and further explanation is available in Davis and Bosart
(2003), who use absolute momentum arguments.
It is helpful to view ST in the context of the storm
continuum implied by the CPS. ST, when compared to
TC, generally have weaker surface circulations and are
typically warm cored and barotropic from the near-
surface levels up to approximately 500 hPa, whereas TC
may have very deep warm cores, extending upward
from the surface into the upper troposphere. Lacking
this deep warm core, an ST cannot fully develop and
maintain its circulation solely via surface fluxes as a TC
might (Emanuel 1986, 1995). However, an ST has an
additional source of dynamic support: the upper-level
PV anomaly (trough or cutoff low), which forces large-
scale ascent via geostrophic adjustment in a weakly sta-
ble large-scale environment. This deep vertical ascent in
a region of near-neutral stability forces convection and
resulting cyclonic development through WISHE, even
with only weak (relative to tropical cyclogenesis pro-
cesses) thermodynamic support from the sea surface
fluxes. In the absence of the upper trough or cutoff low,
an ST is unlikely to form. Hence, the presence of a cold
upper feature facilitating near-neutral stability consti-
tutes a necessary condition for subtropical cyclogenesis.
If an ST attains enough convection that the warm lower
core begins to extend upward past the midlevels and the
upper cyclone begins to erode, the system may become
self-sustaining through convection and transition into
a fully tropical cyclone. This is a mode of tropical
cyclogenesis (which may be defined as the production
of a deeply warm-cored, self-sustaining cyclone) that
has only recently begun to be explored in the literature
(e.g., Davis and Bosart 2003).
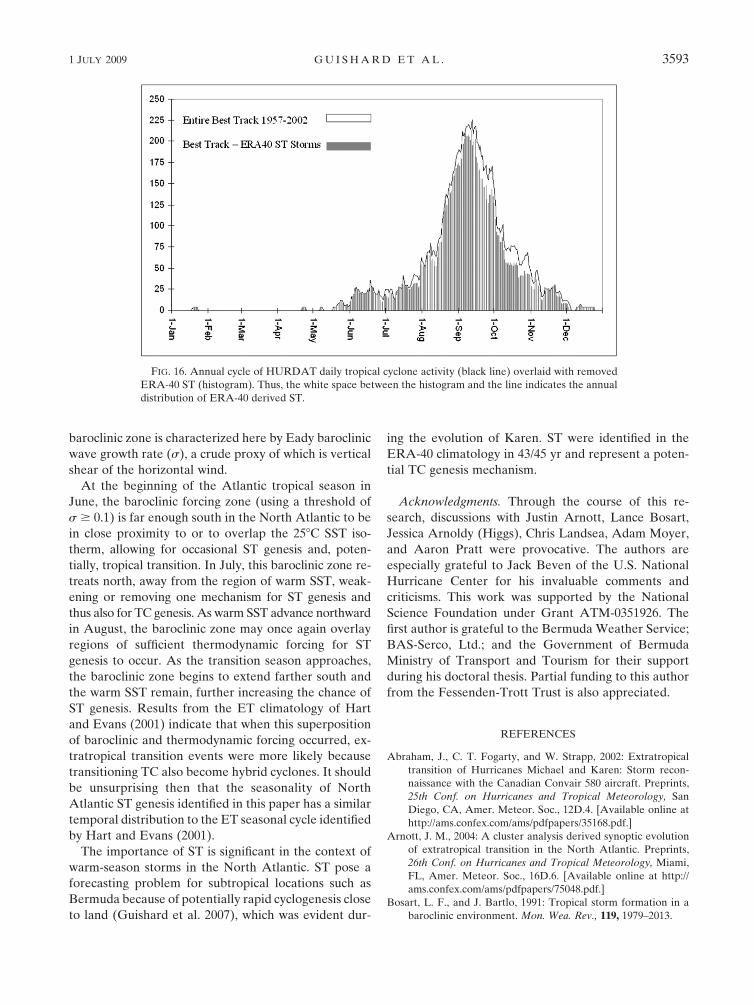
Despite the differences in identification techniques
between the ERA-40 and HURDAT datasets, it is in-
teresting to note the similarities between the ST cli-
matology compiled in this study and that of TC derived
from the NHC HURDAT best-track data. The daily
frequency of storm genesis from the NHC HURDAT
dataset is plotted in Fig. 16: the solid line is the total
number of storms (TC and ST) and the bars are the TC
only (i.e., ST from this climatology are excluded)—the
difference represents the ST in this climatology. ST
make a major contribution (12%) to the number of TC
developments in HURDAT, equivalent to one in eight
genesis events from an incipient ST disturbance. How-
ever, with the addition of 144 ST newly identified in this
climatology (i.e., not presently in HURDAT) and the
reclassification (as NOT ST) of 65 existing storms in
HURDAT, 197/597 storms in the newly combined da-
tabase are ST.
The number of ST is influenced each year by the
relative positions of the baroclinic zone and the ther-
modynamic forcing [characterized here using SST as
a proxy for Emanuel’s potential intensity (PI) The
3592 J O U R N A L O F C L I M A T E VOLUME 22
baroclinic zone is characterized here by Eady baroclinic
wave growth rate (s), a crude proxy of which is vertical
shear of the horizontal wind.
At the beginning of the Atlantic tropical season in
June, the baroclinic forcing zone (using a threshold of
s $ 0.1) is far enough south in the North Atlantic to be
in close proximity to or to overlap the 258C SST iso-
therm, allowing for occasional ST genesis and, poten-
tially, tropical transition. In July, this baroclinic zone re-
treats north, away from the region of warm SST, weak-
ening or removing one mechanism for ST genesis and
thus also for TC genesis. As warm SST advance northward
in August, the baroclinic zone may once again overlay
regions of sufficient thermodynamic forcing for ST
genesis to occur. As the transition season approaches,
the baroclinic zone begins to extend farther south and
the warm SST remain, further increasing the chance of
ST genesis. Results from the ET climatology of Hart
and Evans (2001) indicate that when this superposition
of baroclinic and thermodynamic forcing occurred, ex-
tratropical transition events were more likely because
transitioning TC also become hybrid cyclones. It should
be unsurprising then that the seasonality of North
Atlantic ST genesis identified in this paper has a similar
temporal distribution to the ET seasonal cycle identified
by Hart and Evans (2001).
The importance of ST is significant in the context of
warm-season storms in the North Atlantic. ST pose a
forecasting problem for subtropical locations such as
Bermuda because of potentially rapid cyclogenesis close
to land (Guishard et al. 2007), which was evident dur-
ing the evolution of Karen. ST were identified in the
ERA-40 climatology in 43/45 yr and represent a poten-
tial TC genesis mechanism.
Acknowledgments. Through the course of this re-
search, discussions with Justin Arnott, Lance Bosart,
Jessica Arnoldy (Higgs), Chris Landsea, Adam Moyer,
and Aaron Pratt were provocative. The authors are
especially grateful to Jack Beven of the U.S. National
Hurricane Center for his invaluable comments and
criticisms. This work was supported by the National
Science Foundation under Grant ATM-0351926. The
first author is grateful to the Bermuda Weather Service;
BAS-Serco, Ltd.; and the Government of Bermuda
Ministry of Transport and Tourism for their support
during his doctoral thesis. Partial funding to this author
from the Fessenden-Trott Trust is also appreciated.
REFERENCES
Abraham, J., C. T. Fogarty, and W. Strapp, 2002: Extratropical
transition of Hurricanes Michael and Karen: Storm recon-
naissance with the Canadian Convair 580 aircraft. Preprints,
25th Conf. on Hurricanes and Tropical Meteorology, San
Diego, CA, Amer. Meteor. Soc., 12D.4. [Available online at
http://ams.confex.com/ams/pdfpapers/35168.pdf.]
Arnott, J. M., 2004: A cluster analysis derived synoptic evolution
of extratropical transition in the North Atlantic. Preprints,
26th Conf. on Hurricanes and Tropical Meteorology, Miami,
FL, Amer. Meteor. Soc., 16D.6. [Available online at http://
ams.confex.com/ams/pdfpapers/75048.pdf.]
Bosart, L. F., and J. Bartlo, 1991: Tropical storm formation in a
baroclinic environment. Mon. Wea. Rev., 119, 1979–2013.
FIG. 16. Annual cycle of HURDAT daily tropical cyclone activity (black line) overlaid with removed
ERA-40 ST (histogram). Thus, the white space between the histogram and the line indicates the annual
distribution of ERA-40 derived ST.
1 JULY 2009 G U I S H A R D E T A L . 3593
Bracken, W. E., and L. F. Bosart, 2000: The role of synoptic-scale
flow during tropical cyclogenesis over the North Atlantic
Ocean. Mon. Wea. Rev., 128, 353–376.
Breen, S., and M. Mallon, 2001: There was enough warning. The
Royal Gazette, 13 October, 1.
Davis, C. A., and L. F. Bosart, 2001: Numerical simulations of the
genesis of Hurricane Diana (1984). Part I: Control simulation.
Mon. Wea. Rev., 129, 1859–1881.
——, and ——, 2002: Numerical simulations of the genesis of
Hurricane Diana (1984). Part II: Sensitivity of track and in-
tensity prediction. Mon. Wea. Rev., 130, 1100–1124.
——, and ——, 2003: Baroclinically induced tropical cyclogenesis.
Mon. Wea. Rev., 131, 2730–2747.
——, and ——, 2004: The TT problem: Forecasting the tropical
transition of cyclones. Bull. Amer. Meteor. Soc., 85, 1657–1662.
De Maria, M., J. A. Knaff, and B. H. Connell, 2001: A tropical
cyclone genesis parameter for the tropical Atlantic. Wea.
Forecasting, 16, 219–233.
Dvorak, V. F., 1975: Tropical cyclone intensity analysis and
forecasting from satellite imagery. Mon. Wea. Rev., 103,
420–430.
Emanuel, K. A., 1986: An air–sea interaction theory for tropical
cyclones. Part I: Steady-state maintenance. J. Atmos. Sci., 43,585–605.
——, 1995: Sensitivity of tropical cyclones to surface exchange
coefficients and a revised steady-state model incorporating
eye dynamics. J. Atmos. Sci., 52, 3969–3976.
Evans, J. L., 1993: Sensitivity of tropical cyclone intensity to sea
surface temperature. J. Climate, 6, 1133–1140.
——, and R. E. Hart, 2003: Objective indicators of the life cycle
evolution of extratropical transition for Atlantic tropical cy-
clones. Mon. Wea. Rev., 131, 909–925.
——, and M. P. Guishard, 2009: Atlantic subtropical storms. Part I:
Diagnostic criteria and composite analysis. Mon. Wea. Rev., in
press.
Goldenberg, S. B., and L. J. Shapiro, 1996: Physical mechanisms
for the association of El Nino and West African rainfall with
Atlantic major hurricane activity. J. Climate, 9, 1169–1187.
Graham, N. E., and T. P. Barnett, 1987: Sea surface temperature,
surface wind divergence, and convection over tropical oceans.
Science, 238, 657–659.
Gray, W. M., 1968: Global view of the origin of tropical distur-
bances and storms. Mon. Wea. Rev., 96, 669–700.
Guishard, M. P., 2006: Atlantic subtropical storms: Climatology
and characteristics. Ph.D. thesis, Department of Meteorology,
The Pennsylvania State University, 158 pp.
——, E. A. Nelson, J. L. Evans, R. E. Hart, and D. G. O’Connell,
2007: Bermuda subtropical storms. Meteor. Atmos. Phys., 97,
239–253, doi:10.1007/s00703-006-0255-y.
Hart, R. E., 2003: A cyclone phase space derived from thermal
wind and thermal asymmetry. Mon. Wea. Rev., 131, 585–616.
——, and J. L. Evans, 2001: A climatology of the extratropical
transition of Atlantic tropical cyclones. J. Climate, 14,
546–564.
——, ——, and C. Evans, 2006: Synoptic composites of the ex-
tratropical transition life cycle of North Atlantic tropical cy-
clones: Factors determining posttransition evolution. Mon.
Wea. Rev., 134, 553–578.
Hebert, P. H., and K. O. Poteat, 1975: A satellite classification
technique for subtropical cyclones. NOAA Tech. Memo.
NWS SR-83, 25 pp.
Hendricks, E. A., M. T. Montgomery, and C. A. Davis, 2004: The
role of ‘‘vortical’’ hot towers in the formation of Tropical
Cyclone Diana (1984). J. Atmos. Sci., 61, 1209–1232.
Jarvinen, B. R., C. J. Neumann, and M. A. S. Davis, 1984: A
tropical cyclone data tape for the North Atlantic Basin, 1886–
1983: Contents, limitations, and uses. NOAA Tech. Memo.
NWS NHC 22, 24 pp.
Kalnay, E., and Coauthors, 1996: The NCEP/NCAR 40-Year
Reanalysis Project. Bull. Amer. Meteor. Soc., 77, 437–471.
Kimball, S. K., and J. L. Evans, 2002: Idealized numerical simu-
lations of hurricane–trough interaction. Mon. Wea. Rev., 130,
2210–2227.
Kossin, J. P., J. A. Knaff, H. I. Berger, D. C. Herndon, T. A. Cram,
C. S. Velden, R. J. Murnane, and J. D. Hawkins, 2007: Esti-
mating hurricane wind structure in the absence of aircraft
reconnaissance. Wea. Forecasting, 22, 89–101.
Landsea, C. W., 2007: Counting Atlantic tropical cyclones back to
1900. Eos, Trans. Amer. Geophys. Union, 88, doi:10.1029/
2007EO180001.
——, and Coauthors, 2004: The Atlantic Hurricane Database Re-
analysis Project—Documentation for 1851–1910 alterations
and additions to the HURDAT database. Hurricanes and
Typhoons: Past, Present, and Future, R. J. Murnane and K.-B.
Liu, Eds., Columbia University Press, 177–221.
Lindzen, R. S., and B. Farrell, 1980: A simple approximate result
for the maximum growth rate of baroclinic instabilities.
J. Atmos. Sci., 37, 1648–1654.
Manning, D. M., and R. E. Hart, 2007: Evolution of North Atlantic
ERA40 tropical cyclone representation. Geophys. Res. Lett.,
34, L05705, doi:10.1029/2006GL028266.
McBride, J. L., and R. Zehr, 1981: Observational analysis of tropical
cyclone formation. Part II: Comparison of non-developing
versus developing systems. J. Atmos. Sci., 38, 1132–1151.
Molinari, J., S. Skubis, D. Vollaro, F. Alsheimer, and H. E.
Willoughby, 1998: Potential vorticity analysis of tropical cy-
clone intensification. J. Atmos. Sci., 55, 2632–2644.
OFCM, 2007: National hurricane operations plan. Office of the
Federal Coordinator for Meteorological Services and Support-
ing Research Publication FCM-P12-2007, 191 pp. [Available
online at http://www.ofcm.gov/nhop/07/pdf/entire-nhop07.pdf.]
Ooyama, K. V., 1963: Hurricane development. Proc. Third Tech.
Conf. on Hurricanes and Tropical Meteorology, Mexico City,
Mexico, Amer. Meteor. Soc., 187–199.
Roth, D. M., 2002: A fifty year history of subtropical cyclones.
Preprints, 25th Conf. on Hurricanes and Tropical Meteorol-
ogy, San Diego, CA, Amer. Meteor. Soc., P1.43. [Available
online at http://ams.confex.com/ams/pdfpapers/37402.pdf.]
Sadler, J. C., 1976: A role of the tropical upper tropospheric trough
in early season typhoon development. Mon. Wea. Rev., 104,1266–1278.
Stewart, S. R., cited 2000: Tropical cyclone report: Hurricane
Michael, 17–19 October 2000. National Hurricane Center.
[Available online at http://www.nhc.noaa.gov/2000michael_
text.html.]
——, cited 2001: Tropical cyclone report: Hurricane Karen, 12–15
October 2001. National Hurricane Center. [Available online
at http://www.nhc.noaa.gov/2001karen_text.html.]
Uppala, S. M., and Coauthors, 2005: The ERA-40 re-analysis.
Quart. J. Roy. Meteor. Soc., 131, 2961–3012.
Williams, R., 2002: Bermuda Weather Service tropical cyclone report
on Hurricane Karen. WMO RAIV/HC-XXIV Doc. 4.2, 5–7.
3594 J O U R N A L O F C L I M A T E VOLUME 22