dissolved iron in the tropical and subtropical atlantic...
TRANSCRIPT
Dissolved iron in the tropical and subtropical Atlantic Ocean
B. A. Bergquist1,2 and E. A. Boyle1
Received 7 March 2005; revised 25 October 2005; accepted 28 November 2005; published 18 March 2006.
[1] Detailed depth profiles and surface transects of dissolved iron (DFe defined by0.4-mm filtration) were investigated on three cruises in the subtropical and tropicalAtlantic Ocean where dust deposition varied by 3 orders of magnitude. Surface DFe anddissolved Mn concentrations reflected dust deposition trends, but are not proportional tothe estimated inputs. Using estimates of the atmospheric flux of DFe, surface DFeresidence times were calculated to be on the order of 1 to 5 months. Deepwater DFeconcentrations varied with water masses depending on their source, age, andtransit pathways. At a site located on the edge of the equatorial system (10�N, 45�W),high DFe (>1 nmol/kg) was associated with an oxygen minimum zone at depths of 130to 1100 m. DFe concentrations in North Atlantic Deep Water (NADW) decreased by30% from sites in the North Atlantic to a site in the South Atlantic (24.5�S, 37�W),and DFe was lower in the Antarctic derived water masses (�0.4 nmol/kg) than inNADW at the South Atlantic site. An estimate of deepwater scavenging residence timefor DFe was 270 ± 140 years based on decreasing DFe along the NADW flow path.
Citation: Bergquist, B. A., and E. A. Boyle (2006), Dissolved iron in the tropical and subtropical Atlantic Ocean, Global
Biogeochem. Cycles, 20, GB1015, doi:10.1029/2005GB002505.
1. Introduction
[2] Iron is an essential nutrient for all living organismsand, in particular, is necessary for chlorophyll productionand nitrogen assimilation [Rueter and Ades, 1987]. Despiteits abundance in the environment, the low solubility of Feunder oxidizing conditions results in very low dissolved Feconcentrations and Fe limitation of primary productivity inmany of regions of the ocean [Martin and Fitzwater, 1988;Martin, 1990; Martin et al., 1990a, 1994; Coale et al.,1996; Hutchins and Bruland, 1998; Boyd et al., 2000, 2004;Coale et al., 2004]. This observation has lead to proposalsthat changes in Fe flux to the ocean may play a role inclimate change by influencing primary production (andhence the carbon cycle) of the ocean [Martin, 1990; Kumaret al., 1995; Falkowski, 1998]. In order to incorporate ironinto models of climate change, it is necessary to understandand quantify the processes that control iron distributions inthe ocean. There have been many attempts to model Fe in theocean and to include Fe in models of atmospheric CO2 andclimate change [Lefevre and Watson, 1999;Mahowald et al.,1999; Archer and Johnson, 2000; Fung et al., 2000; Sigmanand Boyle, 2000;Gao et al., 2001;Gregg et al., 2003; Parekhet al., 2005]. However, it is difficult to constrain biogeo-chemical models for Fe because of the paucity of datathroughout the ocean. New water column profiles of Fe,
especially in areas not previously sampled, and new processstudies of Fe biogeochemistry are necessary to improve andchallenge our current understanding of Fe in the ocean.[3] The main sources of Fe to the ocean are rivers,
atmospheric deposition, resuspension of sediments, andhydrothermal vents. Fe concentrations are highest near itssources, and concentrations decrease rapidly with distancefrom sources due to the reactivity and insolubility of Fe inseawater [Wu and Luther, 1996; Johnson et al., 1997].Because Fe from rivers and resuspension of sediments fromthe coastal zone generally does not penetrate far into theocean interior and hydrothermal Fe input is consideredlocalized, it is believed that the main input of Fe to theopen ocean is atmospheric deposition [Duce and Tindale,1991; Wells et al., 1995]. Scavenging onto particles andbiological export followed by burial in sediments aregenerally thought to be the primary removal mechanisms.‘‘Dissolved’’ iron (DFe: <0.4- or <0.2-mm filterable Fe)profiles in the open ocean are consistent with other nutrient-type elements showing depletion in the surface waters andan increase with depth owing to remineralization of organicmatter [Martin and Fitzwater, 1988; Bruland et al., 1994;Johnson et al., 1997]. However, unlike many nutrient-typeelements (e.g., P, N, Cd), DFe concentrations do notincrease with increasing age of deep water (as would beexpected if it were accumulated from remineralization ofsinking organic matter) because of its particle-reactivebehavior (like Al and Pb). In contrast to the concentrationsof particle-reactive elements that are usually higher in themore continentally influenced Atlantic than the Pacific,deepwater Fe concentrations are low in both the Atlanticand Pacific, �0.4 to 1 nmol/kg (for a review, see Johnsonet al. [1997]).
GLOBAL BIOGEOCHEMICAL CYCLES, VOL. 20, GB1015, doi:10.1029/2005GB002505, 2006
1Earth, Atmospheric, and Planetary Sciences, Massachusetts Institute ofTechnology, Cambridge, Massachusetts, USA.
2Now at Department of Geological Sciences, University of Michigan,Ann Arbor, Michigan, USA.
Copyright 2006 by the American Geophysical Union.0886-6236/06/2005GB002505$12.00
GB1015 1 of 14
[4] There have been several attempts to explain and modelthe unique distribution of DFe in the ocean [Johnson et al.,1997; Lefevre and Watson, 1999; Archer and Johnson,2000; Parekh et al., 2005]. The basic mechanisms of thesemodels can be summarized as follows: (1) dissolution ofatmospheric iron in surface waters, (2) biological uptake inthe surface ocean, (3) transport to the deep ocean throughbiological export, (4) remineralization of organic materialat depth releasing iron, (5) some solubilizing mechanism tokeep iron in solution above inorganic solubility (e.g.,organic complexation), and finally (6) scavenging andremoval of iron. Earlier models assumed that organicligands kept deep ocean DFe concentrations relativelyconstant (�0.6 to 0.7 nmol/kg) and only Fe in excess ofthe dissolved ligands was scavenged [Johnson et al., 1997;Lefevre and Watson, 1999; Archer and Johnson, 2000].However, the apparent constancy of the deepwater DFe inthe ocean was over-emphasized in earlier data sets [Boyle,1997]. There are areas of the open ocean where deepwatervalues deviate from the average �0.6 to 0.7 nmol/kg value.DFe concentrations are lower (�0.4 nmol/kg) in the deepNorth Pacific [Bruland et al., 1994; Boyle et al., 2005] andalso at 800 m in the Southern Ocean (0.2 to 0.3 nmol/kg)[de Baar et al., 1999]. It is more likely that deepwatervalues of iron are controlled by a balance between input ofdissolved iron in the deep water (both from remineralizationand lateral transport) and removal by scavenging. Further,the organic ligand pool is usually in excess of DFeconcentrations [Gledhill and van den Berg, 1994; Rue andBruland, 1995; Wu and Luther, 1995; Witter and Luther,1998; Powell and Donat, 2001]. Thus organic ligands likelyenhance the residence time and solubility of DFe, but donot lead to uniform deep ocean values. The mechanismdescribed above allows for more variable deepwater Feconcentrations.[5] Besides assuming uniform deepwater DFe, Fe models
typically use a constant percentage of dissolution for atmo-spheric aerosol Fe and constant Fe:C ratios for organicmatter exported from the euphotic zone to the deep ocean.Model results are very sensitive to these parameters, andboth of these assumptions have been challenged [Sunda,1997; Jickells and Spokes, 2001; Johnson et al., 2003;Bergquist, 2004; Chen and Siefert, 2004; Boyle et al.,2005]. Another challenge to modeling iron is that largeregions of the deep ocean have yet to be sampled, such asthe Indian Ocean, the South Atlantic, the South Pacific, theArctic, and high dust-flux regions of the North Atlantic.More data on the distribution of Fe and better constraints onparameters such as the residence time of Fe in both theupper and deep ocean, Fe:C ratios of exported organicmatter from the euphotic zone, and atmospheric aerosolsolubility are needed to improve our understanding andmodels of Fe behavior.[6] Comparisons of Fe with other trace metals may be
useful in understanding and quantifying certain aspects ofthe Fe cycle in the ocean especially in the surface ocean. Inthis study, Mn was measured and published Al data isavailable along a transect near our surface transect in thewestern Atlantic [Vink and Measures, 2001]. Mn and Al arealso particle reactive and have distributions in the ocean that
reflect their sources (aeolian deposition); however, unlikeFe, neither of these elements have profiles and distributionsindicative of biological recycling [Klinkhammer and Bender,1980; Landing and Bruland, 1980; Orians and Bruland,1986; Bruland et al., 1994]. Aluminum is considered anexcellent tracer of atmospheric deposition in the surfaceocean [Measures and Brown, 1996; Measures and Vink,2000; Vink and Measures, 2001]. It has elevated surfaceconcentrations and decreases with depth due to scavengingwith a residence time of 3–5 years in the surface ocean[Orians and Bruland, 1986]. Manganese also has a surfacemaximum and decreases with depth, but surface values arehigher than what would be predicted from atmosphericdeposition and removal via scavenging. Photochemicalcycling maintains higher concentrations and results in alonger residence time of �20 years in surface waters[Landing and Bruland, 1980, 1987; Sunda and Huntsman,1988].[7] The aim of this study was to investigate Fe distribu-
tion, speciation, and dissolution in areas of varying atmo-spheric dust inputs in the tropical and subtropical AtlanticOcean. Iron concentrations were measured by a new isotopedilution multicollector inductively coupled plasma massspectrometry (MC-ICPMS) method, which allows Mnand Cr concentrations to be measured simultaneously[Bergquist, 2004; Boyle et al., 2005]. We present DFe andlimited Mn data (DFe, DMn, <0.4 mm filtered) from threecruises in the subtropical and tropical Atlantic Ocean (30�Nto 30�S) including both surface data and depth profiles of Fe.
2. Sampling and Methods
2.1. Sampling Sites
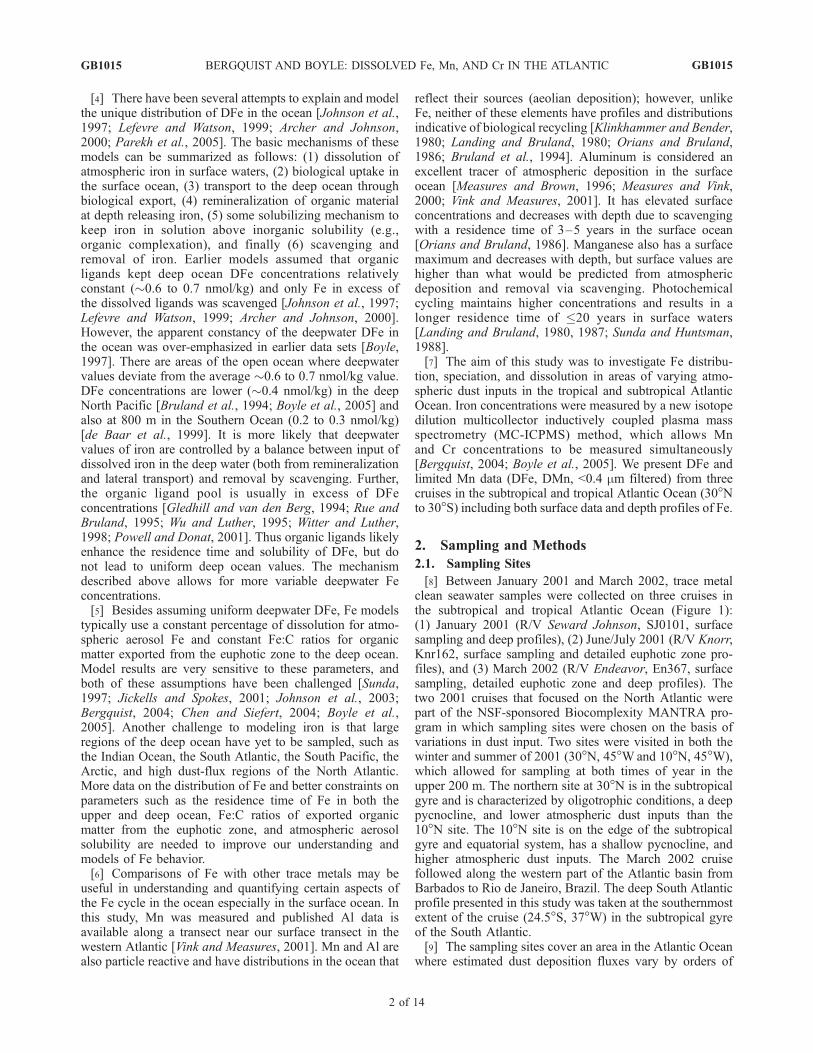
[8] Between January 2001 and March 2002, trace metalclean seawater samples were collected on three cruises inthe subtropical and tropical Atlantic Ocean (Figure 1):(1) January 2001 (R/V Seward Johnson, SJ0101, surfacesampling and deep profiles), (2) June/July 2001 (R/V Knorr,Knr162, surface sampling and detailed euphotic zone pro-files), and (3) March 2002 (R/V Endeavor, En367, surfacesampling, detailed euphotic zone and deep profiles). Thetwo 2001 cruises that focused on the North Atlantic werepart of the NSF-sponsored Biocomplexity MANTRA pro-gram in which sampling sites were chosen on the basis ofvariations in dust input. Two sites were visited in both thewinter and summer of 2001 (30�N, 45�Wand 10�N, 45�W),which allowed for sampling at both times of year in theupper 200 m. The northern site at 30�N is in the subtropicalgyre and is characterized by oligotrophic conditions, a deeppycnocline, and lower atmospheric dust inputs than the10�N site. The 10�N site is on the edge of the subtropicalgyre and equatorial system, has a shallow pycnocline, andhigher atmospheric dust inputs. The March 2002 cruisefollowed along the western part of the Atlantic basin fromBarbados to Rio de Janeiro, Brazil. The deep South Atlanticprofile presented in this study was taken at the southernmostextent of the cruise (24.5�S, 37�W) in the subtropical gyreof the South Atlantic.[9] The sampling sites cover an area in the Atlantic Ocean
where estimated dust deposition fluxes vary by orders of
GB1015 BERGQUIST AND BOYLE: DISSOLVED Fe, Mn, AND Cr IN THE ATLANTIC
2 of 14
GB1015
magnitude both from north to south and seasonally [Duceand Tindale, 1991; Fung et al., 2000; Gao et al., 2001; Vinkand Measures, 2001; Chen and Siefert, 2004]. Dust depo-sition rates are highest in the North Atlantic downwind fromthe Sahara and decrease rapidly south of the intertropicalconvergence zone (ITZC). Generally, dust fluxes to thetropical and subtropical Atlantic are estimated to be highestin the Northern Hemisphere summer [Prospero, 1996; Gaoet al., 2001]. However, seasonally high winter atmosphericdust concentrations have been observed in the easterntropical Atlantic in the zone of maximum dust transportoff the Sahara [Chiapello et al., 1995]. On the NorthAtlantic cruises, particulate and labile Fe (90-min, pH 4.5,reducing leach) atmospheric concentrations were measuredconcurrently at sea [Chen and Siefert, 2004].
2.2. Sampling Methods
[10] The trace metal clean seawater samples collected inthis study were collected using a variety of methods.Many of the samples collected on the cruise were takenwith the Moored In situ Trace Element Serial Sampler(MITESS) water sampler or with a single MITESS ‘‘ATE’’(Automated Trace Element) module [Bell et al., 2002].Each MITESS module opens and closes an acid-cleaned500-mL polyethylene bottle while underwater in order tominimize chances for contamination. Details of the differ-ent types of sampling schemes are given by Bergquist[2004] and Boyle et al. [2005]. For profile work, it isespecially challenging to collect trace metal clean samples
in the upper 30 m of the water column while maintaininggood depth control. Details of the upper water columnsampling can be found in online auxiliary material1. Aftersample collection, sealed sample bottles were taken into aclass 100 clean air flow environment for filtration within12–24 hours of collection in order to avoid Fe loss to bottlewalls. Multiple splits of each sample were vacuum filteredthrough acid cleaned 0.4-mm Nuclepore1 filters. Filtrateswere acidified at sea to pH 2 by addition of triply distilledVycor 6 N HCl in a ratio of 1 mL acid to 500 mL of seawater.
2.3. Fe and Mn Measurement
[11] Iron, Mn, and Cr concentrations in filtrates weremeasured simultaneously by a modified version of themethod by Wu and Boyle [1998], which utilizes isotopedilution followed by Mg(OH)2 coprecipitation and measure-ment by ICPMS [Bergquist, 2004; Boyle et al., 2005]. Thispaper focuses on the Fe data with limited Mn data (details ofmethod and the data are available in Text S1 and Tables S1and S2 in the auxiliary material). Additional details of themethod and the Mn and Cr data are given by Bergquist[2004]. Briefly, the main differences of the new methodused in this study are the use of a 54Fe isotope spike and aGV Instruments IsoProbe MC-ICPMS. The IsoProbe incor-porates a hexapole collision cell prior to the magnet thateliminates 40Ar16O+ and 40Ar14N+ interferences on masses56 and 54, which allows samples to be measured in lowmass resolution. The multi-collection feature permits simul-taneous collection of masses 52 (monitor Cr and correct forCr interference on 54), 54, 55 (Mn), 56, and 57. The largestinterference correction for Fe is CaO+ on mass 56. TheCaO+ interference is monitored by measuring CaOH+ onmass 57, measuring the CaO/CaOH ratio on a trace metalclean Ca solution throughout the run, and correcting mass56 for the CaO+ interference. Mn and Cr concentrations arecalculated by measuring recovery efficiency (from spikedsamples) compared to the 54Fe spike and by measuring therelative ionization efficiencies of Mn, Cr, and Fe in theplasma.[12] Replicate analysis of samples yield precisions of
better than ±0.05 nmol/kg for Fe and ±0.15 nmol/kg forMn. Error bars reported in this study represent the 1sstandard deviation of replicate analysis of samples. Proce-dural blanks for Fe ranged from 0.08 to 0.17 nmol/kgfor individual analysis sessions with typical precisions of±0.03 nmol/kg (1s SD) for individual sessions. For Mn,procedural blanks ranged from 0.4 to 1.0 nmol/kg withtypical precisions of ±0.1 nmol/kg (1s SD) for individualruns. We feel differences between samples in our extendeddata set are comparable to within the analytical sessionsample replication (±0.05 nmol/kg (1SD) for Fe). Compar-isons of our data to other published data sets within�0.15 nmol/kg for Fe should be made with caution, as nointerlaboratory consistency sample was available at thetime these measurements were made. However, agreement(within 0.05 nmol/kg) between deepwater concentrationsin DFe in the North Pacific measured in our lab [Boyle etal., 2005] and concentrations observed at a nearby station
Figure 1. Sample location map for the three cruisesdiscussed in this study. Surface samples analyzed in thisstudy are marked by circles, and profile sites are marked bystars. Published sampling locations and transects used forcomparison are also shown.
1Auxiliary material is available at ftp://ftp.agu.org/apend/gb/2005gb002505.
GB1015 BERGQUIST AND BOYLE: DISSOLVED Fe, Mn, AND Cr IN THE ATLANTIC
3 of 14
GB1015
by Bruland et al. [1994] suggests our method agrees wellwith other methods and laboratories.
3. Results and Discussion
3.1. Surface Water Fe and Mn Variability andDistribution
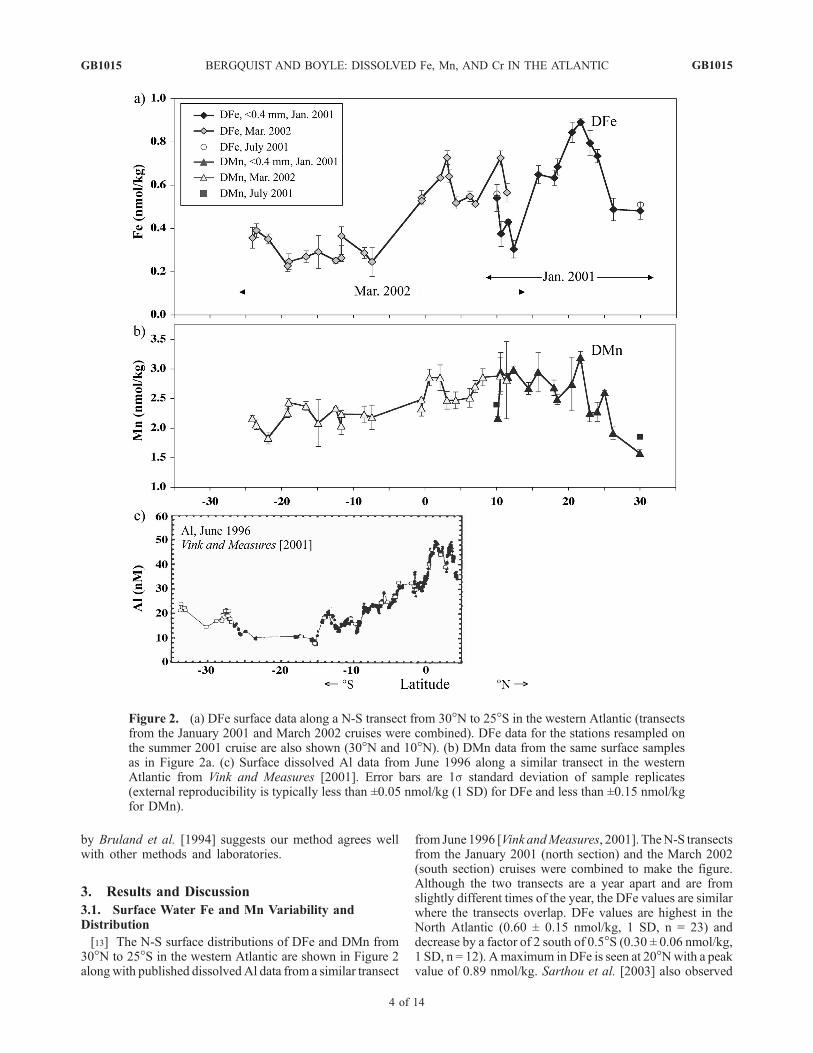
[13] The N-S surface distributions of DFe and DMn from30�N to 25�S in the western Atlantic are shown in Figure 2alongwith published dissolvedAl data from a similar transect
from June 1996 [Vink andMeasures, 2001]. TheN-S transectsfrom the January 2001 (north section) and the March 2002(south section) cruises were combined to make the figure.Although the two transects are a year apart and are fromslightly different times of the year, the DFe values are similarwhere the transects overlap. DFe values are highest in theNorth Atlantic (0.60 ± 0.15 nmol/kg, 1 SD, n = 23) anddecrease by a factor of 2 south of 0.5�S (0.30 ± 0.06 nmol/kg,1 SD, n = 12). Amaximum in DFe is seen at 20�Nwith a peakvalue of 0.89 nmol/kg. Sarthou et al. [2003] also observed
Figure 2. (a) DFe surface data along a N-S transect from 30�N to 25�S in the western Atlantic (transectsfrom the January 2001 and March 2002 cruises were combined). DFe data for the stations resampled onthe summer 2001 cruise are also shown (30�N and 10�N). (b) DMn data from the same surface samplesas in Figure 2a. (c) Surface dissolved Al data from June 1996 along a similar transect in the westernAtlantic from Vink and Measures [2001]. Error bars are 1s standard deviation of sample replicates(external reproducibility is typically less than ±0.05 nmol/kg (1 SD) for DFe and less than ±0.15 nmol/kgfor DMn).
GB1015 BERGQUIST AND BOYLE: DISSOLVED Fe, Mn, AND Cr IN THE ATLANTIC
4 of 14
GB1015
higher DFe (0.40 nmol/kg) in the North Atlantic and lowerconcentrations in the South Atlantic (0.11 nmol/kg) in theeastern Atlantic in October 2000 (transect shown in Figure 1).[14] The observed pattern in the surface DFe is similar to
trends of other dust derived trace metals (e.g., Mn and Al)indicating that surface DFe reflects variations in dust inputalong the transect. DMn measured along the same transectshows a similar pattern with average values of 2.60 ±0.36 nmol/kg (1 SD, n = 26) in the North Atlantic and2.19 ± 0.16 nmol/kg (1 SD, n = 12) in the South Atlantic. Abroader maximum is observed for Mn between 0 and 25�Nwith a peak value of 3.2 nmol/kg. Dissolved Al data along asimilar transect from Vink and Measures [2001] also showshigher values in the North Atlantic (40–50 nmol/kg) and adecrease in the South Atlantic to concentrations <10 nmol/kgin the subtropical gyre (Figure 2c). However, dissolved Alvalues decreased by more than a factor of 5 between theNorth and South Atlantic. DFe values decrease only by afactor of 2 and DMn decreases�20%. For DFe, factors suchas biological uptake, biological export, and scavenging resultin a shorter residence time of less than a year in the surfaceocean (as estimated in section 3.3.2) compared with Al (3–5 years). Solubility limits may also play a role in surface DFeprofiles [Vink and Measures, 2001; Wu and Boyle, 2002]. Ifa proportional amount of Fe to Al was dissolved fromatmospheric particles based on the composition of conti-nental crust (8.0% Al, 4.3% Fe [Wedepohl, 1995]), onewould expect higher DFe concentrations (20–25 nmol/kg)in the North Atlantic. Therefore the short residence time ofFe in surface waters and possible solubility limits lead toDFe values that are more variable than Al and that do notscale proportionally to Al in the North Atlantic. As for Mn,photochemical cycling leads to a longer surface residencetime (�20 years) than Al [Landing and Bruland, 1980;Sunda and Huntsman, 1988]. Thus enhanced cycling andlateral transport erase large flux variations.[15] Both our DFe and DMn transect data show maxima
in the North Atlantic near 20�N, which is consistent withthis being the zone of maximum dust transport from theSahara in the Northern Hemisphere summer months whendust fluxes are typically higher [Husar et al., 1997; Moulinet al., 1997]. The maximum at 20�N is in agreement withmodeled surface DFe fluxes and concentrations [Fung et al.,2000; Gregg et al., 2003; Parekh et al., 2005]. Surface DFedistributions were modeled seasonally by Gregg et al.[2003], although only an atmospheric Fe flux to surfacewater was included (no upwelling flux). The model pro-duced the general pattern observed in the measured DFe ofhigher concentrations in the North Atlantic under theSaharan dust plume and the decrease of DFe to much lowerconcentrations (0.2 to 0.3 nmol/kg) in the subtropical gyreof the South Atlantic. However, the model-derived DFeconcentrations in the region of the Saharan dust plume arehigher (>1 nmol/kg) and the region of high DFe broaderthan our measured DFe in this region. Differences betweenthe modeled and measured DFe are likely due to modelassumptions (e.g., constant percentage of dust dissolution orconstant scavenging rates), but the agreement for thegeneral pattern of DFe indicates that 3-D general circulationmodels including dust dissolution, scavenging, and biolog-
ical uptake for Fe are capturing many of the processescontrolling surface DFe in this region of the ocean. Part ofthe agreement between modeled DFe and observed DFe inthe Atlantic may be due to the dominance of the atmo-spheric flux component of DFe over the upwelling flux inthe Atlantic subtropical and tropical surface ocean [Fung etal., 2000]. In other regions where dust deposition is lower,models with an upwelling flux will be needed to betterestimate the DFe in surface waters [Parekh et al., 2005].[16] Seasonal variability of surface DFe was not observed
for the two stations (30�N and 10�N) sampled both in winterand summer of 2001. The 30�N station had a peak surfaceDFe of 0.68 nmol/kg in the winter and 0.50 nmol/kg in thesummer. However, the peak value at 30�N in the winter ispart of a well-defined surface maximum (see profiles inFigure 4a in section 3.3). The integrated mixed layer valuefor this station was 0.51 nmol/kg. Therefore the winter andsummer surface DFe are similar at this site. Large differ-ences in the DFe from winter to summer are also notobserved at the higher dust site, 10�N, with winter surfaceDFe at 0.59 nmol/kg and summer at 0.56 nmol/kg. Incontrast, in situ atmospheric dust measurements did showseasonal differences. Chen and Siefert [2004] measuredtotal dust, total Fe, and labile Fe (90 min, pH = 4.5,reducing leach) concentrations in the atmosphere concur-rently with our DFe. At the 10�N station, total and labileatmospheric Fe flux estimates are 5 times higher in thewinter than in the summer. At the 30�N station, concurrentdust measurements are 5 times higher in the summer than inthe winter. The poor correlation of our sea surface DFeconcentrations and the concurrent dust flux estimates dem-onstrates the problem of trying to compare in situ atmo-spheric measurements with sea-surface DFe measurements.DFe integrates over weeks to months of dust depositionevents and is biologically cycled with possible solubilitycontrols. Dust deposition measurements at sea are madedaily and may not represent the regional or seasonal inputbecause of the episodic and spatially inhomogeneous natureof dust events [Prospero, 1996; Jickells and Spokes, 2001].[17] DFe and DMn remain relatively invariant on an E-W
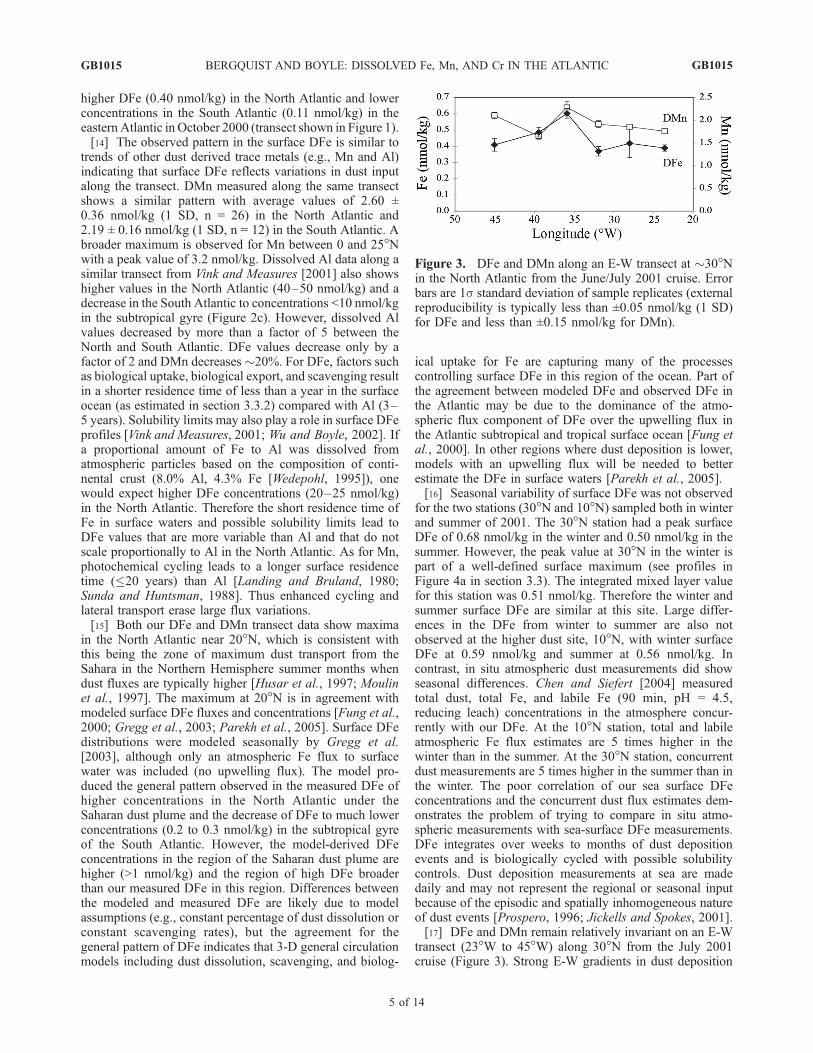
transect (23�W to 45�W) along 30�N from the July 2001cruise (Figure 3). Strong E-W gradients in dust deposition
Figure 3. DFe and DMn along an E-W transect at �30�Nin the North Atlantic from the June/July 2001 cruise. Errorbars are 1s standard deviation of sample replicates (externalreproducibility is typically less than ±0.05 nmol/kg (1 SD)for DFe and less than ±0.15 nmol/kg for DMn).
GB1015 BERGQUIST AND BOYLE: DISSOLVED Fe, Mn, AND Cr IN THE ATLANTIC
5 of 14
GB1015
or DFe at 30�N are also not predicted by models except forvery high values close to the African continent where mostof the larger particles are deposited [Mahowald et al., 1999;Fung et al., 2000; Gregg et al., 2003]. Sarthou et al. [2003]measured surface DFe of greater than 1 nmol/kg closer tothe African continent at 15�W. Our easternmost sample is at23.6�W and had a DFe concentration of 0.40 nmol/kgsuggesting that a steep longitudinal gradient may existbetween these locations. Generally, our E-W data suggeststhat finer particles transported to the west of �20�Ware notpreferentially deposited with longitude.
3.2. Surface Aerosol Solubility
[18] On the summer 2001 cruise, trace metal clean incu-bation experiments were performed by D. Capone andcoworkers (University of Southern California) in order toinvestigate the effects of aerosol additions on phytoplanktongrowth at both the 10�N and 30�N stations. The mesocosmexperiments were done in large carboys (20 L) in incubationchambers on deck. Atmospheric dust was collected forseveral days on large volume acid-cleaned filters (byR. Siefert and Y. Chen), and the filters sectioned andadded to the mesocosm experiments. The mesocosmexperiments were then allowed to incubate for varyingamounts of time (0 to 5 days) and sampled by our groupfor DFe. Y. Chen and R. Siefert (personal communication,2003) estimated that each section of dust filter hadapproximately 100 mg and 900 mg total Fe at the 30�Nand 10�N stations, respectively.[19] Release of excess DFe (the amount of DFe in excess
of the ambient DFe of the natural seawater) from the aerosolfilter additions was only observed at the 10�N station for thetwo 5-day incubation experiments. The experiments reachedtotal concentrations of �1.15 nmol/kg with an excess DFeof �0.50 nmol/kg. Although a large amount of aerosol Fewas added to these experiments (900 mg), the proportion ofthis Fe released into the dissolved pool was very small(<0.1%). The upper concentration reached in these experi-ments may represent the saturation of organic ligands in thedissolved pool. Excess dissolved organic ligand concentra-tions were measured by Wu and Luther [1995] and Lutherand Wu [1997] in surface water of the northwestern AtlanticOcean. Excess ligand concentrations of 0.45–0.60 ± 0.20 nMwere observed, which agrees well with our observed excessDFe for the 5-day mesocosm experiments. In contrast, the30�N station experiments and the 3-day incubation experi-ment at 10�N had no detectable amounts of excess DFereleased from the dust filters. It is unclear why no excess DFewas observed in these dust addition experiments. Dustconcentrations were much lower at the 30�N station, andperhaps there is a kinetic barrier to dissolving Fe off the dustfilters. Additionally if only a small amount of excess DFewere released, it could be quickly taken up by organisms orscavenged onto particles in the mesocosm experiments.
3.3. Fe Water Column Profiles
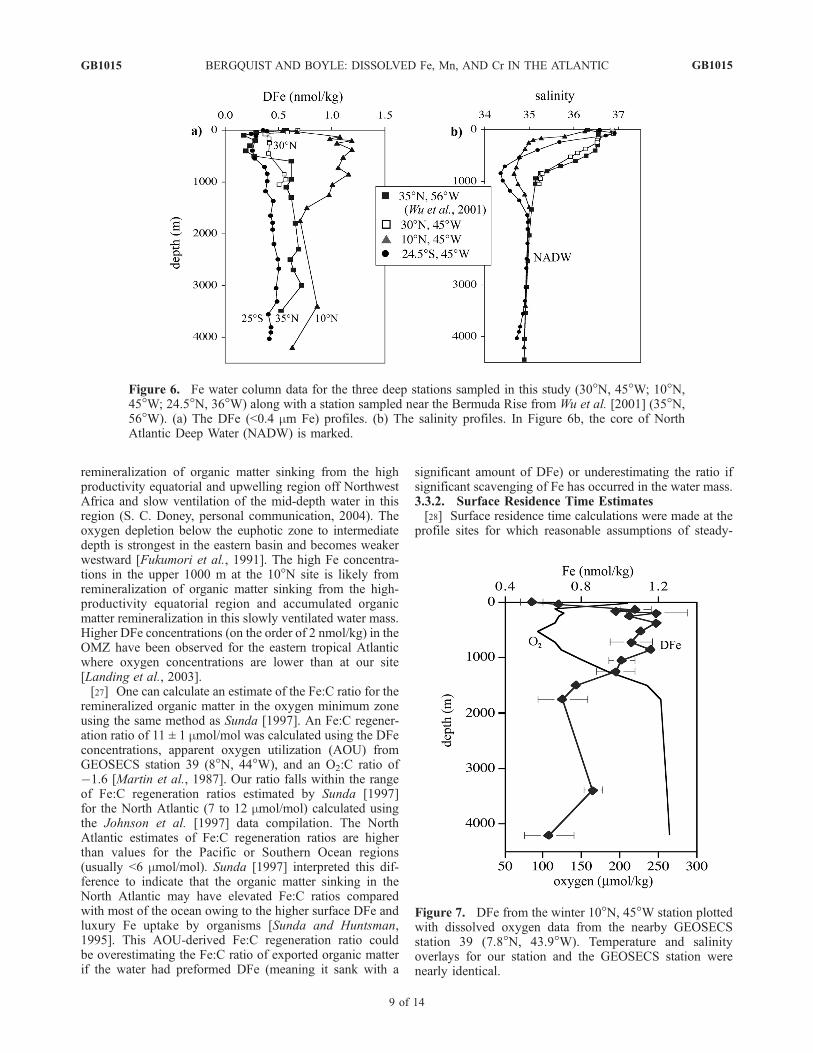
[20] Figures 4 through 7 show water column profiles ofDFe at three sites along the N-S transect: (1) 30�N, 45�W,(2) 10�N, 45�W, and (3) 24.5�S, 36�W (Figure 1). A DFeprofile from a station near the Bermuda Rise (35�N, 58�W)
from Wu et al. [2001] is shown for comparison in Figure 6.The 30�N and 10�N stations were sampled both on theJanuary and the July cruises. Deepwater profiles werecollected in the winter (Figures 4a and 4c) and high-densityeuphotic zone profiles collected in the summer (Figures 4band 4d). The goal of the high-density euphotic zonesampling was to examine Fe in this active zone in moredetail. The South Atlantic site was sampled on the March2002 cruise (Figures 5a and 5b). Table 1 summarizes thedata from these profiles.[21] The DFe concentration profiles generally have nutri-
ent-type profiles with lower concentrations in surface watersthan in deep water, although the profiles have interestingfeatures deviating from classic nutrient-type profiles withsurface maxima, intermediate water minima and maxima,and variations clearly associated with water masses. Profileswill be discussed in terms of their upper and deepwatercolumn profiles. Residence time calculations were made forsurface Fe where steady-state assumptions could be madeand also for deepwater Fe.3.3.1. Upper (Surface to �1000 m) Water Column FeProfiles[22] The two subtropical gyre sites (30�N and 24.5�S)
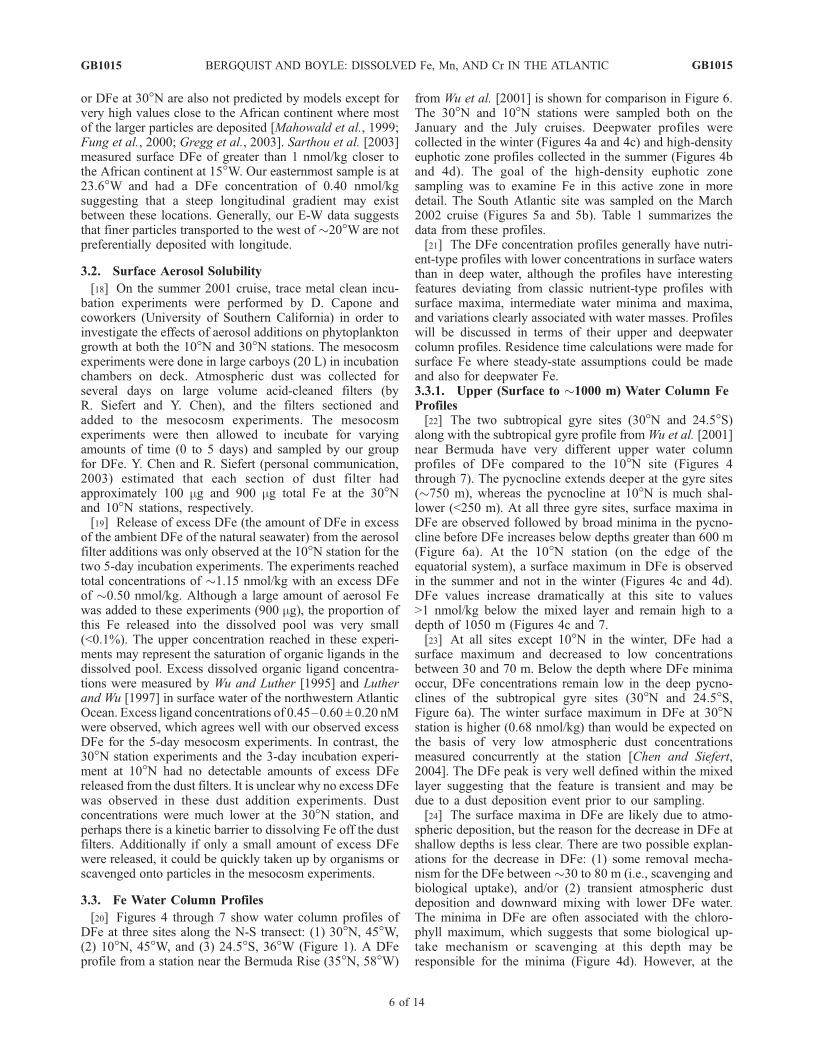
along with the subtropical gyre profile fromWu et al. [2001]near Bermuda have very different upper water columnprofiles of DFe compared to the 10�N site (Figures 4through 7). The pycnocline extends deeper at the gyre sites(�750 m), whereas the pycnocline at 10�N is much shal-lower (<250 m). At all three gyre sites, surface maxima inDFe are observed followed by broad minima in the pycno-cline before DFe increases below depths greater than 600 m(Figure 6a). At the 10�N station (on the edge of theequatorial system), a surface maximum in DFe is observedin the summer and not in the winter (Figures 4c and 4d).DFe values increase dramatically at this site to values>1 nmol/kg below the mixed layer and remain high to adepth of 1050 m (Figures 4c and 7.[23] At all sites except 10�N in the winter, DFe had a
surface maximum and decreased to low concentrationsbetween 30 and 70 m. Below the depth where DFe minimaoccur, DFe concentrations remain low in the deep pycno-clines of the subtropical gyre sites (30�N and 24.5�S,Figure 6a). The winter surface maximum in DFe at 30�Nstation is higher (0.68 nmol/kg) than would be expected onthe basis of very low atmospheric dust concentrationsmeasured concurrently at the station [Chen and Siefert,2004]. The DFe peak is very well defined within the mixedlayer suggesting that the feature is transient and may bedue to a dust deposition event prior to our sampling.[24] The surface maxima in DFe are likely due to atmo-
spheric deposition, but the reason for the decrease in DFe atshallow depths is less clear. There are two possible explan-ations for the decrease in DFe: (1) some removal mecha-nism for the DFe between �30 to 80 m (i.e., scavenging andbiological uptake), and/or (2) transient atmospheric dustdeposition and downward mixing with lower DFe water.The minima in DFe are often associated with the chloro-phyll maximum, which suggests that some biological up-take mechanism or scavenging at this depth may beresponsible for the minima (Figure 4d). However, at the
GB1015 BERGQUIST AND BOYLE: DISSOLVED Fe, Mn, AND Cr IN THE ATLANTIC
6 of 14
GB1015
subtropical gyre sites, DFe does not increase below thechlorophyll maximum within the pycnoclines as might beexpected due to remineralization of organic matter based onmajor nutrient data. It could be that remineralization for Fehappens deeper and that the DFe is lower in the pycnoclinewater owing to the water source. The pycnocline water inthe subtropical gyres is formed at higher latitudes (40�N) inthe gyres and spreads along isopycnals [Tchernia, 1980].This higher latitude source water is generally characterizedby lower dust deposition and hence lower surface DFe. In
particular in the South Atlantic, this water forms in an areaof very low dust deposition. Therefore the pycnoclinewaters at the 24.5�S station are probably ventilated by waterthat sinks with very low DFe. The mechanism for the DFeminima in the deep pycnoclines of the subtropical gyre sitesis not clear, but is likely a combination of the mechanismslisted above (scavenging/biological uptake and ventilationof the pycnocline with high latitude, low DFe water).[25] The station at 10�N is different from the gyre stations
in that the pycnocline is very shallow and high levels of
Figure 4. DFe water column data at the 30�N, 45�Wand 10�N, 45�W stations from both the winter andsummer cruises, 2001. (a) The winter 30�N station plotted with salinity. (b) The summer 30�N stationplotted with salinity. (c) The winter 10�N station plotted with salinity. (d) The summer 10�N stationplotted with chlorophyll fluorescence. Error bars are 1s standard deviation of sample replicates (externalreproducibility is typically less than ±0.05 nmol/kg (1 SD) for DFe).
GB1015 BERGQUIST AND BOYLE: DISSOLVED Fe, Mn, AND Cr IN THE ATLANTIC
7 of 14
GB1015
DFe are observed in the upper 1000 m. The zone of high Feconcentration persists from 130 to 1050 m with an averageDFe of 1.09 ± 0.08 nmol/kg (1 SD, n = 9). In the morestratified summer, a surface maxima in DFe exists followedby a shallow minima at 50 to 100 m. The same station in thewinter was characterized by a deeper mixed layer, and theDFe concentration increased with depth with no observed
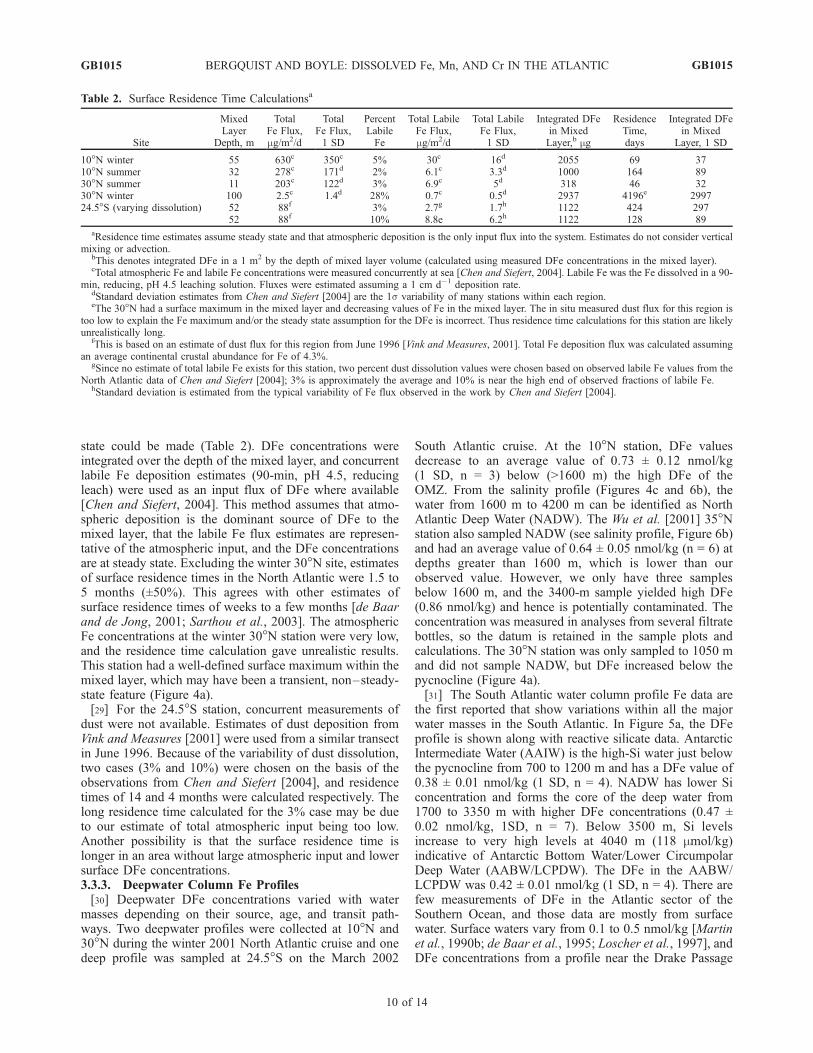
minimum. A DFe minimum may not have occurred at thistime of year due to winter vertical mixing with deeper highDFe water. DFe values increased to higher concentrations atshallower depths in the winter than in the summer.[26] The Fe maximum at 10�N from 130 to 1050 m is
associated with an oxygen minimum zone (OMZ) (Figure 7).The OMZ in the tropical Atlantic is due to enhanced
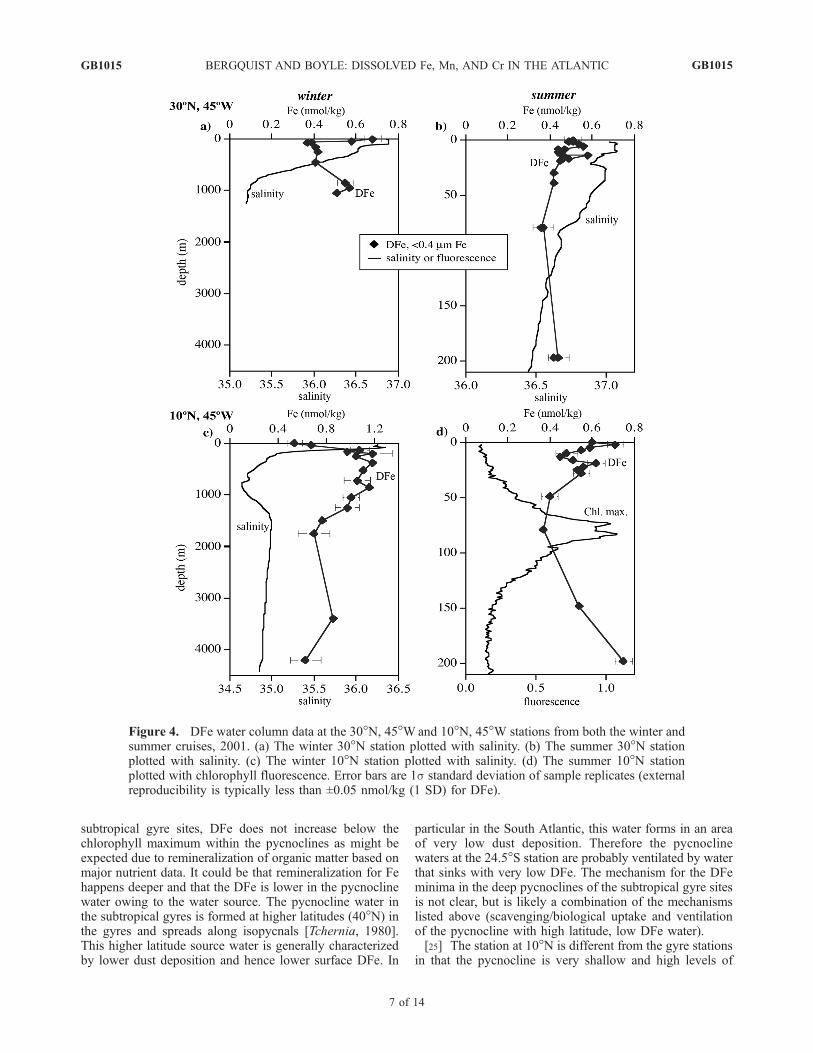
Figure 5. DFe profile for the South Atlantic station at 24.5�S, 37�W, which was occupied in March2002. (a) The full DFe profile to 4500 m plotted along with reactive silicate data measured on the samecruise. (b) A magnification of the upper 1000 m plotted along with CTD salinity data. Error bars are 1sstandard deviation of sample replicates (external reproducibility typically less than ±0.05 nmol/kg (1 SD)for DFe).
Table 1. Summary of Water Column Data
Station Depth, mDFe,
nmol/kgDFE,1 SDa nb
Fe*,c
nmol/kgFe*,1 SDa
AOU Calc. Fe:C,d
mmol/molFe:C,1 SDa
35�N, 58�W mixed layer, <20 m 0.57 1[Wu et al., 2001] pycnocline, 50–500 m 0.24 0.05 6
deep, >1500 m 0.64 0.05 6 0.04 0.07
30�N, 45�W winter mixed, 0–100 m 0.51 0.15 4winter mixed layer peak, 0 m 0.68 1summer mixed layer. 0–11 m 0.50 0.05 8pycnocline, 165–525 m 0.41 0.02 3deep, 850–1050 m 0.54 0.03 3
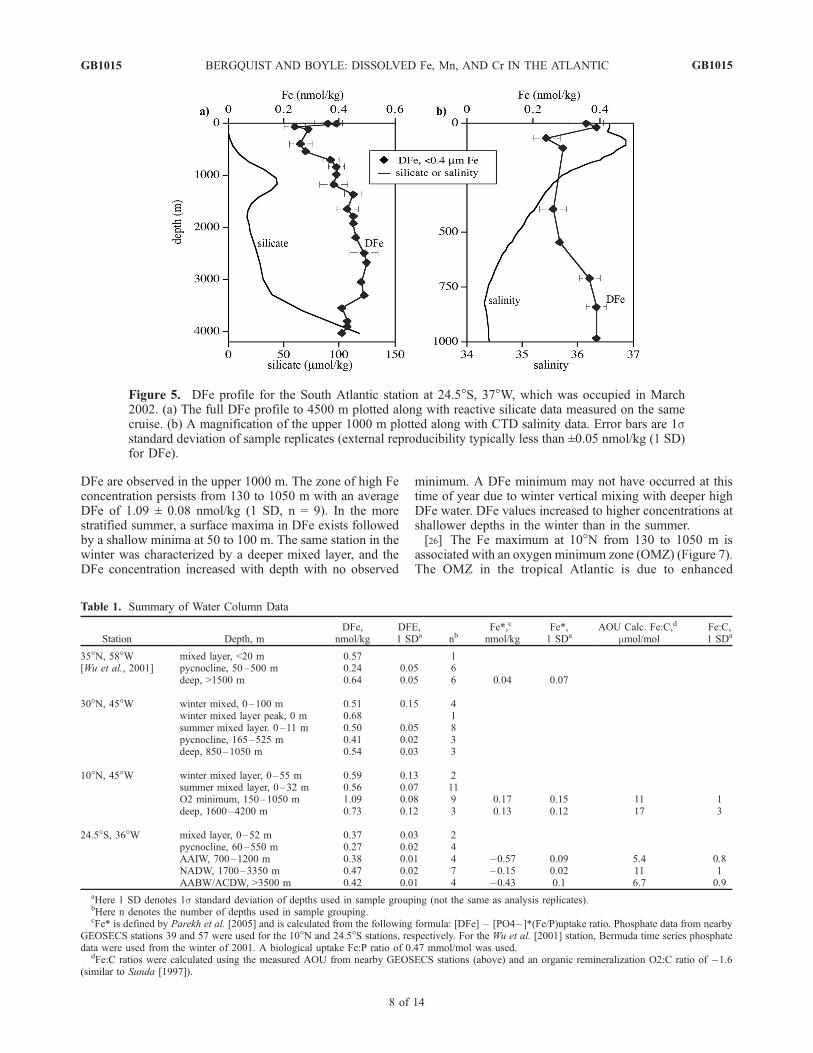
10�N, 45�W winter mixed layer, 0–55 m 0.59 0.13 2summer mixed layer, 0–32 m 0.56 0.07 11O2 minimum, 150–1050 m 1.09 0.08 9 0.17 0.15 11 1deep, 1600–4200 m 0.73 0.12 3 0.13 0.12 17 3
24.5�S, 36�W mixed layer, 0–52 m 0.37 0.03 2pycnocline, 60–550 m 0.27 0.02 4AAIW, 700–1200 m 0.38 0.01 4 �0.57 0.09 5.4 0.8NADW, 1700–3350 m 0.47 0.02 7 �0.15 0.02 11 1AABW/ACDW, >3500 m 0.42 0.01 4 �0.43 0.1 6.7 0.9
aHere 1 SD denotes 1s standard deviation of depths used in sample grouping (not the same as analysis replicates).bHere n denotes the number of depths used in sample grouping.cFe* is defined by Parekh et al. [2005] and is calculated from the following formula: [DFe] – [PO4�]*(Fe/P)uptake ratio. Phosphate data from nearby
GEOSECS stations 39 and 57 were used for the 10�N and 24.5�S stations, respectively. For the Wu et al. [2001] station, Bermuda time series phosphatedata were used from the winter of 2001. A biological uptake Fe:P ratio of 0.47 mmol/mol was used.
dFe:C ratios were calculated using the measured AOU from nearby GEOSECS stations (above) and an organic remineralization O2:C ratio of �1.6(similar to Sunda [1997]).
GB1015 BERGQUIST AND BOYLE: DISSOLVED Fe, Mn, AND Cr IN THE ATLANTIC
8 of 14
GB1015
remineralization of organic matter sinking from the highproductivity equatorial and upwelling region off NorthwestAfrica and slow ventilation of the mid-depth water in thisregion (S. C. Doney, personal communication, 2004). Theoxygen depletion below the euphotic zone to intermediatedepth is strongest in the eastern basin and becomes weakerwestward [Fukumori et al., 1991]. The high Fe concentra-tions in the upper 1000 m at the 10�N site is likely fromremineralization of organic matter sinking from the high-productivity equatorial region and accumulated organicmatter remineralization in this slowly ventilated water mass.Higher DFe concentrations (on the order of 2 nmol/kg) in theOMZ have been observed for the eastern tropical Atlanticwhere oxygen concentrations are lower than at our site[Landing et al., 2003].[27] One can calculate an estimate of the Fe:C ratio for the
remineralized organic matter in the oxygen minimum zoneusing the same method as Sunda [1997]. An Fe:C regener-ation ratio of 11 ± 1 mmol/mol was calculated using the DFeconcentrations, apparent oxygen utilization (AOU) fromGEOSECS station 39 (8�N, 44�W), and an O2:C ratio of�1.6 [Martin et al., 1987]. Our ratio falls within the rangeof Fe:C regeneration ratios estimated by Sunda [1997]for the North Atlantic (7 to 12 mmol/mol) calculated usingthe Johnson et al. [1997] data compilation. The NorthAtlantic estimates of Fe:C regeneration ratios are higherthan values for the Pacific or Southern Ocean regions(usually <6 mmol/mol). Sunda [1997] interpreted this dif-ference to indicate that the organic matter sinking in theNorth Atlantic may have elevated Fe:C ratios comparedwith most of the ocean owing to the higher surface DFe andluxury Fe uptake by organisms [Sunda and Huntsman,1995]. This AOU-derived Fe:C regeneration ratio couldbe overestimating the Fe:C ratio of exported organic matterif the water had preformed DFe (meaning it sank with a
significant amount of DFe) or underestimating the ratio ifsignificant scavenging of Fe has occurred in the water mass.3.3.2. Surface Residence Time Estimates[28] Surface residence time calculations were made at the
profile sites for which reasonable assumptions of steady-
Figure 6. Fe water column data for the three deep stations sampled in this study (30�N, 45�W; 10�N,45�W; 24.5�N, 36�W) along with a station sampled near the Bermuda Rise from Wu et al. [2001] (35�N,56�W). (a) The DFe (<0.4 mm Fe) profiles. (b) The salinity profiles. In Figure 6b, the core of NorthAtlantic Deep Water (NADW) is marked.
Figure 7. DFe from the winter 10�N, 45�W station plottedwith dissolved oxygen data from the nearby GEOSECSstation 39 (7.8�N, 43.9�W). Temperature and salinityoverlays for our station and the GEOSECS station werenearly identical.
GB1015 BERGQUIST AND BOYLE: DISSOLVED Fe, Mn, AND Cr IN THE ATLANTIC
9 of 14
GB1015
state could be made (Table 2). DFe concentrations wereintegrated over the depth of the mixed layer, and concurrentlabile Fe deposition estimates (90-min, pH 4.5, reducingleach) were used as an input flux of DFe where available[Chen and Siefert, 2004]. This method assumes that atmo-spheric deposition is the dominant source of DFe to themixed layer, that the labile Fe flux estimates are represen-tative of the atmospheric input, and the DFe concentrationsare at steady state. Excluding the winter 30�N site, estimatesof surface residence times in the North Atlantic were 1.5 to5 months (±50%). This agrees with other estimates ofsurface residence times of weeks to a few months [de Baarand de Jong, 2001; Sarthou et al., 2003]. The atmosphericFe concentrations at the winter 30�N station were very low,and the residence time calculation gave unrealistic results.This station had a well-defined surface maximum within themixed layer, which may have been a transient, non–steady-state feature (Figure 4a).[29] For the 24.5�S station, concurrent measurements of
dust were not available. Estimates of dust deposition fromVink and Measures [2001] were used from a similar transectin June 1996. Because of the variability of dust dissolution,two cases (3% and 10%) were chosen on the basis of theobservations from Chen and Siefert [2004], and residencetimes of 14 and 4 months were calculated respectively. Thelong residence time calculated for the 3% case may be dueto our estimate of total atmospheric input being too low.Another possibility is that the surface residence time islonger in an area without large atmospheric input and lowersurface DFe concentrations.3.3.3. Deepwater Column Fe Profiles[30] Deepwater DFe concentrations varied with water
masses depending on their source, age, and transit path-ways. Two deepwater profiles were collected at 10�N and30�N during the winter 2001 North Atlantic cruise and onedeep profile was sampled at 24.5�S on the March 2002
South Atlantic cruise. At the 10�N station, DFe valuesdecrease to an average value of 0.73 ± 0.12 nmol/kg(1 SD, n = 3) below (>1600 m) the high DFe of theOMZ. From the salinity profile (Figures 4c and 6b), thewater from 1600 m to 4200 m can be identified as NorthAtlantic Deep Water (NADW). The Wu et al. [2001] 35�Nstation also sampled NADW (see salinity profile, Figure 6b)and had an average value of 0.64 ± 0.05 nmol/kg (n = 6) atdepths greater than 1600 m, which is lower than ourobserved value. However, we only have three samplesbelow 1600 m, and the 3400-m sample yielded high DFe(0.86 nmol/kg) and hence is potentially contaminated. Theconcentration was measured in analyses from several filtratebottles, so the datum is retained in the sample plots andcalculations. The 30�N station was only sampled to 1050 mand did not sample NADW, but DFe increased below thepycnocline (Figure 4a).[31] The South Atlantic water column profile Fe data are
the first reported that show variations within all the majorwater masses in the South Atlantic. In Figure 5a, the DFeprofile is shown along with reactive silicate data. AntarcticIntermediate Water (AAIW) is the high-Si water just belowthe pycnocline from 700 to 1200 m and has a DFe value of0.38 ± 0.01 nmol/kg (1 SD, n = 4). NADW has lower Siconcentration and forms the core of the deep water from1700 to 3350 m with higher DFe concentrations (0.47 ±0.02 nmol/kg, 1SD, n = 7). Below 3500 m, Si levelsincrease to very high levels at 4040 m (118 mmol/kg)indicative of Antarctic Bottom Water/Lower CircumpolarDeep Water (AABW/LCPDW). The DFe in the AABW/LCPDW was 0.42 ± 0.01 nmol/kg (1 SD, n = 4). There arefew measurements of DFe in the Atlantic sector of theSouthern Ocean, and those data are mostly from surfacewater. Surface waters vary from 0.1 to 0.5 nmol/kg [Martinet al., 1990b; de Baar et al., 1995; Loscher et al., 1997], andDFe concentrations from a profile near the Drake Passage
Table 2. Surface Residence Time Calculationsa
Site
MixedLayer
Depth, m
TotalFe Flux,mg/m2/d
TotalFe Flux,1 SD
PercentLabileFe
Total LabileFe Flux,mg/m2/d
Total LabileFe Flux,1 SD
Integrated DFein MixedLayer,b mg
ResidenceTime,days
Integrated DFein Mixed
Layer, 1 SD
10�N winter 55 630c 350c 5% 30c 16d 2055 69 3710�N summer 32 278c 171d 2% 6.1c 3.3d 1000 164 8930�N summer 11 203c 122d 3% 6.9c 5d 318 46 3230�N winter 100 2.5c 1.4d 28% 0.7c 0.5d 2937 4196e 299724.5�S (varying dissolution) 52 88f 3% 2.7g 1.7h 1122 424 297
52 88f 10% 8.8e 6.2h 1122 128 89
aResidence time estimates assume steady state and that atmospheric deposition is the only input flux into the system. Estimates do not consider verticalmixing or advection.
bThis denotes integrated DFe in a 1 m2 by the depth of mixed layer volume (calculated using measured DFe concentrations in the mixed layer).cTotal atmospheric Fe and labile Fe concentrations were measured concurrently at sea [Chen and Siefert, 2004]. Labile Fe was the Fe dissolved in a 90-
min, reducing, pH 4.5 leaching solution. Fluxes were estimated assuming a 1 cm d�1 deposition rate.dStandard deviation estimates from Chen and Siefert [2004] are the 1s variability of many stations within each region.eThe 30�N had a surface maximum in the mixed layer and decreasing values of Fe in the mixed layer. The in situ measured dust flux for this region is
too low to explain the Fe maximum and/or the steady state assumption for the DFe is incorrect. Thus residence time calculations for this station are likelyunrealistically long.
fThis is based on an estimate of dust flux for this region from June 1996 [Vink and Measures, 2001]. Total Fe deposition flux was calculated assumingan average continental crustal abundance for Fe of 4.3%.
gSince no estimate of total labile Fe exists for this station, two percent dust dissolution values were chosen based on observed labile Fe values from theNorth Atlantic data of Chen and Siefert [2004]; 3% is approximately the average and 10% is near the high end of observed fractions of labile Fe.
hStandard deviation is estimated from the typical variability of Fe flux observed in the work by Chen and Siefert [2004].
GB1015 BERGQUIST AND BOYLE: DISSOLVED Fe, Mn, AND Cr IN THE ATLANTIC
10 of 14
GB1015
were 0.10 to 0.16 nmol/kg at the surface and increased to0.40 nmol/kg at 550 m [Martin et al., 1990b]. These deeperAntarctic DFe concentrations are comparable with ourobservations of DFe concentrations for AAIW andAABW/LCPDW at our site. The higher DFe in the NADWcompared to the Antarctic derived water masses is likelydue to the different sources and pathways of these watermasses. NADW is derived from the North Atlantic that hashigher dust inputs and Fe-replete sinking organic matter. Incontrast, the Antarctic derived water masses originate in aregion of the ocean that has low atmospheric dust inputs andsevere Fe limitation.[32] Two qualitatively useful parameters (Fe* and AOU
estimated Fe:C regeneration ratios) were estimated for thevarious water masses sampled in the deep water at our sites(Table 1). Fe* is defined by Parekh et al. [2005] andis calculated with the following formula: Fe* = [Fe] �(Fe/P)uptake ratio*[PO4�]. Fe* is a measure of the Fedeficiency of the water for biological growth with negativevalues indicating that there is insufficient Fe to supportgrowth based on the available phosphate. The Fe:P uptakeratio (0.47 mmol/mol) used in this estimation corresponds toa Fe:C ratio of 4 mmol/mol [Sunda and Huntsman, 1995]using a Redfield C:P of 117 [Anderson and Sarmiento,1994]. The Fe:C ratio used for the Fe* calculation is areasonable value for a minimum amount of Fe needed forgrowth by oceanic species [Sunda and Huntsman, 1995].[33] As shown in Table 1, Fe* values for the North
Atlantic sites are mostly slightly positive, whereas Fe* isnegative for all the water masses at the South Atlantic site.The most severe Fe deficiencies are observed in the Ant-arctic-derived water masses. The general pattern of Fe*agrees well with model derived estimates of Fe* by Parekhet al. [2005]. The NADW, a major source of water upwell-ing in the Southern Ocean [Tchernia, 1980], is alreadydeficient in DFe relative to phosphate at 24.5�S owing toremoval of Fe by scavenging (Fe* of �0.15 nmol/kg). Thesevere deficiency of Fe relative to phosphate in watersderived from the Southern Ocean is caused by upwellingwater already being deficient in Fe as well as the low dustsupply to the Southern Ocean, which does not supplyenough Fe for the biological pump to utilize the entirephosphate pool. Therefore a large excess of phosphate is leftin the surface waters when it sinks. The excess phosphatecombined with progressive scavenging of Fe as the Antarc-tic water masses move north leads to the low Fe* valuesobserved (�0.43 to �0.57 nmol/kg). It is interesting that theFe* values in the North Atlantic are positive. This lendssupport to arguments by Sunda [1997] that sinking organicmatter in the North Atlantic has higher Fe:C ratios owing toluxury uptake of Fe when more Fe is available.[34] The other quantity estimated from our data set was
Fe:C regeneration ratios based on AOU measurements andan O2:C ratio of �1.6 [Martin et al., 1987; Sunda, 1997].The AOU derived Fe:C regeneration ratio represents theFe:C ratio of remineralized organic matter, but is only validin water masses that sank with very little preformed Fe andhave not had significant loss of DFe due to scavenging(young water masses). The Fe:C ratio of 11 mmol/molestimated for the OMZ at the 10�N site may be represen-
tative of Fe:C ratios of sinking organic matter in the NorthAtlantic due to the high levels of remineralized DFe in theOMZ and the relatively young age of this water. TheNADW at 10�N has an elevated Fe:C regeneration ratio of�17 mmol/mol, which may be due to higher Fe:C ratios ofsinking organic matter in the North Atlantic or preformedFe in the NADW when it sank the in the North Atlantic. Apreformed DFe of 0.3 nmol/kg would lower the estimatedFe:C regeneration ratio to �10 mmol/mol. At 24.5�S, theNADW Fe:C regeneration ratio decreases to 11 mmol/mol(from 17 mmol/mol in the North Atlantic) indicating net lossof Fe by scavenging. The two Antarctic derived watermasses (AAIW and AABW/LCPDW) at 24.5�S have sig-nificantly lower Fe:C regeneration ratios of 5 to 7 mmol/mol, which suggest that remineralized organic matter in theSouth Atlantic and Southern Ocean has lower Fe:C valuesthan the North Atlantic remineralized organic matter. TheAOU-derived estimates of the Fe:C of sinking organicmatter in this study indicate that this ratio may vary by upto a factor two in the Atlantic supporting arguments bySunda [1997].3.3.4. Deepwater Residence Time Estimate[35] The DFe data set can also be used to estimate the
scavenging residence time for DFe in NADW. This can beestimated from the difference between DFe in the NorthAtlantic sites and the South Atlantic site. The NADW at theSouth Atlantic site (0.47 ± 0.02 nmol/kg, 1 SD, n = 4) hassignificantly less DFe than the average of NADW from thenorthern sites (0.67 ± 0.09 nmol/kg, 1 SD, n = 9). Salinityand silicate data indicate that the NADW has not beensignificantly diluted with Antarctic water sources duringtransit from the North Atlantic to 24.5�S station. TheNADW value for the North Atlantic is an average of theDFe concentrations from depths greater than 1600 m fromthe 10�N site from this study and the 35�N site from Wu etal. [2001]. Neither North Atlantic site sampled deep enoughto include AABW/LCPDW (see salinity plot, Figure 6b), soall sample depths below 1600 m are included in the average.The measured difference in the DFe between the NorthAtlantic sites and the South Atlantic site is significant at the95% confidence level using the t-test and a distribution-freetest, the Kolmogorov-Smirnov test [Hollander and Wolfe,1973].[36] In order to calculate a scavenging residence time for
the DFe in the NADW, several factors were consideredincluding (1) dilution of the NADW with low Fe Antarcticwater, (2) remineralization of organic bound Fe along theflow path, and (3) the transit time of NADW from the NorthAtlantic (at 10�N) to the South Atlantic site (24.5�S). Ascan be seen by the salinity profile (Figure 6b), the core ofthe NADW salinity from all sites is nearly the sameindicating very little dilution of the NADW from lowersalinity Antarctic water. However, if one assumes that thesmall increase in Si in NADW observed at GEOSECSstations near our stations (station 39: 8�N, 44�W; station 57:24�S, 35�W) is due to dilution of low-Si NADW withhigh-Si Antarctic water, a modest dilution factor of3.5% can be estimated. Dilution could then account for0.01 nmol/kg of the DFe decrease from the North to SouthAtlantic assuming 0.40 nmol/kg DFe for Antarctic deep
GB1015 BERGQUIST AND BOYLE: DISSOLVED Fe, Mn, AND Cr IN THE ATLANTIC
11 of 14
GB1015
water. DFe gain from remineralization of organic matterwas calculated from the small increase in phosphate fromthe two GEOSECS sites after correcting the phosphate fordilution of NADW with Antarctic waters. Using a Fe:Premineralization ratio of �1 mmol/mol (corresponds to anFe:C of 10 mmol/mol and a C:P of 117), a regenerationinput of 0.04 nmol/kg DFe can be estimated for the transitfrom the northern to the southern station. Combining thedilution loss and the regeneration gain, an increase of DFeof 0.03 ± 0.02 nmol/kg was estimated between the northand south stations. The uncertainty in this estimate is largebecause both the Fe:C regeneration ratio and the dilutionfactor could differ by a factor of 2. The transit time ofNADW was estimated using mixing-corrected radiocarbonage estimates for western Atlantic deep water [Broecker andVirgilio, 1991]. Averaging multiple stations from Broeckerand Virgilio [1991] around our 10�N and 25�S stationsresulted in an age difference of �56 ± 18 years.[37] A scavenging residence time estimate of 270 ±
140 years was calculated for deepwater DFe based on theobserved loss of DFe (0.20 nmol/kg) and the estimatedinput of 0.03 nmol/kg DFe from regeneration minus dilutionin the transit from the northern to southern station. Chang-ing the regenerative- and mixing-induced input to lower andhigher estimates of 0.01 and 0.05 nmol/kg does not signif-icantly change the scavenging residence time estimate (300and 250 years, respectively). Our derived scavenging resi-dence time is very sensitive to the observed decrease in DFefrom the north to south sites and the estimated transit time(e.g., lowering the transit time to 40 years changes ourestimate of scavenging residence time to 200 years). The�50% uncertainty in our estimate is due to the uncertaintiesin the difference between the DFe between the North Atlanticand South Atlantic sites and the transit time. Our estimate ofscavenging residence time agrees with published estimatesof residence time based either on indirect methods [Brulandet al., 1994] or models [Johnson et al., 1997; Parekh et al.,2005]. However, our estimate is longer than residence timeestimations made by de Baar and de Jong [2001]. Theirresidence time calculations of less than 50 years were madeusing estimates of input of DFe to the deep ocean that havevery large uncertainties (order of magnitude) associated withthem. Our residence time estimate is based on the output ofDFe (scavenging) in a water mass where transit time, inputfrom regeneration of organic matter, and dilution loss couldbe constrained.
4. Conclusions
[38] In the subtropical and tropical Atlantic, surface DFeand DMn concentrations follow dust deposition trends. Thecoupling of dust deposition and dissolved concentrations ofthese elements is modified by their chemistry in the surfacewaters. For DFe, biological uptake and scavenging causeDFe levels to be variable and have residence times insurface waters on the order of months (1 to 5 months andpossibly longer in the low DFe, low dust deposition regionsof the South Atlantic). On the basis of dust solubilityexperiments (mesocosm incubation experiments), lowerDFe compared to dissolved Al, and observed excess ligand
concentrations in the North Atlantic, there may be asolubility limit to how much atmospheric Fe can dissolvein the North Atlantic surface waters (�1.15 nmol/kg). DMnhas a longer residence time in surface waters (decades) dueto photochemical cycling; therefore the correlation of DMnand dust deposition is eroded owing to cycling and lateraladvection.[39] Three profiles were measured for DFe in this study in
the western subtropical and tropical Atlantic (30�N, 10�N,and 24.5�S), The DFe concentration profiles generally havenutrient-type profiles with lower concentrations in surfacewaters than in deep water, although the profiles haveinteresting features deviating from classic nutrient-typeprofiles with surface maxima, intermediate water minimaand maxima, and variations clearly associated with watermasses. Surface maxima in DFe were observed at all sitesexcept 10�N in the winter. At the two subtropical gyre sites(30�N, 24.5�S), the surface maxima are followed by broadminima in the DFe within the pycnocline before DFeincreases below depths greater than 700 m. The surfacemaxima in DFe are likely due to atmospheric deposition,but the reason for the decrease in DFe at shallow depths isless clear. There are two possible explanations for thedecrease in DFe: (1) some removal mechanism for theDFe between �30 to 80 m (i.e., scavenging and biologicaluptake), and/or (2) episodic atmospheric dust depositionand transient downward mixing with lower DFe water. Theminima in DFe are often associated with the depth of thechlorophyll maximum. This suggests that some biologicaluptake or scavenging mechanism is responsible for theminima. However, transient downward mixing with lowDFe water is also possible because the DFe remains lowthroughout the pycnocline at the subtropical gyre sites. Thepycnocline water at these sites is ventilated by water massesthat form at higher latitude where dust deposition is lower,and therefore potentially have lower surface DFe concen-trations. In particular in the South Atlantic, this water formsin an area of very low dust deposition and low surface DFeand may be responsible for the low DFe concentrations(<0.3 nmol/kg) observed throughout the pycnocline of theSouth Atlantic site at 24.5�S. It is likely that the cause of theDFe minima is some combination of the mechanisms listedabove.[40] In contrast to the gyre sites, the 10�N station was
located on the edge of the equatorial system and had a veryshallow pycnocline (<250 m). In the winter when the mixedlayer was deep, it was the only station that did not have asurface maximum in DFe. DFe increased rapidly within theshallow pycnocline to concentrations >1 nmol/kg associatedwith an OMZ at depths of 130 to 1050 m. The increase inDFe in the OMZ is likely due to remineralization of highFe:C organic matter into the poorly ventilated intermediatedepth waters of this region. Under the more stratifiedsummer conditions, the 10�N station had a surface maxi-mum followed by a minimum from 50 to 100 m.[41] Deepwater DFe concentrations varied with water
masses depending on their source, age, and transit path-ways. DFe concentrations in NADW decrease by 30% fromthe North Atlantic to South Atlantic, but DFe in the NADWis still higher than DFe in the Antarctic derived water
GB1015 BERGQUIST AND BOYLE: DISSOLVED Fe, Mn, AND Cr IN THE ATLANTIC
12 of 14
GB1015
masses at 24.5�S. DFe in AAIW and AABW/LCPDW islow (�0.4 nmol/kg), which is consistent with observationsof DFe in the Southern Ocean. A deepwater scavengingresidence time for DFe of 270 ± 140 years was estimatedfrom the observed DFe decrease in NADW from the NorthAtlantic to South Atlantic sites. The deep profiles in thisstudy support the hypothesis that deepwater concentrationsof DFe are controlled by a balance between input ofdissolved iron in the deep water (both from remineralizationand lateral transport) and removal by scavenging. ThereforeDFe varies in the deep ocean. Also it is likely that the Fe:Cratio of exported organic matter is higher (>10 mmol/mol) inthe Fe replete regions of the North Atlantic than in the watermasses formed in the lower DFe regions of the SouthAtlantic and Southern Ocean (<7 mmol/mol), which isconsistent with previous estimates that this ratio may varyby a factor of 2 [Sunda, 1997].
[42] Acknowledgments. This research was supported by NSF grantsOCE-0002273 and OCE-99871442. B. Bergquist was funded by theNational Physical Science Foundation, Lawrence Livermore NationalLaboratory, and the Education Office of Woods Hole OceanographicInstitution. We thank Richard Kayser for all his efforts preparing andmaintaining MITESS, and M. Reuer and A. Lima for nutrient analysis onthe March 2002 cruise. We would also like to thank our colleagues in theMANTRA Biocomplexity project (A. Michaels et al.) for all their help at seaand useful discussions. Special thanks go to M. Neumann and M. Ericksonfor assisting in MITESS deployment and recovery at sea, to Ron Siefert andYing Chen for aerosol collection and analysis, and to Douglas Capone andcoworkers for running the large volume mesocosm experiments. We thankthe officers and crews of the R/V Knorr, R/V Seward Johnson, and R/VEndeavor.
ReferencesAnderson, L., and J. Sarmiento (1994), Redfield ratios of remineralizationdetermined by nutrient data analysis, Global Biogeochem. Cycles, 8, 65–80.
Archer, D. E., and K. Johnson (2000), A model of the iron cycle in theocean, Global Biogeochem. Cycles, 14, 269–279.
Bell, J., J. Betts, and E. A. Boyle (2002), MITESS: A moored in-situ traceelement serial sampler for deep-sea moorings, Deep Sea Res., Part I, 49,2103–2118.
Bergquist, B. A. (2004), The marine geochemistry of iron and iron isotopes,Ph.D. thesis, Mass. Inst. of Technol. and Woods Hole Oceanogr. Inst.Joint Program in Oceanogr., Cambridge, Mass.
Boyd, P. W., et al. (2000), A mesoscale phytoplankton bloom in thepolar Southern Ocean stimulated by iron fertilization, Nature, 407,695–702.
Boyd, P. W., et al. (2004), The decline and fate of an iron-induced subarcticphytoplankton bloom, Nature, 428, 549–553.
Boyle, E. A. (1997), What controls dissolved iron concentrations in theworld ocean—A comment, Mar. Chem., 57, 163–167.
Boyle, E. A., B. A. Bergquist, R. Kayser, and N. Mahowald (2005), Iron,manganese, and lead at Hawaii Ocean Time Series Station ALOHA:Temporal variability and an intermediate water hydrothermal plum, Geo-chim. Cosmochim. Acta, 69, 933–952.
Broecker, W. S., and A. Virgilio (1991), Radiocarbon age of waters in thedeep Atlantic revisited, Geophys. Res. Lett., 18(1), 1–3.
Bruland, K. W., K. J. Orians, and J. P. Cowen (1994), Reactive trace metalsin the stratified central North Pacific, Geochim. Cosmochim. Acta, 58,3171–3182.
Chen, Y., and R. Siefert (2004), Seasonal and spatial distributions of drydeposition fluxes of atmospheric total and labile iron over the tropical andsub-tropical North Atlantic Ocean, J. Geophys. Res., 109, D09305,doi:10.1029/2003JD003958.
Chiapello, I., G. Bergametti, L. Gomes, B. Chatenet, F. Dulac, J. Pimenta,and E. S. Soares (1995), An additional low layer transport of Shaelianand Saharan dust of the northeastern tropical Atlantic, Geophys. Res.Lett., 22(23), 3191–3194.
Coale, K. H., et al. (1996), A massive phytoplankton bloom induced by anecosystem-scale iron fertilization experiment in the equatorial PacificOcean, Nature, 383, 495–501.
Coale, K. H., et al. (2004), Southern ocean iron enrichment experiment:Carbon cycling in high- and low-Si waters, Science, 304(5669), 408–414.
de Baar, H. J. W., and J. T. M. de Jong (2001), Distributions, sources andsinks of iron in seawater, in The Biogeochemistry of Iron in Seawater,edited by K. A. Hunter and D. Turner, pp. 123–253, John Wiley,Hoboken, N. J.
de Baar, H. J. W., J. T. M. de Jong, D. C. E. Bakker, B. M. Loscher,C. Veth, U. Bathmann, and V. Smetacek (1995), The importance of ironfor plankton blooms and carbon dioxide drawdown in the SouthernOcean, Nature, 373, 412–415.
de Baar, H. J. W., J. T. M. de Jong, R. F. Notling, K. R. Timmermans, M. A.van Leeuwe, U. Bathmann, M. R. van der Loeff, and J. Sildman (1999),Low dissolved Fe and the absence of diatom blooms in the remote Pacificwaters of the Southern Ocean, Mar. Chem., 66, 1–34.
Duce, R. A., and N. W. Tindale (1991), Atmospheric transport of iron andits deposition in the ocean, Limnol. Oceanogr., 36, 1715–1726.
Falkowski, P. G. (1998), Evolution of the nitrogen cycle and its influenceon the biological sequestration of CO2 in the ocean, Nature, 387, 272–275.
Fukumori, I., F. Martel, and C. Wunsch (1991), The hydrography ofthe North-Atlantic in the early 1980s—An atlas, Prog. Oceanogr., 27,1–110.
Fung, I. Y., S. K. Meyn, I. Tegen, S. C. Doney, J. G. John, and K. B. Bishop(2000), Iron supply and demand in the upper ocean, Global Biogeochem.Cycles, 14, 281–295.
Gao, Y., Y. J. Kaufman, D. Tanre, D. Kolber, and P. G. Falkowski (2001),Seasonal distributions of aeolian iron fluxes to the global ocean, Geo-phys. Res. Lett., 28(1), 29–32.
Gledhill, M., and C. M. G. van den Berg (1994), Determination of com-plexation of iron (III) with natural organic complexing ligands in sea-water using cathodic stripping voltammetry, Mar. Chem., 47, 41–54.
Gregg, W. W., P. Ginoux, P. S. Schopf, and N. W. Casey (2003), Phyto-plankton and iron: Validation of a global three-dimensional ocean bio-geochemical model, Deep Sea Res., Part II, 50, 3143–3169.
Hollander, M., and D. A. Wolfe (1973), Nonparametric Statistical Methods,John Wiley, Hoboken, N. J.
Husar, R. B., J. M. Prospero, and L. L. Stowe (1997), Characterization oftropospheric aerosols over the oceans with the NOAA advanced veryhigh resolution radiometer optical thickness operational product, J. Geo-phys. Res., 102, 16,889–16,909.
Hutchins, D. A., and K. W. Bruland (1998), Iron-limited diatom growth andSi:N uptake ratios in a coastal upwelling regime, Nature, 393, 561–564.
Jickells, T. D., and L. J. Spokes (2001), Atmospheric iron inputs to theoceans, in The Biogeochemistry of Iron in Seawater, edited by K. A.Hunter and D. Turner, pp. 85–121, John Wiley, Hoboken, N. J.
Johnson, K. S., R. M. Gordon, and K. H. Coale (1997), What controlsdissolved iron concentrations in the world ocean, Mar. Chem., 57,137–161.
Johnson, K. S., et al. (2003), Surface ocean– lower atmosphere interactionsin the northeast Pacific Ocean gyre: Aerosols, iron, and the ecosystemresponse, Global Biogeochem. Cycles, 17(2), 1063, doi:10.1029/2002GB002004.
Klinkhammer, G. P., and M. L. Bender (1980), The distribution of manga-nese in the Pacific Ocean, Earth Planet. Sci. Lett., 46, 361–384.
Kumar, N., R. F. Anderson, R. A. Mortlock, P. N. Froelich, P. Kubik,B. Dittrich-Hannon, and M. Suter (1995), Increased biological produc-tivity and export production in the glacial Southern Ocean, Nature, 378,675–680.
Landing, W. M., and K. W. Bruland (1980), Manganese in the NorthPacific, Earth Planet. Sci. Lett., 49, 45–56.
Landing, W. M., and K. W. Bruland (1987), The contrasting biogeochem-istry of iron and manganese in the Pacific Ocean, Geochim. Cosmochim.Acta, 51, 29–43.
Landing, W. M., C. I. Measures, C. S. Buck, and M. Brown (2003), Sec-tions of dissolved iron and aluminum from the 2003 repeat hydrographyA16N expedition, Eos Trans. AGU, 84(52), Ocean Sci. Meet. Suppl.,Abstract OS31L-07.
Lefevre, N., and A. J. Watson (1999), Modeling the geochemical cycle ofiron in the oceans and its impact on atmospheric CO2 concentrations,Global Biogeochem. Cycles, 13, 727–736.
Loscher, B. M., H. J. W. de Baar, J. T. M. de Jong, C. Veth, and F. Dehairs(1997), The distribution of Fe in the Antarctic circumpolar current, DeepSea Res., Part II, 44, 143–187.
Luther, G. W. I., and J. Wu (1997), What controls dissolved iron concen-trations in the world ocean?—A comment, Mar. Chem., 57, 173–179.
Mahowald, N., K. Kohfeld, M. Hansson, Y. Balkanski, S. P. Harrison, I. C.Prentice, M. Schulz, and H. Rodhe (1999), Dust sources and deposition
GB1015 BERGQUIST AND BOYLE: DISSOLVED Fe, Mn, AND Cr IN THE ATLANTIC
13 of 14
GB1015
during the Last Glacial Maximum and current climate: A comparison ofmodel results with paleodata from ice cores and marine sediments,J. Geophys. Res., 104, 15,895–15,916.
Martin, J. H. (1990), Glacial-interglacial CO2 change: The iron hypothesis,Paleoceanography, 5, 1–13.
Martin, J. H., and S. E. Fitzwater (1988), Iron deficiency limits phytoplank-ton growth in the north-east Pacific subarctic, Nature, 331, 341–343.
Martin, J. H., G. A. Knauer, D. M. Karl, and W. W. Broenkow (1987),VERTEX: Carbon cycling in the northeast Pacific, Deep Sea Res., 34,267–285.
Martin, J. H., S. E. Fitzwater, and R. M. Gordon (1990a), Iron deficiencylimits phytoplankton growth in Antarctic waters, Global Biogeochem.Cycles, 4, 5–12.
Martin, J. H., R. M. Gordon, and S. E. Fitzwater (1990b), Iron in Antarcticwaters, Nature, 345, 156–158.
Martin, J. H., et al. (1994), Testing the iron hypothesis in ecosystems of theequatorial Pacific Ocean, Nature, 371, 123–129.
Measures, C. I., and E. T. Brown (1996), Estimating dust input to theAtlantic Ocean using surface water Al concentrations, in The Impactof African Dust Across the Mediterranean, edited by S. Guerzoni andR. Chester, 389 pp., Springer, New York.
Measures, C. I., and S. Vink (2000), On the use of dissolved aluminum insurface waters to estimate dust deposition to the ocean, Global Biogeo-chem. Cycles, 14, 317–327.
Moulin, C., C. E. Lambert, F. Dulac, and U. Dayan (1997), Control of theatmospheric export of dust from North Africa by the North AtlanticOscillation, Nature, 387, 691–694.
Orians, K. J., and K. W. Bruland (1986), The biogeochemistry of aluminumin the Pacific Ocean, Earth Planet. Sci. Lett., 78, 397–410.
Parekh, P., M. J. Follows, and E. A. Boyle (2005), Decoupling of iron andphosphate in the global ocean, Global Biogeochem. Cycles, 19, GB2020,doi:10.1029/2004GB002280.
Powell, R., and J. Donat (2001), Organic complexation and speciation ofiron in the South and equatorial Atlantic, Deep Sea Res., Part II, 48,2877–2893.
Prospero, J. M. (1996), The atmospheric transport of particles to the ocean,in Particle Flux in the Ocean, edited by V. Ittekkott et al., pp. 19–52,John Wiley, Hoboken, N. J.
Rue, E. L., and K. W. Bruland (1995), Complexation of iron (III) by naturalligands in the central North Pacific as determined by a new competitiveligand equilibrium/adsorptive cathodic stripping voltammetric method,Mar. Chem., 50, 117–138.
Rueter, J. G., and D. R. Ades (1987), The role of iron nutrition in photo-synthesis and nitrogen assimilation in Scenedesmus quadeicauda(Chlorophyceae), J. Phycol., 23, 452–457.
Sarthou, G., et al. (2003), Atmospheric iron deposition and sea-surfacedissolved iron concentrations in the eastern Atlantic Ocean, Deep SeaRes., Part I, 50, 1339–1352.
Sigman, D. M., and E. A. Boyle (2000), Glacial/Interglacial variations inatmospheric carbon dioxide: Searching for a cause, Nature, 407, 859–868.
Sunda, W. G. (1997), Control of dissolved iron concentrations in the worldocean: A comment, Mar. Chem., 57, 169–172.
Sunda, W. G., and S. A. Huntsman (1988), Effects of sunlight on redoxcycles of manganese in the southwestern Sargasso Sea, Deep Sea Res.,35, 1297–1317.
Sunda, W. G., and S. A. Huntsman (1995), Iron uptake and growthlimitation in oceanic and coastal phytoplankton, Mar. Chem., 50,189–206.
Tchernia, P. (1980), Descriptive Regional Oceanography, 253 pp., Elsevier,New York.
Vink, S., and C. I. Measures (2001), The role of dust deposition in deter-mining surface water distributions of Al and Fe in the south west Atlan-tic, Deep Sea Res., Part II, 48, 2787–2809.
Wedepohl, K. H. (1995), The composition of the continental crust, Geo-chim. Cosmochim. Acta, 59, 1217–1232.
Wells, M. L., N. M. Price, and K. W. Bruland (1995), Iron chemistry inseawater and its relationship to phytoplankton, Mar. Chem., 48, 157–182.
Witter, A. E., and G. W. Luther (1998), Variation in Fe-organic complexa-tion with depth in the northwestern Atlantic Ocean as determined using akinetic approach, Mar. Chem., 62, 241–258.
Wu, J., and E. A. Boyle (1998), Determination of iron in seawater by highresolution inductively coupled plasma mass spectrometry after Mg (OH)2coprecipitation, Anal. Chim. Acta, 367, 183–191.
Wu, J., and E. A. Boyle (2002), Iron in the Sargasso Sea: Implications forthe processes controlling dissolved Fe distribution in the ocean, GlobalBiogeochem. Cycles, 16(4), 1086, doi:10.1029/2001GB001453.
Wu, J., and G. W. Luther (1995), Complexation of iron (III) by naturalorganic ligands in the northwest Atlantic Ocean by competitive ligandequilibration method and a kinetic approach, Mar. Chem., 50, 159–177.
Wu, J., and G. W. Luther (1996), Spatial and temporal distribution of iron insurface water of the northwest Atlantic Ocean, Geochim. Cosmochim.Acta, 60, 2729–2741.
Wu, J., E. A. Boyle, W. Sunda, and L. Wen (2001), Soluble and colloidaliron in the oligotrophic North Atlantic and North Pacific, Science, 293,847–849.
�������������������������B. A. Bergquist, Department of Geological Sciences, University of
Michigan, 2534 C.C. Little Building, 1100 North University Avenue, AnnArbor, MI 48109, USA. ([email protected])E. A. Boyle, Earth, Atmospheric, and Planetary Sciences, Massachusetts
Institute of Technology, Cambridge, MA 02139, USA.
GB1015 BERGQUIST AND BOYLE: DISSOLVED Fe, Mn, AND Cr IN THE ATLANTIC
14 of 14
GB1015