atlantic hurricane season of 1995 · clone’s duration can occur between the 6-h times ... ness in...
TRANSCRIPT

1124 VOLUME 126M O N T H L Y W E A T H E R R E V I E W
Atlantic Hurricane Season of 1995
M. B. LAWRENCE, B. M. MAYFIELD, L. A. AVILA, R. J. PASCH, AND E. N. RAPPAPORT
National Hurricane Center, Tropical Prediction Center, National Weather Service,National Oceanic and Atmospheric Administration, Miami, Florida
(Manuscript received 3 September 1996, in final form 13 February 1997)
ABSTRACT
The 1995 Atlantic hurricane season is described. There were eight tropical storms and 11 hurricanes for atotal of 19 named tropical cyclones in the Atlantic basin during 1995. This is the second-largest number oftropical storms and hurricanes in over 100 years of records. Thirteen named tropical cyclones affected land.
1. Introduction
This report continues a tradition of Monthly WeatherReview annual summaries of Atlantic basin tropical cy-clone activity that goes back to the year 1881. An over-view of the season is given in section 2. Section 3 is amostly chronological description of the track and in-tensity of each tropical storm and hurricane in the At-lantic Ocean, Caribbean Sea, or Gulf of Mexico during1995. Individual storm descriptions are subdivided into1) synoptic history, 2) meteorological statistics, and 3)casualties and damage, when appropriate. Section 4 isa brief summary of error statistics of National HurricaneCenter (NHC) official track and intensity forecasts.
The data used to track tropical cyclones consist pri-marily of 1) satellite imagery; 2) aircraft reconnaissancedata; 3) conventional surface and upper-air meteorolog-ical observations, including ship reports; and 4) radar.Aircraft reconnaissance is accomplished primarily bythe U.S. Air Force Reserve Unit ‘‘Hurricane Hunters’’from Keesler Air Force Base in Biloxi, Mississippi. Na-tional Oceanic and Atmospheric Administration(NOAA) research aircraft are sometimes used to sup-plement the Hurricane Hunters. Reconnaissance is or-dinarily used when a tropical cyclone is west of 558Wor in a position to threaten land. Tropical cyclones lo-cated east of this longitude are monitored only by sat-ellite and a few island observations. When a tropicalcyclone is within the several-hundred-kilometer rangeof land-based radar, this network of observing tools isinvaluable.
Tracking the center or eye of a tropical cyclone isrelatively straightforward. Except for weak systems, thecenter is a well-defined, mostly cloud-free area of light
Corresponding author address: Miles Lawrence, National Hurri-cane Center, NOAA/NWS/NHC, 11691 S.W. 17 St., Miami, FL33165-2149.
winds and lowest surface pressure. It is reliably locatedfrom both satellite and aircraft data. The intensity ismore difficult to determine, as it is defined as the max-imum 1-min surface (10 m) wind speed, anywhere with-in the tropical cyclone circulation.
The location of the maximum wind speed could beanywhere within 50 km or more from the center, so thata rather large area is involved. Aircraft generally maketwo perpendicular passes through the cyclone, samplingthe flight level wind as often as every 10 s, but thisleaves much of the area not sampled. Also the aircraftflight level ranges from about 450 m to 3 km, and es-timating the surface wind speed from observations atthese altitudes introduces uncertainty. An adjustmentfactor of 0.8 is often used to reduce wind speeds fromflight level, but this value can vary from about 0.5 overnorthern latitudes during stable conditions to 1.0 orhigher in an eyewall in the deep Tropics. This subjectis addressed by Powell and Houston (1998). The Hur-ricane Research Division of NOAA has recently de-veloped a semiobjective analysis scheme that providesa first guess of the surface wind field, using all availabledata.
Estimates derived from satellite data of the maximum1-min surface wind speed of a tropical cyclone are basedon the Dvorak (1984) method. These remote measure-ments are also a source of uncertainty. Satellite intensityestimates, along with a position ‘‘fix’’ of the circulationcenter, are made every 6 h from geostationary satelliteimagery by the Tropical Analysis and Forecast Branchof the Tropical Prediction Center and by the SynopticAnalysis Branch of the National Environmental Satel-lite, Data and Information Service. Similar estimates aremade from polar-orbiting satellites approximately twiceper day by the U.S. Air Force Global Weather Central.
The National Weather Service (NWS) classifies trop-ical cyclones according to the maximum 1-min surfacewind speed. The tropical depression stage is for a max-

MAY 1998 1125L A W R E N C E E T A L .
imum wind speed less than 17.5 m s21 (34 kt); tropicalstorm stage is 17.5–32.4 m s21 (34–63 kt); hurricanestage is 32.9 m s21 (64 kt) or greater. The Saffir–Simp-son hurricane scale (Simpson and Riehl 1981) is alsowidely used to give an indication of the intensity. Thecategories for this scale are defined by wind speed asfollows: category 1: 32.9–42.5 m s21 (74–95 mph), cat-egory 2: 42.9–49.2 m s21 (96–110 mph), category 3:49.6–58.1 m s21 (111–130 mph), category 4: 58.6–69.3m s21 (131–155 mph), category 5: greater than 69.3 ms21 (155 mph). Minimum sea level pressure and stormsurge height are also used to define the Saffir–Simpsonscale, but only when the wind speed is not adequatelyknown.
2. Overview of the hurricane season
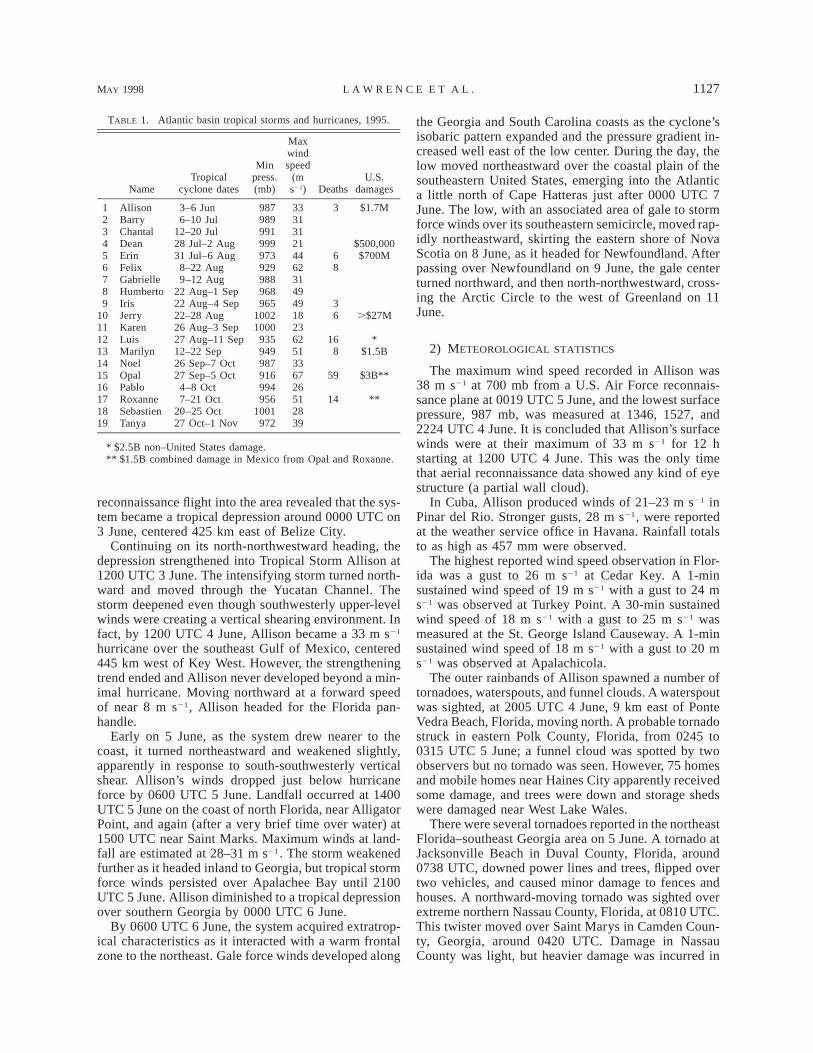
Figure 1 shows the tracks of this season’s 19 namedtropical cyclones of which 11 became hurricanes. Table1 is a listing of storm name, dates, minimum centralsurface pressure, maximum 1-min surface wind speed,death totals, and total dollar damage. The tracks in Fig.1 are based on ‘‘best track’’ statistics, which are deter-mined at the NHC after consideration of all availabledata. The best track is a table of latitude and longitude,or position, of the tropical cyclone center, central pres-sure, and maximum wind speed every 6 h. It is possiblethat the maximum wind speed during a tropical cy-clone’s duration can occur between the 6-h times of thebest track data. For example, Hurricane Erin’s highestwind speed of 44 m s21 occurred at 1330 UTC 3 Augustduring landfall near Fort Walton Beach, Florida, where-as the best track for Erin shows a maximum wind speedof 41 m s21 at 1200 UTC. An additonal source of un-certainty of the wind speed is a result of the fact thatthe wind speed values in Table 1 were originally com-piled in units of knots and rounded off to the nearest 5kt before being converted to meters per second. It wouldbe difficult to quantify the uncertainty of the wind speedestimates in Table 1 and throughout this paper.
The number of tropical storms and hurricanes, byyear, is given by Neumann et al. (1993). Since the year1871, this year’s 19 tropical storms and hurricanes issecond in number only to the year 1933 (21 tropicalstorms and hurricanes). This year’s 11 hurricanes wereexceeded in 1969 (12 hurricanes) and tied in 1916 and1950. Also, the previous 50-yr average is for 9.6 tropicalstorms, of which 5.6 become hurricanes. There are othermeasures of a hurricane season’s activity. Landsea et al.(1998) have compiled an index of seasonal activity since1950. This season’s index is the second largest duringthis 46-yr period.
Such an anomalously active year is expected to beaccompanied by strong ‘‘signals’’ from parameters thathave been causally related to hurricanes. One such pa-rameter is the vertical shear in the horizontal wind,which when large enough, can disrupt the energetic pro-cesses that maintain a storm’s intensity. Landsea et al.
(1998) review the environmental conditions of the 1995season. They show an August–October 1995 anomalyfield of the magnitude of the vertical wind shear betweenthe upper-level and lower-level winds. There are neg-ative anomalies across the tropical Atlantic Ocean, theCaribbean Sea, and the southern Gulf of Mexico. Neg-ative values of up to 7 m s21 are found in the centralCaribbean area.
A feature of this season’s tracks is the many tropicalcyclones that recurved across the North Atlantic. It isspeculated that there should be a corresponding weak-ness in the western North Atlantic subtropical high pres-sure ridge and, indeed, Landsea et al. (1998) show aweak 500-mb trough (and negative 500-mb heightanomalies) over the western North Atlantic Ocean forthe August–October 1995 mean fields.
Some of the season highlights include the following.The origins of 17 of the year’s storms and hurricaneswere attributable to tropical waves that moved fromwestern Africa into the eastern Atlantic Ocean. OnlyTropical Storms Barry and Dean did not originate fromtropical waves. There were five tropical cyclones ongoing at the same time in the Atlantic basin on 27 and28 August. A total of 123 deaths were estimated to havebeen caused by tropical storms and hurricanes this year.Damages from Hurricane Opal are estimated at $3 bil-lion in the Florida panhandle and across the southeasternUnited States. Hurricane Luis caused an estimated $2.5billion in damage to the northeastern Leeward Islandsof the Caribbean and Hurricane Marilyn caused $1.5billion in damage in the northeastern Caribbean, pri-marily to the U.S. Virgin Islands.
3. Description of individual named tropicalcyclones
a. Hurricane Allison, 3–6 June
Allison was an early season hurricane that formedover the northwest Caribbean Sea. It weakened to slight-ly below hurricane strength just before making landfallin north Florida. Allison was responsible for one deathin western Cuba.
1) SYNOPTIC HISTORY
Satellite images and rawinsonde data show that a trop-ical wave passed over the Windward Islands on 28 May.When the wave entered the western Caribbean Sea on1 June, it was accompanied by a broad midlevel cycloniccirculation, which rawinsonde observations indicatedwas particularly distinct at the 700-mb level. Convectivecloudiness acquired sufficient organization to warrantan initial Dvorak satellite classification at 0000 UTC 2June. At that time, the cloud cluster was located severalhundred km to the east of Honduras. The system movednorth-northwestward and gradually became better or-ganized during the daylight hours of 2 June. The first

1126 VOLUME 126M O N T H L Y W E A T H E R R E V I E W
FIG
.1.
Trop
ical
stor
man
dhu
rric
ane
trac
ksfo
r19
95.
MAY 1998 1127L A W R E N C E E T A L .
TABLE 1. Atlantic basin tropical storms and hurricanes, 1995.
NameTropical
cyclone dates
Minpress.(mb)
Maxwindspeed
(ms21) Deaths
U.S.damages
12345
AllisonBarryChantalDeanErin
3–6 Jun6–10 Jul
12–20 Jul28 Jul–2 Aug31 Jul–6 Aug
987989991999973
3331312144
3
6
$1.7M
$500,000$700M
6789
10
FelixGabrielleHumbertoIrisJerry
8–22 Aug9–12 Aug
22 Aug–1 Sep22 Aug–4 Sep22–28 Aug
929988968965
1002
6231494918
8
36 .$27M
1112131415
KarenLuisMarilynNoelOpal
26 Aug–3 Sep27 Aug–11 Sep12–22 Sep26 Sep–7 Oct27 Sep–5 Oct
1000935949987916
2362513367
168
59
*$1.5B
$3B**16171819
PabloRoxanneSebastienTanya
4–8 Oct7–21 Oct
20–25 Oct27 Oct–1 Nov
994956
1001972
26512839
14 **
* $2.5B non–United States damage.** $1.5B combined damage in Mexico from Opal and Roxanne.
reconnaissance flight into the area revealed that the sys-tem became a tropical depression around 0000 UTC on3 June, centered 425 km east of Belize City.
Continuing on its north-northwestward heading, thedepression strengthened into Tropical Storm Allison at1200 UTC 3 June. The intensifying storm turned north-ward and moved through the Yucatan Channel. Thestorm deepened even though southwesterly upper-levelwinds were creating a vertical shearing environment. Infact, by 1200 UTC 4 June, Allison became a 33 m s21
hurricane over the southeast Gulf of Mexico, centered445 km west of Key West. However, the strengtheningtrend ended and Allison never developed beyond a min-imal hurricane. Moving northward at a forward speedof near 8 m s21, Allison headed for the Florida pan-handle.
Early on 5 June, as the system drew nearer to thecoast, it turned northeastward and weakened slightly,apparently in response to south-southwesterly verticalshear. Allison’s winds dropped just below hurricaneforce by 0600 UTC 5 June. Landfall occurred at 1400UTC 5 June on the coast of north Florida, near AlligatorPoint, and again (after a very brief time over water) at1500 UTC near Saint Marks. Maximum winds at land-fall are estimated at 28–31 m s21. The storm weakenedfurther as it headed inland to Georgia, but tropical stormforce winds persisted over Apalachee Bay until 2100UTC 5 June. Allison diminished to a tropical depressionover southern Georgia by 0000 UTC 6 June.
By 0600 UTC 6 June, the system acquired extratrop-ical characteristics as it interacted with a warm frontalzone to the northeast. Gale force winds developed along
the Georgia and South Carolina coasts as the cyclone’sisobaric pattern expanded and the pressure gradient in-creased well east of the low center. During the day, thelow moved northeastward over the coastal plain of thesoutheastern United States, emerging into the Atlantica little north of Cape Hatteras just after 0000 UTC 7June. The low, with an associated area of gale to stormforce winds over its southeastern semicircle, moved rap-idly northeastward, skirting the eastern shore of NovaScotia on 8 June, as it headed for Newfoundland. Afterpassing over Newfoundland on 9 June, the gale centerturned northward, and then north-northwestward, cross-ing the Arctic Circle to the west of Greenland on 11June.
2) METEOROLOGICAL STATISTICS
The maximum wind speed recorded in Allison was38 m s21 at 700 mb from a U.S. Air Force reconnais-sance plane at 0019 UTC 5 June, and the lowest surfacepressure, 987 mb, was measured at 1346, 1527, and2224 UTC 4 June. It is concluded that Allison’s surfacewinds were at their maximum of 33 m s21 for 12 hstarting at 1200 UTC 4 June. This was the only timethat aerial reconnaissance data showed any kind of eyestructure (a partial wall cloud).
In Cuba, Allison produced winds of 21–23 m s21 inPinar del Rio. Stronger gusts, 28 m s21, were reportedat the weather service office in Havana. Rainfall totalsto as high as 457 mm were observed.
The highest reported wind speed observation in Flor-ida was a gust to 26 m s21 at Cedar Key. A 1-minsustained wind speed of 19 m s21 with a gust to 24 ms21 was observed at Turkey Point. A 30-min sustainedwind speed of 18 m s21 with a gust to 25 m s21 wasmeasured at the St. George Island Causeway. A 1-minsustained wind speed of 18 m s21 with a gust to 20 ms21 was observed at Apalachicola.
The outer rainbands of Allison spawned a number oftornadoes, waterspouts, and funnel clouds. A waterspoutwas sighted, at 2005 UTC 4 June, 9 km east of PonteVedra Beach, Florida, moving north. A probable tornadostruck in eastern Polk County, Florida, from 0245 to0315 UTC 5 June; a funnel cloud was spotted by twoobservers but no tornado was seen. However, 75 homesand mobile homes near Haines City apparently receivedsome damage, and trees were down and storage shedswere damaged near West Lake Wales.
There were several tornadoes reported in the northeastFlorida–southeast Georgia area on 5 June. A tornado atJacksonville Beach in Duval County, Florida, around0738 UTC, downed power lines and trees, flipped overtwo vehicles, and caused minor damage to fences andhouses. A northward-moving tornado was sighted overextreme northern Nassau County, Florida, at 0810 UTC.This twister moved over Saint Marys in Camden Coun-ty, Georgia, around 0420 UTC. Damage in NassauCounty was light, but heavier damage was incurred in

1128 VOLUME 126M O N T H L Y W E A T H E R R E V I E W
Camden County, where an elementary school in SaintMarys sustained building damage and facilities at theKings Bay Naval Submarine Base were damaged. Nu-merous trees were downed at the base as well. At 0930UTC, a waterspout moved onshore near Brunswick inGlynn County, Georgia, causing minor damage to struc-tures.
A funnel cloud with a possible brief touchdown tookplace at 1000 UTC near Everret City, also in GlynnCounty, Georgia. Two tornado touchdowns occurredsouth of Brunswick, Georgia, at 1045 UTC. A tornadowas reportedly sighted near Gainesville, Alachua Coun-ty, Florida, at 1251 UTC. There was also a possibletornado east of Interlachen in Putnam County, Florida,around 1340 UTC.
Rainfall totals were generally between 100 and 150mm near the path of Allison, from Florida through NorthCarolina.
Storm surge heights of at least 2.1 m above NationalGeodetic Vertical Datum were measured in ApalacheeBay (Turkey Point). Maximum storm surge heights wereestimated at 1.8–2.4 m from Wakulla through Dixiecounties, 1.2–1.8 m in Franklin County, and 0.6–1.5 mfrom Levy through Hillsborough Counties.
3) CASUALTY AND DAMAGE STATISTICS
The main impact on Cuba was heavy rains, and threedeaths were caused by the collapse of structures in west-ern Cuba. Overall, economic losses were apparently notlarge.
In the United States, there were no direct deaths dueto Allison. Damage was greatest in the coastal sectionsof Dixie, Levy, Taylor, and Wakulla Counties, mainlyfrom storm surge effects, with 60 houses and businessesdamaged. A house collapsed at Bald Point in FranklinCounty. About 5000 people evacuated from the coast.Other coastal effects included mostly minor beach ero-sion, damage to seawalls and coastal roadways, and thesinking of several small boats. Otherwise, minor winddamage to roofs, signs, power lines, and trees occurredover most of the north Florida peninsula. Some rela-tively minor crop damage was also reported.
Total damage in Florida is estimated at $860,000, andthe tornado near St. Marys, Georgia, caused about$800,000 in damage, bringing Allison’s overall U.S.damage figure to $1.7 million.
b. Tropical Storm Barry, 6–10 July
Barry produced gale-force winds over the CanadianMaritime Provinces.
1) SYNOPTIC HISTORY
A weak 1019-mb frontal low was located midwaybetween Bermuda and the South Carolina coast at 0600UTC 5 July. Maximum sustained winds around the low
were 5–10 m s21 based on available ship reports. Sat-ellite imagery indicated that the clouds associated withthe low gradually became isolated from the frontal cloudband over the next 24–36 h. The satellite imagery alsorevealed that a low-level cloud system center becamebetter defined just to the west of a small cluster of deepconvection, and it is estimated that the frontal low trans-formed into a tropical depression at 1800 UTC 6 July.Little overall movement was noted on 5 and 6 July.
The center of circulation became better defined by acurved low- to midlevel cloud band and the depressionstrengthened into Tropical Storm Barry at 0600 UTC 7July. During this day, the storm began moving towardthe north-northeast near 5 m s21 and deep convectionmoved cyclonically around the western semicircle ofthe circulation. The deepest convection moved from justnorth through west to south of the circulation center.The presence of a negatively tilted mid- to upper-leveltrough just to the southwest of Barry appears to havefavored this increase in convection.
The maximum sustained winds of 31 m s21 are es-timated to have occurred near 2100 UTC 7 July, afterwhich the central convection decreased dramatically.
Satellite imagery revealed a cloud-free center withinrelatively weak surrounding convection by 0000 UTC8 July. The next aircraft reconnaissance report indicatedthat the minimum central pressure had changed little,but the maximum flight-level winds had decreased about20 m s21 from those that were measured the previousday. By 1800 UTC 8 July, a small area of deep con-vection had developed near the low-level circulationcenter. The storm began accelerating toward the north-northeast in advance of a large amplitude trough movingeastward over the eastern United States. The centraldense overcast grew until near 1200 UTC 9 July. Someof this increase in convection may have been related tothe passage of Barry over a warm water eddy that bulgednorthward from the Gulf Stream to near 428N and be-tween 638 and 668W.
Convection associated with Barry began to weakenas the tropical cyclone continued to accelerate towardthe north-northeast over cooler water. The maximumwinds began to spread out away from the cyclone centeras Barry gradually lost tropical characteristics, althoughupper-air soundings indicated that the cyclone still ex-hibited a warm core when it passed near Sable Island.The center of the storm crossed the eastern tip of thepeninsula of Nova Scotia around 2130 UTC 9 July andthen continued north-northeastward over Cape BretonIsland. Barry became extratropical near the westerncoast of Newfoundland shortly after 0600 UTC 10 July,when the track ends in Fig. 1.
The weakening remnants lost their identity near thesoutheast coast of Labrador.
2) METEOROLOGICAL STATISTICS
On 9 July, Hart Island, Nova Scotia, reported 990.8mb at 2145 UTC and Fourchu Head, Nova Scotia, re-ported 990.6 mb at 2248 UTC.

MAY 1998 1129L A W R E N C E E T A L .
The maximum wind reported by aircraft was 44 ms21 at a flight level of 457 m at 2050 UTC 7 July, whilethe highest satellite wind estimates at that time were 18m s21. The storm was assigned a maximum surface windspeed of 31 m s21, based on the minimum surface pres-sure of 998 mb and a pressure–wind relationship givenby Dvorak (1984). Similar scatter occurred between thesatellite estimates and the aircraft measurements of max-imum winds on 8 July as well. Given the large amountof scatter, there is considerable uncertainty in the besttrack wind speed on Tropical Storm Barry.
c. Tropical Storm Chantal, 12–20 July
Chantal was a 31 m s21 tropical storm that developedjust east of the Lesser Antilles, recurved around thewestern periphery of the Atlantic subtropical high pres-sure ridge, and became extratropical east of Newfound-land as it moved over the far North Atlantic Ocean.
1) SYNOPTIC HISTORY
Chantal originated from a tropical wave that movedoff of the coast of Africa on 5 July and soon showedsigns of a low-level cloud circulation. By 12 July, sat-ellite imagery showed enough organization for the sys-tem to be upgraded to a tropical depression while it waslocated a few hundred km east of the Lesser Antilles.An aircraft investigated on 13 July and confirmed theexistence of a depression.
Even though there were signs of unfavorably strongupper-level westerlies, the depression strengthened to astorm on 14 July, while centered a little under 400 kmnorth-northeast of Puerto Rico. On 15 July, it threatenedthe southeast and central Bahamas as it was movingwest-northwestward, but it gradually recurved towardthe north on the 16 and 17 July and did not directlyaffect the Bahamas.
The storm’s maximum 1-min surface wind of 31 ms21 is estimated to have been reached on 17 July as itwas moving northward between Bermuda and the U.S.mid-Atlantic coast. Although there was a brief threat toBermuda, the center passed well to the west of there on18 July. Chantal turned toward the northeast and ac-celerated across the North Atlantic shipping lanes whereit became extratropical on 20 July.
2) METEOROLOGICAL STATISTICS
The storm was monitored by reconnaissance aircraftfrom 13 to 18 July. There were 40 penetrations into thecenter of the storm during this period, which averagesto one fix every 3 h. The lowest surface pressure re-ported from an aircraft was 991 mb at 2338 UTC 16July and the maximum wind speed was 34 m s21 at aflight level of 457 m and a few hours earlier.
d. Tropical Storm Dean, 28 July–2 August
1) SYNOPTIC HISTORY
Tropical Storm Dean developed from a broad quasi-stationary midlevel trough extending from the north-eastern Gulf of Mexico across Florida. On 27 July, aweak cyclonic circulation was indicated by buoy reportsin the eastern Gulf of Mexico accompanied by surfacepressure falls of about 2.5 mb in 24 h. At that time,satellite images showed that thunderstorm activity wasdisorganized but the upper-level outflow was becomingestablished. On the 28th, animation of high-resolutionvisible satellite images clearly showed a low-level cy-clonic rotation. Based on that information and on sur-face reports, it is estimated that a tropical depressionformed about 550 km southeast of New Orleans at 1800UTC 28 July.
A reconnaissance plane was dispatched to the areaand located a circulation center with a central surfacepressure of 1008 mb. The maximum flight-level windwas 16 m s21. The depression moved slowly for twodays toward the west to west-northwest around a well-established midlevel high pressure ridge located overthe central United States. Finally, by the afternoon of30 July, the surface pressure dropped from 1005 to 999mb and the flight-level (457 m) winds increased from21 to 26 m s21. It is estimated that the depression becameTropical Storm Dean at 1800 UTC 30 July about 100km from the upper Texas coast. The center of Deancrossed the coast near Freeport, Texas, a few hours later.
Dean weakened to tropical depression status shortlyafter landfall and then became nearly stationary forabout 24 h over the northwest portion of the state pro-ducing heavy rainfall. It dissipated at 0000 UTC 3 Au-gust as it merged with a frontal zone.
2) METEOROLOGICAL STATISTICS
There were no reports of tropical storm–force winds(1-min sustained) from surface land stations. The high-est observed wind was a 23 m s21 gust reported at Gal-veston Scholes Field at 2115 UTC 30 July. The stormsurge flooded Highway 82 between Johnsons Bayou andHolly Beach in Cameron Parish, Louisiana. Minor stormsurge flooding of highway 87 occurred on 30 July.
There were two tornadoes associated with Dean. Thefirst occurred in Galveston County at High Island around2330 UTC and the second touched down just southeastof Anahua near 0300 UTC. Rainfall totals reached ashigh as 426 mm at Monroe City just east of Houston.
3) CASUALTY AND DAMAGE STATISTICS
There were no reports of injuries or deaths associatedwith Dean. However, rainfall caused approximately$500,000 in damage. Evacuation of 20 families wasnecessary in Chambers County due to rainfall flooding.

1130 VOLUME 126M O N T H L Y W E A T H E R R E V I E W
e. Hurricane Erin, 31 July–6 August
1) SYNOPTIC HISTORY
Erin formed from a tropical wave that crossed fromthe coast of Africa to the tropical eastern Atlantic Oceanon 22 July. A large area of disturbed weather and twodistinct low-level circulation centers accompanied thewave. The circulation centers were oriented from north-west to southeast and moved in tandem toward the west-northwest over the next five days.
By 27 July, both circulations were generating deepconvection several hundred kilometers to the northeastof the Leeward Islands. On 30 July, satellite intensityestimates put the wind speed at 18 m s21, indicatingthat a tropical storm had formed. However, although thecloud pattern was slowly consolidating and surface pres-sures were falling ahead of the system in the Bahamas,development was retarded by southwesterly verticalwind shear associated with an upper-level low that wasmoving southwestward at 5–8 m s21 across Florida. Re-connaissance data on 28–30 July indicated that the sys-tem did not have a closed circulation at low levels.Instead it was a very vigorous tropical wave with windsspeeds near 21 m s21 reported from ships in the northernpart of the cloud pattern. Finally, at 0000 UTC 31 July,a reconnaissance mission determined the existence of aclosed low-level circulation and tropical storm–forcewind speeds and Tropical Storm Erin had formed overthe southeastern Bahamas.
The upper-level low near Florida affected Erin’smovement and development. Associated steering cur-rents accelerated Erin from 2.6 to 7.7 m s21 and divertedthe cyclone around the northeast side of the low. Thetemporary and fairly subtle change of heading fromwest-northwest to northwest might have been insignif-icant if Erin had not been so close to land. Instead, thetrack of the center was deflected to a course that wasover or near much of the Bahama Island chain and thentoward a landfall over east-central (rather than south-east) Florida. As this occurred, enough shearing per-sisted to permit only slow strengthening. Late on 31July, Erin became a hurricane while centered near RumCay in the Bahamas. A ragged-looking eye appeared onsatellite pictures on 1 August. Erin made landfall around0600 UTC 2 August near Vero Beach, Florida, as acategory 1 hurricane, with estimated maximum 1-minwind speeds of 39 m s21.
Erin’s track turned back to west-northwest while thecyclone crossed the Florida peninsula during the morn-ing and early afternoon of 2 August. The cyclone weak-ened to a tropical storm with 26 m s21 winds duringthat period, but remained well organized. Upon emerg-ing into the eastern Gulf of Mexico, Erin reintensifiedon a track that gradually swung back to northwestwardat about 5 m s21. The final landfall occurred near Pen-sacola, Florida, during the late morning of 3 August.An eye had redeveloped but upper-level outflow wasnot particularly impressive on satellite images. Erin had
44 m s21 winds (category 2) in a small area of its north-eastern eyewall when that part of the hurricane cameashore near Fort Walton Beach.
Erin weakened to a tropical storm in southeasternMississippi overnight on 3 and 4 August. It was a trop-ical depression when its track shifted to the north onthe 5th and the east on the 6th. The depression mergedwith a frontal system over West Virginia on 6 August.
2) METEOROLOGICAL STATISTICS
Table 2 lists selected surface observations. The high-est wind gust reported at the surface was 66 m s21 inassociation with a tornado at Providenciales in the Turksand Caicos Islands.
Several reports of 10-min-average hurricane forcewinds were received from the Bahamas, including 35and 36 m s21 during the passage of the northeast partof the eyewall over Cat Island at 0200 and 0400 UTC,respectively, on 1 August. These wind speeds are about80% of the 44 m s21 maximum 10-s 850-mb flight-levelwinds encountered by the reconnaissance aircraft. Sev-eral amateur radio reports included gusts to around 46m s21 in the Bahamas. The ship Tampa was in the north-eastern eyewall at 1200 UTC 1 August when it reporteda 36 m s21 wind speed.
The basis for the 39 m s21 1-min wind speed estimatealong the Florida east coast was an observation of 38m s21 recorded by a Florida Institute of Technologyanemometer, which made one observation per hour atSebastian Inlet. This wind appears to coincide with thepassage of one of Erin’s strongest convective cells atthat time (0500 UTC), which was located in the north-western eyewall. The Melbourne NWS Doppler radarmeasured a slightly higher value of 44 m s21 in theoffshore northeast quadrant of the eyewall at an ele-vation of approximately 2100 m and the maximum 850-mb flight-level aircraft wind speed was also near 44 ms21.
It is estimated that the maximum sustained wind dur-ing the Florida panhandle landfall was 44 m s21, at 1330UTC on 3 August near Fort Walton Beach. This tookplace in a small area within Erin’s strongest sector, thenortheastern eyewall, as it swept across the shoreline.That estimate is based largely on the NWS Doppler winddata from Mobile, which showed inbound wind speedsexceeding 51 m s21 at the coast at an elevation of 3000m from 1320 to 1400 UTC. The aircraft peak 850-mbflight-level wind speed leading up to this time was 47m s21 in the northeastern eyewall near 1200 UTC, butsubsequent excursions into that part of the hurricanewere precluded by the hurricane’s close proximity toland.
Doppler velocities decreased by about 8 m s21 overthe following 2 h and 39 m s21 is the estimated maxi-mum surface wind speed when the center of the eyecame ashore around 1600 UTC. Hence, the coastal re-gion immediately west of Fort Walton Beach, including

MAY 1998 1131L A W R E N C E E T A L .
Pensacola, experienced category 1 conditions, thoughgusts to near 51 m s21 likely occurred. The FAA systemof six anemometers at Pensacola Regional Airport reg-istered a maximum 30-s wind speed of about 31 m s21.The highest wind speed measured at an official reportingstation in the Florida panhandle was a 45-m s21 gust atthe Pensacola Naval Air Station. Amateur radio oper-ators relayed unofficial observations of gusts near 49 ms21.
The hurricane’s lowest surface pressure of 973 mbwas reported from aircraft near 1330 UTC and againnear 1600 UTC 3 August. The latter report placed thecenter of Erin near the coast and in the southern partof the eye as seen on land-based radar.
The Melbourne NWS Office estimated that Erin gen-erated a 0.6–1.2-m storm tide during the Florida eastcoast landfall. Storm tides ranged up to 0.6 m along thewest-central Florida peninsula. According to the Mel-bourne office, up to about 300 mm of rain fell southwestthrough northwest of their site. Several small, brief tor-nadoes occurred over east-central Florida well after Erinmade landfall. One tornado caused minor damage inTitusville. Another occurred near Lake Lizzie, killingtwo horses. A couple of weak tornadoes were also re-ported over northeast Florida and in the panhandle nearHurlburt Air Force Base.
Storm tides were estimated up to 2.1 m just west ofNavarre Beach and up to 1.2 m along Pensacola Beach.Up to about 127 mm of rain was reported from thepanhandle.
3) CASUALTY AND DAMAGE STATISTICS
There were no deaths reported in the Bahamas or inFlorida. A total of six drowning deaths occurred in theAtlantic and Gulf of Mexico waters off Florida. The234-ft gambling and cruise ship Club Royale sank inthe Atlantic 170 km east of Cape Canaveral and threecrew members are presumed dead. A 15-yr-old surferdrowned in a rip current off Palm Beach County. A manand daughter in an inflatable boat were swept from theCape San Blas area into the Gulf of Mexico where theypresumably drowned.
All Bahamas islands from Mayaguana to Grand Ba-hama suffered damage characterized by the BahamasDepartment of Meteorology as mostly minor. Somestructural damage, sunken boats, crop loss, and floodingwas reported. Losses known to date for Abaco, GrandBahama, Mayaguana, and Exuma total $400,000.
The American Insurance Services Group estimated$375 million as the loss to insured property in the UnitedStates caused by Erin ($350 million in Florida, $20million in Alabama, and $5 million in Mississippi). Be-cause the total loss is usually estimated by the NHC tobe up to about double the insured loss, the total UnitedStates loss is estimated at $700 million.
Wind damage occurred over east-central and north-east Florida. Thousands of homes and businesses suf-
fered damage in Brevard County. Less significant dam-age occurred in other counties in the region. Freshwaterflooding from rainfall occurred in the Melbourne andPalm Bay areas and westward in some spots to the Flor-ida gulf coast. Beach erosion occurred along the centralFlorida east coast, with damage mainly to boardwalks,beach access ways, and the dune system. Light to mod-erate beach erosion was also reported northward to theGeorgia border. Minor erosion occurred along the west-central Florida coast.
The most significant structural damage for the finallandfall occurred on Pensacola Beach, Navarre Beach,around Mary Esther, and in northeast Pensacola. Morethan 2000 homes were damaged there and crop losseswere reported. Some beach erosion was reported westof Navarre Beach. Farther inland, about 100 homes weredamaged in Alabama. Widespread tree, power line, andcrop damage extended inland.
f. Hurricane Felix, 8–22 August
1) SYNOPTIC HISTORY
A tropical wave moved off the African coast on 6August. Satellite imagery indicated that it quickly dis-played evidence of a closed circulation as it moved to-ward the west. The disturbance became Tropical De-pression Seven about 750 km west-southwest of theCape Verde Islands at 0000 UTC 8 August when looselyorganized deep convection increased.
The depression strengthened into Tropical Storm Fe-lix later on 8 August and followed a west-northwestwardtrack at 8–10 m s21 for the next three days. Based onsatellite intensity estimates, Felix reached hurricanestrength at 0000 UTC 11 August while centered about900 km east-northeast of the Leeward Islands. Reportsfrom reconnaissance aircraft indicated rapid strength-ening from the time of the first eye penetration near1200 UTC 11 August through 12 August. Maximumsustained surface winds of 62 m s21 are estimated tohave occurred near 1800 UTC 12 August. A well-de-fined eye was visible in satellite imagery at this time,as shown in Fig. 2.
Felix moved northwestward on 12 August, and thenturned more toward the north and started to weaken on13 August. Two factors likely contributed to the weak-ening: 1) Felix went through a concentric eyewall cycle,and 2) wind shear increased over the system. Aircraftdata indicated a large wind field with several wind max-ima and no tight center on 13 August, when Felix wascentered 150–200 km south-southeast of Bermuda.These characteristics would persist for much of the re-mainder of the track.
Felix’s northward turn was due to a large deep-layertrough over the western Atlantic. The trough split asFelix approached, with one part moving northeastwardand filling and the other moving southward to the south-west of the hurricane. The resulting steering pattern al-

1132 VOLUME 126M O N T H L Y W E A T H E R R E V I E W
TABLE 2. Hurricane Erin selected surface observations, July–August 1995.
Location Press. (mb)Date/time
(UTC)
Sustainedwind
(m s21)a
Peak gust(m s21)
Date/time(UTC)b
Storm tide(m)c
Total rain(mm)
BahamasCat IslandGrand BahamaChurch Grove, Crooked I.
989.2987.8
1/06001/2250
3635 46
1/04001/2146
309San SalvadorExumaLong Island
1000.01003.3
995.9
1/01001/060031/2100
272321
1/01001/010031/1800
FloridaSebastian InletMelbourne (MLB)Vero Beach (VRB)Orlando Int. (ORL)Daytona Beach (DAB)
985.1985.8986.1994.8
1004.7
2/06002/07002/05542/09072/0856
3934312820
2/05002/08032/04492/10032/0816
22462
15Port St. Lucie City HallCape Canaveral (USAF)Melbourne NWSOMelbourne 58NVero Beach 48W
23 273737c
2/06002/07102/0555 258
21180
Sebastian 28SMelbourne 108SFt. Pierce IntercoastalOrlando (MCO)MIBFI
980.8989.8
2/07142/0415 15
12
25
19
2/0415
3/0000
52
7565
Jacksonville (JAX)Mayport Navy BaseMayport Monty’s MarinaFernandina HarborJacksonville Bch Pier
1010.81008.0
2/11502/1155
11 1923262731
2/19222/12552/13002/13002/1415
53
Gainesville (GNV)Ocala unofficialBrooksville ASOSNew Port Richey ASOSSt. Petersburg ASOS
1006.81002.0
993.3
2/14452/1330
2/1437 1216
1421212021
2/1145
2/11132/17552/1250
46
Tampa Int. Arpt. ASOSRuskin NWSO TBWSunshine Skyway BridgeLake WalesLakeland (LAL) 993.6 2/1200
15
14
10
2019223120
2/13122/18202/18422/18152/1100
Winter Haven ASOSSarasota (SRQ)St. AugustineJacksonville BeachFlagler Beach
987.51002.4
2/11072/1347
1610
2218
2/09942/1952
0.5c
1.2c
1934
St. Augustine BeachMarinelandFernandina BeachNear DeFuniak Springs
0.8c
0.8c
1.4c
508DeFuniak Springs towerHomestead (HST)West Palm Beach (PBI)Miami (MIA)Fort Lauderdale
1000.91005.21004.2
2/02391/23502/0048
11 14 2/0405
279989765
171HollywoodWest Kendall (TMB)Miami Beach (MIBFI)Tallahassee (TLH)Apalachicola NWS
1007.01001.6
2/21302/2151
1214
191826
3/00002/21172/2159
159106
20
St. George IslandPanama City AirportPanama City Beach (CSBF1)Eglin AFB (VPS) 992 3/1355
151922
33332230
3/14492/13003/1355
13771

MAY 1998 1133L A W R E N C E E T A L .
TABLE 2. (Continued)
Location Press. (mb)Date/time
(UTC)
Sustainedwind
(m s21)a
Peak gust(m s21)
Date/time(UTC)b
Storm tide(m)c
Total rain(mm)
Destin (ASOS)Pensacola NAS (NPA)Whiting Field NAS (NSE)Hurlburt Field (HRT)Pensacola Regional Airport
976
988
3/1600
3/1409
19282336c
31
23452644c
3/11513/16003/16253/1409
5696
103
Navarre BeachPensacola Beach
2.0c
1.1c
AlabamaMobile (MOB)(ASOS)Fairhope (ASOS)
997 3/2029 1316
2322
3/19503/1834
65100
NCDC Buoys41009410104203642007
999.91007.0
991.9
2/06002/02003/0000
21181815
27242320
2/05002/03003/01003/1930
C-MAN stationsSPGF1LKWF1SAUF1
1001.81007.9
2/03002/1100
181619
282122
2/00201/22002/0150
CDRF1CSBF1DPIA1
1001.7 2/1600 212019
262823
2/17003/13003/1800
a NWS standard averaging period is 1 min; ASOS and C-MAN are 2 min; buoys are 8 min; WMO standard is 10 min.b Date/time is for sustained wind when both sustained and gust are given.c Estimated.
lowed Felix to resume a general northwestward motionby 15 August, with this motion persisting into the nextday. This track took the storm center within 120 km ofBermuda and toward the North Carolina coast.
The split in the trough resulted in increased ridgingover the western Atlantic that appeared to be strongenough to drive Felix into the eastern United States.However, a small weakness remained between 708 and758W as indicated by reconnaissance data on 16 August.Felix turned northward into the weakness and almoststalled late on 16 August. It then moved slowly north-eastward on 17 August. A second westerly trough failedto pick up the storm on 18–19 August, and Felix per-formed an anticyclonic loop offshore as the trough by-passed the tropical cyclone. The hurricane acceleratednorthward on 20 August and northeastward on 21 Au-gust in response to a third trough.
During 17–19 August, Felix had an eye diameter offrom 90 to 130 km on aircraft radar and rather weakconvection in satellite imagery. Despite this, the stormmaintained 33–36 m s21 sustained winds and a centralpressure near 970 mb. It is possible that this structurewas due to cooler, drier air entering the circulation atlow and midlevels. Felix dropped below hurricanestrength on 20 August as it moved over colder waterand shearing again increased.
Felix became extratropical about 550 km east-north-east of Newfoundland on 22 August. The extratropical
cyclone was tracked across the North Atlantic betweenScotland and Iceland and then toward Norway.
On a historical note, the threat of Hurricane Felixpostponed Bermuda’s scheduled vote for independence.Ironically, the first inhabitants at Bermuda were sur-vivors of a hurricane-caused shipwreck on the island in1609. Their stories helped inspire Shakespeare’s writingof The Tempest.
2) METEOROLOGICAL STATISTICS
The maximum wind speed of 74 m s21 from a flightlevel of 700 mb was measured at 1254 UTC 12 August.The minimum central pressure reported by aircraft was930 mb at 2328 UTC 12 August, and it is likely thatthe pressure was somewhat lower during the previous10 h when there were no aircraft measurements.
During most of 15 and 16 August, the minimum cen-tral pressure hovered between 965 and 970 mb, whichwould normally be consistent with 44–51 m s21 surfacewinds. However, maximum flight-level winds reportedby reconnaissance aircraft were only 33–39 m s21 at 850and 700 mb. This would suggest a minimal hurricaneat most. The rawinsonde at Bermuda indicated 28 m s21
surface winds with 41 m s21 at an elevation of 120 m.Because a large component of these winds were prob-ably brought to the surface in strong convective bands,

1134 VOLUME 126M O N T H L Y W E A T H E R R E V I E W
FIG. 2. GOES-8 visible satellite image of Hurricane Felix at 1615 UTC 12 August 1995. Felix was located about850 km northeast of Puerto Rico at this time and the maximum 1-min surface wind was estimated at 62 m s21.
the maximum sustained surface winds are estimated at36–39 m s21 during this time.
Bermuda reported a minimum pressure of 988.1 mband maximum 2-min winds of 28 m s21 with gusts to36 m s21 at 0000 UTC 15 August as the center of Felixpassed about 120 km to the south-southwest. No sus-tained tropical storm force winds were reported by U.S.land stations. Wind gusts to 19 m s21 were reportedfrom the NWS office at Buxton, North Carolina, at 2058UTC 16 August and at 0102 UTC 17 August while thehurricane was centered about 230 km to the east.
The eye of Felix passed over NOAA buoy 41001located at 34.78N, 72.68W, or about 280 km east of CapeHatteras, near 1600 UTC 16 August. The buoy reporteda 970.4-mb pressure at this time with light winds. A10-min average wind of 27 m s21 and gusts to 34 m s21
were reported earlier by the buoy near 1200 UTC. Rain-bands associated with Hurricane Felix remained off-shore of the U.S. coast.
Although the strong winds and heavy rains did notdirectly affect the United States, large swells generatedby Felix produced dangerous surf conditions includingsome coastal flooding and rip currents from northeasternFlorida to New England. Isolated areas of severe beacherosion occurred along the New Jersey coast, but themost significant beach erosion occurred on the OuterBanks of North Carolina. Highway 12 on the Outer
Banks was flooded with sand and ocean overwash attimes of high tides. Beach nourishment occurred in somecoastal areas of North Carolina to the southwest of theOuter Banks.
3) CASUALTY AND DAMAGE STATISTICS
A total of eight deaths were confirmed in associationwith Felix, three off the North Carolina coast and fiveoff the New Jersey coast. All of these fatalities were aresult of drowning. Although there was considerablebeach erosion, little significant property damage oc-curred.
g. Tropical Storm Gabrielle, 9–12 August
1) SYNOPTIC HISTORY
A tropical wave was at the coast of Africa on 27 Julyand was a well-defined system as it was tracked acrossthe Atlantic and Caribbean over a 12-day period. Itmoved into the western Gulf of Mexico on 8 August.
A weak low-level cloud circulation was evident fromvisible satellite imagery on 9 August and aircraft re-connaissance determined that a well-defined low-levelwind circulation had formed. The tropical depressionstage began on the afternoon of 9 August about 300 km
MAY 1998 1135L A W R E N C E E T A L .
east of La Pesca, Mexico, and 415 km southeast ofBrownsville, Texas.
The track from 10 to 12 August was slow and errat-ically westward with a sharp turn to the south on the10th and a turn to the northwest on the 11th. With spo-radic periods of deep convection, the depressionstrengthened to a storm on the 10th. The storm graduallyintensified to 31 m s21 by late on 11 August, just priorto moving inland. Landfall was on the coast of Mexicojust south of La Pesca and about 275 km south of theU.S.–Mexico border. Gabrielle quickly weakened aftermoving inland.
2) METEOROLOGICAL STATISTICS
Gabrielle came very close to hurricane intensity justbefore landfall. The 38 m s21 aircraft wind speed mea-sured at a flight level of 457 m is the basis for estimatinga maximum 1-min surface wind of 31 m s21 for 1800UTC 11 August. The corresponding central pressurefrom an aircraft fix was 990 mb, but a little later, a 989-mb pressure was reported a short distance away fromthe center, which was too close to the coast for theaircraft to reach. It is estimated that the central pressurewas 988 mb at this time.
3) CASUALTY AND DAMAGE STATISTICS
No reports of death have been received and damageis estimated to be minor. It is assumed that 18–31 ms21 winds affected the La Pesca region of Mexico. Anewspaper reported up to 610 mm of beneficial rain inthe Mexican states of Tamaulipes and Nuevo Leon andflash floods were likely over higher terrain. Storm surgeflooding of about 1 m above normal was likely alongthe Mexican coast to the north of where the centercrossed the coast and some beach flooding occurred insoutheastern Texas. Eight hundred persons were evac-uated in Soto la Marina and San Fernando on the north-east coast of Mexico.
h. Hurricane Humberto, 22 August–1 September
Humberto coexisted with four other tropical cyclones(Iris, Karen, Jerry, and Luis) in the Atlantic basin. Thehurricane traveled several days through the open At-lantic without hitting land.
1) SYNOPTIC HISTORY
Hurricane Humberto developed from one of the sev-eral strong tropical waves that moved off the coast ofAfrica in August of 1995. In fact, Dakar, Senegal, re-ported a 26 m s21 wind speed at 500 mb when the axisof the wave crossed that station on 19 August. Humbertowas preceded by a strong tropical wave that eventuallybecame Iris and was followed by another strong wavethat triggered Karen.
Satellite images and surface reports indicated that abroad cyclonic rotation was associated with this weathersystem from the time it moved off the west coast ofAfrica. However, the convection was disorganized anddisplaced to the southwest of the circulation center dueto the prevailing northeasterly shear. Once the systemmoved westward over warmer waters and into an areaof lighter shear, it developed rapidly. It became a tropicaldepression at 0000 UTC 22 August and reached tropicalstorm status 6 h later. Under an upper-level environmentvery favorable for development, Humberto became ahurricane at 0600 UTC 23 August.
Humberto’s motion was influenced by a midleveltrough over the central Atlantic and turned northwardon 24 and 25 August and then northeastward over openwaters. Humberto maintained hurricane status until 31August when it weakened to a tropical storm. It wasrapidly absorbed by an extratropical low early on 1 Sep-tember in the central North Atlantic Ocean.
Humberto reached its estimated peak intensity of 49m s21 and a minimum pressure of 968 mb at 1800 UTC24 August, based on satellite intensity estimates. There-after, the hurricane weakened some, primarily due tointerference with the outflow produced by Iris. OnceHumberto moved away from Iris, Humberto reintensi-fied and turned northeastward ahead of the extratropicalcyclone, which eventually absorbed it.
2) METEOROLOGICAL STATISTICS
The vessel DBRUK4 was under the influence of Hum-berto for about 48 h and experienced tropical storm forcewinds throughout that period. There was a report fromthat vessel of 31 m s21 winds from the southeast and apressure of 1005 mb at 1800 UTC 30 August. At thattime, the ship was about 35 km north of the center ofthe hurricane.
i. Hurricane Iris, 22 August–4 September
1) SYNOPTIC HISTORY
Iris formed from the first of four consecutive tropicalwaves to generate tropical cyclones (Iris, Humberto,Karen, and Luis) on their generally westward trek acrossthe tropical eastern Atlantic Ocean. Iris’s evolution wasgreatly influenced by two of those systems, Humbertoand Karen.
The wave associated with the formation of Iriscrossed the coast of Africa and began moving over theAtlantic Ocean on 16 August. Surface analyses showeda closed circulation around a 1009-mb pressure centerlocated just south of Dakar. A day later, the circulationwas evident in surface observations and satellite picturesnear the Cape Verde Islands. Associated deep convec-tion diminished on 18 and 19 August but then graduallyredeveloped. From the satellite data it is estimated thatthe system became a tropical depression at 1200 UTC

1136 VOLUME 126M O N T H L Y W E A T H E R R E V I E W
22 August, when located about 1100 km to the east ofthe Lesser Antilles. It became Tropical Storm Iris 6 hlater.
The cyclone took a jog to the northwest on 23 Augustand quickly strengthened. The first reconnaissance flightinto Iris took place that evening and found the systemto be stronger than operational estimates based on sat-ellite pictures. The aircraft encountered 47 m s21 10-swinds at a flight level of about 500 m, and a centralpressure of 991 mb was reported. From this data, Irisis designated as a hurricane at 1800 UTC 23 August.
Iris moved toward the west-southwest at about 5 ms21 on the 24th and 25th. The change in heading wasprobably a consequence of a Fujiwhara interaction be-tween Iris and Humberto located about 1400 km to theeast.
On 25 August, Iris neared the Lesser Antilles. Anupper-level cold low was centered then to the north ofPuerto Rico. Westerly vertical wind shear occurred, sep-arating deep convection from the low-level cloud center,disrupting the circulation, and slowing the general west-ward progress of the cyclone. Iris weakened to tropicalstorm strength. Reconnaissance aircraft and radar dataindicate a reformation of the center to the east of theformer position while the system meandered for abouta day before moving into the islands.
Steering currents ahead of a trough to the northwestthen turned Iris generally toward the north-northwest on27 August. On this track, Iris moved up the chain ofLeeward Islands and strengthened as the shear de-creased. Late on the 28th, Iris regained hurricane statusover the south-central Atlantic.
Iris began a second Fujiwhara interaction on the 30th,with Tropical Storm Karen to its southeast. The inter-action swept the weaker Karen on a spiral path around,and then into, Iris, where it was absorbed on 3 Septem-ber. The interaction could have contributed to Iris’s er-ratic motion during this period.
An eye appeared intermittently and the intensity ofIris fluctuated from 29 August through 2 September. Irisreached its peak intensity of 49 m s21 several hundredkilometers to the southeast of Bermuda on 1 September.Iris then weakened, temporarily, in an environment ofstrong vertical wind shear and relatively cool water. Itdropped below hurricane strength and became extra-tropical while accelerating northeastward well to thesoutheast of Newfoundland on 4 September. It thenturned eastward and deepened. The pressure fell fromaround 1000 mb to near 957 mb in about 48 h. On 7September, Iris battered western Europe as a powerfulextratropical storm with sustained wind speeds near hur-ricane force.
2) METEOROLOGICAL STATISTICS
The ship Pallas Athena reported 21 m s21 winds at1200 UTC 1 September while located about 185 km tothe south-southeast of the center of Iris.
The only available observation of sustained tropicalstorm force winds in the Caribbean islands came fromDesirade (just east of Guadeloupe) where a 23 m s21
(2-min) wind and 28 m s21 gust occurred. The highestreported gusts elsewhere reached 25 m s21 at Marti-nique, 21 m s21 at Antigua, 19 m s21 at Dominica, and18 m s21 at St. Kitts. The lowest pressure reported fromthe northeastern Caribbean area was 999 mb at Antigua.
The primary meteorological event caused by Iris inthe Caribbean islands was heavy rain. The totals wereparticularly large in Martinique where Ducos (La Man-zo) had 450 mm for the event, with 411 mm falling in24 h. Other peak rainfall rates in Martinique included48 mm in 30 min, 77 mm in 1 h, and 117 mm in 2 hat Trois Ilets, Vauclin, and Ducos, respectively. An av-erage of 150 mm of rain fell on Antigua.
3) CASUALTY AND DAMAGE STATISTICS
Two deaths occurred on Martinique, in homes af-fected by mud slides. A media summary indicated onedeath on Guadeloupe.
Few damage reports have been received. There wasextensive flooding in low-lying areas and destruction ofbanana trees on Antigua. Similar damage likely occuredon neighboring islands.
j. Tropical Storm Jerry, 22–28 August
Jerry spread heavy rains over portions of the south-eastern United States.
1) SYNOPTIC HISTORY
Satellite images indicate that an area of cloudiness,associated with a tropical wave that left western Africaon 9 August, moved westward across the tropical At-lantic from 9 to 15 August. Even though convectionincreased when the wave neared the Lesser Antilles onthe 15th, there were no large surface pressure falls notedin those islands. When the wave moved over the easternand central Caribbean Sea, rawinsonde data from SanJuan and Santo Domingo revealed that the system wasfairly strong at mid- to lower-tropospheric levels, asevidenced by 15–21 m s21 wind reports east of the waveaxis at 850 and 700 mb.
By 19 August, satellite pictures and surface data gavesome evidence of a low-level circulation centered justeast of Jamaica. No further development occurred dur-ing the next couple of days as the system moved west-northwestward to northwestward. On 22 August, cloud-iness and convection became better organized near thewestern Bahamas, and surface reports indicate that atropical depression formed from this system a short dis-tance southwest of Andros Island at 1800 UTC 22 Au-gust. Upper-level winds were partially favorable for de-velopment, since anticyclonic outflow prevailed over the
MAY 1998 1137L A W R E N C E E T A L .
eastern half of the depression while outflow was inhib-ited to the west and northwest.
As the depression moved north-northwestward to-ward southeast Florida, slow strengthening took place.It is estimated that the system strengthened to TropicalStorm Jerry around 1200 UTC 23 August and the centercrossed the east coast of Florida later that same day nearJupiter, with highest sustained winds of 18 m s21. Jerrymoved northwest to west-northwest across the Floridapeninsula, weakening back to a tropical depression by1800 UTC 24 August while nearing the upper west coastof Florida. The forward motion slowed, and after thecenter drifted a short distance out over the waters of theGulf of Mexico, Jerry turned toward the north andmoved inland again over northern Florida and acrossthe Georgia–Florida border on 25 August.
The weak depression moved slowly northward tonorth-northwestward over Georgia on the 26th and 27th.Later on the 27th, Jerry turned eastward toward SouthCarolina. By 0000 UTC 28 August, the circulation ofJerry became elongated in a northeast–southwest-ori-ented trough, and 6 h later it was impossible to distin-guish a circulation center. However, a trough persistednear the Carolinas during the next couple of days andtwo discrete low pressure centers appeared. The firstmoved eastward from the coast of North Carolina intothe Atlantic without significant development. The sec-ond became evident just offshore of the Georgia–SouthCarolina border early on 29 August. This weak surfacelow moved southward and southwestward, across theFlorida peninsula on 30–31 August, and slowly dissi-pated over the southeast Gulf of Mexico during the firstfew days of September. There is some uncertainty overwhich, if any, of these two lows was derived from theoriginal circulation of Jerry.
2) METEOROLOGICAL STATISTICS
The highest flight-level wind measurement from ae-rial reconnaissance of Jerry was 23 m s21 at an altitudeof 457 m at 1621 UTC 23 August. Sustained winds of18 m s21 and a gust to 22 m s21 were observed at LakeWorth Inlet, Florida, at 2100 UTC 23 August. PatrickAir Force Base reported sustained winds of 19 m s21
gusting to 26 m s21 at 0640 UTC 24 August. Sustainedwinds of 19 m s21 with a gust to 28 m s21, at an elevationof 17 m above ground level, were recorded at CapeCanaveral at 1420 UTC 24 August. The maximum sus-tained wind of 18 m s21 for Jerry as indicated in Table1 is based on rounding off the original number to thenearest 5 kt.
A waterspout was observed over Tampa Bay east ofthe St. Petersburg Pier at 1840 UTC 23 August. A small,brief tornado was observed 19 km west of Zephyrhillsin Pasco County, Florida, at 1647 UTC 24 August. Nodamage was reported. Another, presumably minor, tor-nado was observed 11 km west of Ruskin in Hillsbor-ough County, Florida, at 1547 UTC 25 August.
Jerry caused very heavy rainfall over Florida, Georgia,South Carolina, and North Carolina. Rainfall totals of upto 250–380 mm were reported over the southwest andwest-central coastal sections of Florida from the Naples–Ft. Myers area northward to Tampa, with one total of 427mm at Golden Gate just east of Naples. Rainfall totalsover southeast Florida were generally 75–200 mm, al-though locally heavier rainfall in the 250-mm range oc-curred in Martin and St. Lucie counties. Rainfall amountsof at least 200 mm occurred over eastern Georgia. Rainfalltotals exceeded 300 mm over portions of western SouthCarolina. Rainfall amounts reached 225 mm over parts ofNorth Carolina, with local totals up to 432 mm over por-tions of north-central North Carolina.
Storm tides were generally about 0.5 m or less alongthe southeast and central east coast of Florida and alongthe west coast of Florida, due to Jerry.
3) CASUALTY AND DAMAGE STATISTICS
Flooding caused three deaths in South Carolina andthree deaths in North Carolina. In Florida, freshwaterflooding near the west coast was responsible for mostof the damage from Jerry. In Collier County, Florida,340 buildings were damaged, with 12 uninhabitable.Flooding was particularly severe in Lee and Charlottecounties. Property damage in Florida totaled $1.5 mil-lion and damage to agriculture was estimated to be $19million. Damage figures due to flooding over the re-mainder of the southeast United States are incomplete.The governor of North Carolina estimated $6 millionin uninsured losses in the Raleigh area. This makes atotal damage estimate for Jerry of $26.5 million, al-though additional flood damage likely took place inGeorgia and South Carolina.
k. Tropical Storm Karen, 26 August–3 September
Karen was a minimal tropical storm that did not affectland. However, it occurred during a very active periodfor tropical cyclones and proved to be noteworthy forits interaction with nearby Hurricane Iris.
1) SYNOPTIC HISTORY
Karen originated from a tropical wave that moved offthe west coast of Africa to the eastern tropical Atlanticon 23 August. This was a very active day in the Tropicswith Hurricane Humberto midway between Africa andthe Lesser Antilles, Hurricane Iris about 900 km eastof the Lesser Antilles, Tropical Storm Jerry near south-east Florida, and Tropical Storm Gil in the eastern NorthPacific. Based on ship and island reports, NHC surfaceanalyses indicated a broad area of low pressure just offthe west coast of Africa in association with the tropicalwave. The organization of the cloud pattern fluctuatedfor a few days, and the system became a tropical de-pression at 1200 UTC 26 August, when satellite imagery

1138 VOLUME 126M O N T H L Y W E A T H E R R E V I E W
showed a well-defined low-level cloud center exposedto the east of a cluster of deep convection. This wasabout 900 km west of the Cape Verde Islands. At thistime, Hurricane Humberto was centered about 1700 kmto the west-northwest and Iris, which had weakened toa tropical storm, was centered over the Lesser Antillesabout 2800 km to the west of the depression. The de-pression was moving generally toward the west-north-west at 5–7 m s21 with the low- to midlevel flow.
Deep convection increased and the depressionstrengthened into Tropical Storm Karen at 0600 UTC28 August. Hurricane Humberto had moved northwardby this time and was centered about 1400 km to thenorthwest of Karen. Tropical Storm Iris had also movednorthward to a position just north of the Leeward Is-lands, about 2000 km to the west of Karen.
Humberto continued moving northward and thennortheastward away from Karen. The steering flowweakened somewhat in the wake of Humberto, and Kar-en slowed its west-northwestward motion to about 2 ms21 between 28 and 31 August. Karen gradually ap-proached the even slower moving Iris, which had againstrengthened to a hurricane by late on 28 August. Theupper-level outflow from the stronger Iris resulted innortherly shear over Karen, and the low-level center ofKaren was exposed to the north of the accompanyingconvective activity from 28 to 31 August. During thisperiod, Karen’s maximum sustained winds of 23 m s21
were estimated to have occurred. Karen was centeredabout 1100 km east-southeast of Iris on 31 August, andbegan moving more toward the northwest, caught inIris’s stronger circulation.
Convective activity associated with Karen becamedisorganized on 1 September as the tropical storm ac-celerated and moved cyclonically around the east sideof Iris. Karen weakened to a tropical depression on 2September. However, a tightly wrapped swirl of low- tomidlevel clouds could still be seen in satellite imagerymoving to the north of Iris late on 2 September. Theremnant vortex of Karen was finally absorbed into thestronger circulation of Hurricane Iris on 3 Septemberwhen located approximately 325 km to the northwestof the center of Iris. This absorption took place overthe western North Atlantic Ocean, far from land.
2) METEOROLOGICAL STATISTICS
Karen was not a threat to land, and therefore, did notrequire aircraft reconnaissance. However, after flyingnearby Hurricane Iris on 2 September, U.S. Air ForceReserve aircraft provided one operational center fix onKaren and measured flight level winds of 21 m s21.
l. Hurricane Luis, 27 August–11 September
Luis was a category 4 Cape Verde hurricane thatwreaked harm and havoc on the northeasternmost of the
Leeward Islands, with an estimated 16 deaths and $2.5billion in damages.
1) SYNOPTIC HISTORY
Luis was first detected as a tropical wave and cir-culation of low clouds on 26 August over the far easterntropical Atlantic between the coast of Africa and theCape Verde Islands. The low-level cloud circulationmoved westward and is estimated to have developed aweak surface circulation on 27 August near the CapeVerde Islands.
While Luis was developing, there were three othertropical cyclones in the Atlantic, to the west andnorthwest: Humberto, Iris, and Karen. Luis strength-ened from a depression to a storm on the 29th, butits deep convection fluctuated for the next two dayswhile there was strong vertical shear nearby. Theshear diminished on the 30th; an eye formed and Luisquickly became a hurricane. The intensification pro-cess continued for the next two days as Luis movedwest-northwestward. A reconnaissance aircraftreached the hurricane late on 3 September and con-firmed the satellite intensity estimates of a category4 hurricane. Luis was located about 1100 km east ofthe Lesser Antilles at this time.
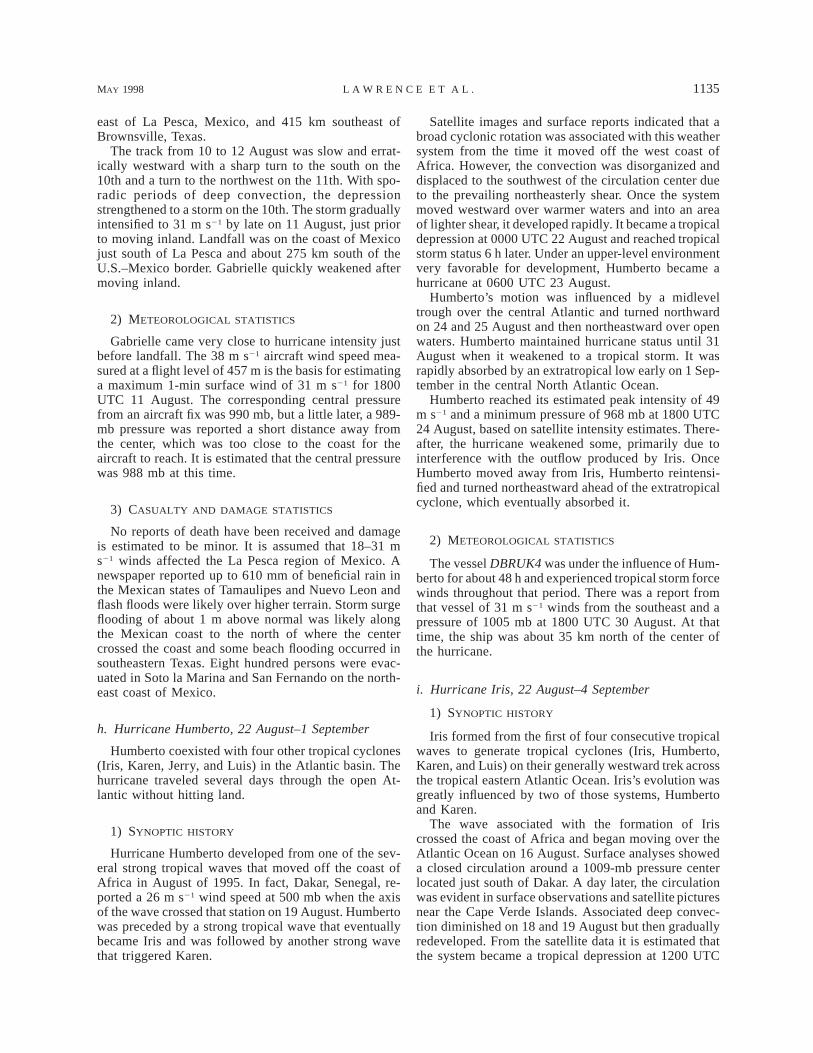
The track heading turned from westward to north-westward on 5 September and the hurricane movedacross the northeastern Leeward Islands. The centerpassed directly over Barbuda (Fig. 3) and close enoughto the northeast of Antigua, St. Barthelemy, St. Martin,and Anguilla that the southern portion of the eyewallaffected these islands. Luis’s sustained winds in the eye-wall were as high as 59 m s21 at this time, just below62 m s21 maximum values, which had occurred for theprevious 48 h.
Luis was a large hurricane. The inner diameter of theeyewall was 74 km as it moved over the islands. Inaddition to the eyewall conditions described above,Nevis, St. Kitts, St. Eustatius, and the northernmost Brit-ish Virgin Islands experienced hurricane-force windspeeds, while tropical storm conditions affected the re-mainder of the British and U.S. Virgin Islands and theeastern islands of Puerto Rico.
Luis gradually recurved across the North Atlantic andweakened. The center of the hurricane passed about 375km west of Bermuda on 9 September, causing tropicalstorm force winds there. Luis became extratropical onthe 10th and 11th, as it moved over colder water and italso reintensified. The center moved over eastern New-foundland on the 11th, but the strongest winds were, bythis time, well to the east of the center and remainedoffshore.
2) METEOROLOGICAL STATISTICS
The highest reconnaissance wind speed was 75 m s21
at 1306 UTC 4 September at a flight level of 700 mb.
MAY 1998 1139L A W R E N C E E T A L .
FIG. 3. GOES-8 visible satellite image of Hurricane Luis at 1215 UTC 5 September 1995, when the eye wasdirectly over the island of Barbuda.
A surface pressure of 945 mb was measured at this time.The surface pressure did not reach its minimum valueof 935 mb until late on the 7th, at which time the highestaircraft-measured wind speed had decreased to 62 ms21. The ship Teal Arrow was in the center of the hur-ricane at 1800 UTC 6 September and measured a sealevel pressure of 942 mb. The ship reported sustainedwinds of 33 m s21 at 1500 UTC and reported 51 m s21
at 2100 UTC and again at 0300 UTC 7 September. Thehighest ship gusts were 64 m s21 and wave heights to15 m were estimated.
The official highest sustained 1-min surface wind at-tained by Luis is estimated to be 62 m s21 from 3 to 5September while it was approaching the Leeward Is-lands. This speed is 82% of the highest aircraft windspeed of 75 m s21. Sustained wind speeds were still ashigh as 59 m s21 as Luis moved over the islands.
Ten-minute surface wind speeds of 54 and 56 m s21
were observed at Antigua and St. Barthelemy, respec-tively, and even higher values may have occurred near-by. Since the eye of the hurricane went over Barbuda,it is expected that sustained winds of near 59 m s21 wereexperienced there. The winds at Anguilla were likelyalmost as high.
Several days later, on 9 September, Bermuda reported
a maximum sustained wind of 21 m s21 as the centerpassed some 375 km to the west.
The Queen Elizabeth 2 encountered a wave of 29 mearly on 11 September while located 375 km south ofeastern Newfoundland and 225 km southeast of the cen-ter of the now-extratropical cyclone. At 0130 UTC, thecrew reported that the anemometer needle was ‘‘hardover’’ at the maximum instrument value of 62 m s21.Two hours later, they estimated that the maximum sus-tained winds were 67 m s21. A nearby Canadian databuoy reported a peak wave height of 30 m at about thesame time, but the buoy winds were much less than theship winds. The best track maximum winds at this timeare estimated at 54 m s21, somewhat less than the shipreports, which were taken near the top of this huge ship’ssuperstructure.
On the afternoon of 8 September, 10 drifting databuoys were deployed by the U.S. Air Force Reserve53d Weather Reconnaissance Squadron some 550 kmahead of Luis, along 318N and from 718 to 668W.One of these buoys measured 8-min winds of 37 m s21
with gusts to 49 m s21 as the hurricane passed, but thisobservation was not at the location of strongest windsas indicated by aircraft reconnaissance data. The buoysalso measured pressure and air and sea temperature and

1140 VOLUME 126M O N T H L Y W E A T H E R R E V I E W
there was a 3.58C decrease in sea surface temperatureto the east of the center after Luis went by, presumablyfrom upwelling.
3) CASUALTY AND DAMAGE STATISTICS
The hurricane killed an estimated 16 persons andcaused extensive damage when it moved across thenortheastern edge of the Leeward Islands of the Carib-bean. Nine died in St. Martin, two in Antigua, two inPuerto Rico, one in Guadeloupe, and one in Dominica.Days later, there was one storm-related death in New-foundland.
Dollar damage totals are unknown. At Barbuda,where a full category 4 hurricane was experienced, thedamage to structures was estimated at 70% along withsevere flooding and erosion. The estimate for St. Maar-tin and St. Martin is 60% damage. The prime ministerof Antigua was quoted as saying that nearly half thehomes on that island were destroyed. A damage estimatefor St. Maartin, alone, is $1.8 billion. With great un-certainty, the total damage estimate for Hurricane Luisis placed at $2.5 billion (U.S.).
m. Hurricane Marilyn, 12–22 September
Hurricane Marilyn devastated portions of the U.S.Virgin Islands as a category 2 to near–category 3 hur-ricane.
1) SYNOPTIC HISTORY
Marilyn originated from a tropical wave that crossedfrom the west coast of Africa to the eastern tropicalAtlantic Ocean on 7–8 September. A large circulationof low- and midlevel clouds accompanied the wave, butlittle deep convection was generated at that time. Thesystem moved westward at about 9 m s21 over the fol-lowing few days, under upper-level easterlies on thesouth side of a well-defined anticyclone aloft, whichalso moved westward.
A low-level circulation was detected on satellite im-agery late on 11 September and deep convection de-veloped and became concentrated near the circulationcenter on the 12th. It became a tropical depression at1800 UTC 12 September. The cyclone strengthened fur-ther, becoming Tropical Storm Marilyn 6 h later. Marilynreached hurricane strength 24 h after that, at 0000 UTC14 September, shortly after aircraft reconnaissance firstidentified a closed eyewall.
Over the following three days, the track graduallybecame directed toward the west-northwest and then thenorthwest while the hurricane moved toward a weaknessin the subtropical ridge over the central Atlantic Ocean.Marilyn continued to strengthen in an ‘‘embedded cen-ter’’ cloud pattern, but at a slower rate during that pe-riod. It was a category 1 hurricane on 14 Septemberwhen the center passed about 85 km to the north of
Barbados, then just north of Martinique, over Dominica,to just southwest of Guadeloupe.
Marilyn continued moving northwestward over thenortheastern Caribbean Sea. It hit the U.S. Virgin Is-lands during the afternoon and night of 15 September(see Fig. 4) as a strengthening category 2, nearly cat-egory 3, hurricane. Hail was reported from the recon-naissance aircraft, an unusual occurrence for tropicalcyclones. The eye had a diameter of 37 km. The strong-est part of the hurricane, the eyewall to the east andnortheast of the center, passed over St. Thomas. Max-imum 1-min surface winds at that time were close to49 m s21.
After passing just offshore from eastern Puerto Ricoearly on 16 September, the center of Marilyn was againover the Atlantic Ocean. An upper-level low had de-veloped to the west and this could have enhanced out-flow aloft from Marilyn. An eye became distinct onsatellite pictures and Marilyn reached its peak intensity,about 949 mb and 51 m s21 (category 3) as it began toturn northward on the 17th. Flight-level data showedsome evidence of a concentric pair of eyewall windmaxima. Reconnaissance data indicated a marked weak-ening later that day. The central pressure rose 20 mb inabout 10 h and the peak flight-level winds decreasedfrom 62 to 46 m s21. The primary (inner) eyewall dis-integrated into a few fragments. The weakening waslikely caused by some combination of shearing withinthe system reported by the flight crew, the impact ofnearby waters upwelled not long before by HurricaneLuis that were 18–38C cooler than normal, and the de-caying phase of an eyewall cycle.
Marilyn began accelerating toward the north-north-east late on 18 September and its center passed about275 km to the west of Bermuda a day later. It had madea brief resurgence, with an eye reappearing in satellitepictures. However, upper-level westerly winds then be-gan to shear Marilyn and the low-level cloud centerbecame partially exposed. Marilyn ceased generatingdeep convection late on the 21st and became extratrop-ical on the 22d. The remnant circulation meandered overthe central tropical Atlantic Ocean for another 10 daysbefore becoming absorbed in a frontal system.
2) METEOROLOGICAL STATISTICS
Table 3 lists selected surface observations taken dur-ing Marilyn’s passage over various locations. Over Mar-tinique and Guadeloupe, the maximum wind speed [sus-tained over the World Meteorological Organization(WMO) standard of 10 min] was 26 m s21 with guststo 39 m s21. Guadeloupe had exceptionally heavy rain,with one station, Saint-Claude, recording 508 mm in a12-h period. The maximum rainfall reported from Mar-tinique was about 225 mm.
Part of Marilyn’s eye passed over St. Croix. However,Marilyn’s strongest winds were located in the easternor northeastern eyewall, which passed just offshore.

MAY 1998 1141L A W R E N C E E T A L .
FIG. 4. GOES-8 visible satellite image of Hurricane Marilyn at 1915 UTC 15 September 1995, when the eye wasjust east of St. Croix in the U.S. Virgin Islands.
Therefore, the highest 1-min wind speed at St. Croixwas likely a little less than the 44 m s21 maximum valueassigned to Marilyn in the official best track.
On the other hand, St. Thomas was hit by the hur-ricane’s eastern and northeastern eyewall. In addition,the hurricane strengthened as it approached and passedSt. Thomas. An uncommissioned FAA Automated Sur-face Observing System (ASOS) at the St. Thomas KingAirport provided the only continuous ‘‘official’’ windrecord of the event in the U.S. Virgin Islands. Its max-imum 2-min wind was 46 m s21 at 0352 and again at0353 UTC 16 September. (Around then, the peak 10-swind in the hurricane at the 700-mb flight level was 57m s21.) The ASOS measured a gust to 58 m s21 at 0408UTC. Based on the ASOS data, the estimated maximum1-min wind speed (for open exposure at 10-m elevation)at that time is 49 m s21. It is likely that somewhatstronger 1-min winds (perhaps, to category 3) and gustsabove 58 m s21 occurred on exposed hills. Some un-official high wind speed observations remain unconfir-med or have been rejected.
The ASOS measured a minimum pressure of 956.7mb. This occurred at 0422 UTC when the airport wasstill experiencing 31 m s21 1-min winds, apparently onthe inside edge of the eyewall. The estimated minimumpressure for Marilyn at that time is 952 mb. This islower than implied by the data obtained from the Hur-
ricane Hunters. They reported extrapolated and drop-sonde pressures of 957 and 960 mb, respectively, at0305 UTC, and 954 and 958 mb for those techniquesat 0600 UTC. This is reminiscent of Hurricane Andrew’slandfall over Florida, where the minimum pressure ob-tained from surface observations was lower than thatobtained using aircraft data. The reason for this dis-crepancy in Marilyn is not obvious.
The storm surge in the U.S. Virgin islands reached2.1 m, with an isolated storm tide of 3.6 m reported onSt. Croix. Rainfall totals reached about 250 mm in St.Croix and St. Thomas.
An unofficial gust to 56 m s21 was reported from theisland of Culebra.
The center of Marilyn passed far enough to the eastof Puerto Rico that hurricane conditions were apparentlynot experienced on that island. The naval base at Roo-sevelt Roads had maximum 1-min winds of 19 m s21
with gusts to 26 m s21.Bermuda experienced sustained winds of 20 m s21
with a gust to 27 m s21 during the passage of Marilyn’souter circulation.
3) CASUALTY AND DAMAGE STATISTICS
Marilyn was directly responsible for eight deaths, fivein St. Thomas, one in St. John, one in St. Croix, and
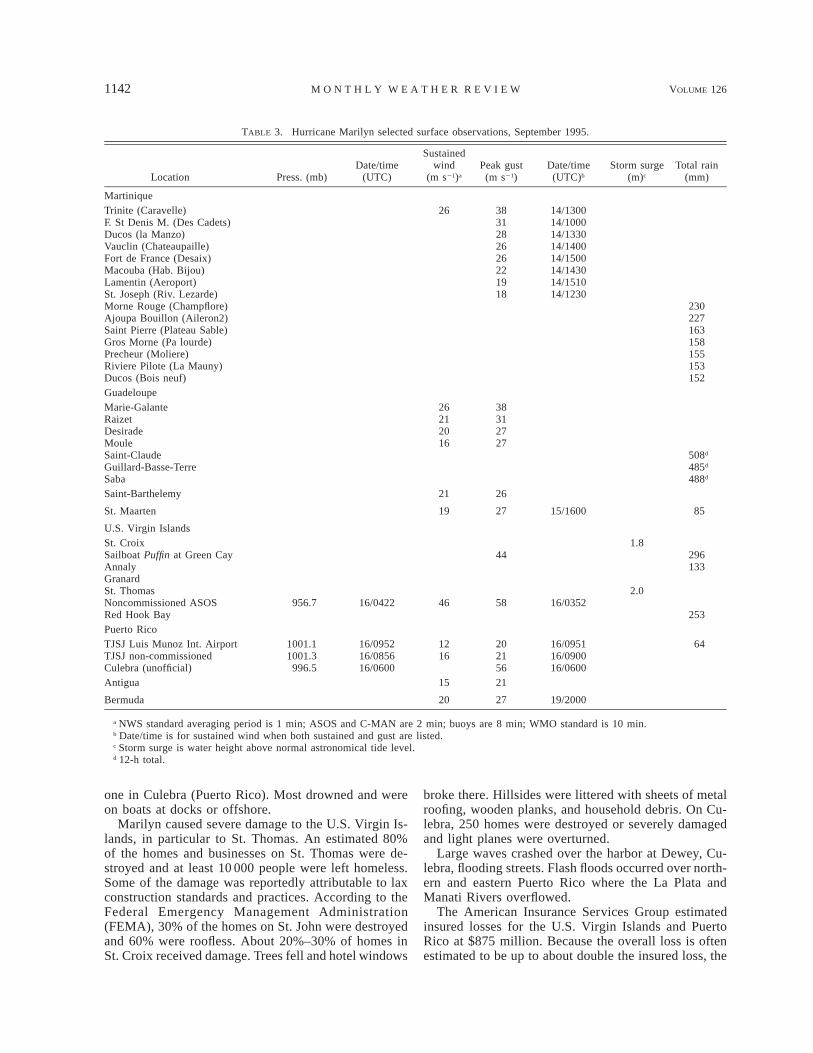
1142 VOLUME 126M O N T H L Y W E A T H E R R E V I E W
TABLE 3. Hurricane Marilyn selected surface observations, September 1995.
Location Press. (mb)Date/time
(UTC)
Sustainedwind
(m s21)a
Peak gust(m s21)
Date/time(UTC)b
Storm surge(m)c
Total rain(mm)
MartiniqueTrinite (Caravelle)F. St Denis M. (Des Cadets)Ducos (la Manzo)Vauclin (Chateaupaille)Fort de France (Desaix)
26 3831282626
14/130014/100014/133014/140014/1500
Macouba (Hab. Bijou)Lamentin (Aeroport)St. Joseph (Riv. Lezarde)Morne Rouge (Champflore)Ajoupa Bouillon (Aileron2)
221918
14/143014/151014/1230
230227
Saint Pierre (Plateau Sable)Gros Morne (Pa lourde)Precheur (Moliere)Riviere Pilote (La Mauny)Ducos (Bois neuf)
163158155153152
GuadeloupeMarie-GalanteRaizetDesiradeMoule
26212016
38312727
Saint-ClaudeGuillard-Basse-TerreSaba
508d
485d
488d
Saint-Barthelemy 21 26
St. Maarten 19 27 15/1600 85
U.S. Virgin IslandsSt. CroixSailboat Puffin at Green CayAnnalyGranard
441.8
296133
St. ThomasNoncommissioned ASOSRed Hook Bay
956.7 16/0422 46 58 16/03522.0
253Puerto RicoTJSJ Luis Munoz Int. AirportTJSJ non-commissionedCulebra (unofficial)
1001.11001.3
996.5
16/095216/085616/0600
1216
202156
16/095116/090016/0600
64
Antigua 15 21
Bermuda 20 27 19/2000
a NWS standard averaging period is 1 min; ASOS and C-MAN are 2 min; buoys are 8 min; WMO standard is 10 min.b Date/time is for sustained wind when both sustained and gust are listed.c Storm surge is water height above normal astronomical tide level.d 12-h total.
one in Culebra (Puerto Rico). Most drowned and wereon boats at docks or offshore.
Marilyn caused severe damage to the U.S. Virgin Is-lands, in particular to St. Thomas. An estimated 80%of the homes and businesses on St. Thomas were de-stroyed and at least 10 000 people were left homeless.Some of the damage was reportedly attributable to laxconstruction standards and practices. According to theFederal Emergency Management Administration(FEMA), 30% of the homes on St. John were destroyedand 60% were roofless. About 20%–30% of homes inSt. Croix received damage. Trees fell and hotel windows
broke there. Hillsides were littered with sheets of metalroofing, wooden planks, and household debris. On Cu-lebra, 250 homes were destroyed or severely damagedand light planes were overturned.
Large waves crashed over the harbor at Dewey, Cu-lebra, flooding streets. Flash floods occurred over north-ern and eastern Puerto Rico where the La Plata andManati Rivers overflowed.
The American Insurance Services Group estimatedinsured losses for the U.S. Virgin Islands and PuertoRico at $875 million. Because the overall loss is oftenestimated to be up to about double the insured loss, the

MAY 1998 1143L A W R E N C E E T A L .
total U.S. loss is tentatively estimated at $1.5 billion.The U.S. Virgin Islands Bureau of Economic Researchestimated the economic loss at $3 billion. FEMA placedthe cost for their programs at $1 billion in the VirginIslands and $50 million in Puerto Rico. The FEMAtotals include losses not traditionally described by theNHC as ‘‘damage,’’ such as FEMA’s cost to set up fieldoffices, inspector’s salaries, disaster unemploymentcompensation, and crisis counseling.
According to The New York Times, the British VirginIslands were not seriously affected and an unspecifiedamount of damage occurred in Antigua. According tothe Antigua Meteorological Service, that island had ex-tensive flooding in low-lying areas, destruction of ba-nana trees and, otherwise, minimal wind damage.
About 12 000 people went to shelters in Puerto Rico.In the U.S. Virgin Islands, 2243 people were sheltered.
n. Hurricane Noel, 26 September–7 October
Noel was a 33 m s21 hurricane that remained at seaover the eastern Atlantic.
1) SYNOPTIC HISTORY
Satellite pictures and rawinsonde data show that atropical wave emerged from western Africa on 22 Sep-tember. Three days later, as the wave neared 308W, bandsof deep convection associated with the system began toacquire some cyclonic shape. By 1800 UTC 26 Sep-tember, the cloud structure indicated the formation of atropical depression over the eastern tropical Atlantic.
A mid- to upper-tropospheric trough lay in the pathof the developing tropical cyclone. Southwesterly shear-ing due to the upper-level winds ahead of this troughstarted to affect the depression as early as 27 September.However, these winds were not strong enough to totallyoffset the development trend and the depressionstrengthened into Tropical Storm Noel around 1200UTC 27 September.
As the cyclone strengthened into a storm, its motionturned from west-northwestward to northwestward, dueto the influence of the above trough and an accompa-nying mid- to upper-level low near 288N, 448W. A north-westward movement continued until about 1800 UTC28 September, when Noel began to take a more northerlyheading. Even though upper-level outflow was beingimpeded to the northwest, satellite intensity estimatesindicate that Noel strengthened to a hurricane near 1800UTC 28 September. Development was halted after thatjuncture by increasing upper-level southwesterly flow.Moving northward to northeastward, Noel maintainedminimal hurricane strength until 30 September, whenthe center became exposed to the southwest of the clus-ter of convection associated with the cyclone. Gradualweakening took place, and the forward speed slowed toa crawl on 30 September and 1 October. On 2 October,with its maximum winds reduced to 23 m s21, Noel
moved generally northward at a faster speed. On 3 Oc-tober, the steering of Noel was influenced by a mid- toupper-level cyclone centered just to the west, and thestorm moved north-northwestward for a while.
Shearing diminished as Noel came into the area oflighter upper-level winds near the center of the mid- toupper-level cyclone, and this allowed the storm to re-strengthen on 3 and 4 October. By 0000 UTC 5 October,Noel was again a 33 m s21 hurricane. The system main-tained this intensity for about 24 h while moving slowlynortheastward to eastward. The final weakening com-menced at 0000 UTC 6 October, when Noel’s windsdropped to just below hurricane strength. A midlatitudetrough approached the area, causing Noel to move morerapidly, toward the east-northeast and northeast. Grad-ually weakening and losing its tropical character as itapproached the Azores, the cyclone was absorbed intoa cold front at 0000 UTC 8 October.
2) METEOROLOGICAL STATISTICS
In addition to satellite intensity estimates, there werea number of useful ship reports. An observation of 33m s21 winds from the ship FNOU was instrumental inreupgrading Noel to a hurricane at 0000 UTC 5 October.
o. Hurricane Opal, 27 September–5 October
Hurricane Opal made landfall near Pensacola Beach,Florida, as a marginal category 3 hurricane, causingextensive storm surge damage to the immediate coastalareas of the Florida panhandle. It was the first category3 hurricane to strike the Florida panhandle since Eloisein 1975.
1) SYNOPTIC HISTORY
Satellite imagery and synoptic analyses indicate thatOpal originated from a tropical wave that emerged fromthe west coast of Africa on 11 September. The wavemoved westward across the Atlantic into the westernCaribbean Sea by 23 September and merged with abroad area of low pressure. The combined system driftedwest-northwestward toward the Yucatan peninsula overthe following few days without significant development.Deep convection increased near the center of the lowand a tropical depression formed about 130 km south-southeast of Cozumel, Mexico, at 1800 UTC 27 Sep-tember.
Steering currents were week and the tropical depres-sion moved slowly over the Yucatan peninsula for thefollowing three days. Convective banding increased andship reports suggest that the depression became TropicalStorm Opal at 1200 UTC 30 September while centerednear the north-central coast of the Yucatan peninsula.The storm gradually strengthened and moved slowlywestward into the Bay of Campeche.
Reconnaissance aircraft investigating Opal over the
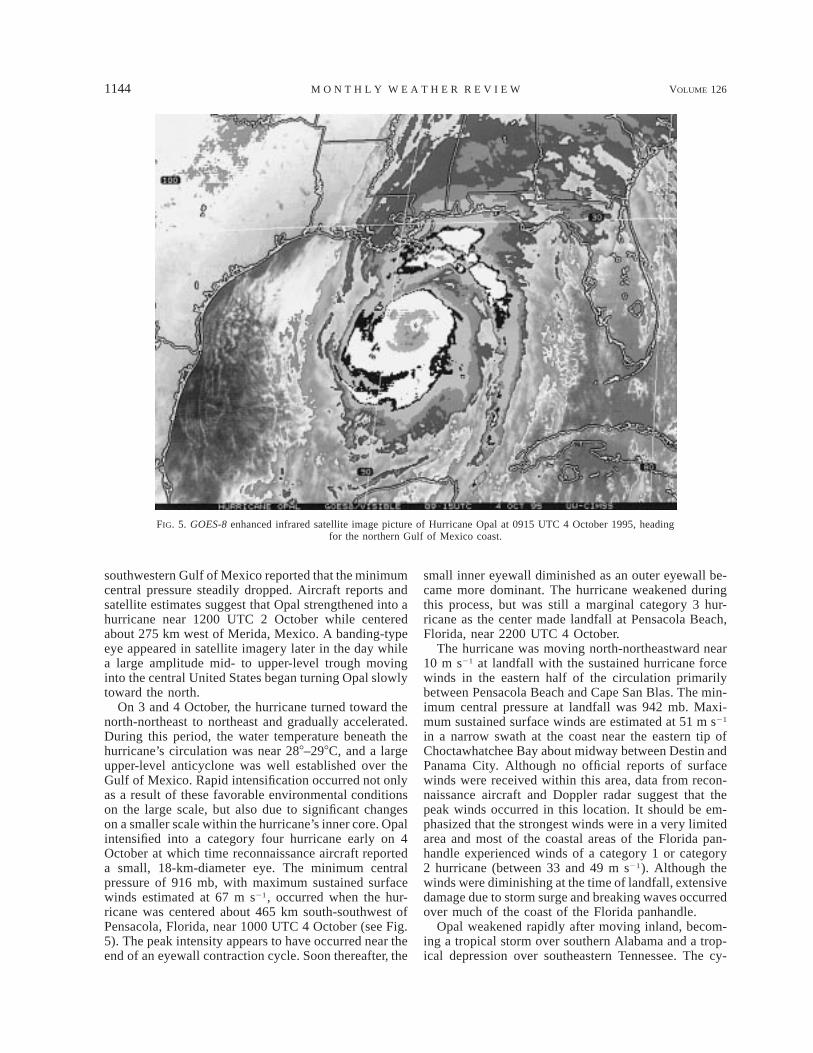
1144 VOLUME 126M O N T H L Y W E A T H E R R E V I E W
FIG. 5. GOES-8 enhanced infrared satellite image picture of Hurricane Opal at 0915 UTC 4 October 1995, headingfor the northern Gulf of Mexico coast.
southwestern Gulf of Mexico reported that the minimumcentral pressure steadily dropped. Aircraft reports andsatellite estimates suggest that Opal strengthened into ahurricane near 1200 UTC 2 October while centeredabout 275 km west of Merida, Mexico. A banding-typeeye appeared in satellite imagery later in the day whilea large amplitude mid- to upper-level trough movinginto the central United States began turning Opal slowlytoward the north.
On 3 and 4 October, the hurricane turned toward thenorth-northeast to northeast and gradually accelerated.During this period, the water temperature beneath thehurricane’s circulation was near 288–298C, and a largeupper-level anticyclone was well established over theGulf of Mexico. Rapid intensification occurred not onlyas a result of these favorable environmental conditionson the large scale, but also due to significant changeson a smaller scale within the hurricane’s inner core. Opalintensified into a category four hurricane early on 4October at which time reconnaissance aircraft reporteda small, 18-km-diameter eye. The minimum centralpressure of 916 mb, with maximum sustained surfacewinds estimated at 67 m s21, occurred when the hur-ricane was centered about 465 km south-southwest ofPensacola, Florida, near 1000 UTC 4 October (see Fig.5). The peak intensity appears to have occurred near theend of an eyewall contraction cycle. Soon thereafter, the
small inner eyewall diminished as an outer eyewall be-came more dominant. The hurricane weakened duringthis process, but was still a marginal category 3 hur-ricane as the center made landfall at Pensacola Beach,Florida, near 2200 UTC 4 October.
The hurricane was moving north-northeastward near10 m s21 at landfall with the sustained hurricane forcewinds in the eastern half of the circulation primarilybetween Pensacola Beach and Cape San Blas. The min-imum central pressure at landfall was 942 mb. Maxi-mum sustained surface winds are estimated at 51 m s21
in a narrow swath at the coast near the eastern tip ofChoctawhatchee Bay about midway between Destin andPanama City. Although no official reports of surfacewinds were received within this area, data from recon-naissance aircraft and Doppler radar suggest that thepeak winds occurred in this location. It should be em-phasized that the strongest winds were in a very limitedarea and most of the coastal areas of the Florida pan-handle experienced winds of a category 1 or category2 hurricane (between 33 and 49 m s21). Although thewinds were diminishing at the time of landfall, extensivedamage due to storm surge and breaking waves occurredover much of the coast of the Florida panhandle.
Opal weakened rapidly after moving inland, becom-ing a tropical storm over southern Alabama and a trop-ical depression over southeastern Tennessee. The cy-

MAY 1998 1145L A W R E N C E E T A L .
clone became extratropical as it moved northeastwardover the Ohio Valley and eastern Great Lakes into south-western Quebec. The strongest winds were far from thecenter of the cyclone during the extratropical stage.
2) METEOROLOGICAL STATISTICS
The minimum central pressure reported by aircraftwas 916 mb at 0945 UTC 4 October. This representeda 53-mb drop in pressure within 24 h and a 42-mb fallwithin about 12 h. This was a very rapid rate of deep-ening, but it is not unprecedented. Several western NorthPacific typhoons have deepened at an even faster rate.The maximum winds of 75 m s21 from a flight level of700 mb were measured shortly after the 916-mb pressurereport. At 2006 UTC, approximately 2 h prior to land-fall, the aircraft reported 65 m s21 at a location 110 kmeast of the center. At 2203 UTC, near the time of land-fall, the aircraft reported 59 m s21, 100 km east of thecenter.
A ship with call sign XCKX reported 39 m s21 windsat 1200 UTC 4 October while located above 165 kmwest-southwest of the hurricane center.
The strongest winds reported by a land station were38 m s21 with gusts to 64 m s21 from Hurlbert Field,Florida. Table 4 lists selected surface observations alongthe path of Opal.
Isolated tornadoes were reported from the Floridapanhandle to the mid-Atlantic states. One fatality oc-curred in Crestview, Florida, as a result of a tornado.Another tornado injured several people and severelydamaged a number of structures as it swept throughCharles, Prince Georges, and Anne Arundel Countiesin Maryland.
Survey results show storm surge flooding from south-eastern Mobile Bay and Gulf Shores, Alabama, eastwardthrough the Florida panhandle to Cedar Key, Florida.Still water mark elevations inside of buildings or tidegauge maximums, which damp out breaking wave ef-fects and are indicative of the storm surge, ranged from1.5 to 3.0 m above mean sea level. Outside water markson buildings or debris lines on sand dunes close to theGulf of Mexico shoreline are more representative of thecombined effects of storm surge and breaking wavesand these ranged from 3.0 to 7.6 m. For example, thetide gauge at the Panama City Beach pier recorded amaximum of approximately 2.5 m above mean sea level,indicative of storm surge. At the end of the pier a debrisline elevation of approximately 5.5 m above mean sealevel was recorded. This indicates that breaking waveson top of the storm surge added approximately 3 m.Many structures in this combined storm surge andbreaking wave zone suffered major damage.
The combination of Opal and a frontal system resultedin heavy rains along the path of the hurricane. Rainfalltotals generally ranged from 125 to 255 mm over por-tions of the Florida panhandle, Alabama, and Georgia.Rains in South Carolina averaged 50–100 mm while in
North Carolina 75–125 mm were common. Highlands,North Carolina, recorded 227 mm and Robinson Creek,North Carolina, recorded 251 mm. Elsewhere, up to 75mm of rain occurred over portions of the northeast Unit-ed States from Maryland northward. These rains havebeen described as beneficial to areas of the northeastUnited States that had been experiencing a prolongeddry period.
3) CASUALTY AND DAMAGE STATISTICS
The total number of deaths directly associated withOpal is estimated at 59, and were distributed as follows:Guatemala, 31 (from flooding during the developingstages of Opal); Mexico, 19 (from flooding); UnitedStates, 9 including Florida (1 from a tornado), Alabama(2 from a tree falling on a mobile home), Georgia (5from falling trees), and North Carolina (1 from a treefalling on a mobile home).
There were no reported deaths due to storm surgeflooding, which is remarkable in view of the vulnerablepopulation and extensive saltwater damage observed.
The Property Claim Services Division of the Amer-ican Insurance Services Group estimate of insured prop-erty damage for the United States is $2.1 billion. Con-siderable uncertainty exists concerning the amount ofadditional damage due to flood claims, uninsured prop-erty damage (including damage to roads and bridgesand other government property), and the cost of cleanup.Based on this, the total damage estimate from HurricaneOpal is $3 billion.
Most of the severe structural damage occurred at thecoastline. The crumbled piers, demolished homes, anderoded or submerged highways were primarily a resultof the storm surge. In addition, however, strong windsspread damage well inland. Opal downed numeroustrees, knocking out power to nearly two million peoplein Florida, Alabama, Georgia, and the Carolinas. TheRobert Trent Golf Course in Opelika, Alabama, lost over7000 trees during the storm. Many people in Floridawere without water for several days.
p. Tropical Storm Pablo, 4–8 October
Pablo was a Cape Verde–type tropical storm that didnot affect land.
1) SYNOPTIC HISTORY
Pablo originated from a tropical wave that movedfrom Africa to the Atlantic Ocean on 3 October. Thewave acquired a low-level circulation and became atropical depression at 1800 UTC 4 October, while itmoved westward at 8–10 m s21 and was centered about1100 km southwest of the Cape Verde Islands.
Pablo became a tropical storm on 5 October. Its move-ment was rather fast toward the west-northwest and thenwest across the tropical Atlantic for the next three days

1146 VOLUME 126M O N T H L Y W E A T H E R R E V I E W
TABLE 4. Hurricane Opal selected surface observations, October 1995.
Location Press. (mb)Date/time
(UTC)
Sustainedwind
(m s21)a
Peak gust(m s21)
Date/time(UTC)b
Stormsurge (m)c
Total rain(mm)
Louisiana 990.1 4/1953 12 15 4/2150 9New Orleans (NEW)Mid L. Ponchartrain cswy.
991.2 4/1951 1516
2120
4/23524/2300
30
MississippiGulfportKeesler AFB (BIX)Meridian (MEI)
985.4984.5991.6
4/19474/21255/0303
1515d
12
2028d
18
4/21474/19564/2335 93
AlabamaEvergreenMobile (MOB)Downtown MobileFt. Rucker (OZR)Maxwell AFB (MXF)
980.0978.5
978.4974.1
4/21194/2250
5/00595/0355
15172333d
21
22262944d
40
4/21154/23394/21005/00245/0327
206190
Montgomery (MGM)Auburn (AUB)Birmingham (BHM)Anniston (ANB)Huntsville (HSV)
969.4980.0976.7989.0982.4
5/02565/04005/06555/06315/0856
2112141319
2823221825
5/02455/03005/04535/03355/0627
82
96155
62
FloridaPensacola (I-10 and E. Bay)Pensacola Airport (FFA)Pensacola (PNS)Pensacola (NPA)Ellyson
948.2
955.0
4/2302
4/2225
2228
27
32323634
4/22474/20414/19304/2043
185176392
Hurlburt Field (HRT)Fort Walton BeachEglin AFB (VPS)Eglin AFB mesonet:
B-71 (30.528N, 86.648W)
960.3960.3966.5d
4/22254/22294/2156
38
36d
28
64
51d
46
4/2155
4/2304
4/2130
169
174
C-52N (30.588N, 86.328W)C-72 (30.668N, 86.348W)
Panama City (PAM)Apalachicola (AQQ)St. George Island cswy.
977.7991.2
4/22064/2120
28282814
4544382632
4/23154/23154/22524/22064/2149
1.8 65
Tallahassee (TLH)Tallahassee FSUTurkey Point (TUPF)Brooksville (BKV)New Port Richey
993.9995.0
1001.61003.5
4/22254/2216
4/21064/2116
14
191012
2328311416
5/02504/22264/20474/21155/0445
32
Tampa (TPA)St. Petersburg (PIE)SarasotaWinter Haven
1002.11001.61002.31003.5
4/20504/20004/18484/2103
11131415
20201919
4/16524/19484/16484/2341
1.2
404171
GeorgiaFort Benning (LSF)Warner Robbins AFB
984.5d
994.35/06565/0656
21d
1526d
235/05555/0555
13325
Atlanta (ATL)Dobbins AFB (MGE)MariettaFulton Co. (FY)Peach Tree City (FSC)
987.5987.0
5/07315/0755
1419d
12
2231d
31
5/05565/06085/0734
167131
158195
Buoys42001420034200742036
963.7992.8979.5995.4
4/06004/12004/21004/2100
27222718
34283522
4/10004/09004/19004/1800
C-MAN stationsGrand Isle (GDIL1)Southwest Pass (Burl1)Dauphin Is. (DPIA1)Keaton Beach (KTNF1)Cedar Key (CDRF1)
990.0985.4970.0998.0
1000.2
4/19004/17004/21264/20004/2100
2133271516
2739342424
4/14004/17004/21504/21004/2300
a NWS standard averaging period is 1 min; ASOS and C-MAN are 2 min; buoys are 8 min; WMO standard is 10 min.b Date/time is for sustained wind when both sustained and gust are listed.c Storm surge is water height above normal astronomical tide level.d Estimated.

MAY 1998 1147L A W R E N C E E T A L .
under the influence of deep easterlies. It is estimatedthat the storm’s sustained winds reached their maximumvalue of 26 m s21 on the 6th and then stayed near 23m s21 until the 8th, when the storm encountered verystrong vertical shear and quickly dissipated while cen-tered about 250 km east-southeast of Barbados.
2) METEOROLOGICAL STATISTICS
A reconnaissance aircraft investigated Pablo on themorning of 8 October and was unable to locate a well-defined low-level wind center. The ship Bruma reported26 m s21 winds on the 6th while located about 110 kmnorth of Pablo’s center, and this report is the basis forthe storm’s maximum wind estimate.
q. Hurricane Roxanne, 7–21 October
After striking the east coast of the Yucatan peninsulaas a category 3 hurricane, Roxanne meandered in theBay of Campeche for several days causing death anddestruction along the coast of the Mexican states ofYucatan, Campeche, and Tabasco.
1) SYNOPTIC HISTORY
Roxanne formed from a complex combination of sev-eral synoptic-scale features (a broad low-level low pres-sure area, a tropical wave, and an upper trough) thatinteracted over the western Caribbean Sea.
On 6 October, radiosonde data from the western Ca-ribbean indicated a broad well-established low- to mid-level cyclonic circulation with cloudiness and showersbetween the Cayman Islands and Honduras. A distincttropical wave, tracked from the coast of Africa on 26September, became convectively active over the centralCaribbean on 4 October. The wave reached the westernCarribean early on 7 October and interacted with thepreexisting area of disturbed weather. A slow westward-moving upper-level trough was at that time located overthe Windward Passage, to the east of an upper-levelanticyclone centered over the southeastern Gulf of Mex-ico. This combination resulted in diffluent, and presum-ably divergent, northerly winds over the low-level dis-turbance. High-level divergence has long been recog-nized as a factor in the development of incipient dis-turbances (e.g., Dunn and Miller 1964).
At the same time, a broad, weak 1004-mb low pres-sure area was located near the east coast of Nicaragua.Satellite images indicated a gradual increase in orga-nization and cloud-banding features began to developearly on 7 October as the tropical wave reached thearea. It is estimated that the system became a tropicaldepression at 1800 UTC 7 October just east of Nica-ragua. The next day, a reconnaissance plane confirmedthe presence of a tropical depression with a pressurecenter of 1004 mb and 15 m s21 winds. Satellite imagesand surface observations indicated a steady intensifi-
cation. The depression became Tropical Storm Roxanneat 0000 UTC 9 October and a hurricane by 0600 on the10th. During that period, data from reconnaissanceplanes indicated that the pressure dropped to 989 mband by 1200 UTC on the 10th the pressure was downto 972 mb. Prior to intensification, the low-level centerwas located on the northern edge of the deep convectiondue to the northerly winds produced by the upper highover the Gulf of Mexico. However, the upper troughpreviously located over the Windward Passage becamea cutoff low and moved west-southwest into CentralAmerica. This allowed the outflow to become estab-lished in all quadrants.
Initially, Roxanne was a threat to Cuba and the Cay-man Islands as it moved northward in response to aweak trough over Florida and the eastern Gulf of Mex-ico. The trough moved eastward and was replaced bya high pressure system. Roxanne turned northwestwardand then westward toward the Yucatan peninsula andintensified.
During the early afternoon of 10 October, a well-defined eye became apparent on satellite images. Bylate on the same day, Roxanne reached its maximumsustained wind speed of 51 m s21 and a minimum pres-sure of 956 mb while located just to the east of Cozumel(see Fig. 6).
Radar imagery from Cancun indicated that the north-ern eyewall crossed the coast at Cozumel at 2340 UTC10 October. The hurricane made landfall just north ofTulum, on the mainland, Mexico, just to the southwestof Cozumel about 0200 UTC 11 October. Roxanne con-tinued westward over the Yucatan peninsula andemerged over the Gulf of Campeche as a minimal hur-ricane, but temporarily weakened to tropical storm sta-tus. It then regained hurricane intensity and maintainedthat status for about 60 h before weakening to a tropicalstorm and then to a tropical depression.
The steering currents were weak when Roxanne wasin the Bay of Campeche. Consequently, the hurricanemeandered within an area of less than 450 km for almosta week. During that period, several shortwave troughsand ridges passed by to the north of Roxanne, forcingthe tropical cyclone to move a short distance eithersoutheastward or northwestward. Rainbands and wavesof 4–6 m pounded the coast from the State of Campecheto Veracruz throughout that time. Eventually, Roxannewas forced to move southward toward Veracruz by anapproaching strong cold front and the remnants movedinland on 21 October.
2) METEOROLOGICAL STATISTICS
The minimum pressure and maximum wind speedreported by reconnaissance aircraft was 956 mb and 59m s21 (700 mb) at 2152 UTC 10 October. An automaticstation near Merida reported sustained winds of 33 ms21 with gusts to 56 m s21 at 1900 UTC 11 October,when the center was located over land and about 150

1148 VOLUME 126M O N T H L Y W E A T H E R R E V I E W
FIG. 6. GOES-8 visible satellite image of Hurricane Roxanne at 2045 UTC 10 October 1995, as the eye wasnearing Cozumel, Mexico.
km to the south of the station. On the 15th, when Rox-anne moved over the Bay of Campeche, sustained windsof 33 m s21 with gusts to 36 m s21 were reported fromParaiso. A report of 29 m s21 with gusts to 33 m s21
was received from Champoton and 23 m s21 with guststo 26 m s21 came from Tuxpan. Villahermosa reported28 m s21 with gusts to 36 m s21. On the east coast,southwest of Cozumel (208309N, 868579W) and about50 km to the north of where the center made landfall,a surface pressure of 978 mb and winds gusting to over60 m s21 were reported and a total of 137 mm of rainwas measured during a period of about 36 h.
A weather station in Veracruz reported a rainfall totalof 305 mm of rain and the Tabasco Observatory reported241 mm.
3) CASUALTY AND DAMAGE STATISTICS
The death toll is estimated at 14 according to the Ft.Lauderdale Sun-Sentinel, 20 October 1995. Five of thesedeaths were caused by a petroleum work barge that sankwith 245 people on board. According to Mexican au-thorities, more than 40 000 homes were damaged byRoxanne in the states of Campeche, Quintana Roo, Ta-basco, Veracruz, and Yucatan. Numerous crops weredamaged, cattle drowned, and roads were washed outor blocked by mud and rock slides. The road between
the City of Carmen and Campeche was completely de-stroyed. Thousands of people were evacuated. There areunconfirmed reports that many hotel lobbies in Cancunand Cozumel were damaged from pounding waves. Ex-tensive tree damage was observed in Cozumel. Stormtides and swollen rivers caused the worst flooding inCampeche and Tabasco since 1927. It appears the worstdamage was produced by the pounding of high wavesalong the shore for several days.
This area had previously been affected by HurricaneOpal a week or two before and it is difficult to separatethe damage caused by Opal and Roxanne. The estimateof the combined damage in the Yucatan peninsula is$1.5 billion.
r. Tropical Storm Sebastien, 20–25 October
1) SYNOPTIC HISTORY
Tropical Storm Sebastien originated from a tropicalwave that moved westward across the Atlantic Oceanfrom 13 through 19 October. Associated thunderstormsremained unorganized and mostly to the south of 158Nduring that period. On the 20th, deep convection becamemore concentrated about 650 km to the east of Barbados,and based on satellite imagery, it is estimated that the

MAY 1998 1149L A W R E N C E E T A L .
system became a tropical depression at 1200 UTC onthe 20th and a tropical storm at 0000 UTC on the 21st.
From 20 to 22 October, Sebastien was embeddedwithin the outer part of the circulation associated witha large, deep low pressure system centered just northeastof Puerto Rico. The associated steering currents movedSebastien toward the northwest and then north at about8 m s21 during that period. Southwesterly vertical windshear precluded significant development and, based ona ship observation, Sebastien reached its peak intensityof 28 m s21 at 1800 UTC 22 October. At that time, itsexposed low-level cloud center was located about 650km to the northeast of the northern Leeward Islands.
Sebastien began moving with the low-level flow to-ward the southwest on 23 October. This pushed Sebas-tien directly into the upper-level southwesterly winds,displacing the coldest cloud tops about 185 km to theeast and northeast of the center. Sebastien weakened toa tropical depression during the evening of 23 Octoberwhile it moved under the upper-level cyclonic circula-tion. Its dissipating circulation of low clouds was nearthe U.S. Virgin Islands about 24 h later, while someremnant deep convection persisted well to the east.
2) METEOROLOGICAL STATISTICS
The basis for the estimated maximum wind speed of28 m s21 is a 27 m s21 wind speed observed on the shipwith call sign ELSE5 while it was located 110 km north-east of the center at 1800 UTC 22 October. The max-imum flight-level reconnaissance wind at about 500 kmwas also reported at about this time and was 26 m s21.The only other reports of tropical storm force or higherwind speeds came from the ship Sea Wolf. It had 19and 20 m s21 winds at 1200 and 1400 UTC, respectively,on 21 October, 65–85 km to the east of the circulationcenter.
s. Hurricane Tanya, 27 October–1 November
1) SYNOPTIC HISTORY
Tanya originated from a tropical wave that moved offthe west coast of Africa in mid-October. This wave fol-lowed one that spawned Tropical Storm Sebastien, andwas not easily identifiable as a cloud mass on satellitepictures until 20 October, while located in the centraltropical Atlantic Ocean. The wave moved slowly west-ward for a few days. By 24 October, cloudiness asso-ciated with the wave merged with an area of convectionto the east and northeast of Tropical Depression Sebas-tien. This weather was partly associated with an upper-level cyclone that was producing shearing winds overSebastien, causing its demise. At 1800 UTC 25 October,a low cloud swirl was evident in the vicinity of 228N,608W. However, the associated deep convection was notvery close to the center. The low-cloud swirl becamemore pronounced on satellite images on the 26th. By
0000 UTC 27 October, surface observations indicateda definite closed surface circulation and the tropical de-pression stage of Tanya began then, centered about 900km northeast of Puerto Rico.
The movement of the tropical cyclone was controlledmainly by two factors: shortwaves in the midlatitudewesterlies and the upper-level cyclone in Tanya’s vicin-ity. Initially the cyclone moved northeastward, in re-sponse to an approaching shortwave trough. However,due to the effect of the upper cyclone, Tanya turnedmore eastward and slowed.
Because of the influence of the upper-level cyclone,the development of Tanya was not like that of a typicaltropical cyclone in the deep Tropics. On 27 and 28 Oc-tober, the system had some subtropical characteristics—that is, a large comma-shaped cloud band and strongestwinds well removed from the center. Nonetheless, Tan-ya’s winds increased to tropical storm force by 1200UTC on the 27th and gradual strengthening continuedthereafter. Convection developed closer to the center by1800 UTC on the 28th, and on the following day thecloud pattern was more symmetrical about the center.Tanya reached hurricane strength around 1200 UTC onthe 29th, when a small eye was observed in the middleof the central dense overcast.
While Tanya was strengthening into a hurricane, itsmotion was cyclonic along roughly a half-circular path,again due to the adjacent upper low. This movementcontinued into 29 October, when a strong eastward-mov-ing midtropospheric trough over the western Atlantic,and associated cold front near Bermuda, began to in-fluence the track of the hurricane. Tanya turned north-northeastward on the 30th, and east-northeastward laterthat same day. Early on the 31st, while still embeddedin a narrow wedge of warmer air between cooler airmasses over the western and eastern Atlantic, the systemacquired its peak intensity of 39 m s21 winds with a972-mb central pressure.
On 1 November, Tanya veered to the east and weak-ened to a tropical storm and headed in the general di-rection of the Azores. As the storm neared those islands,the movement became more northeasterly, taking thecenter just to the north of the Azores. Tanya was be-coming extratropical as it passed near the Azores. Theextratropical cyclone turned north-northeastward, thennorthward, and was absorbed into a larger low pressuresystem over the North Atlantic by 0600 UTC 3 No-vember.
2) METEOROLOGICAL STATISTICS
There were some surface observations from theAzores of sustained gale force winds. Lajes Air Baseon Terceira measured sustained winds of 18 m s21 at2255 UTC with gusts to 30 m s21 at 2343 UTC 1 No-vember. Santa Maria Island reported sustained winds of20 m s21 at 2300 UTC on the 1st, with gusts to 26 ms21 at 0200 UTC on the 2d. The lowest pressure ob-

1150 VOLUME 126M O N T H L Y W E A T H E R R E V I E W
TABLE 5a. Official track forecast errors (km).
Forecast period (h)
0 12 24 36 48 72
1995 mean1995 mean CLIPER(No. of cases)
2222
(446)
87100
(446)
161206
(410)
230319
(375)
297423
(343)
432606
(280)1985–94 mean1995 departure from 1985–94 mean1995 maximum
28220%
163
93207%
343
182211%
660 875
360217%
927
549221%1216
TABLE 5b. Official maximum 1-min wind speed forecast errors (m s21).
Forecast period (h)
0 12 24 36 48 72
1995 mean1995 mean absolute1995 mean SHIFOR1995 mean absolute SHIFOR(No. of cases)
20.81.7
20.81.7
(446)
20.63.2
20.74.0
(446)
20.84.8
21.05.6
(410)
21.16.1
21.56.8
(375)
21.97.8
21.97.9
(343)
22.09.8
23.38.9
(279)1985–94 mean1985–94 mean absolute1995 departure from 1985–94 mean absolute1995 maximum absolute
20.82.4
230%15
20.84.0
219%21
21.05.9
218%23 26
22.18.5
208%31
22.510.8
210%31
served in the Azores was 973.5 mb at Horta on theisland of Faial.
Many ships reported tropical storm force winds inassociation with Tanya. A ship, with call sign GBSA,had the misfortune of being near the center of Tanyatwice: on 29 October, when Tanya was a hurricane; andon 2 November, when Tanya was an extratropical storm.
4. Verification
The NHC issues an official 72-h track and intensityforecast on all tropical cyclones in the Atlantic basin(and in the eastern Pacific basin) and verifies these fore-casts by comparison with the best tracks described insection 1. Table 5a lists the yearly mean track forecasterrors for 1995, along with the previous 10-yr meansand Table 5b lists similar statistics for intensity forecasterrors. The errors in Table 5 are for tropical storm andhurricane stages only, and do not include tropical de-pression stage.
A track error is defined as the great-circle distancebetween a forecast position and a best track position ofthe tropical cyclone center. The mean track errors for1995 range from 22 km at the 0-h forecast period to432 km at 72 h. These errors are less than the previous1985–94 means at all forecast periods. Mean 1995 errorsare also listed in Table 5a for the CLIPER (climatologyand persistence) statistical track forecast model for thesame 446 cases used to determine the official errors.The CLIPER model was designed by Neumann (1972)and is based on linear regression between center motionand several parameters, including initial (0-h forecastperiod) position, initial motion, past 12-h motion, max-
imum wind speed, and day number. The best track da-taset for the period 1931–70 was used to determine thepredictive regression equations. The operational CLI-PER forecasts in Table 5a represent a skill level attain-able using only the operational estimates of initial po-sition and motion as input. It is customary to estimatethe skill of the official forecast as its improvement overthe CLIPER forecast. From Table 5a, it can be deter-mined that the mean official track error improvementover CLIPER ranges from 13% at 12 h to near 30% at36 h and beyond.
There are two intensity forecast errors. One error isthe difference between the forecast maximum 1-minwind speed and the best track wind speed. A positiveerror means that the forecast wind speed is higher thanobserved and vice versa. The second intensity error isthe absolute value of the error without regard to its sign.The sign of the error might be considered as a bias,while the absolute value represents the magnitude of theerror. The SHIFOR model (Jarvinen and Neumann1979) is a statistical model for intensity that is analogousto the CLIPER model and can be used to estimate theskill of the official intensity forecasts. Table 5b showsthat the official 1995 mean absolute official intensityerrors are nearly as large or larger than the 48- and 72-h SHIFOR errors. It is concluded that there is no ‘‘skill’’in the official intensity forecast after 36 h.
Acknowledgments. We thank Stephen R. Baig for as-sistance in preparing Fig. 1, John L. Beven for contrib-uting to the Hurricane Felix section, and ChristopherW. Landsea for suggesting numerous improvements tothe manuscript.

MAY 1998 1151L A W R E N C E E T A L .
REFERENCES
Dunn, G. E., and B. I. Miller, 1964: Atlantic Hurricanes. LouisianaState University Press, 377 pp.
Dvorak, V. F., 1984: Tropical cyclone intensity analysis using satellitedata. NOAA Tech. Rep. NESDIS 11, 47 pp.
Jarvinen, B. R., and C. J. Neumann, 1979: Statistical forecasts oftropical cyclone intercity for the North Atlantic basin. NOAATech. Memo. NWS NHC-10, 22 pp.
Landsea, C. W., G. D. Bell, W. M. Gray, and S. B. Goldenberg, 1998:The extremely active 1995 Atlantic hurricane season: Environ-
mental conditions and verification of seasonal forecasts. Mon.Wea. Rev., 126, 1174–1193.
Neumann, C. J., 1972: An alternate to the HURRAN (hurricane an-alog) tropical cyclone forecast system. NOAA Tech. Memo.NWS SR-62, 24 pp., B. R. Jarvinen, C. J. McAdie, and J. E. Elms, 1993: TropicalCyclones of the North Atlantic Ocean, 1871–1992. HistoricalClimatology Series 6-2, National Climatic Data Center, 193 pp.
Powell, M. D., and S. H. Houston, 1998: Surface wind fields of 1995Hurricanes Erin, Opal, Luis, Marilyn, and Roxanne at landfall.Mon. Wea. Rev., 126, 1259–1273.
Simpson, R. H., and H. Riehl, 1981: The Hurricane and Its Impact.Louisiana State University Press, 398 pp.