assessing the carbon footprint of animal agriculture … education/2009/fall/cady 2.pdf ·...
TRANSCRIPT
Assessing the Carbon Footprint ofAnimal Agriculture
Dr. Jude Capper1, Dr. Roger A. Cady2,Dr. Dale Bauman3
1Washington State University, 2Elanco Animal Health, 3Cornell University
Prepared for: Ontario Association of Bovine Practioneers MeetingGuelph, Ontario, Canada
November 18, 2009
DBM 0304

There is a Human Tendency
DBM 0375
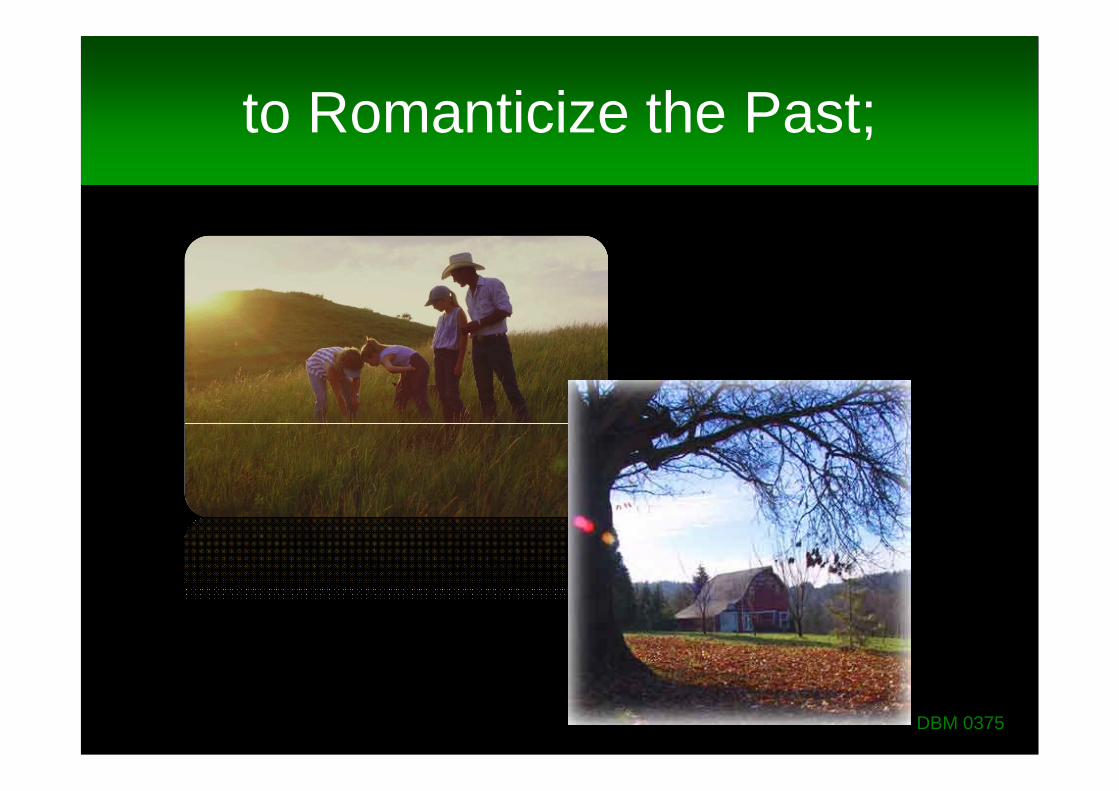
to Romanticize the Past;
DBM 0375
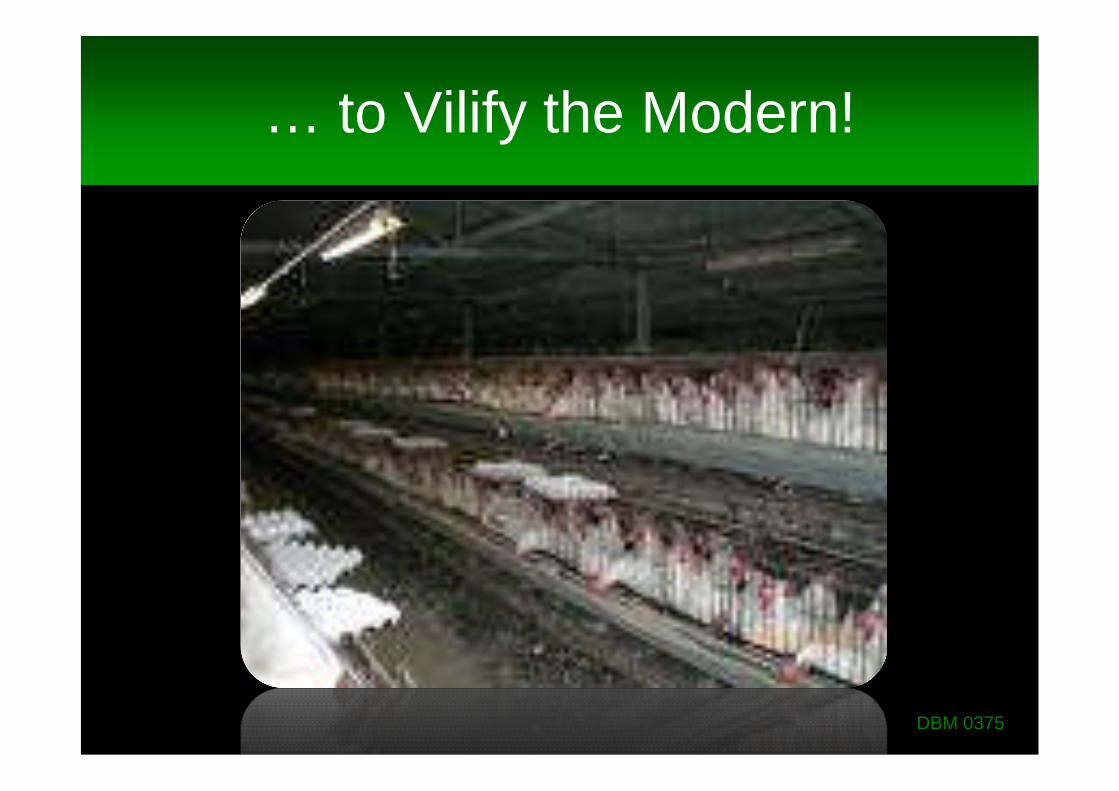
… to Vilify the Modern!
DBM 0375
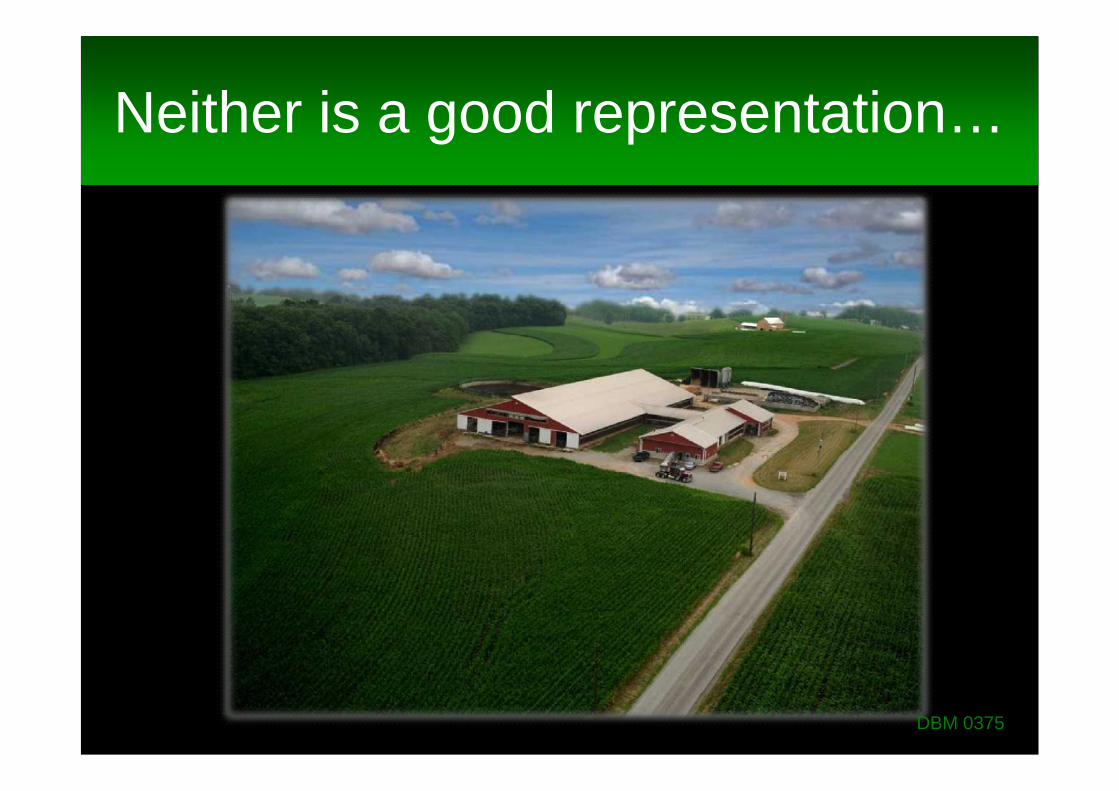
Neither is a good representation…
DBM 0375

… and those that remember,might argue about the past!
DBM 0375
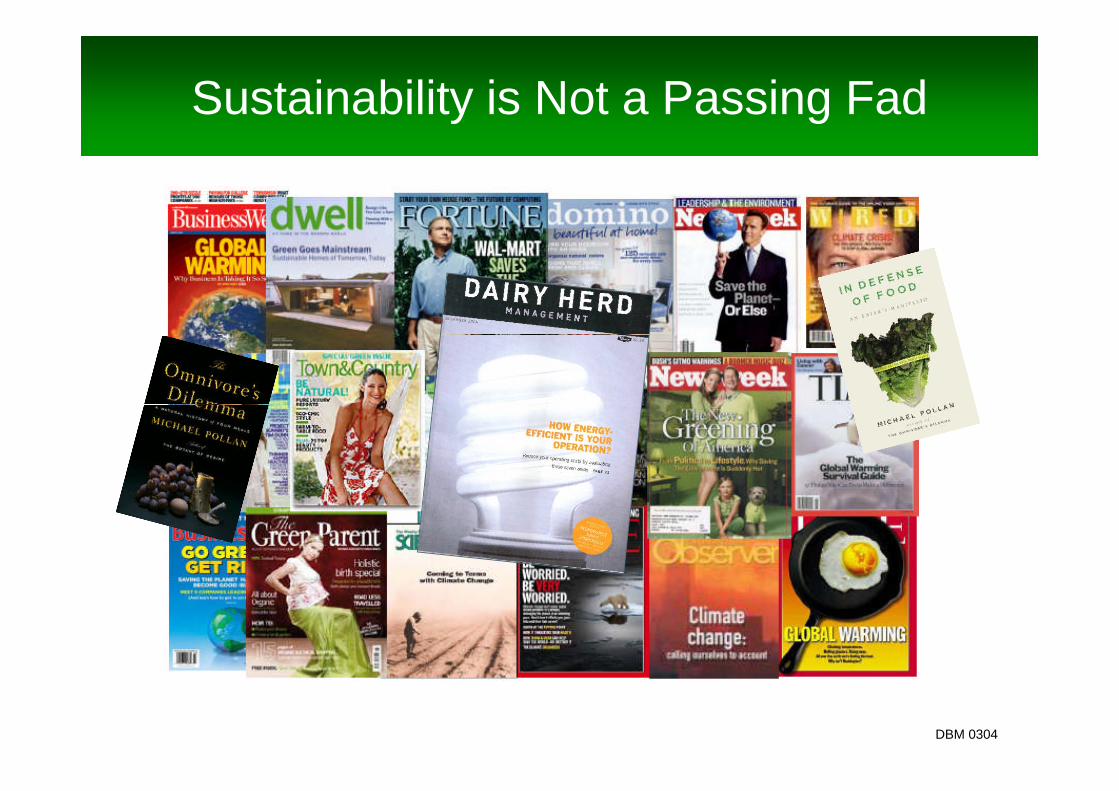
Sustainability is Not a Passing Fad
DBM 0304
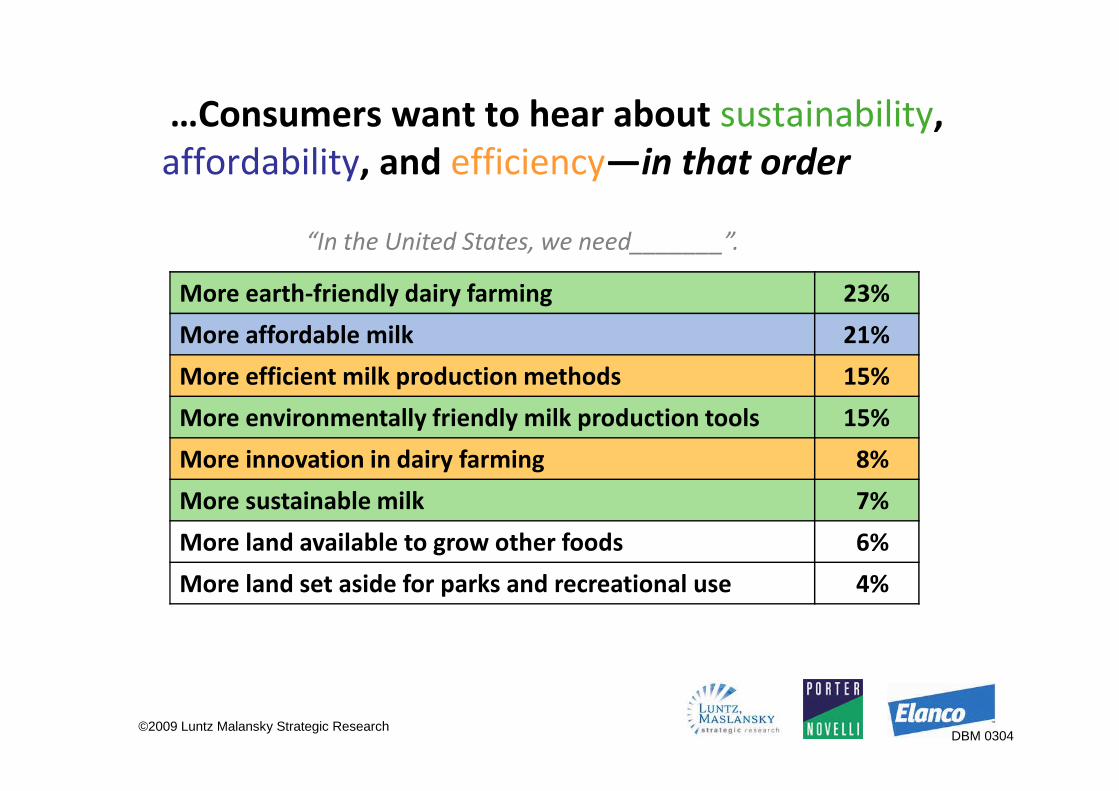
…Consumers want to hear about sustainability,affordability, and efficiency—in that order
“In the United States, we need_______”.
More earth-friendly dairy farming 23%
More affordable milk 21%
More efficient milk production methods 15%
More environmentally friendly milk production tools 15%
More innovation in dairy farming 8%
More sustainable milk 7%
More land available to grow other foods 6%
More land set aside for parks and recreational use 4%
©2009 Luntz Malansky Strategic ResearchDBM 0304

Retailers Are Responding andAccelerating the Movement
Excerpted from: Wall Street Journal, Oct. 9, 2007DBM 0304

Meat, Milk & Egg Production is ClearlyBeing Held Accountable
• Livestock productionaccounts for 18% ofGreenhouse Gasemissions worldwide(UN/FAO, 2006)
• In the USA, contributionof Agriculture (in total) toGHG emissions isapproximately 6% (EPAReport on GHG Emissions, 2008)
• Ability to discussenvironmental benefits iscritical for development ofanimal productivityproducts
DBM 0304
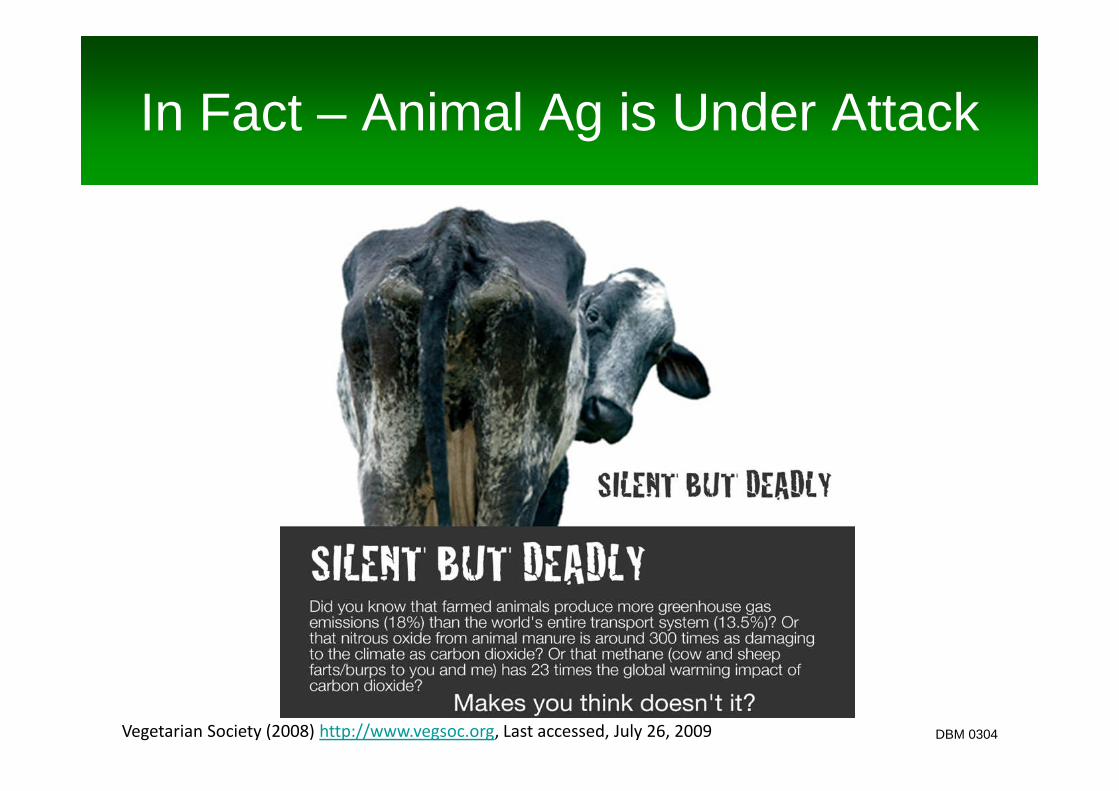
Vegetarian Society (2008) http://www.vegsoc.org, Last accessed, July 26, 2009
In Fact – Animal Ag is Under Attack
DBM 0304
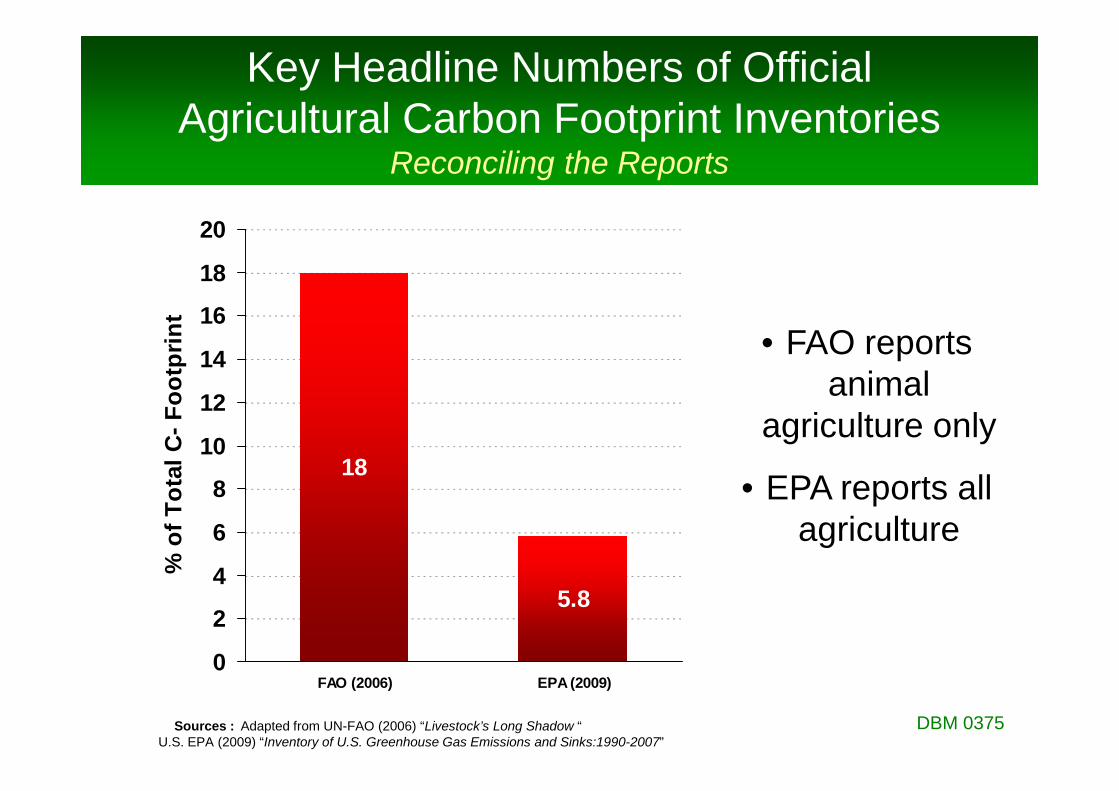
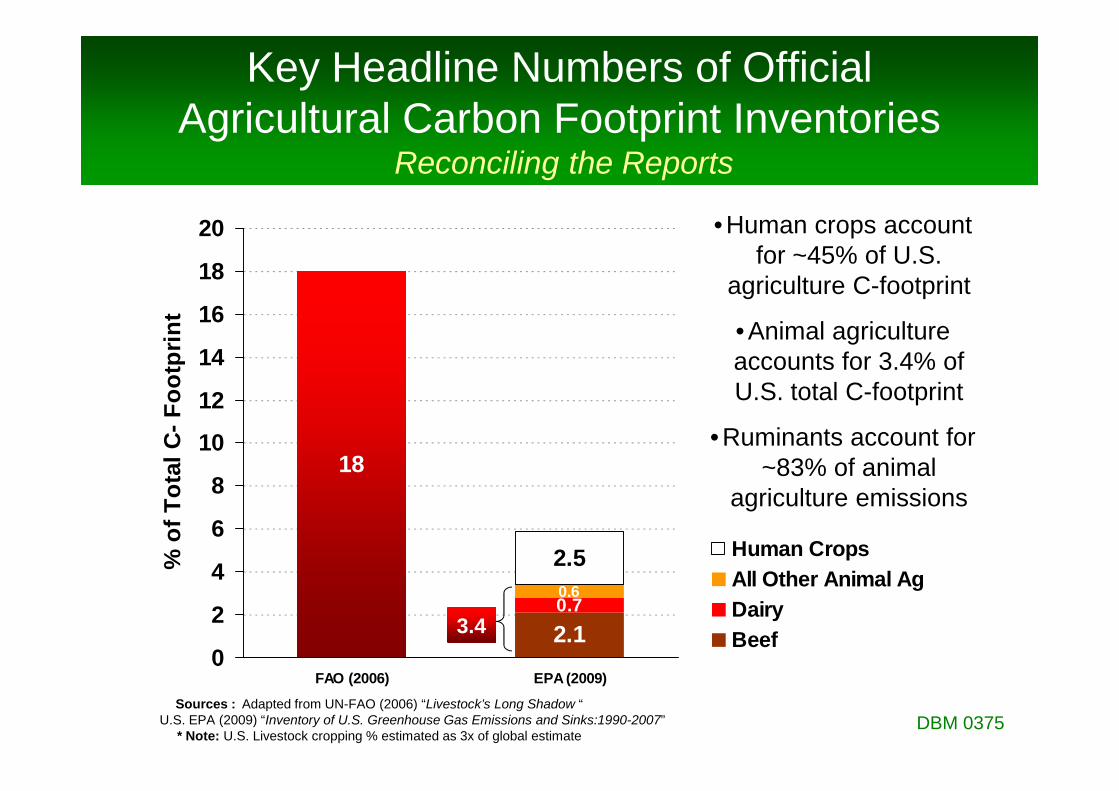
Key Headline Numbers of OfficialAgricultural Carbon Footprint Inventories
Reconciling the Reports
18
5.8
0
2
4
6
8
10
12
14
16
18
20
FAO (2006) EPA (2009)
%o
fT
ota
lC
-F
oo
tpri
nt
• FAO reportsanimal
agriculture only
• EPA reports allagriculture
Sources : Adapted from UN-FAO (2006) “Livestock’s Long Shadow “U.S. EPA (2009) “Inventory of U.S. Greenhouse Gas Emissions and Sinks:1990-2007”
DBM 0375
Key Headline Numbers of OfficialAgricultural Carbon Footprint Inventories
Reconciling the Reports
18
2.1
0.6
2.5
0.7
0
2
4
6
8
10
12
14
16
18
20
FAO (2006) EPA (2009)
%o
fT
ota
lC
-F
oo
tpri
nt
Human Crops
All Other Animal Ag
Dairy
Beef
Deforestation
•Human crops accountfor ~45% of U.S.
agriculture C-footprint
•Animal agricultureaccounts for 3.4% ofU.S. total C-footprint
•Ruminants account for~83% of animal
agriculture emissions
3.4
Sources : Adapted from UN-FAO (2006) “Livestock’s Long Shadow “U.S. EPA (2009) “Inventory of U.S. Greenhouse Gas Emissions and Sinks:1990-2007”
* Note: U.S. Livestock cropping % estimated as 3x of global estimateDBM 0375

Key Headline Numbers of OfficialAgricultural Carbon Footprint Inventories
Reconciling the Reports
8.5
9.5
3.40
2
4
6
8
10
12
14
16
18
20
FAO (2006) EPA (2009)
%o
fT
ota
lC
-F
oo
tpri
nt
Beef
Deforestation
Sources : Adapted from UN-FAO (2006) “Livestock’s Long Shadow “U.S. EPA (2009) “Inventory of U.S. Greenhouse Gas Emissions and Sinks:1990-2007”
* Note: U.S. Livestock cropping % estimated as 3x of global estimate
18%
3.4%R
efo
res
tatio
n
• Deforestation for animal feedand pasture included in FAOreport: 48% of FAO estimate
• Deforestation is a developingcountry phenomenon
• Reforestation creates acarbon sink
• U.S. is a reforesting country
• Reforesting not accountedfor in EPA report
DBM 0375

Forest Transition and Land Degradation in DryLands
Source : UN-FAO (2006) “Livestock’s Long Shadow “DBM 0375
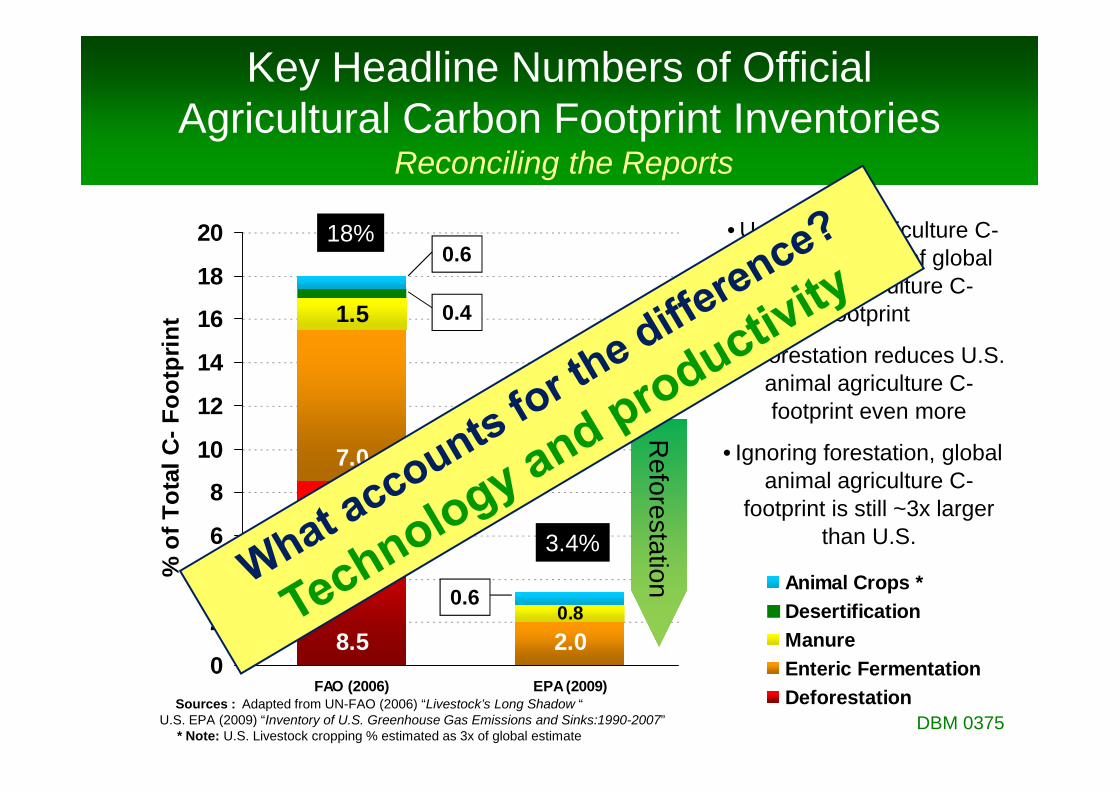
7.0
2.08.5
1.5
0.8
0
2
4
6
8
10
12
14
16
18
20
FAO (2006) EPA(2009)
%o
fT
ota
lC
-F
oo
tpri
nt
Animal Crops *
Desertification
Manure
Enteric Fermentation
Deforestation
Key Headline Numbers of OfficialAgricultural Carbon Footprint Inventories
Reconciling the Reports
Re
fore
sta
tion
0.4
0.6
0.6
18%
3.4%
• U.S. animal agriculture C-footprint is <1/5 of global
animal agriculture C-footprint
• Reforestation reduces U.S.animal agriculture C-footprint even more
• Ignoring forestation, globalanimal agriculture C-
footprint is still ~3x largerthan U.S.
Sources : Adapted from UN-FAO (2006) “Livestock’s Long Shadow “U.S. EPA (2009) “Inventory of U.S. Greenhouse Gas Emissions and Sinks:1990-2007”
* Note: U.S. Livestock cropping % estimated as 3x of global estimateDBM 0375
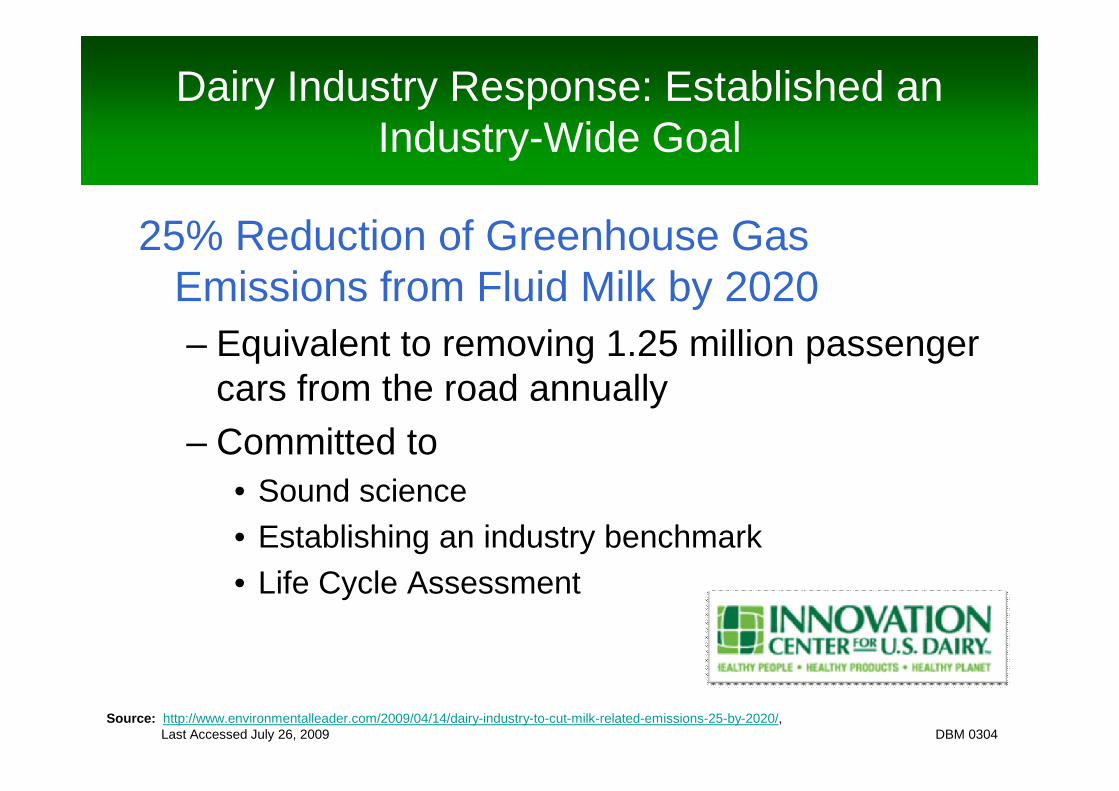
Dairy Industry Response: Established anIndustry-Wide Goal
25% Reduction of Greenhouse GasEmissions from Fluid Milk by 2020
– Equivalent to removing 1.25 million passengercars from the road annually
– Committed to
• Sound science
• Establishing an industry benchmark
• Life Cycle Assessment
Source: http://www.environmentalleader.com/2009/04/14/dairy-industry-to-cut-milk-related-emissions-25-by-2020/,Last Accessed July 26, 2009 DBM 0304
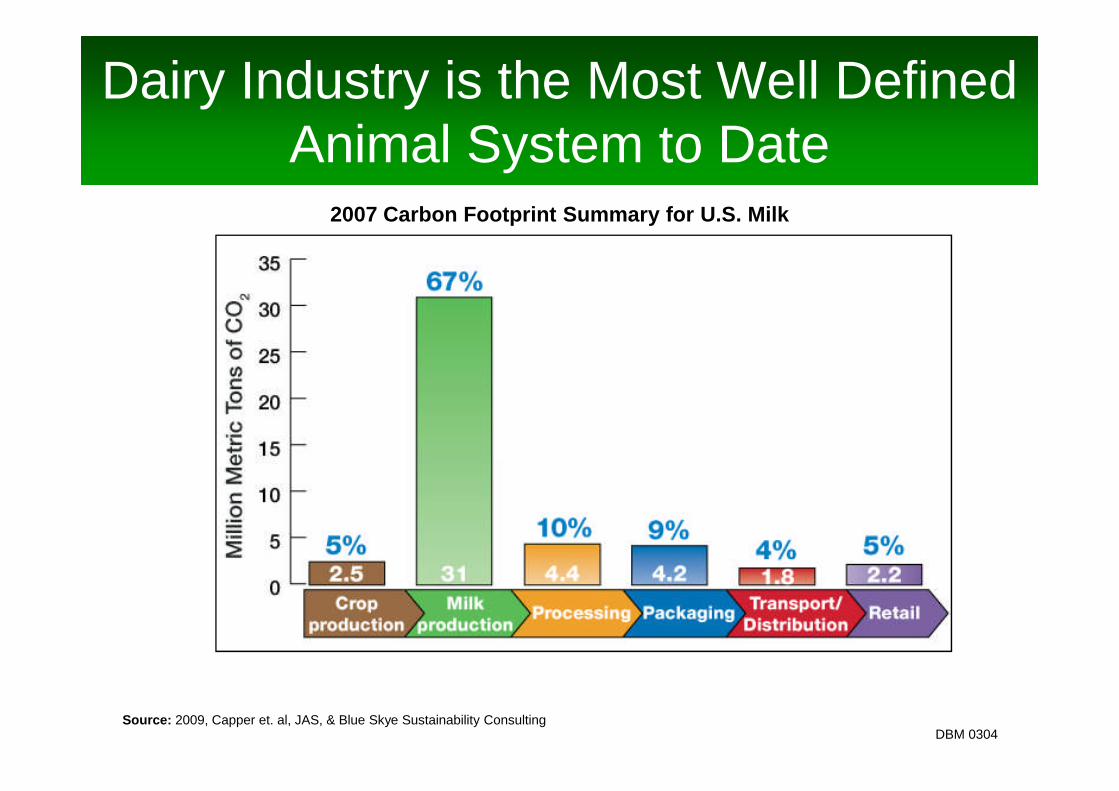
2007 Carbon Footprint Summary for U.S. Milk
Source: 2009, Capper et. al, JAS, & Blue Skye Sustainability Consulting
Dairy Industry is the Most Well DefinedAnimal System to Date
DBM 0304
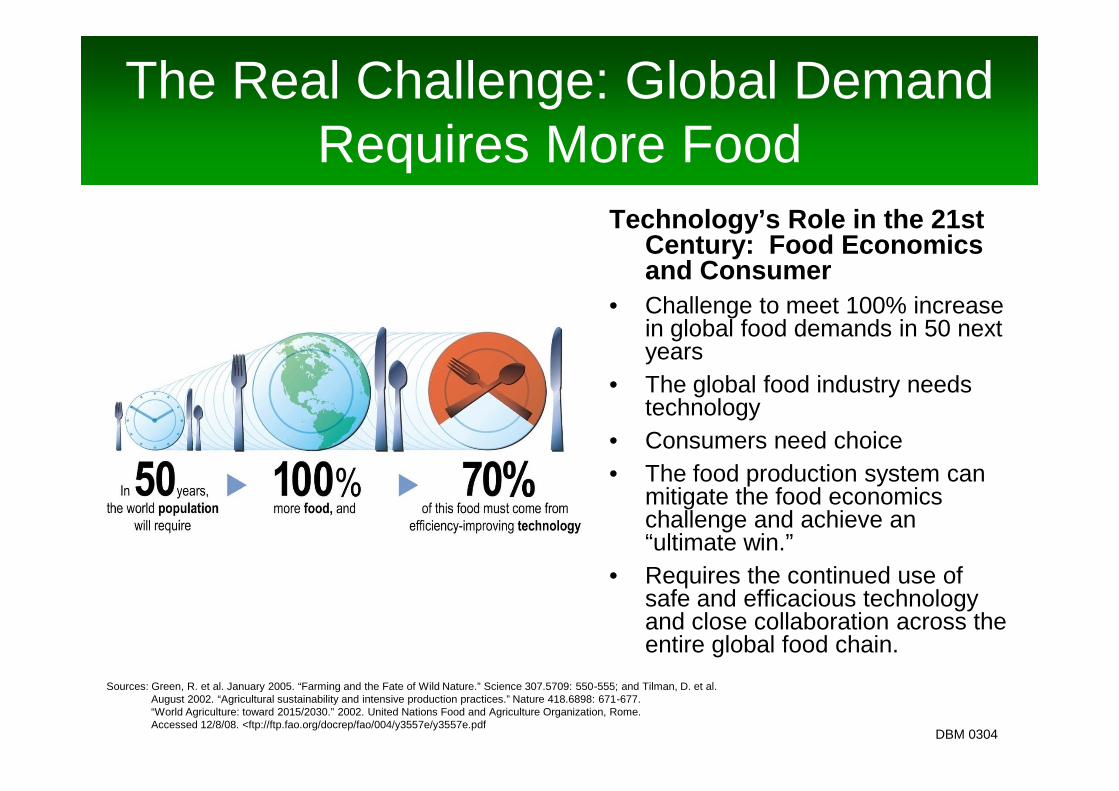
The Real Challenge: Global DemandRequires More Food
Sources: Green, R. et al. January 2005. “Farming and the Fate of Wild Nature.” Science 307.5709: 550-555; and Tilman, D. et al.August 2002. “Agricultural sustainability and intensive production practices.” Nature 418.6898: 671-677.“World Agriculture: toward 2015/2030.” 2002. United Nations Food and Agriculture Organization, Rome.Accessed 12/8/08. <ftp://ftp.fao.org/docrep/fao/004/y3557e/y3557e.pdf
Technology’s Role in the 21stCentury: Food Economicsand Consumer
• Challenge to meet 100% increasein global food demands in 50 nextyears
• The global food industry needstechnology
• Consumers need choice
• The food production system canmitigate the food economicschallenge and achieve an“ultimate win.”
• Requires the continued use ofsafe and efficacious technologyand close collaboration across theentire global food chain.
DBM 0304

What is a Carbon Footprint?
Total GHG (greenhouse gas) emissions caused directlyand indirectly by an individual, organization or state ina given time
• Measured in CO2-equivalents in terms of environmentalheat capturing capability
CO2CH4
N2O
1 23 298
Source: http://ipcc-wg1.ucar.edu/wg1/Report/AR4WG1_Print_Ch02.pdf,Last accessed, July 26, 2009
DBM 0304
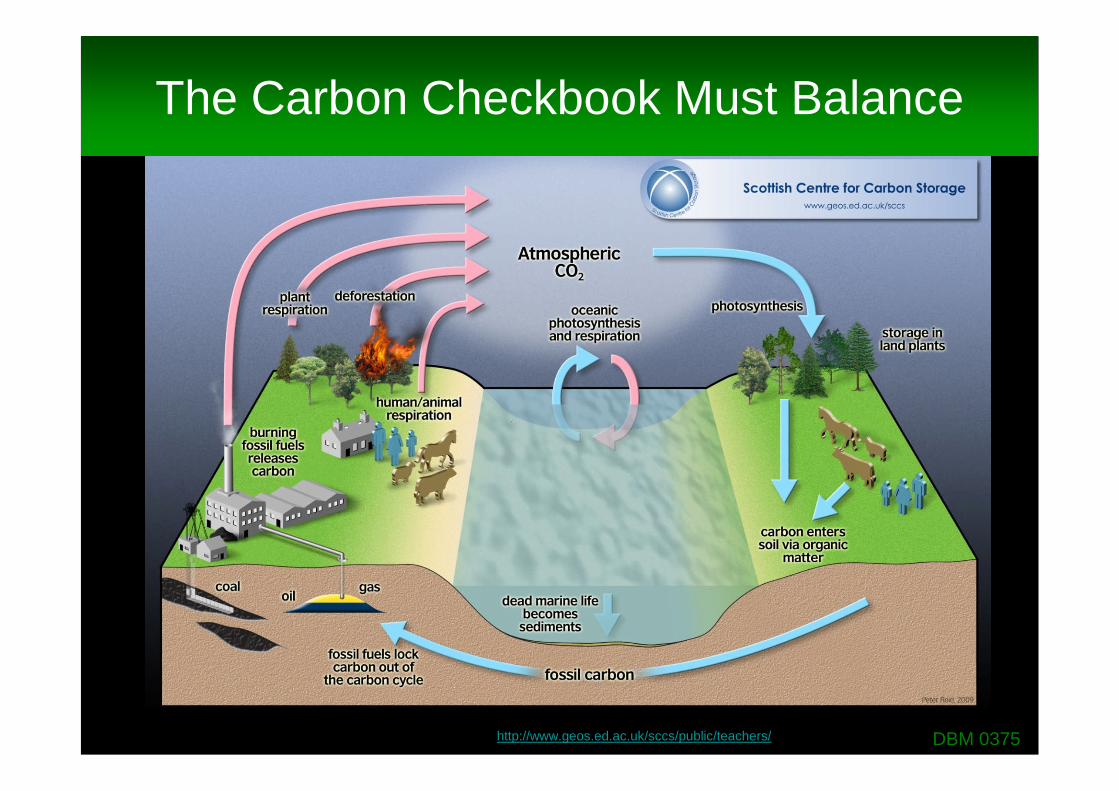
Carbon cycle??
Source: Scottish Centre for Carbon Storage (2009) http://www.geos.ed.ac.uk/sccs/public/teachers/ Last accessed, 9/15/09
The Carbon Checkbook Must Balance
DBM 0375
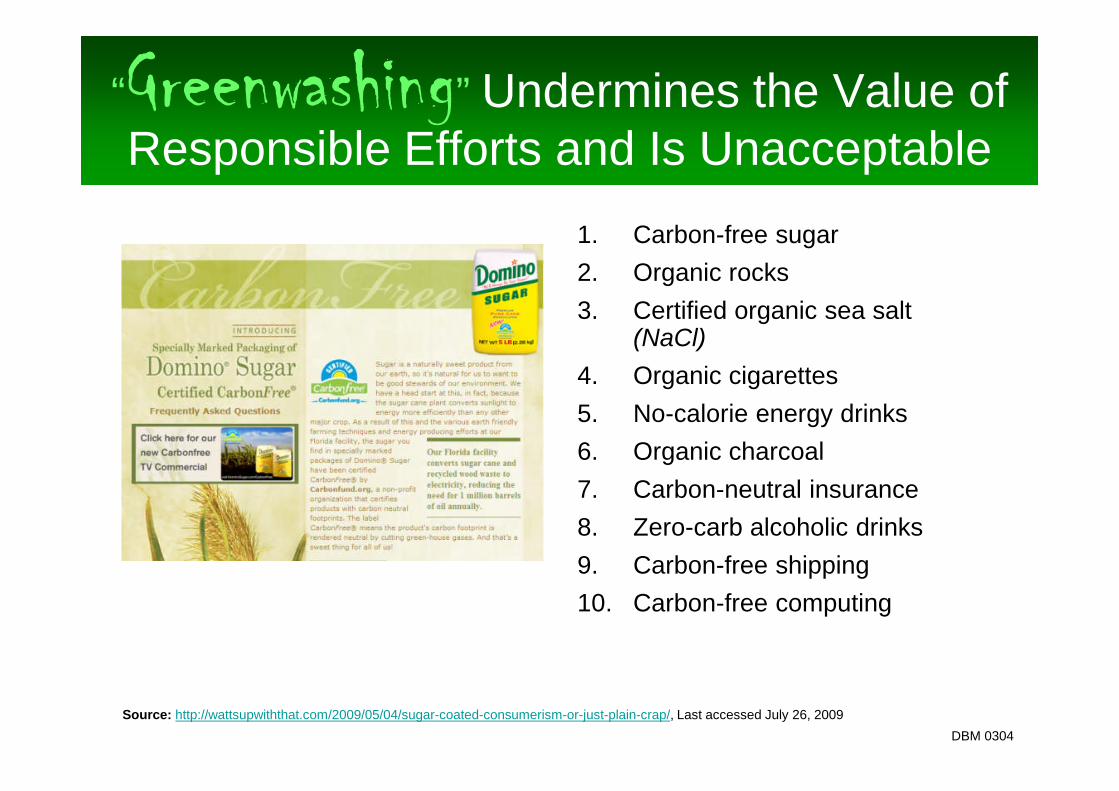
“Greenwashing” Undermines the Value ofResponsible Efforts and Is Unacceptable
1. Carbon-free sugar
2. Organic rocks
3. Certified organic sea salt(NaCl)
4. Organic cigarettes
5. No-calorie energy drinks
6. Organic charcoal
7. Carbon-neutral insurance
8. Zero-carb alcoholic drinks
9. Carbon-free shipping
10. Carbon-free computing
Source: http://wattsupwiththat.com/2009/05/04/sugar-coated-consumerism-or-just-plain-crap/, Last accessed July 26, 2009
DBM 0304
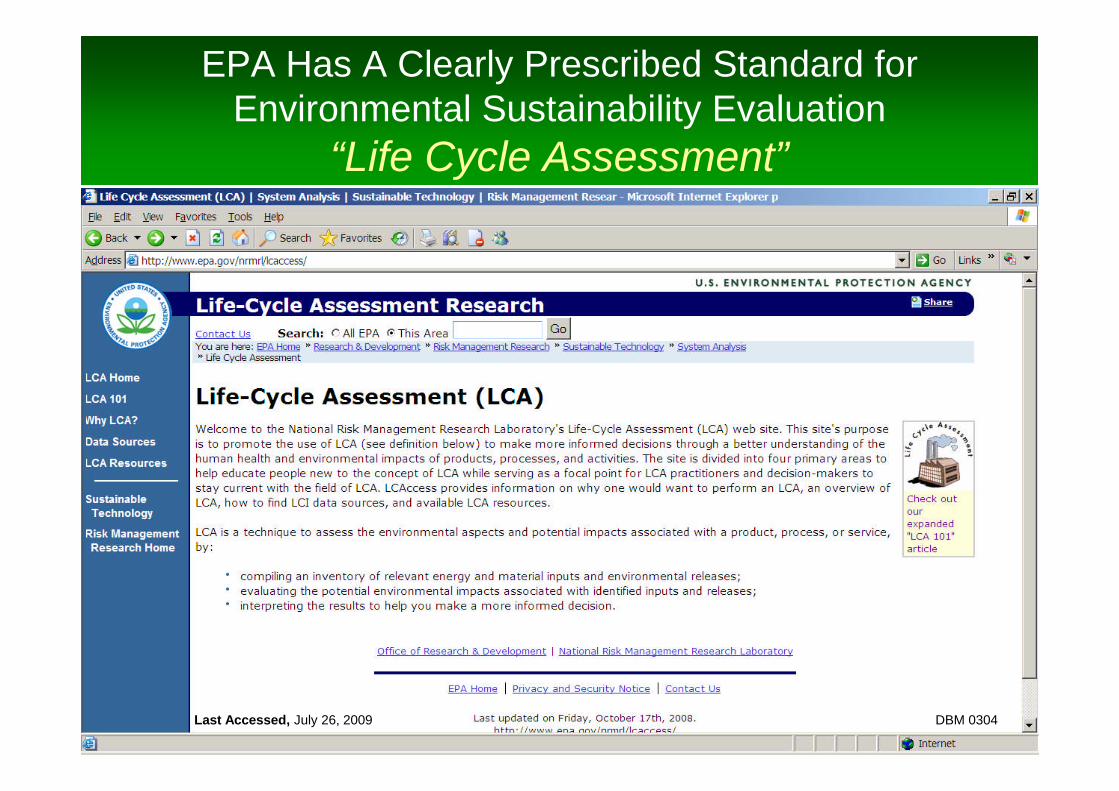
EPA Has A Clearly Prescribed Standard forEnvironmental Sustainability Evaluation
“Life Cycle Assessment”
Last Accessed, July 26, 2009 DBM 0304
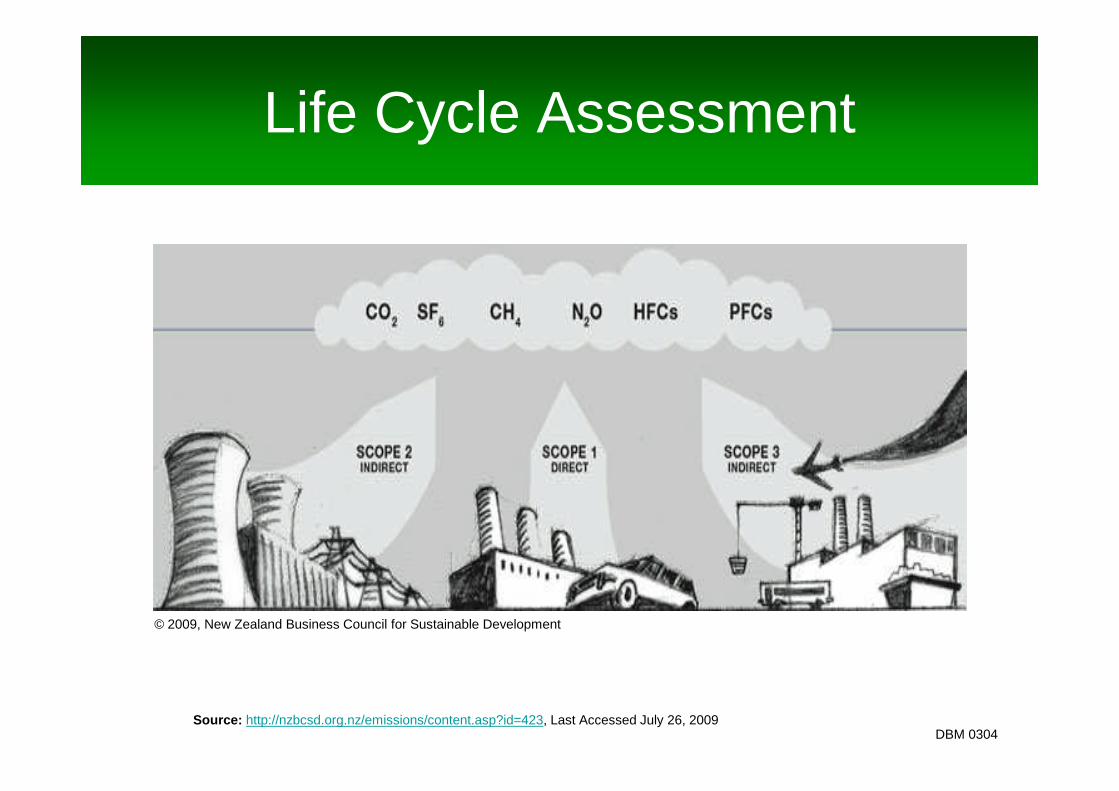
Life Cycle Assessment
Source: http://nzbcsd.org.nz/emissions/content.asp?id=423, Last Accessed July 26, 2009
© 2009, New Zealand Business Council for Sustainable Development
DBM 0304
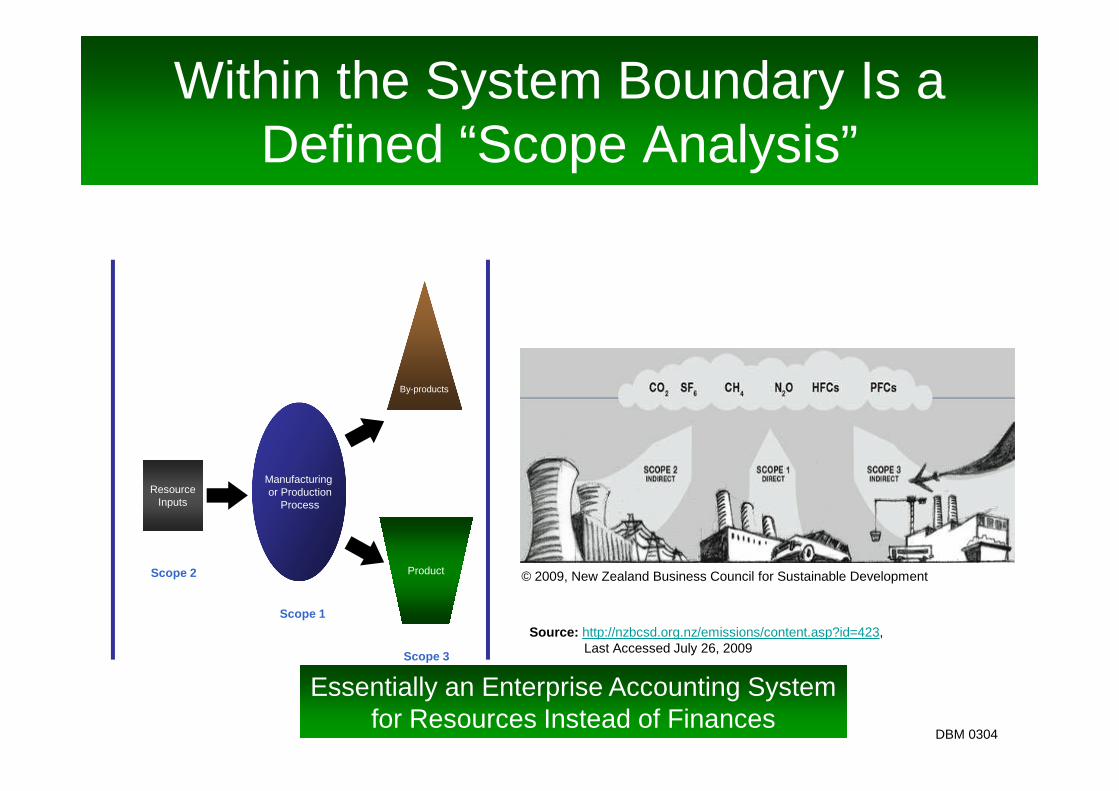
Within the System Boundary Is aDefined “Scope Analysis”
Manufacturingor Production
Process
ResourceInputs
By-products
ProductScope 2
Scope 1
Scope 3
Essentially an Enterprise Accounting Systemfor Resources Instead of Finances
© 2009, New Zealand Business Council for Sustainable Development
Source: http://nzbcsd.org.nz/emissions/content.asp?id=423,Last Accessed July 26, 2009
DBM 0304
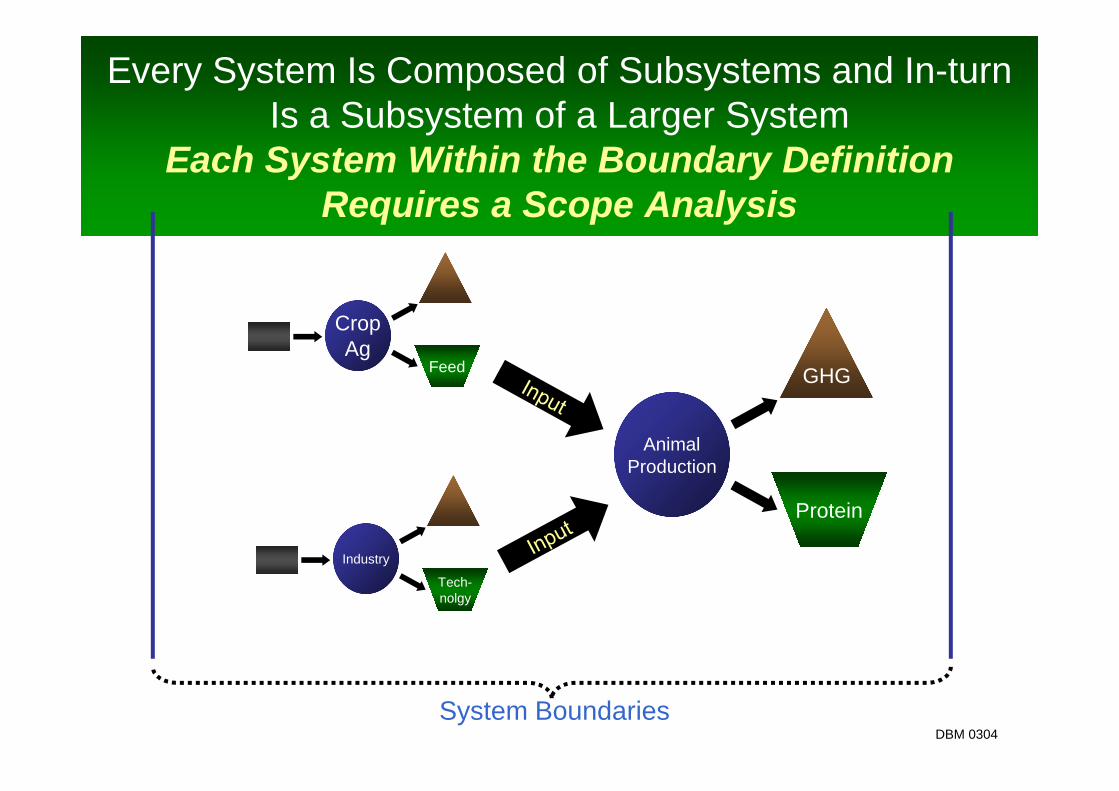
Every System Is Composed of Subsystems and In-turnIs a Subsystem of a Larger System
Each System Within the Boundary DefinitionRequires a Scope Analysis
CropAg
Feed
System Boundaries
Industry
Tech-nolgy
AnimalProduction
GHG
Protein
DBM 0304
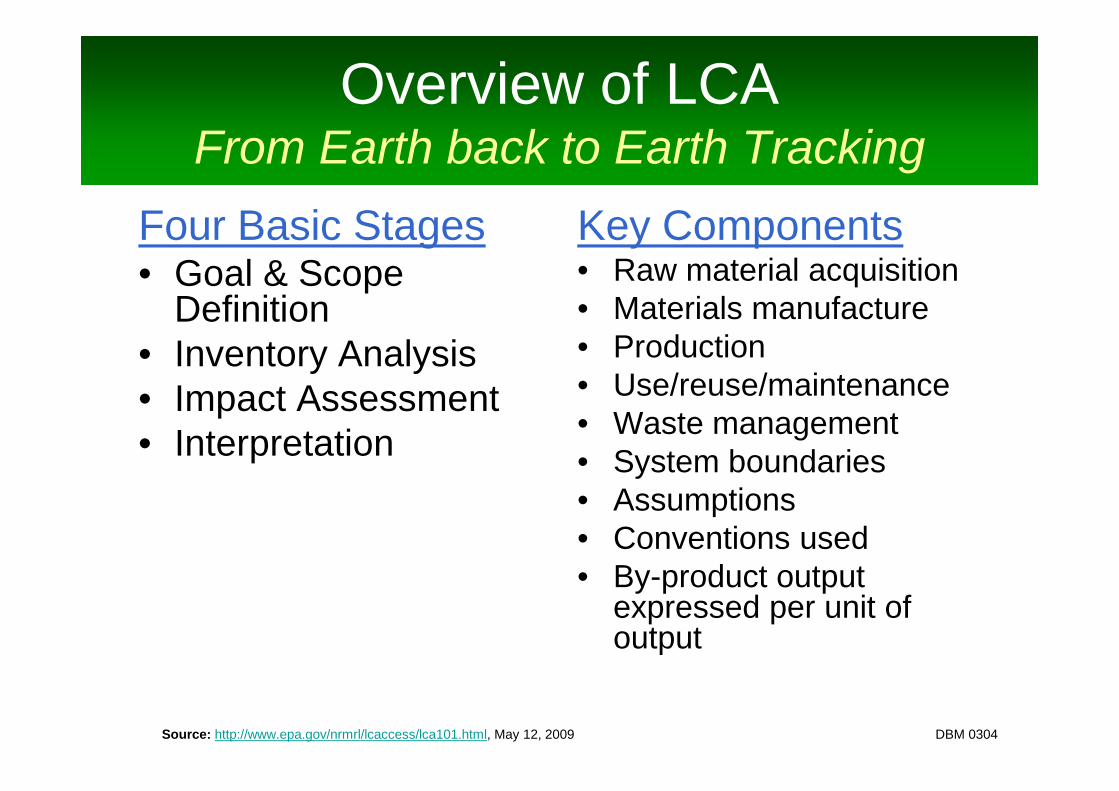
Overview of LCAFrom Earth back to Earth Tracking
Four Basic Stages• Goal & Scope
Definition• Inventory Analysis• Impact Assessment• Interpretation
Key Components• Raw material acquisition• Materials manufacture• Production• Use/reuse/maintenance• Waste management• System boundaries• Assumptions• Conventions used• By-product output
expressed per unit ofoutput
Source: http://www.epa.gov/nrmrl/lcaccess/lca101.html, May 12, 2009 DBM 0304

Essential to Assess Impact per Unit of Output Rather
Than per Unit of the Production Process
Vehicle 1 Vehicle 2Fuel Burned in 5 hrs: 70 gal 10 gal
Distance Traveled: 350 mi (5 mpg) 350 mi (35 mpg)Production
Process
Passengers: 50 4
People Miles: 17,500 1,400
People MPG: 250 140
Output
Winner
DBM 0304
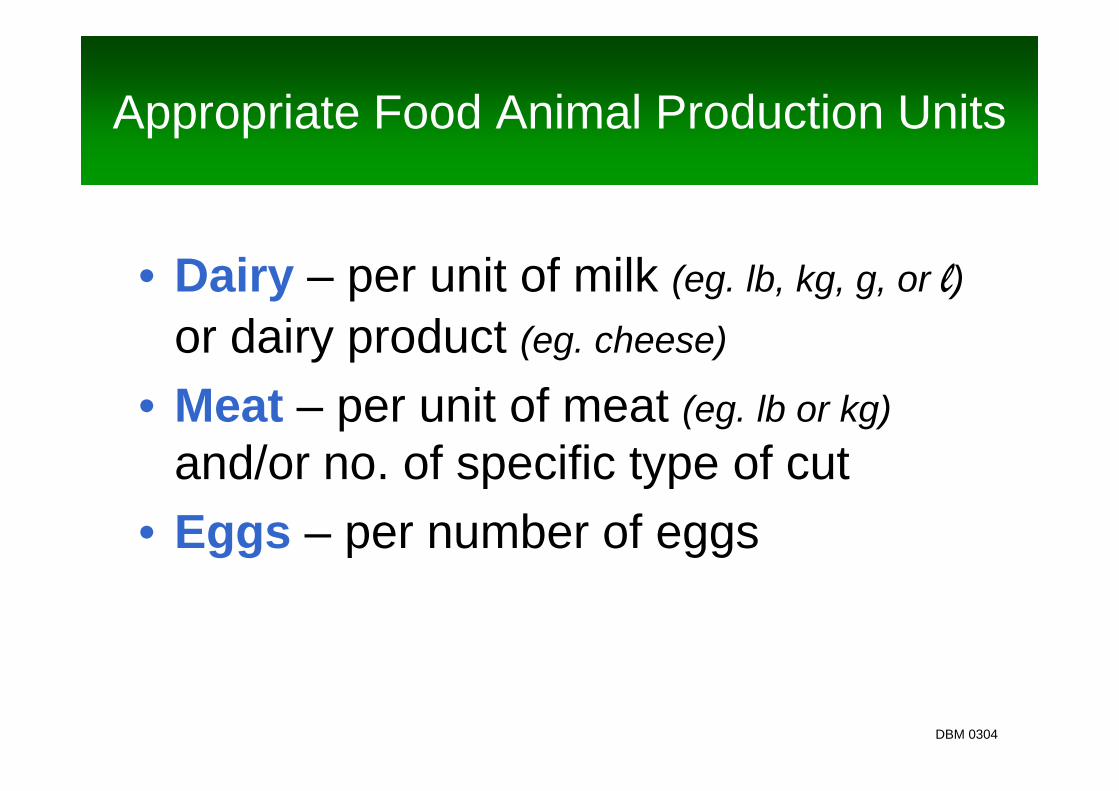
Appropriate Food Animal Production Units
• Dairy – per unit of milk (eg. lb, kg, g, or l)
or dairy product (eg. cheese)
• Meat – per unit of meat (eg. lb or kg)
and/or no. of specific type of cut
• Eggs – per number of eggs
DBM 0304

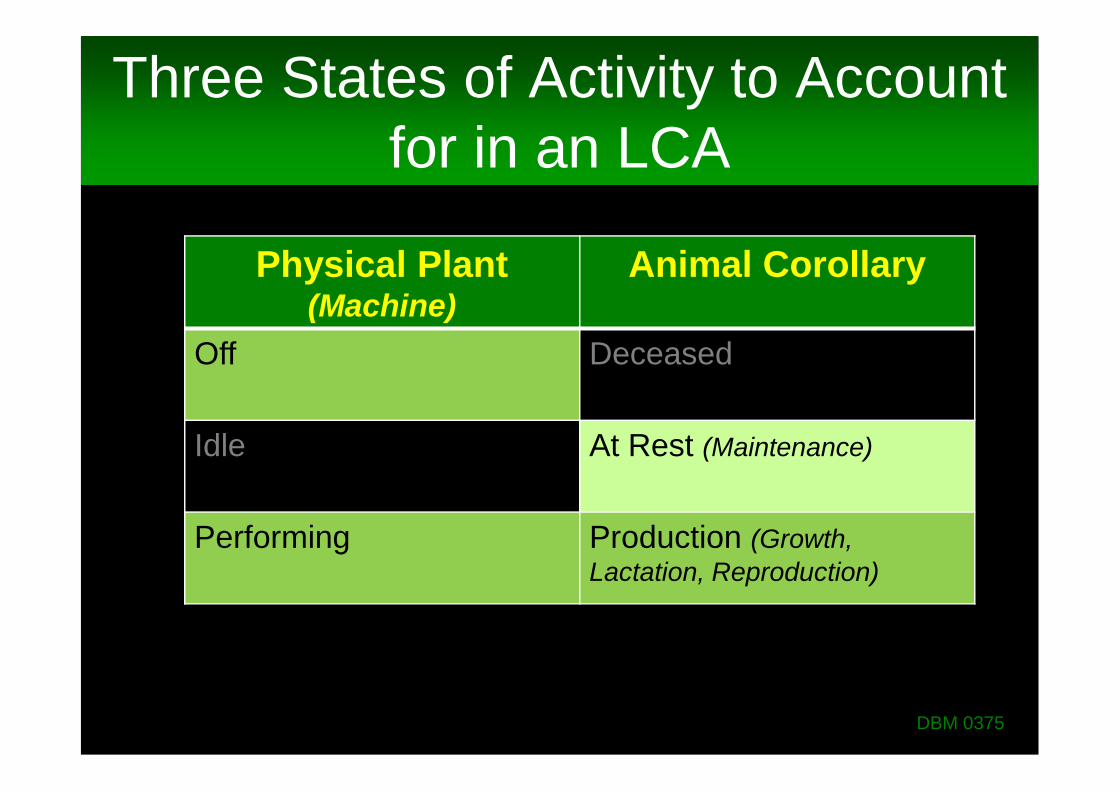
Three States of Activity to Accountfor in an LCA
Physical Plant(Machine)
Animal Corollary
Off Deceased
Idle At Rest (Maintenance)
Performing Production (Growth,Lactation, Reproduction)
DBM 0375
Three States of Activity to Accountfor in an LCA
Physical Plant(Machine)
Animal Corollary
Off Deceased
Idle At Rest (Maintenance)
Performing Production (Growth,Lactation, Reproduction)
DBM 0375

Scientific Efforts Have Focused onReducing Animal and Farm Emissions
Improve metabolic (feed)efficiency
Improve nutrition– Ration balancing
– Feeding management
Improve croppingpractices & technology
Improve manuremanagement– Storage
– Processing
– Application
DBM 0304

Productivity is Not a New Concept
“When the population of this countryincreases to 200,000,000 itshould be easily possible forthe additional supply of dairyproducts needed to beproduced not by more, but bybetter dairy cows….
The average milk production of UScows is about 4,500 pounds ayear. If this were increased at arate of 100 pounds a year, in 45years the average milkproduction per cow would bedoubled. The present numberof cows could then supplysufficient dairy products at thepresent rate of consumption forconsiderably more than200,000,000 people.“
J.C. McDowell, US Yearbook of Agriculture (1927)
19531927
DBM 0304

Animals are Not Cars: They Have a Maintenance CostDilution of Maintenance is a Key Consequence of Productivity
Adapted from Capper et al. (2008), PNAS
Milk yield (lb/d): 15 33 65
10.3
4.7
10.3
10.6
10.3
20.8
0
5
10
15
20
25
30
35
Dai
lyEn
erg
yR
eq
uir
em
en
t-M
EM
cal/
d
Maintenance Milk
Based on 1,435 lb/cow
51%
49%
0.63 Mcal/lb67%
33%
0.48 Mcal/lb
31%
69%
1.0 Mcal/lb
DBM 0304

1/8 of a Dry Cow
+
97% of a Heifer
Infrastructure Maintenance Must Also Be AssessedIt Takes a Herd to Make Milk
• Maintenance Feed
• Water– Intake
– Sanitation
• Greenhouse Gases(Carbon Footprint)
– CO2 - Carbon Dioxide
– CH4 - Methane
– N2O - Nitrous Oxide
• Land
• Manure
• Fuel
• Electricity
• Herbicides & Pesticides
Increases
DBM 0304
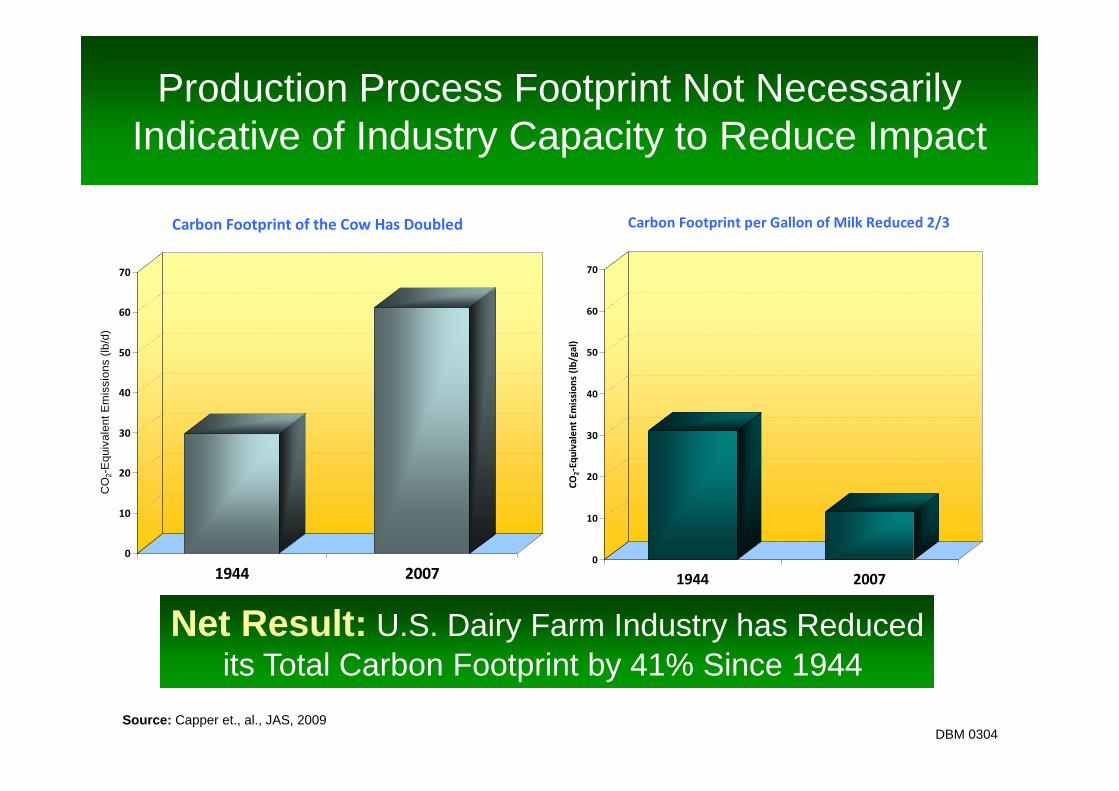
Production Process Footprint Not NecessarilyIndicative of Industry Capacity to Reduce Impact
0
10
20
30
40
50
60
70
CO
2-E
qu
iva
len
tE
mis
sio
ns
(lb
/d)
1944 2007
Carbon Footprint of the Cow Has Doubled
Source: Capper et., al., JAS, 2009
0
10
20
30
40
50
60
70
CO
2-E
qu
ival
en
tEm
issi
on
s(l
b/g
al)
1944 2007
Carbon Footprint per Gallon of Milk Reduced 2/3
Net Result: U.S. Dairy Farm Industry has Reducedits Total Carbon Footprint by 41% Since 1944
Net Result: U.S. Dairy Farm Industry has Reducedits Total Carbon Footprint by 41% Since 1944
DBM 0304
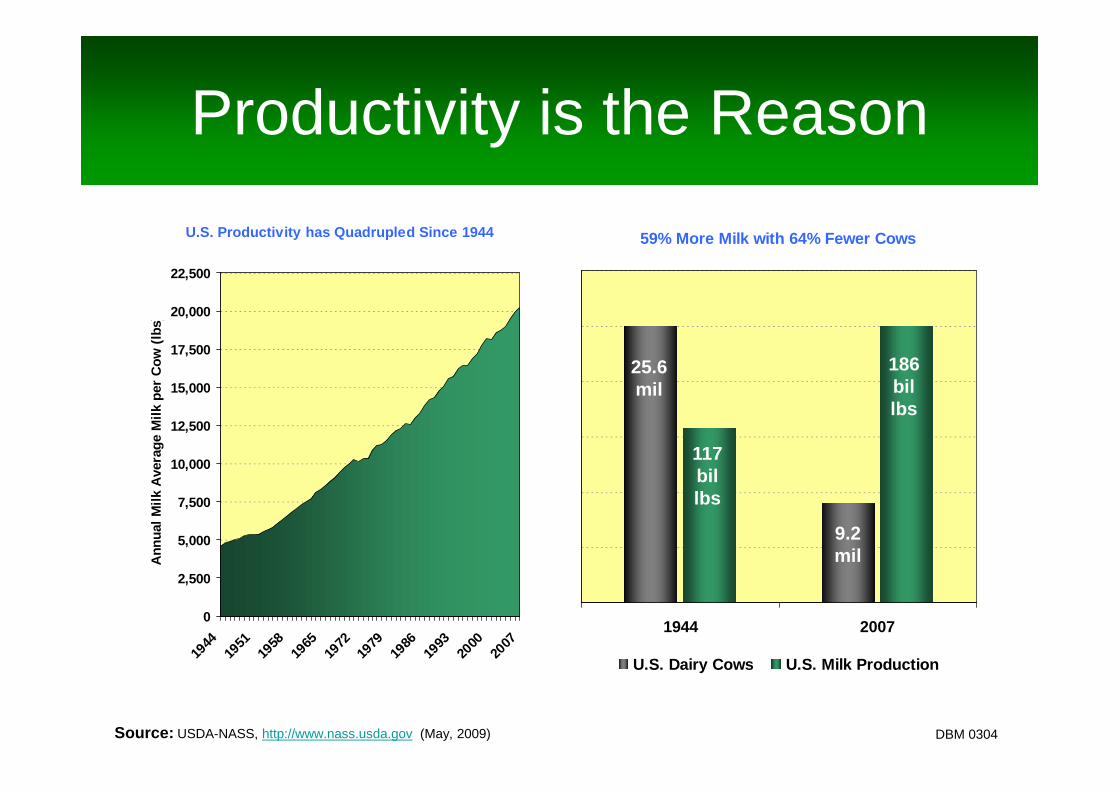
Productivity is the Reason
U.S. Productivity has Quadrupled Since 1944
0
2,500
5,000
7,500
10,000
12,500
15,000
17,500
20,000
22,500
1944
1951
1958
1965
1972
1979
1986
1993
2000
2007
An
nu
al
Mil
kA
vera
ge
Mil
kp
er
Co
w(l
bs)
59% More Milk with 64% Fewer Cows
1944 2007
U.S. Dairy Cows U.S. Milk Production
Source: USDA-NASS, http://www.nass.usda.gov (May, 2009)
25.6mil
9.2mil
117billbs
186billbs
DBM 0304
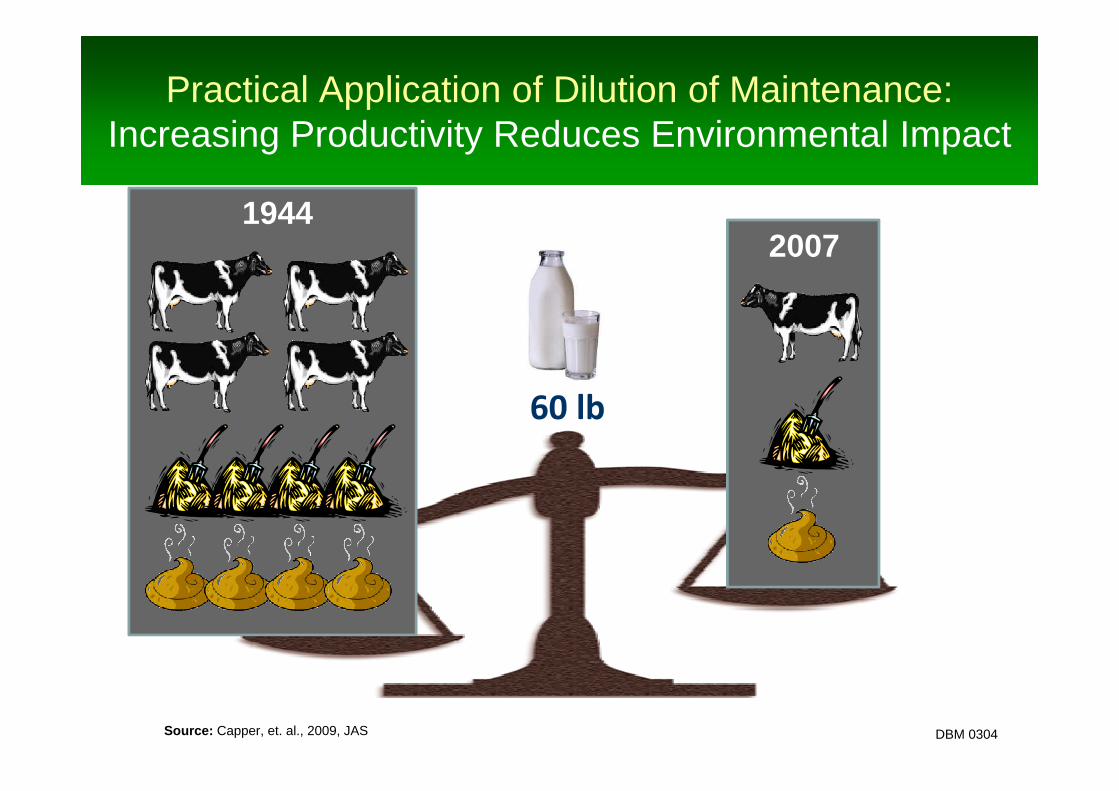
60 lb
20071944
Practical Application of Dilution of Maintenance:Increasing Productivity Reduces Environmental Impact
Source: Capper, et. al., 2009, JAS DBM 0304
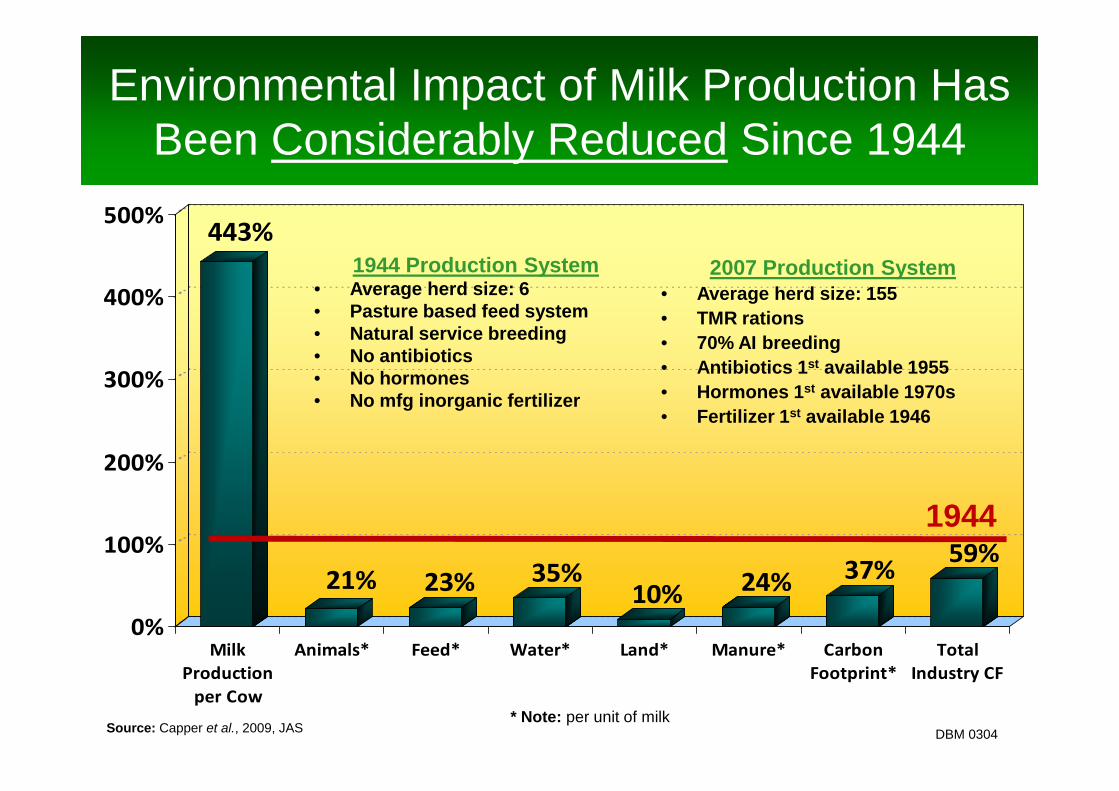
Environmental Impact of Milk Production HasBeen Considerably Reduced Since 1944
443%
21% 23% 35%10% 24% 37%
59%
0%
100%
200%
300%
400%
500%
MilkProduction
per Cow
Animals* Feed* Water* Land* Manure* CarbonFootprint*
TotalIndustry CF
Source: Capper et al., 2009, JAS
1944
1944 Production System• Average herd size: 6• Pasture based feed system• Natural service breeding• No antibiotics• No hormones• No mfg inorganic fertilizer
2007 Production System• Average herd size: 155
• TMR rations
• 70% AI breeding
• Antibiotics 1st available 1955
• Hormones 1st available 1970s
• Fertilizer 1st available 1946
* Note: per unit of milkDBM 0304
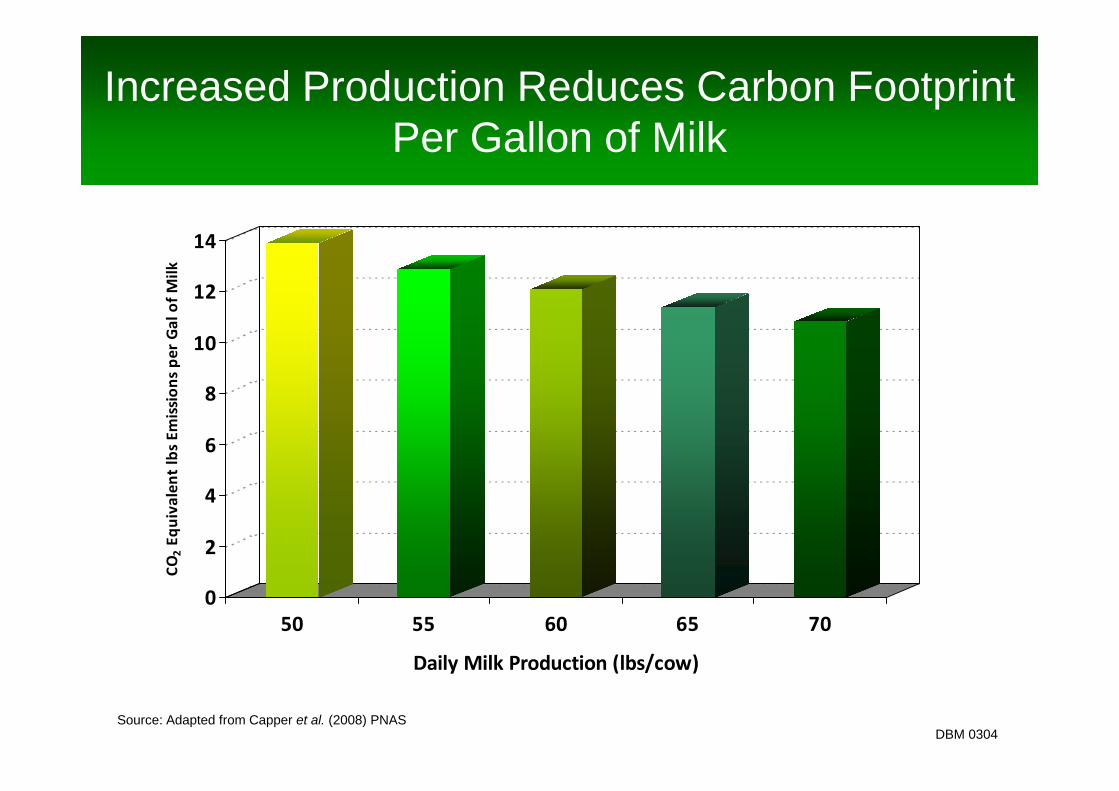
Increased Production Reduces Carbon FootprintPer Gallon of Milk
0
2
4
6
8
10
12
14
CO
2E
qu
iva
len
tlb
sEm
issi
on
sp
erG
alo
fM
ilk
50 55 60 65 70
Daily Milk Production (lbs/cow)
Source: Adapted from Capper et al. (2008) PNASDBM 0304

Dairy Cattle Milk Productivity Trends for4 Major World Milk Producing Regions
0
2,000
4,000
6,000
8,000
10,000
An
nu
alM
ilk
/Co
w(k
g)
Euro-6 NZ CAN US
* Euro-6 represents 2/3 of the cow’s milk produced in the EU in 2007Source: FAO(2009) http://faostat.fao.org/ Last accessed, 8/14/09
DBM 0375
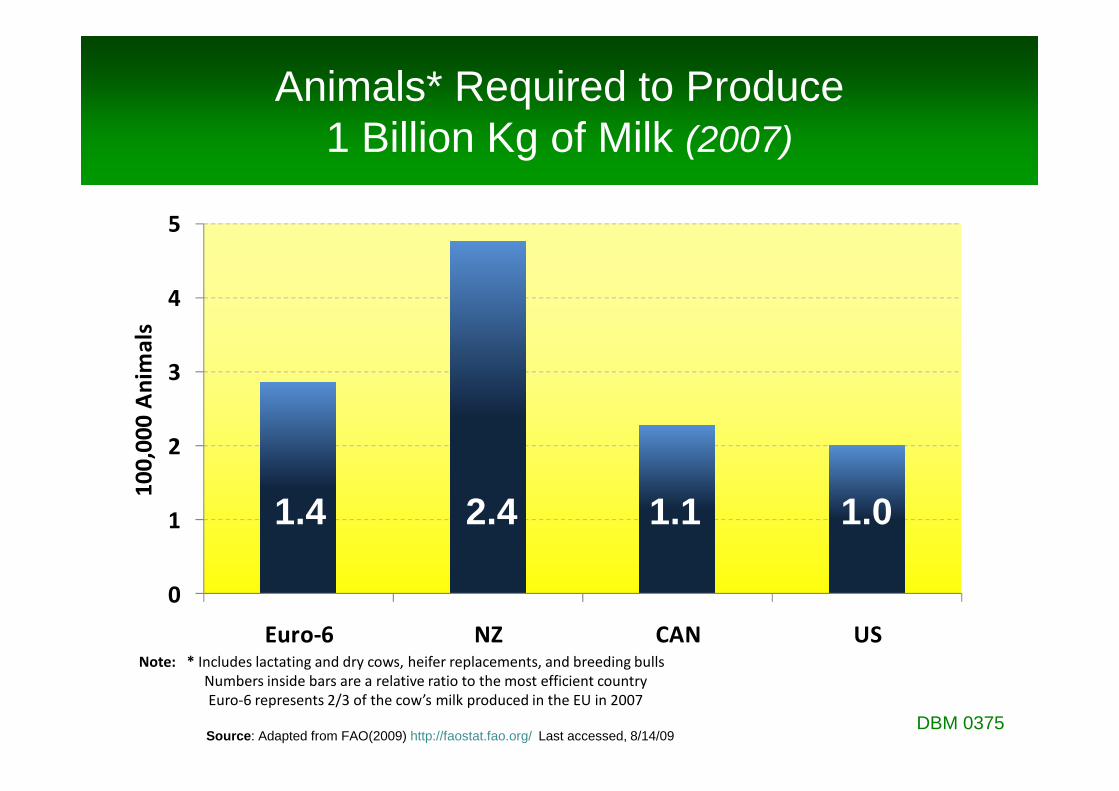
Animals* Required to Produce1 Billion Kg of Milk (2007)
0
1
2
3
4
5
Euro-6 NZ CAN US
10
0,0
00
An
ima
ls
1.01.11.4 2.4
Note: * Includes lactating and dry cows, heifer replacements, and breeding bullsNumbers inside bars are a relative ratio to the most efficient countryEuro-6 represents 2/3 of the cow’s milk produced in the EU in 2007
Source: Adapted from FAO(2009) http://faostat.fao.org/ Last accessed, 8/14/09DBM 0375
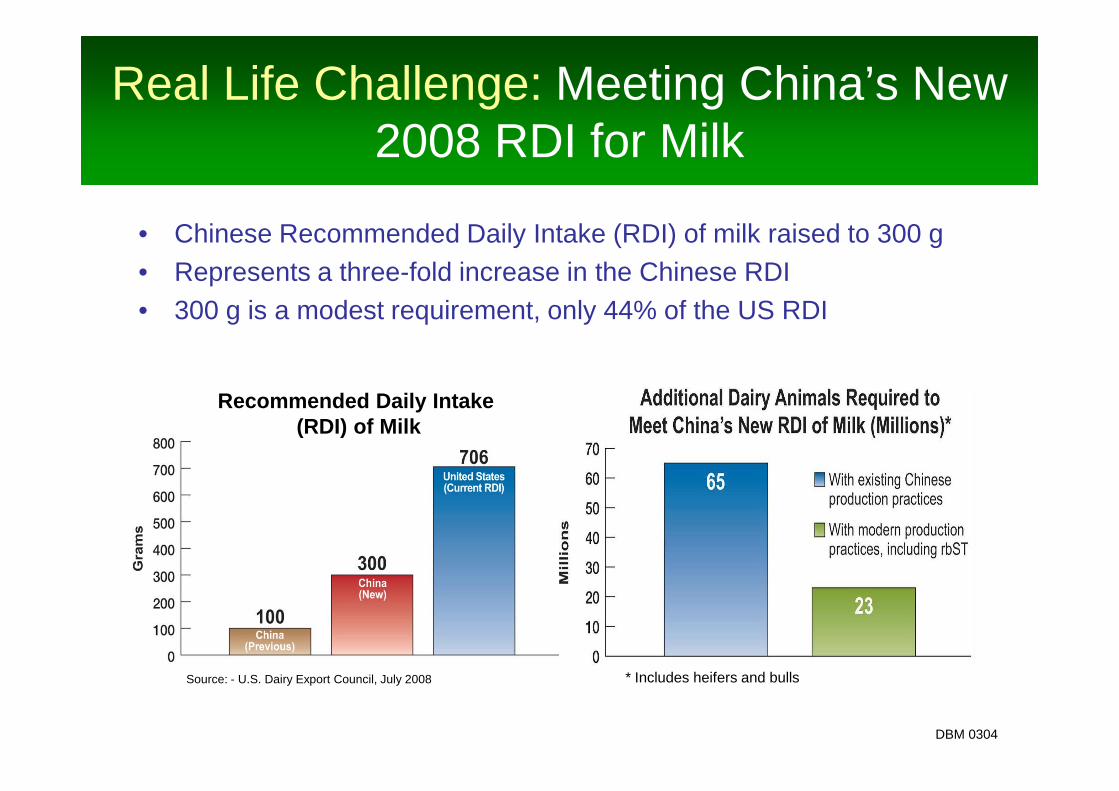
Real Life Challenge: Meeting China’s New2008 RDI for Milk
• Chinese Recommended Daily Intake (RDI) of milk raised to 300 g
• Represents a three-fold increase in the Chinese RDI
• 300 g is a modest requirement, only 44% of the US RDI
Source: - U.S. Dairy Export Council, July 2008
Recommended Daily Intake(RDI) of Milk
* Includes heifers and bulls
DBM 0304
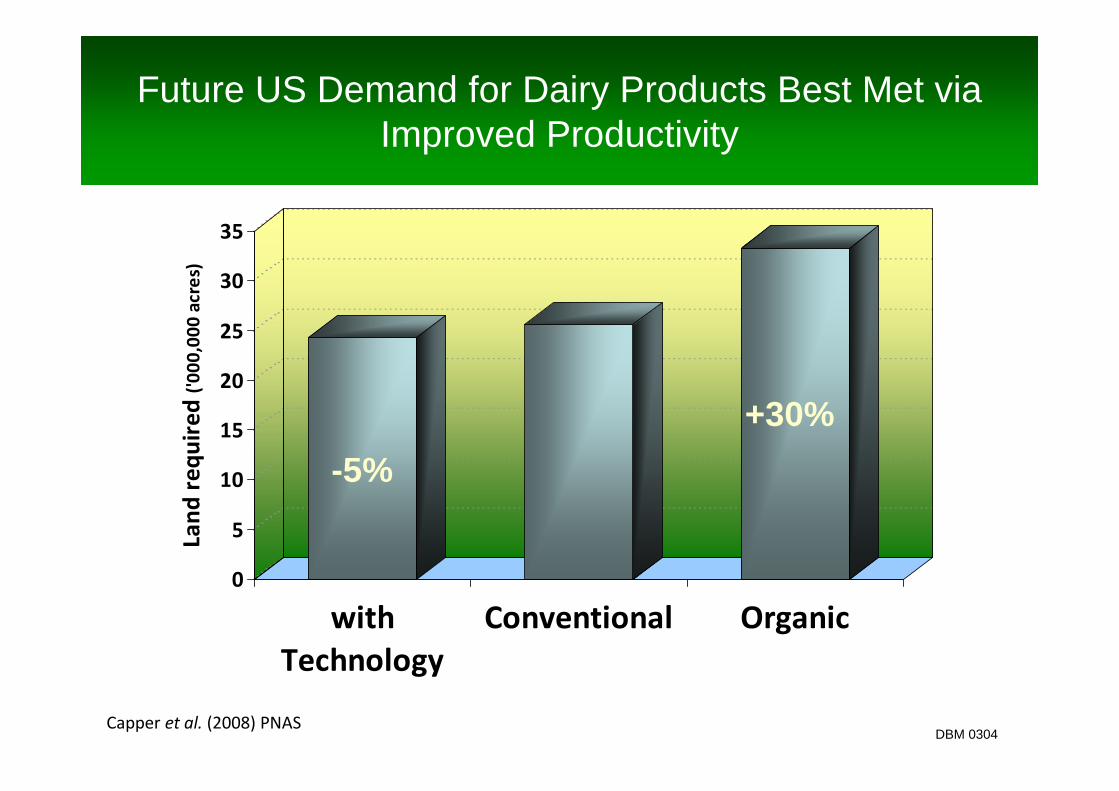
Future US Demand for Dairy Products Best Met viaImproved Productivity
0
5
10
15
20
25
30
35
Lan
dre
qu
ire
d('
00
0,0
00
acre
s)
withTechnology
Conventional Organic
-5%
+30%
Capper et al. (2008) PNASDBM 0304
Summary
Environmental stewardship is a critical responsibility offood animal agriculture
Science-based standards are in place for assessingenvironmental impacts
Essential to evaluate environmental impact per unit ofoutput rather than simply by unit of production
Productivity is an important contributing factor inreducing the food animal industry’s environmental impact
Essential need exists to understand and discuss the roleand environmental consequences of technology
DBM 0304

What Does This Represent?
DBM 0304

Thank you!
Questions?
DBM 0104