what is a carbon footprint? -...
TRANSCRIPT

Assessing the Carbon Footprint of Animal Agriculture
Dr. Jude Capper1, Dr. Roger A. Cady2,Dr. Dale Bauman3
1Washington State University, 2Elanco Animal Health, 3Cornell University
Prepared for: The Livestock & Poultry EnvironmentalLearning Center Webcast
July 31, 2009
DBM 0304
What is a Carbon Footprint?
Total GHG (greenhouse gas) emissions caused directly and indirectly by an individual, organization or state in a given time• Measured in CO2-equivalents in terms of environmental heat capturing capability
CO2 CH4
N2O
1 23 298
Source: http://ipcc-wg1.ucar.edu/wg1/Report/AR4WG1_Print_Ch02.pdf,Last accessed, July 26, 2009 DBM 0304
Sustainability is Not a Passing Fad
DBM 0304
Livestock and Poultry Environmental Learning Center Webcast SeriesSponsored by the: Air Quality Education in Animal Agriculture (AQEAA) project
July 31, 2009
Archived presentation available at:http://www.extension.org/pages/Carbon_Footprint_of_Animal_Agriculture_Webcast

…Consumers want to hear about sustainability, affordability, and efficiency—in that order
“In the United States, we need_______”.
More earth‐friendly dairy farming 23%
More affordable milk 21%
More efficient milk production methods 15%
More environmentally friendly milk production tools 15%
More innovation in dairy farming 8%
More sustainable milk 7%
More land available to grow other foods 6%
More land set aside for parks and recreational use 4%
©2009 Luntz Malansky Strategic ResearchDBM 0304
Retailers Are Responding and Accelerating the Movement
Excerpted from: Wall Street Journal, Oct. 9, 2007DBM 0304
Meat, Milk & Egg Production is Clearly Being Held Accountable
• Livestock production accounts for 18% of Greenhouse Gas emissions worldwide (UN/FAO, 2006)
• In the USA, contribution of Agriculture (in total) to GHG emissions is approximately 6% (EPA Report on GHG Emissions, 2008)
• Ability to discuss environmental benefits is critical for development of animal productivity products
DBM 0304
Livestock and Poultry Environmental Learning Center Webcast SeriesSponsored by the: Air Quality Education in Animal Agriculture (AQEAA) project
July 31, 2009
Archived presentation available at:http://www.extension.org/pages/Carbon_Footprint_of_Animal_Agriculture_Webcast

Vegetarian Society (2008) http://www.vegsoc.org, Last accessed, July 26, 2009
In Fact – Animal Ag is Under Attack
DBM 0304
48%
FAO (2006) Livestock’s Long Shadow
Deforestation contributes 48% to the FAO Estimate of Livestock Production Carbon Footprint
DBM 0304
Total U.S. AgriculturalAnnual Greenhouse Gas Output:
• 454.1 Teragrams• 6% of total US GHG
Note: 1 Teragram = 1 million metric tonnes
EPA (2008) Inventory of U.S. Greenhouse Gas Emissions and Sinks
Other cattle 1.3%
Dairy 0.7%
6% total
Animal Agriculture Contributes Less than 3% to the Total US Carbon Footprint
DBM 0304
Livestock and Poultry Environmental Learning Center Webcast SeriesSponsored by the: Air Quality Education in Animal Agriculture (AQEAA) project
July 31, 2009
Archived presentation available at:http://www.extension.org/pages/Carbon_Footprint_of_Animal_Agriculture_Webcast

Dairy Industry Response: Established an Industry-Wide Goal
25% Reduction of Greenhouse Gas Emissions from Fluid Milk by 2020– Equivalent to removing 1.25 million passenger
cars from the road annually– Committed to
• Sound science• Establishing an industry benchmark• Life Cycle Assessment
Source: http://www.environmentalleader.com/2009/04/14/dairy-industry-to-cut-milk-related-emissions-25-by-2020/,Last Accessed July 26, 2009 DBM 0304
“Greenwashing” Undermines the Value of Responsible Efforts and Is Unacceptable
1. Carbon-free sugar2. Organic rocks3. Certified organic sea salt
(NaCl)4. Organic cigarettes5. No-calorie energy drinks6. Organic charcoal7. Carbon-neutral insurance8. Zero-carb alcoholic drinks9. Carbon-free shipping10. Carbon-free computing
Source: http://wattsupwiththat.com/2009/05/04/sugar-coated-consumerism-or-just-plain-crap/, Last accessed July 26, 2009DBM 0304
The Real Challenge: Global Demand Requires More Food
Sources: Green, R. et al. January 2005. “Farming and the Fate of Wild Nature.” Science 307.5709: 550-555; and Tilman, D. et al. August 2002. “Agricultural sustainability and intensive production practices.” Nature 418.6898: 671-677.“World Agriculture: toward 2015/2030.” 2002. United Nations Food and Agriculture Organization, Rome. Accessed 12/8/08. <ftp://ftp.fao.org/docrep/fao/004/y3557e/y3557e.pdf
Technology’s Role in the 21st Century: Food Economics and Consumer
• Challenge to meet 100% increase in global food demands in 50 next years
• The global food industry needs technology
• Consumers need choice• The food production system can
mitigate the food economics challenge and achieve an “ultimate win.”
• Requires the continued use of safe and efficacious technology and close collaboration across the entire global food chain.
DBM 0304
Livestock and Poultry Environmental Learning Center Webcast SeriesSponsored by the: Air Quality Education in Animal Agriculture (AQEAA) project
July 31, 2009
Archived presentation available at:http://www.extension.org/pages/Carbon_Footprint_of_Animal_Agriculture_Webcast
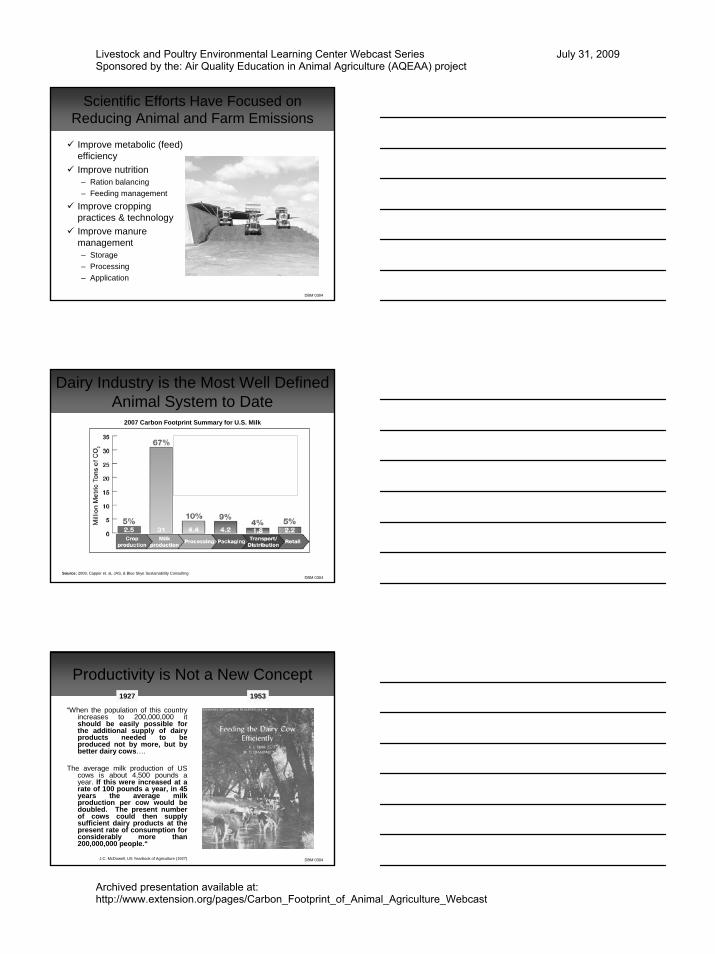
Scientific Efforts Have Focused on Reducing Animal and Farm Emissions
Improve metabolic (feed) efficiencyImprove nutrition– Ration balancing– Feeding management
Improve cropping practices & technologyImprove manure management– Storage– Processing– Application
DBM 0304
2007 Carbon Footprint Summary for U.S. Milk
Source: 2009, Capper et. al, JAS, & Blue Skye Sustainability Consulting
Dairy Industry is the Most Well Defined Animal System to Date
DBM 0304
Productivity is Not a New Concept
“When the population of this country increases to 200,000,000 it should be easily possible for the additional supply of dairy products needed to be produced not by more, but by better dairy cows….
The average milk production of US cows is about 4,500 pounds a year. If this were increased at a rate of 100 pounds a year, in 45 years the average milk production per cow would be doubled. The present number of cows could then supply sufficient dairy products at the present rate of consumption for considerably more than 200,000,000 people.“
J.C. McDowell, US Yearbook of Agriculture (1927)
19531927
DBM 0304
Livestock and Poultry Environmental Learning Center Webcast SeriesSponsored by the: Air Quality Education in Animal Agriculture (AQEAA) project
July 31, 2009
Archived presentation available at:http://www.extension.org/pages/Carbon_Footprint_of_Animal_Agriculture_Webcast

EPA Has A Clearly Prescribed Standard for Environmental Sustainability Evaluation
“Life Cycle Assessment”
Last Accessed, July 26, 2009 DBM 0304
Life Cycle Assessment
Source: http://nzbcsd.org.nz/emissions/content.asp?id=423, Last Accessed July 26, 2009
© 2009, New Zealand Business Council for Sustainable Development
DBM 0304
Within the System Boundary Is a Defined “Scope Analysis”
Manufacturingor Production
ProcessResource
Inputs
By-products
ProductScope 2
Scope 1
Scope 3
Essentially an Enterprise Accounting Systemfor Resources Instead of Finances
© 2009, New Zealand Business Council for Sustainable Development
Source: http://nzbcsd.org.nz/emissions/content.asp?id=423, Last Accessed July 26, 2009
DBM 0304
Livestock and Poultry Environmental Learning Center Webcast SeriesSponsored by the: Air Quality Education in Animal Agriculture (AQEAA) project
July 31, 2009
Archived presentation available at:http://www.extension.org/pages/Carbon_Footprint_of_Animal_Agriculture_Webcast

Every System Is Composed of Subsystems and In-turn Is a Subsystem of a Larger System
Each System Within the Boundary Definition Requires a Scope Analysis
CropAg
Feed
System Boundaries
Industry
Tech-nolgy
AnimalProduction
GHG
Protein
Input
Input
DBM 0304
Overview of LCAFrom Earth back to Earth Tracking
Four Basic Stages• Goal & Scope
Definition• Inventory Analysis• Impact Assessment• Interpretation
Key Components• Raw material acquisition• Materials manufacture• Production• Use/reuse/maintenance • Waste management• System boundaries• Assumptions• Conventions used• By-product output
expressed per unit of output
Source: http://www.epa.gov/nrmrl/lcaccess/lca101.html, May 12, 2009 DBM 0304
Essential to Assess Impact per Unit of Output Rather Than per Unit of the Production Process
Vehicle 1 Vehicle 2Fuel Burned in 5 hrs: 70 gal 10 galDistance Traveled: 350 mi (5 mpg) 350 mi (35 mpg)
ProductionProcess
Passengers: 50 4People Miles: 17,500 1,400People MPG: 250 140
Output
Winner
DBM 0304
Livestock and Poultry Environmental Learning Center Webcast SeriesSponsored by the: Air Quality Education in Animal Agriculture (AQEAA) project
July 31, 2009
Archived presentation available at:http://www.extension.org/pages/Carbon_Footprint_of_Animal_Agriculture_Webcast

Appropriate Food Animal Production Units
• Dairy – per unit of milk (eg. lb, kg, g, or l)or dairy product (eg. cheese)
• Meat – per unit of meat (eg. lb or kg)and/or no. of specific type of cut
• Eggs – per number of eggs
DBM 0304
Animals are Not Cars: They Have a Maintenance CostDilution of Maintenance is a Key Consequence of Productivity
Adapted from Capper et al. (2008), PNAS
Milk yield (lb/d): 15 33 65
10.3
4.7
10.3
10.6
10.3
20.8
0
5
10
15
20
25
30
35
Daily Ene
rgy Re
quirem
ent ‐ME Mcal/d
Maintenance Milk
Based on 1,435 lb/cow
51%
49%
0.63 Mcal/lb67%
33%
0.48 Mcal/lb
31%
69%
1.0 Mcal/lb
DBM 0304
1/8 of a Dry Cow
+
97% of a Heifer
Infrastructure Maintenance Must Also Be AssessedIt Takes a Herd to Make Milk
• Maintenance Feed• Water
– Intake– Sanitation
• Greenhouse Gases (Carbon Footprint)– CO2 - Carbon Dioxide– CH4 - Methane– N2O - Nitrous Oxide
• Land• Manure • Fuel• Electricity• Herbicides & Pesticides
Increases
DBM 0304
Livestock and Poultry Environmental Learning Center Webcast SeriesSponsored by the: Air Quality Education in Animal Agriculture (AQEAA) project
July 31, 2009
Archived presentation available at:http://www.extension.org/pages/Carbon_Footprint_of_Animal_Agriculture_Webcast

Production Process Footprint Not Necessarily Indicative of Industry Capacity to Reduce Impact
0
10
20
30
40
50
60
70
CO
2-E
quiv
alen
t Em
issi
ons
(lb/d
)
1944 2007
Carbon Footprint of the Cow Has Doubled
Source: Capper et., al., JAS, 2009
0
10
20
30
40
50
60
70
CO2‐Equivalent Emission
s (lb
/gal)
1944 2007
Carbon Footprint per Gallon of Milk Reduced 2/3
Net Result: U.S. Dairy Farm Industry has Reducedits Total Carbon Footprint by 41% Since 1944
DBM 0304
Productivity is the ReasonU.S. Productivity has Quadrupled Since 1944
0
2,500
5,000
7,500
10,000
12,500
15,000
17,500
20,000
22,500
1944
1951
1958
1965
1972
1979
1986
1993
2000
2007
Ann
ual M
ilk A
vera
ge M
ilk p
er C
ow (l
bs
59% More Milk with 64% Fewer Cows
1944 2007
U.S. Dairy Cows U.S. Milk Production
Source: USDA-NASS, http://www.nass.usda.gov (May, 2009)
25.6mil
9.2mil
117billbs
186billbs
DBM 0304
60 lb
20071944
Practical Application of Dilution of Maintenance:Increasing Productivity Reduces Environmental Impact
Source: Capper, et. al., 2009, JAS DBM 0304
Livestock and Poultry Environmental Learning Center Webcast SeriesSponsored by the: Air Quality Education in Animal Agriculture (AQEAA) project
July 31, 2009
Archived presentation available at:http://www.extension.org/pages/Carbon_Footprint_of_Animal_Agriculture_Webcast

Environmental Impact of Milk Production Has Been Considerably Reduced Since 1944
443%
21% 23% 35%10% 24% 37% 59%
0%
100%
200%
300%
400%
500%
MilkProductionper Cow
Animals* Feed* Water* Land* Manure* CarbonFootprint*
TotalIndustry CF
Source: Capper et al., 2009, JAS
1944
1944 Production System• Average herd size: 6• Pasture based feed system• Natural service breeding• No antibiotics• No hormones• No mfg inorganic fertilizer
2007 Production System• Average herd size: 155• TMR rations• 70% AI breeding• Antibiotics 1st available 1955• Hormones 1st available 1970s• Fertilizer 1st available 1946
* Note: per unit of milkDBM 0304
Increased Production Reduces Carbon Footprint Per Gallon of Milk
0
2
4
6
8
10
12
14
CO2 Eq
uivalent lb
s Em
ission
s pe
r Gal of M
ilk
50 55 60 65 70
Daily Milk Production (lbs/cow)
Source: Adapted from Capper et al. (2008) PNASDBM 0304
Key Components of 2008 Cornell rbST Impact Study
• LCA evaluation• Impact assessed on industry-scale dairy production system (population)
basis• All animal diets, intakes and metabolism based on NRC2001 nutrient
requirements – Includes heifers, milking cows, dry cows and bulls
• Resource and output data sourced from peer-reviewed scientific publications and government reports
– No undocumented assumptions– USDA milk and crop yields– USDA crop production inputs
• Scopes included: animals, cropping, manure, fertilizer and fossil fuels as sources of GHGs and nutrient flows
• rbST manufacturing impact acknowledged
Source: Capper, et. al., PNAS, June 2008DBM 0304
Livestock and Poultry Environmental Learning Center Webcast SeriesSponsored by the: Air Quality Education in Animal Agriculture (AQEAA) project
July 31, 2009
Archived presentation available at:http://www.extension.org/pages/Carbon_Footprint_of_Animal_Agriculture_Webcast

rbST Has a Positive Environmental Impact Because of More Milk per Cow
• Avg. daily response is 10 lbs (1.2 gal) during supplementation*
• In a typical year, that is 2,380 lbs (287 gal)
• Higher producing cows fewer cows needed to
meet milk demand• Fewer cows means
– fewer resources used (land, labor, energy)
– less manure and waste produced
Typical Lactation Production Curve and rbST Response (500 mg Every 2 Weeks)
30
40
50
60
70
80
90
100
6 36 66 96 126 156 186
216
246
276 306 336
366
Days Since Calving (Days in Milk)
Dai
ly M
ilk (l
bs)
No Supplementation with Supplemental bST
Source: Hartnell, et. al. , 1991, J. Dairy Sci.
DBM 0304*Elanco Ref ID1763.
Example of a Product Impact Analysis: rbST Subsystem Scope Analysis
Posilac Systems Boundary
• Emissions embodied in raw materials and packaging • Delivery of raw materials and packaging
• Energy • Process emissions • Waste
• Distribution of Posilac
• Distribution of waste
• Incinerated syringe waste
• Landfilled packaging waste
Materials Manufacture Distribute Waste
Source: Camco, 2009DBM 0304
Annual Environmental Implications of rbST for Producing 1 Billion lbs Cheese
(10 Billion lbs of Milk)
96,600 animal impact (52,800 cows, 43,800 heifers)
721,000 fewer tons of feed156,000 fewer acres cropland (244 sq mi)Saves enough• fuel to heat 4,500 households• electricity to power 3,600 households• water to supply 2,700 households
874,000 fewer tons of manure producedReduces carbon footprint by 532,000 metric tonnes • Removing 112,000 cars from the road• Planting 83.5 million trees
Adapted from Capper et. al., (2008), PNASDBM 0304
Livestock and Poultry Environmental Learning Center Webcast SeriesSponsored by the: Air Quality Education in Animal Agriculture (AQEAA) project
July 31, 2009
Archived presentation available at:http://www.extension.org/pages/Carbon_Footprint_of_Animal_Agriculture_Webcast

Real Life Challenge: Meeting China’s New 2008 RDI for Milk
• Chinese Recommended Daily Intake (RDI) of milk raised to 300 g• Represents a three-fold increase in the Chinese RDI• 300 g is a modest requirement, only 44% of the US RDI
Source: - U.S. Dairy Export Council, July 2008
Recommended Daily Intake(RDI) of Milk
* Includes heifers and bulls
DBM 0304
Future US Demand for Dairy Products Best Met via Improved Productivity
0
5
10
15
20
25
30
35
Land
req
uired ('0
00,000
acres)
withTechnology
Conventional Organic
-5%+30%
Capper et al. (2008) PNASDBM 0304
Summary
Environmental stewardship is a critical responsibility of food animal agricultureScience-based standards are in place for assessing environmental impactsEssential to evaluate environmental impact per unit of output rather than simply by unit of productionProductivity is an important contributing factor in reducing the food animal industry’s environmental impactEssential need exists to understand and discuss the role and environmental consequences of technology
DBM 0304
Livestock and Poultry Environmental Learning Center Webcast SeriesSponsored by the: Air Quality Education in Animal Agriculture (AQEAA) project
July 31, 2009
Archived presentation available at:http://www.extension.org/pages/Carbon_Footprint_of_Animal_Agriculture_Webcast

What Does This Represent?
DBM 0304
Thank you!
Questions?
DBM 0104
Supplement lactating dairy cows every 14 days beginning at 57-70 days in milk until the end of lactation. When calculating net carbon footprint, manufacturing processes and total environmental costs must be considered. The label contains complete use information, including cautions and warnings. Always read, understand, and follow the label and use directions.
POSILAC® is a trademark of Elanco’s brand of recombinant bovine somatotropin. ©2009 Elanco. DBM 0304
Livestock and Poultry Environmental Learning Center Webcast SeriesSponsored by the: Air Quality Education in Animal Agriculture (AQEAA) project
July 31, 2009
Archived presentation available at:http://www.extension.org/pages/Carbon_Footprint_of_Animal_Agriculture_Webcast