asia pacific: conglomerates - · pdf filestock picks by themes, stress test on valuation and...
TRANSCRIPT
July 27, 2011
Asia Pacific: Conglomerates
Equity Research
Stock picks by themes, stress test on valuation and results preview
Top ideas: Buy Hutch, Wharf and COSCO Pacific; Sell Jardine
Market sell-down on macro concerns has given back much of the price gain
in 1Q, with HK/China conglomerates trading sideways or down ytd. While
their valuations look attractive, our stress test suggests an average
downside of 18% if macro deteriorates and the stocks de-rate to one-
standard deviation below mid-cycle valuation. This said, risk-reward looks
favorable for selective stocks, e.g., COSCO, HPHT and Shanghai Industrial,
in our view. We also see buying opportunities for those that benefit from
sector themes and offer potential surprises in upcoming results.
Investment themes and rating changes
(1) Prefer exposure to Bohai region, and container over bulk ports - Given
the fragility of macro recovery and retailers’ cautious stance as reflected by
their lean inventory levels, shorter restocking cycles would translate to
more volatile trading data in coming months, in our view. We prefer ports
in Bohai Rim which are more leveraged to fast-growing domestic and intra-
Asia trades. We also prefer container over bulk ports for their better
demand and supply outlook. We downgrade Dalian Port from Buy to
Neutral, as we believe slower-than-expected oil throughput growth ytd
could present downside risk to its earnings. We recommend investors
switch to COSCO.
(2) HK rental upcycle to continue and appreciation in capital value – We
expect the cap rate to remain low, as (1) its spread over long-term rates
has been 2-3%, inline with historical avg; (2) our ECS team believes the US
will not raise the Fed rate until at least end-2013. In the meantime, hiring
expectations, though moderate slightly, remain strong. Coupled with a lack
of new supply, we expect HK’s rental upcycle to continue and forecast 25%
office and 10-15% retail rental growth in 2011. We downgrade MTRC from
Buy to Neutral on concerns over policy risk, and upgrade Wharf from
Neutral to Buy, as the stock has underperformed MSCI HK Index by 4%ytd
despite robust rental growth. We expect market to react positively if Wharf
confirms its 2011 property sale target at its interim results in August, and
see significant upside risk to consensus estimates in 2012-13.
(3) Acquisition opportunities for cash-rich conglomerates – Less revenue
from land sales as developers turn more cautious on their replenishment
plans would prompt local government to seek other ways to reduce their
debt burden, which may create acquisition opportunities for cash-rich
companies, e.g. Shanghai Industrial or CRE.
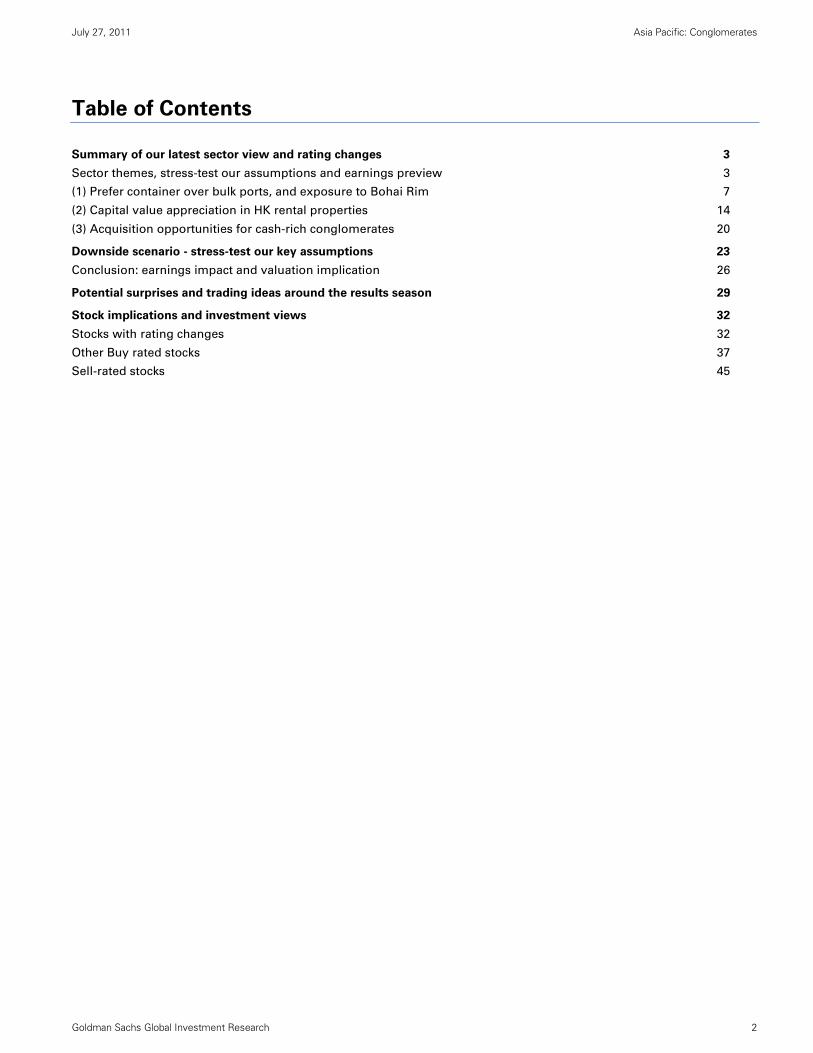
SUMMARY OF RATING AND TP CHANGES
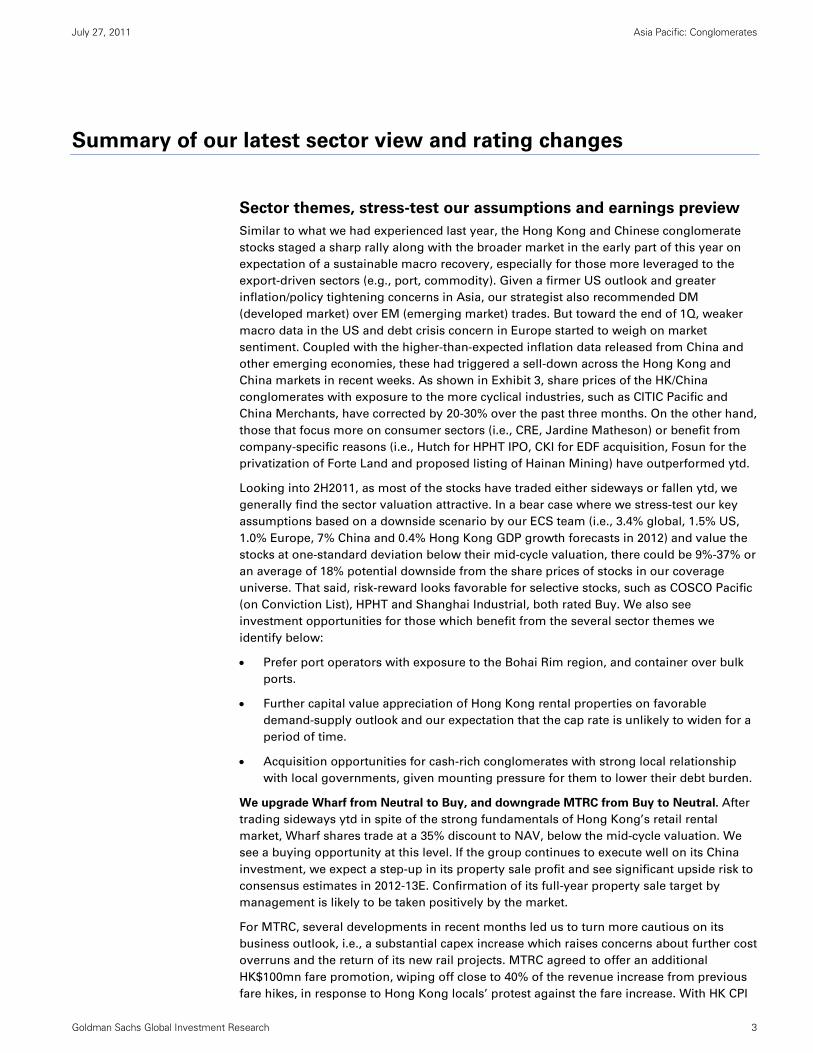
UPSIDE/DOWNSIDE IMPLIED BY TARGET PRICES IN
BASE AND BEAR CASE SCENARIO
Source: Bloomberg, Goldman Sachs Research estimates.
RELATED RESEARCH
Asia Pacific: Conglomerates: Key takeaways from
Conglomerate and Gaming Corporate Day, July 12, 2011
Simon Cheung, CFA +852-2978-6102 [email protected] Goldman Sachs (Asia) L.L.C.
Goldman Sachs does and seeks to do business with companies covered in its research reports. As a result, investors should be aware that the firm may have a conflict of interest that could affect the objectivity of this report. Investors should consider this report as only a single factor in making their investment decision. For Reg AC see the end of the text. For other important disclosures, see the Disclosure Appendix, or go to www.gs.com/research/hedge.html. Analysts employed by non-US affiliates are not registered/qualified as research analysts with FINRA in the U.S.
Frank He +852-2978-7414 [email protected] Goldman Sachs (Asia) L.L.C. Janet Lu +852-2978-1642 [email protected] Goldman Sachs (Asia) L.L.C. Alan Tang +852-2978-2343 [email protected] Goldman Sachs (Asia) L.L.C.
The Goldman Sachs Group, Inc. Global Investment Research
ImpliedPrice +/-%
CCY 25-Jul New Old New OldHong KongHutchison Whampoa HKD 88.7 Buy Buy 108.0 108.0 22%
Swire Pacific (A) HKD 109.9 Buy Buy 140.6 142.5 28%
Wharf Holdings HKD 56.2 Buy Neutral 69.0 59.2 23%
HPH Trust USD 0.8 Buy Buy 1.06 1.06 34%
MTRC HKD 27.0 Neutral Buy 31.6 36.1 17%
Cheung Kong Hldgs HKD 115.8 Neutral Neutral 137.5 146.6 19%
CKI HKD 42.0 Neutral Neutral 45.1 45.1 8%
Wheelock & Co. HKD 32.6 Neutral Neutral 36.7 37.5 13%
Jardine Matheson USD 58.0 Sell Sell 53.0 51.0 -9%
ChinaCOSCO Pacific HKD 13.1 Buy* Buy* 17.5 18.4 34%
Shanghai Industrial HKD 27.9 Buy Buy 36.2 36.7 30%
CITIC Pacific HKD 17.0 Neutral Neutral 21.4 21.4 26%
China Merchants Hldgs HKD 28.1 Neutral Neutral 33.9 37.0 21%
Dalian Port HKD 2.5 Neutral Buy 3.1 3.9 23%
China Resources Ent. HKD 33.9 Neutral Neutral 35.2 34.0 4%
Fosun International HKD 6.2 Neutral Neutral 7.2 7.2 15%
Tianjin Port Development HKD 1.5 Neutral Neutral 1.8 2.1 19%
SIPG CNY 3.9 Neutral Neutral 4.77 4.71 24%
Xiamen Port HKD 1.4 Sell Sell 1.37 1.43 -2%
*On our Asia Pacific Conviction Buy listSource: Company data, Goldman Sachs Research estimates.
12-m NAVRatings based TP
-40.0%
-30.0%
-20.0%
-10.0%
0.0%
10.0%
20.0%
30.0%
40.0%
HP
H T
rust
CO
SC
O P
acif
ic
Sh
an
gh
ai
Ind
.
Sw
ire P
acif
ic
CIT
IC P
acif
ic
SIP
G
Wh
arf
Dali
an
Po
rt
HW
L
CM
Hld
gs
Tia
nji
n P
ort
Dev
Ch
eu
ng
Ko
ng
MT
RC
Fo
su
n In
tl
Wh
eelo
ck &
Co
.
CR
E
Xia
men
Po
rt
Ja
rdin
e M
ath
eso
n
Base case Current Bear case
渐飞研究报告 - http://bg.panlv.net
July 27, 2011 Asia Pacific: Conglomerates
Goldman Sachs Global Investment Research 2
Table of Contents
Summary of our latest sector view and rating changes 3
Sector themes, stress-test our assumptions and earnings preview 3
(1) Prefer container over bulk ports, and exposure to Bohai Rim 7
(2) Capital value appreciation in HK rental properties 14
(3) Acquisition opportunities for cash-rich conglomerates 20
Downside scenario - stress-test our key assumptions 23
Conclusion: earnings impact and valuation implication 26
Potential surprises and trading ideas around the results season 29
Stock implications and investment views 32
Stocks with rating changes 32
Other Buy rated stocks 37
Sell-rated stocks 45
渐飞研究报告 - http://bg.panlv.net
July 27, 2011 Asia Pacific: Conglomerates
Goldman Sachs Global Investment Research 3
Summary of our latest sector view and rating changes
Sector themes, stress-test our assumptions and earnings preview
Similar to what we had experienced last year, the Hong Kong and Chinese conglomerate
stocks staged a sharp rally along with the broader market in the early part of this year on
expectation of a sustainable macro recovery, especially for those more leveraged to the
export-driven sectors (e.g., port, commodity). Given a firmer US outlook and greater
inflation/policy tightening concerns in Asia, our strategist also recommended DM
(developed market) over EM (emerging market) trades. But toward the end of 1Q, weaker
macro data in the US and debt crisis concern in Europe started to weigh on market
sentiment. Coupled with the higher-than-expected inflation data released from China and
other emerging economies, these had triggered a sell-down across the Hong Kong and
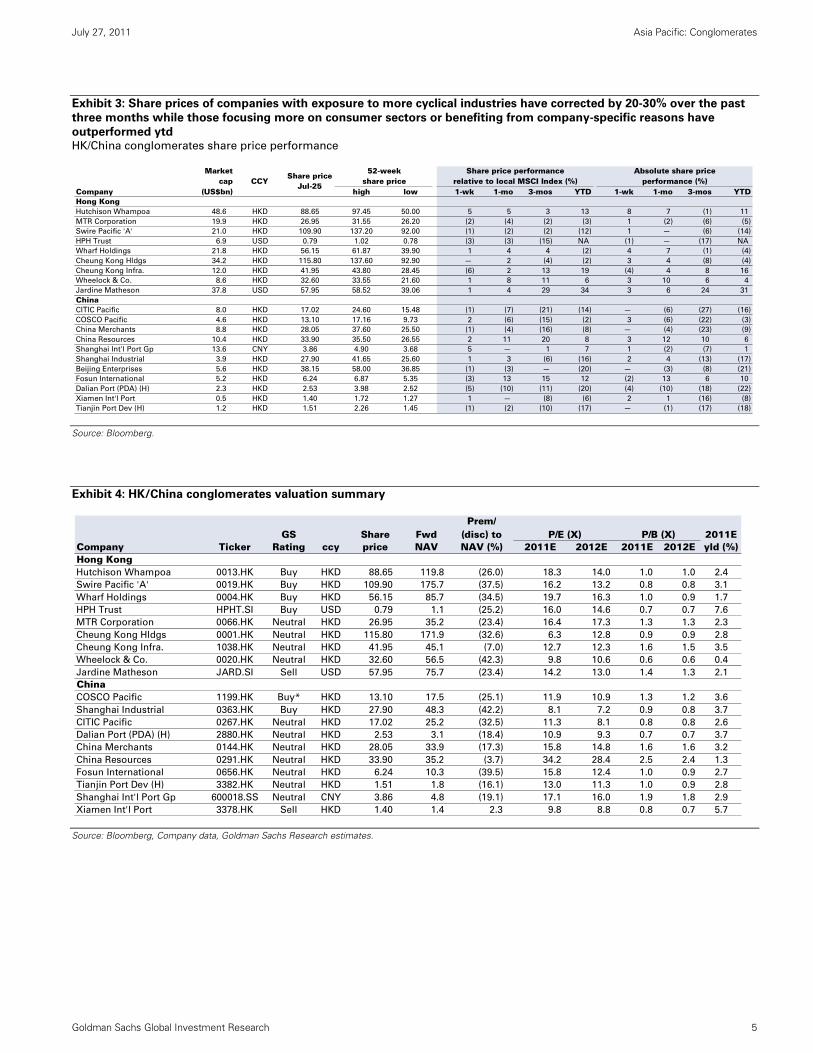
China markets in recent weeks. As shown in Exhibit 3, share prices of the HK/China
conglomerates with exposure to the more cyclical industries, such as CITIC Pacific and
China Merchants, have corrected by 20-30% over the past three months. On the other hand,
those that focus more on consumer sectors (i.e., CRE, Jardine Matheson) or benefit from
company-specific reasons (i.e., Hutch for HPHT IPO, CKI for EDF acquisition, Fosun for the
privatization of Forte Land and proposed listing of Hainan Mining) have outperformed ytd.
Looking into 2H2011, as most of the stocks have traded either sideways or fallen ytd, we
generally find the sector valuation attractive. In a bear case where we stress-test our key
assumptions based on a downside scenario by our ECS team (i.e., 3.4% global, 1.5% US,
1.0% Europe, 7% China and 0.4% Hong Kong GDP growth forecasts in 2012) and value the
stocks at one-standard deviation below their mid-cycle valuation, there could be 9%-37% or
an average of 18% potential downside from the share prices of stocks in our coverage
universe. That said, risk-reward looks favorable for selective stocks, such as COSCO Pacific
(on Conviction List), HPHT and Shanghai Industrial, both rated Buy. We also see
investment opportunities for those which benefit from the several sector themes we
identify below:
Prefer port operators with exposure to the Bohai Rim region, and container over bulk
ports.
Further capital value appreciation of Hong Kong rental properties on favorable
demand-supply outlook and our expectation that the cap rate is unlikely to widen for a
period of time.
Acquisition opportunities for cash-rich conglomerates with strong local relationship
with local governments, given mounting pressure for them to lower their debt burden.
We upgrade Wharf from Neutral to Buy, and downgrade MTRC from Buy to Neutral. After
trading sideways ytd in spite of the strong fundamentals of Hong Kong’s retail rental
market, Wharf shares trade at a 35% discount to NAV, below the mid-cycle valuation. We
see a buying opportunity at this level. If the group continues to execute well on its China
investment, we expect a step-up in its property sale profit and see significant upside risk to
consensus estimates in 2012-13E. Confirmation of its full-year property sale target by
management is likely to be taken positively by the market.
For MTRC, several developments in recent months led us to turn more cautious on its
business outlook, i.e., a substantial capex increase which raises concerns about further cost
overruns and the return of its new rail projects. MTRC agreed to offer an additional
HK$100mn fare promotion, wiping off close to 40% of the revenue increase from previous
fare hikes, in response to Hong Kong locals’ protest against the fare increase. With HK CPI
渐飞研究报告 - http://bg.panlv.net
July 27, 2011 Asia Pacific: Conglomerates
Goldman Sachs Global Investment Research 4
rising to 5.6% in June, the magnitude of the fare hike will likely be even higher. MTRC may
face more of a challenge then. In addition, there may be a risk that the existing Fare
Adjustment Mechanism (FAM) formula may be revised when it is reviewed in 1H 2012.
We also downgrade Dalian Port from Buy to Neutral and prefer COSCO Pacific. We see
downside risk on consensus earnings estimates on weaker-than-expected crude oil
throughput growth ytd and potential dilution after the completion of the China-Russia
pipeline. The recent fire accident at PetroChina’s Dalian Petrochemical plan may also delay
the launch of PetroChina’s 4.2mn oil storage facility.
Our top buys are COSCO Pacific, Hutch and Wharf. Our top Sell is Jardine Matheson.
Exhibit 1: Summary of rating, target price and net asset value changes
Source: Company data, Goldman Sachs Research estimates.
Exhibit 2: Summary of core net profit estimate revisions
Source: Company data, Goldman Sachs Research estimates.
Price Implied
Ticker Ccy 25-Jul New Old New Old Chg New Old New Old % +/-% Comments
Hong KongHutchison Whampoa 0013.HK HKD 88.7 Buy Buy 119.8 120.0 0% -10% -10% 108.0 108.0 0% 22% NAV-basedSwire Pacific (A) 0019.HK HKD 109.9 Buy Buy 175.7 178.1 -1% -20% -20% 140.6 142.5 -1% 28% NAV-basedWharf Holdings 0004.HK HKD 56.2 Buy Neutral 85.7 78.9 9% -20% -25% 69.0 59.2 17% 23% NAV-based Narrower discount on solid China property executionHPH Trust HPHT.SI USD 0.8 Buy Buy 1.1 1.1 0% 0% 0% 1.06 1.06 0% 34% DCF-based
MTRC 0066.HK HKD 27.0 Neutral Buy 35.2 36.1 -3% -10% 0% 31.6 36.1 -12% 17% NAV-basedWider discount on concern over the new projects' return and its ability to raise fare
Cheung Kong Hldgs 0001.HK HKD 115.8 Neutral Neutral 171.9 172.5 0% -20% -15% 137.5 146.6 -6% 19% NAV-basedWider discount on de-rating of property developers and HK property policy risks
CKI 1038.HK HKD 42.0 Neutral Neutral 45.1 45.1 0% 0% 0% 45.1 45.1 0% 8% NAV-basedWheelock & Co. 0020.HK HKD 32.6 Neutral Neutral 56.5 53.6 5% -35% -30% 36.7 37.5 -2% 13% NAV-based Wider discount on HK/Singapore property policy risksJardine Matheson JARD.SI USD 58.0 Sell Sell 75.7 72.9 4% -30% -30% 53.0 51.0 4% -9% NAV-based
ChinaCOSCO Pacific 1199.HK HKD 13.1 Buy* Buy* 17.5 18.4 -5% 0% 0% 17.5 18.4 -5% 34% NAV-basedShanghai Industrial 0363.HK HKD 27.9 Buy Buy 48.3 48.9 -1% -25% -25% 36.2 36.7 -1% 30% NAV-basedCITIC Pacific 0267.HK HKD 17.0 Neutral Neutral 25.2 25.2 0% -15% -15% 21.4 21.4 0% 26% NAV-basedChina Merchants Hldgs 0144.HK HKD 28.1 Neutral Neutral 33.9 37.0 -8% 0% 0% 33.9 37.0 -8% 21% NAV-basedDalian Port 2880.HK HKD 2.5 Neutral Buy 3.1 3.9 -21% 0% 0% 3.1 3.9 -21% 23% DCF-based SOTPChina Resources Ent. 0291.HK HKD 33.9 Neutral Neutral 35.2 34.0 4% 0% 0% 35.2 34.0 4% 4% NAV-basedFosun International 0656.HK HKD 6.2 Neutral Neutral 10.3 10.4 -1% -30% -30% 7.2 7.2 0% 15% NAV-basedTianjin Port Development 3382.HK HKD 1.5 Neutral Neutral 1.8 2.1 -15% 0% 0% 1.8 2.1 -15% 19% DCF-based SOTPSIPG 600018.SS CNY 3.9 Neutral Neutral 4.8 4.7 1% 0% 0% 4.77 4.71 1% 24% DCF-based SOTPXiamen Port 3378.HK HKD 1.4 Sell Sell 1.4 1.4 -4% 0% 0% 1.37 1.43 -4% -2% DCF-based SOTP* On Conviction List.
Target price2011E NAV / shareRating Target disc. Valuation methodology
Ticker Ccy New Old Chg New Old Chg New Old ChgHong KongHutchison Whampoa 0013.HK HKD 20,694 23,086 -10% 27,049 29,906 -10% 31,489 33,137 -5% Factor in deferral of proeprty profit booking and higher earnings at HuskSwire Pacific (A) 0019.HK HKD 10,225 10,941 -7% 12,536 13,325 -6% 13,592 14,083 -3% Factor in lastest GS estimates of Cathay Pacific and HAECOWharf Holdings 0004.HK HKD 8,493 8,482 0% 10,456 10,293 2% 13,198 10,659 24% Factor in higher HK retail rental growth & China property sales assumptHPH Trust HPHT.SI HKD 2,314 2,314 0% 2,514 2,514 0% 2,834 2,834 0% n.a.
MTRC 0066.HK HKD 9,599 9,818 -2% 9,382 10,795 -13% 11,127 11,795 -6%Factor in lower margin for its rail business and deferral of profit booking at Lohas Park Phase 3 from 2012 to 2013
Cheung Kong Hldgs 0001.HK HKD 42,393 39,255 8% 21,027 28,854 -27% 27,582 31,863 -13% Factor in Hutch's latest estimates and latest proeprty scheduleCKI 1038.HK HKD 7,458 7,458 0% 7,695 7,695 0% 7,957 7,957 0% n.a.Wheelock & Co. 0020.HK HKD 6,726 6,588 2% 6,250 6,060 3% 9,181 6,764 36% Factor in Wharf's latest estimatesJardine Matheson JARD.SI USD 1,470 1,406 5% 1,598 1,538 4% 1,859 1,751 6% Factor in latest GS estimates for HK Land, JCNC and Astra
ChinaCOSCO Pacific 1199.HK USD 385 385 0% 417 417 0% 469 469 0% n.a.Shanghai Industrial 0363.HK HKD 3,727 2,774 34% 4,162 3,288 27% 3,700 3,862 -4% Reclassify the Qingpu landbank sales as recurrent earningsCITIC Pacific 0267.HK HKD 5,493 5,493 0% 7,662 7,662 0% 11,561 11,561 0% n.a.China Merchants Hldgs 0144.HK HKD 4,373 4,422 -1% 4,661 4,827 -3% 5,130 5,476 -6% Factor in lower container throughput growth in PRD Dalian Port 2880.HK CNY 846 941 -10% 960 1,096 -12% 1,068 1,227 -13% Slower throughput growth in oil handling divisionChina Resources Ent. 0291.HK HKD 2,379 2,387 0% 2,861 2,822 1% 3,487 3,404 2% Factor in higher sales growth for retail business in 2012-13Fosun International 0656.HK CNY 2,101 2,116 -1% 2,675 2,706 -1% 3,332 3,360 -1% Factor in higher interest expensesTianjin Port Development 3382.HK HKD 718 691 4% 823 793 4% 904 875 3% Factor in higher coal and container throughput growth assumptionsSIPG 600018.SS CNY 5,032 5,094 -1% 5,486 5,695 -4% 6,169 6,567 -6% Factor in lower container throughput and tariff forecastXiamen Port 3378.HK CNY 320 298 7% 345 321 8% 367 343 7% Lower container throughput and tariff forecast
**Core net profit excluding exceptional items except for Cheung Kong
CommentRecurring net profits (mn)**
2011E 2012E 2013E
渐飞研究报告 - http://bg.panlv.net
July 27, 2011 Asia Pacific: Conglomerates
Goldman Sachs Global Investment Research 5
Exhibit 3: Share prices of companies with exposure to more cyclical industries have corrected by 20-30% over the past
three months while those focusing more on consumer sectors or benefiting from company-specific reasons have
outperformed ytd HK/China conglomerates share price performance
Source: Bloomberg.
Exhibit 4: HK/China conglomerates valuation summary
Source: Bloomberg, Company data, Goldman Sachs Research estimates.
Marketcap
Company (US$bn) high low 1-wk 1-mo 3-mos YTD 1-wk 1-mo 3-mos YTDHong KongHutchison Whampoa 48.6 HKD 88.65 97.45 50.00 5 5 3 13 8 7 (1) 11
MTR Corporation 19.9 HKD 26.95 31.55 26.20 (2) (4) (2) (3) 1 (2) (6) (5)
Swire Pacific 'A' 21.0 HKD 109.90 137.20 92.00 (1) (2) (2) (12) 1 — (6) (14)
HPH Trust 6.9 USD 0.79 1.02 0.78 (3) (3) (15) NA (1) — (17) NA
Wharf Holdings 21.8 HKD 56.15 61.87 39.90 1 4 4 (2) 4 7 (1) (4)
Cheung Kong Hldgs 34.2 HKD 115.80 137.60 92.90 — 2 (4) (2) 3 4 (8) (4)
Cheung Kong Infra. 12.0 HKD 41.95 43.80 28.45 (6) 2 13 19 (4) 4 8 16
Wheelock & Co. 8.6 HKD 32.60 33.55 21.60 1 8 11 6 3 10 6 4
Jardine Matheson 37.8 USD 57.95 58.52 39.06 1 4 29 34 3 6 24 31
ChinaCITIC Pacific 8.0 HKD 17.02 24.60 15.48 (1) (7) (21) (14) — (6) (27) (16)
COSCO Pacific 4.6 HKD 13.10 17.16 9.73 2 (6) (15) (2) 3 (6) (22) (3)
China Merchants 8.8 HKD 28.05 37.60 25.50 (1) (4) (16) (8) — (4) (23) (9)
China Resources 10.4 HKD 33.90 35.50 26.55 2 11 20 8 3 12 10 6
Shanghai Int'l Port Gp 13.6 CNY 3.86 4.90 3.68 5 — 1 7 1 (2) (7) 1
Shanghai Industrial 3.9 HKD 27.90 41.65 25.60 1 3 (6) (16) 2 4 (13) (17)
Beijing Enterprises 5.6 HKD 38.15 58.00 36.85 (1) (3) — (20) — (3) (8) (21)
Fosun International 5.2 HKD 6.24 6.87 5.35 (3) 13 15 12 (2) 13 6 10
Dalian Port (PDA) (H) 2.3 HKD 2.53 3.98 2.52 (5) (10) (11) (20) (4) (10) (18) (22)
Xiamen Int'l Port 0.5 HKD 1.40 1.72 1.27 1 — (8) (6) 2 1 (16) (8)
Tianjin Port Dev (H) 1.2 HKD 1.51 2.26 1.45 (1) (2) (10) (17) — (1) (17) (18)
CCYShare price
Jul-25
Absolute share priceperformance (%)
52-weekshare price
Share price performancerelative to local MSCI Index (%)
Prem/GS Share Fwd (disc) to 2011E
Company Ticker Rating ccy price NAV NAV (%) 2011E 2012E 2011E 2012E yld (%)Hong KongHutchison Whampoa 0013.HK Buy HKD 88.65 119.8 (26.0) 18.3 14.0 1.0 1.0 2.4
Swire Pacific 'A' 0019.HK Buy HKD 109.90 175.7 (37.5) 16.2 13.2 0.8 0.8 3.1
Wharf Holdings 0004.HK Buy HKD 56.15 85.7 (34.5) 19.7 16.3 1.0 0.9 1.7
HPH Trust HPHT.SI Buy USD 0.79 1.1 (25.2) 16.0 14.6 0.7 0.7 7.6
MTR Corporation 0066.HK Neutral HKD 26.95 35.2 (23.4) 16.4 17.3 1.3 1.3 2.3
Cheung Kong Hldgs 0001.HK Neutral HKD 115.80 171.9 (32.6) 6.3 12.8 0.9 0.9 2.8
Cheung Kong Infra. 1038.HK Neutral HKD 41.95 45.1 (7.0) 12.7 12.3 1.6 1.5 3.5
Wheelock & Co. 0020.HK Neutral HKD 32.60 56.5 (42.3) 9.8 10.6 0.6 0.6 0.4
Jardine Matheson JARD.SI Sell USD 57.95 75.7 (23.4) 14.2 13.0 1.4 1.3 2.1
ChinaCOSCO Pacific 1199.HK Buy* HKD 13.10 17.5 (25.1) 11.9 10.9 1.3 1.2 3.6
Shanghai Industrial 0363.HK Buy HKD 27.90 48.3 (42.2) 8.1 7.2 0.9 0.8 3.7
CITIC Pacific 0267.HK Neutral HKD 17.02 25.2 (32.5) 11.3 8.1 0.8 0.8 2.6
Dalian Port (PDA) (H) 2880.HK Neutral HKD 2.53 3.1 (18.4) 10.9 9.3 0.7 0.7 3.7
China Merchants 0144.HK Neutral HKD 28.05 33.9 (17.3) 15.8 14.8 1.6 1.6 3.2
China Resources 0291.HK Neutral HKD 33.90 35.2 (3.7) 34.2 28.4 2.5 2.4 1.3
Fosun International 0656.HK Neutral HKD 6.24 10.3 (39.5) 15.8 12.4 1.0 0.9 2.7
Tianjin Port Dev (H) 3382.HK Neutral HKD 1.51 1.8 (16.1) 13.0 11.3 1.0 0.9 2.8
Shanghai Int'l Port Gp 600018.SS Neutral CNY 3.86 4.8 (19.1) 17.1 16.0 1.9 1.8 2.9
Xiamen Int'l Port 3378.HK Sell HKD 1.40 1.4 2.3 9.8 8.8 0.8 0.7 5.7
P/E (X) P/B (X)
渐飞研究报告 - http://bg.panlv.net
July 27, 2011 Asia Pacific: Conglomerates
Goldman Sachs Global Investment Research 6
Exhibit 5: Summary of key assumptions
Source: Goldman Sachs Research estimates.
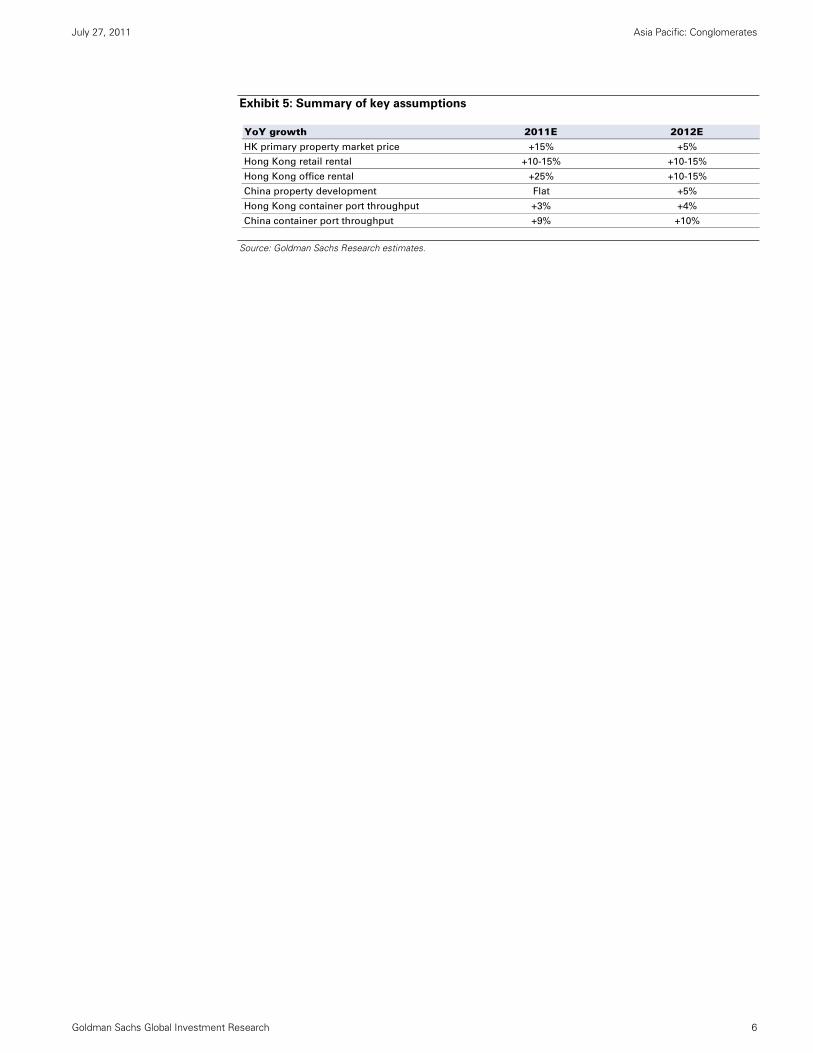
YoY growth 2011E 2012EHK primary property market price +15% +5%
Hong Kong retail rental +10-15% +10-15%
Hong Kong office rental +25% +10-15%
China property development Flat +5%
Hong Kong container port throughput +3% +4%
China container port throughput +9% +10%
渐飞研究报告 - http://bg.panlv.net
July 27, 2011 Asia Pacific: Conglomerates
Goldman Sachs Global Investment Research 7
Key investment and sector themes
As in the past, we have identified the following sector themes which the conglomerates in
our coverage universe would be able to leverage.
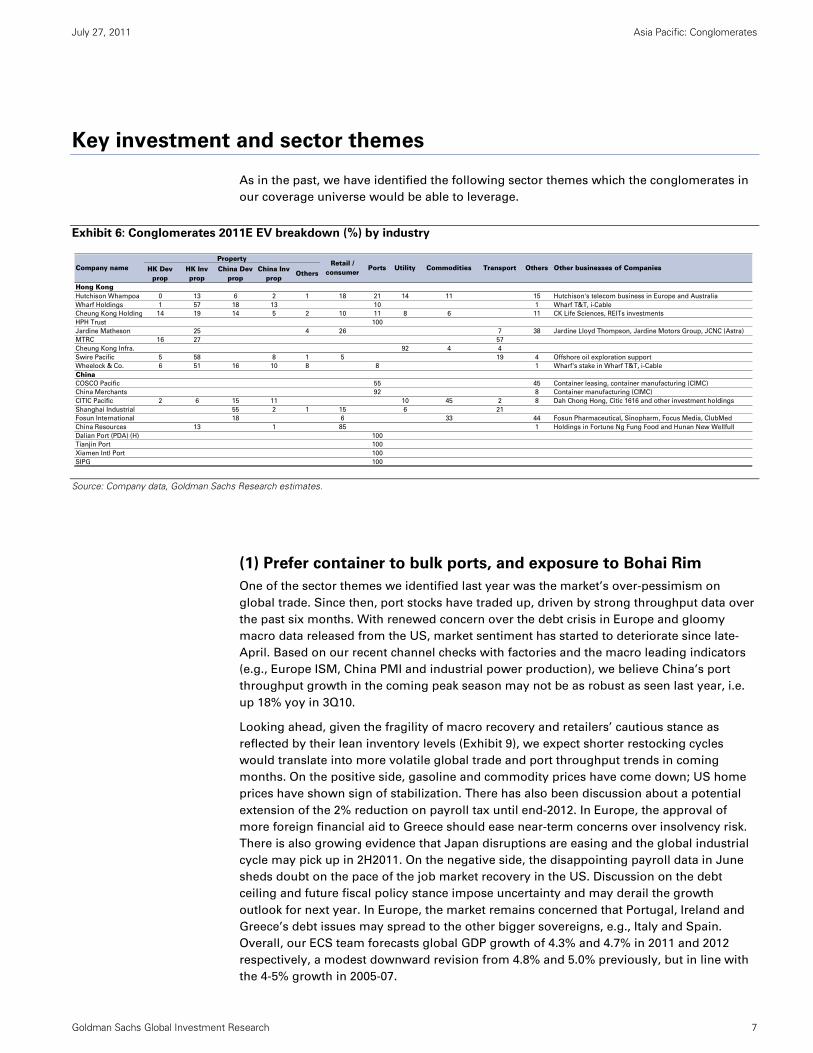
Exhibit 6: Conglomerates 2011E EV breakdown (%) by industry
Source: Company data, Goldman Sachs Research estimates.
(1) Prefer container to bulk ports, and exposure to Bohai Rim
One of the sector themes we identified last year was the market’s over-pessimism on
global trade. Since then, port stocks have traded up, driven by strong throughput data over
the past six months. With renewed concern over the debt crisis in Europe and gloomy
macro data released from the US, market sentiment has started to deteriorate since late-
April. Based on our recent channel checks with factories and the macro leading indicators
(e.g., Europe ISM, China PMI and industrial power production), we believe China’s port
throughput growth in the coming peak season may not be as robust as seen last year, i.e.
up 18% yoy in 3Q10.
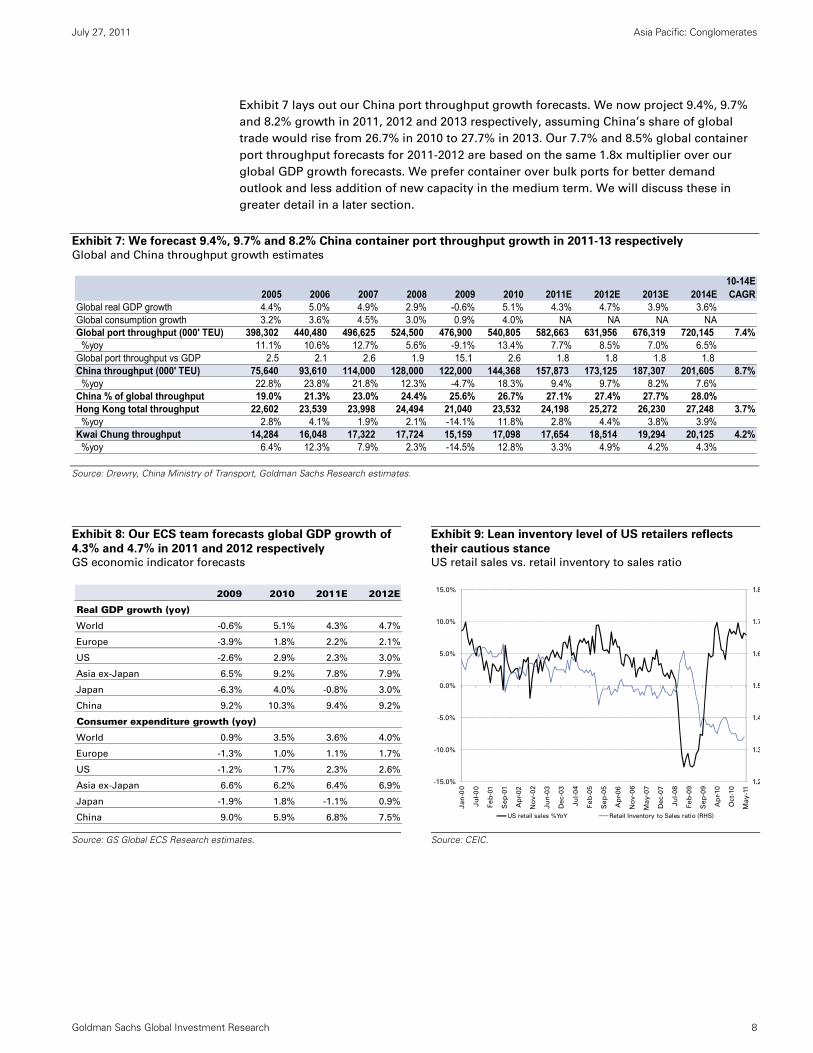
Looking ahead, given the fragility of macro recovery and retailers’ cautious stance as
reflected by their lean inventory levels (Exhibit 9), we expect shorter restocking cycles
would translate into more volatile global trade and port throughput trends in coming
months. On the positive side, gasoline and commodity prices have come down; US home
prices have shown sign of stabilization. There has also been discussion about a potential
extension of the 2% reduction on payroll tax until end-2012. In Europe, the approval of
more foreign financial aid to Greece should ease near-term concerns over insolvency risk.
There is also growing evidence that Japan disruptions are easing and the global industrial
cycle may pick up in 2H2011. On the negative side, the disappointing payroll data in June
sheds doubt on the pace of the job market recovery in the US. Discussion on the debt
ceiling and future fiscal policy stance impose uncertainty and may derail the growth
outlook for next year. In Europe, the market remains concerned that Portugal, Ireland and
Greece’s debt issues may spread to the other bigger sovereigns, e.g., Italy and Spain.
Overall, our ECS team forecasts global GDP growth of 4.3% and 4.7% in 2011 and 2012
respectively, a modest downward revision from 4.8% and 5.0% previously, but in line with
the 4-5% growth in 2005-07.
HK Dev prop
HK Inv prop
China Dev prop
China Inv prop
Others
Hong KongHutchison Whampoa 0 13 6 2 1 18 21 14 11 15 Hutchison's telecom business in Europe and Australia
Wharf Holdings 1 57 18 13 10 1 Wharf T&T, i-Cable
Cheung Kong Holding 14 19 14 5 2 10 11 8 6 11 CK Life Sciences, REITs investments
HPH Trust 100
Jardine Matheson 25 4 26 7 38 Jardine Lloyd Thompson, Jardine Motors Group, JCNC (Astra)
MTRC 16 27 57
Cheung Kong Infra. 92 4 4
Swire Pacific 5 58 8 1 5 19 4 Offshore oil exploration support
Wheelock & Co. 6 51 16 10 8 8 1 Wharf's stake in Wharf T&T, i-Cable
ChinaCOSCO Pacific 55 45 Container leasing, container manufacturing (CIMC)
China Merchants 92 8 Container manufacturing (CIMC)
CITIC Pacific 2 6 15 11 10 45 2 8 Dah Chong Hong, Citic 1616 and other investment holdings
Shanghai Industrial 55 2 1 15 6 21
Fosun International 18 6 33 44 Fosun Pharmaceutical, Sinopharm, Focus Media, ClubMed
China Resources 13 1 85 1 Holdings in Fortune Ng Fung Food and Hunan New Wellfull
Dalian Port (PDA) (H) 100
Tianjin Port 100
Xiamen Intl Port 100
SIPG 100
Transport Others Other businesses of CompaniesCompany nameProperty
Retail / consumer
Ports Utility Commodities
渐飞研究报告 - http://bg.panlv.net
July 27, 2011 Asia Pacific: Conglomerates
Goldman Sachs Global Investment Research 8
Exhibit 7 lays out our China port throughput growth forecasts. We now project 9.4%, 9.7%
and 8.2% growth in 2011, 2012 and 2013 respectively, assuming China’s share of global
trade would rise from 26.7% in 2010 to 27.7% in 2013. Our 7.7% and 8.5% global container
port throughput forecasts for 2011-2012 are based on the same 1.8x multiplier over our
global GDP growth forecasts. We prefer container over bulk ports for better demand
outlook and less addition of new capacity in the medium term. We will discuss these in
greater detail in a later section.
Exhibit 7: We forecast 9.4%, 9.7% and 8.2% China container port throughput growth in 2011-13 respectively
Global and China throughput growth estimates
Source: Drewry, China Ministry of Transport, Goldman Sachs Research estimates.
Exhibit 8: Our ECS team forecasts global GDP growth of
4.3% and 4.7% in 2011 and 2012 respectively GS economic indicator forecasts
Exhibit 9: Lean inventory level of US retailers reflects
their cautious stance US retail sales vs. retail inventory to sales ratio
Source: GS Global ECS Research estimates.
Source: CEIC.
2005 2006 2007 2008 2009 2010 2011E 2012E 2013E 2014E10-14E CAGR
Global real GDP growth 4.4% 5.0% 4.9% 2.9% -0.6% 5.1% 4.3% 4.7% 3.9% 3.6%Global consumption growth 3.2% 3.6% 4.5% 3.0% 0.9% 4.0% NA NA NA NAGlobal port throughput (000' TEU) 398,302 440,480 496,625 524,500 476,900 540,805 582,663 631,956 676,319 720,145 7.4% %yoy 11.1% 10.6% 12.7% 5.6% -9.1% 13.4% 7.7% 8.5% 7.0% 6.5%Global port throughput vs GDP 2.5 2.1 2.6 1.9 15.1 2.6 1.8 1.8 1.8 1.8 China throughput (000' TEU) 75,640 93,610 114,000 128,000 122,000 144,368 157,873 173,125 187,307 201,605 8.7% %yoy 22.8% 23.8% 21.8% 12.3% -4.7% 18.3% 9.4% 9.7% 8.2% 7.6%China % of global throughput 19.0% 21.3% 23.0% 24.4% 25.6% 26.7% 27.1% 27.4% 27.7% 28.0%Hong Kong total throughput 22,602 23,539 23,998 24,494 21,040 23,532 24,198 25,272 26,230 27,248 3.7% %yoy 2.8% 4.1% 1.9% 2.1% -14.1% 11.8% 2.8% 4.4% 3.8% 3.9%Kwai Chung throughput 14,284 16,048 17,322 17,724 15,159 17,098 17,654 18,514 19,294 20,125 4.2% %yoy 6.4% 12.3% 7.9% 2.3% -14.5% 12.8% 3.3% 4.9% 4.2% 4.3%
2009 2010 2011E 2012E
Real GDP growth (yoy)
World -0.6% 5.1% 4.3% 4.7%
Europe -3.9% 1.8% 2.2% 2.1%
US -2.6% 2.9% 2.3% 3.0%
Asia ex-Japan 6.5% 9.2% 7.8% 7.9%
Japan -6.3% 4.0% -0.8% 3.0%
China 9.2% 10.3% 9.4% 9.2%
Consumer expenditure growth (yoy)
World 0.9% 3.5% 3.6% 4.0%
Europe -1.3% 1.0% 1.1% 1.7%
US -1.2% 1.7% 2.3% 2.6%
Asia ex-Japan 6.6% 6.2% 6.4% 6.9%
Japan -1.9% 1.8% -1.1% 0.9%
China 9.0% 5.9% 6.8% 7.5%
1.2
1.3
1.4
1.5
1.6
1.7
1.8
-15.0%
-10.0%
-5.0%
0.0%
5.0%
10.0%
15.0%
Ja
n-0
0
Ju
l-0
0
Fe
b-0
1
Se
p-0
1
Ap
r-0
2
No
v-0
2
Ju
n-0
3
De
c-0
3
Ju
l-0
4
Fe
b-0
5
Se
p-0
5
Ap
r-0
6
No
v-0
6
Ma
y-0
7
De
c-0
7
Ju
l-0
8
Fe
b-0
9
Se
p-0
9
Ap
r-10
Oct-
10
Ma
y-1
1
US retail sales %YoY Retail Inventory to Sales ratio (RHS)
渐飞研究报告 - http://bg.panlv.net
July 27, 2011 Asia Pacific: Conglomerates
Goldman Sachs Global Investment Research 9
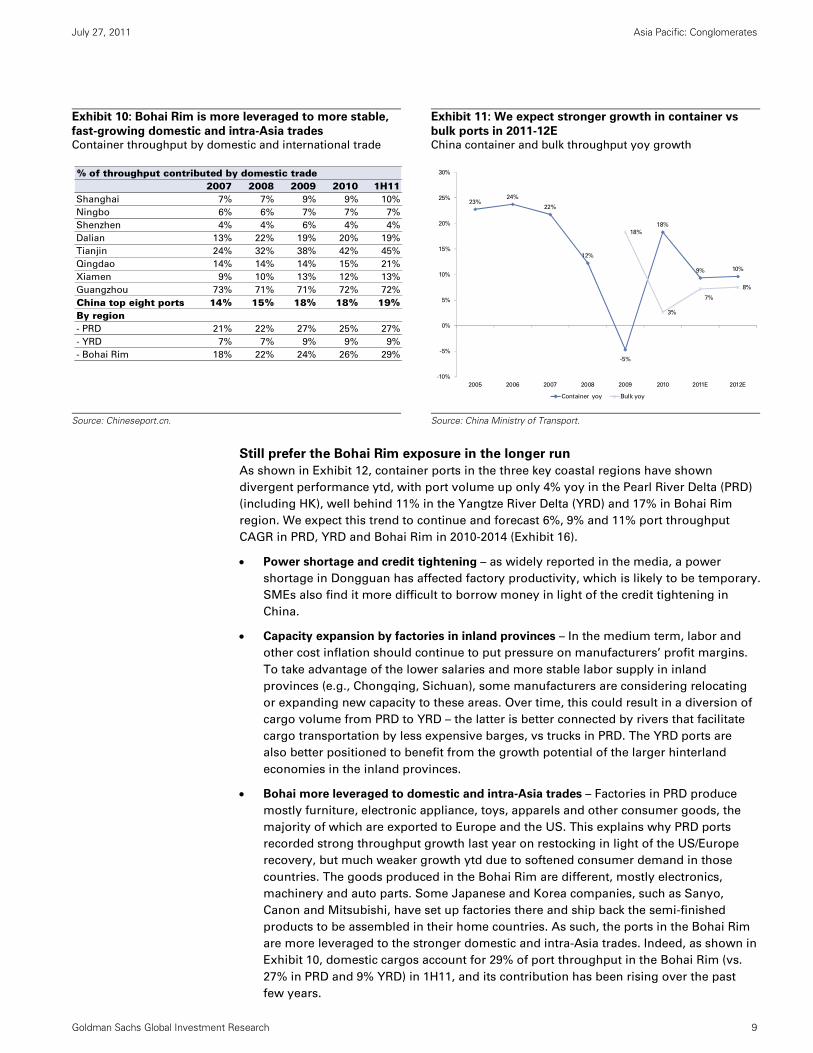
Exhibit 10: Bohai Rim is more leveraged to more stable,
fast-growing domestic and intra-Asia trades Container throughput by domestic and international trade
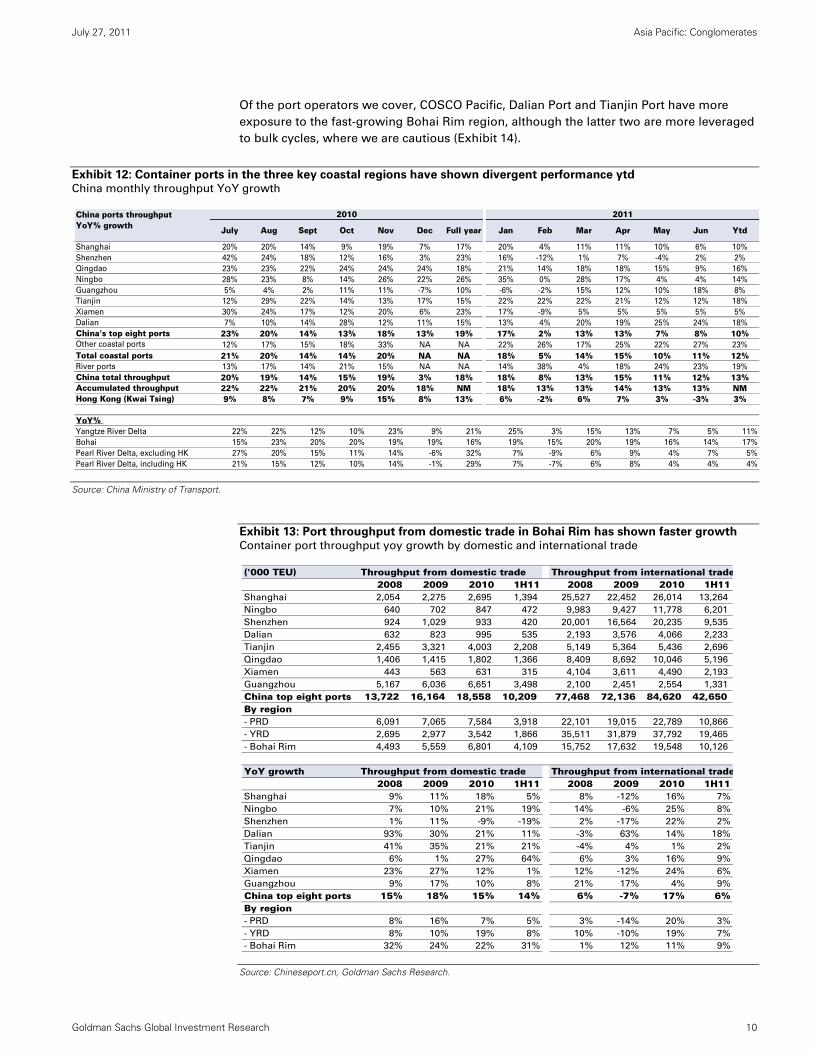
Exhibit 11: We expect stronger growth in container vs
bulk ports in 2011-12E China container and bulk throughput yoy growth
Source: Chineseport.cn.
Source: China Ministry of Transport.
Still prefer the Bohai Rim exposure in the longer run
As shown in Exhibit 12, container ports in the three key coastal regions have shown
divergent performance ytd, with port volume up only 4% yoy in the Pearl River Delta (PRD)
(including HK), well behind 11% in the Yangtze River Delta (YRD) and 17% in Bohai Rim
region. We expect this trend to continue and forecast 6%, 9% and 11% port throughput
CAGR in PRD, YRD and Bohai Rim in 2010-2014 (Exhibit 16).
Power shortage and credit tightening – as widely reported in the media, a power
shortage in Dongguan has affected factory productivity, which is likely to be temporary.
SMEs also find it more difficult to borrow money in light of the credit tightening in
China.
Capacity expansion by factories in inland provinces – In the medium term, labor and
other cost inflation should continue to put pressure on manufacturers’ profit margins.
To take advantage of the lower salaries and more stable labor supply in inland
provinces (e.g., Chongqing, Sichuan), some manufacturers are considering relocating
or expanding new capacity to these areas. Over time, this could result in a diversion of
cargo volume from PRD to YRD – the latter is better connected by rivers that facilitate
cargo transportation by less expensive barges, vs trucks in PRD. The YRD ports are
also better positioned to benefit from the growth potential of the larger hinterland
economies in the inland provinces.
Bohai more leveraged to domestic and intra-Asia trades – Factories in PRD produce
mostly furniture, electronic appliance, toys, apparels and other consumer goods, the
majority of which are exported to Europe and the US. This explains why PRD ports
recorded strong throughput growth last year on restocking in light of the US/Europe
recovery, but much weaker growth ytd due to softened consumer demand in those
countries. The goods produced in the Bohai Rim are different, mostly electronics,
machinery and auto parts. Some Japanese and Korea companies, such as Sanyo,
Canon and Mitsubishi, have set up factories there and ship back the semi-finished
products to be assembled in their home countries. As such, the ports in the Bohai Rim
are more leveraged to the stronger domestic and intra-Asia trades. Indeed, as shown in
Exhibit 10, domestic cargos account for 29% of port throughput in the Bohai Rim (vs.
27% in PRD and 9% YRD) in 1H11, and its contribution has been rising over the past
few years.
% of throughput contributed by domestic trade2007 2008 2009 2010 1H11
Shanghai 7% 7% 9% 9% 10%
Ningbo 6% 6% 7% 7% 7%
Shenzhen 4% 4% 6% 4% 4%
Dalian 13% 22% 19% 20% 19%
Tianjin 24% 32% 38% 42% 45%
Qingdao 14% 14% 14% 15% 21%
Xiamen 9% 10% 13% 12% 13%
Guangzhou 73% 71% 71% 72% 72%
China top eight ports 14% 15% 18% 18% 19%By region- PRD 21% 22% 27% 25% 27%
- YRD 7% 7% 9% 9% 9%
- Bohai Rim 18% 22% 24% 26% 29%
23%24%
22%
12%
-5%
18%
9% 10%
18%
3%
7%
8%
-10%
-5%
0%
5%
10%
15%
20%
25%
30%
2005 2006 2007 2008 2009 2010 2011E 2012E
Container yoy Bulk yoy
渐飞研究报告 - http://bg.panlv.net
July 27, 2011 Asia Pacific: Conglomerates
Goldman Sachs Global Investment Research 10
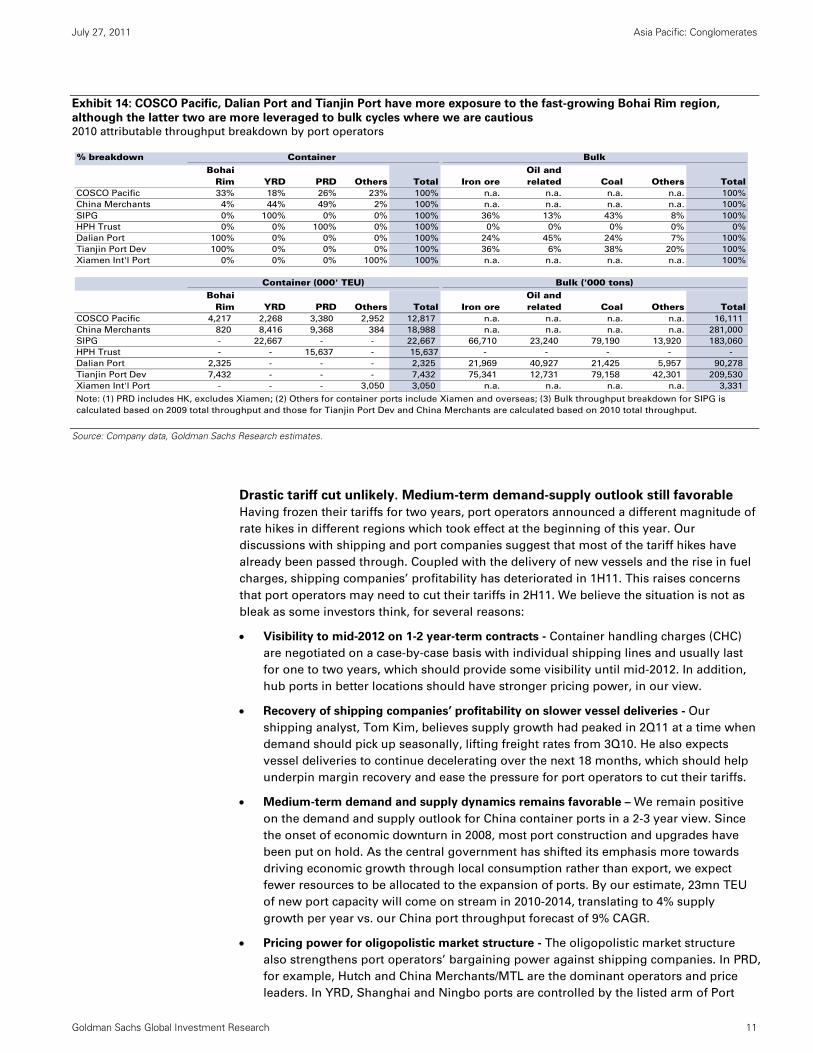
Of the port operators we cover, COSCO Pacific, Dalian Port and Tianjin Port have more
exposure to the fast-growing Bohai Rim region, although the latter two are more leveraged
to bulk cycles, where we are cautious (Exhibit 14).
Exhibit 12: Container ports in the three key coastal regions have shown divergent performance ytd China monthly throughput YoY growth
Source: China Ministry of Transport.
Exhibit 13: Port throughput from domestic trade in Bohai Rim has shown faster growth Container port throughput yoy growth by domestic and international trade
Source: Chineseport.cn, Goldman Sachs Research.
China ports throughputYoY% growth
Shanghai 20% 20% 14% 9% 19% 7% 17% 20% 4% 11% 11% 10% 6% 10%
Shenzhen 42% 24% 18% 12% 16% 3% 23% 16% -12% 1% 7% -4% 2% 2%
Qingdao 23% 23% 22% 24% 24% 24% 18% 21% 14% 18% 18% 15% 9% 16%
Ningbo 28% 23% 8% 14% 26% 22% 26% 35% 0% 28% 17% 4% 4% 14%
Guangzhou 5% 4% 2% 11% 11% -7% 10% -6% -2% 15% 12% 10% 18% 8%
Tianjin 12% 29% 22% 14% 13% 17% 15% 22% 22% 22% 21% 12% 12% 18%
Xiamen 30% 24% 17% 12% 20% 6% 23% 17% -9% 5% 5% 5% 5% 5%
Dalian 7% 10% 14% 28% 12% 11% 15% 13% 4% 20% 19% 25% 24% 18%
China's top eight ports 23% 20% 14% 13% 18% 13% 19% 17% 2% 13% 13% 7% 8% 10%Other coastal ports 12% 17% 15% 18% 33% NA NA 22% 26% 17% 25% 22% 27% 23%
Total coastal ports 21% 20% 14% 14% 20% NA NA 18% 5% 14% 15% 10% 11% 12%River ports 13% 17% 14% 21% 15% NA NA 14% 38% 4% 18% 24% 23% 19%
China total throughput 20% 19% 14% 15% 19% 3% 18% 18% 8% 13% 15% 11% 12% 13%Accumulated throughput 22% 22% 21% 20% 20% 18% NM 18% 13% 13% 14% 13% 13% NMHong Kong (Kwai Tsing) 9% 8% 7% 9% 15% 8% 13% 6% -2% 6% 7% 3% -3% 3%
YoY% Yangtze River Delta 22% 22% 12% 10% 23% 9% 21% 25% 3% 15% 13% 7% 5% 11%
Bohai 15% 23% 20% 20% 19% 19% 16% 19% 15% 20% 19% 16% 14% 17%
Pearl River Delta, excluding HK 27% 20% 15% 11% 14% -6% 32% 7% -9% 6% 9% 4% 7% 5%
Pearl River Delta, including HK 21% 15% 12% 10% 14% -1% 29% 7% -7% 6% 8% 4% 4% 4%
2010
Full year FebJanSeptAug DecNovOctJuly
2011
Mar Apr May Jun Ytd
('000 TEU) Throughput from domestic trade Throughput from international trade2008 2009 2010 1H11 2008 2009 2010 1H11
Shanghai 2,054 2,275 2,695 1,394 25,527 22,452 26,014 13,264
Ningbo 640 702 847 472 9,983 9,427 11,778 6,201
Shenzhen 924 1,029 933 420 20,001 16,564 20,235 9,535
Dalian 632 823 995 535 2,193 3,576 4,066 2,233
Tianjin 2,455 3,321 4,003 2,208 5,149 5,364 5,436 2,696
Qingdao 1,406 1,415 1,802 1,366 8,409 8,692 10,046 5,196
Xiamen 443 563 631 315 4,104 3,611 4,490 2,193
Guangzhou 5,167 6,036 6,651 3,498 2,100 2,451 2,554 1,331
China top eight ports 13,722 16,164 18,558 10,209 77,468 72,136 84,620 42,650 By region- PRD 6,091 7,065 7,584 3,918 22,101 19,015 22,789 10,866
- YRD 2,695 2,977 3,542 1,866 35,511 31,879 37,792 19,465
- Bohai Rim 4,493 5,559 6,801 4,109 15,752 17,632 19,548 10,126
YoY growth Throughput from domestic trade Throughput from international trade2008 2009 2010 1H11 2008 2009 2010 1H11
Shanghai 9% 11% 18% 5% 8% -12% 16% 7%
Ningbo 7% 10% 21% 19% 14% -6% 25% 8%
Shenzhen 1% 11% -9% -19% 2% -17% 22% 2%
Dalian 93% 30% 21% 11% -3% 63% 14% 18%
Tianjin 41% 35% 21% 21% -4% 4% 1% 2%
Qingdao 6% 1% 27% 64% 6% 3% 16% 9%
Xiamen 23% 27% 12% 1% 12% -12% 24% 6%
Guangzhou 9% 17% 10% 8% 21% 17% 4% 9%
China top eight ports 15% 18% 15% 14% 6% -7% 17% 6%By region- PRD 8% 16% 7% 5% 3% -14% 20% 3%
- YRD 8% 10% 19% 8% 10% -10% 19% 7%
- Bohai Rim 32% 24% 22% 31% 1% 12% 11% 9%
渐飞研究报告 - http://bg.panlv.net
July 27, 2011 Asia Pacific: Conglomerates
Goldman Sachs Global Investment Research 11
Exhibit 14: COSCO Pacific, Dalian Port and Tianjin Port have more exposure to the fast-growing Bohai Rim region,
although the latter two are more leveraged to bulk cycles where we are cautious 2010 attributable throughput breakdown by port operators
Source: Company data, Goldman Sachs Research estimates.
Drastic tariff cut unlikely. Medium-term demand-supply outlook still favorable
Having frozen their tariffs for two years, port operators announced a different magnitude of
rate hikes in different regions which took effect at the beginning of this year. Our
discussions with shipping and port companies suggest that most of the tariff hikes have
already been passed through. Coupled with the delivery of new vessels and the rise in fuel
charges, shipping companies’ profitability has deteriorated in 1H11. This raises concerns
that port operators may need to cut their tariffs in 2H11. We believe the situation is not as
bleak as some investors think, for several reasons:
Visibility to mid-2012 on 1-2 year-term contracts - Container handling charges (CHC)
are negotiated on a case-by-case basis with individual shipping lines and usually last
for one to two years, which should provide some visibility until mid-2012. In addition,
hub ports in better locations should have stronger pricing power, in our view.
Recovery of shipping companies’ profitability on slower vessel deliveries - Our
shipping analyst, Tom Kim, believes supply growth had peaked in 2Q11 at a time when
demand should pick up seasonally, lifting freight rates from 3Q10. He also expects
vessel deliveries to continue decelerating over the next 18 months, which should help
underpin margin recovery and ease the pressure for port operators to cut their tariffs.
Medium-term demand and supply dynamics remains favorable – We remain positive
on the demand and supply outlook for China container ports in a 2-3 year view. Since
the onset of economic downturn in 2008, most port construction and upgrades have
been put on hold. As the central government has shifted its emphasis more towards
driving economic growth through local consumption rather than export, we expect
fewer resources to be allocated to the expansion of ports. By our estimate, 23mn TEU
of new port capacity will come on stream in 2010-2014, translating to 4% supply
growth per year vs. our China port throughput forecast of 9% CAGR.
Pricing power for oligopolistic market structure - The oligopolistic market structure
also strengthens port operators’ bargaining power against shipping companies. In PRD,
for example, Hutch and China Merchants/MTL are the dominant operators and price
leaders. In YRD, Shanghai and Ningbo ports are controlled by the listed arm of Port
% breakdownBohai
Rim YRD PRD Others Total Iron oreOil and related Coal Others Total
COSCO Pacific 33% 18% 26% 23% 100% n.a. n.a. n.a. n.a. 100%
China Merchants 4% 44% 49% 2% 100% n.a. n.a. n.a. n.a. 100%
SIPG 0% 100% 0% 0% 100% 36% 13% 43% 8% 100%
HPH Trust 0% 0% 100% 0% 100% 0% 0% 0% 0% 0%
Dalian Port 100% 0% 0% 0% 100% 24% 45% 24% 7% 100%
Tianjin Port Dev 100% 0% 0% 0% 100% 36% 6% 38% 20% 100%
Xiamen Int'l Port 0% 0% 0% 100% 100% n.a. n.a. n.a. n.a. 100%
Bohai Rim YRD PRD Others Total Iron ore
Oil and related Coal Others Total
COSCO Pacific 4,217 2,268 3,380 2,952 12,817 n.a. n.a. n.a. n.a. 16,111
China Merchants 820 8,416 9,368 384 18,988 n.a. n.a. n.a. n.a. 281,000
SIPG - 22,667 - - 22,667 66,710 23,240 79,190 13,920 183,060
HPH Trust - - 15,637 - 15,637 - - - - -
Dalian Port 2,325 - - - 2,325 21,969 40,927 21,425 5,957 90,278
Tianjin Port Dev 7,432 - - - 7,432 75,341 12,731 79,158 42,301 209,530
Xiamen Int'l Port - - - 3,050 3,050 n.a. n.a. n.a. n.a. 3,331
Container Bulk
Container (000' TEU) Bulk ('000 tons)
Note: (1) PRD includes HK, excludes Xiamen; (2) Others for container ports include Xiamen and overseas; (3) Bulk throughput breakdown for SIPG is
calculated based on 2009 total throughput and those for Tianjin Port Dev and China Merchants are calculated based on 2010 total throughput.
渐飞研究报告 - http://bg.panlv.net
July 27, 2011 Asia Pacific: Conglomerates
Goldman Sachs Global Investment Research 12
Authorities, namely SIPG and Ningbo Port. Shanghai’s pricing strategy is indicative of
the trend and Ningbo is usually a price follower.
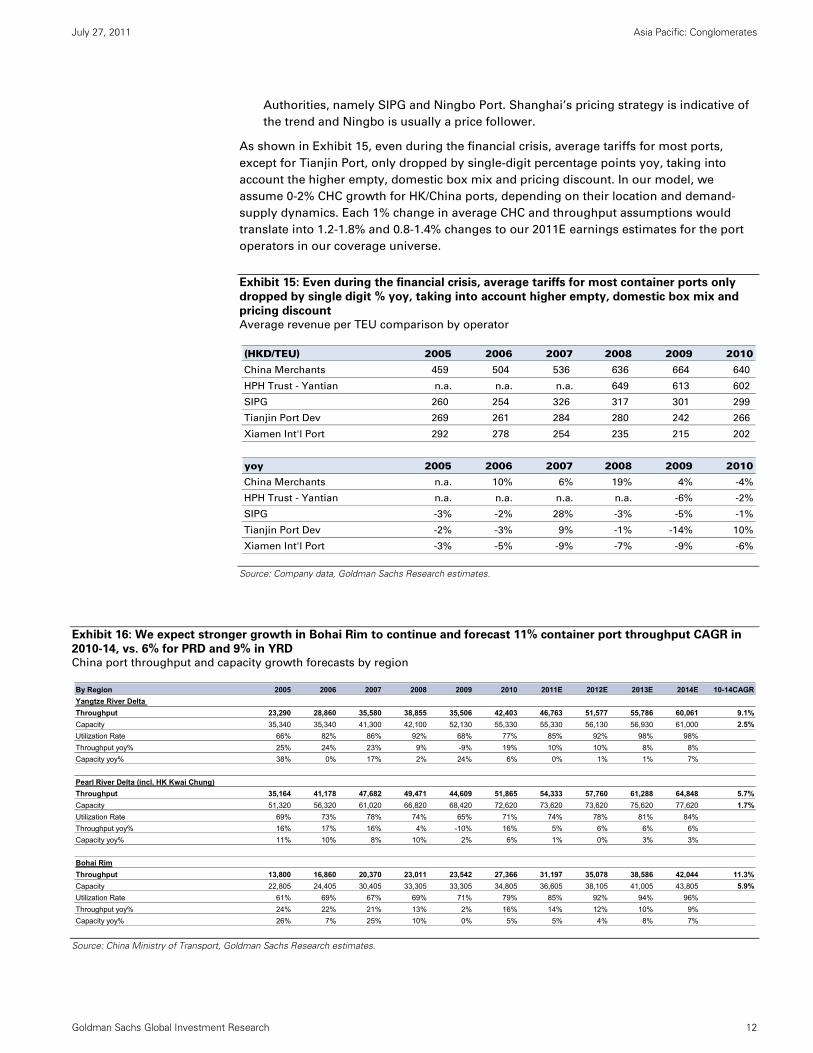
As shown in Exhibit 15, even during the financial crisis, average tariffs for most ports,
except for Tianjin Port, only dropped by single-digit percentage points yoy, taking into
account the higher empty, domestic box mix and pricing discount. In our model, we
assume 0-2% CHC growth for HK/China ports, depending on their location and demand-
supply dynamics. Each 1% change in average CHC and throughput assumptions would
translate into 1.2-1.8% and 0.8-1.4% changes to our 2011E earnings estimates for the port
operators in our coverage universe.
Exhibit 15: Even during the financial crisis, average tariffs for most container ports only
dropped by single digit % yoy, taking into account higher empty, domestic box mix and
pricing discount Average revenue per TEU comparison by operator
Source: Company data, Goldman Sachs Research estimates.
Exhibit 16: We expect stronger growth in Bohai Rim to continue and forecast 11% container port throughput CAGR in
2010-14, vs. 6% for PRD and 9% in YRD China port throughput and capacity growth forecasts by region
Source: China Ministry of Transport, Goldman Sachs Research estimates.
(HKD/TEU) 2005 2006 2007 2008 2009 2010
China Merchants 459 504 536 636 664 640
HPH Trust - Yantian n.a. n.a. n.a. 649 613 602
SIPG 260 254 326 317 301 299
Tianjin Port Dev 269 261 284 280 242 266
Xiamen Int'l Port 292 278 254 235 215 202
yoy 2005 2006 2007 2008 2009 2010
China Merchants n.a. 10% 6% 19% 4% -4%
HPH Trust - Yantian n.a. n.a. n.a. n.a. -6% -2%
SIPG -3% -2% 28% -3% -5% -1%
Tianjin Port Dev -2% -3% 9% -1% -14% 10%
Xiamen Int'l Port -3% -5% -9% -7% -9% -6%
By Region 2005 2006 2007 2008 2009 2010 2011E 2012E 2013E 2014E 10-14CAGR
Yangtze River Delta
Throughput 23,290 28,860 35,580 38,855 35,506 42,403 46,763 51,577 55,786 60,061 9.1%
Capacity 35,340 35,340 41,300 42,100 52,130 55,330 55,330 56,130 56,930 61,000 2.5%
Utilization Rate 66% 82% 86% 92% 68% 77% 85% 92% 98% 98%
Throughput yoy% 25% 24% 23% 9% -9% 19% 10% 10% 8% 8%
Capacity yoy% 38% 0% 17% 2% 24% 6% 0% 1% 1% 7%
Pearl River Delta (incl. HK Kwai Chung)
Throughput 35,164 41,178 47,682 49,471 44,609 51,865 54,333 57,760 61,288 64,848 5.7%
Capacity 51,320 56,320 61,020 66,820 68,420 72,620 73,620 73,620 75,620 77,620 1.7%
Utilization Rate 69% 73% 78% 74% 65% 71% 74% 78% 81% 84%
Throughput yoy% 16% 17% 16% 4% -10% 16% 5% 6% 6% 6%
Capacity yoy% 11% 10% 8% 10% 2% 6% 1% 0% 3% 3%
Bohai Rim
Throughput 13,800 16,860 20,370 23,011 23,542 27,366 31,197 35,078 38,586 42,044 11.3%
Capacity 22,805 24,405 30,405 33,305 33,305 34,805 36,605 38,105 41,005 43,805 5.9%
Utilization Rate 61% 69% 67% 69% 71% 79% 85% 92% 94% 96%
Throughput yoy% 24% 22% 21% 13% 2% 16% 14% 12% 10% 9%
Capacity yoy% 26% 7% 25% 10% 0% 5% 5% 4% 8% 7%
渐飞研究报告 - http://bg.panlv.net
July 27, 2011 Asia Pacific: Conglomerates
Goldman Sachs Global Investment Research 13
Near-term slowdown of throughput growth in bulk ports
China’s fast-growing economy has underpinned the robust demand for commodities over
the past decade, which had grown 11% CAGR since 2001. As a result, China’s shares of
global iron ore, coal and oil demand reached 62%, 48% and 11% last year, up from 19%,
18% and 6% a decade ago. We believe the bulk ports will benefit from continued growth of
commodity demand in China over the long run. In near term, however, we share our
shipping analyst, Tom Kim’s cautious view, as several demand drivers are decelerating.
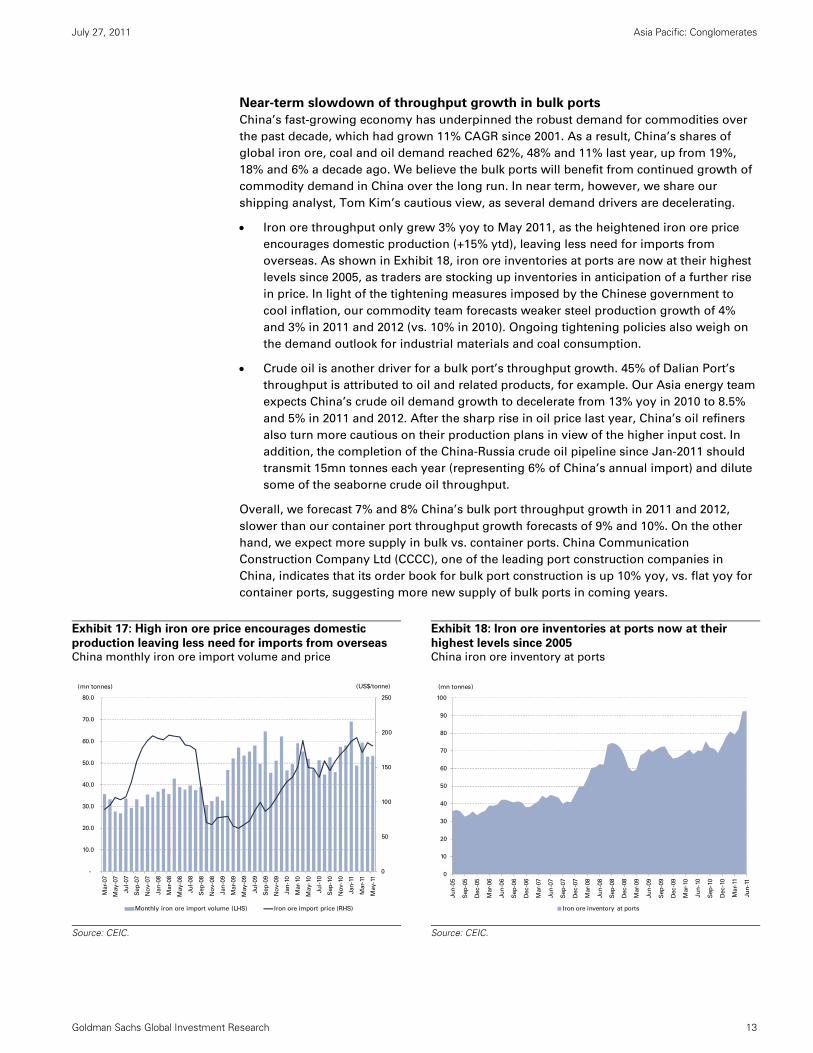
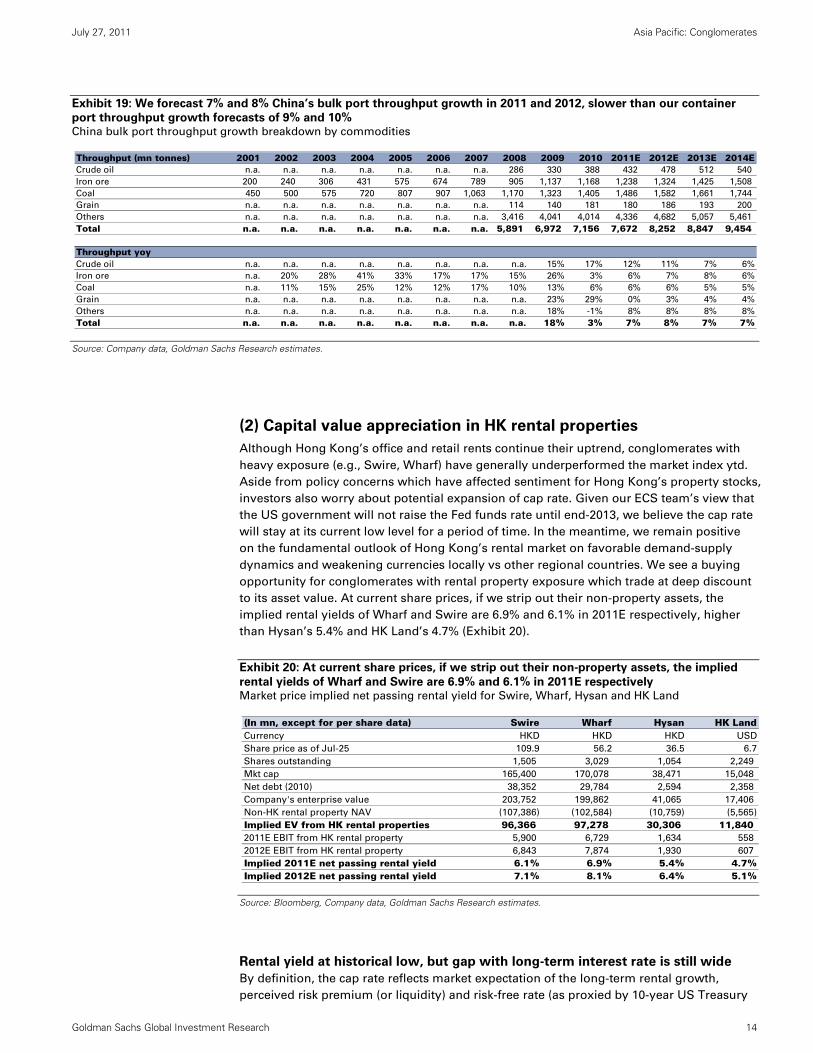
Iron ore throughput only grew 3% yoy to May 2011, as the heightened iron ore price
encourages domestic production (+15% ytd), leaving less need for imports from
overseas. As shown in Exhibit 18, iron ore inventories at ports are now at their highest
levels since 2005, as traders are stocking up inventories in anticipation of a further rise
in price. In light of the tightening measures imposed by the Chinese government to
cool inflation, our commodity team forecasts weaker steel production growth of 4%
and 3% in 2011 and 2012 (vs. 10% in 2010). Ongoing tightening policies also weigh on
the demand outlook for industrial materials and coal consumption.
Crude oil is another driver for a bulk port’s throughput growth. 45% of Dalian Port’s
throughput is attributed to oil and related products, for example. Our Asia energy team
expects China’s crude oil demand growth to decelerate from 13% yoy in 2010 to 8.5%
and 5% in 2011 and 2012. After the sharp rise in oil price last year, China’s oil refiners
also turn more cautious on their production plans in view of the higher input cost. In
addition, the completion of the China-Russia crude oil pipeline since Jan-2011 should
transmit 15mn tonnes each year (representing 6% of China’s annual import) and dilute
some of the seaborne crude oil throughput.
Overall, we forecast 7% and 8% China’s bulk port throughput growth in 2011 and 2012,
slower than our container port throughput growth forecasts of 9% and 10%. On the other
hand, we expect more supply in bulk vs. container ports. China Communication
Construction Company Ltd (CCCC), one of the leading port construction companies in
China, indicates that its order book for bulk port construction is up 10% yoy, vs. flat yoy for
container ports, suggesting more new supply of bulk ports in coming years.
Exhibit 17: High iron ore price encourages domestic
production leaving less need for imports from overseas China monthly iron ore import volume and price
Exhibit 18: Iron ore inventories at ports now at their
highest levels since 2005 China iron ore inventory at ports
Source: CEIC.
Source: CEIC.
0
50
100
150
200
250
-
10.0
20.0
30.0
40.0
50.0
60.0
70.0
80.0
Mar-
07
May-0
7
Ju
l-07
Sep
-07
No
v-0
7
Jan
-08
Mar-
08
May-0
8
Ju
l-08
Sep
-08
No
v-0
8
Jan
-09
Mar-
09
May-0
9
Ju
l-09
Sep
-09
No
v-0
9
Jan
-10
Mar-
10
May-1
0
Ju
l-10
Sep
-10
No
v-1
0
Jan
-11
Mar-
11
May-1
1
Monthly iron ore import volume (LHS) Iron ore import price (RHS)
(US$/tonne)(mn tonnes)
0
10
20
30
40
50
60
70
80
90
100
Ju
n-0
5
Sep
-05
Dec-0
5
Mar-
06
Ju
n-0
6
Sep
-06
Dec-0
6
Mar-
07
Ju
n-0
7
Sep
-07
Dec-0
7
Mar-
08
Ju
n-0
8
Sep
-08
Dec-0
8
Mar-
09
Ju
n-0
9
Sep
-09
Dec-0
9
Mar-
10
Ju
n-1
0
Sep
-10
Dec-1
0
Mar-
11
Ju
n-1
1
Iron ore inventory at ports
(mn tonnes)
渐飞研究报告 - http://bg.panlv.net
July 27, 2011 Asia Pacific: Conglomerates
Goldman Sachs Global Investment Research 14
Exhibit 19: We forecast 7% and 8% China’s bulk port throughput growth in 2011 and 2012, slower than our container
port throughput growth forecasts of 9% and 10% China bulk port throughput growth breakdown by commodities
Source: Company data, Goldman Sachs Research estimates.
(2) Capital value appreciation in HK rental properties
Although Hong Kong’s office and retail rents continue their uptrend, conglomerates with
heavy exposure (e.g., Swire, Wharf) have generally underperformed the market index ytd.
Aside from policy concerns which have affected sentiment for Hong Kong’s property stocks,
investors also worry about potential expansion of cap rate. Given our ECS team’s view that
the US government will not raise the Fed funds rate until end-2013, we believe the cap rate
will stay at its current low level for a period of time. In the meantime, we remain positive
on the fundamental outlook of Hong Kong’s rental market on favorable demand-supply
dynamics and weakening currencies locally vs other regional countries. We see a buying
opportunity for conglomerates with rental property exposure which trade at deep discount
to its asset value. At current share prices, if we strip out their non-property assets, the
implied rental yields of Wharf and Swire are 6.9% and 6.1% in 2011E respectively, higher
than Hysan’s 5.4% and HK Land’s 4.7% (Exhibit 20).
Exhibit 20: At current share prices, if we strip out their non-property assets, the implied
rental yields of Wharf and Swire are 6.9% and 6.1% in 2011E respectively Market price implied net passing rental yield for Swire, Wharf, Hysan and HK Land
Source: Bloomberg, Company data, Goldman Sachs Research estimates.
Rental yield at historical low, but gap with long-term interest rate is still wide
By definition, the cap rate reflects market expectation of the long-term rental growth,
perceived risk premium (or liquidity) and risk-free rate (as proxied by 10-year US Treasury
Throughput (mn tonnes) 2001 2002 2003 2004 2005 2006 2007 2008 2009 2010 2011E 2012E 2013E 2014ECrude oil n.a. n.a. n.a. n.a. n.a. n.a. n.a. 286 330 388 432 478 512 540
Iron ore 200 240 306 431 575 674 789 905 1,137 1,168 1,238 1,324 1,425 1,508
Coal 450 500 575 720 807 907 1,063 1,170 1,323 1,405 1,486 1,582 1,661 1,744
Grain n.a. n.a. n.a. n.a. n.a. n.a. n.a. 114 140 181 180 186 193 200
Others n.a. n.a. n.a. n.a. n.a. n.a. n.a. 3,416 4,041 4,014 4,336 4,682 5,057 5,461
Total n.a. n.a. n.a. n.a. n.a. n.a. n.a. 5,891 6,972 7,156 7,672 8,252 8,847 9,454
Throughput yoyCrude oil n.a. n.a. n.a. n.a. n.a. n.a. n.a. n.a. 15% 17% 12% 11% 7% 6%
Iron ore n.a. 20% 28% 41% 33% 17% 17% 15% 26% 3% 6% 7% 8% 6%
Coal n.a. 11% 15% 25% 12% 12% 17% 10% 13% 6% 6% 6% 5% 5%
Grain n.a. n.a. n.a. n.a. n.a. n.a. n.a. n.a. 23% 29% 0% 3% 4% 4%
Others n.a. n.a. n.a. n.a. n.a. n.a. n.a. n.a. 18% -1% 8% 8% 8% 8%
Total n.a. n.a. n.a. n.a. n.a. n.a. n.a. n.a. 18% 3% 7% 8% 7% 7%
(In mn, except for per share data) Swire Wharf Hysan HK LandCurrency HKD HKD HKD USD
Share price as of Jul-25 109.9 56.2 36.5 6.7
Shares outstanding 1,505 3,029 1,054 2,249
Mkt cap 165,400 170,078 38,471 15,048
Net debt (2010) 38,352 29,784 2,594 2,358
Company's enterprise value 203,752 199,862 41,065 17,406
Non-HK rental property NAV (107,386) (102,584) (10,759) (5,565)
Implied EV from HK rental properties 96,366 97,278 30,306 11,840 2011E EBIT from HK rental property 5,900 6,729 1,634 558
2012E EBIT from HK rental property 6,843 7,874 1,930 607
Implied 2011E net passing rental yield 6.1% 6.9% 5.4% 4.7%Implied 2012E net passing rental yield 7.1% 8.1% 6.4% 5.1%
渐飞研究报告 - http://bg.panlv.net
July 27, 2011 Asia Pacific: Conglomerates
Goldman Sachs Global Investment Research 15
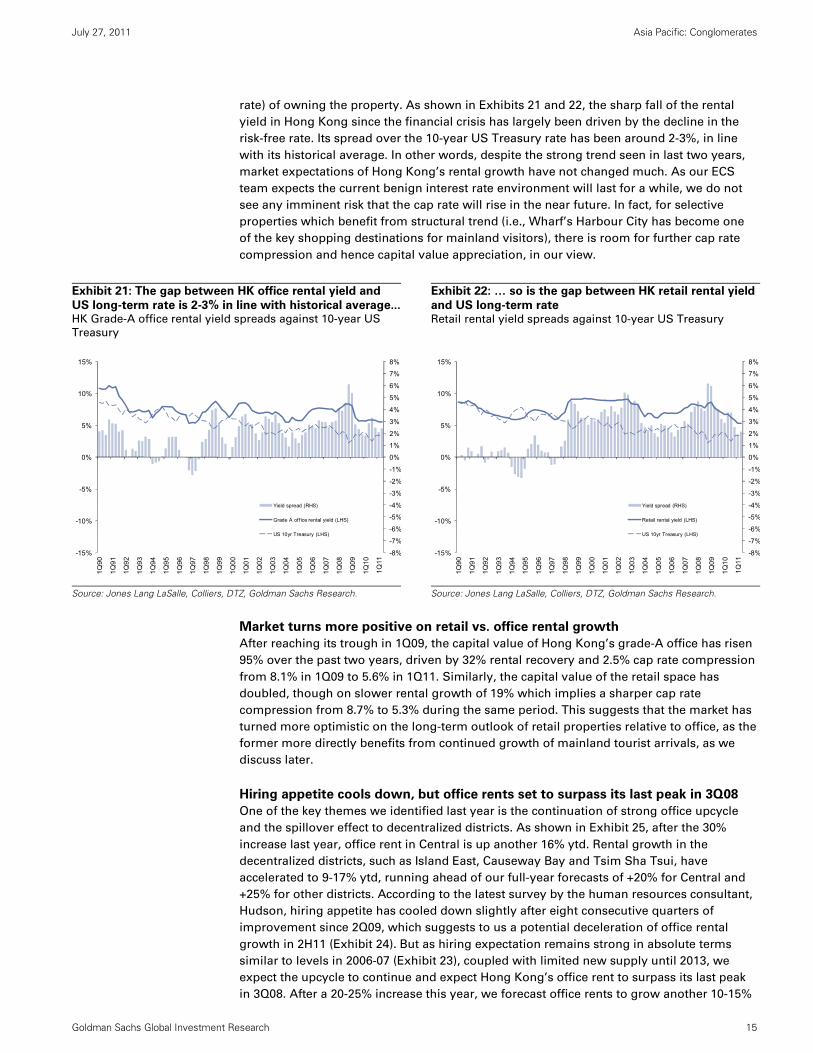
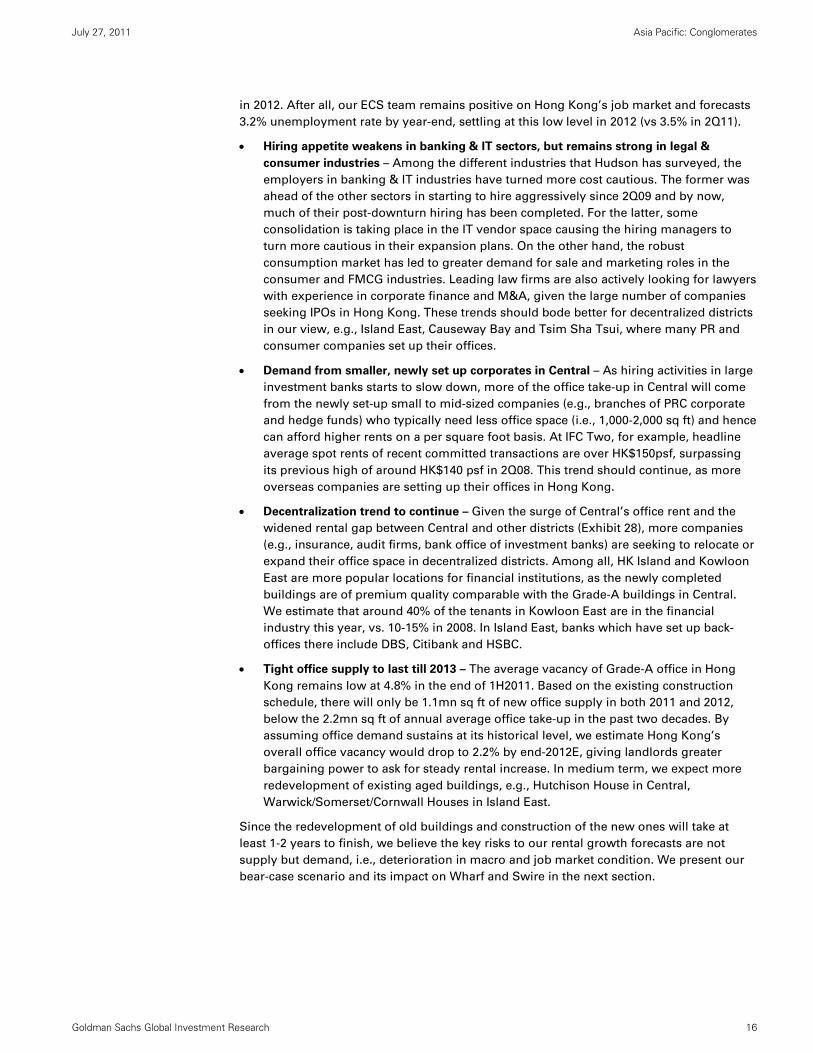
rate) of owning the property. As shown in Exhibits 21 and 22, the sharp fall of the rental
yield in Hong Kong since the financial crisis has largely been driven by the decline in the
risk-free rate. Its spread over the 10-year US Treasury rate has been around 2-3%, in line
with its historical average. In other words, despite the strong trend seen in last two years,
market expectations of Hong Kong’s rental growth have not changed much. As our ECS
team expects the current benign interest rate environment will last for a while, we do not
see any imminent risk that the cap rate will rise in the near future. In fact, for selective
properties which benefit from structural trend (i.e., Wharf’s Harbour City has become one
of the key shopping destinations for mainland visitors), there is room for further cap rate
compression and hence capital value appreciation, in our view.
Exhibit 21: The gap between HK office rental yield and
US long-term rate is 2-3% in line with historical average...HK Grade-A office rental yield spreads against 10-year US
Treasury
Exhibit 22: … so is the gap between HK retail rental yield
and US long-term rate Retail rental yield spreads against 10-year US Treasury
Source: Jones Lang LaSalle, Colliers, DTZ, Goldman Sachs Research.
Source: Jones Lang LaSalle, Colliers, DTZ, Goldman Sachs Research.
Market turns more positive on retail vs. office rental growth
After reaching its trough in 1Q09, the capital value of Hong Kong’s grade-A office has risen
95% over the past two years, driven by 32% rental recovery and 2.5% cap rate compression
from 8.1% in 1Q09 to 5.6% in 1Q11. Similarly, the capital value of the retail space has
doubled, though on slower rental growth of 19% which implies a sharper cap rate
compression from 8.7% to 5.3% during the same period. This suggests that the market has
turned more optimistic on the long-term outlook of retail properties relative to office, as the
former more directly benefits from continued growth of mainland tourist arrivals, as we
discuss later.
Hiring appetite cools down, but office rents set to surpass its last peak in 3Q08
One of the key themes we identified last year is the continuation of strong office upcycle
and the spillover effect to decentralized districts. As shown in Exhibit 25, after the 30%
increase last year, office rent in Central is up another 16% ytd. Rental growth in the
decentralized districts, such as Island East, Causeway Bay and Tsim Sha Tsui, have
accelerated to 9-17% ytd, running ahead of our full-year forecasts of +20% for Central and
+25% for other districts. According to the latest survey by the human resources consultant,
Hudson, hiring appetite has cooled down slightly after eight consecutive quarters of
improvement since 2Q09, which suggests to us a potential deceleration of office rental
growth in 2H11 (Exhibit 24). But as hiring expectation remains strong in absolute terms
similar to levels in 2006-07 (Exhibit 23), coupled with limited new supply until 2013, we
expect the upcycle to continue and expect Hong Kong’s office rent to surpass its last peak
in 3Q08. After a 20-25% increase this year, we forecast office rents to grow another 10-15%
-8%
-7%
-6%
-5%
-4%
-3%
-2%
-1%
0%
1%
2%
3%
4%
5%
6%
7%
8%
-15%
-10%
-5%
0%
5%
10%
15%
1Q
90
1Q
91
1Q
92
1Q
93
1Q
94
1Q
95
1Q
96
1Q
97
1Q
98
1Q
99
1Q
00
1Q
01
1Q
02
1Q
03
1Q
04
1Q
05
1Q
06
1Q
07
1Q
08
1Q
09
1Q
10
1Q
11
Yield spread (RHS)
Grade A office rental yield (LHS)
US 10yr Treasury (LHS)
-8%
-7%
-6%
-5%
-4%
-3%
-2%
-1%
0%
1%
2%
3%
4%
5%
6%
7%
8%
-15%
-10%
-5%
0%
5%
10%
15%
1Q
90
1Q
91
1Q
92
1Q
93
1Q
94
1Q
95
1Q
96
1Q
97
1Q
98
1Q
99
1Q
00
1Q
01
1Q
02
1Q
03
1Q
04
1Q
05
1Q
06
1Q
07
1Q
08
1Q
09
1Q
10
1Q
11
Yield spread (RHS)
Retail rental yield (LHS)
US 10yr Treasury (LHS)
渐飞研究报告 - http://bg.panlv.net
July 27, 2011 Asia Pacific: Conglomerates
Goldman Sachs Global Investment Research 16
in 2012. After all, our ECS team remains positive on Hong Kong’s job market and forecasts
3.2% unemployment rate by year-end, settling at this low level in 2012 (vs 3.5% in 2Q11).
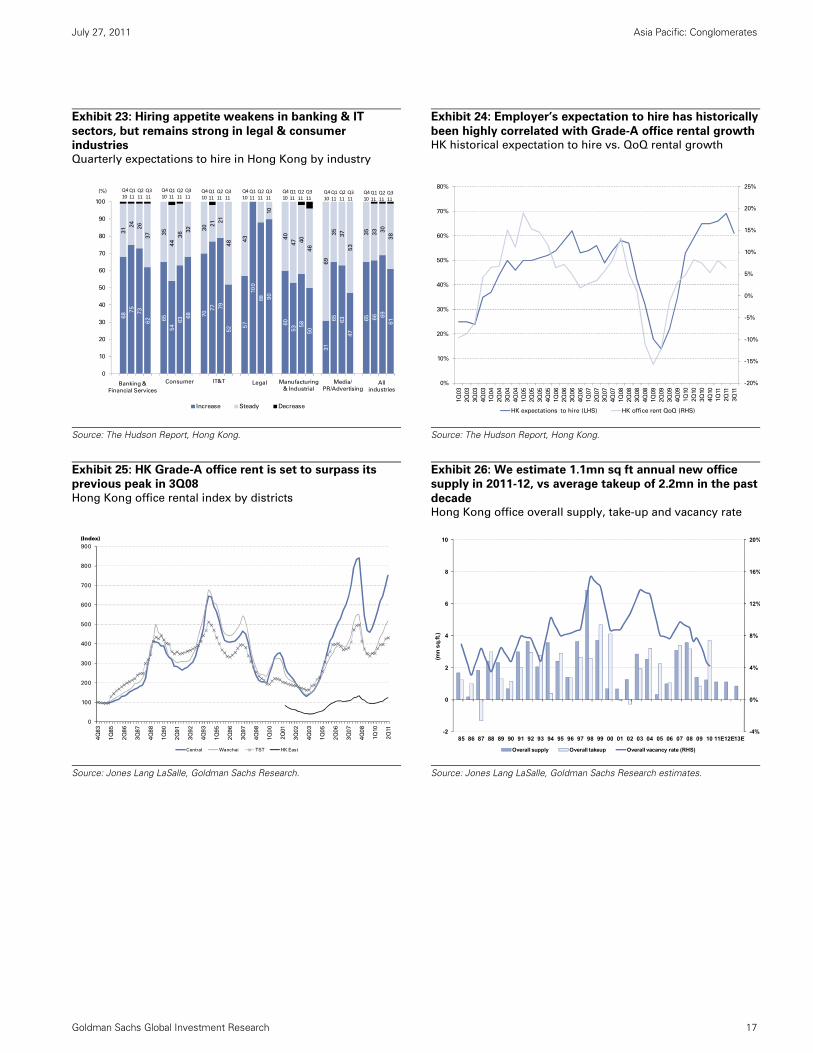
Hiring appetite weakens in banking & IT sectors, but remains strong in legal &
consumer industries – Among the different industries that Hudson has surveyed, the
employers in banking & IT industries have turned more cost cautious. The former was
ahead of the other sectors in starting to hire aggressively since 2Q09 and by now,
much of their post-downturn hiring has been completed. For the latter, some
consolidation is taking place in the IT vendor space causing the hiring managers to
turn more cautious in their expansion plans. On the other hand, the robust
consumption market has led to greater demand for sale and marketing roles in the
consumer and FMCG industries. Leading law firms are also actively looking for lawyers
with experience in corporate finance and M&A, given the large number of companies
seeking IPOs in Hong Kong. These trends should bode better for decentralized districts
in our view, e.g., Island East, Causeway Bay and Tsim Sha Tsui, where many PR and
consumer companies set up their offices.
Demand from smaller, newly set up corporates in Central – As hiring activities in large
investment banks starts to slow down, more of the office take-up in Central will come
from the newly set-up small to mid-sized companies (e.g., branches of PRC corporate
and hedge funds) who typically need less office space (i.e., 1,000-2,000 sq ft) and hence
can afford higher rents on a per square foot basis. At IFC Two, for example, headline
average spot rents of recent committed transactions are over HK$150psf, surpassing
its previous high of around HK$140 psf in 2Q08. This trend should continue, as more
overseas companies are setting up their offices in Hong Kong.
Decentralization trend to continue – Given the surge of Central’s office rent and the
widened rental gap between Central and other districts (Exhibit 28), more companies
(e.g., insurance, audit firms, bank office of investment banks) are seeking to relocate or
expand their office space in decentralized districts. Among all, HK Island and Kowloon
East are more popular locations for financial institutions, as the newly completed
buildings are of premium quality comparable with the Grade-A buildings in Central.
We estimate that around 40% of the tenants in Kowloon East are in the financial
industry this year, vs. 10-15% in 2008. In Island East, banks which have set up back-
offices there include DBS, Citibank and HSBC.
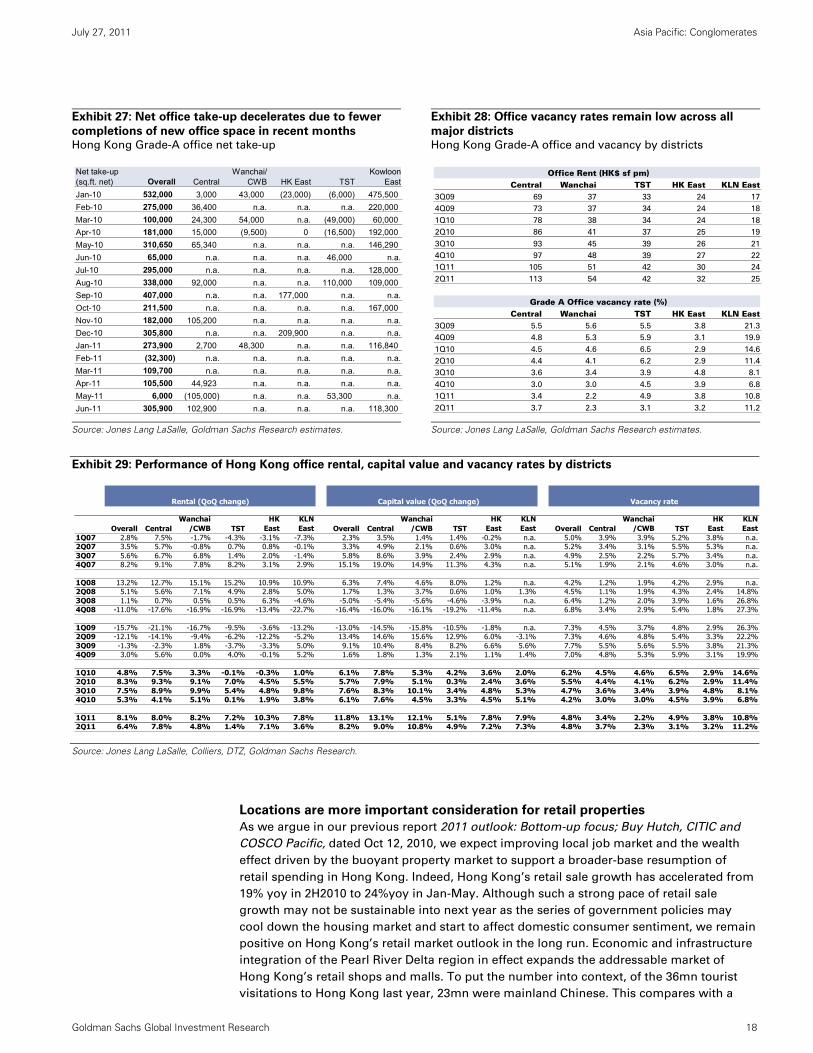
Tight office supply to last till 2013 – The average vacancy of Grade-A office in Hong
Kong remains low at 4.8% in the end of 1H2011. Based on the existing construction
schedule, there will only be 1.1mn sq ft of new office supply in both 2011 and 2012,
below the 2.2mn sq ft of annual average office take-up in the past two decades. By
assuming office demand sustains at its historical level, we estimate Hong Kong’s
overall office vacancy would drop to 2.2% by end-2012E, giving landlords greater
bargaining power to ask for steady rental increase. In medium term, we expect more
redevelopment of existing aged buildings, e.g., Hutchison House in Central,
Warwick/Somerset/Cornwall Houses in Island East.
Since the redevelopment of old buildings and construction of the new ones will take at
least 1-2 years to finish, we believe the key risks to our rental growth forecasts are not
supply but demand, i.e., deterioration in macro and job market condition. We present our
bear-case scenario and its impact on Wharf and Swire in the next section.
渐飞研究报告 - http://bg.panlv.net
July 27, 2011 Asia Pacific: Conglomerates
Goldman Sachs Global Investment Research 17
Exhibit 23: Hiring appetite weakens in banking & IT
sectors, but remains strong in legal & consumer
industries Quarterly expectations to hire in Hong Kong by industry
Exhibit 24: Employer’s expectation to hire has historically
been highly correlated with Grade-A office rental growthHK historical expectation to hire vs. QoQ rental growth
Source: The Hudson Report, Hong Kong.
Source: The Hudson Report, Hong Kong.
Exhibit 25: HK Grade-A office rent is set to surpass its
previous peak in 3Q08
Hong Kong office rental index by districts
Exhibit 26: We estimate 1.1mn sq ft annual new office
supply in 2011-12, vs average takeup of 2.2mn in the past
decade Hong Kong office overall supply, take-up and vacancy rate
Source: Jones Lang LaSalle, Goldman Sachs Research.
Source: Jones Lang LaSalle, Goldman Sachs Research estimates.
68
65 7
0
57 60
31
65
31
35 3
0
43 40
69
35
75
54
77
10
0
53
65 66
24
44
21
47
35
33
73
63
79
88
58 6
3 69
26
36
21
40
37 3
0
62 6
8
52
90
50
47
61
37
32
48
10
46 53
38
0
10
20
30
40
50
60
70
80
90
100
Increase Steady Decrease
IT&TConsumerBanking &
Financial Services
Legal Manufacturing
& Industrial
Media/
PR/AdvertisingAll
industries
Q410
Q111
Q211
Q311
(%) Q410
Q111
Q211
Q311
Q410
Q111
Q211
Q311
Q410
Q111
Q211
Q311
Q410
Q111
Q211
Q311
Q410
Q111
Q211
Q311
Q410
Q111
Q211
Q311
-20%
-15%
-10%
-5%
0%
5%
10%
15%
20%
25%
0%
10%
20%
30%
40%
50%
60%
70%
80%
1Q
03
2Q
03
3Q
03
4Q
03
1Q
04
2Q
04
3Q
04
4Q
04
1Q
05
2Q
05
3Q
05
4Q
05
1Q
06
2Q
06
3Q
06
4Q
06
1Q
07
2Q
07
3Q
07
4Q
07
1Q
08
2Q
08
3Q
08
4Q
08
1Q
09
2Q
09
3Q
09
4Q
09
1Q
10
2Q
10
3Q
10
4Q
10
1Q
11
2Q
11
3Q
11
HK expectations to hire (LHS) HK office rent QoQ (RHS)
0
100
200
300
400
500
600
700
800
900
4Q
83
1Q
85
2Q
86
3Q
87
4Q
88
1Q
90
2Q
91
3Q
92
4Q
93
1Q
95
2Q
96
3Q
97
4Q
98
1Q
00
2Q
01
3Q
02
4Q
03
1Q
05
2Q
06
3Q
07
4Q
08
1Q
10
2Q
11
(Index)
Central Wanchai TST HK East
-4%
0%
4%
8%
12%
16%
20%
-2
0
2
4
6
8
10
85 86 87 88 89 90 91 92 93 94 95 96 97 98 99 00 01 02 03 04 05 06 07 08 09 10 11E12E13E
(mn
sq
.ft.)
Overall supply Overall takeup Overall vacancy rate (RHS)
渐飞研究报告 - http://bg.panlv.net
July 27, 2011 Asia Pacific: Conglomerates
Goldman Sachs Global Investment Research 18
Exhibit 27: Net office take-up decelerates due to fewer
completions of new office space in recent months Hong Kong Grade-A office net take-up
Exhibit 28: Office vacancy rates remain low across all
major districts Hong Kong Grade-A office and vacancy by districts
Source: Jones Lang LaSalle, Goldman Sachs Research estimates.
Source: Jones Lang LaSalle, Goldman Sachs Research estimates.
Exhibit 29: Performance of Hong Kong office rental, capital value and vacancy rates by districts
Source: Jones Lang LaSalle, Colliers, DTZ, Goldman Sachs Research.
Locations are more important consideration for retail properties
As we argue in our previous report 2011 outlook: Bottom-up focus; Buy Hutch, CITIC and
COSCO Pacific, dated Oct 12, 2010, we expect improving local job market and the wealth
effect driven by the buoyant property market to support a broader-base resumption of
retail spending in Hong Kong. Indeed, Hong Kong’s retail sale growth has accelerated from
19% yoy in 2H2010 to 24%yoy in Jan-May. Although such a strong pace of retail sale
growth may not be sustainable into next year as the series of government policies may
cool down the housing market and start to affect domestic consumer sentiment, we remain
positive on Hong Kong’s retail market outlook in the long run. Economic and infrastructure
integration of the Pearl River Delta region in effect expands the addressable market of
Hong Kong’s retail shops and malls. To put the number into context, of the 36mn tourist
visitations to Hong Kong last year, 23mn were mainland Chinese. This compares with a
Net take-up(sq.ft. net) Overall Central
Wanchai/ CWB HK East TST
Kowloon East
Jan-10 532,000 3,000 43,000 (23,000) (6,000) 475,500
Feb-10 275,000 36,400 n.a. n.a. n.a. 220,000
Mar-10 100,000 24,300 54,000 n.a. (49,000) 60,000
Apr-10 181,000 15,000 (9,500) 0 (16,500) 192,000
May-10 310,650 65,340 n.a. n.a. n.a. 146,290
Jun-10 65,000 n.a. n.a. n.a. 46,000 n.a.
Jul-10 295,000 n.a. n.a. n.a. n.a. 128,000
Aug-10 338,000 92,000 n.a. n.a. 110,000 109,000
Sep-10 407,000 n.a. n.a. 177,000 n.a. n.a.
Oct-10 211,500 n.a. n.a. n.a. n.a. 167,000
Nov-10 182,000 105,200 n.a. n.a. n.a. n.a.
Dec-10 305,800 n.a. n.a. 209,900 n.a. n.a.
Jan-11 273,900 2,700 48,300 n.a. n.a. 116,840
Feb-11 (32,300) n.a. n.a. n.a. n.a. n.a.
Mar-11 109,700 n.a. n.a. n.a. n.a. n.a.
Apr-11 105,500 44,923 n.a. n.a. n.a. n.a.
May-11 6,000 (105,000) n.a. n.a. 53,300 n.a.
Jun-11 305,900 102,900 n.a. n.a. n.a. 118,300
Central Wanchai TST HK East KLN East3Q09 69 37 33 24 17
4Q09 73 37 34 24 18
1Q10 78 38 34 24 18
2Q10 86 41 37 25 19
3Q10 93 45 39 26 21
4Q10 97 48 39 27 22
1Q11 105 51 42 30 24
2Q11 113 54 42 32 25
Central Wanchai TST HK East KLN East3Q09 5.5 5.6 5.5 3.8 21.3
4Q09 4.8 5.3 5.9 3.1 19.9
1Q10 4.5 4.6 6.5 2.9 14.6
2Q10 4.4 4.1 6.2 2.9 11.4
3Q10 3.6 3.4 3.9 4.8 8.1
4Q10 3.0 3.0 4.5 3.9 6.8
1Q11 3.4 2.2 4.9 3.8 10.8
2Q11 3.7 2.3 3.1 3.2 11.2
Grade A Office vacancy rate (%)
Office Rent (HK$ sf pm)
Overall CentralWanchai
/CWB TSTHK
EastKLNEast Overall Central
Wanchai/CWB TST
HKEast
KLNEast Overall Central
Wanchai/CWB TST
HKEast
KLNEast
1Q07 2.8% 7.5% -1.7% -4.3% -3.1% -7.3% 2.3% 3.5% 1.4% 1.4% -0.2% n.a. 5.0% 3.9% 3.9% 5.2% 3.8% n.a.2Q07 3.5% 5.7% -0.8% 0.7% 0.8% -0.1% 3.3% 4.9% 2.1% 0.6% 3.0% n.a. 5.2% 3.4% 3.1% 5.5% 5.3% n.a.3Q07 5.6% 6.7% 6.8% 1.4% 2.0% -1.4% 5.8% 8.6% 3.9% 2.4% 2.9% n.a. 4.9% 2.5% 2.2% 5.7% 3.4% n.a.4Q07 8.2% 9.1% 7.8% 8.2% 3.1% 2.9% 15.1% 19.0% 14.9% 11.3% 4.3% n.a. 5.1% 1.9% 2.1% 4.6% 3.0% n.a.
1Q08 13.2% 12.7% 15.1% 15.2% 10.9% 10.9% 6.3% 7.4% 4.6% 8.0% 1.2% n.a. 4.2% 1.2% 1.9% 4.2% 2.9% n.a.2Q08 5.1% 5.6% 7.1% 4.9% 2.8% 5.0% 1.7% 1.3% 3.7% 0.6% 1.0% 1.3% 4.5% 1.1% 1.9% 4.3% 2.4% 14.8%3Q08 1.1% 0.7% 0.5% 0.5% 6.3% -4.6% -5.0% -5.4% -5.6% -4.6% -3.9% n.a. 6.4% 1.2% 2.0% 3.9% 1.6% 26.8%4Q08 -11.0% -17.6% -16.9% -16.9% -13.4% -22.7% -16.4% -16.0% -16.1% -19.2% -11.4% n.a. 6.8% 3.4% 2.9% 5.4% 1.8% 27.3%
1Q09 -15.7% -21.1% -16.7% -9.5% -3.6% -13.2% -13.0% -14.5% -15.8% -10.5% -1.8% n.a. 7.3% 4.5% 3.7% 4.8% 2.9% 26.3%2Q09 -12.1% -14.1% -9.4% -6.2% -12.2% -5.2% 13.4% 14.6% 15.6% 12.9% 6.0% -3.1% 7.3% 4.6% 4.8% 5.4% 3.3% 22.2%3Q09 -1.3% -2.3% 1.8% -3.7% -3.3% 5.0% 9.1% 10.4% 8.4% 8.2% 6.6% 5.6% 7.7% 5.5% 5.6% 5.5% 3.8% 21.3%4Q09 3.0% 5.6% 0.0% 4.0% -0.1% 5.2% 1.6% 1.8% 1.3% 2.1% 1.1% 1.4% 7.0% 4.8% 5.3% 5.9% 3.1% 19.9%
1Q10 4.8% 7.5% 3.3% -0.1% -0.3% 1.0% 6.1% 7.8% 5.3% 4.2% 3.6% 2.0% 6.2% 4.5% 4.6% 6.5% 2.9% 14.6%2Q10 8.3% 9.3% 9.1% 7.0% 4.5% 5.5% 5.7% 7.9% 5.1% 0.3% 2.4% 3.6% 5.5% 4.4% 4.1% 6.2% 2.9% 11.4%3Q10 7.5% 8.9% 9.9% 5.4% 4.8% 9.8% 7.6% 8.3% 10.1% 3.4% 4.8% 5.3% 4.7% 3.6% 3.4% 3.9% 4.8% 8.1%4Q10 5.3% 4.1% 5.1% 0.1% 1.9% 3.8% 6.1% 7.6% 4.5% 3.3% 4.5% 5.1% 4.2% 3.0% 3.0% 4.5% 3.9% 6.8%
1Q11 8.1% 8.0% 8.2% 7.2% 10.3% 7.8% 11.8% 13.1% 12.1% 5.1% 7.8% 7.9% 4.8% 3.4% 2.2% 4.9% 3.8% 10.8%2Q11 6.4% 7.8% 4.8% 1.4% 7.1% 3.6% 8.2% 9.0% 10.8% 4.9% 7.2% 7.3% 4.8% 3.7% 2.3% 3.1% 3.2% 11.2%
Rental (QoQ change) Capital value (QoQ change) Vacancy rate
渐飞研究报告 - http://bg.panlv.net
July 27, 2011 Asia Pacific: Conglomerates
Goldman Sachs Global Investment Research 19
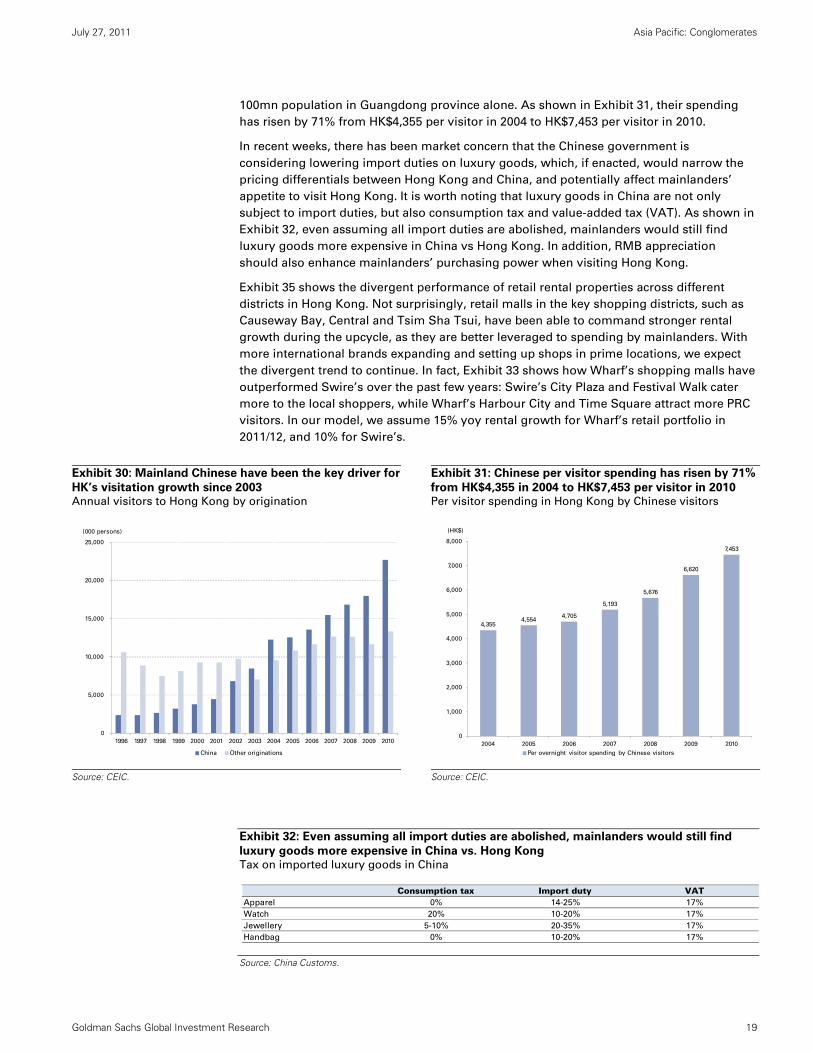
100mn population in Guangdong province alone. As shown in Exhibit 31, their spending
has risen by 71% from HK$4,355 per visitor in 2004 to HK$7,453 per visitor in 2010.
In recent weeks, there has been market concern that the Chinese government is
considering lowering import duties on luxury goods, which, if enacted, would narrow the
pricing differentials between Hong Kong and China, and potentially affect mainlanders’
appetite to visit Hong Kong. It is worth noting that luxury goods in China are not only
subject to import duties, but also consumption tax and value-added tax (VAT). As shown in
Exhibit 32, even assuming all import duties are abolished, mainlanders would still find
luxury goods more expensive in China vs Hong Kong. In addition, RMB appreciation
should also enhance mainlanders’ purchasing power when visiting Hong Kong.
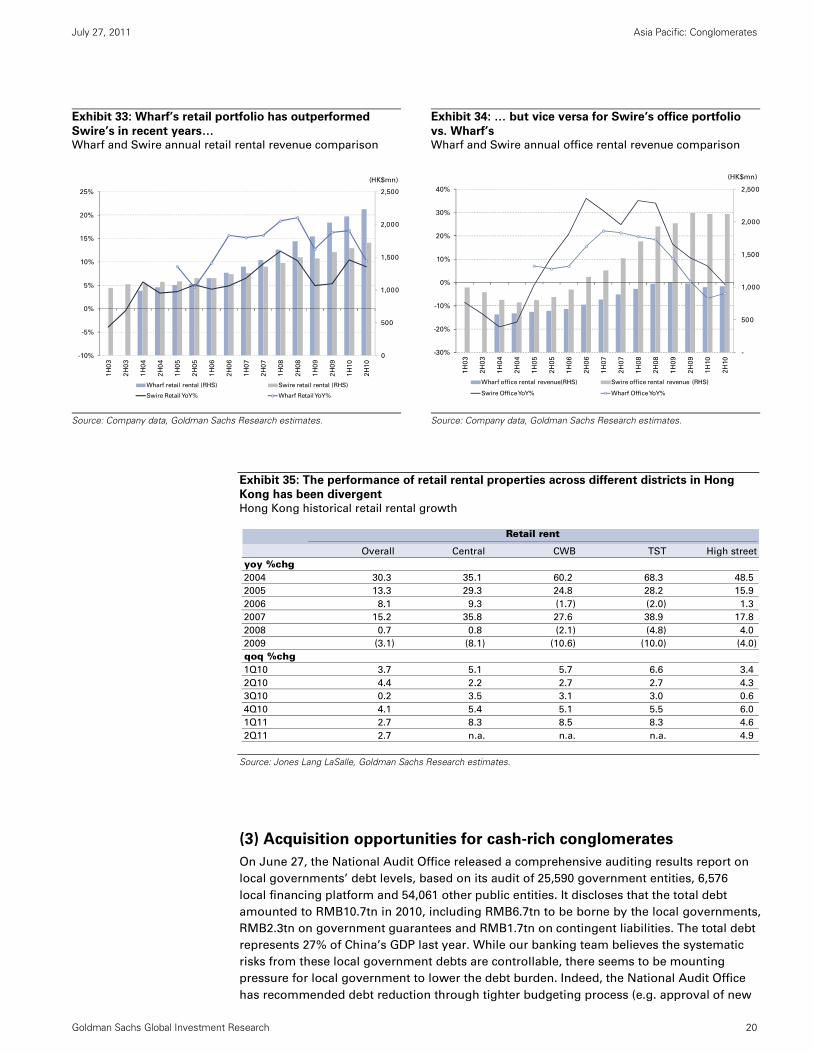
Exhibit 35 shows the divergent performance of retail rental properties across different
districts in Hong Kong. Not surprisingly, retail malls in the key shopping districts, such as
Causeway Bay, Central and Tsim Sha Tsui, have been able to command stronger rental
growth during the upcycle, as they are better leveraged to spending by mainlanders. With
more international brands expanding and setting up shops in prime locations, we expect
the divergent trend to continue. In fact, Exhibit 33 shows how Wharf’s shopping malls have
outperformed Swire’s over the past few years: Swire’s City Plaza and Festival Walk cater
more to the local shoppers, while Wharf’s Harbour City and Time Square attract more PRC
visitors. In our model, we assume 15% yoy rental growth for Wharf’s retail portfolio in
2011/12, and 10% for Swire’s.
Exhibit 30: Mainland Chinese have been the key driver for
HK’s visitation growth since 2003 Annual visitors to Hong Kong by origination
Exhibit 31: Chinese per visitor spending has risen by 71%
from HK$4,355 in 2004 to HK$7,453 per visitor in 2010 Per visitor spending in Hong Kong by Chinese visitors
Source: CEIC.
Source: CEIC.
Exhibit 32: Even assuming all import duties are abolished, mainlanders would still find
luxury goods more expensive in China vs. Hong Kong Tax on imported luxury goods in China
Source: China Customs.
0
5,000
10,000
15,000
20,000
25,000
1996 1997 1998 1999 2000 2001 2002 2003 2004 2005 2006 2007 2008 2009 2010
China Other originations
(000 persons)
4,3554,554
4,705
5,193
5,676
6,620
7,453
0
1,000
2,000
3,000
4,000
5,000
6,000
7,000
8,000
2004 2005 2006 2007 2008 2009 2010
Per overnight visitor spending by Chinese visitors
(HK$)
Consumption tax Import duty VATApparel 0% 14-25% 17%
Watch 20% 10-20% 17%
Jewellery 5-10% 20-35% 17%
Handbag 0% 10-20% 17%
渐飞研究报告 - http://bg.panlv.net
July 27, 2011 Asia Pacific: Conglomerates
Goldman Sachs Global Investment Research 20
Exhibit 33: Wharf’s retail portfolio has outperformed
Swire’s in recent years… Wharf and Swire annual retail rental revenue comparison
Exhibit 34: … but vice versa for Swire’s office portfolio
vs. Wharf’s Wharf and Swire annual office rental revenue comparison
Source: Company data, Goldman Sachs Research estimates.
Source: Company data, Goldman Sachs Research estimates.
Exhibit 35: The performance of retail rental properties across different districts in Hong
Kong has been divergent
Hong Kong historical retail rental growth
Source: Jones Lang LaSalle, Goldman Sachs Research estimates.
(3) Acquisition opportunities for cash-rich conglomerates
On June 27, the National Audit Office released a comprehensive auditing results report on
local governments’ debt levels, based on its audit of 25,590 government entities, 6,576
local financing platform and 54,061 other public entities. It discloses that the total debt
amounted to RMB10.7tn in 2010, including RMB6.7tn to be borne by the local governments,
RMB2.3tn on government guarantees and RMB1.7tn on contingent liabilities. The total debt
represents 27% of China’s GDP last year. While our banking team believes the systematic
risks from these local government debts are controllable, there seems to be mounting
pressure for local government to lower the debt burden. Indeed, the National Audit Office
has recommended debt reduction through tighter budgeting process (e.g. approval of new
0
500
1,000
1,500
2,000
2,500
-10%
-5%
0%
5%
10%
15%
20%
25%
1H
03
2H
03
1H
04
2H
04
1H
05
2H
05
1H
06
2H
06
1H
07
2H
07
1H
08
2H
08
1H
09
2H
09
1H
10
2H
10
Wharf retail rental (RHS) Swire retail rental (RHS)
Swire Retail YoY% Wharf Retail YoY%
(HK$mn)
-
500
1,000
1,500
2,000
2,500
-30%
-20%
-10%
0%
10%
20%
30%
40%
1H
03
2H
03
1H
04
2H
04
1H
05
2H
05
1H
06
2H
06
1H
07
2H
07
1H
08
2H
08
1H
09
2H
09
1H
10
2H
10
Wharf office rental revenue(RHS) Swire office rental revenue (RHS)
Swire Office YoY% Wharf Office YoY%
(HK$mn)
Retail rent
Overall Central CWB TST High street
yoy %chg2004 30.3 35.1 60.2 68.3 48.5
2005 13.3 29.3 24.8 28.2 15.9
2006 8.1 9.3 (1.7) (2.0) 1.3
2007 15.2 35.8 27.6 38.9 17.8
2008 0.7 0.8 (2.1) (4.8) 4.0
2009 (3.1) (8.1) (10.6) (10.0) (4.0)
qoq %chg1Q10 3.7 5.1 5.7 6.6 3.4
2Q10 4.4 2.2 2.7 2.7 4.3
3Q10 0.2 3.5 3.1 3.0 0.6
4Q10 4.1 5.4 5.1 5.5 6.0
1Q11 2.7 8.3 8.5 8.3 4.6
2Q11 2.7 n.a. n.a. n.a. 4.9
渐飞研究报告 - http://bg.panlv.net
July 27, 2011 Asia Pacific: Conglomerates
Goldman Sachs Global Investment Research 21
projects), more closely monitoring of fiscal disciplines and issuance of local government
debts.
In recent years, land sales have been an important source of revenue streams for municipal
governments. According to the Ministry of Land and Resources, China’s land sale revenue
amounted to RMB2.7tn in 2010, representing 37% of its tax-related revenue. In light of the
tightening policies implemented in the property sector since last year, developers have
generally turned more cautious on their landbank replenishment. In Shanghai and Beijing,
for example, land sales have fallen by 48% and 80% yoy in 1H2011 respectively. As local
governments find other ways to relieve their debt burden and lower their fiscal spending, it
may create potential opportunities for companies with strong balance sheet and
government relationship to acquire assets at reasonable valuation.
Shanghai Industrial, Hutch/Cheung Kong and CRE to benefit
Within our coverage universe, we believe the following conglomerates are financially
equipped to take acquisition opportunities:
Shanghai Industrial – Since 2011, management has stated its intention to speed up its
pace of acquiring infrastructure assets, including both toll roads and water plants. We
now forecast the earnings contribution from its infrastructure division would rise from
25% in 2011E to 32% in 2013E, driven by organic growth in toll roads and capacity
expansion of its water business. Potential acquisition may present further upside to
our estimates. In specific terms, if we assume the group gears up its net debt to equity
from 34% at end-2010 to 50%, we estimate it could raise another HK$4.8bn for
acquisition.
Hutch and Cheung Kong – After the Hutch Port spin-off early this year, Hutch’s net debt
to capital would improve significantly to 18% at end-2011E,, the strongest it has been
since 2002 after its 3G venture. Having secured more contracted property sales than its
spending in land replenishment in recent years, we estimate Cheung Kong’s net
gearing would only be 6% at end-2011. The strength of its balance sheet and less
competition from mainland developers should provide it with the opportunities to
acquire land at cheaper valuation. Indeed, since Sept last year, it has acquired four
pieces of land in Nanjing, Shanghai, Chongqing and Dalian for RMB9bn.
China Resources Enterprise – CRE’s balance sheet is among the strongest of the
conglomerates in our coverage universe: it was in a net cash position at end-2010.
Over the past two years, the group has been seeking acquisition opportunities across
its three key divisions, namely beverage, retail and food. It has budgeted a total capex
of HK$8.6bn in 2011, including HK$3.4bn for retail, HK$3.1bn for beverage and
HK$1.9bn for food. On our recent corporate day, management said that the company is
still interested in acquiring slaughter houses in China, as heightened concerns about
food hygiene and safety are prompting local governments to consolidate the number
of abattoir licenses.
渐飞研究报告 - http://bg.panlv.net
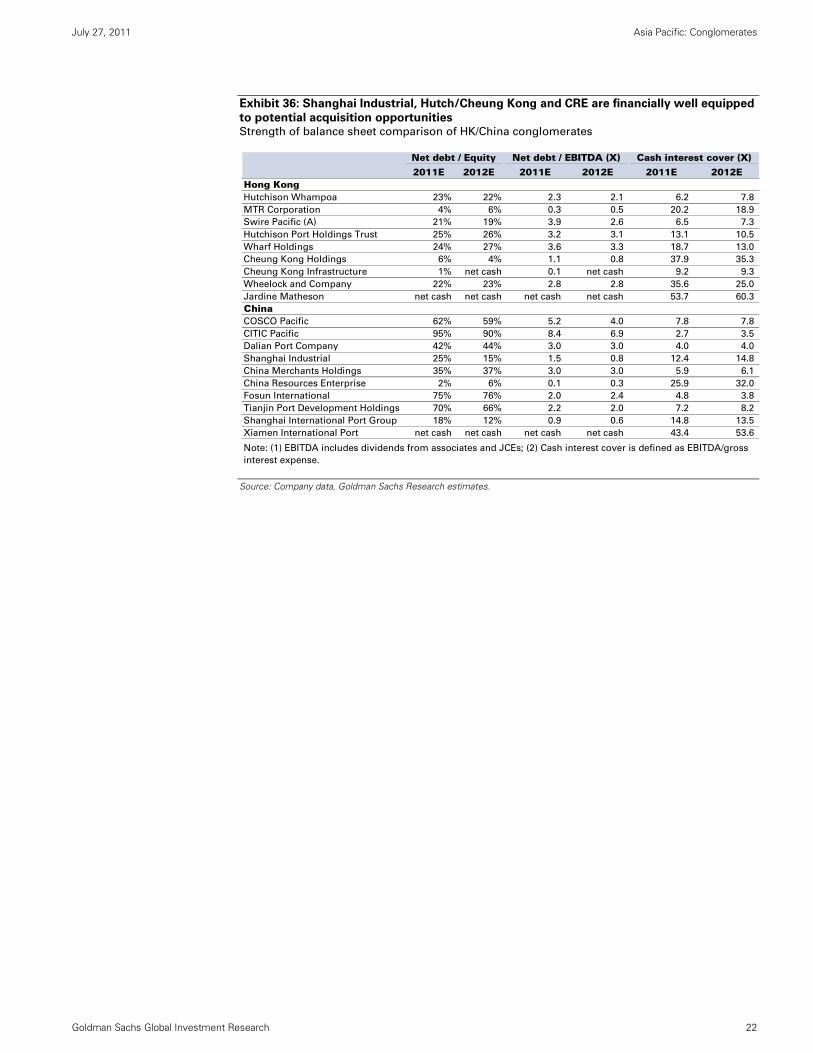
July 27, 2011 Asia Pacific: Conglomerates
Goldman Sachs Global Investment Research 22
Exhibit 36: Shanghai Industrial, Hutch/Cheung Kong and CRE are financially well equipped
to potential acquisition opportunities Strength of balance sheet comparison of HK/China conglomerates
Source: Company data, Goldman Sachs Research estimates.
2011E 2012E 2011E 2012E 2011E 2012EHong KongHutchison Whampoa 23% 22% 2.3 2.1 6.2 7.8
MTR Corporation 4% 6% 0.3 0.5 20.2 18.9
Swire Pacific (A) 21% 19% 3.9 2.6 6.5 7.3
Hutchison Port Holdings Trust 25% 26% 3.2 3.1 13.1 10.5
Wharf Holdings 24% 27% 3.6 3.3 18.7 13.0
Cheung Kong Holdings 6% 4% 1.1 0.8 37.9 35.3
Cheung Kong Infrastructure 1% net cash 0.1 net cash 9.2 9.3
Wheelock and Company 22% 23% 2.8 2.8 35.6 25.0
Jardine Matheson net cash net cash net cash net cash 53.7 60.3
ChinaCOSCO Pacific 62% 59% 5.2 4.0 7.8 7.8
CITIC Pacific 95% 90% 8.4 6.9 2.7 3.5
Dalian Port Company 42% 44% 3.0 3.0 4.0 4.0
Shanghai Industrial 25% 15% 1.5 0.8 12.4 14.8
China Merchants Holdings 35% 37% 3.0 3.0 5.9 6.1
China Resources Enterprise 2% 6% 0.1 0.3 25.9 32.0
Fosun International 75% 76% 2.0 2.4 4.8 3.8
Tianjin Port Development Holdings 70% 66% 2.2 2.0 7.2 8.2
Shanghai International Port Group 18% 12% 0.9 0.6 14.8 13.5
Xiamen International Port net cash net cash net cash net cash 43.4 53.6
Net debt / Equity Net debt / EBITDA (X) Cash interest cover (X)
Note: (1) EBITDA includes dividends from associates and JCEs; (2) Cash interest cover is defined as EBITDA/gross
interest expense.
渐飞研究报告 - http://bg.panlv.net
July 27, 2011 Asia Pacific: Conglomerates
Goldman Sachs Global Investment Research 23
Downside scenario - stress-test our key assumptions
Market concerns over macro slowdown and tightening policies in China have driven down
stock valuation in recent months. To gauge what has been priced in and identify potential
investment opportunities, we have undertaken a stress test on the key assumptions and
target valuation for the stocks in our coverage universe. Our ECS team believes it is highly
unlikely to see another economic downturn as severe as the one we had experienced in
2008/09. In 2009, global, US and EU GDP fell 0.6%, 2.6% and 3.9% respectively. Based on
our ECS team’s downside scenario (i.e., 2012 GDP growth of +3.4% globally, +7.0% for
China, +1.5% for the US, +1.0% for EU, +0.4% for Hong Kong), we come up with the
following bear-case assumptions:
Hong Kong properties – residential price to fall 10% yoy in 2012 and transaction
volume to shrink 20% vs. our base case. Office and retail rents to drop 10-15%, vs our
base-case forecast of +10% growth in 2012. The magnitudes of our bear-case housing
price and rental decline assumptions are less drastic than those in the short-lived
financial crisis 2-3 years ago, when housing price was down 20% and office/retail rents
down 34%/13% in 4Q08-2Q09.
China properties – residential price to fall 10% in 2012, similar to our bear-case
assumption in Hong Kong, but sharper transaction volume decline of 40% (vs 20% in
Hong Kong). For rental properties, we assume office and retail rents fall 20%, and the
cap rate to rise 1% in our bear case. During the financial crisis, residential property
prices in major Chinese cities dropped 20%-25%; office/retail rents fell 35%/8%.
China port throughput and handling charges – Unlike in 2009 when global GDP
contracted by 0.6%, our ECS team still expects 3.4% growth in 2012 under its bear-case
scenario. If we apply a 1.5x multiplier (i.e., low end of historical range) over this global
GDP growth forecast and assume China ports grow in line with the rest of the world,
we come up with our bear-case China port throughput growth assumption of 5% for
next year. By region, we expect strong throughput growth in the Bohai Rim region (i.e.,
+8%) given its greater exposure to domestic trades. Indeed, even during the financial
crisis, port throughput in this region grew 2% yoy in 2009. We forecast weaker
throughput growth in Yangtze River Delta (+5%) and Pearl River Delta (0%), especially
the latter, as it serves more US and Europe shipping lines. As for ASP, our bear case
assumes 3% ASP decline. In the past economic downturn, port operators managed to
keep their headline tariffs unchanged. The single-digit % ASP reduction was largely
driven by more pricing discount and higher empty box mix.
Valuation – If macro starts to deteriorate, stocks will de-rate on higher risk premium
and expectation of slower growth. In deriving our bear-case valuation, we apply
multiples or NAV discount at one standard deviation below their mid-cycle or our
current target multiples in our base case (Exhibit 41).
Other assumptions specific to individual conglomerates in our base vs bear case are laid
out clearly in Exhibit 40.
渐飞研究报告 - http://bg.panlv.net
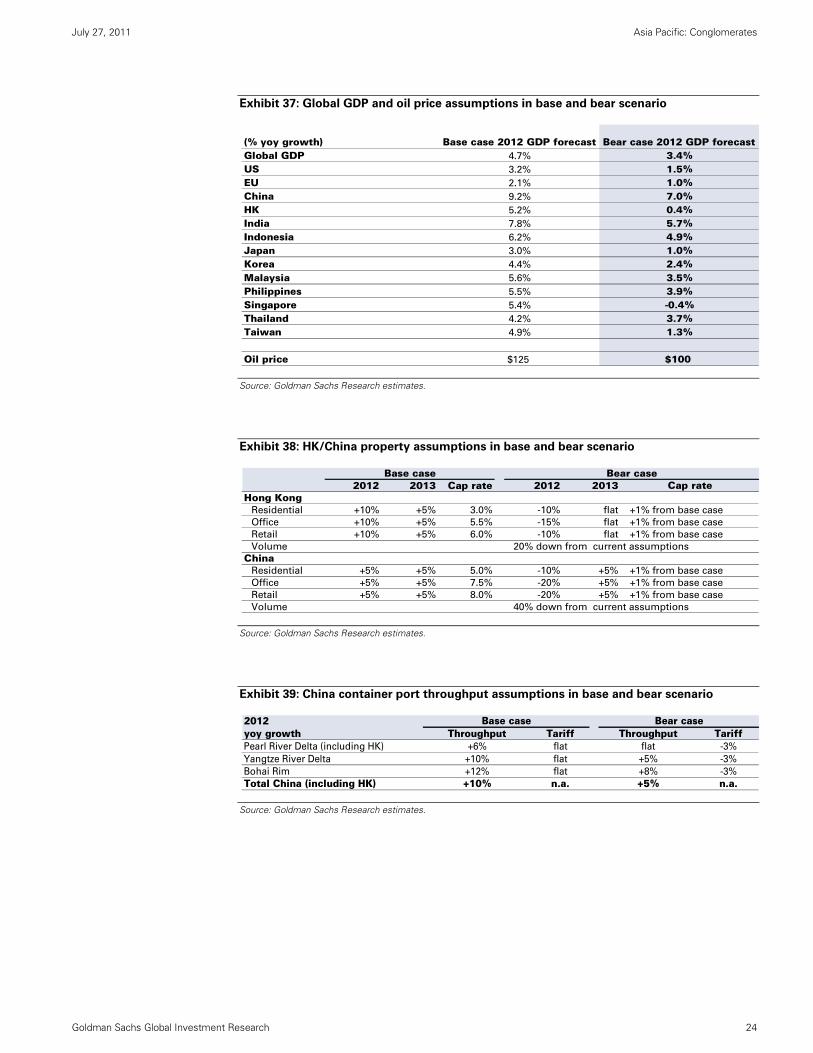
July 27, 2011 Asia Pacific: Conglomerates
Goldman Sachs Global Investment Research 24
Exhibit 37: Global GDP and oil price assumptions in base and bear scenario
Source: Goldman Sachs Research estimates.
Exhibit 38: HK/China property assumptions in base and bear scenario
Source: Goldman Sachs Research estimates.
Exhibit 39: China container port throughput assumptions in base and bear scenario
Source: Goldman Sachs Research estimates.
(% yoy growth) Base case 2012 GDP forecast Bear case 2012 GDP forecastGlobal GDP 4.7% 3.4%US 3.2% 1.5%EU 2.1% 1.0%China 9.2% 7.0%HK 5.2% 0.4%India 7.8% 5.7%Indonesia 6.2% 4.9%Japan 3.0% 1.0%Korea 4.4% 2.4%Malaysia 5.6% 3.5%Philippines 5.5% 3.9%Singapore 5.4% -0.4%Thailand 4.2% 3.7%Taiwan 4.9% 1.3%
Oil price $125 $100
2012 2013 Cap rate 2012 2013Hong Kong
Residential +10% +5% 3.0% -10% flat +1% from base case
Office +10% +5% 5.5% -15% flat +1% from base case
Retail +10% +5% 6.0% -10% flat +1% from base case
Volume 20% down from current assumptions
China Residential +5% +5% 5.0% -10% +5% +1% from base case
Office +5% +5% 7.5% -20% +5% +1% from base case
Retail +5% +5% 8.0% -20% +5% +1% from base case
Volume 40% down from current assumptions
Base caseCap rate
Bear case
2012yoy growth Throughput Tariff Throughput TariffPearl River Delta (including HK) +6% flat flat -3%
Yangtze River Delta +10% flat +5% -3%
Bohai Rim +12% flat +8% -3%
Total China (including HK) +10% n.a. +5% n.a.
Base case Bear case
渐飞研究报告 - http://bg.panlv.net
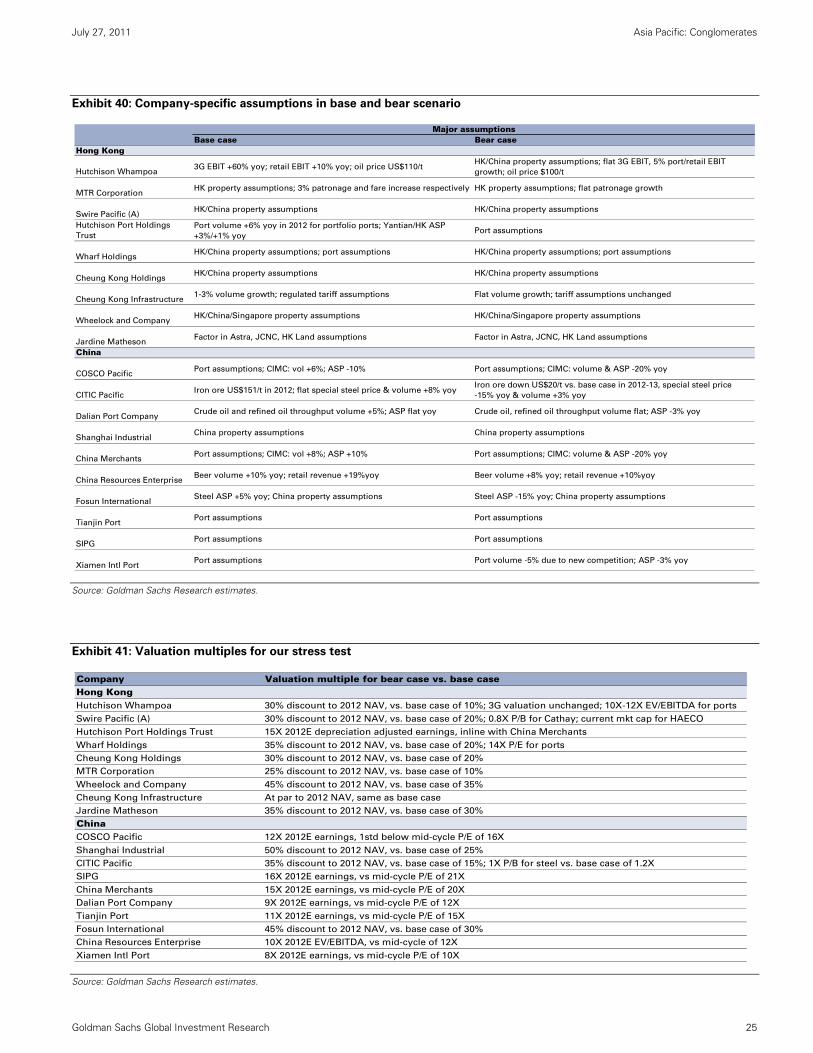
July 27, 2011 Asia Pacific: Conglomerates
Goldman Sachs Global Investment Research 25
Exhibit 40: Company-specific assumptions in base and bear scenario
Source: Goldman Sachs Research estimates.
Exhibit 41: Valuation multiples for our stress test
Source: Goldman Sachs Research estimates.
Base case Bear caseHong Kong
Hutchison Whampoa3G EBIT +60% yoy; retail EBIT +10% yoy; oil price US$110/t
HK/China property assumptions; flat 3G EBIT, 5% port/retail EBIT
growth; oil price $100/t
MTR CorporationHK property assumptions; 3% patronage and fare increase respectively HK property assumptions; flat patronage growth
Swire Pacific (A)HK/China property assumptions HK/China property assumptions
Hutchison Port Holdings
Trust
Port volume +6% yoy in 2012 for portfolio ports; Yantian/HK ASP
+3%/+1% yoyPort assumptions
Wharf HoldingsHK/China property assumptions; port assumptions HK/China property assumptions; port assumptions
Cheung Kong HoldingsHK/China property assumptions HK/China property assumptions
Cheung Kong Infrastructure1-3% volume growth; regulated tariff assumptions Flat volume growth; tariff assumptions unchanged
Wheelock and CompanyHK/China/Singapore property assumptions HK/China/Singapore property assumptions
Jardine MathesonFactor in Astra, JCNC, HK Land assumptions Factor in Astra, JCNC, HK Land assumptions
China
COSCO PacificPort assumptions; CIMC: vol +6%; ASP -10% Port assumptions; CIMC: volume & ASP -20% yoy
CITIC PacificIron ore US$151/t in 2012; flat special steel price & volume +8% yoy
Iron ore down US$20/t vs. base case in 2012-13, special steel price
-15% yoy & volume +3% yoy
Dalian Port CompanyCrude oil and refined oil throughput volume +5%; ASP flat yoy Crude oil, refined oil throughput volume flat; ASP -3% yoy
Shanghai IndustrialChina property assumptions China property assumptions
China Merchants Port assumptions; CIMC: vol +8%; ASP +10% Port assumptions; CIMC: volume & ASP -20% yoy
China Resources EnterpriseBeer volume +10% yoy; retail revenue +19%yoy Beer volume +8% yoy; retail revenue +10%yoy
Fosun InternationalSteel ASP +5% yoy; China property assumptions Steel ASP -15% yoy; China property assumptions
Tianjin Port Port assumptions Port assumptions
SIPGPort assumptions Port assumptions
Xiamen Intl PortPort assumptions Port volume -5% due to new competition; ASP -3% yoy
Major assumptions
Company Valuation multiple for bear case vs. base caseHong KongHutchison Whampoa 30% discount to 2012 NAV, vs. base case of 10%; 3G valuation unchanged; 10X-12X EV/EBITDA for ports
Swire Pacific (A) 30% discount to 2012 NAV, vs. base case of 20%; 0.8X P/B for Cathay; current mkt cap for HAECO
Hutchison Port Holdings Trust 15X 2012E depreciation adjusted earnings, inline with China Merchants
Wharf Holdings 35% discount to 2012 NAV, vs. base case of 20%; 14X P/E for ports
Cheung Kong Holdings 30% discount to 2012 NAV, vs. base case of 20%
MTR Corporation 25% discount to 2012 NAV, vs. base case of 10%
Wheelock and Company 45% discount to 2012 NAV, vs. base case of 35%
Cheung Kong Infrastructure At par to 2012 NAV, same as base case
Jardine Matheson 35% discount to 2012 NAV, vs. base case of 30%
ChinaCOSCO Pacific 12X 2012E earnings, 1std below mid-cycle P/E of 16X
Shanghai Industrial 50% discount to 2012 NAV, vs. base case of 25%
CITIC Pacific 35% discount to 2012 NAV, vs. base case of 15%; 1X P/B for steel vs. base case of 1.2X
SIPG 16X 2012E earnings, vs mid-cycle P/E of 21X
China Merchants 15X 2012E earnings, vs mid-cycle P/E of 20X
Dalian Port Company 9X 2012E earnings, vs mid-cycle P/E of 12X
Tianjin Port 11X 2012E earnings, vs mid-cycle P/E of 15X
Fosun International 45% discount to 2012 NAV, vs. base case of 30%
China Resources Enterprise 10X 2012E EV/EBITDA, vs mid-cycle of 12X
Xiamen Intl Port 8X 2012E earnings, vs mid-cycle P/E of 10X
渐飞研究报告 - http://bg.panlv.net
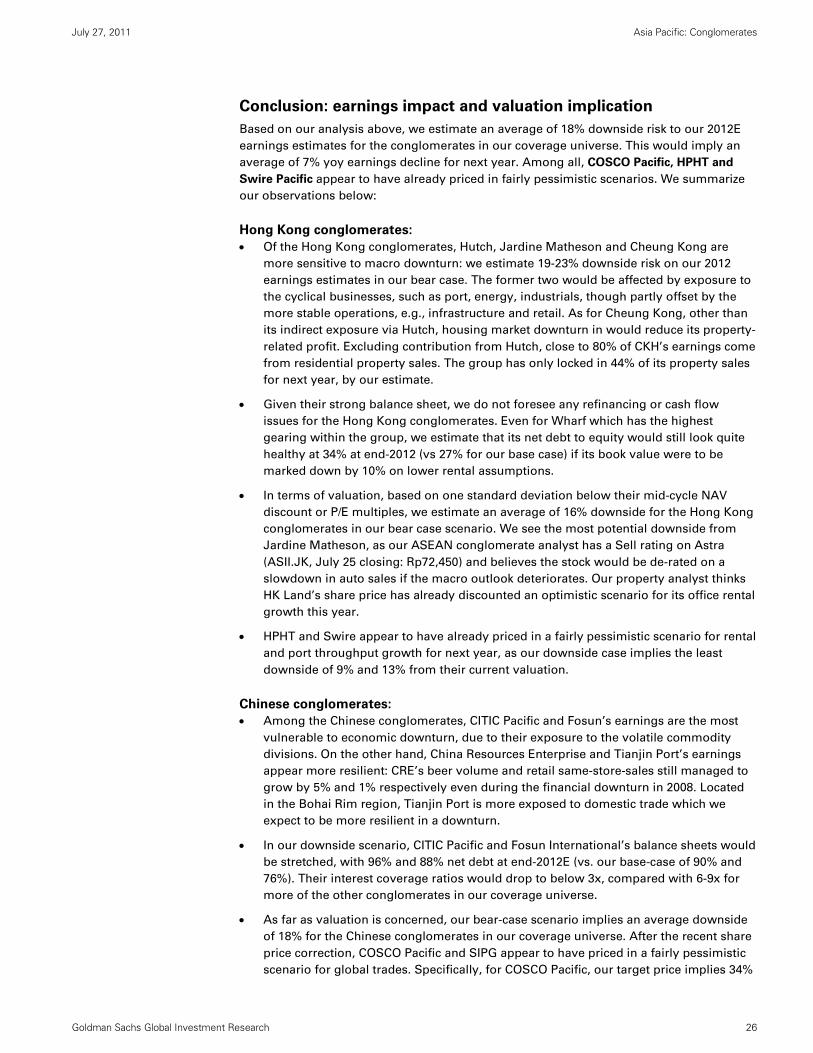
July 27, 2011 Asia Pacific: Conglomerates
Goldman Sachs Global Investment Research 26
Conclusion: earnings impact and valuation implication
Based on our analysis above, we estimate an average of 18% downside risk to our 2012E
earnings estimates for the conglomerates in our coverage universe. This would imply an
average of 7% yoy earnings decline for next year. Among all, COSCO Pacific, HPHT and
Swire Pacific appear to have already priced in fairly pessimistic scenarios. We summarize
our observations below:
Hong Kong conglomerates:
Of the Hong Kong conglomerates, Hutch, Jardine Matheson and Cheung Kong are
more sensitive to macro downturn: we estimate 19-23% downside risk on our 2012
earnings estimates in our bear case. The former two would be affected by exposure to
the cyclical businesses, such as port, energy, industrials, though partly offset by the
more stable operations, e.g., infrastructure and retail. As for Cheung Kong, other than
its indirect exposure via Hutch, housing market downturn in would reduce its property-
related profit. Excluding contribution from Hutch, close to 80% of CKH’s earnings come
from residential property sales. The group has only locked in 44% of its property sales
for next year, by our estimate.
Given their strong balance sheet, we do not foresee any refinancing or cash flow
issues for the Hong Kong conglomerates. Even for Wharf which has the highest
gearing within the group, we estimate that its net debt to equity would still look quite
healthy at 34% at end-2012 (vs 27% for our base case) if its book value were to be
marked down by 10% on lower rental assumptions.
In terms of valuation, based on one standard deviation below their mid-cycle NAV
discount or P/E multiples, we estimate an average of 16% downside for the Hong Kong
conglomerates in our bear case scenario. We see the most potential downside from
Jardine Matheson, as our ASEAN conglomerate analyst has a Sell rating on Astra
(ASII.JK, July 25 closing: Rp72,450) and believes the stock would be de-rated on a
slowdown in auto sales if the macro outlook deteriorates. Our property analyst thinks
HK Land’s share price has already discounted an optimistic scenario for its office rental
growth this year.
HPHT and Swire appear to have already priced in a fairly pessimistic scenario for rental
and port throughput growth for next year, as our downside case implies the least
downside of 9% and 13% from their current valuation.
Chinese conglomerates:
Among the Chinese conglomerates, CITIC Pacific and Fosun’s earnings are the most
vulnerable to economic downturn, due to their exposure to the volatile commodity
divisions. On the other hand, China Resources Enterprise and Tianjin Port’s earnings
appear more resilient: CRE’s beer volume and retail same-store-sales still managed to
grow by 5% and 1% respectively even during the financial downturn in 2008. Located
in the Bohai Rim region, Tianjin Port is more exposed to domestic trade which we
expect to be more resilient in a downturn.
In our downside scenario, CITIC Pacific and Fosun International’s balance sheets would
be stretched, with 96% and 88% net debt at end-2012E (vs. our base-case of 90% and
76%). Their interest coverage ratios would drop to below 3x, compared with 6-9x for
more of the other conglomerates in our coverage universe.
As far as valuation is concerned, our bear-case scenario implies an average downside
of 18% for the Chinese conglomerates in our coverage universe. After the recent share
price correction, COSCO Pacific and SIPG appear to have priced in a fairly pessimistic
scenario for global trades. Specifically, for COSCO Pacific, our target price implies 34%
渐飞研究报告 - http://bg.panlv.net
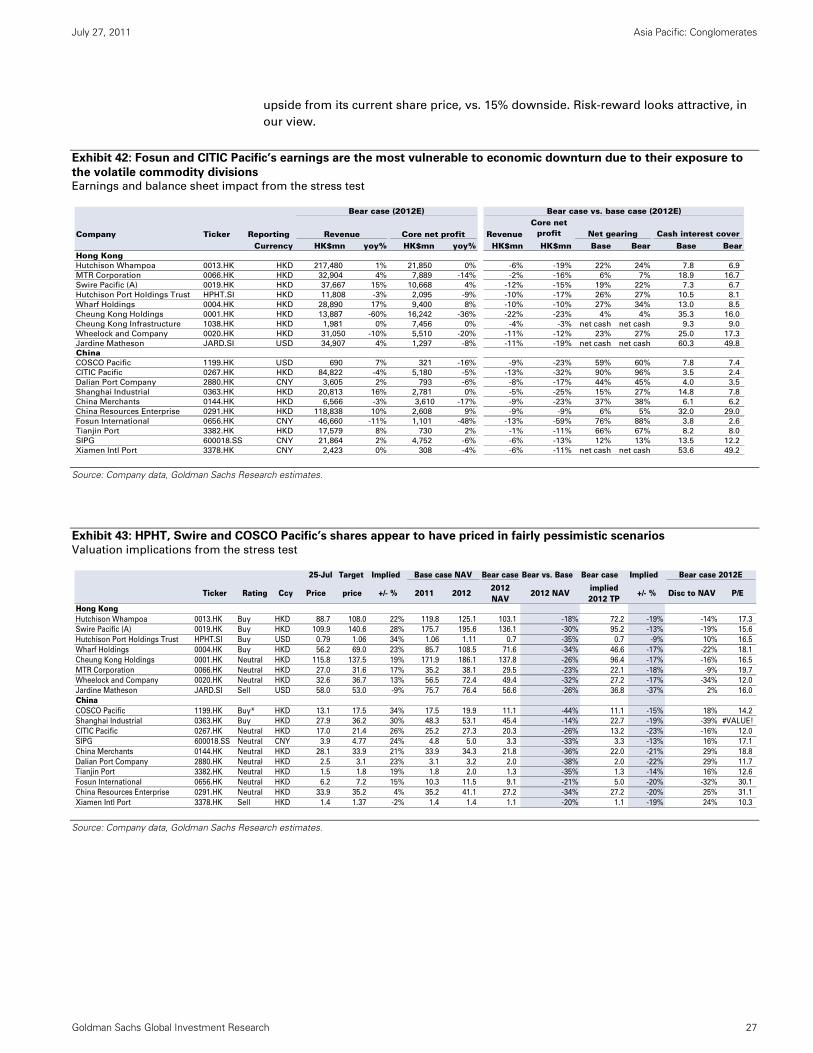
July 27, 2011 Asia Pacific: Conglomerates
Goldman Sachs Global Investment Research 27
upside from its current share price, vs. 15% downside. Risk-reward looks attractive, in
our view.
Exhibit 42: Fosun and CITIC Pacific’s earnings are the most vulnerable to economic downturn due to their exposure to
the volatile commodity divisions Earnings and balance sheet impact from the stress test
Source: Company data, Goldman Sachs Research estimates.
Exhibit 43: HPHT, Swire and COSCO Pacific’s shares appear to have priced in fairly pessimistic scenarios
Valuation implications from the stress test
Source: Company data, Goldman Sachs Research estimates.
Company Ticker ReportingCurrency HK$mn yoy% HK$mn yoy% HK$mn HK$mn Base Bear Base Bear
Hong KongHutchison Whampoa 0013.HK HKD 217,480 1% 21,850 0% -6% -19% 22% 24% 7.8 6.9
MTR Corporation 0066.HK HKD 32,904 4% 7,889 -14% -2% -16% 6% 7% 18.9 16.7
Swire Pacific (A) 0019.HK HKD 37,667 15% 10,668 4% -12% -15% 19% 22% 7.3 6.7
Hutchison Port Holdings Trust HPHT.SI HKD 11,808 -3% 2,095 -9% -10% -17% 26% 27% 10.5 8.1
Wharf Holdings 0004.HK HKD 28,890 17% 9,400 8% -10% -10% 27% 34% 13.0 8.5
Cheung Kong Holdings 0001.HK HKD 13,887 -60% 16,242 -36% -22% -23% 4% 4% 35.3 16.0
Cheung Kong Infrastructure 1038.HK HKD 1,981 0% 7,456 0% -4% -3% net cash net cash 9.3 9.0
Wheelock and Company 0020.HK HKD 31,050 -10% 5,510 -20% -11% -12% 23% 27% 25.0 17.3
Jardine Matheson JARD.SI USD 34,907 4% 1,297 -8% -11% -19% net cash net cash 60.3 49.8
ChinaCOSCO Pacific 1199.HK USD 690 7% 321 -16% -9% -23% 59% 60% 7.8 7.4
CITIC Pacific 0267.HK HKD 84,822 -4% 5,180 -5% -13% -32% 90% 96% 3.5 2.4
Dalian Port Company 2880.HK CNY 3,605 2% 793 -6% -8% -17% 44% 45% 4.0 3.5
Shanghai Industrial 0363.HK HKD 20,813 16% 2,781 0% -5% -25% 15% 27% 14.8 7.8
China Merchants 0144.HK HKD 6,566 -3% 3,610 -17% -9% -23% 37% 38% 6.1 6.2
China Resources Enterprise 0291.HK HKD 118,838 10% 2,608 9% -9% -9% 6% 5% 32.0 29.0
Fosun International 0656.HK CNY 46,660 -11% 1,101 -48% -13% -59% 76% 88% 3.8 2.6
Tianjin Port 3382.HK HKD 17,579 8% 730 2% -1% -11% 66% 67% 8.2 8.0
SIPG 600018.SS CNY 21,864 2% 4,752 -6% -6% -13% 12% 13% 13.5 12.2
Xiamen Intl Port 3378.HK CNY 2,423 0% 308 -4% -6% -11% net cash net cash 53.6 49.2
Core net profit
Bear case vs. base case (2012E)
Revenue Core net profit Net gearingRevenue Cash interest cover
Bear case (2012E)
25-Jul Target Implied Bear case Bear vs. Base Bear case Implied
Ticker Rating Ccy Price price +/- % 2011 20122012 NAV
2012 NAVimplied 2012 TP
+/- % Disc to NAV P/E
Hong KongHutchison Whampoa 0013.HK Buy HKD 88.7 108.0 22% 119.8 125.1 103.1 -18% 72.2 -19% -14% 17.3
Swire Pacific (A) 0019.HK Buy HKD 109.9 140.6 28% 175.7 195.6 136.1 -30% 95.2 -13% -19% 15.6
Hutchison Port Holdings Trust HPHT.SI Buy USD 0.79 1.06 34% 1.06 1.11 0.7 -35% 0.7 -9% 10% 16.5
Wharf Holdings 0004.HK Buy HKD 56.2 69.0 23% 85.7 108.5 71.6 -34% 46.6 -17% -22% 18.1
Cheung Kong Holdings 0001.HK Neutral HKD 115.8 137.5 19% 171.9 186.1 137.8 -26% 96.4 -17% -16% 16.5
MTR Corporation 0066.HK Neutral HKD 27.0 31.6 17% 35.2 38.1 29.5 -23% 22.1 -18% -9% 19.7
Wheelock and Company 0020.HK Neutral HKD 32.6 36.7 13% 56.5 72.4 49.4 -32% 27.2 -17% -34% 12.0
Jardine Matheson JARD.SI Sell USD 58.0 53.0 -9% 75.7 76.4 56.6 -26% 36.8 -37% 2% 16.0
ChinaCOSCO Pacific 1199.HK Buy* HKD 13.1 17.5 34% 17.5 19.9 11.1 -44% 11.1 -15% 18% 14.2
Shanghai Industrial 0363.HK Buy HKD 27.9 36.2 30% 48.3 53.1 45.4 -14% 22.7 -19% -39% #VALUE!
CITIC Pacific 0267.HK Neutral HKD 17.0 21.4 26% 25.2 27.3 20.3 -26% 13.2 -23% -16% 12.0
SIPG 600018.SS Neutral CNY 3.9 4.77 24% 4.8 5.0 3.3 -33% 3.3 -13% 16% 17.1
China Merchants 0144.HK Neutral HKD 28.1 33.9 21% 33.9 34.3 21.8 -36% 22.0 -21% 29% 18.8
Dalian Port Company 2880.HK Neutral HKD 2.5 3.1 23% 3.1 3.2 2.0 -38% 2.0 -22% 29% 11.7
Tianjin Port 3382.HK Neutral HKD 1.5 1.8 19% 1.8 2.0 1.3 -35% 1.3 -14% 16% 12.6
Fosun International 0656.HK Neutral HKD 6.2 7.2 15% 10.3 11.5 9.1 -21% 5.0 -20% -32% 30.1
China Resources Enterprise 0291.HK Neutral HKD 33.9 35.2 4% 35.2 41.1 27.2 -34% 27.2 -20% 25% 31.1
Xiamen Intl Port 3378.HK Sell HKD 1.4 1.37 -2% 1.4 1.4 1.1 -20% 1.1 -19% 24% 10.3
Base case NAV Bear case 2012E
渐飞研究报告 - http://bg.panlv.net
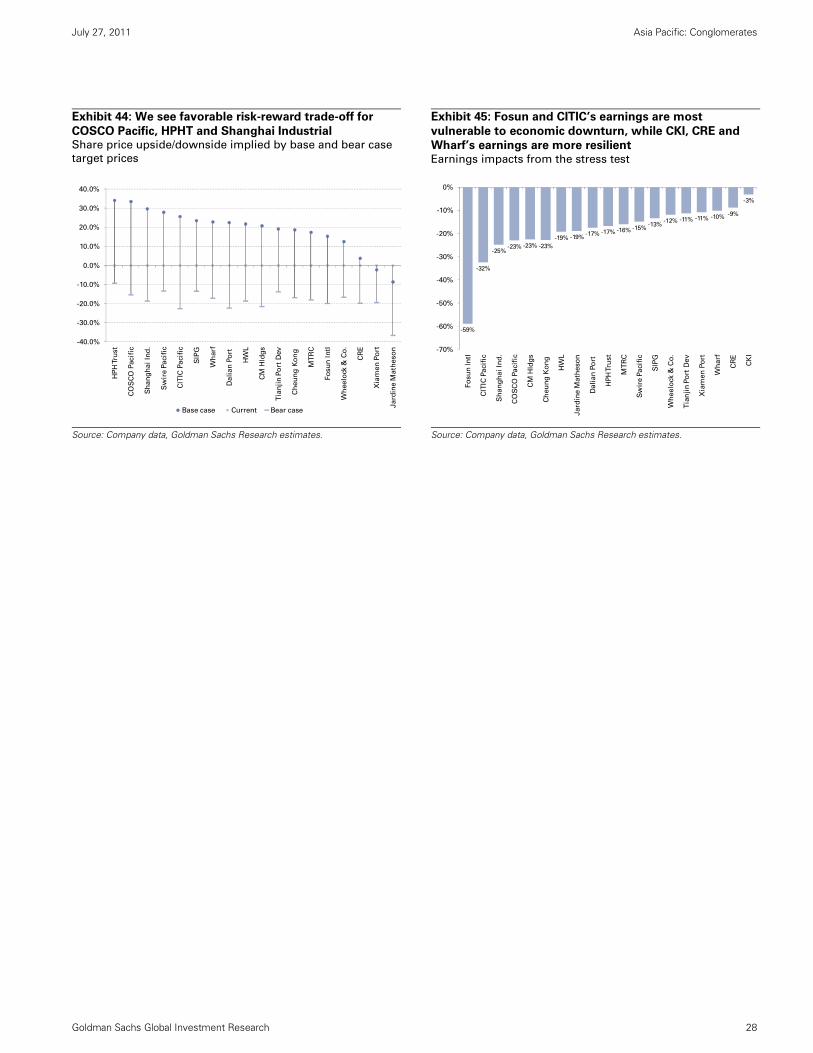
July 27, 2011 Asia Pacific: Conglomerates
Goldman Sachs Global Investment Research 28
Exhibit 44: We see favorable risk-reward trade-off for
COSCO Pacific, HPHT and Shanghai Industrial Share price upside/downside implied by base and bear case
target prices
Exhibit 45: Fosun and CITIC’s earnings are most
vulnerable to economic downturn, while CKI, CRE and
Wharf’s earnings are more resilient Earnings impacts from the stress test
Source: Company data, Goldman Sachs Research estimates.
Source: Company data, Goldman Sachs Research estimates.
-40.0%
-30.0%
-20.0%
-10.0%
0.0%
10.0%
20.0%
30.0%
40.0%
HP
H T
rust
CO
SC
O P
acif
ic
Sh
an
gh
ai
Ind
.
Sw
ire P
acif
ic
CIT
IC P
acif
ic
SIP
G
Wh
arf
Dali
an
Po
rt
HW
L
CM
Hld
gs
Tia
nji
n P
ort
Dev
Ch
eu
ng
Ko
ng
MT
RC
Fo
su
n In
tl
Wh
eelo
ck &
Co
.
CR
E
Xia
men
Po
rt
Jard
ine M
ath
eso
n
Base case Current Bear case
-59%
-32%
-25%-23% -23% -23%
-19% -19%-17% -17% -16% -15%
-13%-12% -11% -11% -10% -9%
-3%
-70%
-60%
-50%
-40%
-30%
-20%
-10%
0%
Fo
su
n In
tl
CIT
IC P
acif
ic
Sh
an
gh
ai
Ind
.
CO
SC
O P
acif
ic
CM
Hld
gs
Ch
eu
ng
Ko
ng
HW
L
Jard
ine M
ath
eso
n
Dali
an
Po
rt
HP
H T
rust
MT
RC
Sw
ire P
acif
ic
SIP
G
Wh
eelo
ck &
Co
.
Tia
nji
n P
ort
Dev
Xia
men
Po
rt
Wh
arf
CR
E
CK
I
渐飞研究报告 - http://bg.panlv.net
July 27, 2011 Asia Pacific: Conglomerates
Goldman Sachs Global Investment Research 29
Potential surprises and trading ideas around the results season
CKI will kick off the reporting season for the conglomerates on July 27. Overall, we expect
the conglomerates under our coverage universe to record an average of 20% core earnings
growth in 1H11, driven by a buoyant housing and rental market in Hong Kong, price hike
and 13% container port volume growth in China and accelerated retail same-store-sale
growth in HK/China. On the other hand, we expect cost pressure to become more
noticeable in these results, especially for those with downstream operations, such as
CITIC’s special steel and CRE’s beer businesses.
Key focus will likely be: (1) signs and impact of a macro slowdown and any revisions on
company’s guidance for the full-year; (2) an update of pricing strategies and ability to pass
on the cost increase to end-users. We highlight the following stocks where we expect
potential surprises and hence room for revisions in the upcoming results:
Wharf (4.HK; Buy) – Although we do not anticipate any major surprise from the results
itself and expect the group to deliver 20% yoy core earnings growth on booking of
more property sale profit, any confirmation of its full-year property sale target by the
group will likely be taken positively by the market. In light of the tightening policies
imposed by the government on the China property sector, investors are generally
skeptical on Wharf’s ability to achieve its aggressive property sale target of RMB14bn
(vs RMB8.8bn in 2010). But as we highlight in the company section later, the group’s
property sale of RMB5bn ytd is in line with its run rate in the last few years (i.e., 40/60
between 1H and 2H), as most of the project launches are back-end-loaded. If it
continues to execute well on its China property investment, we see significant upside
to consensus estimates in 2012-2013E.
China Resources Enterprise (291.HK; Neutral) – Kingway Brewery’s profit warning
issued on July 11 provides some read-across for the results for CRE’s beer business.
Specifically, although CRE’s beer sale growth has accelerated to mid-teens % yoy in
May due to the low-base effect with heavy rain last year, we believe its 5% ASP
increase may not be sufficient to make up for the higher urban construction and
education surcharges, and rising raw material costs ytd. As the lower-cost barley
inventory has been consumed, the 28% barley price increase last year should have
started to impose margin pressure in its 2Q results. We also expect the profitability of
its food distribution business in Hong Kong to be affected by the surge of imported
hog price from China. In the past, CRE’s retail and beer operations have always
exhibited some seasonality, in that its retail division typically contributes close to 80%
of the group’s core earnings in 1Q and 4Q, and vice versa for its beer division. As such,
we expect the weak earnings from its beer division would be more apparent and better
reflected in its 2Q and 3Q results, vs. last quarter. Our 2011E earnings estimate for CRE
is 11% below market consensus (Exhibit 47).
渐飞研究报告 - http://bg.panlv.net
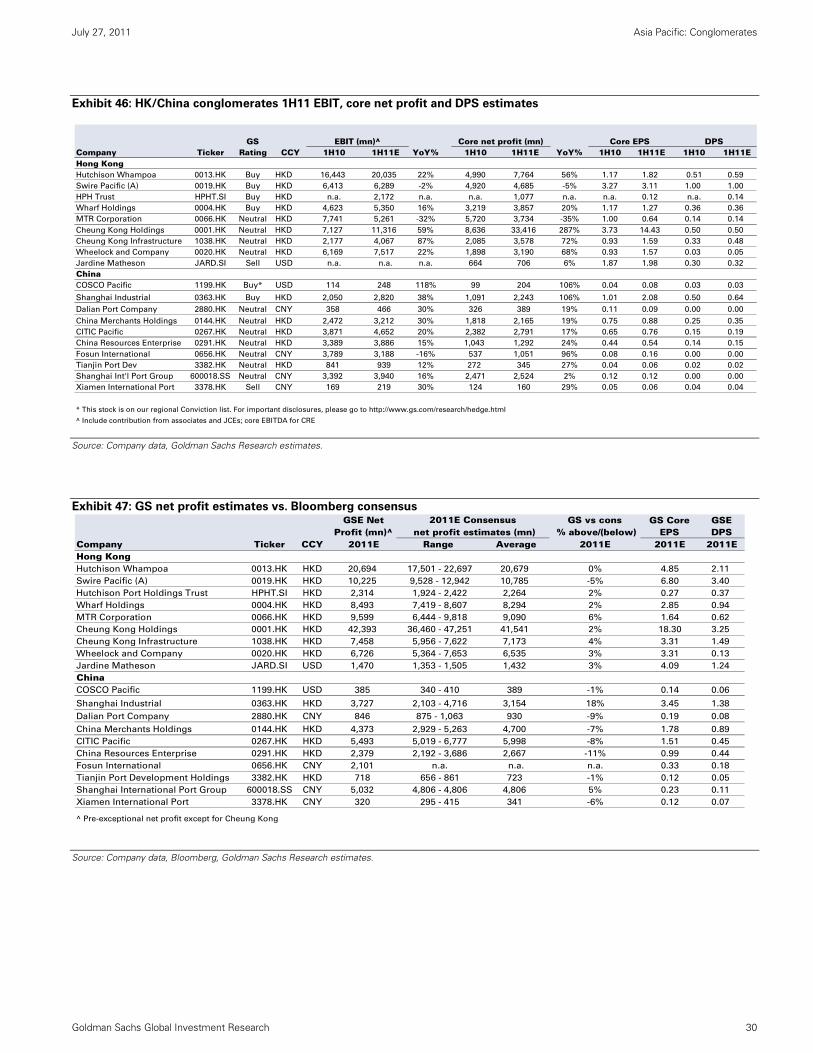
July 27, 2011 Asia Pacific: Conglomerates
Goldman Sachs Global Investment Research 30
Exhibit 46: HK/China conglomerates 1H11 EBIT, core net profit and DPS estimates
Source: Company data, Goldman Sachs Research estimates.
Exhibit 47: GS net profit estimates vs. Bloomberg consensus
Source: Company data, Bloomberg, Goldman Sachs Research estimates.
GSCompany Ticker Rating CCY 1H10 1H11E 1H10 1H11E 1H10 1H11E 1H10 1H11EHong KongHutchison Whampoa 0013.HK Buy HKD 16,443 20,035 22% 4,990 7,764 56% 1.17 1.82 0.51 0.59
Swire Pacific (A) 0019.HK Buy HKD 6,413 6,289 -2% 4,920 4,685 -5% 3.27 3.11 1.00 1.00
HPH Trust HPHT.SI Buy HKD n.a. 2,172 n.a. n.a. 1,077 n.a. n.a. 0.12 n.a. 0.14
Wharf Holdings 0004.HK Buy HKD 4,623 5,350 16% 3,219 3,857 20% 1.17 1.27 0.36 0.36
MTR Corporation 0066.HK Neutral HKD 7,741 5,261 -32% 5,720 3,734 -35% 1.00 0.64 0.14 0.14
Cheung Kong Holdings 0001.HK Neutral HKD 7,127 11,316 59% 8,636 33,416 287% 3.73 14.43 0.50 0.50
Cheung Kong Infrastructure 1038.HK Neutral HKD 2,177 4,067 87% 2,085 3,578 72% 0.93 1.59 0.33 0.48
Wheelock and Company 0020.HK Neutral HKD 6,169 7,517 22% 1,898 3,190 68% 0.93 1.57 0.03 0.05
Jardine Matheson JARD.SI Sell USD n.a. n.a. n.a. 664 706 6% 1.87 1.98 0.30 0.32
ChinaCOSCO Pacific 1199.HK Buy* USD 114 248 118% 99 204 106% 0.04 0.08 0.03 0.03
Shanghai Industrial 0363.HK Buy HKD 2,050 2,820 38% 1,091 2,243 106% 1.01 2.08 0.50 0.64
Dalian Port Company 2880.HK Neutral CNY 358 466 30% 326 389 19% 0.11 0.09 0.00 0.00
China Merchants Holdings 0144.HK Neutral HKD 2,472 3,212 30% 1,818 2,165 19% 0.75 0.88 0.25 0.35
CITIC Pacific 0267.HK Neutral HKD 3,871 4,652 20% 2,382 2,791 17% 0.65 0.76 0.15 0.19
China Resources Enterprise 0291.HK Neutral HKD 3,389 3,886 15% 1,043 1,292 24% 0.44 0.54 0.14 0.15
Fosun International 0656.HK Neutral CNY 3,789 3,188 -16% 537 1,051 96% 0.08 0.16 0.00 0.00
Tianjin Port Dev 3382.HK Neutral HKD 841 939 12% 272 345 27% 0.04 0.06 0.02 0.02
Shanghai Int'l Port Group 600018.SS Neutral CNY 3,392 3,940 16% 2,471 2,524 2% 0.12 0.12 0.00 0.00
Xiamen International Port 3378.HK Sell CNY 169 219 30% 124 160 29% 0.05 0.06 0.04 0.04
* This stock is on our regional Conviction list. For important disclosures, please go to http://www.gs.com/research/hedge.html
^ Include contribution from associates and JCEs; core EBITDA for CRE
DPSEBIT (mn)^YoY%
Core net profit (mn)YoY%
Core EPS
GSE Net GS vs consProfit (mn)^ % above/(below)
Company Ticker CCY 2011E Range Average 2011E 2011E 2011EHong KongHutchison Whampoa 0013.HK HKD 20,694 17,501 - 22,697 20,679 0% 4.85 2.11
Swire Pacific (A) 0019.HK HKD 10,225 9,528 - 12,942 10,785 -5% 6.80 3.40
Hutchison Port Holdings Trust HPHT.SI HKD 2,314 1,924 - 2,422 2,264 2% 0.27 0.37
Wharf Holdings 0004.HK HKD 8,493 7,419 - 8,607 8,294 2% 2.85 0.94
MTR Corporation 0066.HK HKD 9,599 6,444 - 9,818 9,090 6% 1.64 0.62
Cheung Kong Holdings 0001.HK HKD 42,393 36,460 - 47,251 41,541 2% 18.30 3.25
Cheung Kong Infrastructure 1038.HK HKD 7,458 5,956 - 7,622 7,173 4% 3.31 1.49
Wheelock and Company 0020.HK HKD 6,726 5,364 - 7,653 6,535 3% 3.31 0.13
Jardine Matheson JARD.SI USD 1,470 1,353 - 1,505 1,432 3% 4.09 1.24
ChinaCOSCO Pacific 1199.HK USD 385 340 - 410 389 -1% 0.14 0.06
Shanghai Industrial 0363.HK HKD 3,727 2,103 - 4,716 3,154 18% 3.45 1.38
Dalian Port Company 2880.HK CNY 846 875 - 1,063 930 -9% 0.19 0.08
China Merchants Holdings 0144.HK HKD 4,373 2,929 - 5,263 4,700 -7% 1.78 0.89
CITIC Pacific 0267.HK HKD 5,493 5,019 - 6,777 5,998 -8% 1.51 0.45
China Resources Enterprise 0291.HK HKD 2,379 2,192 - 3,686 2,667 -11% 0.99 0.44
Fosun International 0656.HK CNY 2,101 n.a. n.a. n.a. 0.33 0.18
Tianjin Port Development Holdings 3382.HK HKD 718 656 - 861 723 -1% 0.12 0.05
Shanghai International Port Group 600018.SS CNY 5,032 4,806 - 4,806 4,806 5% 0.23 0.11
Xiamen International Port 3378.HK CNY 320 295 - 415 341 -6% 0.12 0.07
^ Pre-exceptional net profit except for Cheung Kong
GSE DPS
GS Core EPS
2011E Consensus net profit estimates (mn)
渐飞研究报告 - http://bg.panlv.net
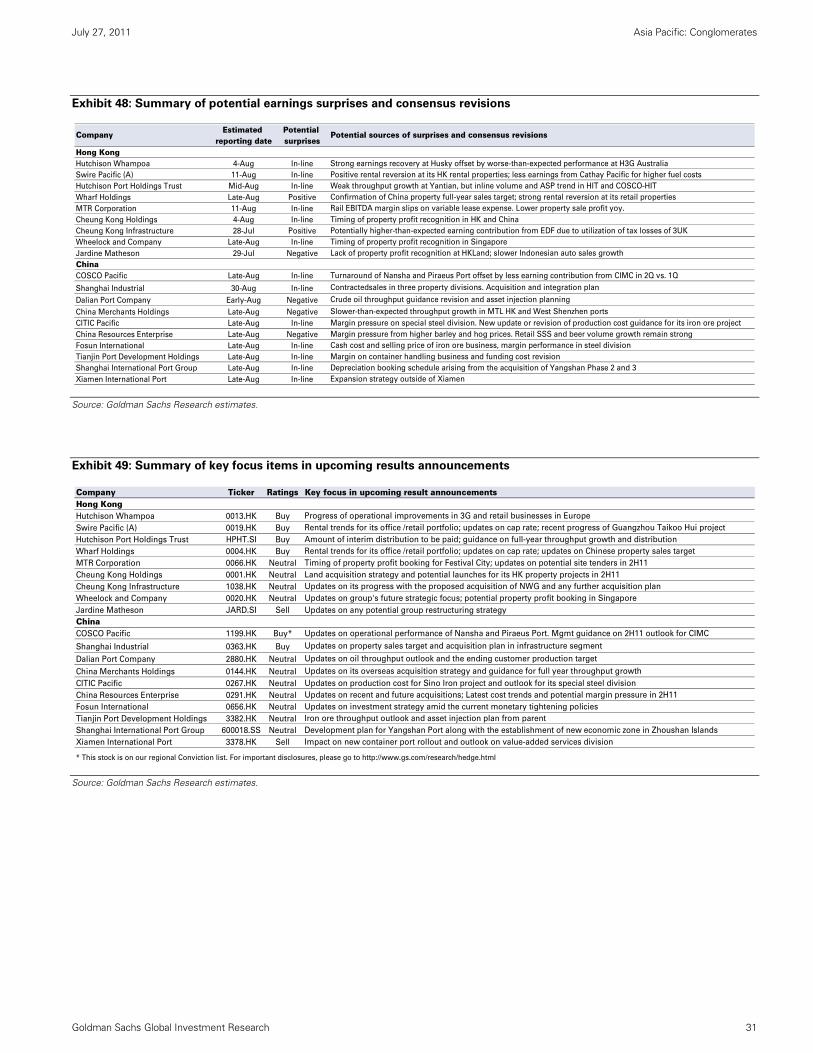
July 27, 2011 Asia Pacific: Conglomerates
Goldman Sachs Global Investment Research 31
Exhibit 48: Summary of potential earnings surprises and consensus revisions
Source: Goldman Sachs Research estimates.
Exhibit 49: Summary of key focus items in upcoming results announcements
Source: Goldman Sachs Research estimates.
Estimated Potential reporting date surprises
Hong KongHutchison Whampoa 4-Aug In-line Strong earnings recovery at Husky offset by worse-than-expected performance at H3G Australia
Swire Pacific (A) 11-Aug In-line Positive rental reversion at its HK rental properties; less earnings from Cathay Pacific for higher fuel costs
Hutchison Port Holdings Trust Mid-Aug In-line Weak throughput growth at Yantian, but inline volume and ASP trend in HIT and COSCO-HIT
Wharf Holdings Late-Aug Positive Confirmation of China property full-year sales target; strong rental reversion at its retail properties
MTR Corporation 11-Aug In-line Rail EBITDA margin slips on variable lease expense. Lower property sale profit yoy.
Cheung Kong Holdings 4-Aug In-line Timing of property profit recognition in HK and China
Cheung Kong Infrastructure 28-Jul Positive Potentially higher-than-expected earning contribution from EDF due to utilization of tax losses of 3UK
Wheelock and Company Late-Aug In-line Timing of property profit recognition in Singapore
Jardine Matheson 29-Jul Negative Lack of property profit recognition at HKLand; slower Indonesian auto sales growth
ChinaCOSCO Pacific Late-Aug In-line Turnaround of Nansha and Piraeus Port offset by less earning contribution from CIMC in 2Q vs. 1Q
Shanghai Industrial 30-Aug In-line Contractedsales in three property divisions. Acquisition and integration plan
Dalian Port Company Early-Aug Negative Crude oil throughput guidance revision and asset injection planning
China Merchants Holdings Late-Aug Negative Slower-than-expected throughput growth in MTL HK and West Shenzhen ports
CITIC Pacific Late-Aug In-line Margin pressure on special steel division. New update or revision of production cost guidance for its iron ore project
China Resources Enterprise Late-Aug Negative Margin pressure from higher barley and hog prices. Retail SSS and beer volume growth remain strong
Fosun International Late-Aug In-line Cash cost and selling price of iron ore business, margin performance in steel division
Tianjin Port Development Holdings Late-Aug In-line Margin on container handling business and funding cost revision
Shanghai International Port Group Late-Aug In-line Depreciation booking schedule arising from the acquisition of Yangshan Phase 2 and 3
Xiamen International Port Late-Aug In-line Expansion strategy outside of Xiamen
Potential sources of surprises and consensus revisionsCompany
Company Ticker Ratings Key focus in upcoming result announcementsHong KongHutchison Whampoa 0013.HK Buy Progress of operational improvements in 3G and retail businesses in Europe
Swire Pacific (A) 0019.HK Buy Rental trends for its office /retail portfolio; updates on cap rate; recent progress of Guangzhou Taikoo Hui project
Hutchison Port Holdings Trust HPHT.SI Buy Amount of interim distribution to be paid; guidance on full-year throughput growth and distribution
Wharf Holdings 0004.HK Buy Rental trends for its office /retail portfolio; updates on cap rate; updates on Chinese property sales target
MTR Corporation 0066.HK Neutral Timing of property profit booking for Festival City; updates on potential site tenders in 2H11
Cheung Kong Holdings 0001.HK Neutral Land acquisition strategy and potential launches for its HK property projects in 2H11
Cheung Kong Infrastructure 1038.HK Neutral Updates on its progress with the proposed acquisition of NWG and any further acquisition plan
Wheelock and Company 0020.HK Neutral Updates on group's future strategic focus; potential property profit booking in Singapore
Jardine Matheson JARD.SI Sell Updates on any potential group restructuring strategy
ChinaCOSCO Pacific 1199.HK Buy* Updates on operational performance of Nansha and Piraeus Port. Mgmt guidance on 2H11 outlook for CIMC
Shanghai Industrial 0363.HK Buy Updates on property sales target and acquisition plan in infrastructure segment
Dalian Port Company 2880.HK Neutral Updates on oil throughput outlook and the ending customer production target
China Merchants Holdings 0144.HK Neutral Updates on its overseas acquisition strategy and guidance for full year throughput growth
CITIC Pacific 0267.HK Neutral Updates on production cost for Sino Iron project and outlook for its special steel division
China Resources Enterprise 0291.HK Neutral Updates on recent and future acquisitions; Latest cost trends and potential margin pressure in 2H11
Fosun International 0656.HK Neutral Updates on investment strategy amid the current monetary tightening policies
Tianjin Port Development Holdings 3382.HK Neutral Iron ore throughput outlook and asset injection plan from parent
Shanghai International Port Group 600018.SS Neutral Development plan for Yangshan Port along with the establishment of new economic zone in Zhoushan Islands
Xiamen International Port 3378.HK Sell Impact on new container port rollout and outlook on value-added services division
* This stock is on our regional Conviction list. For important disclosures, please go to http://www.gs.com/research/hedge.html
渐飞研究报告 - http://bg.panlv.net
July 27, 2011 Asia Pacific: Conglomerates
Goldman Sachs Global Investment Research 32
Stock implications and investment views
Stocks with rating changes
(1) Wharf (4.HK; upgrade to Buy; 12m TP: HK$69)
Investment view: We upgrade Wharf from Neutral to Buy. Despite the strong performance
of its office and retail portfolios in Hong Kong, the stock has traded sideways ytd on
investor concern over cap rate expansion and its ability to meet its China property sales
target of RMB14bn for the full-year. As discussed in earlier sections, we believe cap rate is
unlikely to expand over the next 1-2 years, given: (1) our ECS team’s view that the US
government will not raise the Fed funds rate until end-2013; (2) HK’s rental yield spread
over US treasury rate is around 2-3%, in line with its historical average. In the meantime, its
two key shopping malls in Hong Kong, namely Harbour City and Time Square, continue to
perform well, with retail sales up 32% and 21% yoy to May. For their prime location in the
two core shopping districts for mainland tourists, we expect their outperformance to
continue and now forecast 20% and 15% retail rental growth in 2011 and 2012 respectively
(vs +15% and 5% previously).
One of the key concerns that we have had on Wharf in the past is its execution in its China
property investment, in light of the tightening policies imposed by the government to cool
the market. To recap, we estimate the group had invested HK$63bn capital in land
purchases and property construction in China over the past decade, but fetched less than
HK$20bn from property sales so far. Based on 5.8mn sq ft property sales in 2010, its total
land size of 135mn sq ft GFA would imply 23 years of landbank. During our Conglomerate
Corporate Day two weeks ago, we were impressed by its strong execution, as the group
has already secured RMB5bn property sales in Jan-May, on track to achieve its full-year
target of RMB14bn. More importantly, the property sale was not achieved by price cut: a
sign that its products are well received in the local markets. Management attributes its
solid execution to the localization of sale teams, which understand the markets and taste of
local buyers. As most of their properties are located in the second-tier cities (i.e., Chengdu,
Suzhou, Wuxi, Chongqing), we see less risk of a significant price cut given the strong end-
user demand.
If Wharf continues to execute well on its China property sales, we expect a step-up of its
property development profit presenting significant upside risk to consensus earnings in
2012-2013. Specifically, to end-2010, Wharf had around RMB8bn property sales on its book
that had not been recognized. If it achieves its full-year sale target of RMB14bn, netting off
the RMB4bn sale it budgets to recognize this year, the group would secure and carry
forward RMB18bn or HK$21bn property sales to 2012. Based on management guidance of
30% EBIT margin for its China property projects, this would represent HK$6bn property
sale profit yet to be booked - a step up from HK$1.1bn in 2010 and HK$1.7bn in 2011E. We
now model RMB12bn and RMB16bn China property sale for Wharf in 2011 and 2012. Based
on its completion schedule, we estimate its property sale EBIT would reach HK$6bn in
2013E (up from HK$1.7bn in 2011E), underpinning a 25% core earnings CAGR for the group
in 2011-2013E.
Over the medium term, the completion of its rental properties in China could serve as
another earnings driver for the group. At the moment, Wharf has four rental properties in
China, namely Shanghai Time Square, Chongqing Time Square, Dalian Time Square and
the newly completed Wheelock Square. Given its success in running shopping malls in
渐飞研究报告 - http://bg.panlv.net
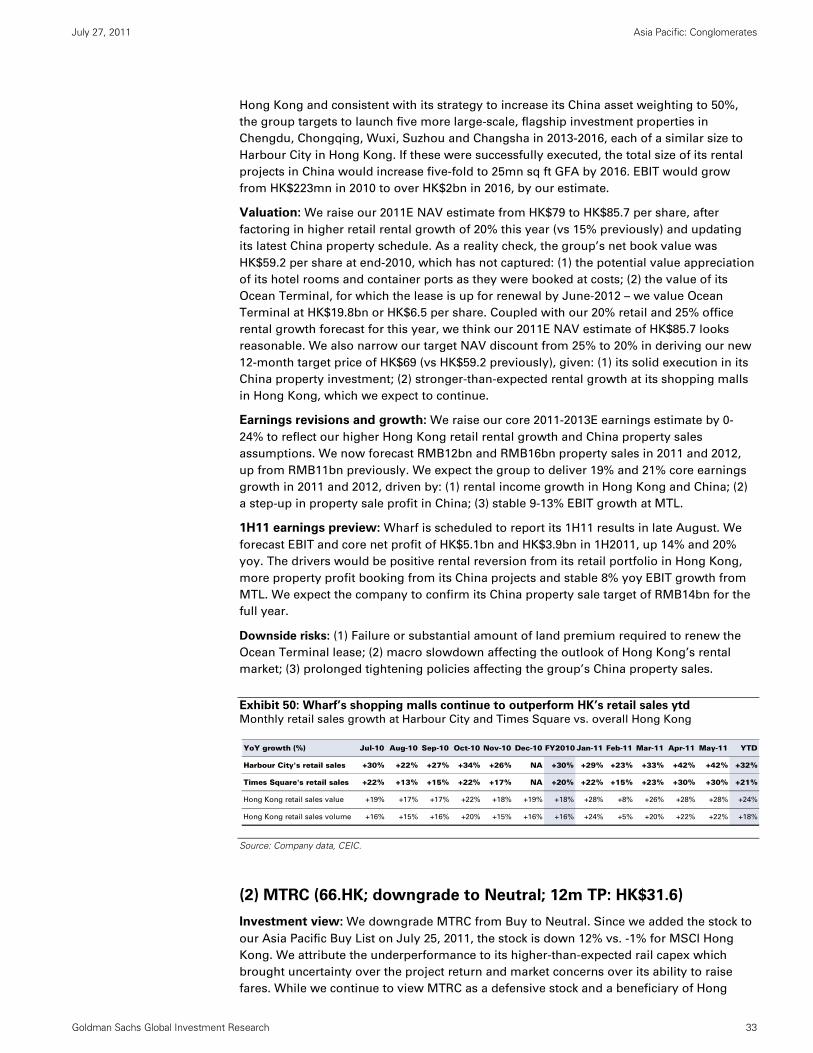
July 27, 2011 Asia Pacific: Conglomerates
Goldman Sachs Global Investment Research 33
Hong Kong and consistent with its strategy to increase its China asset weighting to 50%,
the group targets to launch five more large-scale, flagship investment properties in
Chengdu, Chongqing, Wuxi, Suzhou and Changsha in 2013-2016, each of a similar size to
Harbour City in Hong Kong. If these were successfully executed, the total size of its rental
projects in China would increase five-fold to 25mn sq ft GFA by 2016. EBIT would grow
from HK$223mn in 2010 to over HK$2bn in 2016, by our estimate.
Valuation: We raise our 2011E NAV estimate from HK$79 to HK$85.7 per share, after
factoring in higher retail rental growth of 20% this year (vs 15% previously) and updating
its latest China property schedule. As a reality check, the group’s net book value was
HK$59.2 per share at end-2010, which has not captured: (1) the potential value appreciation
of its hotel rooms and container ports as they were booked at costs; (2) the value of its
Ocean Terminal, for which the lease is up for renewal by June-2012 – we value Ocean
Terminal at HK$19.8bn or HK$6.5 per share. Coupled with our 20% retail and 25% office
rental growth forecast for this year, we think our 2011E NAV estimate of HK$85.7 looks
reasonable. We also narrow our target NAV discount from 25% to 20% in deriving our new
12-month target price of HK$69 (vs HK$59.2 previously), given: (1) its solid execution in its
China property investment; (2) stronger-than-expected rental growth at its shopping malls
in Hong Kong, which we expect to continue.
Earnings revisions and growth: We raise our core 2011-2013E earnings estimate by 0-
24% to reflect our higher Hong Kong retail rental growth and China property sales
assumptions. We now forecast RMB12bn and RMB16bn property sales in 2011 and 2012,
up from RMB11bn previously. We expect the group to deliver 19% and 21% core earnings
growth in 2011 and 2012, driven by: (1) rental income growth in Hong Kong and China; (2)
a step-up in property sale profit in China; (3) stable 9-13% EBIT growth at MTL.
1H11 earnings preview: Wharf is scheduled to report its 1H11 results in late August. We
forecast EBIT and core net profit of HK$5.1bn and HK$3.9bn in 1H2011, up 14% and 20%
yoy. The drivers would be positive rental reversion from its retail portfolio in Hong Kong,
more property profit booking from its China projects and stable 8% yoy EBIT growth from
MTL. We expect the company to confirm its China property sale target of RMB14bn for the
full year.
Downside risks: (1) Failure or substantial amount of land premium required to renew the
Ocean Terminal lease; (2) macro slowdown affecting the outlook of Hong Kong’s rental
market; (3) prolonged tightening policies affecting the group’s China property sales.
Exhibit 50: Wharf’s shopping malls continue to outperform HK’s retail sales ytd Monthly retail sales growth at Harbour City and Times Square vs. overall Hong Kong
Source: Company data, CEIC.
(2) MTRC (66.HK; downgrade to Neutral; 12m TP: HK$31.6)
Investment view: We downgrade MTRC from Buy to Neutral. Since we added the stock to
our Asia Pacific Buy List on July 25, 2011, the stock is down 12% vs. -1% for MSCI Hong
Kong. We attribute the underperformance to its higher-than-expected rail capex which
brought uncertainty over the project return and market concerns over its ability to raise
fares. While we continue to view MTRC as a defensive stock and a beneficiary of Hong
YoY growth (%) Jul-10 Aug-10 Sep-10 Oct-10 Nov-10 Dec-10 FY2010 Jan-11 Feb-11 Mar-11 Apr-11 May-11 YTD
Harbour City's retail sales +30% +22% +27% +34% +26% NA +30% +29% +23% +33% +42% +42% +32%
Times Square's retail sales +22% +13% +15% +22% +17% NA +20% +22% +15% +23% +30% +30% +21%
Hong Kong retail sales value +19% +17% +17% +22% +18% +19% +18% +28% +8% +26% +28% +28% +24%
Hong Kong retail sales volume +16% +15% +16% +20% +15% +16% +16% +24% +5% +20% +22% +22% +18%
渐飞研究报告 - http://bg.panlv.net
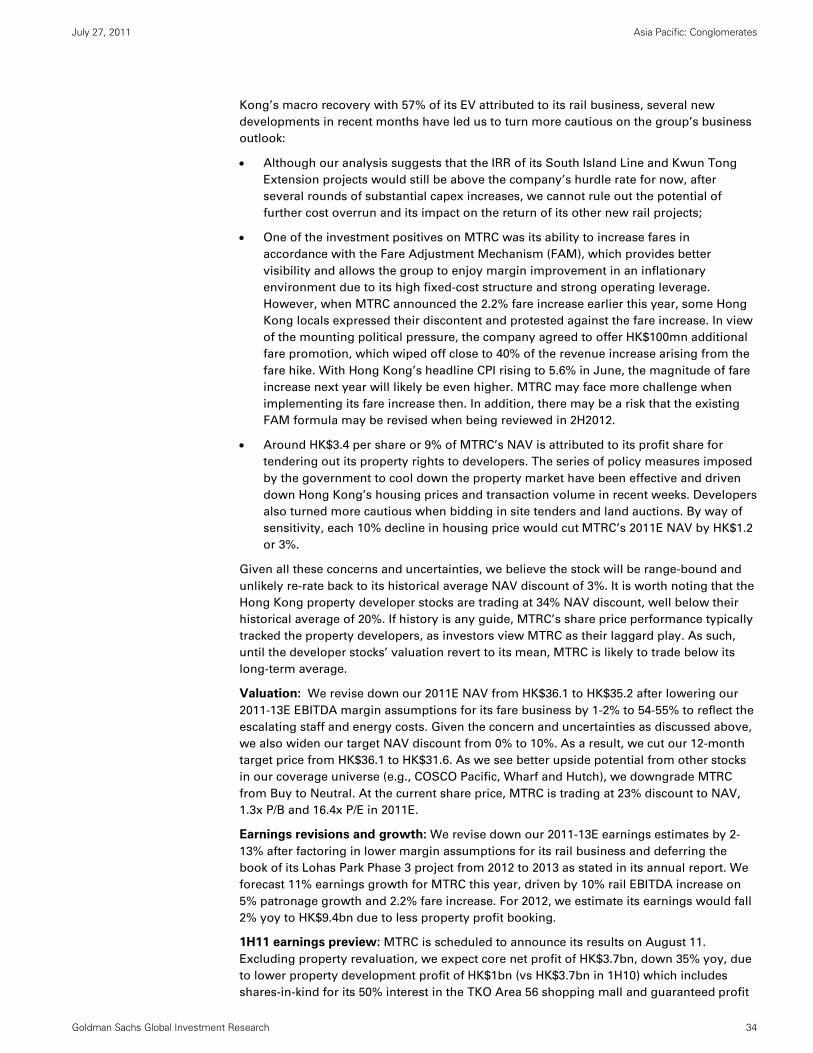
July 27, 2011 Asia Pacific: Conglomerates
Goldman Sachs Global Investment Research 34
Kong’s macro recovery with 57% of its EV attributed to its rail business, several new
developments in recent months have led us to turn more cautious on the group’s business
outlook:
Although our analysis suggests that the IRR of its South Island Line and Kwun Tong
Extension projects would still be above the company’s hurdle rate for now, after
several rounds of substantial capex increases, we cannot rule out the potential of
further cost overrun and its impact on the return of its other new rail projects;
One of the investment positives on MTRC was its ability to increase fares in
accordance with the Fare Adjustment Mechanism (FAM), which provides better
visibility and allows the group to enjoy margin improvement in an inflationary
environment due to its high fixed-cost structure and strong operating leverage.
However, when MTRC announced the 2.2% fare increase earlier this year, some Hong
Kong locals expressed their discontent and protested against the fare increase. In view
of the mounting political pressure, the company agreed to offer HK$100mn additional
fare promotion, which wiped off close to 40% of the revenue increase arising from the
fare hike. With Hong Kong’s headline CPI rising to 5.6% in June, the magnitude of fare
increase next year will likely be even higher. MTRC may face more challenge when
implementing its fare increase then. In addition, there may be a risk that the existing
FAM formula may be revised when being reviewed in 2H2012.
Around HK$3.4 per share or 9% of MTRC’s NAV is attributed to its profit share for
tendering out its property rights to developers. The series of policy measures imposed
by the government to cool down the property market have been effective and driven
down Hong Kong’s housing prices and transaction volume in recent weeks. Developers
also turned more cautious when bidding in site tenders and land auctions. By way of
sensitivity, each 10% decline in housing price would cut MTRC’s 2011E NAV by HK$1.2
or 3%.
Given all these concerns and uncertainties, we believe the stock will be range-bound and
unlikely re-rate back to its historical average NAV discount of 3%. It is worth noting that the
Hong Kong property developer stocks are trading at 34% NAV discount, well below their
historical average of 20%. If history is any guide, MTRC’s share price performance typically
tracked the property developers, as investors view MTRC as their laggard play. As such,
until the developer stocks’ valuation revert to its mean, MTRC is likely to trade below its
long-term average.
Valuation: We revise down our 2011E NAV from HK$36.1 to HK$35.2 after lowering our
2011-13E EBITDA margin assumptions for its fare business by 1-2% to 54-55% to reflect the
escalating staff and energy costs. Given the concern and uncertainties as discussed above,
we also widen our target NAV discount from 0% to 10%. As a result, we cut our 12-month
target price from HK$36.1 to HK$31.6. As we see better upside potential from other stocks
in our coverage universe (e.g., COSCO Pacific, Wharf and Hutch), we downgrade MTRC
from Buy to Neutral. At the current share price, MTRC is trading at 23% discount to NAV,
1.3x P/B and 16.4x P/E in 2011E.
Earnings revisions and growth: We revise down our 2011-13E earnings estimates by 2-
13% after factoring in lower margin assumptions for its rail business and deferring the
book of its Lohas Park Phase 3 project from 2012 to 2013 as stated in its annual report. We
forecast 11% earnings growth for MTRC this year, driven by 10% rail EBITDA increase on
5% patronage growth and 2.2% fare increase. For 2012, we estimate its earnings would fall
2% yoy to HK$9.4bn due to less property profit booking.
1H11 earnings preview: MTRC is scheduled to announce its results on August 11.
Excluding property revaluation, we expect core net profit of HK$3.7bn, down 35% yoy, due
to lower property development profit of HK$1bn (vs HK$3.7bn in 1H10) which includes
shares-in-kind for its 50% interest in the TKO Area 56 shopping mall and guaranteed profit
渐飞研究报告 - http://bg.panlv.net
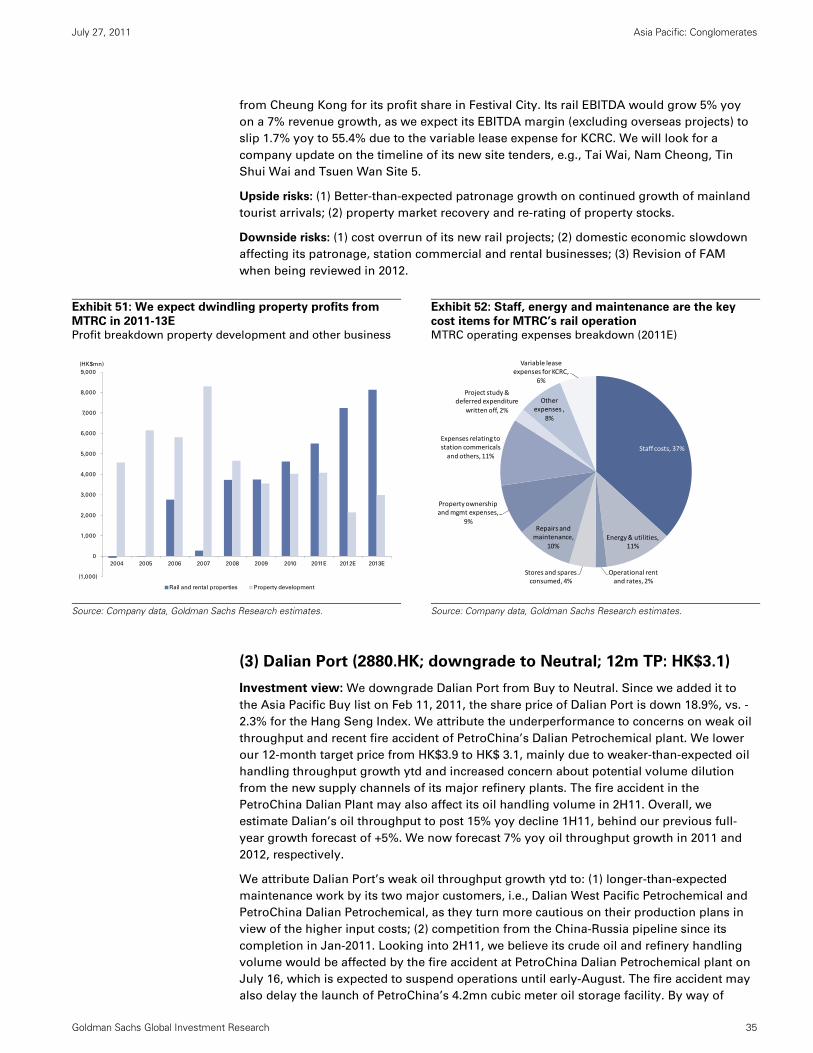
July 27, 2011 Asia Pacific: Conglomerates
Goldman Sachs Global Investment Research 35
from Cheung Kong for its profit share in Festival City. Its rail EBITDA would grow 5% yoy
on a 7% revenue growth, as we expect its EBITDA margin (excluding overseas projects) to
slip 1.7% yoy to 55.4% due to the variable lease expense for KCRC. We will look for a
company update on the timeline of its new site tenders, e.g., Tai Wai, Nam Cheong, Tin
Shui Wai and Tsuen Wan Site 5.
Upside risks: (1) Better-than-expected patronage growth on continued growth of mainland
tourist arrivals; (2) property market recovery and re-rating of property stocks.
Downside risks: (1) cost overrun of its new rail projects; (2) domestic economic slowdown
affecting its patronage, station commercial and rental businesses; (3) Revision of FAM
when being reviewed in 2012.
Exhibit 51: We expect dwindling property profits from
MTRC in 2011-13E Profit breakdown property development and other business
Exhibit 52: Staff, energy and maintenance are the key
cost items for MTRC’s rail operation MTRC operating expenses breakdown (2011E)
Source: Company data, Goldman Sachs Research estimates.
Source: Company data, Goldman Sachs Research estimates.
(3) Dalian Port (2880.HK; downgrade to Neutral; 12m TP: HK$3.1)
Investment view: We downgrade Dalian Port from Buy to Neutral. Since we added it to
the Asia Pacific Buy list on Feb 11, 2011, the share price of Dalian Port is down 18.9%, vs. -
2.3% for the Hang Seng Index. We attribute the underperformance to concerns on weak oil
throughput and recent fire accident of PetroChina’s Dalian Petrochemical plant. We lower
our 12-month target price from HK$3.9 to HK$ 3.1, mainly due to weaker-than-expected oil
handling throughput growth ytd and increased concern about potential volume dilution
from the new supply channels of its major refinery plants. The fire accident in the
PetroChina Dalian Plant may also affect its oil handling volume in 2H11. Overall, we
estimate Dalian’s oil throughput to post 15% yoy decline 1H11, behind our previous full-
year growth forecast of +5%. We now forecast 7% yoy oil throughput growth in 2011 and
2012, respectively.
We attribute Dalian Port’s weak oil throughput growth ytd to: (1) longer-than-expected
maintenance work by its two major customers, i.e., Dalian West Pacific Petrochemical and
PetroChina Dalian Petrochemical, as they turn more cautious on their production plans in
view of the higher input costs; (2) competition from the China-Russia pipeline since its
completion in Jan-2011. Looking into 2H11, we believe its crude oil and refinery handling
volume would be affected by the fire accident at PetroChina Dalian Petrochemical plant on
July 16, which is expected to suspend operations until early-August. The fire accident may
also delay the launch of PetroChina’s 4.2mn cubic meter oil storage facility. By way of
(1,000)
0
1,000
2,000
3,000
4,000
5,000
6,000
7,000
8,000
9,000
2004 2005 2006 2007 2008 2009 2010 2011E 2012E 2013E
Rail and rental properties Property development
(HK$mn)
Staff costs, 37%
Energy & utilities, 11%
Operational rent and rates, 2%
Stores and spares consumed, 4%
Repairs and maintenance,
10%
Property ownership and mgmt expenses,
9%
Expenses relating to station commericals and others, 11%
Project study & deferred expenditure
written off, 2%
Other expenses ,
8%
Variable lease expenses for KCRC,
6%
渐飞研究报告 - http://bg.panlv.net
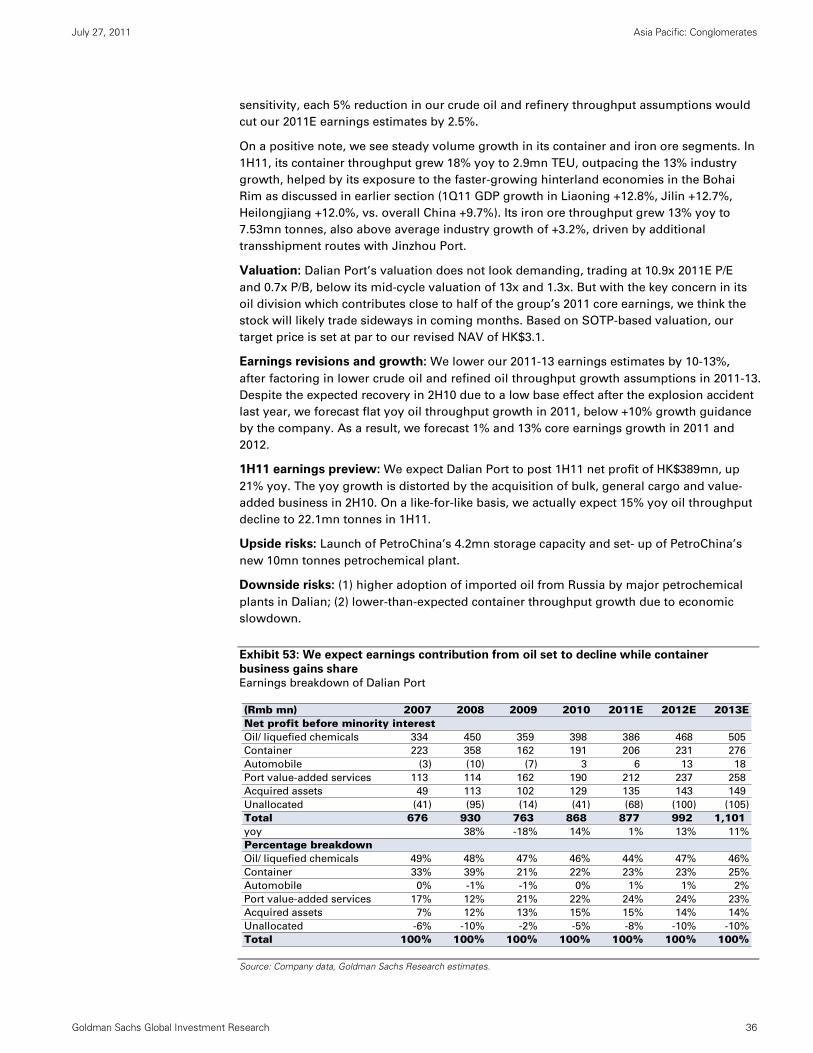
July 27, 2011 Asia Pacific: Conglomerates
Goldman Sachs Global Investment Research 36
sensitivity, each 5% reduction in our crude oil and refinery throughput assumptions would
cut our 2011E earnings estimates by 2.5%.
On a positive note, we see steady volume growth in its container and iron ore segments. In
1H11, its container throughput grew 18% yoy to 2.9mn TEU, outpacing the 13% industry
growth, helped by its exposure to the faster-growing hinterland economies in the Bohai
Rim as discussed in earlier section (1Q11 GDP growth in Liaoning +12.8%, Jilin +12.7%,
Heilongjiang +12.0%, vs. overall China +9.7%). Its iron ore throughput grew 13% yoy to
7.53mn tonnes, also above average industry growth of +3.2%, driven by additional
transshipment routes with Jinzhou Port.
Valuation: Dalian Port’s valuation does not look demanding, trading at 10.9x 2011E P/E
and 0.7x P/B, below its mid-cycle valuation of 13x and 1.3x. But with the key concern in its
oil division which contributes close to half of the group’s 2011 core earnings, we think the
stock will likely trade sideways in coming months. Based on SOTP-based valuation, our
target price is set at par to our revised NAV of HK$3.1.
Earnings revisions and growth: We lower our 2011-13 earnings estimates by 10-13%,
after factoring in lower crude oil and refined oil throughput growth assumptions in 2011-13.
Despite the expected recovery in 2H10 due to a low base effect after the explosion accident
last year, we forecast flat yoy oil throughput growth in 2011, below +10% growth guidance
by the company. As a result, we forecast 1% and 13% core earnings growth in 2011 and
2012.
1H11 earnings preview: We expect Dalian Port to post 1H11 net profit of HK$389mn, up
21% yoy. The yoy growth is distorted by the acquisition of bulk, general cargo and value-
added business in 2H10. On a like-for-like basis, we actually expect 15% yoy oil throughput
decline to 22.1mn tonnes in 1H11.
Upside risks: Launch of PetroChina’s 4.2mn storage capacity and set- up of PetroChina’s
new 10mn tonnes petrochemical plant.
Downside risks: (1) higher adoption of imported oil from Russia by major petrochemical
plants in Dalian; (2) lower-than-expected container throughput growth due to economic
slowdown.
Exhibit 53: We expect earnings contribution from oil set to decline while container
business gains share
Earnings breakdown of Dalian Port
Source: Company data, Goldman Sachs Research estimates.
(Rmb mn) 2007 2008 2009 2010 2011E 2012E 2013ENet profit before minority interestOil/ liquefied chemicals 334 450 359 398 386 468 505
Container 223 358 162 191 206 231 276
Automobile (3) (10) (7) 3 6 13 18
Port value-added services 113 114 162 190 212 237 258
Acquired assets 49 113 102 129 135 143 149
Unallocated (41) (95) (14) (41) (68) (100) (105)
Total 676 930 763 868 877 992 1,101 yoy 38% -18% 14% 1% 13% 11%
Percentage breakdownOil/ liquefied chemicals 49% 48% 47% 46% 44% 47% 46%
Container 33% 39% 21% 22% 23% 23% 25%
Automobile 0% -1% -1% 0% 1% 1% 2%
Port value-added services 17% 12% 21% 22% 24% 24% 23%
Acquired assets 7% 12% 13% 15% 15% 14% 14%
Unallocated -6% -10% -2% -5% -8% -10% -10%
Total 100% 100% 100% 100% 100% 100% 100%
渐飞研究报告 - http://bg.panlv.net
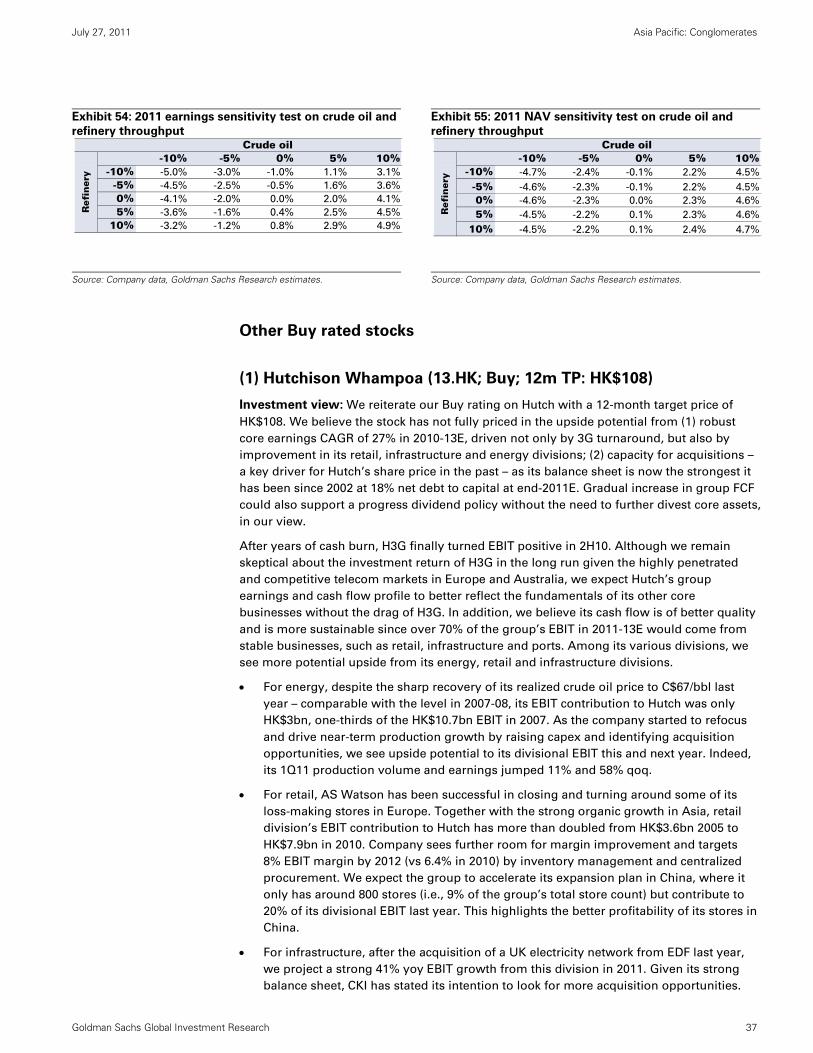
July 27, 2011 Asia Pacific: Conglomerates
Goldman Sachs Global Investment Research 37
Exhibit 54: 2011 earnings sensitivity test on crude oil and
refinery throughput
Exhibit 55: 2011 NAV sensitivity test on crude oil and
refinery throughput
Source: Company data, Goldman Sachs Research estimates.
Source: Company data, Goldman Sachs Research estimates.
Other Buy rated stocks
(1) Hutchison Whampoa (13.HK; Buy; 12m TP: HK$108)
Investment view: We reiterate our Buy rating on Hutch with a 12-month target price of
HK$108. We believe the stock has not fully priced in the upside potential from (1) robust
core earnings CAGR of 27% in 2010-13E, driven not only by 3G turnaround, but also by
improvement in its retail, infrastructure and energy divisions; (2) capacity for acquisitions –
a key driver for Hutch’s share price in the past – as its balance sheet is now the strongest it
has been since 2002 at 18% net debt to capital at end-2011E. Gradual increase in group FCF
could also support a progress dividend policy without the need to further divest core assets,
in our view.
After years of cash burn, H3G finally turned EBIT positive in 2H10. Although we remain
skeptical about the investment return of H3G in the long run given the highly penetrated
and competitive telecom markets in Europe and Australia, we expect Hutch’s group
earnings and cash flow profile to better reflect the fundamentals of its other core
businesses without the drag of H3G. In addition, we believe its cash flow is of better quality
and is more sustainable since over 70% of the group’s EBIT in 2011-13E would come from
stable businesses, such as retail, infrastructure and ports. Among its various divisions, we
see more potential upside from its energy, retail and infrastructure divisions.
For energy, despite the sharp recovery of its realized crude oil price to C$67/bbl last
year – comparable with the level in 2007-08, its EBIT contribution to Hutch was only
HK$3bn, one-thirds of the HK$10.7bn EBIT in 2007. As the company started to refocus
and drive near-term production growth by raising capex and identifying acquisition
opportunities, we see upside potential to its divisional EBIT this and next year. Indeed,
its 1Q11 production volume and earnings jumped 11% and 58% qoq.
For retail, AS Watson has been successful in closing and turning around some of its
loss-making stores in Europe. Together with the strong organic growth in Asia, retail
division’s EBIT contribution to Hutch has more than doubled from HK$3.6bn 2005 to
HK$7.9bn in 2010. Company sees further room for margin improvement and targets
8% EBIT margin by 2012 (vs 6.4% in 2010) by inventory management and centralized
procurement. We expect the group to accelerate its expansion plan in China, where it
only has around 800 stores (i.e., 9% of the group’s total store count) but contribute to
20% of its divisional EBIT last year. This highlights the better profitability of its stores in
China.
For infrastructure, after the acquisition of a UK electricity network from EDF last year,
we project a strong 41% yoy EBIT growth from this division in 2011. Given its strong
balance sheet, CKI has stated its intention to look for more acquisition opportunities.
-10% -5% 0% 5% 10%-10% -5.0% -3.0% -1.0% 1.1% 3.1%
-5% -4.5% -2.5% -0.5% 1.6% 3.6%
0% -4.1% -2.0% 0.0% 2.0% 4.1%
5% -3.6% -1.6% 0.4% 2.5% 4.5%
10% -3.2% -1.2% 0.8% 2.9% 4.9%
Ref
iner
y
Crude oil -10% -5% 0% 5% 10%
-10% -4.7% -2.4% -0.1% 2.2% 4.5%
-5% -4.6% -2.3% -0.1% 2.2% 4.5%
0% -4.6% -2.3% 0.0% 2.3% 4.6%
5% -4.5% -2.2% 0.1% 2.3% 4.6%
10% -4.5% -2.2% 0.1% 2.4% 4.7%
Crude oil
Ref
iner
y
渐飞研究报告 - http://bg.panlv.net
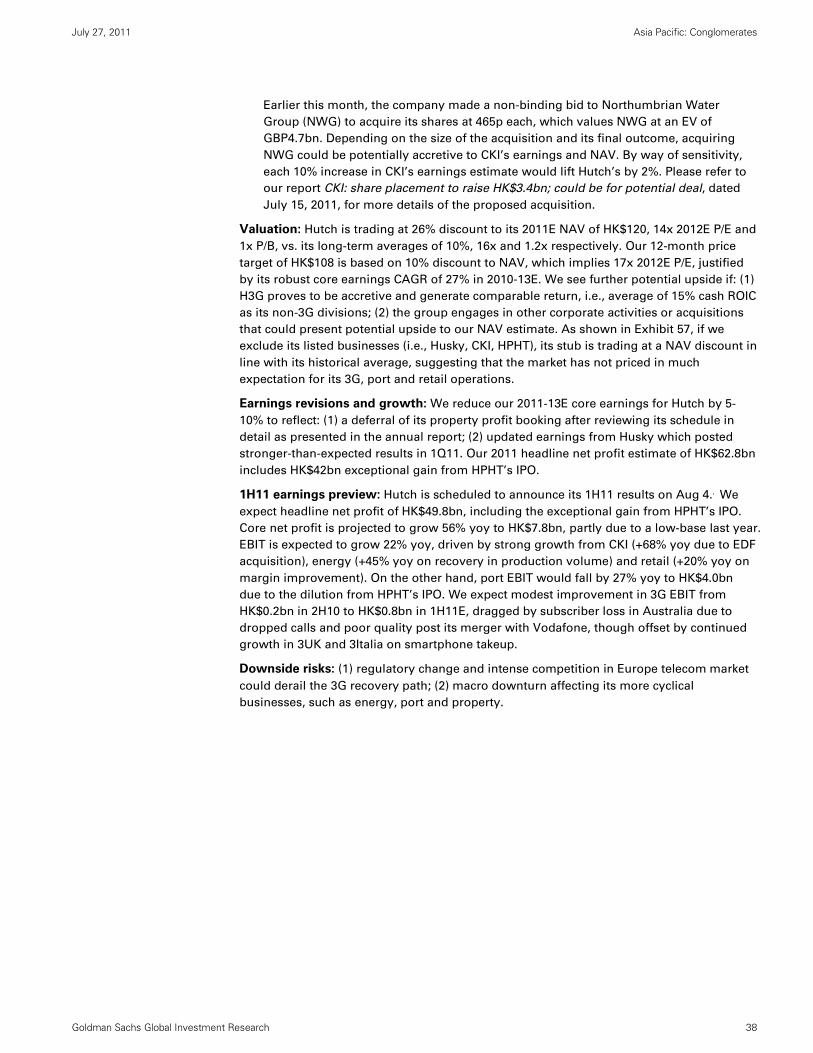
July 27, 2011 Asia Pacific: Conglomerates
Goldman Sachs Global Investment Research 38
Earlier this month, the company made a non-binding bid to Northumbrian Water
Group (NWG) to acquire its shares at 465p each, which values NWG at an EV of
GBP4.7bn. Depending on the size of the acquisition and its final outcome, acquiring
NWG could be potentially accretive to CKI’s earnings and NAV. By way of sensitivity,
each 10% increase in CKI’s earnings estimate would lift Hutch’s by 2%. Please refer to
our report CKI: share placement to raise HK$3.4bn; could be for potential deal, dated
July 15, 2011, for more details of the proposed acquisition.
Valuation: Hutch is trading at 26% discount to its 2011E NAV of HK$120, 14x 2012E P/E and
1x P/B, vs. its long-term averages of 10%, 16x and 1.2x respectively. Our 12-month price
target of HK$108 is based on 10% discount to NAV, which implies 17x 2012E P/E, justified
by its robust core earnings CAGR of 27% in 2010-13E. We see further potential upside if: (1)
H3G proves to be accretive and generate comparable return, i.e., average of 15% cash ROIC
as its non-3G divisions; (2) the group engages in other corporate activities or acquisitions
that could present potential upside to our NAV estimate. As shown in Exhibit 57, if we
exclude its listed businesses (i.e., Husky, CKI, HPHT), its stub is trading at a NAV discount in
line with its historical average, suggesting that the market has not priced in much
expectation for its 3G, port and retail operations.
Earnings revisions and growth: We reduce our 2011-13E core earnings for Hutch by 5-
10% to reflect: (1) a deferral of its property profit booking after reviewing its schedule in
detail as presented in the annual report; (2) updated earnings from Husky which posted
stronger-than-expected results in 1Q11. Our 2011 headline net profit estimate of HK$62.8bn
includes HK$42bn exceptional gain from HPHT’s IPO.
1H11 earnings preview: Hutch is scheduled to announce its 1H11 results on Aug 4.. We
expect headline net profit of HK$49.8bn, including the exceptional gain from HPHT’s IPO.
Core net profit is projected to grow 56% yoy to HK$7.8bn, partly due to a low-base last year.
EBIT is expected to grow 22% yoy, driven by strong growth from CKI (+68% yoy due to EDF
acquisition), energy (+45% yoy on recovery in production volume) and retail (+20% yoy on
margin improvement). On the other hand, port EBIT would fall by 27% yoy to HK$4.0bn
due to the dilution from HPHT’s IPO. We expect modest improvement in 3G EBIT from
HK$0.2bn in 2H10 to HK$0.8bn in 1H11E, dragged by subscriber loss in Australia due to
dropped calls and poor quality post its merger with Vodafone, though offset by continued
growth in 3UK and 3Italia on smartphone takeup.
Downside risks: (1) regulatory change and intense competition in Europe telecom market
could derail the 3G recovery path; (2) macro downturn affecting its more cyclical
businesses, such as energy, port and property.
渐飞研究报告 - http://bg.panlv.net
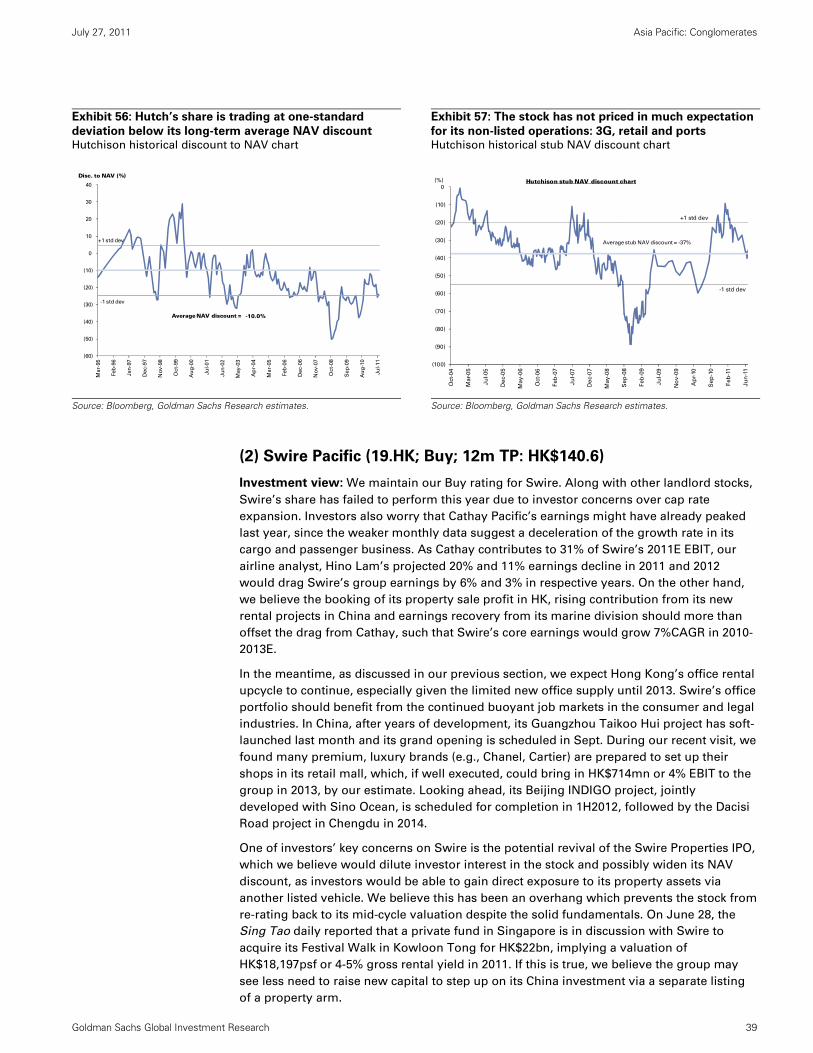
July 27, 2011 Asia Pacific: Conglomerates
Goldman Sachs Global Investment Research 39
Exhibit 56: Hutch’s share is trading at one-standard
deviation below its long-term average NAV discount Hutchison historical discount to NAV chart
Exhibit 57: The stock has not priced in much expectation
for its non-listed operations: 3G, retail and ports Hutchison historical stub NAV discount chart
Source: Bloomberg, Goldman Sachs Research estimates.
Source: Bloomberg, Goldman Sachs Research estimates.
(2) Swire Pacific (19.HK; Buy; 12m TP: HK$140.6)
Investment view: We maintain our Buy rating for Swire. Along with other landlord stocks,
Swire’s share has failed to perform this year due to investor concerns over cap rate
expansion. Investors also worry that Cathay Pacific’s earnings might have already peaked
last year, since the weaker monthly data suggest a deceleration of the growth rate in its
cargo and passenger business. As Cathay contributes to 31% of Swire’s 2011E EBIT, our
airline analyst, Hino Lam’s projected 20% and 11% earnings decline in 2011 and 2012
would drag Swire’s group earnings by 6% and 3% in respective years. On the other hand,
we believe the booking of its property sale profit in HK, rising contribution from its new
rental projects in China and earnings recovery from its marine division should more than
offset the drag from Cathay, such that Swire’s core earnings would grow 7%CAGR in 2010-
2013E.
In the meantime, as discussed in our previous section, we expect Hong Kong’s office rental
upcycle to continue, especially given the limited new office supply until 2013. Swire’s office
portfolio should benefit from the continued buoyant job markets in the consumer and legal
industries. In China, after years of development, its Guangzhou Taikoo Hui project has soft-
launched last month and its grand opening is scheduled in Sept. During our recent visit, we
found many premium, luxury brands (e.g., Chanel, Cartier) are prepared to set up their
shops in its retail mall, which, if well executed, could bring in HK$714mn or 4% EBIT to the
group in 2013, by our estimate. Looking ahead, its Beijing INDIGO project, jointly
developed with Sino Ocean, is scheduled for completion in 1H2012, followed by the Dacisi
Road project in Chengdu in 2014.
One of investors’ key concerns on Swire is the potential revival of the Swire Properties IPO,
which we believe would dilute investor interest in the stock and possibly widen its NAV
discount, as investors would be able to gain direct exposure to its property assets via
another listed vehicle. We believe this has been an overhang which prevents the stock from
re-rating back to its mid-cycle valuation despite the solid fundamentals. On June 28, the
Sing Tao daily reported that a private fund in Singapore is in discussion with Swire to
acquire its Festival Walk in Kowloon Tong for HK$22bn, implying a valuation of
HK$18,197psf or 4-5% gross rental yield in 2011. If this is true, we believe the group may
see less need to raise new capital to step up on its China investment via a separate listing
of a property arm.
(60)
(50)
(40)
(30)
(20)
(10)
0
10
20
30
40
Mar-
95
Feb
-96
Jan
-97
Dec-9
7
No
v-9
8
Oct-
99
Au
g-0
0
Ju
l-01
Ju
n-0
2
May-0
3
Ap
r-04
Mar-
05
Feb
-06
Dec-0
6
No
v-0
7
Oct-
08
Sep
-09
Au
g-1
0
Ju
l-11
Disc. to NAV (%)
+1 std dev
-1 std dev
Average NAV discount = -10.0%
(100)
(90)
(80)
(70)
(60)
(50)
(40)
(30)
(20)
(10)
0
Oct-
04
Mar-
05
Ju
l-05
De
c-0
5
May
-06
Oct-
06
Feb
-07
Ju
l-07
De
c-0
7
May
-08
Se
p-0
8
Feb
-09
Ju
l-09
No
v-0
9
Ap
r-10
Se
p-1
0
Feb
-11
Ju
n-1
1
Average stub NAV discount = -37%
(%)
+1 std dev
-1 std dev
Hutchison stub NAV discount chart
渐飞研究报告 - http://bg.panlv.net
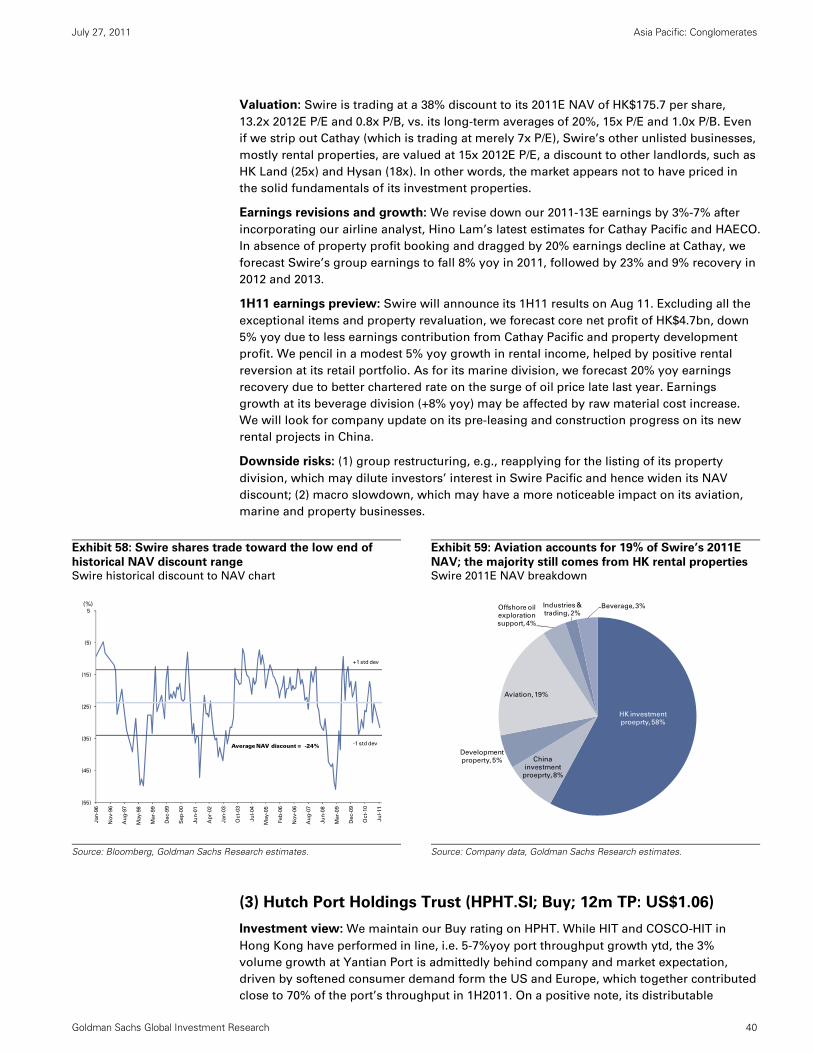
July 27, 2011 Asia Pacific: Conglomerates
Goldman Sachs Global Investment Research 40
Valuation: Swire is trading at a 38% discount to its 2011E NAV of HK$175.7 per share,
13.2x 2012E P/E and 0.8x P/B, vs. its long-term averages of 20%, 15x P/E and 1.0x P/B. Even
if we strip out Cathay (which is trading at merely 7x P/E), Swire’s other unlisted businesses,
mostly rental properties, are valued at 15x 2012E P/E, a discount to other landlords, such as
HK Land (25x) and Hysan (18x). In other words, the market appears not to have priced in
the solid fundamentals of its investment properties.
Earnings revisions and growth: We revise down our 2011-13E earnings by 3%-7% after
incorporating our airline analyst, Hino Lam’s latest estimates for Cathay Pacific and HAECO.
In absence of property profit booking and dragged by 20% earnings decline at Cathay, we
forecast Swire’s group earnings to fall 8% yoy in 2011, followed by 23% and 9% recovery in
2012 and 2013.
1H11 earnings preview: Swire will announce its 1H11 results on Aug 11. Excluding all the
exceptional items and property revaluation, we forecast core net profit of HK$4.7bn, down
5% yoy due to less earnings contribution from Cathay Pacific and property development
profit. We pencil in a modest 5% yoy growth in rental income, helped by positive rental
reversion at its retail portfolio. As for its marine division, we forecast 20% yoy earnings
recovery due to better chartered rate on the surge of oil price late last year. Earnings
growth at its beverage division (+8% yoy) may be affected by raw material cost increase.
We will look for company update on its pre-leasing and construction progress on its new
rental projects in China.
Downside risks: (1) group restructuring, e.g., reapplying for the listing of its property
division, which may dilute investors’ interest in Swire Pacific and hence widen its NAV
discount; (2) macro slowdown, which may have a more noticeable impact on its aviation,
marine and property businesses.
Exhibit 58: Swire shares trade toward the low end of
historical NAV discount range Swire historical discount to NAV chart
Exhibit 59: Aviation accounts for 19% of Swire’s 2011E
NAV; the majority still comes from HK rental properties Swire 2011E NAV breakdown
Source: Bloomberg, Goldman Sachs Research estimates.
Source: Company data, Goldman Sachs Research estimates.
(3) Hutch Port Holdings Trust (HPHT.SI; Buy; 12m TP: US$1.06)
Investment view: We maintain our Buy rating on HPHT. While HIT and COSCO-HIT in
Hong Kong have performed in line, i.e. 5-7%yoy port throughput growth ytd, the 3%
volume growth at Yantian Port is admittedly behind company and market expectation,
driven by softened consumer demand form the US and Europe, which together contributed
close to 70% of the port’s throughput in 1H2011. On a positive note, its distributable
(55)
(45)
(35)
(25)
(15)
(5)
5
Jan
-96
No
v-9
6
Au
g-9
7
May-9
8
Mar-
99
Dec-9
9
Sep
-00
Ju
n-0
1
Ap
r-02
Jan
-03
Oct-
03
Ju
l-04
May-0
5
Feb
-06
No
v-0
6
Au
g-0
7
Ju
n-0
8
Mar-
09
Dec-0
9
Oct-
10
Ju
l-11
(%)
-1 std dev
+1 std dev
Average NAV discount = -24%
HK investment
proeprty, 58%
China
investment
proeprty, 8%
Development
property, 5%
Aviation, 19%
Offshore oil
exploration
support, 4%
Industries &
trading, 2%Beverage, 3%
渐飞研究报告 - http://bg.panlv.net
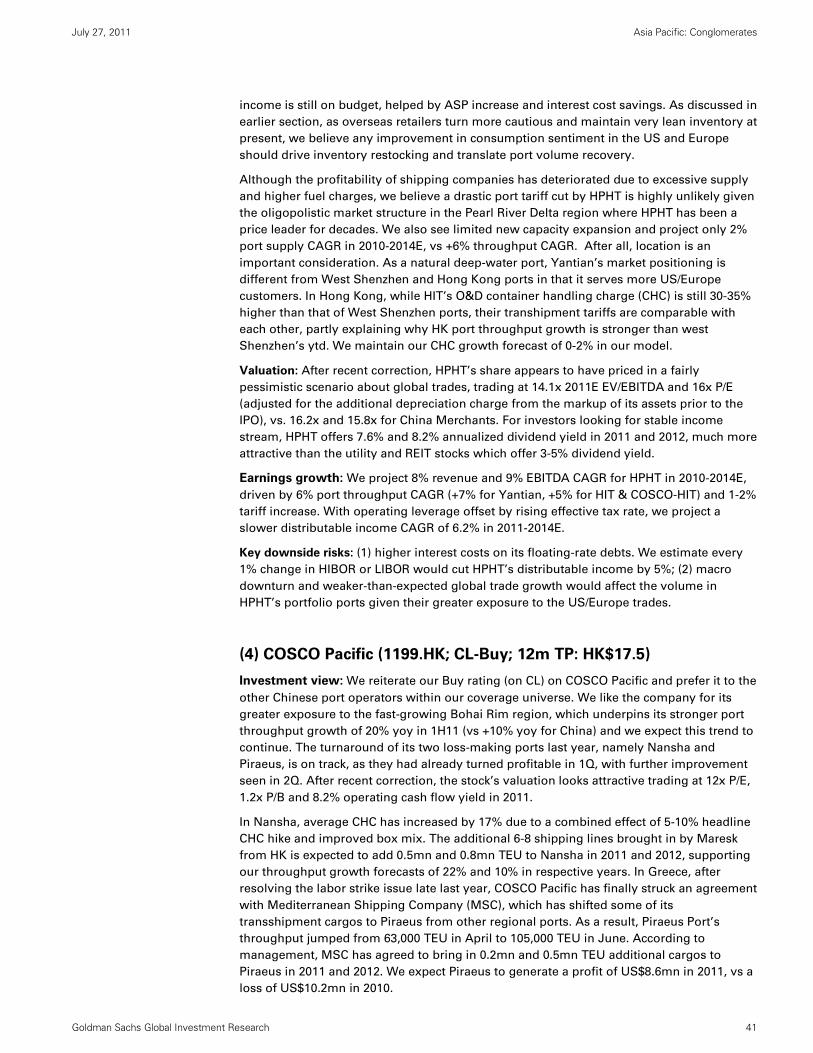
July 27, 2011 Asia Pacific: Conglomerates
Goldman Sachs Global Investment Research 41
income is still on budget, helped by ASP increase and interest cost savings. As discussed in
earlier section, as overseas retailers turn more cautious and maintain very lean inventory at
present, we believe any improvement in consumption sentiment in the US and Europe
should drive inventory restocking and translate port volume recovery.
Although the profitability of shipping companies has deteriorated due to excessive supply
and higher fuel charges, we believe a drastic port tariff cut by HPHT is highly unlikely given
the oligopolistic market structure in the Pearl River Delta region where HPHT has been a
price leader for decades. We also see limited new capacity expansion and project only 2%
port supply CAGR in 2010-2014E, vs +6% throughput CAGR. After all, location is an
important consideration. As a natural deep-water port, Yantian’s market positioning is
different from West Shenzhen and Hong Kong ports in that it serves more US/Europe
customers. In Hong Kong, while HIT’s O&D container handling charge (CHC) is still 30-35%
higher than that of West Shenzhen ports, their transhipment tariffs are comparable with
each other, partly explaining why HK port throughput growth is stronger than west
Shenzhen’s ytd. We maintain our CHC growth forecast of 0-2% in our model.
Valuation: After recent correction, HPHT’s share appears to have priced in a fairly
pessimistic scenario about global trades, trading at 14.1x 2011E EV/EBITDA and 16x P/E
(adjusted for the additional depreciation charge from the markup of its assets prior to the
IPO), vs. 16.2x and 15.8x for China Merchants. For investors looking for stable income
stream, HPHT offers 7.6% and 8.2% annualized dividend yield in 2011 and 2012, much more
attractive than the utility and REIT stocks which offer 3-5% dividend yield.
Earnings growth: We project 8% revenue and 9% EBITDA CAGR for HPHT in 2010-2014E,
driven by 6% port throughput CAGR (+7% for Yantian, +5% for HIT & COSCO-HIT) and 1-2%
tariff increase. With operating leverage offset by rising effective tax rate, we project a
slower distributable income CAGR of 6.2% in 2011-2014E.
Key downside risks: (1) higher interest costs on its floating-rate debts. We estimate every
1% change in HIBOR or LIBOR would cut HPHT’s distributable income by 5%; (2) macro
downturn and weaker-than-expected global trade growth would affect the volume in
HPHT’s portfolio ports given their greater exposure to the US/Europe trades.
(4) COSCO Pacific (1199.HK; CL-Buy; 12m TP: HK$17.5)
Investment view: We reiterate our Buy rating (on CL) on COSCO Pacific and prefer it to the
other Chinese port operators within our coverage universe. We like the company for its
greater exposure to the fast-growing Bohai Rim region, which underpins its stronger port
throughput growth of 20% yoy in 1H11 (vs +10% yoy for China) and we expect this trend to
continue. The turnaround of its two loss-making ports last year, namely Nansha and
Piraeus, is on track, as they had already turned profitable in 1Q, with further improvement
seen in 2Q. After recent correction, the stock’s valuation looks attractive trading at 12x P/E,
1.2x P/B and 8.2% operating cash flow yield in 2011.
In Nansha, average CHC has increased by 17% due to a combined effect of 5-10% headline
CHC hike and improved box mix. The additional 6-8 shipping lines brought in by Maresk
from HK is expected to add 0.5mn and 0.8mn TEU to Nansha in 2011 and 2012, supporting
our throughput growth forecasts of 22% and 10% in respective years. In Greece, after
resolving the labor strike issue late last year, COSCO Pacific has finally struck an agreement
with Mediterranean Shipping Company (MSC), which has shifted some of its
transshipment cargos to Piraeus from other regional ports. As a result, Piraeus Port’s
throughput jumped from 63,000 TEU in April to 105,000 TEU in June. According to
management, MSC has agreed to bring in 0.2mn and 0.5mn TEU additional cargos to
Piraeus in 2011 and 2012. We expect Piraeus to generate a profit of US$8.6mn in 2011, vs a
loss of US$10.2mn in 2010.
渐飞研究报告 - http://bg.panlv.net
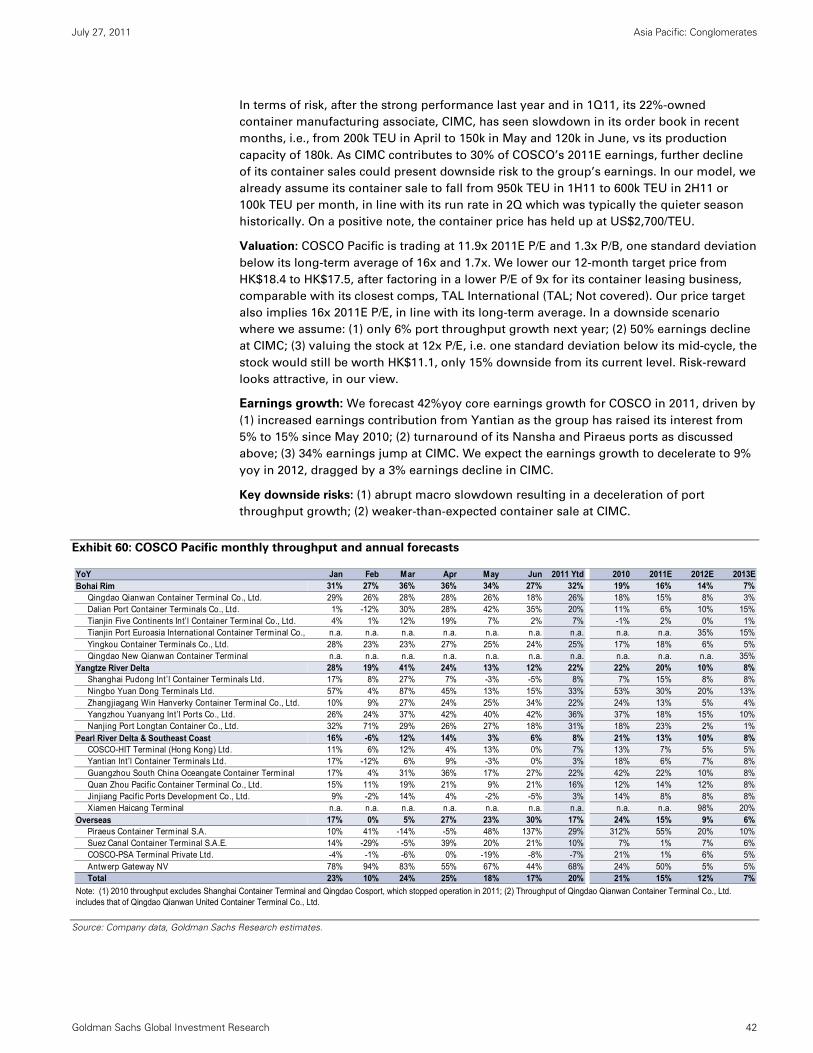
July 27, 2011 Asia Pacific: Conglomerates
Goldman Sachs Global Investment Research 42
In terms of risk, after the strong performance last year and in 1Q11, its 22%-owned
container manufacturing associate, CIMC, has seen slowdown in its order book in recent
months, i.e., from 200k TEU in April to 150k in May and 120k in June, vs its production
capacity of 180k. As CIMC contributes to 30% of COSCO’s 2011E earnings, further decline
of its container sales could present downside risk to the group’s earnings. In our model, we
already assume its container sale to fall from 950k TEU in 1H11 to 600k TEU in 2H11 or
100k TEU per month, in line with its run rate in 2Q which was typically the quieter season
historically. On a positive note, the container price has held up at US$2,700/TEU.
Valuation: COSCO Pacific is trading at 11.9x 2011E P/E and 1.3x P/B, one standard deviation
below its long-term average of 16x and 1.7x. We lower our 12-month target price from
HK$18.4 to HK$17.5, after factoring in a lower P/E of 9x for its container leasing business,
comparable with its closest comps, TAL International (TAL; Not covered). Our price target
also implies 16x 2011E P/E, in line with its long-term average. In a downside scenario
where we assume: (1) only 6% port throughput growth next year; (2) 50% earnings decline
at CIMC; (3) valuing the stock at 12x P/E, i.e. one standard deviation below its mid-cycle, the
stock would still be worth HK$11.1, only 15% downside from its current level. Risk-reward
looks attractive, in our view.
Earnings growth: We forecast 42%yoy core earnings growth for COSCO in 2011, driven by
(1) increased earnings contribution from Yantian as the group has raised its interest from
5% to 15% since May 2010; (2) turnaround of its Nansha and Piraeus ports as discussed
above; (3) 34% earnings jump at CIMC. We expect the earnings growth to decelerate to 9%
yoy in 2012, dragged by a 3% earnings decline in CIMC.
Key downside risks: (1) abrupt macro slowdown resulting in a deceleration of port
throughput growth; (2) weaker-than-expected container sale at CIMC.
Exhibit 60: COSCO Pacific monthly throughput and annual forecasts
Source: Company data, Goldman Sachs Research estimates.
YoY Jan Feb Mar Apr May Jun 2011 Ytd 2010 2011E 2012E 2013E31% 27% 36% 36% 34% 27% 32% 19% 16% 14% 7%
Qingdao Qianwan Container Terminal Co., Ltd. 29% 26% 28% 28% 26% 18% 26% 18% 15% 8% 3%Dalian Port Container Terminals Co., Ltd. 1% -12% 30% 28% 42% 35% 20% 11% 6% 10% 15%Tianjin Five Continents Int’l Container Terminal Co., Ltd. 4% 1% 12% 19% 7% 2% 7% -1% 2% 0% 1%Tianjin Port Euroasia International Container Terminal Co., n.a. n.a. n.a. n.a. n.a. n.a. n.a. n.a. n.a. 35% 15%Yingkou Container Terminals Co., Ltd. 28% 23% 23% 27% 25% 24% 25% 17% 18% 6% 5%Qingdao New Qianwan Container Terminal n.a. n.a. n.a. n.a. n.a. n.a. n.a. n.a. n.a. n.a. 35%
28% 19% 41% 24% 13% 12% 22% 22% 20% 10% 8%Shanghai Pudong Int’l Container Terminals Ltd. 17% 8% 27% 7% -3% -5% 8% 7% 15% 8% 8%Ningbo Yuan Dong Terminals Ltd. 57% 4% 87% 45% 13% 15% 33% 53% 30% 20% 13%Zhangjiagang Win Hanverky Container Terminal Co., Ltd. 10% 9% 27% 24% 25% 34% 22% 24% 13% 5% 4%Yangzhou Yuanyang Int’l Ports Co., Ltd. 26% 24% 37% 42% 40% 42% 36% 37% 18% 15% 10%Nanjing Port Longtan Container Co., Ltd. 32% 71% 29% 26% 27% 18% 31% 18% 23% 2% 1%
16% -6% 12% 14% 3% 6% 8% 21% 13% 10% 8%COSCO-HIT Terminal (Hong Kong) Ltd. 11% 6% 12% 4% 13% 0% 7% 13% 7% 5% 5%Yantian Int’l Container Terminals Ltd. 17% -12% 6% 9% -3% 0% 3% 18% 6% 7% 8%Guangzhou South China Oceangate Container Terminal 17% 4% 31% 36% 17% 27% 22% 42% 22% 10% 8%Quan Zhou Pacific Container Terminal Co., Ltd. 15% 11% 19% 21% 9% 21% 16% 12% 14% 12% 8%Jinjiang Pacific Ports Development Co., Ltd. 9% -2% 14% 4% -2% -5% 3% 14% 8% 8% 8%Xiamen Haicang Terminal n.a. n.a. n.a. n.a. n.a. n.a. n.a. n.a. n.a. 98% 20%
17% 0% 5% 27% 23% 30% 17% 24% 15% 9% 6%Piraeus Container Terminal S.A. 10% 41% -14% -5% 48% 137% 29% 312% 55% 20% 10%Suez Canal Container Terminal S.A.E. 14% -29% -5% 39% 20% 21% 10% 7% 1% 7% 6%COSCO-PSA Terminal Private Ltd. -4% -1% -6% 0% -19% -8% -7% 21% 1% 6% 5%Antwerp Gateway NV 78% 94% 83% 55% 67% 44% 68% 24% 50% 5% 5%Total 23% 10% 24% 25% 18% 17% 20% 21% 15% 12% 7%
Note: (1) 2010 throughput excludes Shanghai Container Terminal and Qingdao Cosport, which stopped operation in 2011; (2) Throughput of Qingdao Qianwan Container Terminal Co., Ltd. includes that of Qingdao Qianwan United Container Terminal Co., Ltd.
Overseas
Pearl River Delta & Southeast Coast
Yangtze River Delta
Bohai Rim
渐飞研究报告 - http://bg.panlv.net
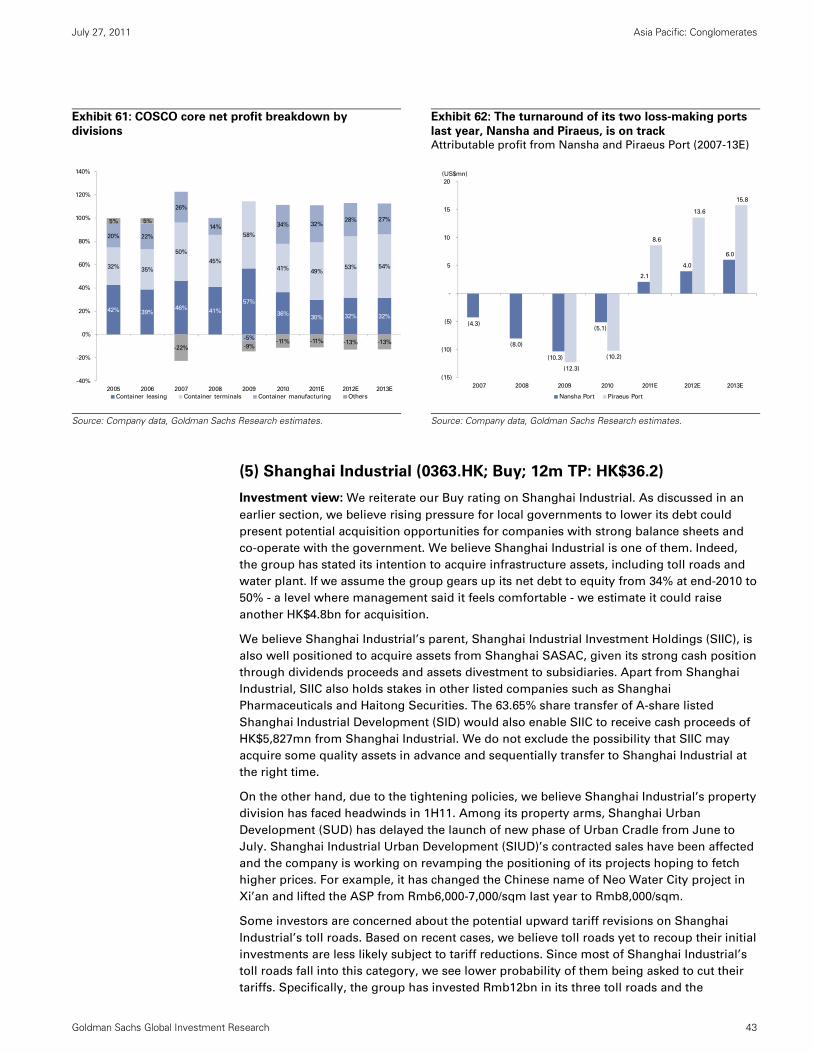
July 27, 2011 Asia Pacific: Conglomerates
Goldman Sachs Global Investment Research 43
Exhibit 61: COSCO core net profit breakdown by
divisions
Exhibit 62: The turnaround of its two loss-making ports
last year, Nansha and Piraeus, is on track Attributable profit from Nansha and Piraeus Port (2007-13E)
Source: Company data, Goldman Sachs Research estimates.
Source: Company data, Goldman Sachs Research estimates.
(5) Shanghai Industrial (0363.HK; Buy; 12m TP: HK$36.2)
Investment view: We reiterate our Buy rating on Shanghai Industrial. As discussed in an
earlier section, we believe rising pressure for local governments to lower its debt could
present potential acquisition opportunities for companies with strong balance sheets and
co-operate with the government. We believe Shanghai Industrial is one of them. Indeed,
the group has stated its intention to acquire infrastructure assets, including toll roads and
water plant. If we assume the group gears up its net debt to equity from 34% at end-2010 to
50% - a level where management said it feels comfortable - we estimate it could raise
another HK$4.8bn for acquisition.
We believe Shanghai Industrial’s parent, Shanghai Industrial Investment Holdings (SIIC), is
also well positioned to acquire assets from Shanghai SASAC, given its strong cash position
through dividends proceeds and assets divestment to subsidiaries. Apart from Shanghai
Industrial, SIIC also holds stakes in other listed companies such as Shanghai
Pharmaceuticals and Haitong Securities. The 63.65% share transfer of A-share listed
Shanghai Industrial Development (SID) would also enable SIIC to receive cash proceeds of
HK$5,827mn from Shanghai Industrial. We do not exclude the possibility that SIIC may
acquire some quality assets in advance and sequentially transfer to Shanghai Industrial at
the right time.
On the other hand, due to the tightening policies, we believe Shanghai Industrial’s property
division has faced headwinds in 1H11. Among its property arms, Shanghai Urban
Development (SUD) has delayed the launch of new phase of Urban Cradle from June to
July. Shanghai Industrial Urban Development (SIUD)’s contracted sales have been affected
and the company is working on revamping the positioning of its projects hoping to fetch
higher prices. For example, it has changed the Chinese name of Neo Water City project in
Xi’an and lifted the ASP from Rmb6,000-7,000/sqm last year to Rmb8,000/sqm.
Some investors are concerned about the potential upward tariff revisions on Shanghai
Industrial’s toll roads. Based on recent cases, we believe toll roads yet to recoup their initial
investments are less likely subject to tariff reductions. Since most of Shanghai Industrial’s
toll roads fall into this category, we see lower probability of them being asked to cut their
tariffs. Specifically, the group has invested Rmb12bn in its three toll roads and the
42% 39%46%
41%
57%
36%30% 32% 32%
32%35%
50%
45%
58%
41%49%
53% 54%
20% 22%
26%
14%
-5%
34% 32%28% 27%5% 5%
-22% -9%-11% -11% -13% -13%
-40%
-20%
0%
20%
40%
60%
80%
100%
120%
140%
2005 2006 2007 2008 2009 2010 2011E 2012E 2013E
Container leasing Container terminals Container manufacturing Others
(4.3)
(8.0)
(10.3)
(5.1)
2.1
4.0
6.0
(12.3)
(10.2)
8.6
13.6
15.8
(15)
(10)
(5)
-
5
10
15
20
2007 2008 2009 2010 2011E 2012E 2013E
Nansha Port Piraeus Port
(US$mn)
渐飞研究报告 - http://bg.panlv.net
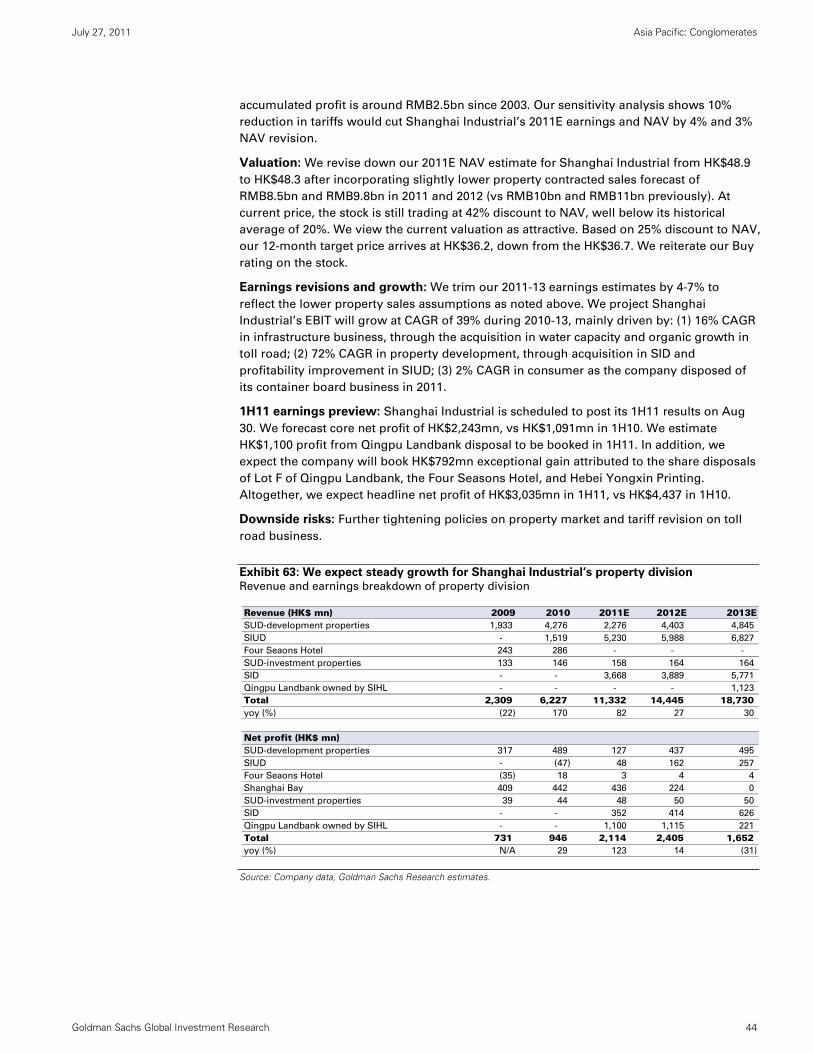
July 27, 2011 Asia Pacific: Conglomerates
Goldman Sachs Global Investment Research 44
accumulated profit is around RMB2.5bn since 2003. Our sensitivity analysis shows 10%
reduction in tariffs would cut Shanghai Industrial’s 2011E earnings and NAV by 4% and 3%
NAV revision.
Valuation: We revise down our 2011E NAV estimate for Shanghai Industrial from HK$48.9
to HK$48.3 after incorporating slightly lower property contracted sales forecast of
RMB8.5bn and RMB9.8bn in 2011 and 2012 (vs RMB10bn and RMB11bn previously). At
current price, the stock is still trading at 42% discount to NAV, well below its historical
average of 20%. We view the current valuation as attractive. Based on 25% discount to NAV,
our 12-month target price arrives at HK$36.2, down from the HK$36.7. We reiterate our Buy
rating on the stock.
Earnings revisions and growth: We trim our 2011-13 earnings estimates by 4-7% to
reflect the lower property sales assumptions as noted above. We project Shanghai
Industrial’s EBIT will grow at CAGR of 39% during 2010-13, mainly driven by: (1) 16% CAGR
in infrastructure business, through the acquisition in water capacity and organic growth in
toll road; (2) 72% CAGR in property development, through acquisition in SID and
profitability improvement in SIUD; (3) 2% CAGR in consumer as the company disposed of
its container board business in 2011.
1H11 earnings preview: Shanghai Industrial is scheduled to post its 1H11 results on Aug
30. We forecast core net profit of HK$2,243mn, vs HK$1,091mn in 1H10. We estimate
HK$1,100 profit from Qingpu Landbank disposal to be booked in 1H11. In addition, we
expect the company will book HK$792mn exceptional gain attributed to the share disposals
of Lot F of Qingpu Landbank, the Four Seasons Hotel, and Hebei Yongxin Printing.
Altogether, we expect headline net profit of HK$3,035mn in 1H11, vs HK$4,437 in 1H10.
Downside risks: Further tightening policies on property market and tariff revision on toll
road business.
Exhibit 63: We expect steady growth for Shanghai Industrial’s property division
Revenue and earnings breakdown of property division
Source: Company data, Goldman Sachs Research estimates.
Revenue (HK$ mn) 2009 2010 2011E 2012E 2013ESUD-development properties 1,933 4,276 2,276 4,403 4,845
SIUD - 1,519 5,230 5,988 6,827
Four Seaons Hotel 243 286 - - -
SUD-investment properties 133 146 158 164 164
SID - - 3,668 3,889 5,771
Qingpu Landbank owned by SIHL - - - - 1,123
Total 2,309 6,227 11,332 14,445 18,730 yoy (%) (22) 170 82 27 30
Net profit (HK$ mn)SUD-development properties 317 489 127 437 495
SIUD - (47) 48 162 257
Four Seaons Hotel (35) 18 3 4 4
Shanghai Bay 409 442 436 224 0
SUD-investment properties 39 44 48 50 50
SID - - 352 414 626
Qingpu Landbank owned by SIHL - - 1,100 1,115 221
Total 731 946 2,114 2,405 1,652yoy (%) N/A 29 123 14 (31)
渐飞研究报告 - http://bg.panlv.net
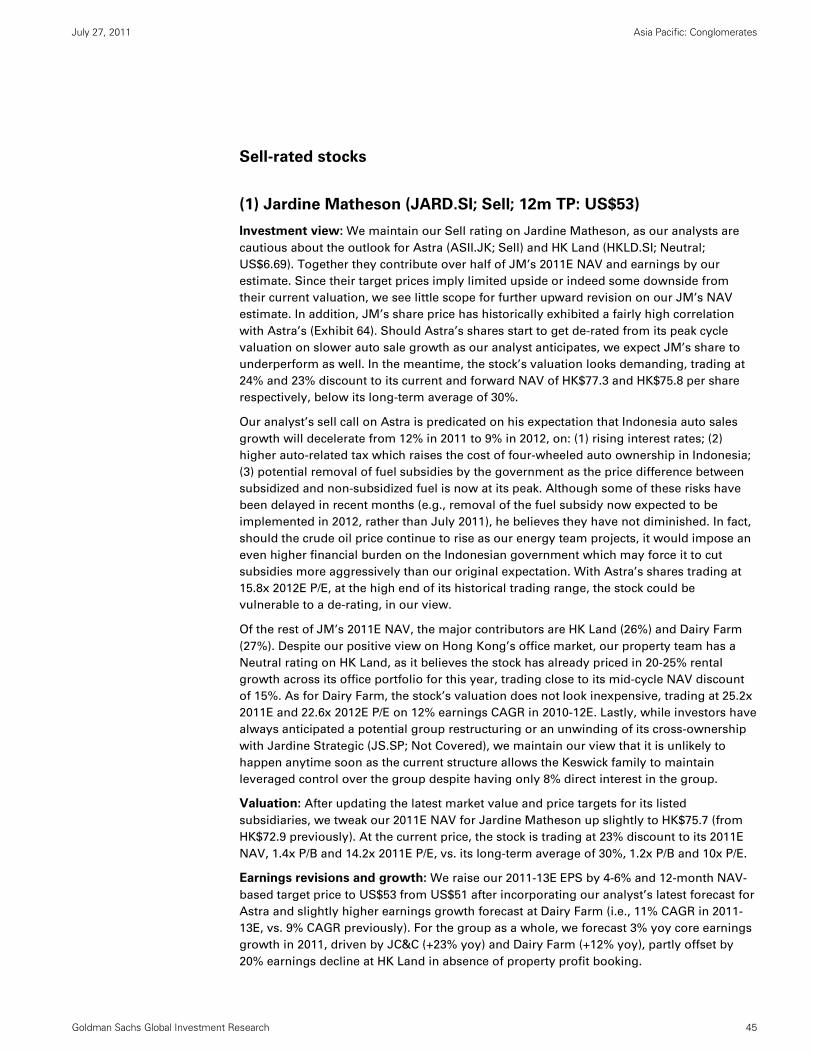
July 27, 2011 Asia Pacific: Conglomerates
Goldman Sachs Global Investment Research 45
Sell-rated stocks
(1) Jardine Matheson (JARD.SI; Sell; 12m TP: US$53)
Investment view: We maintain our Sell rating on Jardine Matheson, as our analysts are
cautious about the outlook for Astra (ASII.JK; Sell) and HK Land (HKLD.SI; Neutral;
US$6.69). Together they contribute over half of JM’s 2011E NAV and earnings by our
estimate. Since their target prices imply limited upside or indeed some downside from
their current valuation, we see little scope for further upward revision on our JM’s NAV
estimate. In addition, JM’s share price has historically exhibited a fairly high correlation
with Astra’s (Exhibit 64). Should Astra’s shares start to get de-rated from its peak cycle
valuation on slower auto sale growth as our analyst anticipates, we expect JM’s share to
underperform as well. In the meantime, the stock’s valuation looks demanding, trading at
24% and 23% discount to its current and forward NAV of HK$77.3 and HK$75.8 per share
respectively, below its long-term average of 30%.
Our analyst’s sell call on Astra is predicated on his expectation that Indonesia auto sales
growth will decelerate from 12% in 2011 to 9% in 2012, on: (1) rising interest rates; (2)
higher auto-related tax which raises the cost of four-wheeled auto ownership in Indonesia;
(3) potential removal of fuel subsidies by the government as the price difference between
subsidized and non-subsidized fuel is now at its peak. Although some of these risks have
been delayed in recent months (e.g., removal of the fuel subsidy now expected to be
implemented in 2012, rather than July 2011), he believes they have not diminished. In fact,
should the crude oil price continue to rise as our energy team projects, it would impose an
even higher financial burden on the Indonesian government which may force it to cut
subsidies more aggressively than our original expectation. With Astra’s shares trading at
15.8x 2012E P/E, at the high end of its historical trading range, the stock could be
vulnerable to a de-rating, in our view.
Of the rest of JM’s 2011E NAV, the major contributors are HK Land (26%) and Dairy Farm
(27%). Despite our positive view on Hong Kong’s office market, our property team has a
Neutral rating on HK Land, as it believes the stock has already priced in 20-25% rental
growth across its office portfolio for this year, trading close to its mid-cycle NAV discount
of 15%. As for Dairy Farm, the stock’s valuation does not look inexpensive, trading at 25.2x
2011E and 22.6x 2012E P/E on 12% earnings CAGR in 2010-12E. Lastly, while investors have
always anticipated a potential group restructuring or an unwinding of its cross-ownership
with Jardine Strategic (JS.SP; Not Covered), we maintain our view that it is unlikely to
happen anytime soon as the current structure allows the Keswick family to maintain
leveraged control over the group despite having only 8% direct interest in the group.
Valuation: After updating the latest market value and price targets for its listed
subsidiaries, we tweak our 2011E NAV for Jardine Matheson up slightly to HK$75.7 (from
HK$72.9 previously). At the current price, the stock is trading at 23% discount to its 2011E
NAV, 1.4x P/B and 14.2x 2011E P/E, vs. its long-term average of 30%, 1.2x P/B and 10x P/E.
Earnings revisions and growth: We raise our 2011-13E EPS by 4-6% and 12-month NAV-
based target price to US$53 from US$51 after incorporating our analyst’s latest forecast for
Astra and slightly higher earnings growth forecast at Dairy Farm (i.e., 11% CAGR in 2011-
13E, vs. 9% CAGR previously). For the group as a whole, we forecast 3% yoy core earnings
growth in 2011, driven by JC&C (+23% yoy) and Dairy Farm (+12% yoy), partly offset by
20% earnings decline at HK Land in absence of property profit booking.
渐飞研究报告 - http://bg.panlv.net
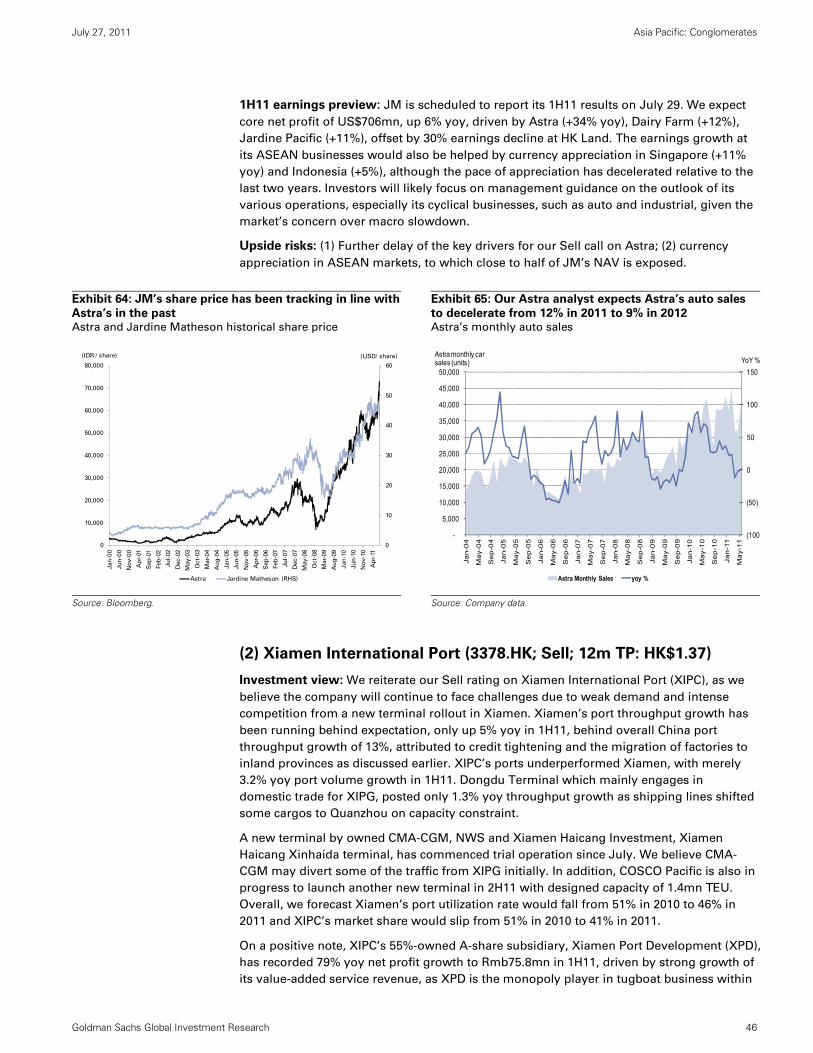
July 27, 2011 Asia Pacific: Conglomerates
Goldman Sachs Global Investment Research 46
1H11 earnings preview: JM is scheduled to report its 1H11 results on July 29. We expect
core net profit of US$706mn, up 6% yoy, driven by Astra (+34% yoy), Dairy Farm (+12%),
Jardine Pacific (+11%), offset by 30% earnings decline at HK Land. The earnings growth at
its ASEAN businesses would also be helped by currency appreciation in Singapore (+11%
yoy) and Indonesia (+5%), although the pace of appreciation has decelerated relative to the
last two years. Investors will likely focus on management guidance on the outlook of its
various operations, especially its cyclical businesses, such as auto and industrial, given the
market’s concern over macro slowdown.
Upside risks: (1) Further delay of the key drivers for our Sell call on Astra; (2) currency
appreciation in ASEAN markets, to which close to half of JM’s NAV is exposed.
Exhibit 64: JM’s share price has been tracking in line with
Astra’s in the past Astra and Jardine Matheson historical share price
Exhibit 65: Our Astra analyst expects Astra’s auto sales
to decelerate from 12% in 2011 to 9% in 2012 Astra’s monthly auto sales
Source: Bloomberg.
Source: Company data.
(2) Xiamen International Port (3378.HK; Sell; 12m TP: HK$1.37)
Investment view: We reiterate our Sell rating on Xiamen International Port (XIPC), as we
believe the company will continue to face challenges due to weak demand and intense
competition from a new terminal rollout in Xiamen. Xiamen’s port throughput growth has
been running behind expectation, only up 5% yoy in 1H11, behind overall China port
throughput growth of 13%, attributed to credit tightening and the migration of factories to
inland provinces as discussed earlier. XIPC’s ports underperformed Xiamen, with merely
3.2% yoy port volume growth in 1H11. Dongdu Terminal which mainly engages in
domestic trade for XIPG, posted only 1.3% yoy throughput growth as shipping lines shifted
some cargos to Quanzhou on capacity constraint.
A new terminal by owned CMA-CGM, NWS and Xiamen Haicang Investment, Xiamen
Haicang Xinhaida terminal, has commenced trial operation since July. We believe CMA-
CGM may divert some of the traffic from XIPG initially. In addition, COSCO Pacific is also in
progress to launch another new terminal in 2H11 with designed capacity of 1.4mn TEU.
Overall, we forecast Xiamen’s port utilization rate would fall from 51% in 2010 to 46% in
2011 and XIPC’s market share would slip from 51% in 2010 to 41% in 2011.
On a positive note, XIPC’s 55%-owned A-share subsidiary, Xiamen Port Development (XPD),
has recorded 79% yoy net profit growth to Rmb75.8mn in 1H11, driven by strong growth of
its value-added service revenue, as XPD is the monopoly player in tugboat business within
0
10
20
30
40
50
60
0
10,000
20,000
30,000
40,000
50,000
60,000
70,000
80,000
Jan
-00
Ju
n-0
0
No
v-0
0
Ap
r-01
Sep
-01
Feb
-02
Ju
l-02
Dec-0
2
May-0
3
Oct-
03
Mar-
04
Au
g-0
4
Jan
-05
Ju
n-0
5
No
v-0
5
Ap
r-06
Sep
-06
Feb
-07
Ju
l-07
Dec-0
7
May-0
8
Oct-
08
Mar-
09
Au
g-0
9
Jan
-10
Ju
n-1
0
No
v-1
0
Ap
r-11
Astra Jardine Matheson (RHS)
(IDR / share) (USD/ share)
(100
(50)
0
50
100
150
-
5,000
10,000
15,000
20,000
25,000
30,000
35,000
40,000
45,000
50,000
Ja
n-0
4
Ma
y-0
4
Se
p-0
4
Ja
n-0
5
Ma
y-0
5
Se
p-0
5
Ja
n-0
6
Ma
y-0
6
Se
p-0
6
Ja
n-0
7
Ma
y-0
7
Se
p-0
7
Ja
n-0
8
Ma
y-0
8
Se
p-0
8
Ja
n-0
9
Ma
y-0
9
Se
p-0
9
Ja
n-1
0
Ma
y-1
0
Se
p-1
0
Ja
n-1
1
Ma
y-1
1
YoY %Astra monthly car sales (units)
Astra Monthly Sales yoy %
渐飞研究报告 - http://bg.panlv.net
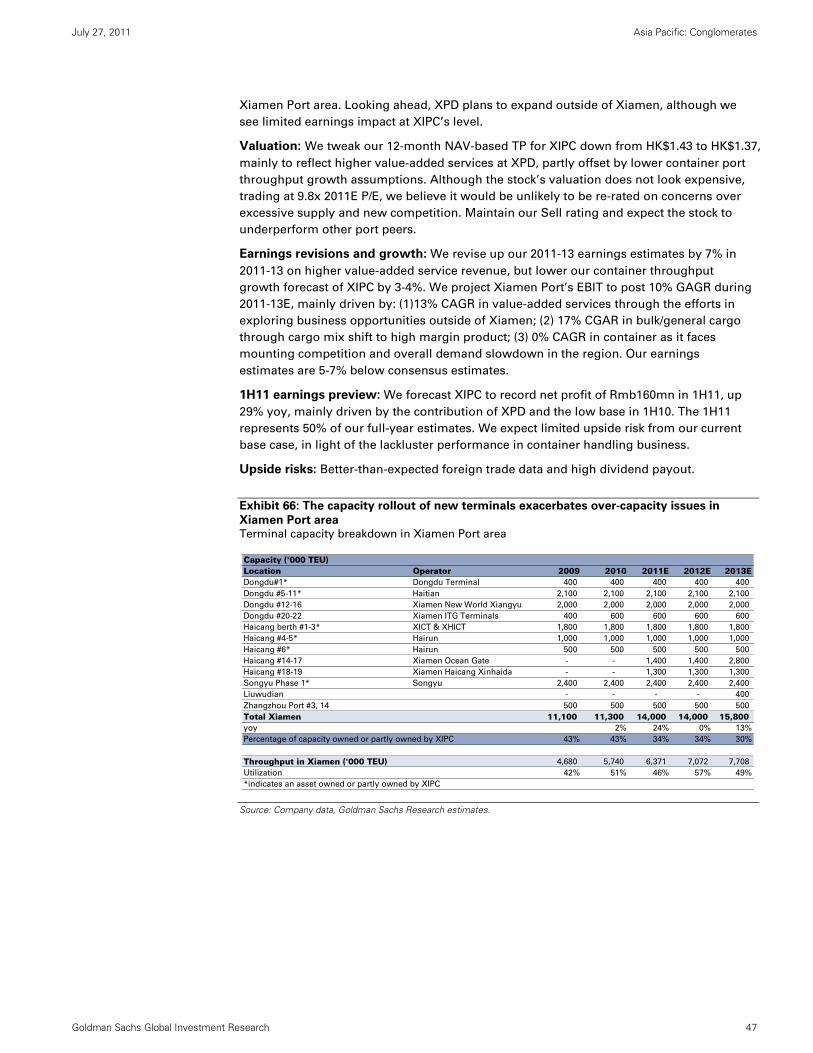
July 27, 2011 Asia Pacific: Conglomerates
Goldman Sachs Global Investment Research 47
Xiamen Port area. Looking ahead, XPD plans to expand outside of Xiamen, although we
see limited earnings impact at XIPC’s level.
Valuation: We tweak our 12-month NAV-based TP for XIPC down from HK$1.43 to HK$1.37,
mainly to reflect higher value-added services at XPD, partly offset by lower container port
throughput growth assumptions. Although the stock’s valuation does not look expensive,
trading at 9.8x 2011E P/E, we believe it would be unlikely to be re-rated on concerns over
excessive supply and new competition. Maintain our Sell rating and expect the stock to
underperform other port peers.
Earnings revisions and growth: We revise up our 2011-13 earnings estimates by 7% in
2011-13 on higher value-added service revenue, but lower our container throughput
growth forecast of XIPC by 3-4%. We project Xiamen Port’s EBIT to post 10% GAGR during
2011-13E, mainly driven by: (1)13% CAGR in value-added services through the efforts in
exploring business opportunities outside of Xiamen; (2) 17% CGAR in bulk/general cargo
through cargo mix shift to high margin product; (3) 0% CAGR in container as it faces
mounting competition and overall demand slowdown in the region. Our earnings
estimates are 5-7% below consensus estimates.
1H11 earnings preview: We forecast XIPC to record net profit of Rmb160mn in 1H11, up
29% yoy, mainly driven by the contribution of XPD and the low base in 1H10. The 1H11
represents 50% of our full-year estimates. We expect limited upside risk from our current
base case, in light of the lackluster performance in container handling business.
Upside risks: Better-than-expected foreign trade data and high dividend payout.
Exhibit 66: The capacity rollout of new terminals exacerbates over-capacity issues in
Xiamen Port area Terminal capacity breakdown in Xiamen Port area
Source: Company data, Goldman Sachs Research estimates.
Capacity ('000 TEU)Location Operator 2009 2010 2011E 2012E 2013EDongdu#1* Dongdu Terminal 400 400 400 400 400
Dongdu #5-11* Haitian 2,100 2,100 2,100 2,100 2,100
Dongdu #12-16 Xiamen New World Xiangyu 2,000 2,000 2,000 2,000 2,000
Dongdu #20-22 Xiamen ITG Terminals 400 600 600 600 600
Haicang berth #1-3* XICT & XHICT 1,800 1,800 1,800 1,800 1,800
Haicang #4-5* Hairun 1,000 1,000 1,000 1,000 1,000
Haicang #6* Hairun 500 500 500 500 500
Haicang #14-17 Xiamen Ocean Gate - - 1,400 1,400 2,800
Haicang #18-19 Xiamen Haicang Xinhaida - - 1,300 1,300 1,300
Songyu Phase 1* Songyu 2,400 2,400 2,400 2,400 2,400
Liuwudian - - - - 400
Zhangzhou Port #3, 14 500 500 500 500 500
Total Xiamen 11,100 11,300 14,000 14,000 15,800yoy 2% 24% 0% 13%
Percentage of capacity owned or partly owned by XIPC 43% 43% 34% 34% 30%
Throughput in Xiamen ('000 TEU) 4,680 5,740 6,371 7,072 7,708
Utilization 42% 51% 46% 57% 49%
*indicates an asset owned or partly owned by XIPC
渐飞研究报告 - http://bg.panlv.net
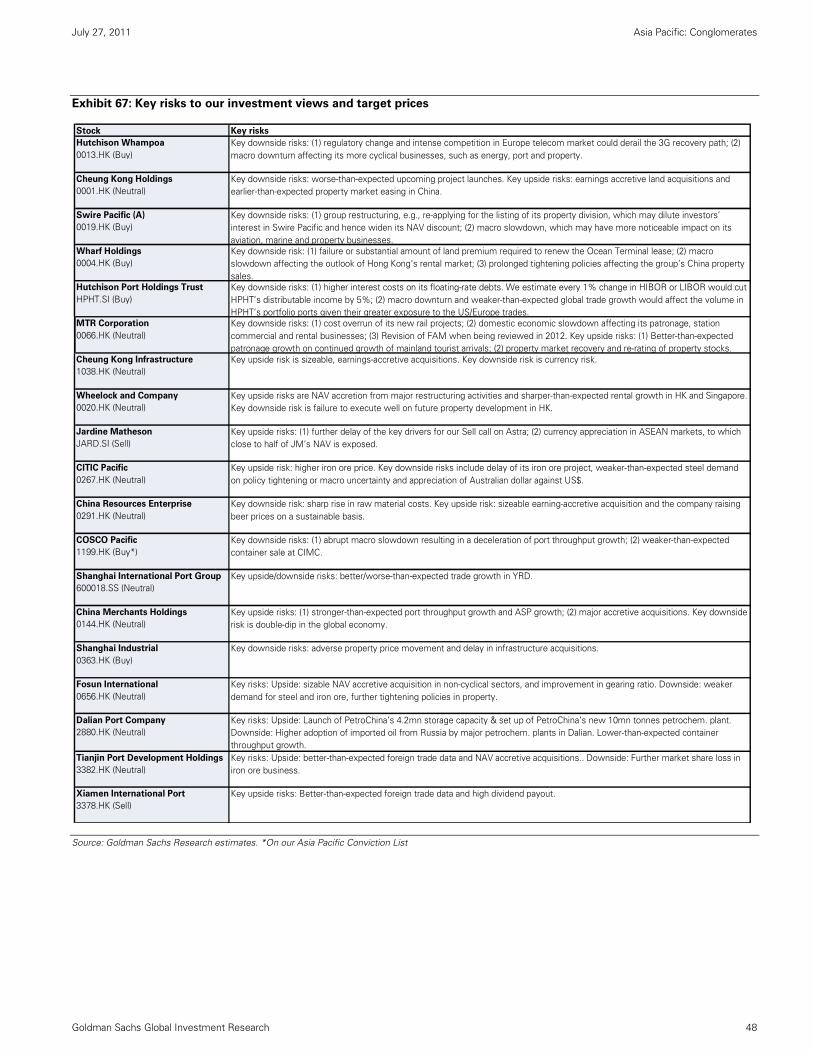
July 27, 2011 Asia Pacific: Conglomerates
Goldman Sachs Global Investment Research 48
Exhibit 67: Key risks to our investment views and target prices
Source: Goldman Sachs Research estimates. *On our Asia Pacific Conviction List
Stock Key risks
Hutchison Whampoa
0013.HK (Buy)
Cheung Kong Holdings
0001.HK (Neutral)
Swire Pacific (A)
0019.HK (Buy)
Wharf Holdings
0004.HK (Buy)
Hutchison Port Holdings Trust
HPHT.SI (Buy)
MTR Corporation
0066.HK (Neutral)
Cheung Kong Infrastructure
1038.HK (Neutral)
Wheelock and Company
0020.HK (Neutral)
Jardine Matheson
JARD.SI (Sell)
CITIC Pacific
0267.HK (Neutral)
China Resources Enterprise
0291.HK (Neutral)
COSCO Pacific
1199.HK (Buy*)
Shanghai International Port Group
600018.SS (Neutral)
China Merchants Holdings
0144.HK (Neutral)
Shanghai Industrial
0363.HK (Buy)
Fosun International
0656.HK (Neutral)
Dalian Port Company
2880.HK (Neutral)
Tianjin Port Development Holdings
3382.HK (Neutral)
Xiamen International Port
3378.HK (Sell)
Key risks: Upside: better-than-expected foreign trade data and NAV accretive acquisitions.. Downside: Further market share loss in iron ore business.
Key upside risks: Better-than-expected foreign trade data and high dividend payout.
Key risks: Upside: sizable NAV accretive acquisition in non-cyclical sectors, and improvement in gearing ratio. Downside: weaker demand for steel and iron ore, further tightening policies in property.
Key risks: Upside: Launch of PetroChina’s 4.2mn storage capacity & set up of PetroChina’s new 10mn tonnes petrochem. plant. Downside: Higher adoption of imported oil from Russia by major petrochem. plants in Dalian. Lower-than-expected container throughput growth.
Key upside/downside risks: better/worse-than-expected trade growth in YRD.
Key upside risks: (1) stronger-than-expected port throughput growth and ASP growth; (2) major accretive acquisitions. Key downside risk is double-dip in the global economy.
Key downside risks: adverse property price movement and delay in infrastructure acquisitions.
Key upside risk: higher iron ore price. Key downside risks include delay of its iron ore project, weaker-than-expected steel demand on policy tightening or macro uncertainty and appreciation of Australian dollar against US$.
Key downside risk: sharp rise in raw material costs. Key upside risk: sizeable earning-accretive acquisition and the company raising beer prices on a sustainable basis.
Key downside risks: (1) abrupt macro slowdown resulting in a deceleration of port throughput growth; (2) weaker-than-expected container sale at CIMC.
Key upside risks are NAV accretion from major restructuring activities and sharper-than-expected rental growth in HK and Singapore. Key downside risk is failure to execute well on future property development in HK.
Key upside risks: (1) further delay of the key drivers for our Sell call on Astra; (2) currency appreciation in ASEAN markets, to which close to half of JM’s NAV is exposed.
Key downside risk: (1) failure or substantial amount of land premium required to renew the Ocean Terminal lease; (2) macro slowdown affecting the outlook of Hong Kong’s rental market; (3) prolonged tightening policies affecting the group’s China property sales.Key downside risks: (1) higher interest costs on its floating-rate debts. We estimate every 1% change in HIBOR or LIBOR would cut HPHT’s distributable income by 5%; (2) macro downturn and weaker-than-expected global trade growth would affect the volume in HPHT’s portfolio ports given their greater exposure to the US/Europe trades.Key downside risks: (1) cost overrun of its new rail projects; (2) domestic economic slowdown affecting its patronage, station commercial and rental businesses; (3) Revision of FAM when being reviewed in 2012. Key upside risks: (1) Better-than-expected patronage growth on continued growth of mainland tourist arrivals; (2) property market recovery and re-rating of property stocks.
Key downside risks: (1) regulatory change and intense competition in Europe telecom market could derail the 3G recovery path; (2) macro downturn affecting its more cyclical businesses, such as energy, port and property.
Key downside risks: worse-than-expected upcoming project launches. Key upside risks: earnings accretive land acquisitions and earlier-than-expected property market easing in China.
Key downside risks: (1) group restructuring, e.g., re-applying for the listing of its property division, which may dilute investors’ interest in Swire Pacific and hence widen its NAV discount; (2) macro slowdown, which may have more noticeable impact on its aviation, marine and property businesses.
Key upside risk is sizeable, earnings-accretive acquisitions. Key downside risk is currency risk.
渐飞研究报告 - http://bg.panlv.net
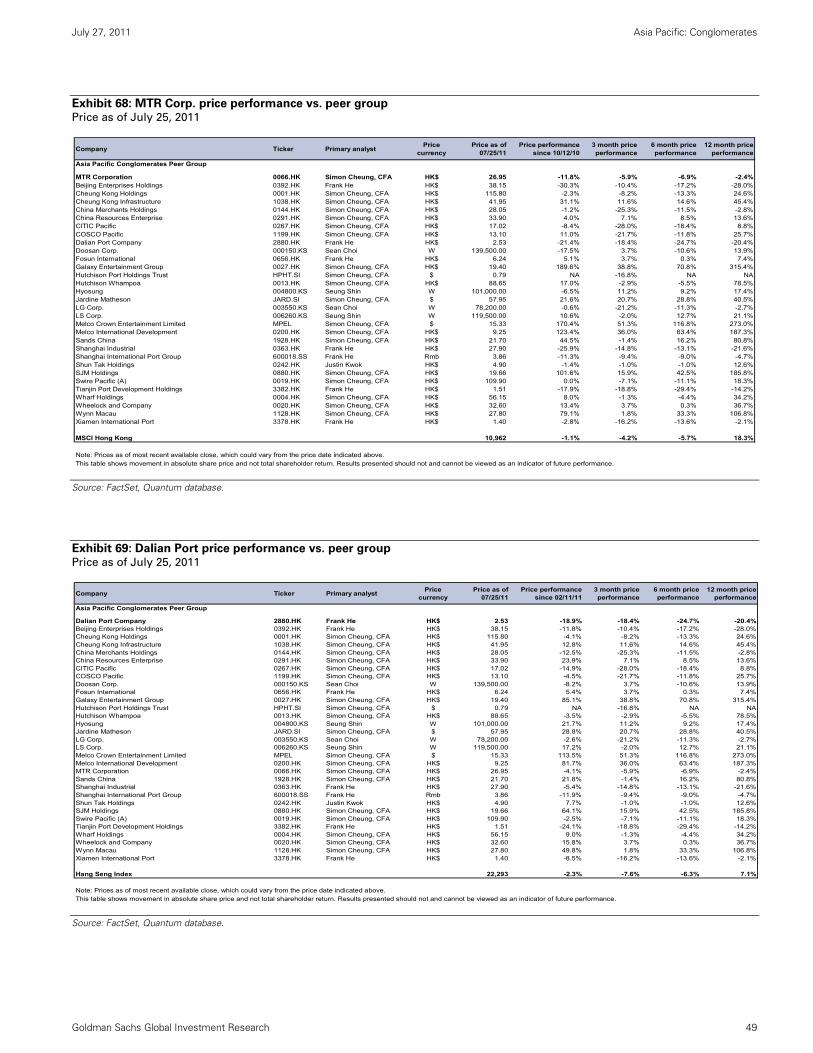
July 27, 2011 Asia Pacific: Conglomerates
Goldman Sachs Global Investment Research 49
Exhibit 68: MTR Corp. price performance vs. peer group Price as of July 25, 2011
Source: FactSet, Quantum database.
Exhibit 69: Dalian Port price performance vs. peer group Price as of July 25, 2011
Source: FactSet, Quantum database.
Company Ticker Primary analystPrice
currencyPrice as of
07/25/11Price performance
since 10/12/103 month price performance
6 month price performance
12 month price performance
Asia Pacific Conglomerates Peer Group MTR Corporation 0066.HK Simon Cheung, CFA HK$ 26.95 -11.8% -5.9% -6.9% -2.4%Beijing Enterprises Holdings 0392.HK Frank He HK$ 38.15 -30.3% -10.4% -17.2% -28.0%Cheung Kong Holdings 0001.HK Simon Cheung, CFA HK$ 115.80 -2.3% -8.2% -13.3% 24.6%Cheung Kong Infrastructure 1038.HK Simon Cheung, CFA HK$ 41.95 31.1% 11.6% 14.6% 45.4%China Merchants Holdings 0144.HK Simon Cheung, CFA HK$ 28.05 -1.2% -25.3% -11.5% -2.8%China Resources Enterprise 0291.HK Simon Cheung, CFA HK$ 33.90 4.0% 7.1% 8.5% 13.6%CITIC Pacific 0267.HK Simon Cheung, CFA HK$ 17.02 -8.4% -28.0% -18.4% 8.8%COSCO Pacific 1199.HK Simon Cheung, CFA HK$ 13.10 11.0% -21.7% -11.8% 25.7%Dalian Port Company 2880.HK Frank He HK$ 2.53 -21.4% -18.4% -24.7% -20.4%Doosan Corp. 000150.KS Sean Choi W 139,500.00 -17.5% 3.7% -10.6% 13.9%Fosun International 0656.HK Frank He HK$ 6.24 5.1% 3.7% 0.3% 7.4%Galaxy Entertainment Group 0027.HK Simon Cheung, CFA HK$ 19.40 189.6% 38.8% 70.8% 315.4%Hutchison Port Holdings Trust HPHT.SI Simon Cheung, CFA $ 0.79 NA -16.8% NA NAHutchison Whampoa 0013.HK Simon Cheung, CFA HK$ 88.65 17.0% -2.9% -5.5% 78.5%Hyosung 004800.KS Seung Shin W 101,000.00 -6.5% 11.2% 9.2% 17.4%Jardine Matheson JARD.SI Simon Cheung, CFA $ 57.95 21.6% 20.7% 28.8% 40.5%LG Corp. 003550.KS Sean Choi W 78,200.00 -0.6% -21.2% -11.3% -2.7%LS Corp. 006260.KS Seung Shin W 119,500.00 10.6% -2.0% 12.7% 21.1%Melco Crown Entertainment Limited MPEL Simon Cheung, CFA $ 15.33 170.4% 51.3% 116.8% 273.0%Melco International Development 0200.HK Simon Cheung, CFA HK$ 9.25 123.4% 36.0% 63.4% 187.3%Sands China 1928.HK Simon Cheung, CFA HK$ 21.70 44.5% -1.4% 16.2% 80.8%Shanghai Industrial 0363.HK Frank He HK$ 27.90 -25.9% -14.8% -13.1% -21.6%Shanghai International Port Group 600018.SS Frank He Rmb 3.86 -11.3% -9.4% -9.0% -4.7%Shun Tak Holdings 0242.HK Justin Kwok HK$ 4.90 -1.4% -1.0% -1.0% 12.6%SJM Holdings 0880.HK Simon Cheung, CFA HK$ 19.66 101.6% 15.9% 42.5% 185.8%Swire Pacific (A) 0019.HK Simon Cheung, CFA HK$ 109.90 0.0% -7.1% -11.1% 18.3%Tianjin Port Development Holdings 3382.HK Frank He HK$ 1.51 -17.9% -18.8% -29.4% -14.2%Wharf Holdings 0004.HK Simon Cheung, CFA HK$ 56.15 8.0% -1.3% -4.4% 34.2%Wheelock and Company 0020.HK Simon Cheung, CFA HK$ 32.60 13.4% 3.7% 0.3% 36.7%Wynn Macau 1128.HK Simon Cheung, CFA HK$ 27.80 79.1% 1.8% 33.3% 106.8%Xiamen International Port 3378.HK Frank He HK$ 1.40 -2.8% -16.2% -13.6% -2.1%
MSCI Hong Kong 10,962 -1.1% -4.2% -5.7% 18.3%
Note: Prices as of most recent available close, which could vary from the price date indicated above.This table shows movement in absolute share price and not total shareholder return. Results presented should not and cannot be viewed as an indicator of future performance.
Company Ticker Primary analystPrice
currencyPrice as of
07/25/11Price performance
since 02/11/113 month price performance
6 month price performance
12 month price performance
Asia Pacific Conglomerates Peer Group Dalian Port Company 2880.HK Frank He HK$ 2.53 -18.9% -18.4% -24.7% -20.4%Beijing Enterprises Holdings 0392.HK Frank He HK$ 38.15 -11.8% -10.4% -17.2% -28.0%Cheung Kong Holdings 0001.HK Simon Cheung, CFA HK$ 115.80 -4.1% -8.2% -13.3% 24.6%Cheung Kong Infrastructure 1038.HK Simon Cheung, CFA HK$ 41.95 12.8% 11.6% 14.6% 45.4%China Merchants Holdings 0144.HK Simon Cheung, CFA HK$ 28.05 -12.5% -25.3% -11.5% -2.8%China Resources Enterprise 0291.HK Simon Cheung, CFA HK$ 33.90 23.9% 7.1% 8.5% 13.6%CITIC Pacific 0267.HK Simon Cheung, CFA HK$ 17.02 -14.9% -28.0% -18.4% 8.8%COSCO Pacific 1199.HK Simon Cheung, CFA HK$ 13.10 -4.5% -21.7% -11.8% 25.7%Doosan Corp. 000150.KS Sean Choi W 139,500.00 -8.2% 3.7% -10.6% 13.9%Fosun International 0656.HK Frank He HK$ 6.24 5.4% 3.7% 0.3% 7.4%Galaxy Entertainment Group 0027.HK Simon Cheung, CFA HK$ 19.40 85.1% 38.8% 70.8% 315.4%Hutchison Port Holdings Trust HPHT.SI Simon Cheung, CFA $ 0.79 NA -16.8% NA NAHutchison Whampoa 0013.HK Simon Cheung, CFA HK$ 88.65 -3.5% -2.9% -5.5% 78.5%Hyosung 004800.KS Seung Shin W 101,000.00 21.7% 11.2% 9.2% 17.4%Jardine Matheson JARD.SI Simon Cheung, CFA $ 57.95 28.8% 20.7% 28.8% 40.5%LG Corp. 003550.KS Sean Choi W 78,200.00 -2.6% -21.2% -11.3% -2.7%LS Corp. 006260.KS Seung Shin W 119,500.00 17.2% -2.0% 12.7% 21.1%Melco Crown Entertainment Limited MPEL Simon Cheung, CFA $ 15.33 113.5% 51.3% 116.8% 273.0%Melco International Development 0200.HK Simon Cheung, CFA HK$ 9.25 81.7% 36.0% 63.4% 187.3%MTR Corporation 0066.HK Simon Cheung, CFA HK$ 26.95 -4.1% -5.9% -6.9% -2.4%Sands China 1928.HK Simon Cheung, CFA HK$ 21.70 21.8% -1.4% 16.2% 80.8%Shanghai Industrial 0363.HK Frank He HK$ 27.90 -5.4% -14.8% -13.1% -21.6%Shanghai International Port Group 600018.SS Frank He Rmb 3.86 -11.9% -9.4% -9.0% -4.7%Shun Tak Holdings 0242.HK Justin Kwok HK$ 4.90 7.7% -1.0% -1.0% 12.6%SJM Holdings 0880.HK Simon Cheung, CFA HK$ 19.66 64.1% 15.9% 42.5% 185.8%Swire Pacific (A) 0019.HK Simon Cheung, CFA HK$ 109.90 -2.5% -7.1% -11.1% 18.3%Tianjin Port Development Holdings 3382.HK Frank He HK$ 1.51 -24.1% -18.8% -29.4% -14.2%Wharf Holdings 0004.HK Simon Cheung, CFA HK$ 56.15 9.0% -1.3% -4.4% 34.2%Wheelock and Company 0020.HK Simon Cheung, CFA HK$ 32.60 15.8% 3.7% 0.3% 36.7%Wynn Macau 1128.HK Simon Cheung, CFA HK$ 27.80 49.8% 1.8% 33.3% 106.8%Xiamen International Port 3378.HK Frank He HK$ 1.40 -8.5% -16.2% -13.6% -2.1%
Hang Seng Index 22,293 -2.3% -7.6% -6.3% 7.1%
Note: Prices as of most recent available close, which could vary from the price date indicated above.This table shows movement in absolute share price and not total shareholder return. Results presented should not and cannot be viewed as an indicator of future performance.
渐飞研究报告 - http://bg.panlv.net
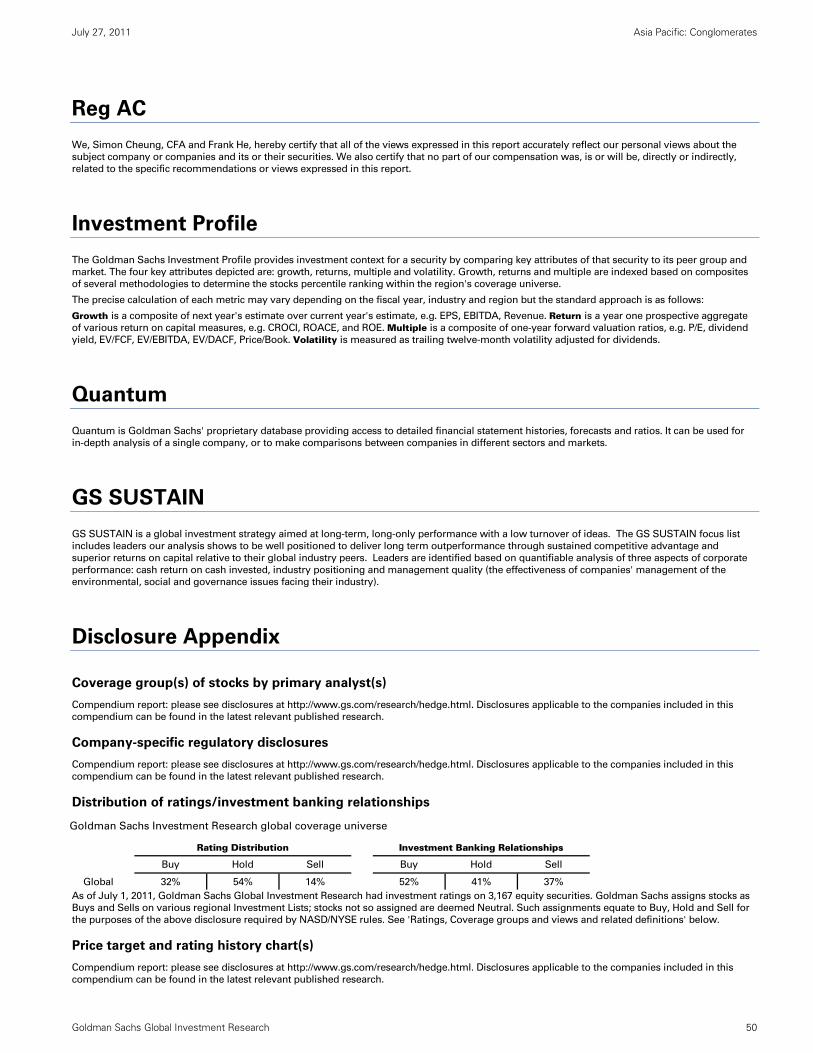
July 27, 2011 Asia Pacific: Conglomerates
Goldman Sachs Global Investment Research 50
Reg AC
We, Simon Cheung, CFA and Frank He, hereby certify that all of the views expressed in this report accurately reflect our personal views about the
subject company or companies and its or their securities. We also certify that no part of our compensation was, is or will be, directly or indirectly,
related to the specific recommendations or views expressed in this report.
Investment Profile
The Goldman Sachs Investment Profile provides investment context for a security by comparing key attributes of that security to its peer group and
market. The four key attributes depicted are: growth, returns, multiple and volatility. Growth, returns and multiple are indexed based on composites
of several methodologies to determine the stocks percentile ranking within the region's coverage universe.
The precise calculation of each metric may vary depending on the fiscal year, industry and region but the standard approach is as follows:
Growth is a composite of next year's estimate over current year's estimate, e.g. EPS, EBITDA, Revenue. Return is a year one prospective aggregate
of various return on capital measures, e.g. CROCI, ROACE, and ROE. Multiple is a composite of one-year forward valuation ratios, e.g. P/E, dividend
yield, EV/FCF, EV/EBITDA, EV/DACF, Price/Book. Volatility is measured as trailing twelve-month volatility adjusted for dividends.
Quantum
Quantum is Goldman Sachs' proprietary database providing access to detailed financial statement histories, forecasts and ratios. It can be used for
in-depth analysis of a single company, or to make comparisons between companies in different sectors and markets.
GS SUSTAIN
GS SUSTAIN is a global investment strategy aimed at long-term, long-only performance with a low turnover of ideas. The GS SUSTAIN focus list
includes leaders our analysis shows to be well positioned to deliver long term outperformance through sustained competitive advantage and
superior returns on capital relative to their global industry peers. Leaders are identified based on quantifiable analysis of three aspects of corporate
performance: cash return on cash invested, industry positioning and management quality (the effectiveness of companies' management of the
environmental, social and governance issues facing their industry).
Disclosure Appendix
Coverage group(s) of stocks by primary analyst(s)
Compendium report: please see disclosures at http://www.gs.com/research/hedge.html. Disclosures applicable to the companies included in this
compendium can be found in the latest relevant published research.
Company-specific regulatory disclosures
Compendium report: please see disclosures at http://www.gs.com/research/hedge.html. Disclosures applicable to the companies included in this
compendium can be found in the latest relevant published research.
Distribution of ratings/investment banking relationships
Goldman Sachs Investment Research global coverage universe
Rating Distribution Investment Banking Relationships
Buy Hold Sell Buy Hold Sell
Global 32% 54% 14% 52% 41% 37%
As of July 1, 2011, Goldman Sachs Global Investment Research had investment ratings on 3,167 equity securities. Goldman Sachs assigns stocks as
Buys and Sells on various regional Investment Lists; stocks not so assigned are deemed Neutral. Such assignments equate to Buy, Hold and Sell for
the purposes of the above disclosure required by NASD/NYSE rules. See 'Ratings, Coverage groups and views and related definitions' below.
Price target and rating history chart(s)
Compendium report: please see disclosures at http://www.gs.com/research/hedge.html. Disclosures applicable to the companies included in this
compendium can be found in the latest relevant published research.
渐飞研究报告 - http://bg.panlv.net
July 27, 2011 Asia Pacific: Conglomerates
Goldman Sachs Global Investment Research 51
Regulatory disclosures
Disclosures required by United States laws and regulations
See company-specific regulatory disclosures above for any of the following disclosures required as to companies referred to in this report: manager
or co-manager in a pending transaction; 1% or other ownership; compensation for certain services; types of client relationships; managed/co-
managed public offerings in prior periods; directorships; for equity securities, market making and/or specialist role. Goldman Sachs usually makes a
market in fixed income securities of issuers discussed in this report and usually deals as a principal in these securities.
The following are additional required disclosures: Ownership and material conflicts of interest: Goldman Sachs policy prohibits its analysts,
professionals reporting to analysts and members of their households from owning securities of any company in the analyst's area of coverage.
Analyst compensation: Analysts are paid in part based on the profitability of Goldman Sachs, which includes investment banking revenues. Analyst as officer or director: Goldman Sachs policy prohibits its analysts, persons reporting to analysts or members of their households from serving as an
officer, director, advisory board member or employee of any company in the analyst's area of coverage. Non-U.S. Analysts: Non-U.S. analysts may
not be associated persons of Goldman Sachs & Co. and therefore may not be subject to NASD Rule 2711/NYSE Rules 472 restrictions on
communications with subject company, public appearances and trading securities held by the analysts.
Distribution of ratings: See the distribution of ratings disclosure above. Price chart: See the price chart, with changes of ratings and price targets in
prior periods, above, or, if electronic format or if with respect to multiple companies which are the subject of this report, on the Goldman Sachs
website at http://www.gs.com/research/hedge.html.
Additional disclosures required under the laws and regulations of jurisdictions other than the United States
The following disclosures are those required by the jurisdiction indicated, except to the extent already made above pursuant to United States laws
and regulations. Australia: This research, and any access to it, is intended only for "wholesale clients" within the meaning of the Australian
Corporations Act. Brazil: Disclosure information in relation to CVM Instruction 483 is available at http://www.gs.com/worldwide/brazil/gir/index.html.
Where applicable, the Brazil-registered analyst primarily responsible for the content of this research report, as defined in Article 16 of CVM Instruction
483, is the first author named at the beginning of this report, unless indicated otherwise at the end of the text. Canada: Goldman Sachs & Co. has
approved of, and agreed to take responsibility for, this research in Canada if and to the extent it relates to equity securities of Canadian issuers.
Analysts may conduct site visits but are prohibited from accepting payment or reimbursement by the company of travel expenses for such visits.
Hong Kong: Further information on the securities of covered companies referred to in this research may be obtained on request from Goldman
Sachs (Asia) L.L.C. India: Further information on the subject company or companies referred to in this research may be obtained from Goldman
Sachs (India) Securities Private Limited; Japan: See below. Korea: Further information on the subject company or companies referred to in this
research may be obtained from Goldman Sachs (Asia) L.L.C., Seoul Branch. Russia: Research reports distributed in the Russian Federation are not
advertising as defined in the Russian legislation, but are information and analysis not having product promotion as their main purpose and do not
provide appraisal within the meaning of the Russian legislation on appraisal activity. Singapore: Further information on the covered companies
referred to in this research may be obtained from Goldman Sachs (Singapore) Pte. (Company Number: 198602165W). Taiwan: This material is for
reference only and must not be reprinted without permission. Investors should carefully consider their own investment risk. Investment results are
the responsibility of the individual investor. United Kingdom: Persons who would be categorized as retail clients in the United Kingdom, as such
term is defined in the rules of the Financial Services Authority, should read this research in conjunction with prior Goldman Sachs research on the
covered companies referred to herein and should refer to the risk warnings that have been sent to them by Goldman Sachs International. A copy of
these risks warnings, and a glossary of certain financial terms used in this report, are available from Goldman Sachs International on request.
European Union: Disclosure information in relation to Article 4 (1) (d) and Article 6 (2) of the European Commission Directive 2003/126/EC is available
at http://www.gs.com/client_services/global_investment_research/europeanpolicy.html which states the European Policy for Managing Conflicts of
Interest in Connection with Investment Research.
Japan: Goldman Sachs Japan Co., Ltd. is a Financial Instrument Dealer under the Financial Instrument and Exchange Law, registered with the Kanto
Financial Bureau (Registration No. 69), and is a member of Japan Securities Dealers Association (JSDA) and Financial Futures Association of Japan
(FFAJ). Sales and purchase of equities are subject to commission pre-determined with clients plus consumption tax. See company-specific
disclosures as to any applicable disclosures required by Japanese stock exchanges, the Japanese Securities Dealers Association or the Japanese
Securities Finance Company.
Ratings, coverage groups and views and related definitions
Buy (B), Neutral (N), Sell (S) -Analysts recommend stocks as Buys or Sells for inclusion on various regional Investment Lists. Being assigned a Buy
or Sell on an Investment List is determined by a stock's return potential relative to its coverage group as described below. Any stock not assigned as
a Buy or a Sell on an Investment List is deemed Neutral. Each regional Investment Review Committee manages various regional Investment Lists to a
global guideline of 25%-35% of stocks as Buy and 10%-15% of stocks as Sell; however, the distribution of Buys and Sells in any particular coverage
group may vary as determined by the regional Investment Review Committee. Regional Conviction Buy and Sell lists represent investment
recommendations focused on either the size of the potential return or the likelihood of the realization of the return.
Return potential represents the price differential between the current share price and the price target expected during the time horizon associated
with the price target. Price targets are required for all covered stocks. The return potential, price target and associated time horizon are stated in each
report adding or reiterating an Investment List membership.
Coverage groups and views: A list of all stocks in each coverage group is available by primary analyst, stock and coverage group at
http://www.gs.com/research/hedge.html. The analyst assigns one of the following coverage views which represents the analyst's investment outlook
on the coverage group relative to the group's historical fundamentals and/or valuation. Attractive (A). The investment outlook over the following 12
months is favorable relative to the coverage group's historical fundamentals and/or valuation. Neutral (N). The investment outlook over the following
12 months is neutral relative to the coverage group's historical fundamentals and/or valuation. Cautious (C). The investment outlook over the
following 12 months is unfavorable relative to the coverage group's historical fundamentals and/or valuation.
Not Rated (NR). The investment rating and target price have been removed pursuant to Goldman Sachs policy when Goldman Sachs is acting in an
advisory capacity in a merger or strategic transaction involving this company and in certain other circumstances. Rating Suspended (RS). Goldman
Sachs Research has suspended the investment rating and price target for this stock, because there is not a sufficient fundamental basis for
determining, or there are legal, regulatory or policy constraints around publishing, an investment rating or target. The previous investment rating and
price target, if any, are no longer in effect for this stock and should not be relied upon. Coverage Suspended (CS). Goldman Sachs has suspended
coverage of this company. Not Covered (NC). Goldman Sachs does not cover this company. Not Available or Not Applicable (NA). The information
is not available for display or is not applicable. Not Meaningful (NM). The information is not meaningful and is therefore excluded.
渐飞研究报告 - http://bg.panlv.net
July 27, 2011 Asia Pacific: Conglomerates
Goldman Sachs Global Investment Research 52
Global product; distributing entities
The Global Investment Research Division of Goldman Sachs produces and distributes research products for clients of Goldman Sachs, and pursuant
to certain contractual arrangements, on a global basis. Analysts based in Goldman Sachs offices around the world produce equity research on
industries and companies, and research on macroeconomics, currencies, commodities and portfolio strategy. This research is disseminated in
Australia by Goldman Sachs & Partners Australia Pty Ltd (ABN 21 006 797 897) on behalf of Goldman Sachs; in Brazil by Goldman Sachs do Brasil
Banco Múltiplo S.A.; in Canada by Goldman Sachs & Co. regarding Canadian equities and by Goldman Sachs & Co. (all other research); in Hong
Kong by Goldman Sachs (Asia) L.L.C.; in India by Goldman Sachs (India) Securities Private Ltd.; in Japan by Goldman Sachs Japan Co., Ltd.; in the
Republic of Korea by Goldman Sachs (Asia) L.L.C., Seoul Branch; in New Zealand by Goldman Sachs & Partners New Zealand Limited on behalf of
Goldman Sachs; in Russia by OOO Goldman Sachs; in Singapore by Goldman Sachs (Singapore) Pte. (Company Number: 198602165W); and in the
United States of America by Goldman Sachs & Co. Goldman Sachs International has approved this research in connection with its distribution in the
United Kingdom and European Union.
European Union: Goldman Sachs International, authorized and regulated by the Financial Services Authority, has approved this research in
connection with its distribution in the European Union and United Kingdom; Goldman Sachs & Co. oHG, regulated by the Bundesanstalt für
Finanzdienstleistungsaufsicht, may also distribute research in Germany.
General disclosures
This research is for our clients only. Other than disclosures relating to Goldman Sachs, this research is based on current public information that we
consider reliable, but we do not represent it is accurate or complete, and it should not be relied on as such. We seek to update our research as
appropriate, but various regulations may prevent us from doing so. Other than certain industry reports published on a periodic basis, the large
majority of reports are published at irregular intervals as appropriate in the analyst's judgment.
Goldman Sachs conducts a global full-service, integrated investment banking, investment management, and brokerage business. We have
investment banking and other business relationships with a substantial percentage of the companies covered by our Global Investment Research
Division. Goldman Sachs & Co., the United States broker dealer, is a member of SIPC (http://www.sipc.org).
Our salespeople, traders, and other professionals may provide oral or written market commentary or trading strategies to our clients and our
proprietary trading desks that reflect opinions that are contrary to the opinions expressed in this research. Our asset management area, our
proprietary trading desks and investing businesses may make investment decisions that are inconsistent with the recommendations or views
expressed in this research.
We and our affiliates, officers, directors, and employees, excluding equity and credit analysts, will from time to time have long or short positions in,
act as principal in, and buy or sell, the securities or derivatives, if any, referred to in this research.
This research is not an offer to sell or the solicitation of an offer to buy any security in any jurisdiction where such an offer or solicitation would be
illegal. It does not constitute a personal recommendation or take into account the particular investment objectives, financial situations, or needs of
individual clients. Clients should consider whether any advice or recommendation in this research is suitable for their particular circumstances and, if
appropriate, seek professional advice, including tax advice. The price and value of investments referred to in this research and the income from them
may fluctuate. Past performance is not a guide to future performance, future returns are not guaranteed, and a loss of original capital may occur.
Fluctuations in exchange rates could have adverse effects on the value or price of, or income derived from, certain investments.
Certain transactions, including those involving futures, options, and other derivatives, give rise to substantial risk and are not suitable for all investors.
Investors should review current options disclosure documents which are available from Goldman Sachs sales representatives or at
http://www.theocc.com/about/publications/character-risks.jsp. Transactions cost may be significant in option strategies calling for multiple purchase
and sales of options such as spreads. Supporting documentation will be supplied upon request.
All research reports are disseminated and available to all clients simultaneously through electronic publication to our internal client websites. Not all
research content is redistributed to our clients or available to third-party aggregators, nor is Goldman Sachs responsible for the redistribution of our
research by third party aggregators. For all research available on a particular stock, please contact your sales representative or go to
http://360.gs.com.
Disclosure information is also available at http://www.gs.com/research/hedge.html or from Research Compliance, 200 West Street, New York, NY
10282.
Copyright 2011 Goldman Sachs.
No part of this material may be (i) copied, photocopied or duplicated in any form by any means or (ii) redistributed without the prior written consent of The Goldman Sachs Group, Inc.
渐飞研究报告 - http://bg.panlv.net