asean+3 regional economic outlook 2019: building capacity
TRANSCRIPT

ASEAN+3 Regional Economic Outlook 2019:
Building Capacity and Connectivity for the New Economy
1
18 June 2019
Jakarta, Indonesia

2
Near Term Macroeconomic Prospects & Challenges
Longer Term Structural Shifts:
Building Capacity and Connectivity for the New Economy
Outline

Global Risk Map – Risks Faced by ASEAN+3 Region
3Imminence
Lo
w M
ed
ium
H
igh
Short Term (now up to 2 yrs) Medium Term (2 to 5 yrs) Long Term (> 5 yrs)
Legend: Low Impact Medium Impact High Impact
Perennial Risks
Cyber-Attacks
Climate Change
Sharp
deceleration
in G3 growth
& weaker oil
prices
Sharp
slowdown in
China’s
growth
Escalation
of global trade
tensions from
imposition of
additional tariffs
by the U.S.
Escalation of
geopolitical
risks
Lik
elih
oo
d
Large swings
in asset prices
from global
monetary policy
shifts
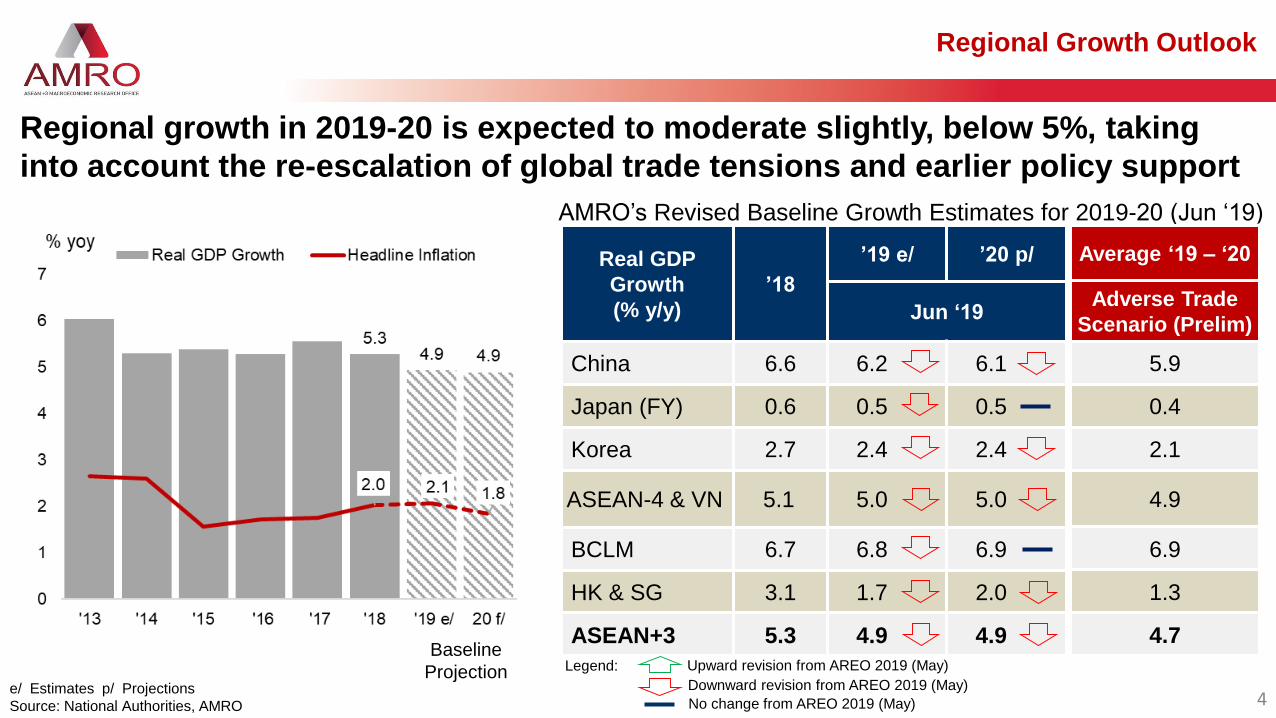
Regional Growth Outlook
Real GDP
Growth
(% y/y)
’18
’19 e/ ’20 p/
Jun ‘19
China 6.6 6.2 6.1
Japan (FY) 0.6 0.5 0.5
Korea 2.7 2.4 2.4
ASEAN-4 & VN 5.1 5.0 5.0
BCLM 6.7 6.8 6.9
HK & SG 3.1 1.7 2.0
ASEAN+3 5.3 4.9 4.9
AMRO’s Revised Baseline Growth Estimates for 2019-20 (Jun ‘19)
Average ‘19 – ‘20
Adverse Trade
Scenario (Prelim)
5.9
0.4
2.1
4.9
6.9
1.3
4.7
Upward revision from AREO 2019 (May)
Downward revision from AREO 2019 (May)
No change from AREO 2019 (May) 4
Regional growth in 2019-20 is expected to moderate slightly, below 5%, taking
into account the re-escalation of global trade tensions and earlier policy support
Legend:
e/ Estimates p/ Projections
Source: National Authorities, AMRO
Baseline
Projection
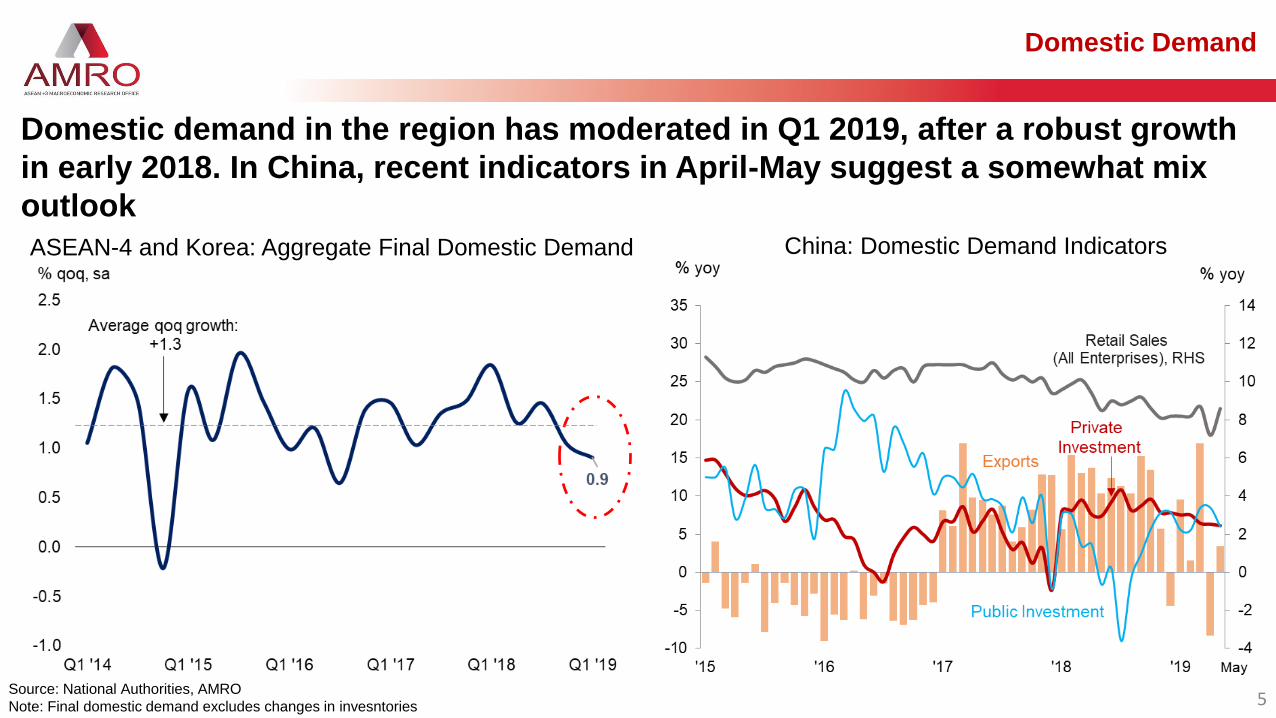
Domestic Demand
Source: National Authorities, AMRO
Note: Final domestic demand excludes changes in invesntories
Domestic demand in the region has moderated in Q1 2019, after a robust growth
in early 2018. In China, recent indicators in April-May suggest a somewhat mix
outlook
ASEAN-4 and Korea: Aggregate Final Domestic Demand China: Domestic Demand Indicators
5

Exports
Heatmap of Export Performance Selected Economies
(% yoy in USD Terms)
Source: National authorities, Haver Analytics6
Regional Exports (Volume and in USD Terms)
22 Mar
U.S
. T
ariff
Annnouncem
ent
US
D50 b
nC
hin
ese I
mport
s
U.S
. T
ariff
Annnouncem
ent
US
D200 b
nC
hin
ese I
mport
s
18 Sep
Highest ValueLowest ValueLegend: Mid Point
Regional exports contracted in Q1 2019, with latest April-May data indicating
further weakness
Jan Feb Mar Apr May Jun Jul Aug Sep Oct Nov Dec Jan Feb Mar Apr May
China
Hong Kong -
Korea
Japan -
Malaysia -
Singapore -
Thailand -
Philippines -
Indonesia -
Vietnam
Region
'18 '19
% yoy
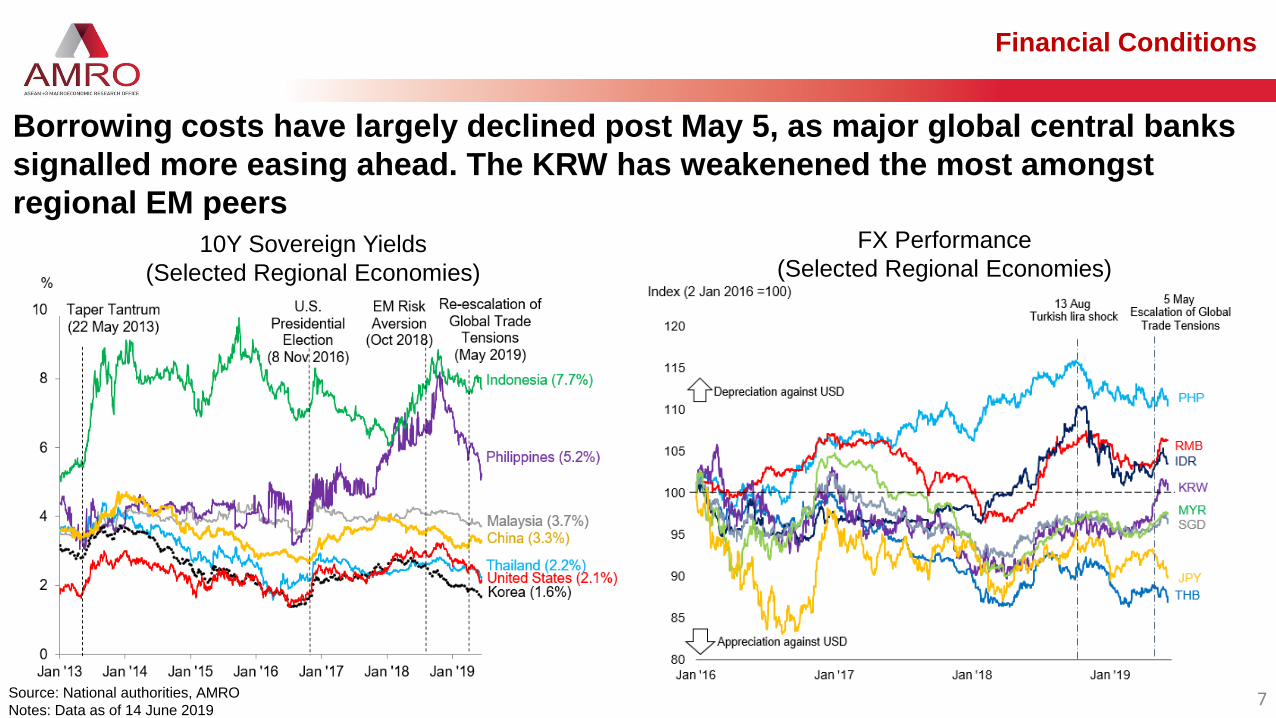
Financial Conditions
Source: National authorities, AMRO
Notes: Data as of 14 June 20197
Borrowing costs have largely declined post May 5, as major global central banks
signalled more easing ahead. The KRW has weakenened the most amongst
regional EM peersFX Performance
(Selected Regional Economies)10Y Sovereign Yields
(Selected Regional Economies)

8
Indonesia: Growth and BOP
Growth is expected to remain strong, underpinned by solid domestic demand.
Overall BOP has reversed to a surplus on rebounding capital inflows amidst
persistent current account deficits.
GDP Growth
% point contribution
Overall Balance of Payments% of GDP
Source: National authorities, AMRO

9
Indonesia: Risks and Vulnerabilities
Risks of capital flow reversal remain intact, while a weaker global outlook and re-
escalation of global trade tensions could weigh further on exports.
Source: National authorities, ADB (Asian Bonds Online Database), AMRO
Foreign Holding of LCY Government Bonds
% of total bonds outstanding % point contribution
Contribution to Export Growth: by Destination
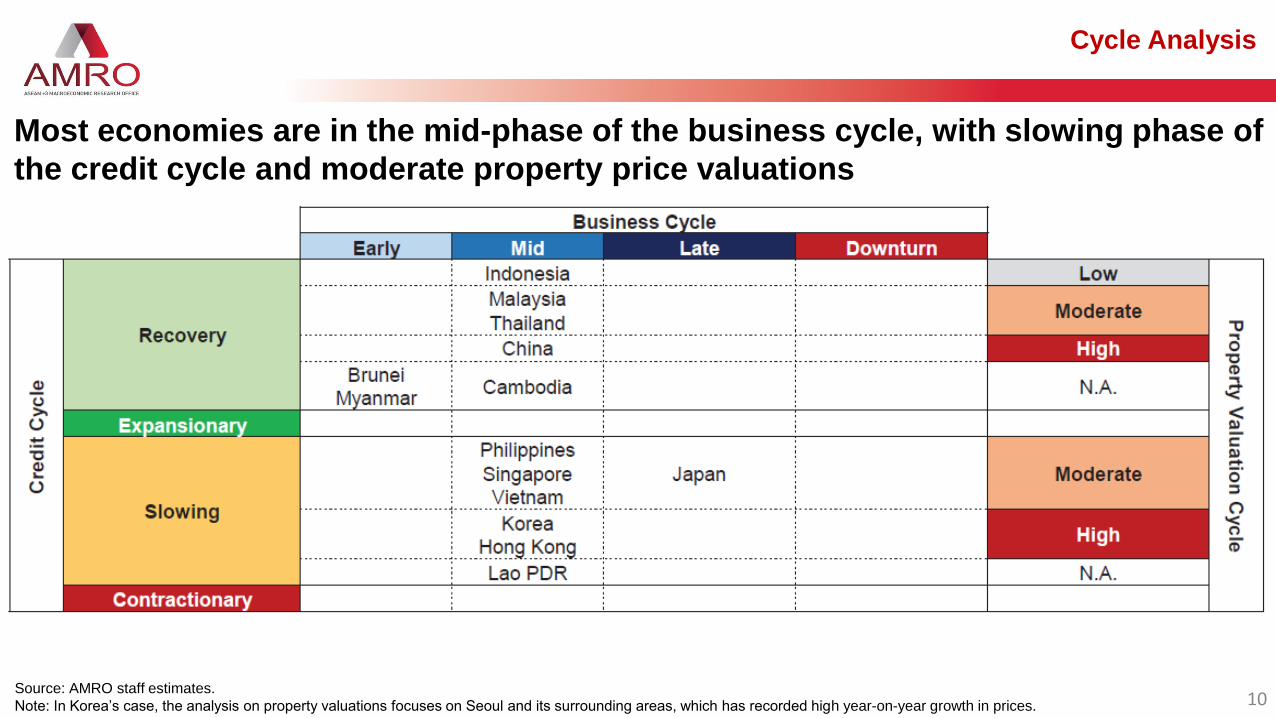
Cycle Analysis
Source: AMRO staff estimates.
Note: In Korea’s case, the analysis on property valuations focuses on Seoul and its surrounding areas, which has recorded high year-on-year growth in prices.
Most economies are in the mid-phase of the business cycle, with slowing phase of
the credit cycle and moderate property price valuations
10
11Source: AMRO
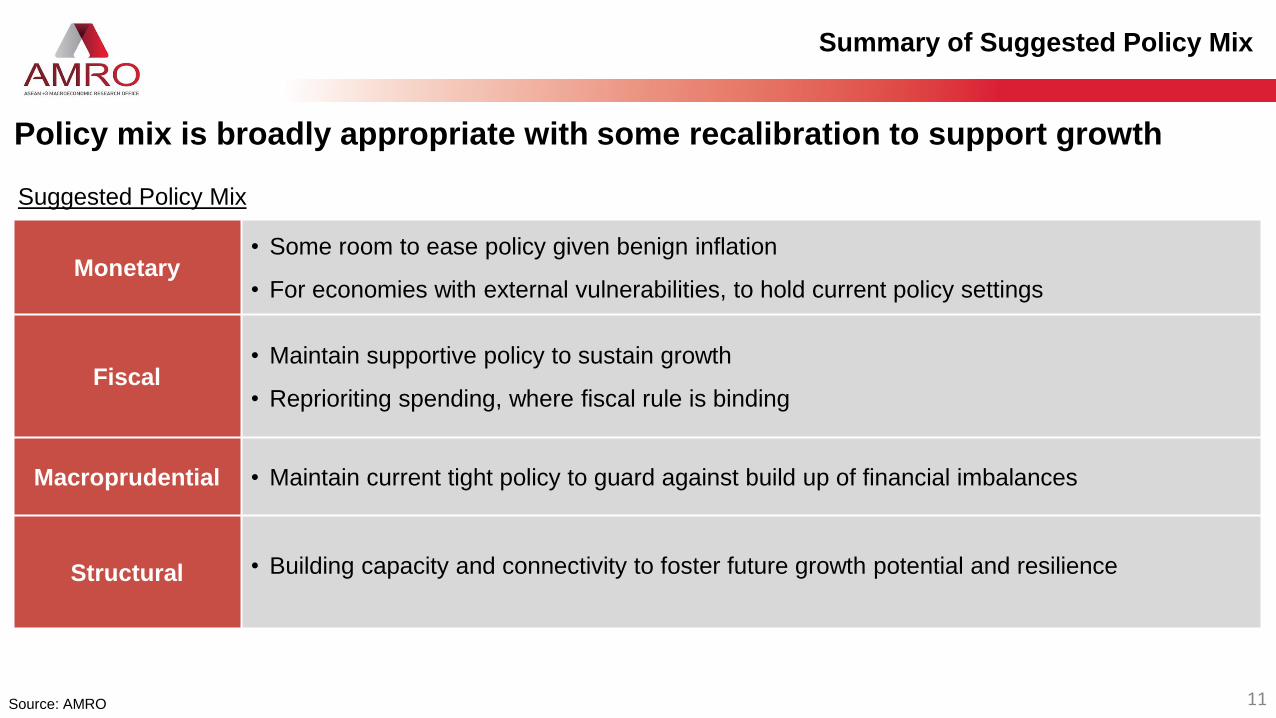
Summary of Suggested Policy Mix
Monetary• Some room to ease policy given benign inflation
• For economies with external vulnerabilities, to hold current policy settings
Fiscal• Maintain supportive policy to sustain growth
• Reprioriting spending, where fiscal rule is binding
Macroprudential • Maintain current tight policy to guard against build up of financial imbalances
Structural • Building capacity and connectivity to foster future growth potential and resilience
Policy mix is broadly appropriate with some recalibration to support growth
Suggested Policy Mix

12
Outline
Near Term Macroeconomic Prospects & Challenges
Longer Term Structural Shifts:
Building Capacity and Connectivity for the New Economy

13
Video: Building Capacity and Connectivity for the New Economy

14
New Growth Drivers: Technology
Technology (e.g. 4IR) – A growth enabler for services/new economy
Services Value Chains in the New Economy: Stylized Representation
Source: AMRO staff.
1
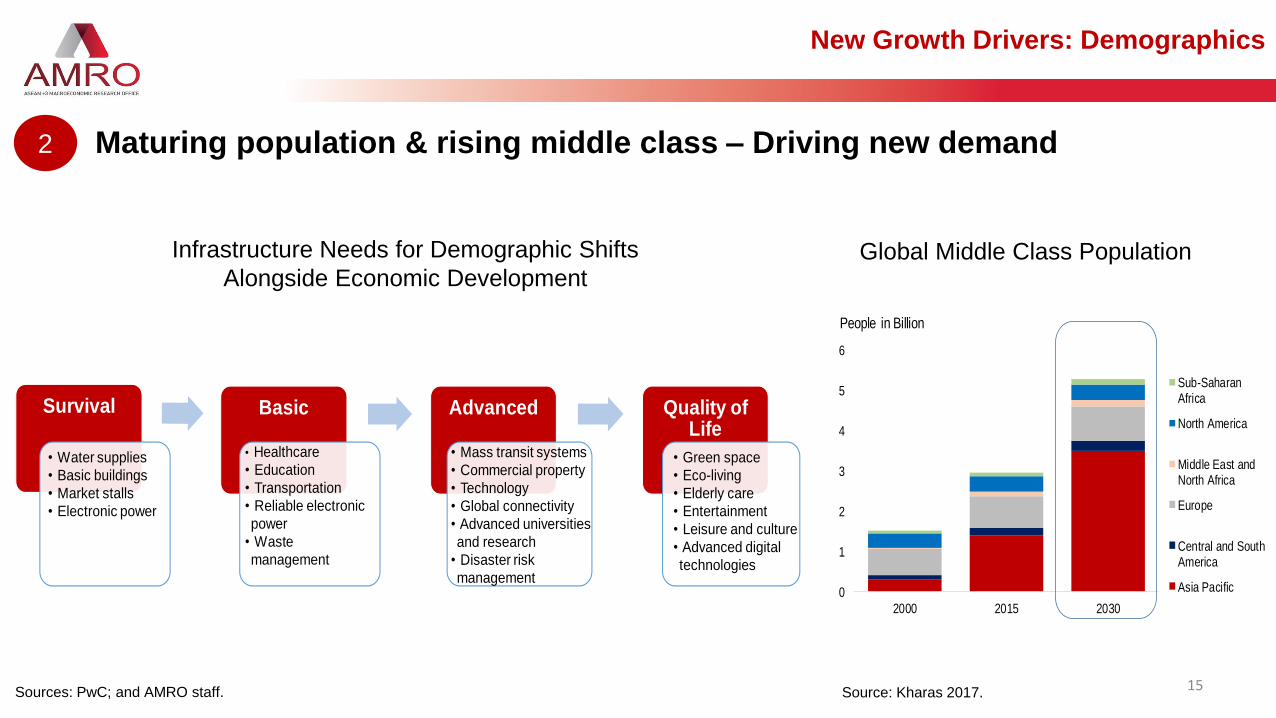
Infrastructure Needs for Demographic Shifts
Alongside Economic Development
15Source: Kharas 2017.
Global Middle Class Population
0
1
2
3
4
5
6
2000 2015 2030
People in Billion
Sub-SaharanAfrica
North America
Middle East andNorth Africa
Europe
Central and SouthAmerica
Asia Pacific
Sources: PwC; and AMRO staff.
Survival Basic Advanced Quality of Life
• Water supplies
• Basic buildings
• Market stalls
• Electronic power
• Healthcare
• Education
• Transportation
• Reliable electronic
power
• Waste
management
• Mass transit systems
• Commercial property
• Technology
• Global connectivity
• Advanced universities
and research
• Disaster risk
management
• Green space
• Eco-living
• Elderly care
• Entertainment
• Leisure and culture
• Advanced digital
technologies
New Growth Drivers: Demographics
Maturing population & rising middle class – Driving new demand2

Sources: OECD; and AMRO staff calculations/estimates
Note: Numbers may not add up due to rounding.16
ASEAN’s Value-Added Exports
(% Share, by Major Destinations)ASEAN-4 and Vietnam
(Share of Real GDP by Expenditure, Import-Adjusted Method)
2005 2010 2016
New Growth Drivers: Intra-Regional Demand
Growth rebalancing & regional integration – Driving regional demand2
-20
-15
-10
-5
0
5
LA KH MM VN
% of GDP
'80 - '90 '91 - '00 '01 - '10 '11 - '18 '19 - '23
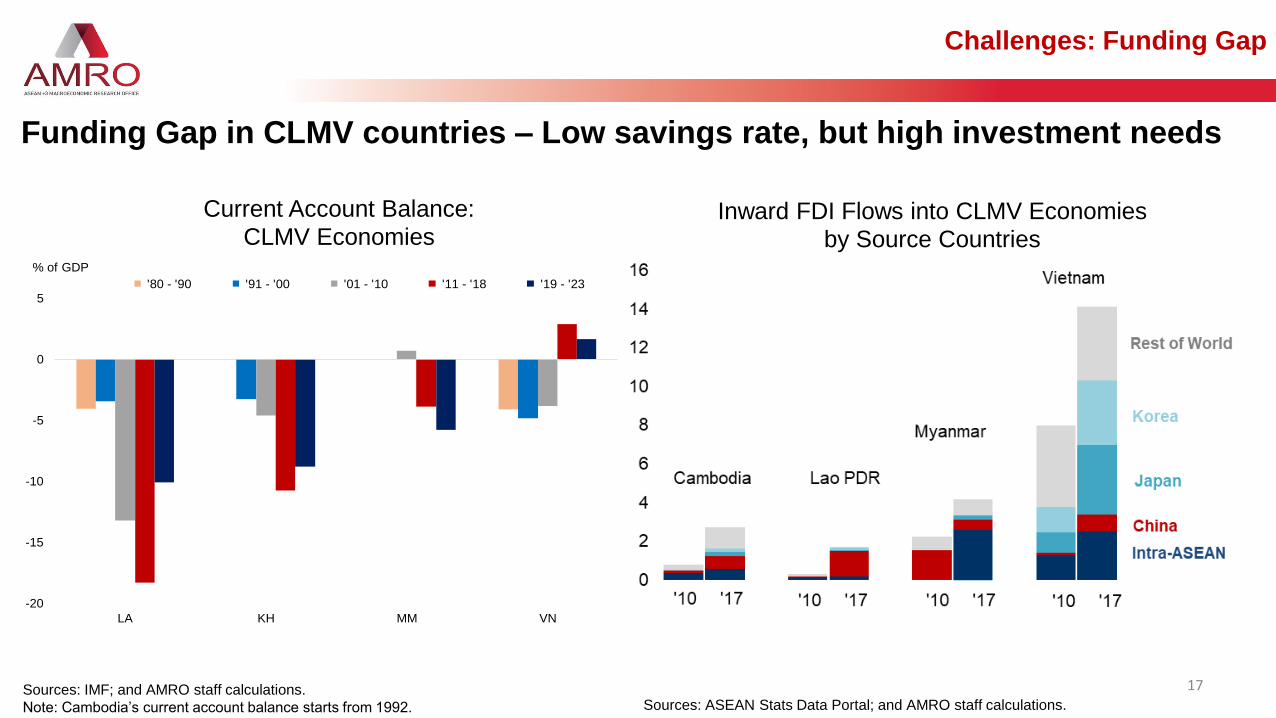
Challenges: Funding Gap
Sources: IMF; and AMRO staff calculations.
Note: Cambodia’s current account balance starts from 1992.
Current Account Balance:
CLMV Economies
Sources: ASEAN Stats Data Portal; and AMRO staff calculations.
Funding Gap in CLMV countries – Low savings rate, but high investment needs
17
Inward FDI Flows into CLMV Economies
by Source Countries
Sources: World Bank; and AMRO staff calculations.
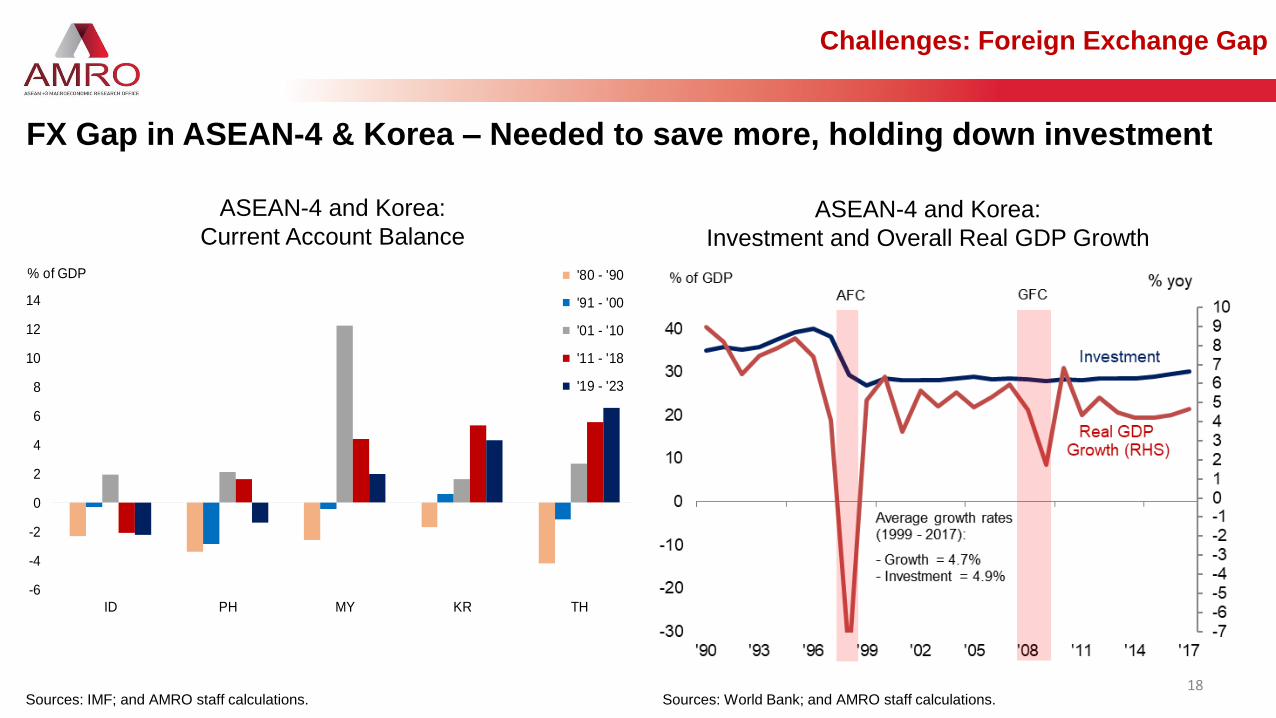
FX Gap in ASEAN-4 & Korea – Needed to save more, holding down investment
Challenges: Foreign Exchange Gap
18
ASEAN-4 and Korea:
Investment and Overall Real GDP Growth
-6
-4
-2
0
2
4
6
8
10
12
14
ID PH MY KR TH
% of GDP '80 - '90
'91 - '00
'01 - '10
'11 - '18
'19 - '23
ASEAN-4 and Korea:
Current Account Balance
Sources: IMF; and AMRO staff calculations.

Regional Connectivity
Hard
Infrastructure
Road, airports, Energy,
telecommunication…
Soft
Infrastructure
Social
(education,
health) & fin/IT
infrastructure,
public services
Legal/regulatory
framework
Source: AMRO staff. Source: World Economic Forum.
Hard infrastructure is indispensable for development, but soft infrastructure –
including cross-country connectivity – is also key for unleashing the region’sgrowth potential and facilitating its transition to the “new economy”
Human Capital and Services Sector Development, 2017Hard and Soft Infrastructure and Regional Connectivity
Challenges: Factors Gap
19
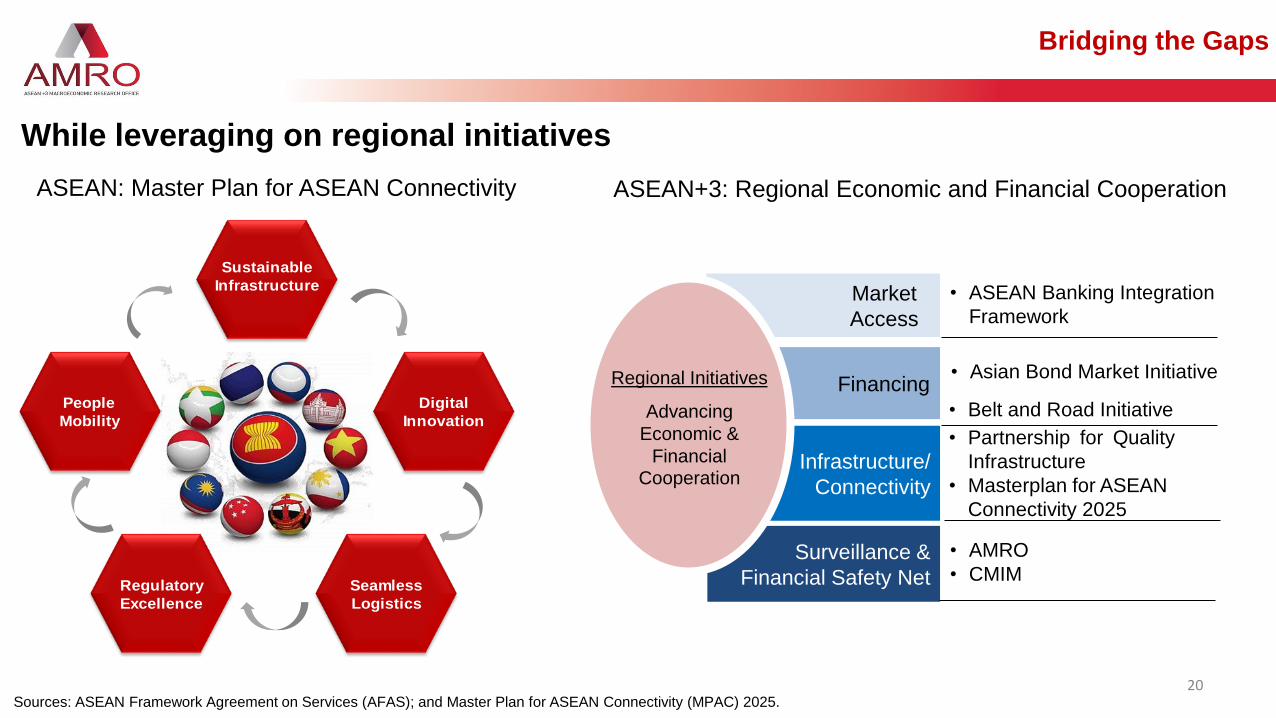
ASEAN: Master Plan for ASEAN Connectivity ASEAN+3: Regional Economic and Financial Cooperation
Sources: ASEAN Framework Agreement on Services (AFAS); and Master Plan for ASEAN Connectivity (MPAC) 2025.
While leveraging on regional initiatives
Seamless
Logistics
Digital
Innovation
Sustainable
Infrastructure
Regulatory
Excellence
People
Mobility
Bridging the Gaps
20
Market
Access
Financing
Infrastructure/
Connectivity
• ASEAN Banking Integration
Framework
Surveillance &
Financial Safety Net
• AMRO
• CMIM
• Belt and Road Initiative
• Partnership for Quality
Infrastructure
• Masterplan for ASEAN
Connectivity 2025
• Asian Bond Market InitiativeRegional Initiatives
Advancing
Economic &
Financial Cooperation
21
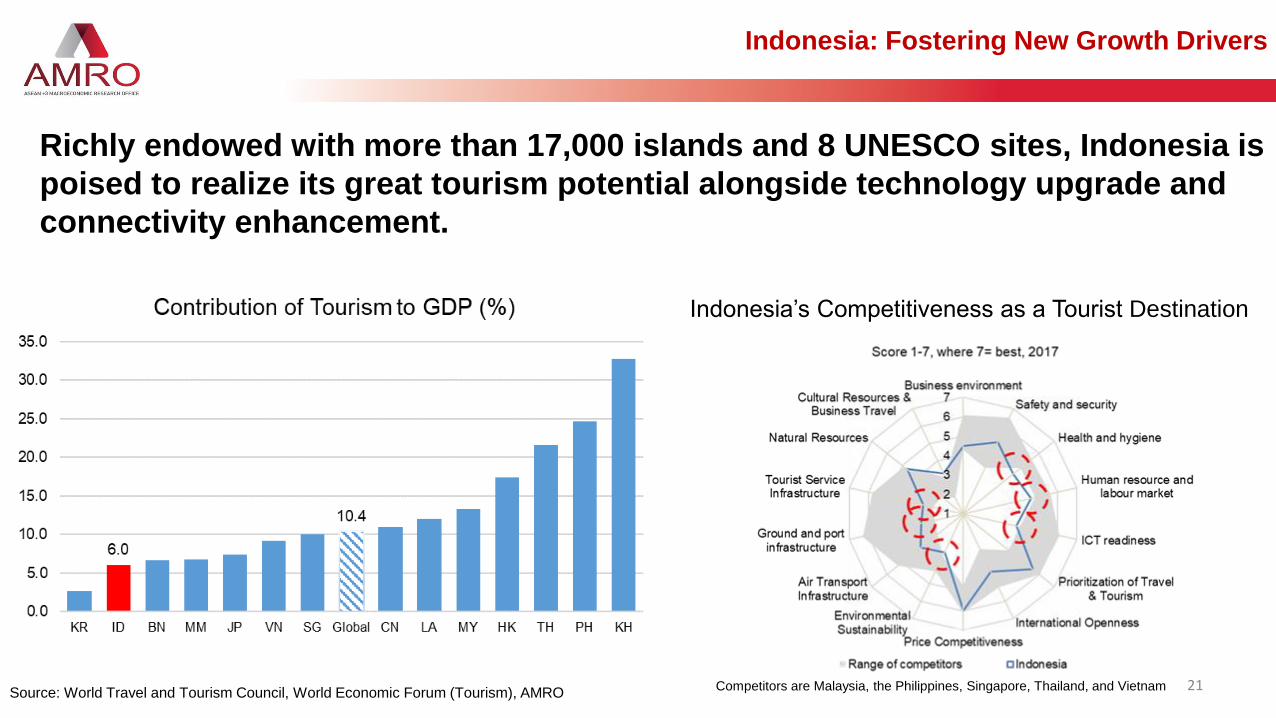
Richly endowed with more than 17,000 islands and 8 UNESCO sites, Indonesia is
poised to realize its great tourism potential alongside technology upgrade and
connectivity enhancement.
Indonesia: Fostering New Growth Drivers
Indonesia’s Competitiveness as a Tourist Destination
Source: World Travel and Tourism Council, World Economic Forum (Tourism), AMROCompetitors are Malaysia, the Philippines, Singapore, Thailand, and Vietnam
22
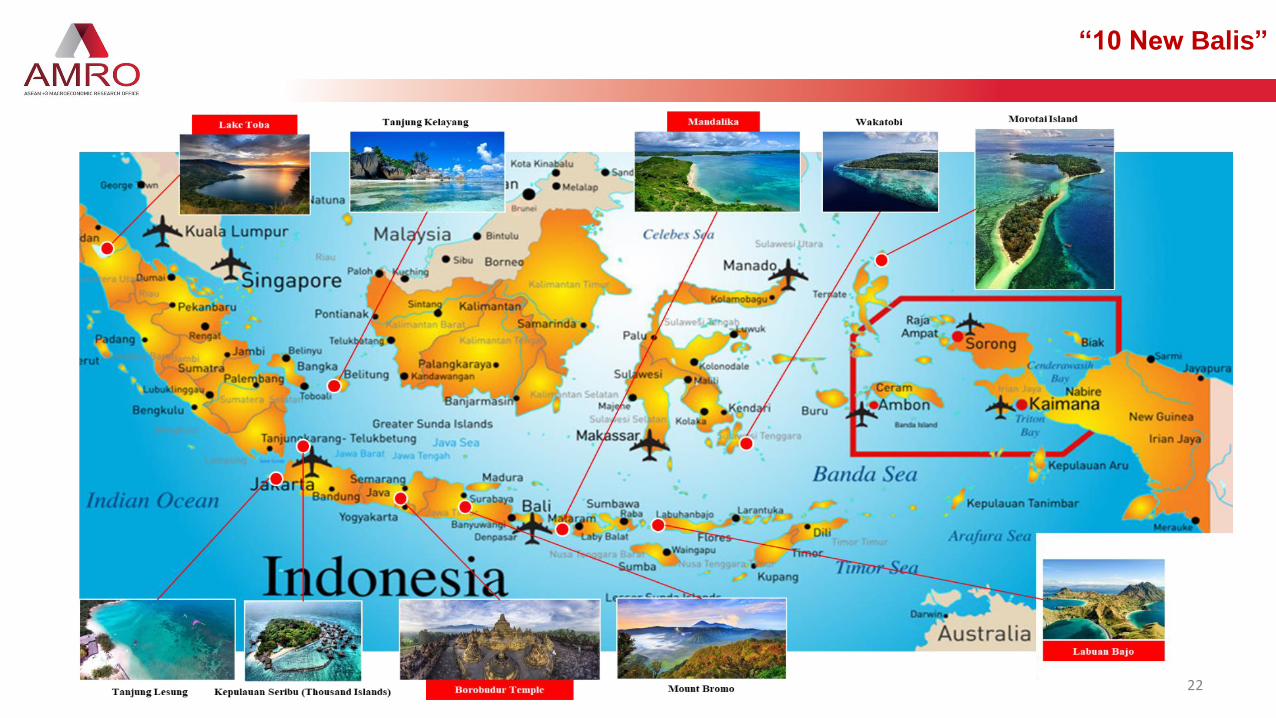
“10 New Balis”

23
The Mid-term National Development Plan has been implemented under the
strong public sector stewardship and joint funding with the private sector.
Close the Gaps: Infrastructure Development
Source: National authorities, AMRO
Mid-term National Development Plan: 2014-2019

24
Close the Gaps: Infrastructure Development
Phase 1 of the National Priority Project on Jakarta
MRT North-South Line completed in April 2019
Jakarta-Surabaya Toll Road – part of the National
Strategic Project on Trans-Java Toll Road, open for
use from December 2018
Photo courtesy of AMRO and PT GMA
25
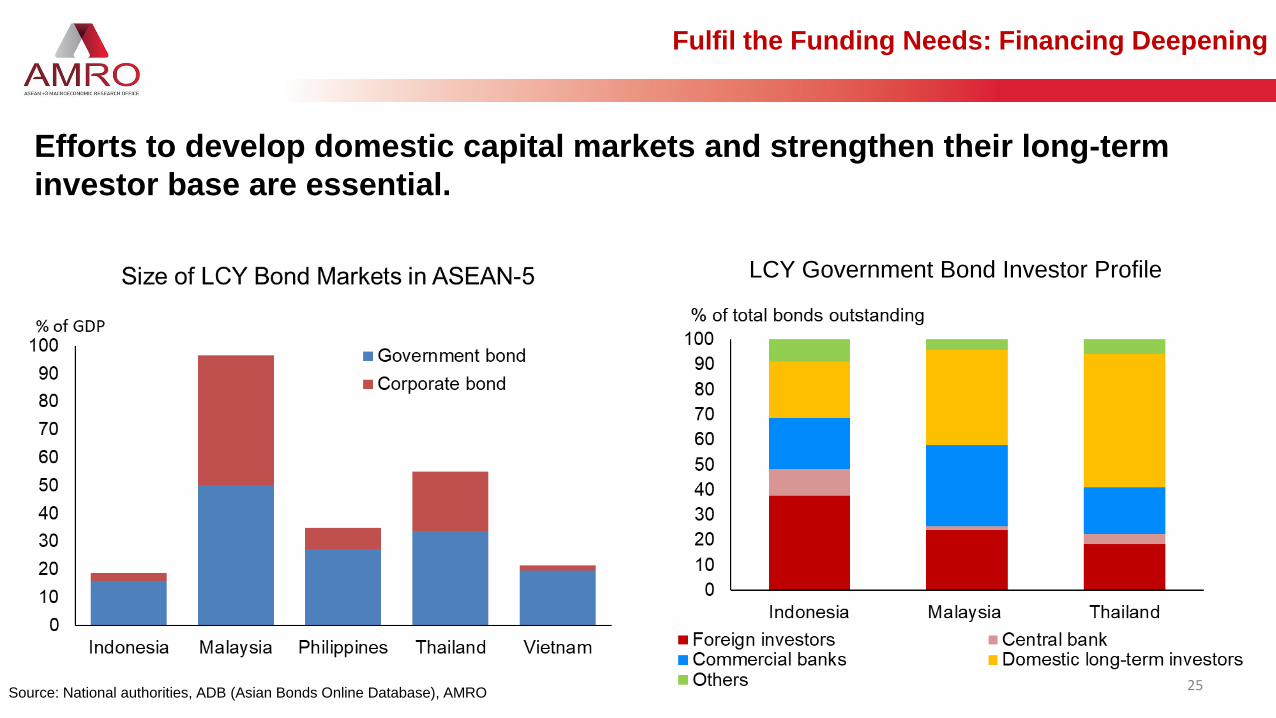
LCY Government Bond Investor Profile
Efforts to develop domestic capital markets and strengthen their long-term
investor base are essential.
Fulfil the Funding Needs: Financing Deepening
Source: National authorities, ADB (Asian Bonds Online Database), AMRO

Thank You
Contact Us:
ASEAN+3 Macroeconomic Research Office (AMRO)
Address: 10 Shenton Way, #15-08/9 MAS Building,
Singapore 079117
Tel : +65 6323 9844
Fax : +65 6323 9827
Email : [email protected]
Website : www.amro-asia.org