artificial insemination of cattle in sri lanka: status
TRANSCRIPT

ARTIFICIAL INSEMINATION OF CATTLE IN SRI LANKA: STATUS,PERFORMANCE AND PROBLEMS
H. ABEYGUNAWARDENA, P.A.B.D. ALEXANDERDepartment of Veterinary Clinical Studies XA0101324
I.S. ABEYGUNAWARDENADepartment of Veterinary Preclinical Studies
Faculty of Veterinary Medicine and Animal Science,University of Peradeniya
Peradeniya, Sri Lanka
Abstract
ARTIFICIAL INSEMINATION OF CATTLE IN SRI LANKA: STATUS, PERFORMANCE ANDPROBLEMS.
Artificial insemination (AI) has been accepted as the primary breeding tool in genetic upgradingprogrammes of cattle in Sri Lanka. Three studies were conducted, to determine the coverage and performance ofAI at national, provincial and district levels (Study 1), the success rate and factors affecting success rate of AI inwet zone mid-country smallholder farms (Study 2) and in wet zone up-country large multiplier farms (Study 3).The objective was to design, implement remedial measures and/or determine future studies necessary to improvethe efficiency of AI services. Study 1 revealed that at national level the AI service reached less than 15% of thebreedable cattle and accounted for less than 6% of estimated annual calvings. The coverage reached above 50%of the breedable cattle only in the wet zone while in the intermediate and dry zone areas it was negligible. Study 2revealed that the mean calving to first service interval (CFSI) in cattle of the wet zone mid-country smallholdings was 183 ± 87.1 days (n = 211) and the calving to conception interval (CCI) was 194 ± 93.9 days (n =143). The first service conception rate (FSCR) was 45% and the overall conception rate (OCR) was 50.2%, withan average of 1.99 services per conception (S/C). Study 3 showed that the mean CFSI and CCI in wet zone up-country multiplier farmers were 111.2 ± 74.2 days (n = 133) and 156 ± 92.7 days (n = 170) respectively. Theaverage FSCR and OCR were 50.4% and 53.6% respectively and the average S/C was 1.9. Study 1 showed thatthe AI coverage of the island is very low and the proportion of calvings from AI is too low to have a significantimpact on genetic composition of the national cow population. Studies 2 and 3 showed that the success rate of theAI service in the more favourable and extensively covered wet zone areas was also low. These studies revealedthat factors associated with the chain of events from farmer, cow, semen to the technician contributed to poorfertility.
1. INTRODUCTION
Artificial insemination (AI) could be regarded as one of the oldest and robust biotechnologicalapplications that has made a significant impact in animal agriculture throughout the world. It was firstcarried out in farm animals at the beginning of the twentieth century by the Russian scientist Ivanoffand, by the 1930s, had spread to Europe and Northern America.
AI was first introduced into Sri Lanka in 1938 by T.M.Z. Mahamooth [1] and after successfultrials, was offered to private breeders around Peradeniya. However, the acceptance by the breederswas very low. After independence from British rule in 1948, improvement of peasant agriculture andlivestock was undertaken as a major strategy for development of the rural agrarian economy [2] andAI services commenced field operations in 1951 [1, 3]. Initially it was provided through the maincentre at Peradeniya and two sub-centres in Colombo and Galle. By 1955, the number of sub-centreshad increased to 17 and all were located in close proximity to railroads as it was necessary totransport processed liquid semen with minimum delay from the processing centre at Peradeniya. In1960, semen collection and processing activities were transferred to Central Artificial InseminationService Centre (CAIS) at Kundasale. This was followed by the establishment of two regional semenprocessing laboratories, one at Tinneveli and the other at Polonnaruwa. The deep frozen sementechnology was introduced into the country on an experimental basis in 1966 and came into
51

commercial operation in 1968 [4]. By 1975, there were 65 AI sub-centres in operation, spread acrossmost regions of the country except the dry zone. Extension to the dry zone was gradual, and by 1997,there were 168 Veterinary Offices with 137 AI sub-centres operating the service with 357 technicians(258 government technicians and 99 private technicians). The number of AI services per annumincreased from 72 in 1951 to around 108 338 in 1996. This expansion of the AI service was supportedby several international donor programmes [5].
Although the AI service is in operation on an island wide basis, few scientific studies have beenconducted to assess its performance [6, 7]. One study [6] reported that the efficiency of heat detectionby smallholder farmers was less than 65% and nearly a third of inseminations were carried out duringthe wrong time with respect to oestrus. The other [7], a limited scale study in the wet zone mid-country area, showed that the conception rate (CR) was lower than expected and suggested that thiswas most likely due to poor heat detection by the farmers and delays in getting the cow served. Twoconsultancy reviews [8, 9] have also highlighted the poor performance of the AI service at nationallevel.
Today the challenges to the farmer, extension worker and livestock researcher are many. Thecurrent level of productivity of livestock is too low to retain resources (land, labour and capital) inanimal agriculture. Yet the rural resource poor have no skills to venture into any other economicpursuit. As such they will continue to remain in peasant-based agriculture and continue to performpoorly unless interventions are introduced. Therefore the need at this crucial juncture is to improvethe productivity of animal agriculture so as to sustain the rural economy and maximise the welfare ofthe society. Within animal agriculture, the dairy sector forms the largest component. Its productivityhas to increase several-fold in order to sustain this valuable industry and genetic improvement of thenational cattle population is an obligatory step towards this goal. Today AI is recognised as theprimary tool for genetic improvement in cattle breeding. Therefore, a series of studies wasundertaken, to determine the coverage and performance of AI at national, provincial and district levels(Study 1), the success rate and factors affecting it in wet zone mid-country smallholder farms (Study2) and in wet zone up-country large multiplier farms (Study 3). The objective was to design,implement remedial measures and/or determine future studies necessary to improve the efficiency ofAI services.
2. MATERIALS AND METHODS
2.1. Study 1: Assessment of national, regional and district level coverage and performance ofAI services [10]
2.1.1. Data collectionThe records at the Division of Animal Breeding in the Department of Animal Production and
Health (DAPH) and the Division of Planning and Monitoring in the Ministry of LivestockDevelopment and Estate Infrastructure (MLDEI) were examined and the following data wereextracted for the country, agro-ecological zones, provinces and districts: i) total number of AI servicecentres; ii) total number of cattle; and iii) number of AIs and recorded calvings. The publishedreviews and consultancy reports available at the data bank of DAPH were also reviewed.
2.1.2. Data analysisA map of Sri Lanka depicting the agro-ecological zones, provincial boundaries, districts,
locations of semen processing centres, veterinary surgeon's (VS) offices providing AI service and AIsub-centres centres was drawn up. Estimates of total breedable cattle and annual calvings at national,provincial and district levels from 1983 to 1996 were calculated. Percentages of breedable cattlecovered by AI and proportion of estimated calvings due to AI at national, provincial and regionallevels were calculated. The same data was rearranged according to three major agro-ecological zonesof the country. For analytical purposes, the following assumptions were made: i) all recorded AIswere considered as first services, ii) 60% of the total cattle population were considered as females, iii)55% of the females were considered as breedable; and iv) the annual calving rate of the breedable
52

cattle population was considered as 50%. These assumptions were applied across the island, agro-ecological zones, provinces and districts.
2.2. Study 2: Survey on success rate of AI in smallholdings of the wet zone mid-country region[11]
2.2.1. LocationThe study was conducted in the wet zone mid-country region since it is the one where the
highest percentage of cattle belonging to smallholdings are bred artificially. It is located between600-800 metres above sea level, with an annual rainfall of 2000-3000 mm, temperature of 25-28°Cand humidity of 75-80% during the year. The dairy production system is characterised bysmallholdings (1-2 cows/herd) of Bos taurus genotype, managed under zero grazing with naturalgrasses and supplemented with limited quantities of commercial concentrate feed. Five VS ranges(Gampola, Kundasale, Teldeniya, Udunuwara, and Yatinuwara) from this region were purposivelyselected for the study.
2.2.2. Longitudinal studyA sample of cows was monitored by performing a longitudinal field study during the period
January 1996 to June 1997. In liaison with the VS offices and the inseminators serving these fiveranges, dairy cows receiving first inseminations following a recorded calving were monitored untilthey were confirmed as pregnant. One investigator accompanied the inseminator to smallholder farmswhen there was a call for an AI. At the time of AI (day 0), the following detailed information relatingto the farm, cow, semen and inseminator were recorded.
2.2.3. Farm dataInformation was recorded regarding total land extent, herd size, the type of management,
feeding systems and breeding practices, including the voluntary waiting period from detection ofoestrus to insemination, housing system and herd composition.
2.2.4. Cow dataFor cows presented to AI the identification number, date of birth, parity, last calving date, last
calving type, date of first postpartum heat, body weight, service number, dates of AI, interval betweenheat detection and AI, time of day at which AI was done, observed heat signs, degree of vulvalswelling, colour of mucous discharge, degree of uterine tone, site of semen deposition, code of semen,lactation state, body weight, body condition score (BCS) at time of AI and average daily milk yieldwere recorded.
2.2.5. Semen/bull dataFor each AI performed the breed of semen donor, identification number, source of semen
(local/imported), volume, type of semen (chilled/frozen), quality of semen (if available) and spermdose were recorded.
2.2.6 AI technician dataInformation on age, highest level of education, duration of formal training in AI, years of
experience, average number of AI per month, type of employment, method of thawing semen andother non-AI work performed were recorded for each technician participating in the study.
2.2.7. Milk sampling for progesterone measurementOn day 0, a milk sample (10 mL) was collected into a bottle containing a potassium dichromate
tablet as preservative. A second milk sample was collected 10-12 days later from the same cow and,if the cow was not presented for a repeat AI, a third milk sample was collected at 21-23 days after theAI. Dates of subsequent services if any were recorded for cows presented for repeat services. In allcases, those not returning to service within 60-90 days after the last service were examined forpregnancy by rectal palpation and the findings were entered in record sheets.
53

2.2.8. Milk progesterone assayMilk samples were placed in a refrigerator (4°C) within 6 hours of collection and transferred to
the laboratory for processing within 7 days. They were centrifuged at 4°C and 1000 x g for 10minutes, the fat-free fraction (skim milk) was drawn off and stored at —15°C until assayed forprogesterone using a direct solid-phase radioimmunoassay (RIA) employing antibody-coated tubes,125I-progesterone as tracer and standards (0, 1.25, 2.5, 5, 10, 20 and 40 nmol/L) prepared in skim milk(kits supplied by the FAO/IAEA Sub-programme on Animal Production and Health, Vienna). Theintra-assay and inter-assay coefficients of variation were 9% and 14.5% respectively.
2.2.9. Data tabulation and analysisData were recorded and partially analysed using a computer database named AIDA (Artificial
Insemination Database Application) which was developed by the FAO/IAEA Sub-programme. Forfurther analysis data was exported to Systat (V.6.0 for Windows, SPSS).
2.3. Study 3: Survey on success rate of AI in state multiplier farms [12]
2.3.1. LocationFour multiplier farms, namely Ambewela, Bopaththalawa, Dayagama and New Zealand, were
selected purposively for the study. They are located at 2000 metres above sea level, with an annualrainfall of 2000-2500 mm distributed throughout the year. The mean temperature ranges from 10°C inDecember to 25°C in April, with relative humidity of 75-80%. The dairy production system is basedon pure Bos taunts genotypes, managed under zero grazing in one farm (New Zealand) and daytimegrazing with stall-feeding at night in the other three. Feeding of commercial concentrates and mineralmixture is done on all farms.
2.3.2. Longitudinal studyFollowing the same procedures described in Section 2.2, two hundred cows receiving first
insemination following calving were monitored during the period from April 1997 to December 1997.A sample of 200 cows bred artificially were studied longitudinally. The recording of data, collectionand analysis of milk samples, and the recording and analysis of data were done as describedpreviously.
3. RESULTS
3.1. Coverage and performance of AI service
A map of Sri Lanka depicting the agro-ecological zones, provincial and district boundaries,spread of semen processing centres, VS offices and AI sub-centres, total land extent and cattlepopulation is given in Fig. 1. The total land extent of the island is 65 610 sq. km and the dry zoneaccounts for 62.9% of the total land area, while the intermediate and wet zone accounts for 13% and24.1%, respectively. The total number of cattle is estimated at 1.7 million with 48%, 36.7% and15.3%, respectively in dry, intermediate and wet zones. The largest concentration of AI service is inthe wet zone region, followed by intermediate zone with the lowest coverage in the dry zone. Thecattle density is lowest in the dry zone, followed by the intermediate zone with the highestconcentration in the wet zone. Administratively the country is divided into 7 provinces; Centralprovince (CP), Western province (WP), Southern province (SP), Eastern province (EP), Northernprovince (NP), North-western province (NWP), North-central province (NCP) and Sabaragamuwaprovince (Sab.P). The total number of administrative districts and divisions are 25 and 302respectively and are served by 194 VS offices and 207 AI sub-centres (Internal Reports of theDepartment of Animal Production and Health).
3.1.1. At national levelThe total number of AI performed in the country rose from 47 318 in 1983 to 109 008 in 1996
and the number of recorded calvings from AI rose from 2724 in 1983 to 18 183 in 1996. The increase
54

in the total number of services paralleled the expansion of the veterinary service across the country,provinces and districts.
• Veterinary QJIkco Ai Sub-centre
Central Semei* Processing CentreAgroccalogical Zone BoundaryDistrict Boundary
FIG.l. Map of Sri Lanka depicting the agro-ecological zones, district boundaries and locations ofartificial insemination service points (veterinary offices and AI sub-centres).
55

The percentage of breedable cows covered by AI gradually increased from 8.6% in 1983 to18.8% in 1996 and the proportion of AI calvings from the total estimated calvings rose from less than1% in 1983 to 6.3% in 1996. The number of estimated female calves produced from AI in 1996,assuming that 50% calvings result in female calves and with 5% calf mortality was estimated to be8642. The number of male calves produced appears to be less than this because of higher mortalityamong male calves. Empirical evidences suggest that only a small percentage of male calves reachadulthood and of them very few enter into the breeding population.
3.1.2. At agro-ecological zone levelThe total number of AI done, coverage of breedable cows and performance criteria during 1996
for the wet, intermediate and dry zones are given in Table I.
TABLE I. NUMBER OF AI, COVERAGE AND PERFORMANCE IN DIFFERENT AGRO-ECOLOGICAL ZONES IN 1996
Number of Percentageestimated of calvingscalvings due to AI
Agro-ecologicalZone
Number ofbreedable
cattle
Number ofAI
performed
Percentage ofBreedable
cows servedbyAI
Number ofRecorded
AI calvings
Calving ratefrom AI (%)
WetIntermediateDry-Total
88 836213 378278 586580 800
60 91335 98912 106
10 9008
68.616.94.318.8
12 2284 6161349
18 193
20.112.811.116.7
44 418106 689139 293290 400
27.54.3
<0.16.3
Source: Department of Animal Production and Health (1997)
In 1996, the wet zone had recorded the highest number of inseminations, the highest coveragein terms of the proportion of breedable cows served by AI, highest number of calvings due to AI andthe highest percentage of estimated calvings due AI. The dry zone had the lowest figures for all theseparameters.
3.1.3. At provincial levelThe total number of AI done, coverage of breedable cows and performance criteria during 1996
at provincial and district levels are shown in Table II. The highest number of AIs were done in CP andthe lowest were recorded in EP and NP. The coverage in terms of the proportion of breedable cattlewas highest in CP followed by WP, Sab.P, NWP, NCP, UP and SP. Lowest coverages were recordedin EP and NP. The highest calving rate was recorded in WP, followed by SP, CP, Sab.P, NWP, UPand NCP. The percentage of total estimated calvings after AI was highest in CP, followed by WP andwas low in Sb.P, NWP, SP, UP and NCP. The proportion of calvings from AI was negligible in EPand NP.
3.1.4. At district levelsAs shown in Table II, the coverage in wet zone districts was relatively high and ranged from
about 10% in Matara to 100% in Kandy and Nuwaraeliya. In the intermediate zone areas the coveragewas relatively low, lowest being in parts of Hambantota and Moneragala and high in Badulla. In mostof the dry zone the coverage was very low (less than 0.1%) except in Anuradhapura, Polonnaruwa andPuttalam. The success rate as measured by the calving rates ranged from 30.4% in Gampaha tonegligible levels in districts of EP and NP. Highest proportion of calvings from AI was recorded inNuwaraeliya, followed by Kandy, Gampaha and Kegalle with other districts recording lowpercentages. Most wet zone districts recorded high proportion of calvings due to AI (>15%) while theintermediate zone areas recorded low proportions (<10%) with negligible levels in all dry zonedistricts except in Polonnaruwa and Anuradhapura districts which recorded around 3%.
56
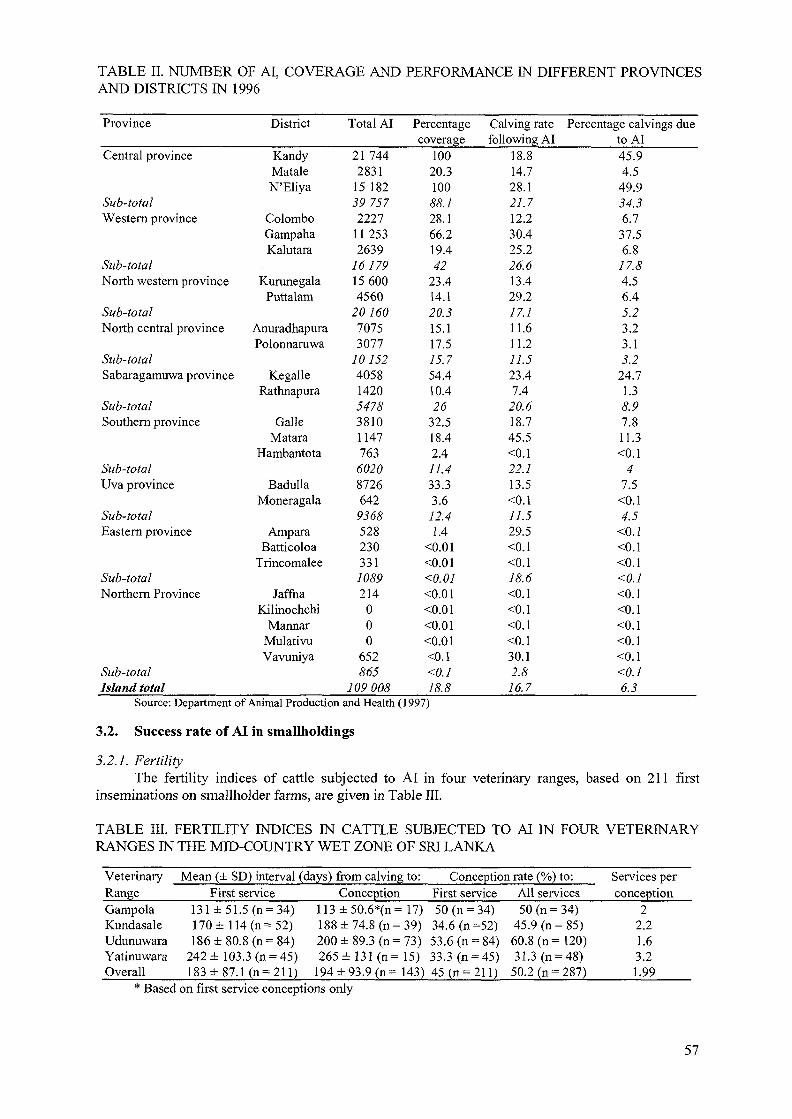
TABLE II. NUMBER OF AI, COVERAGE AND PERFORMANCE IN DIFFERENT PROVINCESAND DISTRICTS IN 1996
Province
Central province
Sub-totalWestern province
Sub-totalNorth western province
Sub-totalNorth central province
Sub-totalSabaragamuwa province
Sub-totalSouthern province
Sub-totalUva province
Sub-totalEastern province
Sub-totalNorthern Province
Sub-totalIsland total
District
KandyMataleN'Eliya
ColomboGampahaKalutara
KurunegalaPuttalam
AnuradhapuraPolonnaruwa
KegalleRathnapura
GalleMatara
Hambantota
BadullaMoneragala
AmparaBatticoloa
Trincomalee
JaffnaKilinochchi
MannarMulativuVavuniya
Total AI
21 7442831
15 18239 7572227
11 2532639
1617915 6004560
2016070753077
10152405814205478381011477636020872664293685282303311089214
000
652865
109 008
Percentagecoverage
10020.310088.128.166.219.442
23.414.120.315.117.515.754.410.426
32.518.42.411.433.33.612.41.4
<0.01<0.01<0.01<0.01<0.01<0.01<0.01<0.1<0.118.8
Calving ratefollowing AI
18.814.728.121.712.230.425.226.613.429.217.111.611.277.523.47.4
20.618.745.5O.I22.113.5O. I77.529.5O.IO.I18.6O.IO.IO.IO.I30.12.816.7
Percentage calvings duetoAI45.94.5
49.934.36.7
37.56.8
17.84.56.45.23.23.13.2
24.71.38.97.811.3O . I
47.5
O . I4.5
O . IO. IO . I<0.1O . IO. IO . IO. IO . I<0.16.3
Source: Department of Animal Production and Health (1997)
3.2. Success rate of AI in smallholdings
3.2.1. Fertility
The fertility indices of cattle subjected to AI in four veterinary ranges, based on 211 firstinseminations on smallholder farms, are given in Table III.
TABLE III. FERTILITY INDICES IN CATTLE SUBJECTED TO AI IN FOUR VETERINARYRANGES IN THE MID-COUNTRY WET ZONE OF SRI LANKA
Veterinary Mean (± SD) interval (days) from calving to: Conception rate (%) to:Range First service Conception First service All services
Services perconception
GampolaKundasaleUdunuwaraYatinuwaraOverall
50 (n = 34)34.6 (n =52)53.6 (n = 84)33.3 (n = 45)
183±87.1(n = 211) 194 ±93.9 (n= 143) 45(n = 211)
131 ± 51.5 (n= 34)170±114(n=52)186 ± 80.8 (n = 84)
242 ± 103.3 (n = 45)
113±50.6*(n=17)188 ± 74.8 (n= 39)200 ± 89.3 (n = 73)265±131(n=15)
50(n = 34)45.9 (n = 85)60.8 (n= 120)31.3 (n = 48)
50.2 (n = 287)
22.21.63.21.99
* Based on first service conceptions only
57

The average calving to first service interval (CFSI) was well over 6 months and the averagecalving to conception interval (CCI) was nearly 200 days, with significant differences (P <0.05) dueto location in both parameters. Cows at Yatinuwara VS rage recorded longest CFSI and CCI while thecows at Gampola VS range recorded the shortest CFSI and CCI. Similarly, first service conceptionrate (FSCR) and the overall conception rate (OCR) were significantly different (P <0.05) among threelocations; with Yatinuwara recording the lowest and Udunuwara recording the highest values. At thetime of the first postpartum service, the mean body weight of the cows was 321.2 ± 77.5 kg, the bodycondition score (BCS, on a 1-5 scale) was 2.7 ± 0.4, and the average milk production was 7.7 ± 4.1 Lper day.
3.2.2. Interpretation of progesterone dataResults from milk progesterone assay for day 0 samples (n = 258) revealed that 79.4% of the
AIs were done when progesterone was below 1 nmol/L, indicating that the cow could have been inheat, but 13.2% of AIs were done when progesterone was above 3 nmol/L, when the cow could nothave been in heat. The remainder of the samples (8.5%) had values in the inconclusive range (>1 and<3 nmol/L). Progesterone values for samples collected on days 0 and 10-12 (n = 258) showed thatonly 64.3% of the animals had a normal ovulatory cycle, while 10.5% were in anoestrous, 5% werepregnant and 5.4% were in luteal phase. Intermediate progesterone values were found in 14.7% ofsamples. The progesterone values from all three samples (days 0, 10-12 and 21-23) were availablefor 237 services and these along with data from pregnancy diagnosis (PD) by rectal palpation 60-90days after service indicated that 44.3% conceived to that service. In 8.9% AI was done in thefollicular phase but they failed to conceive or had early embryonic death and were not detected in heatuntil PD was done. Late embryo mortality or persistent corpus luteum (CL) occurred in 3.8%. In 2.1%of cases AI had been done during pregnancy while 6.3% were done in anoestrous cows. Intermediatelevel of progesterone with doubtful rectal findings at 60-90 days post-service was found in 23.6%while in 11% the results were not physiological meaningful.
The overall analysis of progesterone data revealed that 25.5% of AIs were performed at anerroneously detected heat. Of these, 13.2% were done in cows with an active CL where nearly half ofthem were pregnant at the time of AI, while 12.3% were done in anoestrous cows. Nearly 20% of thecows submitted for PD were found to be non-pregnant, while 5% of the cows which became pregnanthad subsequently suffered late embryonic mortality.
3.2.3. Effect of different factors on success ofAIin smallholder farmsFarm factors: No differences in CRs were evident in animals managed semi-intensively and
intensively. However, tendency for higher, but statistically non significant, CRs were observed inanimals fed concentrates (40%) than in those not fed concentrates (27%). When farms were groupedaccording to percentage of family income from dairy farming, those with less than 25% had anaverage CR of 26%, while those with higher proportions had CRs above 40%, but this difference wasnot statistically significant. For AIs performed 6, 12, 18, 24 and 30 hours after first detection of heat,the CRs were 25, 34.7, 38.1, 68.4 and 37.5%, respectively. The highest CRs (>60%) were recordedduring the months of June, July, August and September, while the lowest (<30%) were recorded inMarch, April and November.
Cow factors: A tendency was seen for declining CRs from parity 1 up to a parity of 5;thereafter the numbers were too small for comparisons. Cows receiving their first service before 60days postpartum had lower CR (P <0.05) than those receiving the first service after 60 days. The dataon other cow factors such as breed, body weight, body condition, milk yield at AI and intensity andtype of oestrous signs were inconclusive.
Bull/semen factors: Semen from 22 bulls had been used in the sample under study. Of these,semen from seven bulls had been used for more than 20 services and their CRs ranged from 18.2—70.4% (P <0.05). Semen originating at the Kundasale AI station gave higher (P <0.05) CR (49%, n =181) than imported semen (30%, n = 166). Data on effects of volume and dose of semen, type ofsemen (chilled or frozen) and motility before processing was inconclusive.
Inseminator: In the present study, only one technician was monitored in each of threeveterinary ranges (Gampola, Kundasale and Udunuwara), while two were monitored in the fourth
58

range (Yatinuwara). Technician had a significant effect (P <0.05) on conception rate, with the overallCRs achieved by them ranging from 27.8% in Yatinuwara to 58.5% in Udunuwara. However, thetechnician factor is confounded within location and hence true effects cannot be separated.
3.3. Success rate of AI in large farms
3.3.1. FertilityAs shown in Table IV, the overall average CFSI and CCI were over 4 and 5 months,
respectively. The longest CFSI was recorded at New Zealand farm while the shortest interval was atDayagama. The longest CCI was recorded at New Zealand farm while the shortest was atBopaththalawa. Both the FSCR and OCR were lowest at New Zealand farm and highest atBopaththalawa farm
TABLE IV. FERTILITY INDICES OF CATTLE SUBJECTED TO AI
Farm
Ambawela
Bopaththalawa
Dayagama
New Zealand
Overall
Mean intervalFirst service102 ±63.2(n=13)
109 ±66.3(n = 34)
91 ±33.5(n = 35)
128 ± 96.5(n = 51)
111.2 ±74.2(n=133)
(days) from calving toConception159 ± 103.6
(n=23)136 ±65.6(n = 42)
148 ±101.5(n = 45)
175 ±96.1(n = 60)
156 ±92.7(n= 170)
ConceptionFirst service
53.8(n=13)
70.5(n = 34)
57.1(n = 35)
31.3(n = 51)
50.4(n=133)
rate (%) toAll services
65.7(n = 35)
69.3(n = 62)
60(n = 75)
40.8(n = 147)
53.6(n = 319)
Services perConception
1.5
1.4
1.7
2.5
1.9
3.3.2. Interpretation of progesterone dataResults from milk progesterone assay for day 0 samples (n = 199) revealed that 79.4 % of the
AIs s were performed when progesterone concentration was below 1 nmol/L indicating that the cowcould have been in heat, but 9.5% of AIs were done when progesterone concentration was above 3nmol/L, indicating that the cow could not have been in heat. The remainder of the samples (11.1%)had values in the inconclusive range (>1 to < 3nmol/L). Progesterone values of samples collected onday 0 and 10-12 (n = 199) showed that only 67.3% of the animals had normal ovulatory cycles. In4.5% of cases AI was done in anoestrous cows, in 5.5% cases in pregnant cows and in 2.0% duringthe luteal phase. Intermediate progesterone values were found in 20.6% of the samples.
The progesterone values from all three samples (Days 0, 10—12 and 21-23) were available for166 services. Progesterone data along with rectal palpation findings at PD indicated that 50% hadconceived; 6.6 % most likely had non-fertilisation or early embryonic death or had gone into post-AIanoestrous; 4.2% had late embryonic death, luteal cyst or persistent CL; 1.2% were inseminatedduring pregnancy; and 2.4% were inseminated during anoestrus. None of these animals were detectedin heat until PD. Intermediate progesterone values and inclusive rectal findings were found in 26.5%of the animals.
Overall analysis of progesterone data suggested that 16.4% of the AIs were done at anerroneously detected heat. Of these, 13.2% were done in cows with an active CL where more thanhalf of them were pregnant at the time of AI.
3.3.3. Effect of different factors on AIFarm factors: The farm had significant effect (P <0.05) on the CR, with highest OCR observed
at Bopaththalawa farm and the lowest at New Zealand farm. Farms which coupled visual heatdetection with use of teaser bulls had higher CRs (64.5%) than those using only visual detection(40.8%). When the time from heat detection to AI was grouped as 0-6, 6-12, and 12-24 h, therespective CRs were 60%, 49.2% and 51.4%. Higher CRs (>50%) were recorded during the months of
59

August, June, July and September while the lower CRs (<40%) were recorded in April and March.But neither the time of AI nor the time of the year effect was statistically significant
Cow factors: There was a significant breed effect (P <0.05) on CR. Among the pure breeds keptin these farms the Ayrshire breed had the highest CR (Ambewela, 65.7%), with the Jersey breedintermediate (60%) and the Friesian breed having the lowest (New Zealand, 40.3%). However, thebreed effect is compounded within farms and hence true effects cannot be delineated. Parity hadsignificant effect (P <0.05) on CR, with a steady increase from parity 1 to 6 followed by a decline tothe lowest CR in parity 10. A tendency for higher CRs were seen in animals with BCS of 2.5 andabove and lower CRs in those with BCS below 2.5, but this was not reflected in the pooled dataacross farms. Type of heat sign noted at the time heat detection or service had significant effect (P<0.05) on CR; cows which were observed to be at 'standing heat' at the time of AI had the highest CR(64.2%, n = 81) whereas those with signs of 'mounting others' and 'mucus discharge' had CRs of47.4% and 42.5%, respectively.
Bull/semen factors: Imported deep frozen semen from five donor bulls (Ayrshire, Friesian andJersey) were used on the cows in this study. The resulting CRs ranged from 34.2 to 68.9% withsignificant difference (P <0.05) among donors; semen identification number Fr-390-1997 hadachieved the highest CR (68.9%, n = 61) while the semen identification number Fr-387-1997 achievedthe lowest CR (34.2%, n = 114). Semen code numbers Jr-208-1997, Fr-388-1997 and Ay-85105 hadCRs of 59.5% (n = 74), 59.1% (n = 22) and 63.6% (n = 33), respectively.
Inseminator related factors: Three farms (Ambewela, Dayagama and New Zealand) had one AItechnician per farm while the other (Bopaththalawa) had 2 technicians and all were resident on therespective farms. The technician factor was significant, with CRs ranging from 40.6% for thetechnician at New Zealand farm to 72.3% for one at Bopaththalawa. However, as the technician factorwas confounded within farm factor, true effect of technician cannot be isolated.
4. DISCUSSION
4.1. AI service at national level
Although AI has been considered as the primary tool for cattle breeding in the country, it stillreaches less than 20% of the breedable cattle population and accounts for less than 10% of the annualcalvings in the country. Considering that only half of the calves born are females, coupled with theknown high rate of wastage of male calves, the infusion of new genetic material into the nationalcattle population is therefore extremely low.
It was evident that although the AI service is in operation throughout the island, this service hasgained grounds and established itself as a primary breeding technique only in a few provinces. Interms of numbers of cattle only about 10% of the estimated breedable cattle population(approximately 600 000 cattle) is provided with a coverage above 50%. The rest of the population(90%) are provided with very marginal coverage and more than two-thirds are still be bred naturally,mostly by scrub bulls.
This low level of coverage on a national basis as well as in some areas of the country appear tobe due to many factors. The most significant factor is the variation in the infrastructural facilities,which is closely related to land use patterns coupled with the agro-ecology.
In the dry zone, which covers nearly two-thirds of the land mass and carries nearly half thecattle population, the coverage is less than 10% with a negligible level of coverage in many areas,particularly in the NCP, UP, SP, EP and NP. These areas have remained underdeveloped with respectto roads, transport and communication due to their low population density and harsh climaticconditions. Cattle are reared under extensive systems with dependence on communal grazing groundswhich are often located far away from the farmers' dwellings. Further, the predominant genotypes areindigenous and the expression of heat signs is not well marked. Farmers in these areas rely ontraditional knowledge rather than on modern technologies. This creates a problem for AI services asthe intended recipients are not well motivated to get the benefits of such a service and are unable todetect heat signs and get the animals served in time. This clearly shows that the farmers need to be
60

educated. However, the relatively few veterinarians in such areas are unable to fulfil this task due tothe low resources in terms of trained personnel, mobility and operational budgets at their disposal.Most parts of the intermediate zone too have similar problems. Though the infrastructural facilitiesare relatively better compared with the dry zone, farmers in this zone are not willing to invest timeand labour for an activity which does not bring enough returns. It is well known that the milk marketis heavily distorted and the producers lack bargaining power at the present time. The combined effectof all these factors is the low AI coverage of animals in the dry and intermediate zones of the country.
In the wet zone areas with relatively better infrastructure and reasonably well informed farmers,such as in CP and WP, the majority of the animals are covered by AI. In these areas the predominantgenotype is Bos taunts pure or crosses, the herd size is small, animals are managed with more careand farmers are compelled to use AI due to the absence of bulls for natural mating. Yet the successrate is lower than it ought to be.
The disparity in coverage and also the poor performance of AI in the different agro-ecologicalzones poses a serious question to development workers in the livestock sector. AI has been declaredas the primary breeding tool in efforts towards genetic up-grading. However, in the light ofcontinuous poor coverage and performance, particularly in most areas of the dry and intermediatezones, this policy may need to be re examined. This concern has also been expressed in manyprevious consultancy reports [8, 9].
4.2. Smallholder farms
In about a quarter of smallholdings in the mid-country wet zone of Sri Lanka, cattle farming fordairy production is an integral component of a mixed farming system [13]. The animals arepredominantly Bos taunis genotypes and the system of management is semi-intensive or intensive.Most farmers resort to AI for breeding their cows, due either to the awareness of the value of AI forobtaining a calf of higher dairy potential or the unavailability of good quality stud bulls in theirvillages. The present study revealed that the majority of farmers had no specific preferences forbreeds or type of semen indicating their lack of appreciation of the relative merits and suitability ofdifferent breeds for their particular farming environment. This points to an important need to educatethe farmers on breeding goals and the appropriate use of AI to achieve these goals. The calving to firstservice interval was well over 4 months and this may most likely stem from the poor knowledge offarmers on reproductive management of cattle. The majority did not breed their cows until severalmonths after calving because of the misconception that early re-breeding adversely affects the milkyield of the cow as well as the growth of the calf. The average calving to first service interval in thisstudy was 183 days, whereas in a previous study in this area [14], the average interval from calving tofirst rise in plasma progesterone was around 75 days. While one of the reasons for the delay in firstservice could have been postpartum anoestrous due to poor nutrition as evident from the study, it isalso likely that even those which returned to oestrus early in the postpartum period were kept unbredby the farmers due to the above misconceptions.
As evidenced from progesterone measurement in milk samples, the accuracy of oestrousdetection has been significantly low, with 13.2% having an active CL and 12.3% being anoestrous atAI. Even in those with low progesterone levels at AI, only 64% appeared to have had a normalovulatory oestrus. There is no doubt that these errors in oestrous detection would have contributedsignificantly to the observed low success rates of AI in this study. These results reinforce the findingsof previous studies [6, 7] and indicate the need for farmer education, training and extension in thisarea.
The average first service CR was 45%, which can be considered to be within the lower range ofacceptability for a developing country. However, two of the veterinary ranges studied had CRs below35%, which is below acceptability. A large number of factors relating to the farm, cow, semen andinseminator were recorded in this study. However, given the highly heterogeneous nature of thesample, many of these factors did not have sufficient records in their different categories to allow foraccurate interpretation. Also, several of the factors were interrelated and therefore producedconfounding effects. However, a few factors, as discussed below, were perceived to be of practical
61

importance and were found to have an overriding influence on CRs. These provide insights to ways inwhich the fertility of cattle in this region, as well as the AI service, might be improved.
Tendency for higher CR was found in animals fed concentrates as a supplement to roughagesthan in those not fed concentrates. The importance of nutrition is also evidenced by the finding thatcows with good BCS had a tendency to show higher CR than those with poor BCS. Thus improvednutrition will not only reduce the postpartum anoestrous period as shown in many studies, but alsoimprove CR. While recognising the possibility of direct effect of nutrition on fertilisation andsubsequent events, the finding that farms with higher proportions of their total family income fromdairying had shown tendency for higher CR than those with lower proportions, nevertheless indicatethat these families attached more importance, and hence paid more attention, to the care of their cows.Presumably, this may include better feeding and heat detection, getting the cow served at the righttime with respect to oestrus, resulting in higher fertility.
It is well known that the timing of insemination relative to first detection of heat is of a criticalnature for achieving high CR [15]. In the present study, a trend in CR was shown with time fromdetection of oestrus to service; the CR increased as the interval increased from 6 up to 24 hours, andthen declined. In theory, the optimum time for service is 12-18 hours after onset of "standing" heat.However, in the present study, the animals were housed or tethered and there was no opportunity forthem to exhibit standing heat. Thus, it is likely that the farmer's reliance on signs such as vaginalmucous discharge and bellowing may have resulted in animals being detected during pro-oestrus,several hours before the actual onset of oestrus. This could explain the above results, since AI done18-24 hours after detection by the farmer would mean 12-18 hours after onset of standing heat.Incorrect timing of AI can be a major constraint in many regions of Sri Lanka. This stems from theignorance of farmers regarding the importance of correct timing of service and the poorcommunication between smallholdings which are scattered and the AI service centres which are fewin number. Attention therefore needs to be focused on addressing these deficiencies.
Variations in fertility due to bulls were also observed. Of the seven bulls from which semen hadbeen used for at least 20 inseminations, one had very poor CR (18.2%), while two others had CRsbelow 45%. The continued use of such bulls in an AI programme is clearly unwarranted. A regularprogramme should therefore be instituted to monitor each bull used in AI and to cull those that havelow fertility. Semen produced locally gave higher CR than imported semen. Assuming that theimported semen was of good quality at the point of origin, problems during subsequent transport,storage and/or handling could be responsible for the decline in fertility. Although the number ofobservations was low, a tendency for higher CR with chilled than with frozen semen was seen. Thisfurther stresses the need for special care in all operations associated with frozen semen. The findingsof this study emphasise the need for provision of optimal conditions for transport and storage ofsemen, and also for routine monitoring of quality at the point of receipt and during storage.
The influence of the technician on the outcome of AI is well documented. Not only their skill,but also motivation, attitudes and the facilities available have profound influence on the outcome ofAI. In the present study, only one technician was monitored in each of three veterinary ranges, whiletwo were monitored in the fourth range (Yatinuwara). Thus location was a confounding factor ininterpreting the influence of technicians on CR in this study. However, the wide range of CR seenbetween individual technicians (27.8-58.5%) is noteworthy. Also, both technicians monitored atYatinuwara (the location which recorded lowest FSCR and OCR) had the lowest CRs. Althoughfurther studies are needed to partition the effects of factors such as location, bull, semen type andtechnician in order to evaluate the true effects of technicians on CR, it is very conceivable thattechnicians may have contributed substantially to the variation in CRs in the present study.
4.3. Large farms
Of the four farms studied only one has achieved CRs at least in the lower level of theacceptable range, while the other farms recorded even lower rates. This is a matter for concern asthese farms are the premier state farms for multiplication of Bos taurus cattle in the country and arekept for the purpose of providing superior breeding animals to the smallholder farmers.
62

A recent study has shown that less than 75% of total potential land extent on these farms haveimproved pasture and the stocking rate is much lower than the potential [12]. In one farm, the bodyweights of the mature animals are much lower than those expected for that genotype. This may bemost likely due to sub-optimal nutrition and lack of a regular selection and culling policy for desiredbreed characteristics and performance. The sub-optimal feeding of animals was reflected in BCS, withmost animals recorded at less than 2.5. In general all four farms do not appear to practice a regularsystematic culling programme on the basis of age, productivity and reproductive performances asreflected in the heterogeneity of the cattle population in terms of parity. As shown in the presentstudy, the older animals tend to be less fertile. Therefore, sound management coupled with regularculling is of paramount importance to achieve higher fertility in these multiplier farms.
The average CFSI in all farms were well over three months. This delay may be due to longperiods of postpartum anoestrus and, judging from the body condition of these animals, this is mostlikely caused by poor nutrition, particularly during the early postpartum period. Though the animalson New Zealand farm had relatively better body condition, yet their production levels were higherthan those of animals at other farms. Presumably, these high yielding animals may have run intonutritional limitations particularly during the immediate post-calving period because of a greater drainof nutrients through milk. With overall average of two services per conception, the overall CCI waswell over 5 months. At this level of efficiency of postpartum fertility, the average inter-calvinginterval was estimated to be 18 months, which cannot be considered to be satisfactory for a multiplierfarm.
Although the average milk production was superior at New Zealand farm, the indices of fertilitywere inferior to those in the other three farms, where these were in any case lower than the desiredlevel. Many factors may have contributed to this situation: firstly, sub-optimal nutritionalmanagement; secondly, a high proportion of older animals; and thirdly, as discussed later, poor heatdetection.
As evidenced from progesterone concentration in milk samples, the accuracy of heat detectionand the timing of insemination at all farms was less than optimal. Based on progesterone levels on dayof AI (day 0), 10% of the animals could not have been in oestrus. When progesterone levels in the twosamples on days 0 and 10-12 were considered, only 67% appeared to have had a normal ovulatoryoestrus. If the samples with inconclusive progesterone data are also included, 36% of the cowspresented for AI were not correct candidates to receive an AI; they were either anoestrous, pregnant orhad an abnormal oestrous cycles. Thus oestrous detection efficiency appears to be a major factorcontributing to the low success rate of AI. This point is supported by the finding that the farms whichcoupled visual heat detection with teaser bulls had higher CRs compared to those farms that reliedonly on visual heat detection.
The timing of AI relative to first detection of heat is known to be critical for achieving highCRs [15]. In theory, higher conception rates can be achieved if animals are inseminated between 12-18 hrs after detection of heat. In the present study AIs were performed at time intervals ranging from1 to 24 hours and, when grouped into 3 time intervals (0-6, 6-12, and 12-24), the respective CRswere 60, 49 and 51%. This pattern of conception in relation to timing of AI could have been mostlikely due to the herdsmen's inability to differentiate prooestrus and oestrus, and to make a correctjudgement of the time of onset of oestrus.
Another factor which appears to have a significant effect on CR following AI is semen quality.It is apparent that factors relating to the chain of activities in performing AI such as transport, storageand handling of semen during thawing and the AI technique itself are very important determinants ofCR [15]. Findings of on-going research in our laboratory indicate that there is significant reduction inquality of semen during storage and transport. There was a drop of sperm motility from 55 to 50%upon dispatch from the point of production to point of use. At the point of use there was again asignificant reduction of motility with time, dropping to less than 30% over a 3 month storage period.As we have not looked into this aspect in the present study, conclusions cannot be made on thepossible contribution of semen quality to recorded conception rates. With regard to technique ofinsemination, there appear to be differences between technicians, which may be related to skill,motivation, attitudes and facilities available to them. A wide difference was seen in CRs achieved byindividual technicians. The lowest fertility was seen at the farm which was served by the technician
63

with lowest achievement in CR. Whether this is a reflection of the technician's poor performances orthe result of sub-optimal management factors related to heat detection, timing of insemination orsemen factors cannot be determined for certainty at this point. Of the 5 bulls from which semen wasused in at least 20 inseminations, one had very poor CR (34%). It is clear that there is an influence ofthe semen donor in the observed variation in fertility. Further studies are in progress to partition theeffects of factors such as heat detection efficiency, timing of insemination, bull and semen type, andtechnician in order to evaluate the true effects of these factors on the observed fertility status ofartificially bred cattle in Sri Lanka.
5. CONCLUSIONS
In conclusion, the findings of the first study indicate that the proportion of breedable cattleserved by AI and the overall success rate of AI are too low to make a measurable impact on thegenetic composition of the national cattle population. Many factors have contributed to this low levelof performance and efficiency, including farmer's ignorance and low motivation, poor infrastructuralfacilities, inadequate veterinary coverage and resources, low motivation and mobility of field staff.The findings of the second study indicate that the overall success rate of AI in small-holder farms inthe mid-country wet zone of Sri Lanka is in the lower range of acceptability, with high variability inCR between locations. Findings of the third study indicate that the overall success rate of AI in thefour state multiplier farms studied was also lower than optimal. Both smallholder and large farmstudies suggest that many factors appear to contribute to this low level of efficiency. Of these, poorheat detection and delays in getting the AI done stand out as the most important contributory factors.Results also indicate that the quality of semen, technical efficiency in its handling and storage, and theskill of AI technicians also contribute to this low success rate.
ACKNOWLEDGEMENTS
This study was conducted under an FAO/IAEA Research Contract (SRL-8301/RB) and wewish to acknowledge the financial assistance, RIA kits and computer software provided under thegrant. We thank the officers in the Division of Livestock Resources Development in the Departmentof Animal Production and Health and National Livestock Development Board for providinginformation for Study 1. We also thank the officers in the Division of Livestock ResourcesDevelopment in the Department of Animal Production and Health, the field veterinarians and the AItechnicians in the five study areas for the assistance provided during Study 2. We record our gratitudeto Mr. M.G. Chandrasena and Dr. Sarath Kaduwela of the National Livestock Development Board forpermission to conduct Study 3. We are also very thankful to the Managers, Assistant Managers and AItechnicians at Ambewela, Bopaththalawa, New Zealand and Dayagama farms for their cooperationand assistance provided during study 3. The technical services of Mr. A.M. Karunarathna, Mr. JanakaHerath and Ms. Ramani Ruwanpathirana are acknowledged with thanks. We are also grateful to Drs.J.A.de S. Siriwardena and D.H.A. Subasinghe for their advice and constructive criticism during thepreparation of the manuscript.
REFERENCES
[1] MAHAMOOTH, T.M.Z., Development of artificial method of breeding livestock in Sri Lanka,Ceylon Vet. J. 3 (1955) 2-5.
[2] KARUNATILAKE, H.N.S., Economic Development in Ceylon. Praeger Publishers, New York,USA (1971).
[3] JEGANATHAN, P., A review of the progress of artificial insemination of cattle in Ceylon,Ceylon Vet. J. 3 (1955) 6-31.
[4] JAINUDEEN, M. R., The use of imported frozen semen in routine insemination of dairy cattlein Ceylon, Ceylon Vet. J. 16 (1968) 7-10.
64

[5] SRI LANKA LIVESTOCK STATISTICS. Ministry of Agricultural Development andResearch, Colombo, Sri Lanka (1991/92).
[6] MOHAMED, A.R., SIVAKANESAN, R., RAJAMAHENDRAN, R., "Oestrous detection andreproductive performance of cattle in Sri Lanka", Studies on the Reproductive Efficiency ofCattle Using Radioimmunoassay Techniques, International Atomic Energy Agency, Vienna,(1990)73-85.
[7] ABEYGUNAWARDENA, H., MYA SEIN, C , EPAKANDA, L.W.B., Status of the artificialinsemination programme, success rate and factors affecting fertility of artificially bred cattle,Sri Lanka Vet. J. 42 (1995) 25-26.
[8] SONI, B.K., ABEYGUNAWARDENA, H., JAYATILAKE, M.W.A.P., KENDARAGAMA,T., Review of Animal Health and Extension Services of Department of Animal Production andHealth in Sri Lanka. GTZ Consultancy Report, Ministry of Agricultural Development andResearch, Peradeniya, Sri Lanka (1991).
[9] FAO mission on dairy breeding and genetics in Sri Lanka. Ministry of Rural IndustrialDevelopment, Colombo, Sri Lanka (1984).
[10] ABEYGUNAWARDENA, H., ABEYGUNAWARDENA, I.S., Fifty years of animal breedingactivities in Sri Lanka: A critical assessment, Sri Lanka Vet. J. (accepted for publication)(2000).
[11] ALEXANDER, P.A.B.D., ABEYGUNAWARDENA, H., PERERA, B.M.A.O.,ABEYGUNAWARDENA, I.S., Current status and factors affecting the success rate of artificialinsemination in smallholder farms in mid country wet zone of Sri Lanka, Trop. Agric. Res. 9(1997)204-216.
[12] ALEXANDER, P.A.B.D., ABEYGUNAWARDENA, H., PERERA, B.M.A.O.,ABEYGUNAWARDENA, I.S., Reproductive performance and factors affecting the successrate of artificial insemination of cattle in upcountry multiplier farms, Trop. Agric. Res. 10(1998)356-371.
[13] ABEYGUNAWARDENA, H., RATNAYAKE, D., JAYATILAKE, M.W.A.P., Characteristicsof cattle farming systems in Sri Lanka, J. Natn. Sci. Coun, Sri Lanka 25 (1996) 25-38.
[14] ABEYGUNAWARDENA, H., ABEYGUNAWARDENA, I.S., PERERA, A.N.F.,JAYAPADMA, H.M.H.L., EPAKANDA, L.W.B., Characteristics of mid country smallholderdairy cattle production system, Sri Lanka Vet. J. 42 (1995) 27-28.
[15] PETERS, A.R., BALL, P.J.H., Reproduction in cattle, Second Edition, Blackwell Press,Oxford, U.K. (1995).
65