artificial cochlea and acoustic black hole travelling
TRANSCRIPT

HAL Id: hal-01111368https://hal.archives-ouvertes.fr/hal-01111368
Submitted on 30 Jan 2015
HAL is a multi-disciplinary open accessarchive for the deposit and dissemination of sci-entific research documents, whether they are pub-lished or not. The documents may come fromteaching and research institutions in France orabroad, or from public or private research centers.
L’archive ouverte pluridisciplinaire HAL, estdestinée au dépôt et à la diffusion de documentsscientifiques de niveau recherche, publiés ou non,émanant des établissements d’enseignement et derecherche français ou étrangers, des laboratoirespublics ou privés.
Artificial cochlea and acoustic black hole travellingwaves observation: Model and experimental results
Simon Foucaud, Guilhem Michon, Yves Gourinat, Adrien Pelat, FrançoisGautier
To cite this version:Simon Foucaud, Guilhem Michon, Yves Gourinat, Adrien Pelat, François Gautier. Artificial cochleaand acoustic black hole travelling waves observation: Model and experimental results. Journal ofSound and Vibration, Elsevier, 2014, vol. 333 (n° 15), pp. 3428-3439. �10.1016/j.jsv.2014.03.016�.�hal-01111368�

This is an author-deposited version published in: http://oatao.univ-toulouse.fr/
Eprints ID: 13345
To link to this article: DOI:10.1016/j.jsv.2014.03.016
URL: http://dx.doi.org/10.1016/j.jsv.2014.03.016
To cite this version: Foucaud, Simon and Michon, Guilhem and Gourinat,
Yves and Pelat, Adrien and Gautier, François Artificial cochlea and
acoustic black hole travelling waves observation: Model and experimental
results. (2014) Journal of Sound and Vibration, vol. 333 (n° 15). pp. 3428-
3439. ISSN 0022-460X
Open Archive Toulouse Archive Ouverte (OATAO) OATAO is an open access repository that collects the work of Toulouse researchers and
makes it freely available over the web where possible.
Any correspondence concerning this service should be sent to the repository
administrator: [email protected]
Artificial cochlea and acoustic black hole travelling wavesobservation: Model and experimental results
Simon Foucaud a,n, Guilhem Michon a, Yves Gourinat a, Adrien Pelat b,François Gautier b
a Université de Toulouse, INSA, UPS, EMAC, ISAE, ICA (Institut Clément Ader), 10 Avenue Edouard Belin, 31055 Toulouse, Franceb Laboratoire d'Acoustique de l'Université du Maine, CNRS, Avenue Olivier Messiaen, 72085 Le Mans, France
a r t i c l e i n f o a b s t r a c t
An inhomogeneous fluid structure waveguide reproducing passive behaviour of the inner
ear is modelled with the help of the Wentzel–Kramers–Brillouin method. A physical setup
is designed and built. Experimental results are compared with a good correlation to
theoretical ones. The experimental setup is a varying width plate immersed in fluid and
terminated with an acoustic black hole. The varying width plate provides a spatial
repartition of the vibration depending on the excitation frequency. The acoustic black hole
is made by decreasing the plate's thickness with a quadratic profile and by covering this
region with a thin film of viscoelastic material. Such a termination attenuates the flexural
wave reflection at the end of the waveguide, turning standing waves into travelling waves.
1. Introduction
The cochlea is the mammalian organ of hearing. It is made of a fluid-filled duct partitioned with the basilar membrane.The basilar membrane compliance is varying along the length of cochlea. The acoustic excitation coming from the externalsound provides a wave travelling along the basilar membrane from the base to the apex of the cochlea with a peak ofmaximum magnitude. The localization of this peak is related to the excitation frequency and permits the sounddiscrimination.
Artificial cochleas mimic mechanical filtering without the help of a power-consuming processing device. Vibrations aremeasured with the help of piezoelectric patches [1] or laser velocimeter [1–3]. The frequency–place relation, calledtonotopy, can be observed on these devices. However, reflections at the end of the waveguides provide standing waves.In the inner ear, waves are attenuated before they reach the apex because of interstitial fluid viscosity and no reflectionoccurs [4]. This mechanism is not easily reproducible even with micromachining techniques [2]. Interesting results can beobtained by increasing the fluid viscosity [5] but the resulting magnitude is then reduced by the introduced damping. Here,a new method is experimented to observe travelling waves on an artificial metallic support. The Acoustic Black Hole (ABH)effect takes place for flexural waves propagating toward sharp edges [6–8]. It attenuates the reflected waves at free edges ona wide frequency bandwidth.
n Corresponding author.
E-mail address: [email protected] (S. Foucaud).

This paper describes a waveguide inspired by artificial cochleas and designed in order to observe travelling waves. Maincomponents of the waveguide are two ducts partitioned with a plate of varying width. An ABH is added as an anechoic end.An asymptotic method is used to model the waveguide. In a wave approach, the ABH is here modelled with a reflectioncoefficient. An experimental setup is manufactured and experimented successively with ducts filled with water and with air.Finally, experimental results are compared to the model and discussed.
2. Model of the inhomogeneous waveguide
Let us consider an inhomogeneous waveguide made with a flexible panel coupled to a confined fluid domain (see Fig. 1).Here, the modelling strategy aims at reducing computing costs and providing analytical interpretations. Firstly, simplifyingassumptions are applied for obtaining governing equations of the solid and fluid domains. Then, an asymptotic methodprovides a formulation for the solution of the coupled problem as a one-dimensional propagating wave. Finally, wavepropagation problem is solved using a Lagrangian approach.
2.1. Governing equations
The considered geometry (see Fig. 1) is called a box model of the cochlea. The geometric parameters are varying slowlyalong the waveguide in the Z direction. From zA to zB, the height H of the ducts and the thickness h of the plate are constantwhile the width b of the plate is varying linearly. Then, from zB to zC, the waveguide cross section is constant. Finally, in thethird zone, from zC to zD, the thickness decreases in a quadratic law to zero while the width of the plate stays constant. Ductsare joined at the free end of the plate. Modelling is focused on the section from zA to zB. The constant zone from zB to zC andthe acoustic black hole from zC are considered as a boundary condition at zB. Vibrations are considered as harmonic at thefrequency ω and the time dependance of each variable is eiωt . Assuming no viscosity and incompressibility, the fluid domainis ruled by the Laplace equation, satisfied by the velocity potential Φ
ΔΦ¼ 0; (1)
where the operator Δ denotes ∂2=∂x2þ∂2=∂y2þ∂2=∂z2. The outer walls are rigid and fixed. The interface between fluid andstructure is moving vertically. These definitions provide the following boundary conditions:
v-
# n-
¼ 0 for x¼ 7b=2 (2)
v-
# n-
¼ _W for y¼ 7H and y¼ 0; (3)
where n-
is the normal vector to the surfaces, v-
corresponds to the fluid velocity and _W is the structural velocity. Since theratio of the thickness to the width and to the length stays very small, the structure is considered as a thin body and verticaldisplacement are assumed as constant through the thickness of the structure. The dynamic equation for an isotropicbending plate under harmonic vibration is
∂2
∂z2D∂2W
∂z2
! "
þ2∂2
∂z∂xD∂2W
∂z∂x
! "
þ∂2
∂x2D∂2W
∂x2
! "
$ρph zð Þω2Wþpf ¼ 0; (4)
where W is the deflection, h(z) the thickness, ρp the density, D the flexural rigidity of the plate defined byD¼ EhðzÞ3=12ð1$ν2Þ with E the Young modulus and ν Poisson's ratio of the material. pf is the resulting fluid pressureapplied on the plate. The damping is considered with the substitution of E with a complex Young's modulus as Ec ¼ Eð1þ iηsÞwith ηs the structural damping ratio. The structural displacement is imposed at the first cross section. The boundary
Fig. 1. Geometry of the box model.
condition in zB is due to the ABH effect and will be defined later. The plate is clamped on its both sides along the wholelength of the waveguide. Thus the boundary conditions for the structural domain are
∂W
∂x¼ 0 and W ¼ 0 for x¼ 7b=2 (5)
W ¼W0 for z¼ zA: (6)
The aim of the model is to solve the deflection of the plate and the fluid pressure field for the varying width zone, from zA tozB. A wide number of numerical methods (Finite Elements Method for example) could be used to solve this problem.Numerical methods require great computing costs and the relation between results and system parameters is not clearlyexpressed. Here, a semi-analytic asymptotic method simplifies the solving and provides an analytic expression.
2.2. WKB formulation
The Wentzel–Kramers–Brillouin (WKB) method has been used from the early seventies [9,10] for modelling thebehaviour of passive cochlea, seen as mechanical waveguide. Wave representation is very useful for physical interpretationssince results are expressed with an analytical expression depending on only two modelling variables – wavenumbers andmagnitudes – permitting an analysis of the system.
Since the waveguide is slowly varying, variables are separated within the product of a longitudinal envelope function anda transverse mode shape under the form YzðzÞYT ðx; yÞeSðzÞeiωt and the following relation is assumed:
Y 0zðzÞ{S0ðzÞYzðzÞ; (7)
where 0 ¼ ∂=∂z. It means that the derivative along the longitudinal direction is substituted by a multiplication factor S0ðzÞ
in the following. We define the longitudinal wavenumber k(z) by
kðzÞ ¼ iS0ðzÞ: (8)
In the fluid domain, the velocity potential Φðx; y; zÞ is chosen as the independent variable
Φðx; y; zÞ ¼ ϕðx; yÞϕzðzÞeSðzÞ: (9)
In the structure domain, the independent variable is the deflection Wðx; zÞ of the median plane (y¼0) of the plate
Wðx; zÞ ¼wðxÞwzðzÞeSðzÞ: (10)
2.3. Fields expression
The expression of the fluid velocity potential (9), introduced into Eq. (1), gives
½ΔTϕðx; yÞϕzþϕðx; yÞððS0Þ2ϕzþϕ″
zþ2ϕ0zS
0þϕzS″Þ)eSðzÞ ¼ 0; (11)
where ΔT ¼ ∂2=∂x2þ∂2=∂y2 is the bidimensional Laplacian in the (x,y) plane. Using the WKB assumption (7), ðS0Þ2ϕz is thedominant factor of ϕðx; yÞ in the previous equation. Thus, the following partial differential equation is obtained at order zero:
½ΔTϕðx; yÞþðS0Þ2ϕðx; yÞ)ϕzðzÞeSðzÞ ¼ 0: (12)
Finally, the transverse problem for the fluid field ϕðx; yÞ can be expressed in each cross section by
ΔTϕðx; yÞ$k2ϕðx; yÞ ¼ 0; (13)
The boundary conditions on the upper, the lower and the lateral walls are hard wall conditions ∂Φ=∂n¼ 0
∂ϕ
∂xx¼ 7
bðzÞ
2
! "
¼ 0 (14)
∂ϕ
∂yy¼ 7Hð Þ ¼ 0 (15)
The fluid structure interaction is represented with a continuity of the velocity field between fluid and structure on theinterface boundary through the relation
∂Φ
∂yy¼ 0ð Þ ¼ $ iωW x; zð Þ; (16)
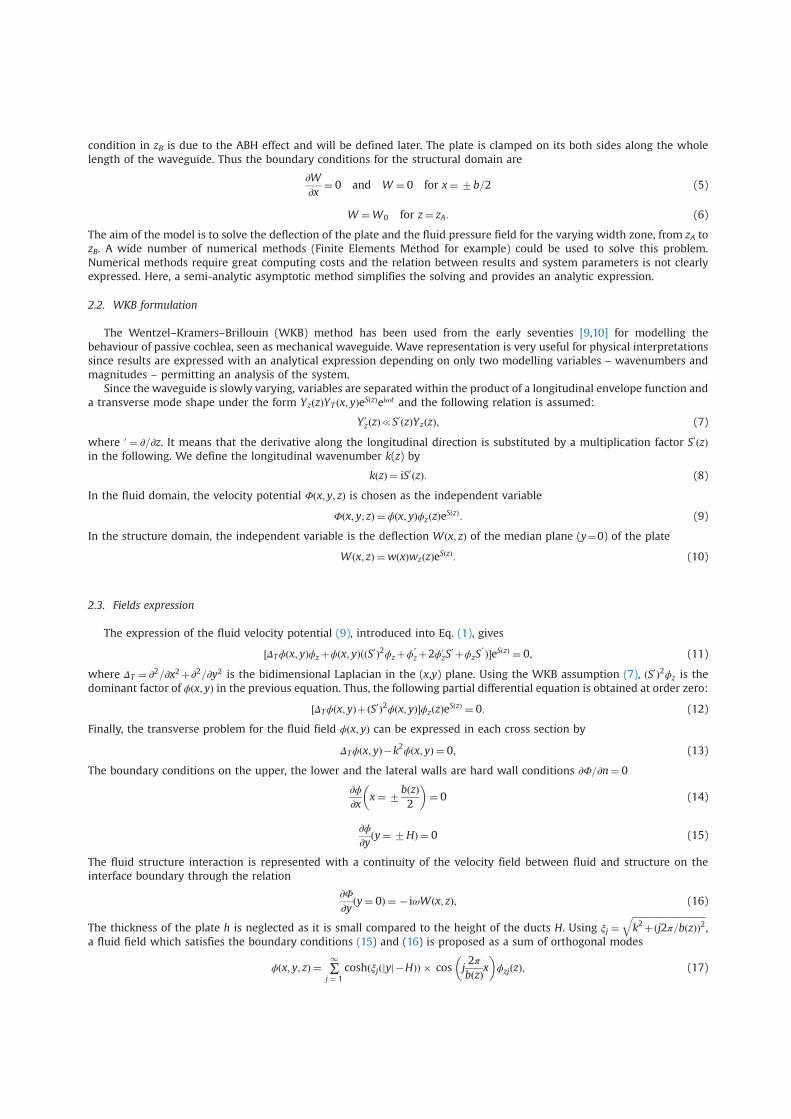
The thickness of the plate h is neglected as it is small compared to the height of the ducts H. Using ξj ¼
ffiffiffiffiffiffiffiffiffiffiffiffiffiffiffiffiffiffiffiffiffiffiffiffiffiffiffiffiffiffiffiffi
k2þðj2π=bðzÞÞ2q
,a fluid field which satisfies the boundary conditions (15) and (16) is proposed as a sum of orthogonal modes
ϕ x; y; zð Þ ¼ ∑1
j ¼ 1
coshðξjðjy $Hj ÞÞ , cos j2π
bðzÞx
! "
ϕzj zð Þ; (17)
where the terms ϕzjðzÞ are defined in order to satisfy the boundary condition (16). These terms are calculated introducing theexpression (17) in (16) and projecting it on the cos ðjð2πbðzÞÞxÞ basis
ϕzj zð Þ ¼ $ iω
R bðzÞ=2$bðzÞ=2 cos j
2π
bðzÞx
! "
w xð Þ dx
R bðzÞ=2$bðzÞ=2 cos 2 j
2π
bðzÞx
! "
dx
,1
ξj sinhðξjHÞwz zð Þ: (18)
This expression establishes the expected relationship between the fluid velocity potential and the plate deflection wz(z). Thefluid pressure is related to the fluid potential through the relation pðx; y; zÞ ¼ $ iρfωΦðx; y; zÞ, where ρf is the density of thefluid. Since the velocity field is antisymmetric in the lower and upper ducts, the resulting pressure applied on the plate istwice the pressure from one duct. Introducing the expression (10) into the plate equation (4), the following equation mustbe satisfied in each cross section:
Dwz zð Þ k4 zð Þw xð Þ$2kðzÞ2∂2wðxÞ
∂x2þ∂4wðxÞ
∂x4
! "
$ρph zð Þω2wz zð Þw xð Þ$2iρfωϕ x;0; zð Þ ¼ 0; (19)
with the boundary conditions
w xð Þ ¼ 0 and∂wðxÞ
∂x¼ 0 for x¼ 7b=2: (20)
The transversal deflected shape is assumed as a solution of a transverse beam problem with the previous boundaryconditions (20)
D∂4wðxÞ
∂x4
! "
$ρph zð Þω2w xð Þ ¼ 0: (21)
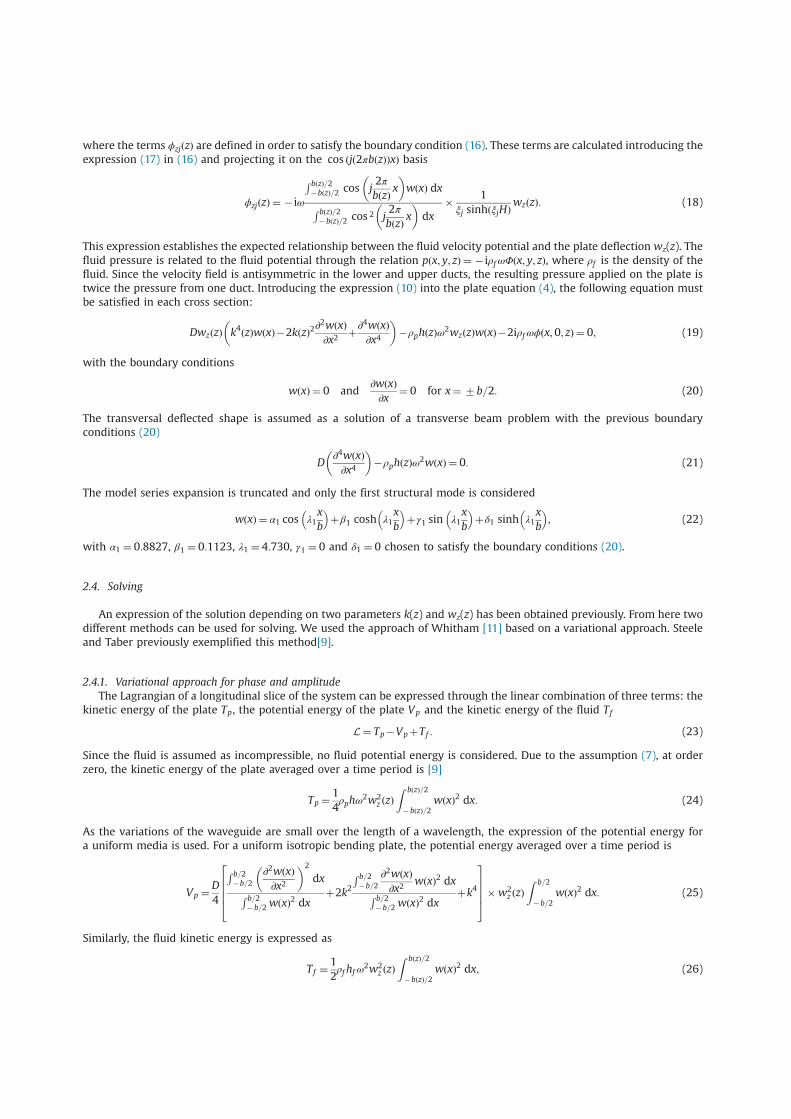
The model series expansion is truncated and only the first structural mode is considered
w xð Þ ¼ α1 cos λ1x
b
& '
þβ1 cosh λ1x
b
& '
þγ1 sin λ1x
b
& '
þδ1 sinh λ1x
b
& '
; (22)
with α1 ¼ 0:8827, β1 ¼ 0:1123, λ1 ¼ 4:730, γ1 ¼ 0 and δ1 ¼ 0 chosen to satisfy the boundary conditions (20).
2.4. Solving
An expression of the solution depending on two parameters k(z) and wz(z) has been obtained previously. From here twodifferent methods can be used for solving. We used the approach of Whitham [11] based on a variational approach. Steeleand Taber previously exemplified this method[9].
2.4.1. Variational approach for phase and amplitude
The Lagrangian of a longitudinal slice of the system can be expressed through the linear combination of three terms: thekinetic energy of the plate Tp, the potential energy of the plate Vp and the kinetic energy of the fluid T f
L¼ Tp$VpþT f : (23)
Since the fluid is assumed as incompressible, no fluid potential energy is considered. Due to the assumption (7), at orderzero, the kinetic energy of the plate averaged over a time period is [9]
Tp ¼1
4ρphω
2w2z zð Þ
Z bðzÞ=2
$bðzÞ=2wðxÞ2 dx: (24)
As the variations of the waveguide are small over the length of a wavelength, the expression of the potential energy fora uniform media is used. For a uniform isotropic bending plate, the potential energy averaged over a time period is
Vp ¼D
4
R b=2$b=2
∂2wðxÞ
∂x2
! "2
dx
R b=2$b=2 wðxÞ2 dx
þ2k2
R b=2$b=2
∂2wðxÞ
∂x2wðxÞ2 dx
R b=2$b=2 wðxÞ2 dx
þk4
2
6
6
6
4
3
7
7
7
5
,w2z zð Þ
Z b=2
$b=2wðxÞ2 dx: (25)
Similarly, the fluid kinetic energy is expressed as
T f ¼1
2ρfhfω
2w2z zð Þ
Z bðzÞ=2
$bðzÞ=2wðxÞ2 dx; (26)
where hf is the equivalent fluid mass of the both ducts, calculated as in [9]
hf ¼ ∑1
j ¼ 1
1
ξj tanhðξjHÞ
R bðzÞ=2$bðzÞ=2 w xð Þ cos j
2π
bðzÞx
! "
dx
! "2
R bðzÞ=2$bðzÞ=2 cos 2 j
2π
bðzÞx
! "
dxR bðzÞ=2$bðzÞ=2 wðxÞ2 dx
: (27)
Finally, the first order time-averaged Lagrangian expression is
L¼1
2ρfω
2hf þ1
4ρpω
2h$D
4I1ðzÞþ I2ðzÞk
2þk4
& '
/ 0
,w2z zð Þ
Z bðzÞ=2
$bðzÞ=2w2 x; yð Þ dx; (28)
with
I1 zð Þ ¼
R b=2$b=2
∂2wðxÞ
∂x2
! "2
dx
R b=2$b=2 wðxÞ2 dx
; (29)
I2 zð Þ ¼
R b=2$b=2
∂2wðxÞ
∂x2wðxÞ2 dx
R b=2$b=2 wðxÞ2 dx
: (30)
The variational principle [11] provides an eikonal equation and a transport equation through the invariance of theLagrangian with the variations in wz(z) and θðz; tÞ ¼ωtþSðzÞ,
∂L
∂wz¼ 0; (31)
∂L
∂θ¼
∂
∂t
∂L
∂ωþ
∂
∂z
∂L
∂k¼ 0: (32)
For each cross section, wavenumbers k(z) are the solutions of the eikonal equation (31) also called the dispersion relation
DðI1ðzÞþ I2ðzÞk2þk4Þ$2ρfω
2hf $ρpω2h¼ 0: (33)
For an established periodic response, the transport equation (32) gives
1
2ρfω
2∂hf∂k
$D∂ðI1ðzÞþ I2ðzÞk
2þk4Þ
∂k
!
w2z zð Þ
Z bðzÞ=2
$bðzÞ=2w2 xð Þ dx¼ Cz; (34)
where Cz is a constant. This expression corresponds to the conservation of the energy transported by the wave.
2.4.2. Excitation and boundary conditions
Since the relation of dispersion (33) is even, the plate deflection is a combination of an incident and a reflected wave
Wðx; zÞ ¼wziðzÞwðxÞeSðzÞþwzrðzÞwðxÞe$SðzÞ: (35)
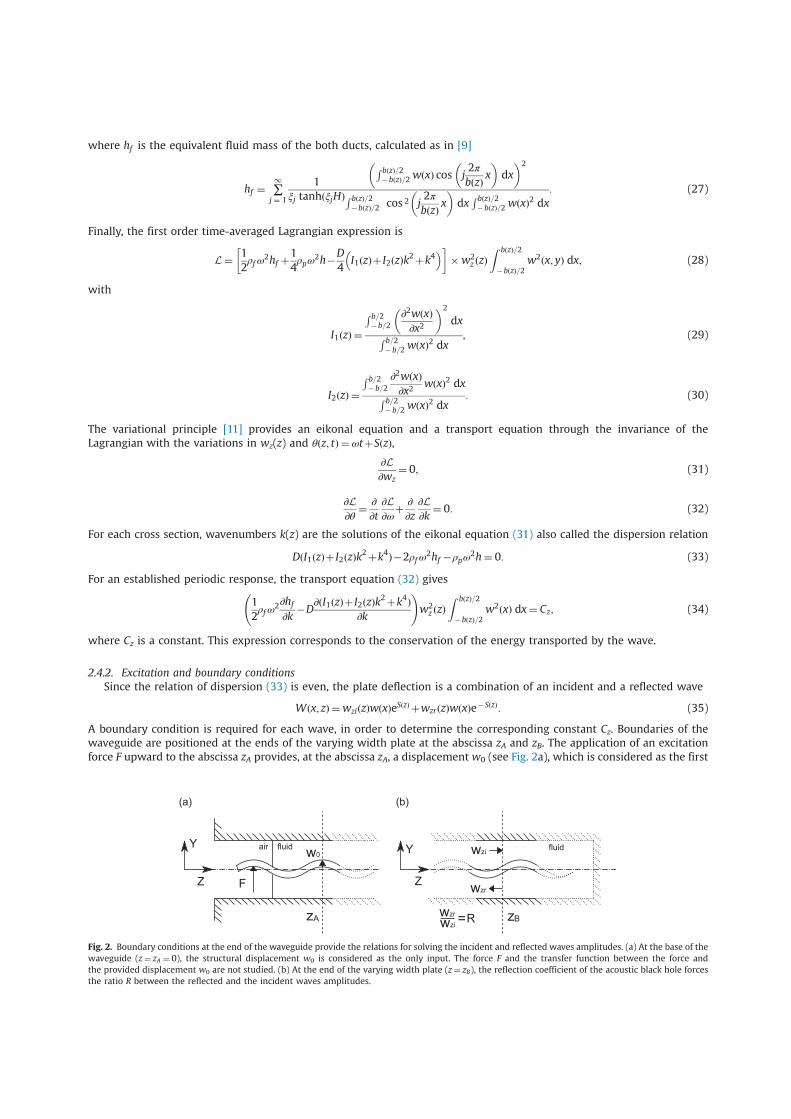
A boundary condition is required for each wave, in order to determine the corresponding constant Cz. Boundaries of thewaveguide are positioned at the ends of the varying width plate at the abscissa zA and zB. The application of an excitationforce F upward to the abscissa zA provides, at the abscissa zA, a displacement w0 (see Fig. 2a), which is considered as the first
Fig. 2. Boundary conditions at the end of the waveguide provide the relations for solving the incident and reflected waves amplitudes. (a) At the base of the
waveguide (z¼ zA ¼ 0), the structural displacement w0 is considered as the only input. The force F and the transfer function between the force and
the provided displacement w0 are not studied. (b) At the end of the varying width plate (z¼ zB), the reflection coefficient of the acoustic black hole forces
the ratio R between the reflected and the incident waves amplitudes.
boundary condition
wziðzAÞþwzrðzAÞ ¼w0: (36)
The acoustic black hole is considered here as an anechoic end providing a relation between the incident and the reflectedwaves at the abscissa zB (see Fig. 2b)
wzrðzBÞ
wziðzBÞ¼ R; (37)
where R is the coefficient of reflection of the acoustic black hole [6].Using the expression (34) and the previous boundary conditions (36) and (37), the incident and reflected waves
amplitudes are solved for each cross section of the varying width plate.
2.5. Results
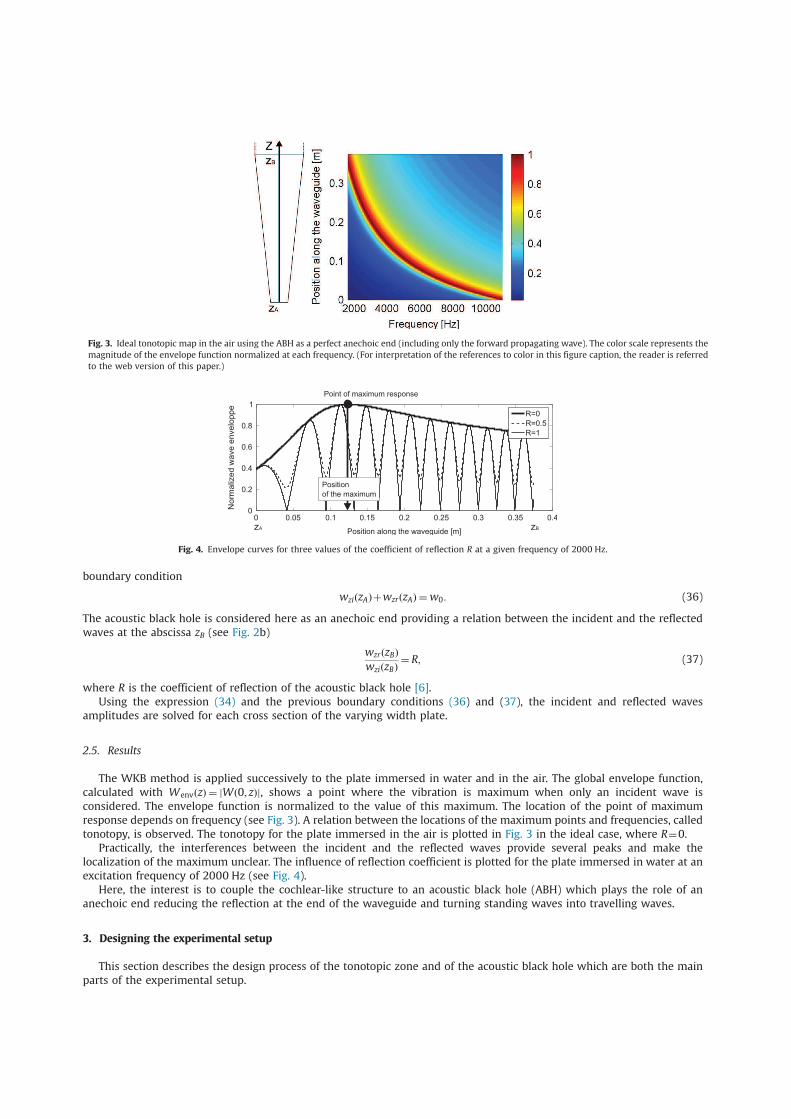
The WKB method is applied successively to the plate immersed in water and in the air. The global envelope function,calculated with WenvðzÞ ¼ jWð0; zÞj, shows a point where the vibration is maximum when only an incident wave isconsidered. The envelope function is normalized to the value of this maximum. The location of the point of maximumresponse depends on frequency (see Fig. 3). A relation between the locations of the maximum points and frequencies, calledtonotopy, is observed. The tonotopy for the plate immersed in the air is plotted in Fig. 3 in the ideal case, where R¼0.
Practically, the interferences between the incident and the reflected waves provide several peaks and make thelocalization of the maximum unclear. The influence of reflection coefficient is plotted for the plate immersed in water at anexcitation frequency of 2000 Hz (see Fig. 4).
Here, the interest is to couple the cochlear-like structure to an acoustic black hole (ABH) which plays the role of ananechoic end reducing the reflection at the end of the waveguide and turning standing waves into travelling waves.
3. Designing the experimental setup
This section describes the design process of the tonotopic zone and of the acoustic black hole which are both the mainparts of the experimental setup.
Fig. 3. Ideal tonotopic map in the air using the ABH as a perfect anechoic end (including only the forward propagating wave). The color scale represents the
magnitude of the envelope function normalized at each frequency. (For interpretation of the references to color in this figure caption, the reader is referred
to the web version of this paper.)
Fig. 4. Envelope curves for three values of the coefficient of reflection R at a given frequency of 2000 Hz.
3.1. Dimensions of the tonotopic zone
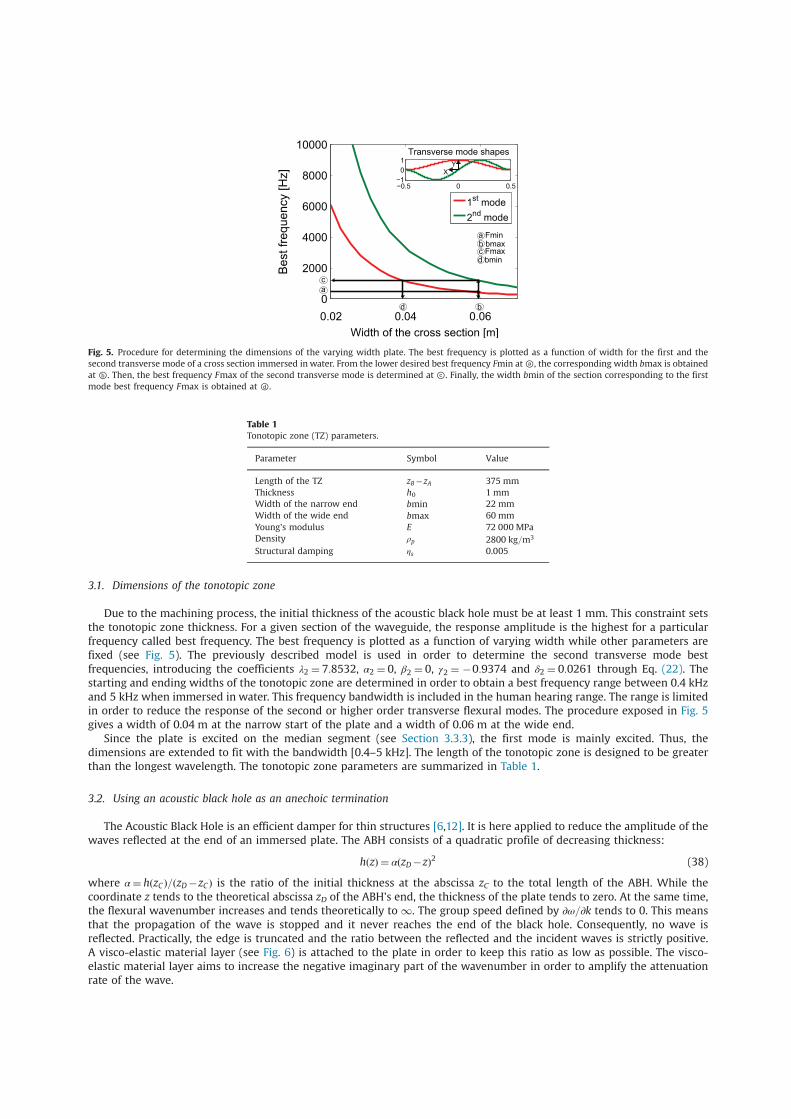
Due to the machining process, the initial thickness of the acoustic black hole must be at least 1 mm. This constraint setsthe tonotopic zone thickness. For a given section of the waveguide, the response amplitude is the highest for a particularfrequency called best frequency. The best frequency is plotted as a function of varying width while other parameters arefixed (see Fig. 5). The previously described model is used in order to determine the second transverse mode bestfrequencies, introducing the coefficients λ2 ¼ 7:8532, α2 ¼ 0, β2 ¼ 0, γ2 ¼ $0:9374 and δ2 ¼ 0:0261 through Eq. (22). Thestarting and ending widths of the tonotopic zone are determined in order to obtain a best frequency range between 0.4 kHzand 5 kHz when immersed in water. This frequency bandwidth is included in the human hearing range. The range is limitedin order to reduce the response of the second or higher order transverse flexural modes. The procedure exposed in Fig. 5gives a width of 0.04 m at the narrow start of the plate and a width of 0.06 m at the wide end.
Since the plate is excited on the median segment (see Section 3.3.3), the first mode is mainly excited. Thus, thedimensions are extended to fit with the bandwidth [0.4–5 kHz]. The length of the tonotopic zone is designed to be greaterthan the longest wavelength. The tonotopic zone parameters are summarized in Table 1.
3.2. Using an acoustic black hole as an anechoic termination
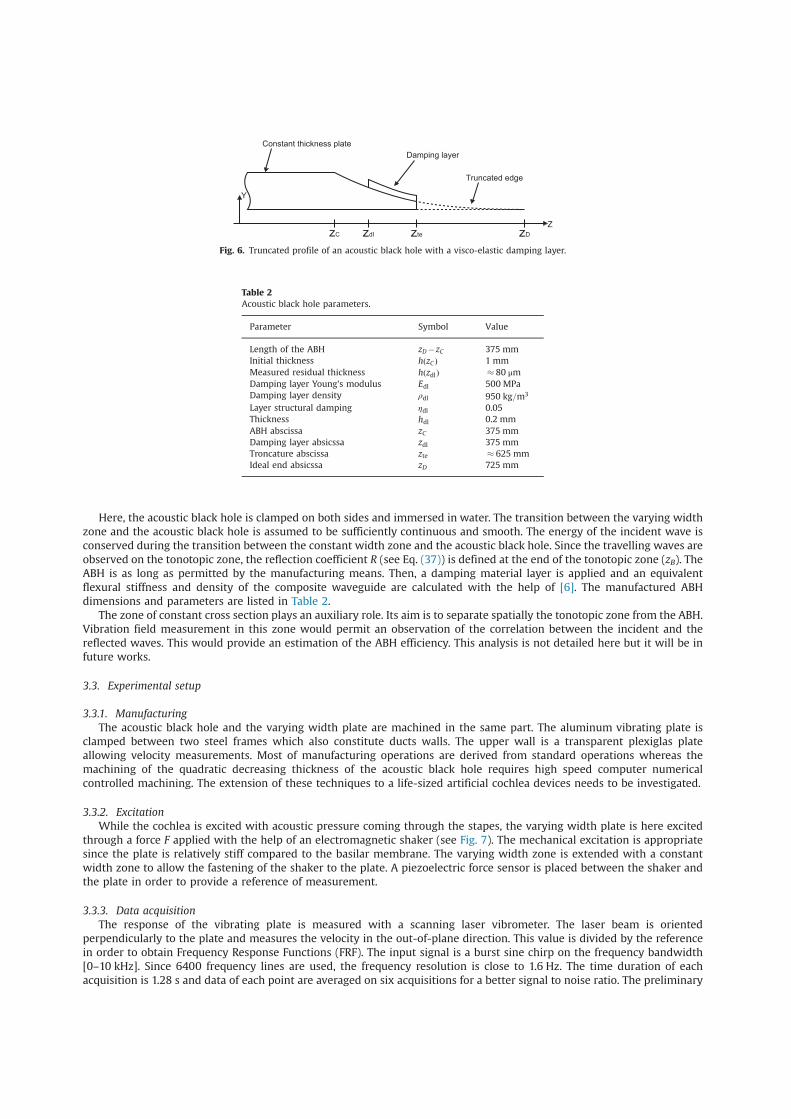
The Acoustic Black Hole is an efficient damper for thin structures [6,12]. It is here applied to reduce the amplitude of thewaves reflected at the end of an immersed plate. The ABH consists of a quadratic profile of decreasing thickness:
hðzÞ ¼ αðzD$zÞ2 (38)
where α¼ hðzCÞ=ðzD$zCÞ is the ratio of the initial thickness at the abscissa zC to the total length of the ABH. While thecoordinate z tends to the theoretical abscissa zD of the ABH's end, the thickness of the plate tends to zero. At the same time,the flexural wavenumber increases and tends theoretically to 1. The group speed defined by ∂ω=∂k tends to 0. This meansthat the propagation of the wave is stopped and it never reaches the end of the black hole. Consequently, no wave isreflected. Practically, the edge is truncated and the ratio between the reflected and the incident waves is strictly positive.A visco-elastic material layer (see Fig. 6) is attached to the plate in order to keep this ratio as low as possible. The visco-elastic material layer aims to increase the negative imaginary part of the wavenumber in order to amplify the attenuationrate of the wave.
Fig. 5. Procedure for determining the dimensions of the varying width plate. The best frequency is plotted as a function of width for the first and the
second transverse mode of a cross section immersed in water. From the lower desired best frequency Fmin at ⓐ, the corresponding width bmax is obtained
at ⓑ. Then, the best frequency Fmax of the second transverse mode is determined at ⓒ. Finally, the width bmin of the section corresponding to the first
mode best frequency Fmax is obtained at ⓓ.
Table 1
Tonotopic zone (TZ) parameters.
Parameter Symbol Value
Length of the TZ zB$zA 375 mm
Thickness h0 1 mm
Width of the narrow end bmin 22 mm
Width of the wide end bmax 60 mm
Young's modulus E 72 000 MPa
Density ρp 2800 kg=m3
Structural damping ηs 0.005
Here, the acoustic black hole is clamped on both sides and immersed in water. The transition between the varying widthzone and the acoustic black hole is assumed to be sufficiently continuous and smooth. The energy of the incident wave isconserved during the transition between the constant width zone and the acoustic black hole. Since the travelling waves areobserved on the tonotopic zone, the reflection coefficient R (see Eq. (37)) is defined at the end of the tonotopic zone (zB). TheABH is as long as permitted by the manufacturing means. Then, a damping material layer is applied and an equivalentflexural stiffness and density of the composite waveguide are calculated with the help of [6]. The manufactured ABHdimensions and parameters are listed in Table 2.
The zone of constant cross section plays an auxiliary role. Its aim is to separate spatially the tonotopic zone from the ABH.Vibration field measurement in this zone would permit an observation of the correlation between the incident and thereflected waves. This would provide an estimation of the ABH efficiency. This analysis is not detailed here but it will be infuture works.
3.3. Experimental setup
3.3.1. Manufacturing
The acoustic black hole and the varying width plate are machined in the same part. The aluminum vibrating plate isclamped between two steel frames which also constitute ducts walls. The upper wall is a transparent plexiglas plateallowing velocity measurements. Most of manufacturing operations are derived from standard operations whereas themachining of the quadratic decreasing thickness of the acoustic black hole requires high speed computer numericalcontrolled machining. The extension of these techniques to a life-sized artificial cochlea devices needs to be investigated.
3.3.2. Excitation
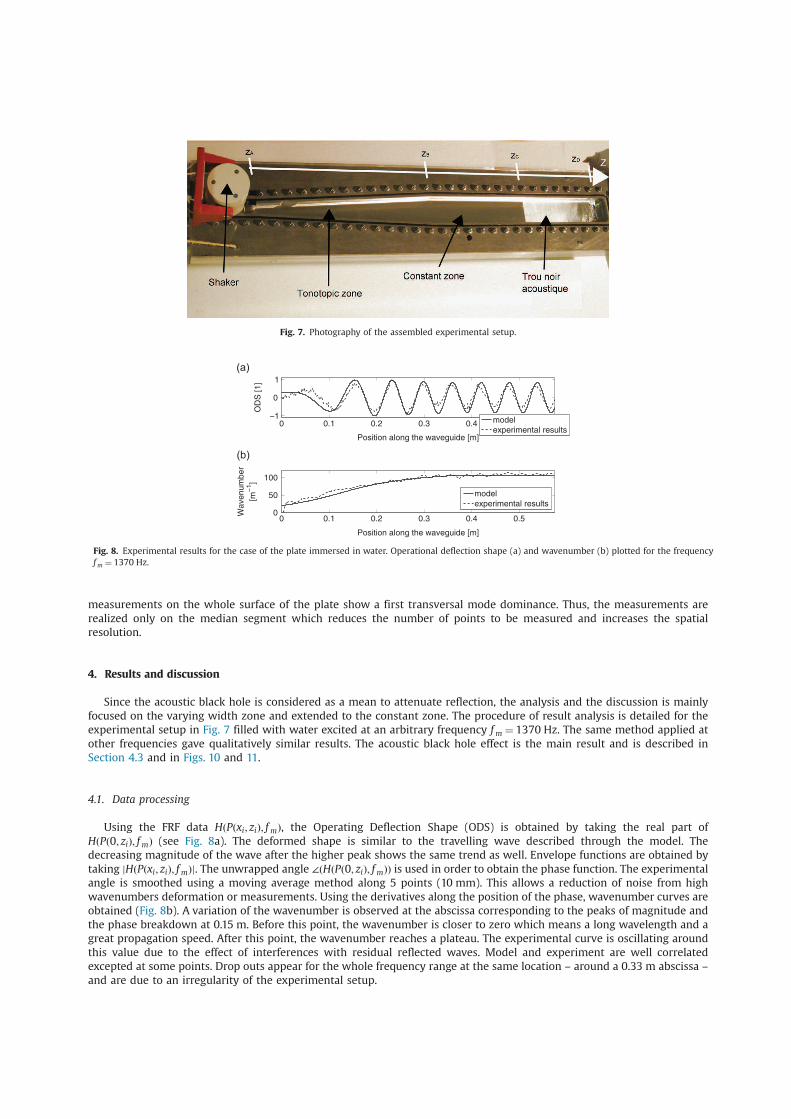
While the cochlea is excited with acoustic pressure coming through the stapes, the varying width plate is here excitedthrough a force F applied with the help of an electromagnetic shaker (see Fig. 7). The mechanical excitation is appropriatesince the plate is relatively stiff compared to the basilar membrane. The varying width zone is extended with a constantwidth zone to allow the fastening of the shaker to the plate. A piezoelectric force sensor is placed between the shaker andthe plate in order to provide a reference of measurement.
3.3.3. Data acquisition
The response of the vibrating plate is measured with a scanning laser vibrometer. The laser beam is orientedperpendicularly to the plate and measures the velocity in the out-of-plane direction. This value is divided by the referencein order to obtain Frequency Response Functions (FRF). The input signal is a burst sine chirp on the frequency bandwidth[0–10 kHz]. Since 6400 frequency lines are used, the frequency resolution is close to 1.6 Hz. The time duration of eachacquisition is 1.28 s and data of each point are averaged on six acquisitions for a better signal to noise ratio. The preliminary
Fig. 6. Truncated profile of an acoustic black hole with a visco-elastic damping layer.
Table 2
Acoustic black hole parameters.
Parameter Symbol Value
Length of the ABH zD$zC 375 mm
Initial thickness hðzC Þ 1 mm
Measured residual thickness hðzdlÞ - 80 μm
Damping layer Young's modulus Edl 500 MPa
Damping layer density ρdl 950 kg=m3
Layer structural damping ηdl 0.05
Thickness hdl 0.2 mm
ABH abscissa zC 375 mm
Damping layer absicssa zdl 375 mm
Troncature abscissa zte - 625 mm
Ideal end absicssa zD 725 mm
measurements on the whole surface of the plate show a first transversal mode dominance. Thus, the measurements arerealized only on the median segment which reduces the number of points to be measured and increases the spatialresolution.
4. Results and discussion
Since the acoustic black hole is considered as a mean to attenuate reflection, the analysis and the discussion is mainlyfocused on the varying width zone and extended to the constant zone. The procedure of result analysis is detailed for theexperimental setup in Fig. 7 filled with water excited at an arbitrary frequency fm ¼ 1370 Hz. The same method applied atother frequencies gave qualitatively similar results. The acoustic black hole effect is the main result and is described inSection 4.3 and in Figs. 10 and 11.
4.1. Data processing
Using the FRF data HðPðxi; ziÞ; fmÞ, the Operating Deflection Shape (ODS) is obtained by taking the real part ofHðPð0; ziÞ; fmÞ (see Fig. 8a). The deformed shape is similar to the travelling wave described through the model. Thedecreasing magnitude of the wave after the higher peak shows the same trend as well. Envelope functions are obtained bytaking jHðPðxi; ziÞ; fmÞj. The unwrapped angle ∠ðHðPð0; ziÞ; fmÞÞ is used in order to obtain the phase function. The experimentalangle is smoothed using a moving average method along 5 points (10 mm). This allows a reduction of noise from highwavenumbers deformation or measurements. Using the derivatives along the position of the phase, wavenumber curves areobtained (Fig. 8b). A variation of the wavenumber is observed at the abscissa corresponding to the peaks of magnitude andthe phase breakdown at 0.15 m. Before this point, the wavenumber is closer to zero which means a long wavelength and agreat propagation speed. After this point, the wavenumber reaches a plateau. The experimental curve is oscillating aroundthis value due to the effect of interferences with residual reflected waves. Model and experiment are well correlatedexcepted at some points. Drop outs appear for the whole frequency range at the same location – around a 0.33 m abscissa –
and are due to an irregularity of the experimental setup.
Fig. 8. Experimental results for the case of the plate immersed in water. Operational deflection shape (a) and wavenumber (b) plotted for the frequency
fm ¼ 1370 Hz.
Fig. 7. Photography of the assembled experimental setup.

4.2. Tonotopy
Since the objective of the experimental setup is to show a tonotopy on the varying width plate, data are used to plottonotopic curves. For some frequencies, the position of the point of maximum vibration is plotted and compared to thetonotopic curve from the ideal model response (see Fig. 3), taking the location of the maximum response point for eachfrequency. Model and experimental results are compared in Fig. 9. Due to the frame vibrations some outliers are rejected.
4.3. Acoustic black hole effect
In order to observe the acoustic black hole effect, data are used to plot tonotopic maps. For each frequency, the envelopefunction is normalized and plotted on a color map. The blue color corresponds to no-vibration zones and the red color to thezones of maximum vibration.
Experimental results with acoustic black hole match well with theory (see Fig. 10a). Maximum responses for eachfrequency are located around the dashed lines representing the modelled ideal localization with no reflection extracted from Fig. 3.
Fig. 9. Comparison of the tonotopic curves plotted from the model and the experimental results for the case in water and in the air.
Fig. 10. Tonotopic maps obtained experimentally for the plate in the air, with (a) or without (b) an acoustic black hole. (For interpretation of the references
to color in this figure caption, the reader is referred to the web version of this paper.)
The same experiments are realized on the device without the ABH for the same configuration (see Fig. 10b). The decreasingthickness zone with a viscoelastic layer is replaced in practice by a constant thickness zone without any viscoelastic layer.Interferences between incident and reflected waves are clearly visible in Fig. 10b while no interference appears in Fig. 10athanks to the acoustic black hole effect. The ABH significantly attenuates reflected waves on the whole frequency bandwidth.The relation between frequency and place of maximum vibration is made bijective thanks to the ABH effect. The ABH is hereexperimented in a new configuration compared to the previous works [6,7]. Lateral boundaries are clamped and the flexuralplate constitutes a waveguide. It is shown here that the transverse problem does not affect the ABH efficiency.
However, some imperfections appear. The acoustic black hole reflection coefficient does not perfectly cancelled and someinterferences are attenuated but still visible. The clamping system of the waveguide is not perfect and some irregularitiesprovide the drop outs observed at the abscissa above 0.3 m in Fig. 10a.
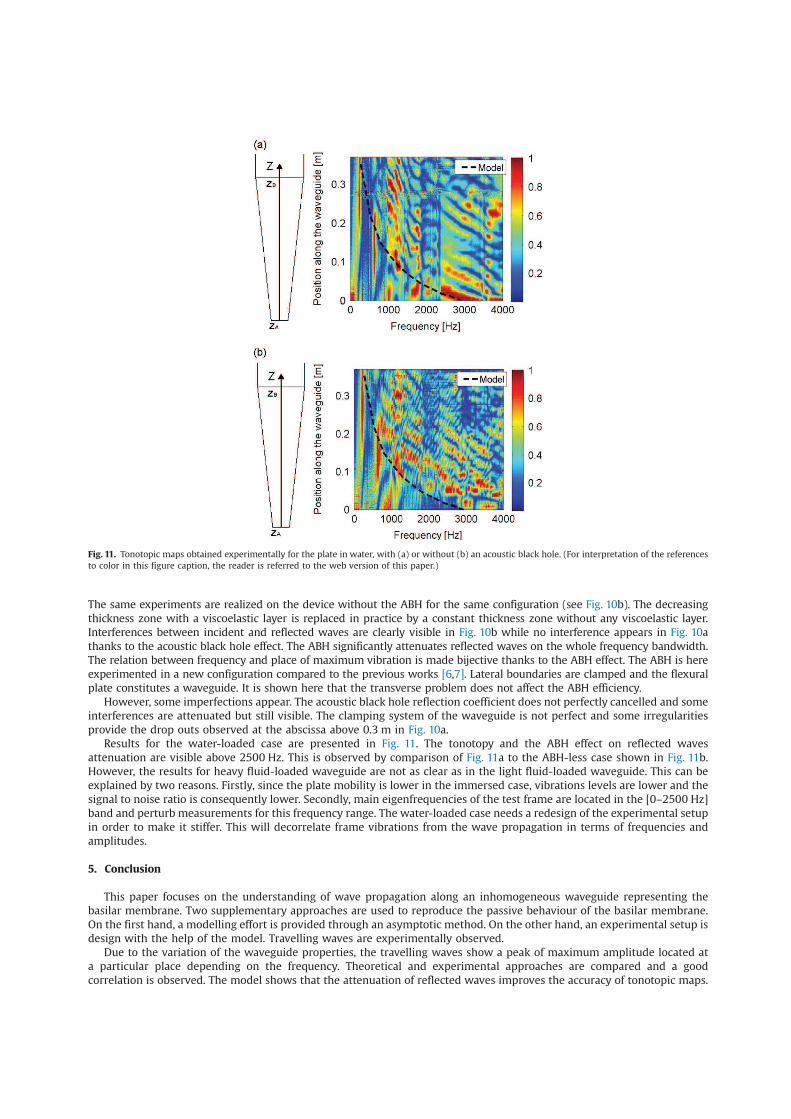
Results for the water-loaded case are presented in Fig. 11. The tonotopy and the ABH effect on reflected wavesattenuation are visible above 2500 Hz. This is observed by comparison of Fig. 11a to the ABH-less case shown in Fig. 11b.However, the results for heavy fluid-loaded waveguide are not as clear as in the light fluid-loaded waveguide. This can beexplained by two reasons. Firstly, since the plate mobility is lower in the immersed case, vibrations levels are lower and thesignal to noise ratio is consequently lower. Secondly, main eigenfrequencies of the test frame are located in the [0–2500 Hz]band and perturb measurements for this frequency range. The water-loaded case needs a redesign of the experimental setupin order to make it stiffer. This will decorrelate frame vibrations from the wave propagation in terms of frequencies andamplitudes.
5. Conclusion
This paper focuses on the understanding of wave propagation along an inhomogeneous waveguide representing thebasilar membrane. Two supplementary approaches are used to reproduce the passive behaviour of the basilar membrane.On the first hand, a modelling effort is provided through an asymptotic method. On the other hand, an experimental setup isdesign with the help of the model. Travelling waves are experimentally observed.
Due to the variation of the waveguide properties, the travelling waves show a peak of maximum amplitude located ata particular place depending on the frequency. Theoretical and experimental approaches are compared and a goodcorrelation is observed. The model shows that the attenuation of reflected waves improves the accuracy of tonotopic maps.
Fig. 11. Tonotopic maps obtained experimentally for the plate in water, with (a) or without (b) an acoustic black hole. (For interpretation of the references
to color in this figure caption, the reader is referred to the web version of this paper.)

Comparative experiments show coherently that an acoustic black hole used as an anechoic end improves the quality ofmeasurements. Results for the immersed setup might be improved with a redesign of the experimental setup.
This paper uses the acoustic black hole effect only as a way to attenuate wave reflection. Future works will be focused onthe analysis of the acoustic black hole. It is used here in an unusual manner with clamped transverse boundary conditionsand a normal heavy fluid loading. The comparison of the ABH effects in this experimental setup to classical results couldprovide interesting results. The modelling approach with the WKB method also presents a great interest for the ABHrepresentation. Wave propagation in the Acoustic Black Hole is not fully understood and the WKB method offers aparticularly adapted frame for wave propagation study.
References
[1] H. Shintaku, T. Nakagawa, D. Kitagawa, H. Tanujaya, S. Kawano, J. Ito, Development of piezoelectric acoustic sensor with frequency selectivity forartificial cochlea, Sensors and Actuators A: Physical 158 (2010) 183–192.
[2] R. White, K. Grosh, Microengineered hydromechanical cochlear model, Proceedings of the National Academy of Sciences of the United States of America102 (2005) 1296.
[3] G. Zhou, L. Bintz, D.Z. Anderson, K.E. Bright, A life-sized physical model of the human cochlea with optical holographic readout, The Journal of theAcoustical Society of America 93 (1993) 1516–1523.
[4] E. De Boer, R. MacKay, Reflections on reflections, The Journal of the Acoustical Society of America 67 (1980) 882.[5] R. White, Biomimetic Trapped Fluid Microsystems for Acoustic Sensing, PhD Thesis, The University of Michigan, 2005.[6] V. Georgiev, J. Cuenca, F. Gautier, L. Simon, V. Krylov, Damping of structural vibrations in beams and elliptical plates using the acoustic black hole
effect, Journal of Sound and Vibration 330 (2011) 2497–2508.[7] F. Gautier, J. Cuenca, V. Krylov, L. Simon, Experimental investigation of the acoustic black hole effect for vibration damping in elliptical plates,
Acoustical Society of America Journal 123 (2008) 3318.[8] J. Bayod, Experimental study of vibration damping in a modified elastic wedge of power-law profile, Journal of Vibration and Acoustics 133 (2011)
061003.[9] C. Steele, L. Taber, Comparison of wkb calculations and experimental results for three-dimensional cochlear models, The Journal of the Acoustical
Society of America 65 (1979) 1007.[10] M. Holmes, J. Cole, Cochlear mechanics: analysis for a pure tone, The Journal of the Acoustical Society of America 76 (1984) 767.[11] G. Whitham, Linear and Nonlinear Waves, vol. 226, Wiley, New York, 1974.[12] J. Cuenca, Wave Models for the Flexural Vibrations of Thin Plates, PhD Thesis, Université du Maine, Le Mans, France, 2009.