ars.els-cdn.com · web viewbeer brought to sweden by traveling and smuggling is assumed to be...
TRANSCRIPT

COMPLEMENTARY MATERIALS
Climate impact of alcohol consumption in Sweden
Hallström,E.a*, Håkansson, N.b, Åkesson, A.b, Wolk, A.b, Sonesson, U.a
a Research Institute of Sweden (RISE), Dept. of Agrifood and Bioscience, P.O. Box 5401
SE40229 Göteborg, Sweden, www.ri.se
b Institute of Environmental Medicine, Karolinska Institute, P.O. Box 210, SE171 77
Stockholm, Sweden
*Corresponding author ([email protected]; +46 105166641)
1

METHODOLOGY
CM 1. Consumption of alcoholic beverages in Sweden
In Sweden 62%, 85% and 45% of the consumption of class III beer (>3.5%), wine and liquor,
respectively, is bought from the Swedish Alcohol Monopoly (Ramstedt et al., 2013). Class III
beer that is not bought from Swedish Alcohol Monopoly is either bought in restaurants (50%),
brought to Sweden via personal traveling or smuggling (44%) or made at home (6%)
(Trolledal, 2016). Class III beer bought on the internet represents 0.5% of the total quantity of
beer not bought from the Swedish Alcohol Monopoly and is not included in this analysis.
Class I and II beer (˂3.5%) is to 99% purchased in retail and a minor share is bought in
restaurants (Swedish Brewery Association, 2013). Wine not bought from the Swedish Alcohol
Monopoly is bought either in restaurants (49%), brought to Sweden via personal traveling or
smuggling (33%), made at home (9%) or bought on the internet (9%) (Trolledal, 2016).
Liquor not bought from the Swedish Alcohol Monopoly is bought either in restaurants (15%),
brought to Sweden via personal traveling or smuggling (81%), made at home (2%) or bought
on the internet (2%) (Trolledal, 2016).
2

CM 2. Climate impact of agricultural production
Greenhouse gas emissions from the agricultural phase of alcoholic beverages are based on
data from the literature review.
CM 2.1 Beer
For beer (class I, II and III), the average climate impact used in our calculations is based on
11 individual estimates (Table CM 1) from five original studies. The origin of agricultural
production varies, five data are based on production in Europe and six data are based on
production in North America.
Table CM 1. Emissions of GHGs in the agriculture phase for 1 litre of beer
Kg CO2e/litre Region Source
0.17 Italy (Cimini and Moresi, 2016)
0.20 UK (Amienyo and Azapagic, 2016)
0.11 UK (Williams and Mekonen, 2014)
0.37 US (Lalonde et al., 2013)
0.51 US (Lalonde et al., 2013)
0.31 US (Lalonde et al., 2013)
0.20 US (Lalonde et al., 2013)
0.23 US (Lalonde et al., 2013)
0.30 North America (BIER, 2012)
0.16 Europe (BIER, 2012)
AVERAGE (n=10) 0.26
MEDIAN (n=10) 0.23
RANGE (n=10) 0.11-0.51
3

CM 2.2 Wine
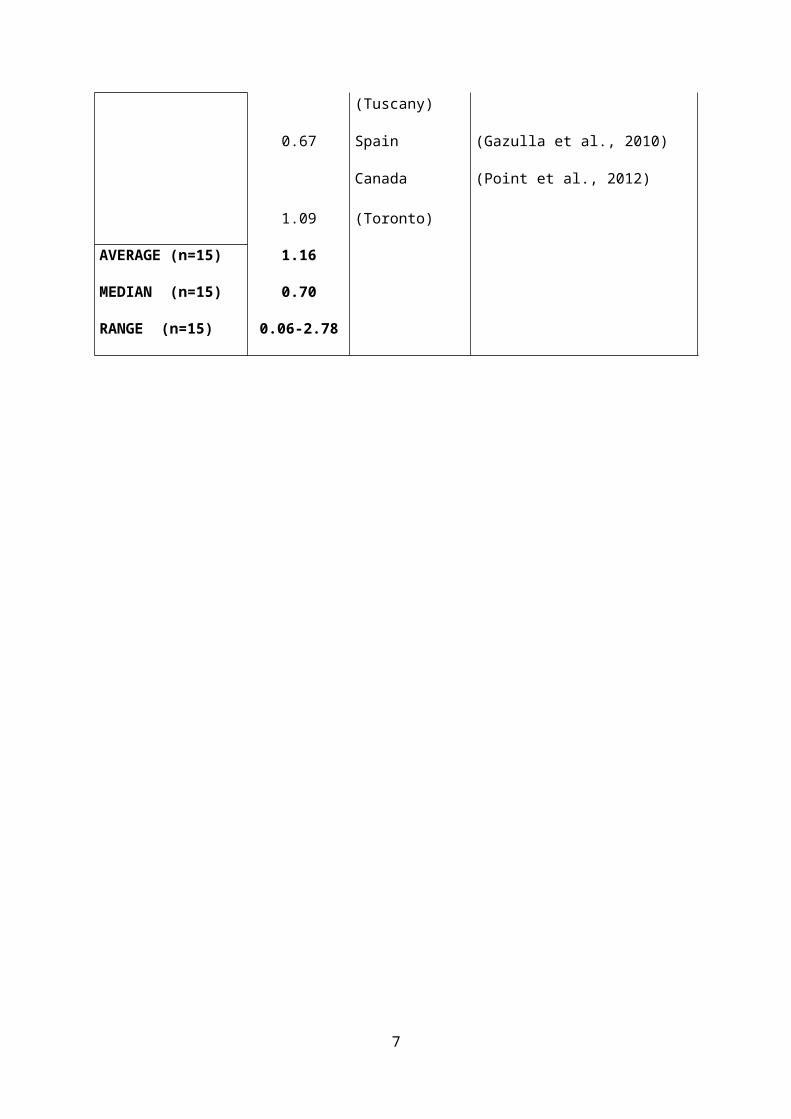
For wine and strong wine the average climate impact used in our calculations is based on 15
individual estimates (Table CM 2) from 8 original studies. The origin of agricultural
production is mainly south Europe, except for one study in which the production is based in
Canada.
Table CM 2. Emissions of GHGs in the agriculture phase for 1 litre of wine
Kg CO2e/litre Region Source
0.23 Italy (Sardinia) (Fusi et al., 2014)
0.26 Italy (Sardinia) (Fusi et al., 2014)
2.67 Portugal (Neto et al., 2013)
0.94 Italy (Sardinia) (Benedetto, 2013)
0.06 Italy (Pattara et al., 2012)
2.41 Spain (Galicia) (Vázquez-Rowe et al., 2012)
2.78 Spain (Galicia) (Vázquez-Rowe et al., 2012)
2.76 Spain (Galicia) (Vázquez-Rowe et al., 2012)
2.34 Spain (Galicia) (Vázquez-Rowe et al., 2012)
0.44 Italy (Tuscany) (Boscro et al., 2011)
0.29 Italy (Tuscany) (Boscro et al., 2011)
0.25 Italy (Tuscany) (Boscro et al., 2011)
0.16 Italy (Tuscany) (Boscro et al., 2011)
0.67 Spain (Gazulla et al., 2010)
1.09 Canada (Toronto) (Point et al., 2012)
AVERAGE (n=15) 1.16
4

MEDIAN (n=15) 0.70
RANGE (n=15) 0.06-2.78
5

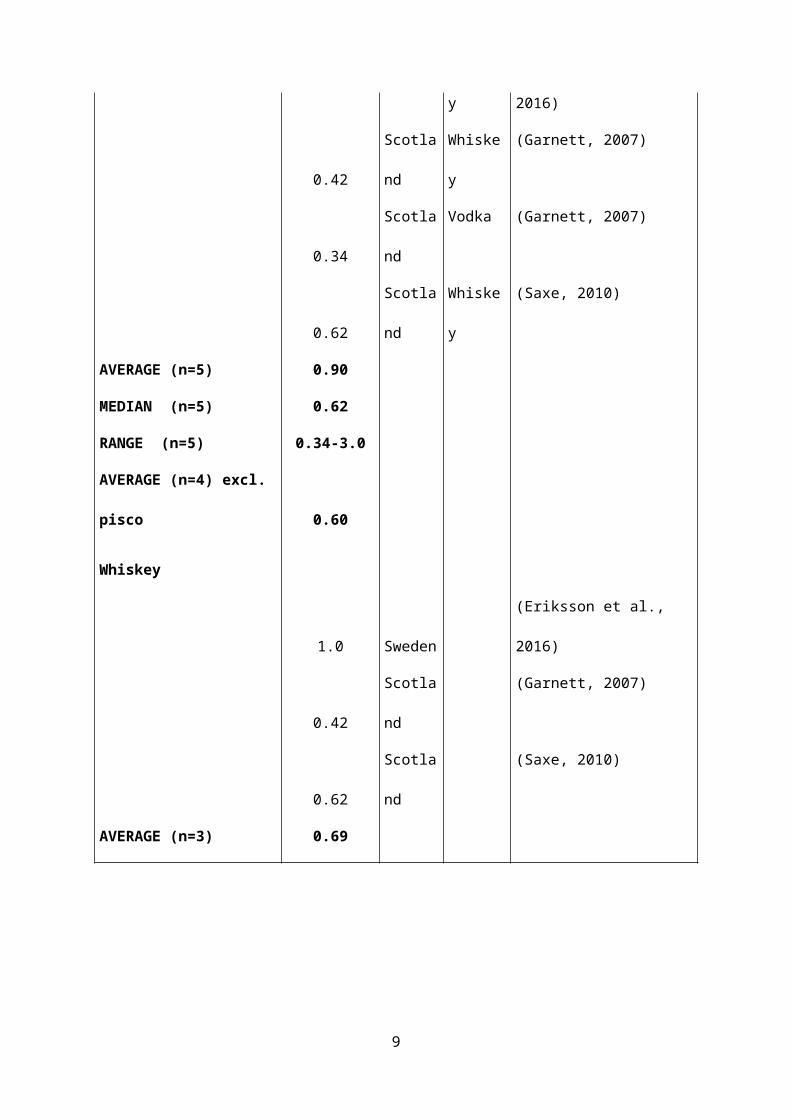
CM 2.3 Liquor
For liquor the average climate impact used in our calculations is based on 5 individual
estimates () from 4 original studies. The origin of agricultural production is Scotland, Sweden
and Peru.
In our calculations a distinction is made between types of liquor. For whiskey the average of
0.69 kg CO2e/L is used, for liquor with origin from Latin America the average of 0.90 kg
CO2e/L is used, and for all other types of liquor the average of 0.60 kg CO2e/L is used.
Table CM 3. Emissions of GHGs in the agriculture phase for 1 litre of liquor
Kg CO2e/litre Region
Alcoholic
beverage
Source
Liquor
3.0 Peru Pisco (Vázquez-Rowe et al., 2017)
1.0 Sweden Whiskey (Eriksson et al., 2016)
0.42 Scotland Whiskey (Garnett, 2007)
0.34 Scotland Vodka (Garnett, 2007)
0.62 Scotland Whiskey (Saxe, 2010)
AVERAGE (n=5) 0.90
MEDIAN (n=5) 0.62
RANGE (n=5) 0.34-3.0
AVERAGE (n=4) excl. pisco 0.60
Whiskey
1.0 Sweden (Eriksson et al., 2016)
0.42 Scotland (Garnett, 2007)
6
0.62 Scotland (Saxe, 2010)
AVERAGE (n=3) 0.69
7

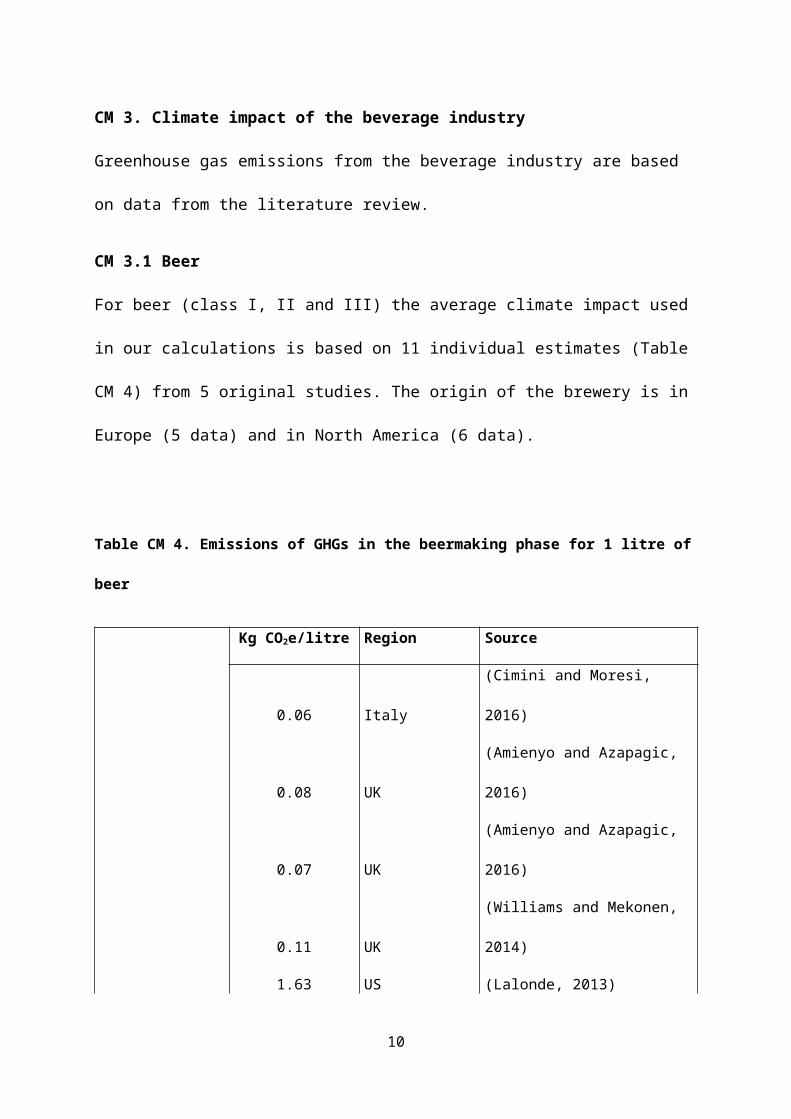
CM 3. Climate impact of the beverage industry
Greenhouse gas emissions from the beverage industry are based on data from the literature
review.
CM 3.1 Beer
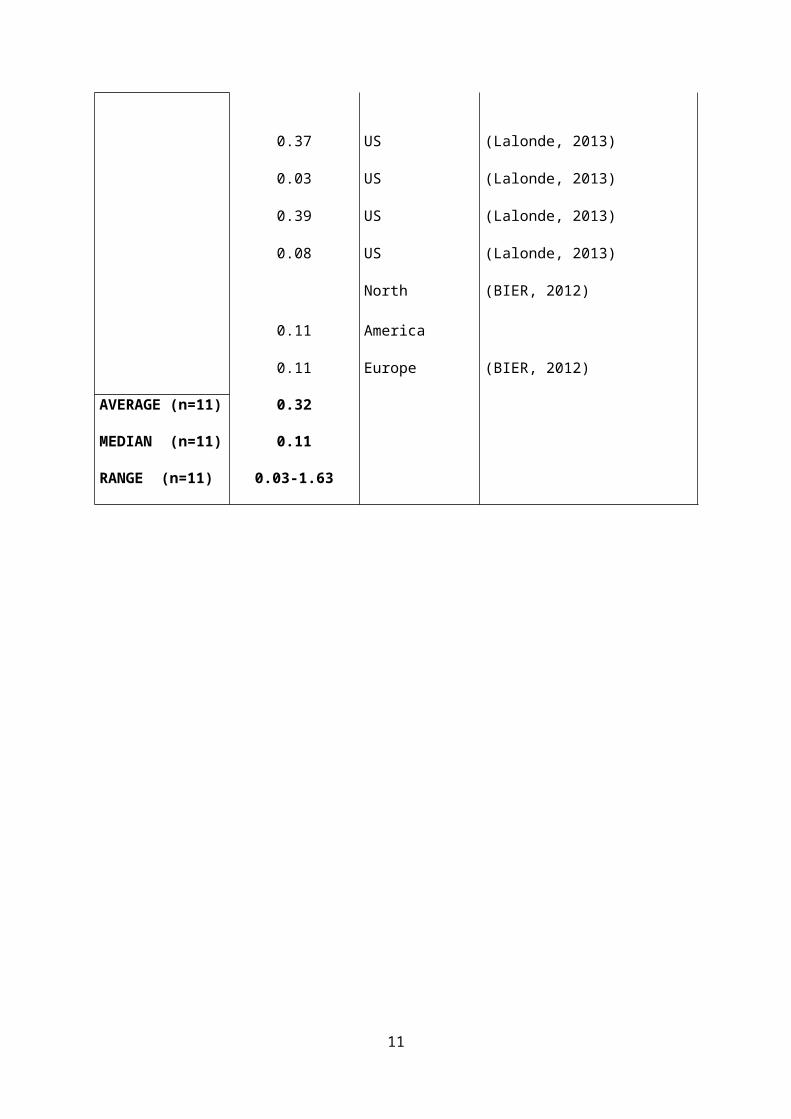
For beer (class I, II and III) the average climate impact used in our calculations is based on 11
individual estimates (Table CM 4) from 5 original studies. The origin of the brewery is in
Europe (5 data) and in North America (6 data).
Table CM 4. Emissions of GHGs in the beermaking phase for 1 litre of beer
Kg CO2e/litre Region Source
0.06 Italy (Cimini and Moresi, 2016)
0.08 UK (Amienyo and Azapagic, 2016)
0.07 UK (Amienyo and Azapagic, 2016)
0.11 UK (Williams and Mekonen, 2014)
1.63 US (Lalonde, 2013)
0.37 US (Lalonde, 2013)
0.03 US (Lalonde, 2013)
0.39 US (Lalonde, 2013)
0.08 US (Lalonde, 2013)
0.11 North America (BIER, 2012)
0.11 Europe (BIER, 2012)
AVERAGE (n=11) 0.32
MEDIAN (n=11) 0.11
RANGE (n=11) 0.03-1.63
8
CM 3.2 Wine
For wine and strong wine the average climate impact used in our calculations is based on 14
individual estimates (Table CM 5) from 8 original studies. The origin of agricultural
production is mainly south Europe, except for one study in which the production is based in
Canada.
Table CM 5. Emissions of GHGs in the winemaking phase for 1 litre of wine
Kg CO2e/litre Region Source
0.38 Italy (Sardina) (Fusi et al., 2014)
0.42 Italy (Sardina) (Fusi et al. 2014)
0.32 Portugal (Neto et al., 2013)
0.004 Italy (Sardinia) (Benedetto, 2013)
0.03 Italy (Pattara et al., 2012)
0.66 Spain (Galicia) (Vázquez-Rowe et al., 2012)
0.60 Spain (Galicia) (Vázquez-Rowe et al., 2012)
0.42 Spain (Galicia) (Vázquez-Rowe et al., 2012)
0.29 Italy (Tuscany) (Bosco et al., 2011)
0.05 Italy (Tuscany) (Bosco et al., 2011)
0.07 Italy (Tuscany) (Bosco et al., 2011)
0.12 Italy (Tuscany) (Bosco et al., 2011)
0.05 Spain (Gazulla et al., 2010)
0.45 Canada (Toronto) (Point et al., 2012)
AVERAGE (n=14) 0.28
MEDIAN (n=14) 0.31
RANGE (n=14) 0.004-0.66
9
CM 3.3 Liquor
For liquor the average climate impact used in our calculations is based on 6 individual
estimates (Table CM 6) from 5 original studies. The origin of agricultural production is
Scotland, Sweden and Peru.
Table CM 6. Emissions of GHGs in the distillery phase of 1 litre of liquor
Kg CO2e/litre Region
Alcoholic
beverage
Source
0.83 Peru Pisco (Vázquez-Rowe et al., 2017)
0.10 Sweden Whiskey (Eriksson et al., 2016)
0.40 - Vodka (Saxe, 2010)
0.41 UK
UK
Whiskey
Whiskey
(Garnett, 2007; Saxe, 2010)
0.18 (Garnett, 2007; Saxe, 2010)
0.91 Scotland Whiskey (Saxe, 2010)
AVERAGE (n=6) 0.47
MEDIAN (n=6) 0.40
RANGE (n=6) 0.10-0.91
10
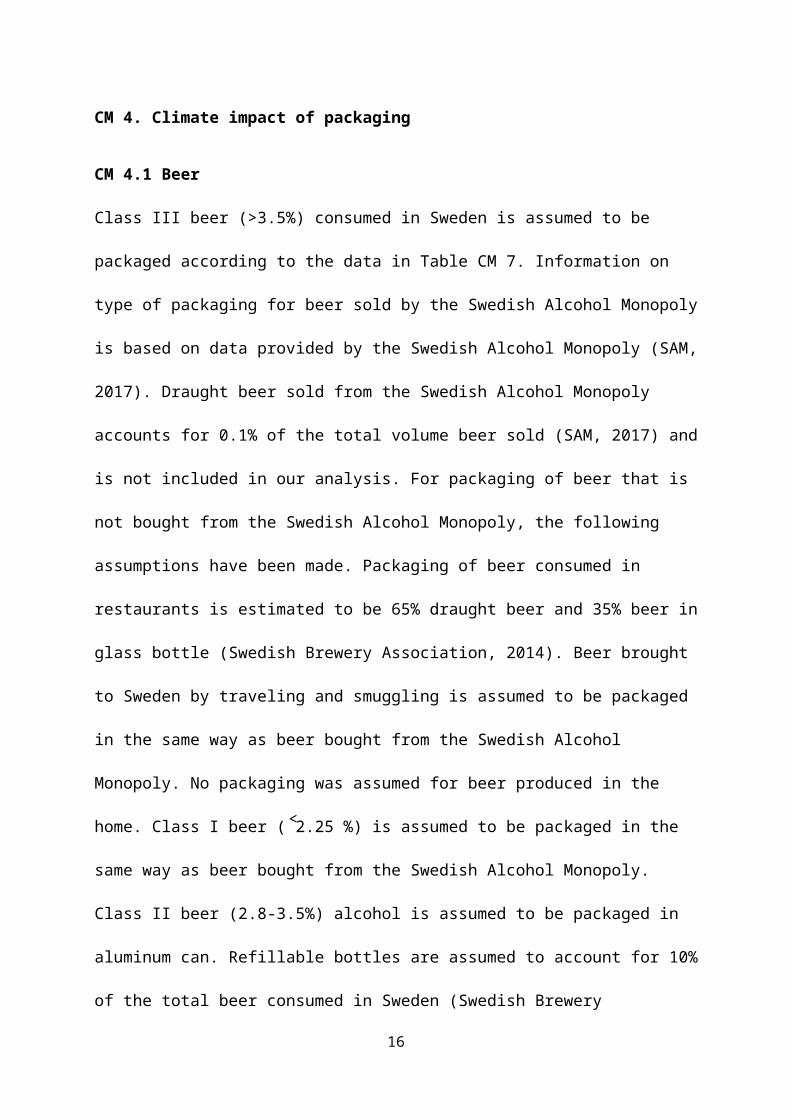
CM 4. Climate impact of packaging
CM 4.1 Beer
Class III beer (>3.5%) consumed in Sweden is assumed to be packaged according to the data
in Table CM 7. Information on type of packaging for beer sold by the Swedish Alcohol
Monopoly is based on data provided by the Swedish Alcohol Monopoly (SAM, 2017).
Draught beer sold from the Swedish Alcohol Monopoly accounts for 0.1% of the total volume
beer sold (SAM, 2017) and is not included in our analysis. For packaging of beer that is not
bought from the Swedish Alcohol Monopoly, the following assumptions have been made.
Packaging of beer consumed in restaurants is estimated to be 65% draught beer and 35% beer
in glass bottle (Swedish Brewery Association, 2014). Beer brought to Sweden by traveling
and smuggling is assumed to be packaged in the same way as beer bought from the Swedish
Alcohol Monopoly. No packaging was assumed for beer produced in the home. Class I beer
(˂2.25 %) is assumed to be packaged in the same way as beer bought from the Swedish
Alcohol Monopoly. Class II beer (2.8-3.5%) alcohol is assumed to be packaged in aluminum
can. Refillable bottles are assumed to account for 10% of the total beer consumed in Sweden
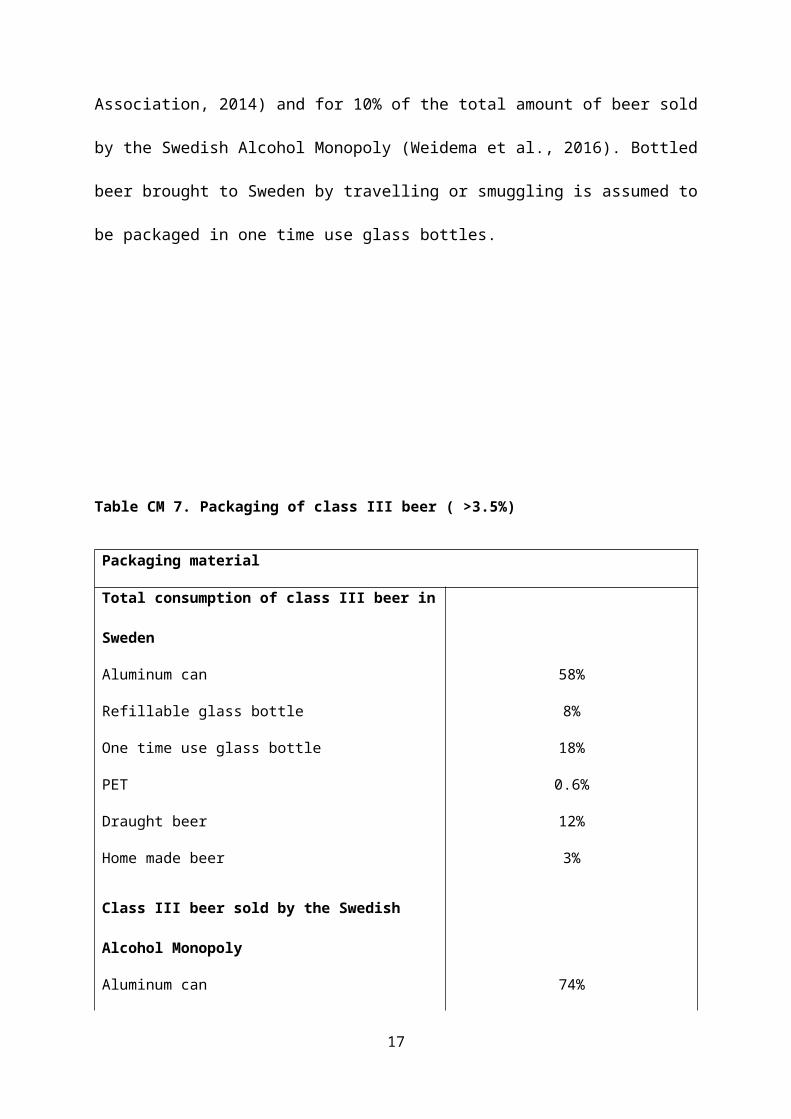
(Swedish Brewery Association, 2014) and for 10% of the total amount of beer sold by the
Swedish Alcohol Monopoly (Weidema et al., 2016). Bottled beer brought to Sweden by
travelling or smuggling is assumed to be packaged in one time use glass bottles.
11
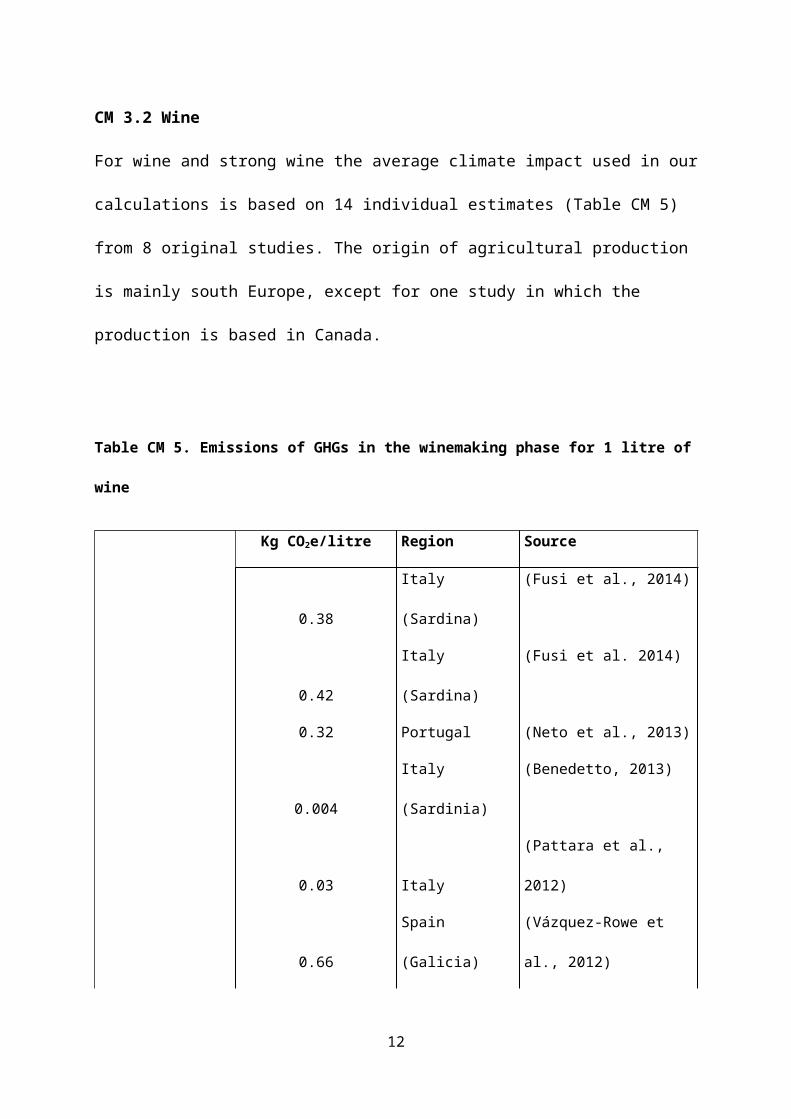
Table CM 7. Packaging of class III beer ( >3.5%)
Packaging material
Total consumption of class III beer in Sweden
Aluminum can 58%
Refillable glass bottle 8%
One time use glass bottle 18%
PET 0.6%
Draught beer 12%
Home made beer 3%
Class III beer sold by the Swedish Alcohol Monopoly
Aluminum can 74%
Refillable glass bottle 10%
One time use glass bottle 15%
PET 1.6%
Data based on (SAM, 2017; Swedish Brewery Association, 2014)
12

CM 4.2 Wine
Wine consumed in Sweden is assumed to be packaged according to the data in (Table CM 8).
Information on type of packaging for wine sold by the Swedish Alcohol Monopoly is based
on data from the Swedish Alcohol Monopoly (SAM, 2017). Wine packaged in PET bottles
and in bags account for less than 1% of the total sales in volume and has therefore been
excluded from the analysis. Wine consumed in restaurants is assumed to be served in glass
bottles. Wine brought to Sweden by traveling and smuggling is assumed to be packaged in the
same way as wine bought from the Swedish Alcohol Monopoly. Wine ordered on the internet
is assumed to be packaged in glass bottles. No packaging has been assumed for wine
produced in the home. Strong wine is assumed to be packaged in glass bottles. Liquor
consumed in Sweden is assumed to be packaged in glass bottles. According to the Swedish
Alcohol Monopoly, 99% of all liquor sold by volume is packaged in glass bottles (SAM,
2011).
Table CM 8. Packaging of wine
Packaging material
Total consumption of wine in Swedena
Bag in Box 50%
Glass bottle 40%
Carton 9%
Home production 1%
Wine sold from Swedish Alcohol Monopolyb
Bag in Box 56%
Glass bottle 35%
Carton 9%
aOwn estimates based on data specified in text above. bBased on (SAM, 2011)
13

CM 4.3 Liquor
Liquor consumed in Sweden is assumed to be packaged in glass bottles. According to the
Swedish Alcohol Monopoly, 99% of all liquor sold by volume is packaged in glass bottles
(SAM, 2011).
14

CM 4.4 Emissions from packaging
Data from an LCA of Nordic packaging systems (SERI, 2013) (Table CM 9) is used to
calculate the emissions of GHGs embodied in packaging of beer. The emissions refer to
distribution of 1 litre of beverage including the packaging to retail or restaurant, and thus
include all emissions generated by the fabrication of the package (e.g. primary, secondary and
tertiary packages), filling, distribution and waste management. System expansion is used to
account for that less new material is required in new packages due to recycling of packaging
materials. For draught beer, emissions are based on data from the literature (Cimini and
Moresi, 2016)
Table CM 9. Emissions of GHGs for packaging of beer
Packaging material Kg CO2e/litre
33cl refillable glass bottle 0.09
50 cl refillable glass bottle 0.11
Used data for average refillable glass bottle 0.10
33 cl one time use glass bottle 0.35
50 cl one time use glass bottle 0.32
Used data for average one time use glass bottle 0.34
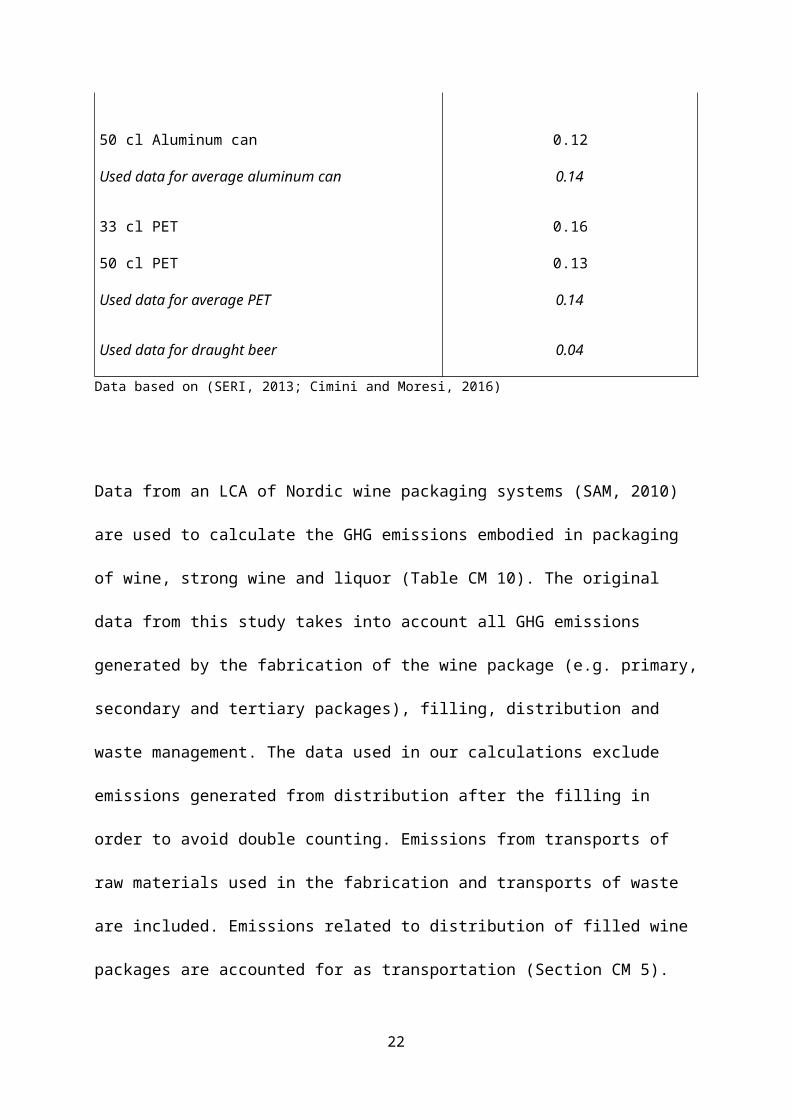
33 cl Aluminum can 0.16
50 cl Aluminum can 0.12
Used data for average aluminum can 0.14
33 cl PET 0.16
50 cl PET 0.13
Used data for average PET 0.14
Used data for draught beer 0.04
15
Data based on (SERI, 2013; Cimini and Moresi, 2016)
Data from an LCA of Nordic wine packaging systems (SAM, 2010) are used to calculate the
GHG emissions embodied in packaging of wine, strong wine and liquor (Table CM 10). The
original data from this study takes into account all GHG emissions generated by the
fabrication of the wine package (e.g. primary, secondary and tertiary packages), filling,
distribution and waste management. The data used in our calculations exclude emissions
generated from distribution after the filling in order to avoid double counting. Emissions from
transports of raw materials used in the fabrication and transports of waste are included.
Emissions related to distribution of filled wine packages are accounted for as transportation
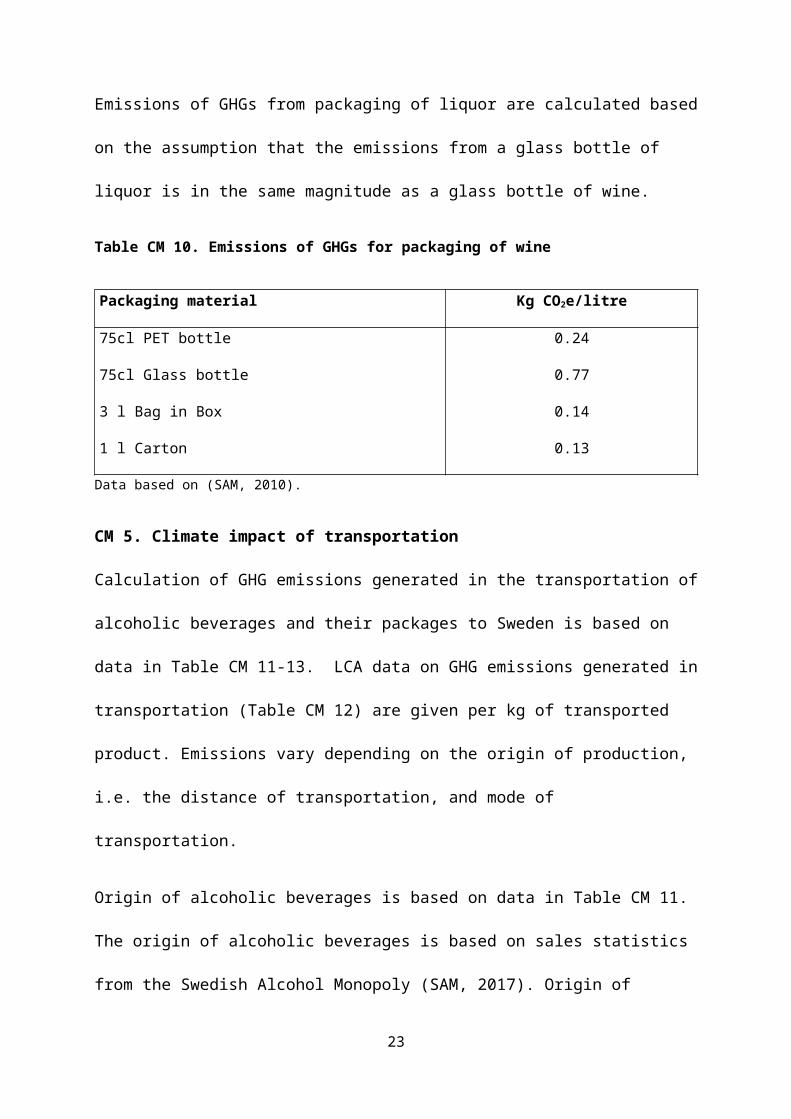
(Section CM 5). Emissions of GHGs from packaging of liquor are calculated based on the
assumption that the emissions from a glass bottle of liquor is in the same magnitude as a glass
bottle of wine.
Table CM 10. Emissions of GHGs for packaging of wine
Packaging material Kg CO2e/litre
75cl PET bottle 0.24
75cl Glass bottle 0.77
3 l Bag in Box 0.14
1 l Carton 0.13
Data based on (SAM, 2010).
CM 5. Climate impact of transportation
Calculation of GHG emissions generated in the transportation of alcoholic beverages and their
packages to Sweden is based on data in Table CM 11-13. LCA data on GHG emissions
16
generated in transportation (Table CM 12) are given per kg of transported product. Emissions
vary depending on the origin of production, i.e. the distance of transportation, and mode of
transportation.
Origin of alcoholic beverages is based on data in Table CM 11. The origin of alcoholic
beverages is based on sales statistics from the Swedish Alcohol Monopoly (SAM, 2017).
Origin of alcohol brought to Sweden by traveling and smuggling and alcohol consumed in
restaurants is assumed to have the same origin as alcohol sold by the Swedish Alcohol
Monopoly.
Emissions of GHGs from transportation of alcoholic beverages to Sweden are shown in Table
CM 12. Alcohol from North Europe is assumed to be transported by semi-trailer. Alcohol
from south and central Europe, Africa, Latin America, Oceania and North America is
assumed to be transported by boat and semi-trailer. Emissions of transportation of alcohol
categorized being of “other origin”, often meaning a mix of origins, are calculated based on
average LCA data of the different origins and modes of transportation excluding air freight.
LCA data on emissions for transportation are combined with data on the weight of alcoholic
beverages and their packages. One litre of alcohol is assumed to correspond to 1 kg and
weight of different packages are based on data in Table CM 13 (Weidema et al., 2016). For
draught beer no transportation emissions are added for packaging. For beer produced in the
home no emissions for transportation are included. Wine ordered on the internet with origin of
South Africa, Latin America, Oceania and North America is assumed to be transported by air.
In total, air transported wine accounts for 0.5% of the total wine consumption. For wine
produced in the home no emissions for transportation are included. No GHG emissions are
added for transportation within Sweden.
17
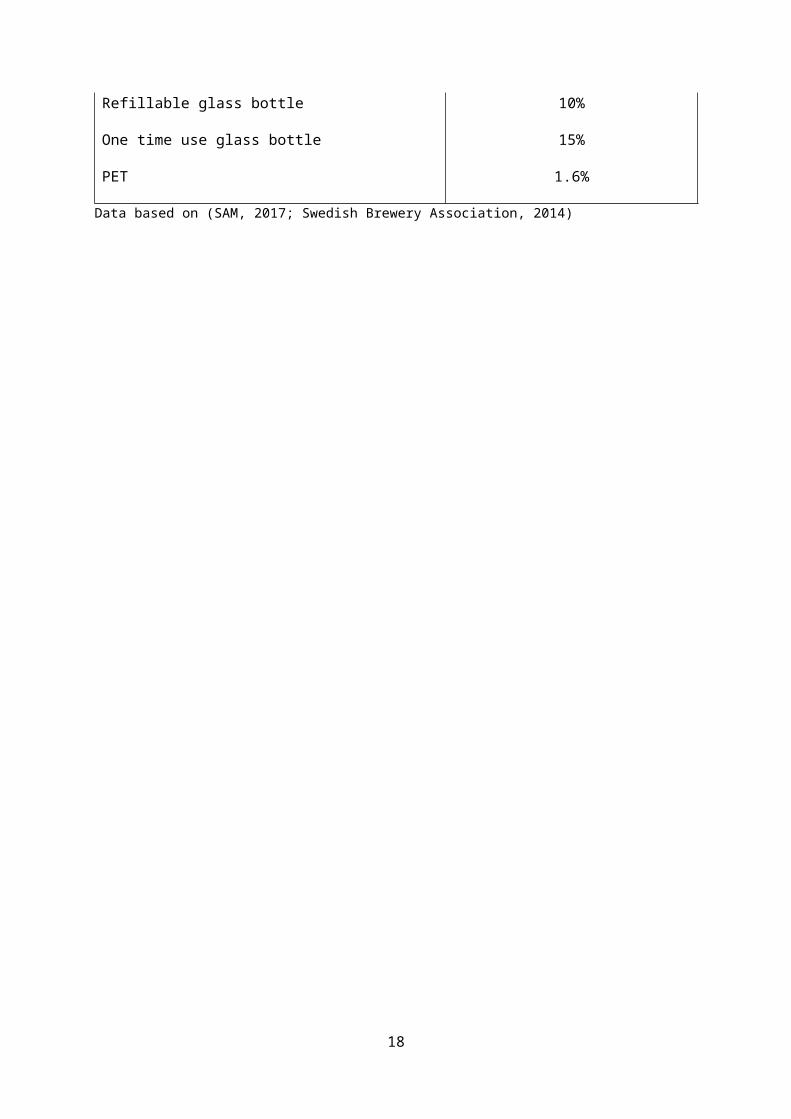
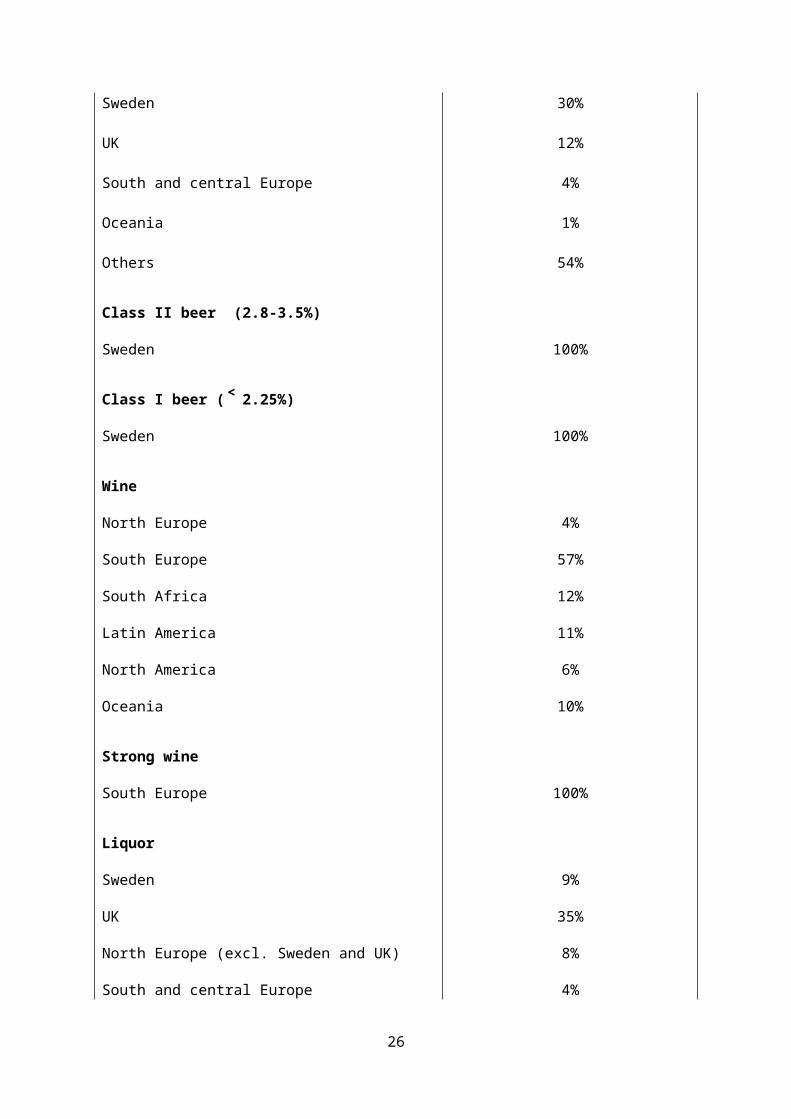
Table CM 11. Origin of alcoholic beverages
Origin Share of origin
Class III beer (>3.5 %) Glass bottle
Sweden 40%
North Europe (excl. Sweden) 6%
South and central Europe 21%
UK 7%
North America 7%
Latin America 4%
Asia 1%
Others 15%
Class III beer (>3.5 %) Aluminum can
Sweden
North Europe (excl. Sweden)
South and central Europe
North America
Others
84%
3%
4%
1%
8%
Class III beer (>3.5 %) PET
Sweden
UK
South and central Europe
Oceania
Others
30%
12%
4%
1%
54%
Class II beer (2.8-3.5%)
Sweden 100%
18
Class I beer (˂ 2.25%)
Sweden 100%Wine
North Europe 4%
South Europe 57%
South Africa 12%
Latin America 11%
North America 6%
Oceania 10%
Strong wine
South Europe 100%
Liquor
Sweden 9%
UK 35%
North Europe (excl. Sweden and UK) 8%
South and central Europe 4%
North America 9%
Latin America 3%
Asia 0.4%
Others 30%
Data based on (SAM, 2017).
Table CM 12. Emissions of GHGs for transportation of alcoholic beverages to Sweden
19

Origin Mode of transportation Kg CO2e/kg product
North Europe Semi trailer (lorry ˃32 metric ton EURO4) 0.12
South and central Europe Boat (transoceanic ship)
Semi trailer (lorry ˃32 metric ton EURO4)0.10
Central Africa Boat (transoceanic ship)
Semi trailer (lorry ˃32 metric ton EURO4)0.15
Latin America Boat (transoceanic ship)
Semi trailer (lorry ˃32 metric ton EURO4)0.20
Oceania Boat (transoceanic ship)
Semi trailer (lorry ˃32 metric ton EURO4)0.30
Asia Boat (transoceanic ship)
Semi trailer (lorry ˃32 metric ton EURO4)0.27
North America
Boat (transoceanic ship)
Semi trailer (lorry ˃32 metric ton EURO4)0.14
Latin America Air freight 13.7
Asia Air freight 20
Own estimates based on data from Ecoinvent.
Table CM 13. Weight of packaging in grams per litre of different alcoholic beverages
Primary
packaging
Secondary
packaging
Tertiary
packaging
Closure and
labels
Total Weight
(g/L)
20

Aluminum can 39 6 4 49
Bag in Box 59 5 4 68
Wine glass
bottle 658 45 7 10.2 718
Beer glass
bottle 680 28 7 2 717
Glass bottle
liquor 746 45 7 6.5 805
PET, wine and
liquor 100 17 4 5 126
PET, beer 100 17 4 4.6 126
Carton 38 19 5 62
Data based on (Weidema et al., 2016)
21
DISCUSSION
CM.6 Uncertainty analysis
Emissions of GHGs generated in the agricultural production and beverage industry are based
on average data from the literature review. To analyze how sensitive the results are to changes
in these underlying data we performed a sensitivity analysis by analyzing the GHG emissions
per litre alcoholic beverage based on the median, minimum and maximum values reported for
agricultural production and beverage industry based on the results from the literature review
(Table CM 14).
Table CM 14. Climate impact of alcoholic beverages (kg CO2e/litre) based on median, min and
max values for GHG emissions from agricultural production and beverage industry
Average value
(used data)
Median value Min value Max value
Class III Beer 0.81 0.55 0.36 2.38
Wine 2.16 1.70 0.78 4.17
Liquor 2.07 1.98 1.40 4.89
22
References
Amienyo, D., Azapagic, A., 2016. Life cycle environmental impacts and costs of beer
production and consumption in the UK. Int. J. LCA 21, 492-509.
Benedetto, G., 2013. The environmental impact of a Sardinian wine by partial life cycle
assessment. Wine Econ. Policy 2, 33-41.
BIER, 2012. Research on the Carbon Footprint of Beer. Beverage Industry Environmental
Roundtable (BIER):
http://media.wix.com/ugd/49d7a0_70726e8dc94c456caf8a10771fc31625.pdf
Bosco, S., Di Bene, C., Galli, M., Remorini, D., Massai, R., Bonari, E., 2011. Greenhouse gas
emissions in the agricultural phase of wine production in the Maremma rural district in
Tuscany, Italy. Italian J. Agron. 6, 15.
Cimini, A., Moresi, M., 2016. Carbon footprint of a pale lager packed in different formats:
assessment and sensitivity analysis based on transparent data. J. Clean. Prod. 112, 4196-
4213.
Eriksson, O., Jonsson, D., Hillman, K., 2016. Life cycle assessment of Swedish single malt
whisky. J. Clean. Prod. 112, 229-237.
Fusi, A., Guidetti, R., Benedetto, G., 2014. Delving into the environmental aspect of a
Sardinian white wine: from partial to total life cycle assessment. Sci. Total Environ. 472,
989-1000.
Garnett, T., 2007. The alcohol we drink and its contribution to the UK’s Greenhouse Gas
Emissions: a discussion paper. Centre for Environmental Strategy, University of Surrey,
Surrey: http://www.fcrn.org.uk/sites/default/files/ALCOHOL%20final%20version%20TG
%20feb%202007.pdf
23

Gazulla, C., Raugei, M., Fullana-i-Palmer, P., 2010. Taking a life cycle look at crianza wine
production in Spain: where are the bottlenecks? Int. J. LCA 15, 330-337.
Lalonde, A., Nicholson, A., Schenck, R., 2013. Life Cycle Assessment of Beer in Support of
an Environmental Product Declaration. Institute for Environmental Research and
Education (IERE): Washington:
http://iere.org/wp-content/uploads/2013/10/IERE_Beer_LCA_Final.pdf
Neto, B., Dias, A.C., Machado, M., 2013. Life cycle assessment of the supply chain of a
Portuguese wine: from viticulture to distribution. Int. J. LCA 18, 590-602.
Pattara, C., Raggi, A., Cichelli, A., 2012. Life cycle assessment and carbon footprint in the
wine supply-chain. J. Environ. Manage. 49, 1247-1258.
Point, E., Tyedmers, P., Naugler, C., 2012. Life cycle environmental impacts of wine
production and consumption in Nova Scotia, Canada. J. Clean. Prod. 27, 11-20.
Ramstedt, M., Lindell, A., Raninen, J., 2013. Tal om alkohol 2012 - En statistisk årsrapport
från Monitorprojektet. Report no 67. Centre for Social Research on Alcohol and Drugs
(SoRAD), Stockholm Universisty, Stockholm: http://www.sorad.su.se/forskning/statistik
SAM, 2017. Swedish Alcohol Monopoly Sales statistcs 2016. Arikellistan 2016. Swedish
Alcohol Monopoly (SAM), Stockholm:
https://www.systembolaget.se/om-systembolaget/om-foretaget/forsaljningsstatistik/
SAM, 2011. Environmental report Swedish Alcohol Monopoly. Swedish Alcohol Monopoly
(SAM), Stockholm: http://ansvarsredovisning2015.systembolaget.se/wp-content/uploads/
2016/01/miljoutredning_systembolaget.pdf
SAM., Vinmonopolet., 2010. Nordic Life Cycle Assessment Wine Package Study. Swedish
Alcohol Monopoly (SAM) and Wine Monopoly:
https://endpoint895270.azureedge.net/static/se/documents/sustainability-downloads/lca
%20nordic%20wine%20comparative_august_10_with%20final%20statement.pdf
24

Saxe, H., 2010. LCA-based comparison of the climate footprint of beer vs. wine & spirits.
Report no 207. Fødevareøkonomisk Institut, Copenhagen University, Copenhagen:
http://curis.ku.dk/ws/files/44663043/FOI_report_207.pdf
SERI., 2013. Livscykelanallys av glasflaskor, PET flaskor och aluminiumburkar i det svenska
distributionssystemet för drycker. En uppföljning av studierna från år 2008. Report no U
4588. Swedish Environmental Research Institute (SERI).
Swedish Brewery Association, 2014. Fördelning på förpackningstyper. Swedish Brewery
Association, Stockholm: http://sverigesbryggerier.se/statistik/fordelning-av-ol-lask-och-
vatten-pa-forpackningstyper/
Swedish Brewery Association, 2013. Dryckesförsäljning 2013 efter huvudsaklig
säljkanalsandel. Swedish Brewery Association, Stockholm:
http://sverigesbryggerier.se/statistik/fordelning-av-ol-lask-och-vatten-pa-saljkanaler/
Trolledal, B., 2016. Alkoholkonsumtionen i Sverige 2015. Report no 160. Swedish Council
for Information on Alcohol and Other Drugs (CAN). Stockholm:
http://can.se/contentassets/8a116b56043e49eab7f4128010a7f6b2/alkoholkonsumtionen-i-
sverige-2015.pdf
Vázquez-Rowe, I., Cáceres, A.L., Torres-García, J.R., Quispe, I., Kahhat, R., 2017. Life
Cycle Assessment of the production of pisco in Peru. J. Clean. Prod. 142, 4369-4383.
Vázquez-Rowe, I., Villanueva-Rey, P., Moreira, M.T., Feijoo, G., 2012. Environmental
analysis of Ribeiro wine from a timeline perspective: harvest year matters when reporting
environmental impacts. J. Environ. Manage. 98, 73-83.
Weidema, B., de Saxcé, M, Muñoz, I., 2016. Environmental impacts of alcoholic beverages as
distributed by the Nordic Alcohol Monoplies 2014. 2.0 LCA consultants, Aalborg.
Williams, A. G.; Mekonen, S. Environmental performance of traditional beer production in a
micro-brewery. In Proceedings of the 9th International Conference on Life Cycle
25
Assessment in the Agri-Food Sector (LCA Food 2014), San Francisco, USA, Oct 8-10,
2014; American Center for Life Cycle Assessment: 2014; pp 1535-1540.
26