architectural distortion model for breast cancer detection...
TRANSCRIPT
Web Site: www.ijettcs.org Email: [email protected], [email protected] Volume 2, Issue 2, March – April 2013 ISSN 2278-6856
Volume 2, Issue 2 March – April 2013 Page 474
Abstract: Mammography is the best available examination for the detection of early signs of breast cancer such as masses, calcifications, bilateral asymmetry and architectural distortion. The architectural distortion is a very important finding in interpreting breast cancers as well as micro calcification and mass on mammograms. However, it is more difficult for physicians to detect architectural distortion than micro calcification and mass. The purpose of this study is to develop two detection approaches for architectural distortions existing around skin line and within mammary glandular tissues. The detection methods for depressed areas around skin line consisted of three steps. The binarization technique was performed to extract the mammary gland region. The methods are based upon mathematical morphological operations and active contour techniques, a novel method for the analysis of the angular spread of power, fractal analysis, Laws’ texture energy measures derived from geometrically transformed regions of interest (ROIs), and texture features Keywords: Breast cancer, Mammograms, mathematical morphology, active contours, edge detection
1. INTRODUCTION Breast cancer is the most frequently diagnosed cancer in women. According to the National Cancer Institute of Canada, the lifetime probability of developing breast cancer is one in 8.9, and the lifetime probability of death due to breast cancer is one in 26.8 [1]. In future the Breast cancer would be highest prevalence among all cancers in the female population, with 1.0% of all women living with the disease [1]. Early detection of breast cancer is importance: localized cancer leads to a 5-year survival rate of 97.5%, whereas cancer that has spread to distant organs has a 5-year survival rate of only 20.4% [2]. Although a substantial record of research can be found in the literature regarding CAD and classification of masses and calcifications, the number of studies on the detection of architectural distortion is significantly lower [3], [4], [5],. Furthermore, only a few studies have been reported on the detection of abnormalities in prior mammogramsacquired before the detection of cancer [6][9] to explore the possibility. Classifications of breast lesions as malignant or benign from mammograms must be based on information present in the mammogram. In addition clinical data such as
patient age can also be used. Clinical data such patient age can also be used. A common approach to this task is to extract information (called features from mammogram and then use a mathematical or statically model (called classifier) to make the malignant versus benign assessment. This stagey is not unique to classifications with computers; many radiologists advocate a similar systematic approach in their interpretation of mammograms. Important signs of abnormalities and cancer:
calcifications, masses, localized increase in density asymmetry between the left and right breast images,
and architectural distortion
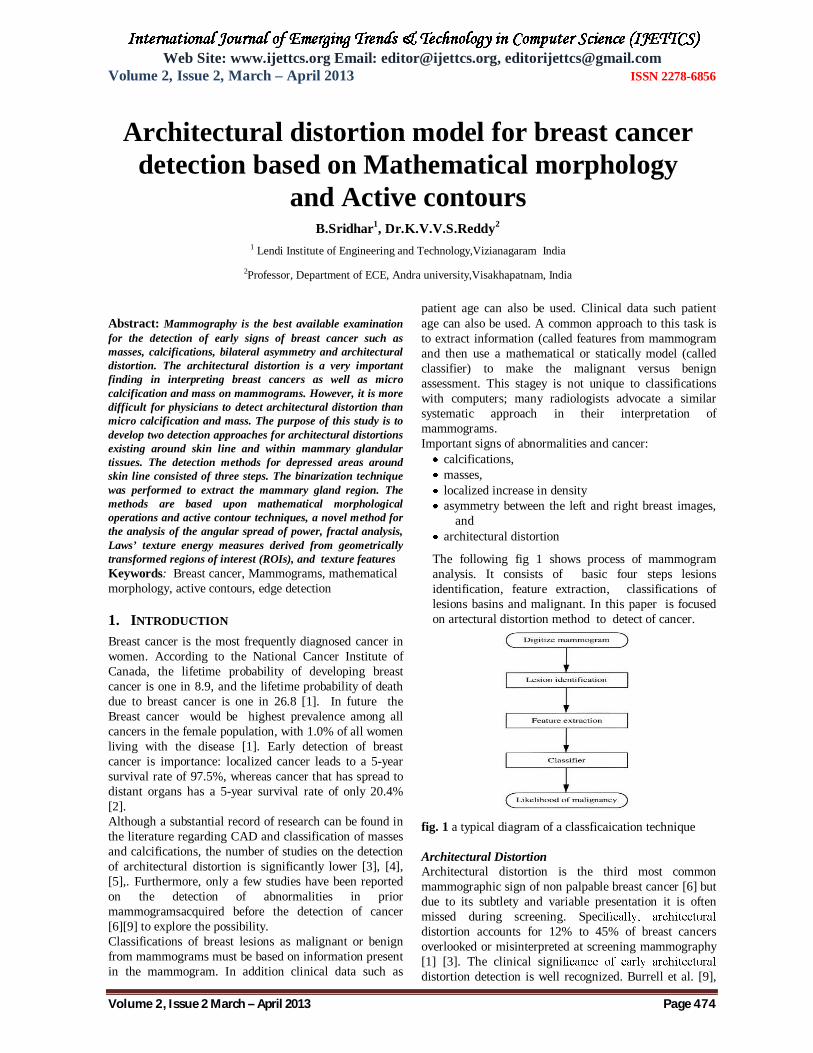
The following fig 1 shows process of mammogram analysis. It consists of basic four steps lesions identification, feature extraction, classifications of lesions basins and malignant. In this paper is focused on artectural distortion method to detect of cancer.
fig. 1 a typical diagram of a classficaication technique
Architectural Distortion Architectural distortion is the third most common mammographic sign of non palpable breast cancer [6] but due to its subtlety and variable presentation it is often missed during screening. Specidistortion accounts for 12% to 45% of breast cancers overlooked or misinterpreted at screening mammography [1] [3]. The clinical signidistortion detection is well recognized. Burrell et al. [9],
Architectural distortion model for breast cancer detection based on Mathematical morphology
and Active contours B.Sridhar1, Dr.K.V.V.S.Reddy2
1 Lendi Institute of Engineering and Technology,Vizianagaram India
2Professor, Department of ECE, Andra university,Visakhapatnam, India

Web Site: www.ijettcs.org Email: [email protected], [email protected] Volume 2, Issue 2, March – April 2013 ISSN 2278-6856
Volume 2, Issue 2 March – April 2013 Page 475
in a study of screening interval breast cancers, showed that architectural distortion is the most commonly missed abnormality in false-negative cases. Broeders et al. [5] suggested that improvement in the detection of architectural distortion could lead to an e ective improvement in the prognosis of breast cancer patients Determination of architectural distortion candidates within mammary glandular tissue and elimination of false positives The distributions of mammary gland were approximated to linear structures. Those within normal breast were toward the nipple; on the other hand, those within abnormal breast were toward the suspect area. Fig.2 shows a simplified illustration of architectural distortion within mammary gland region[11]. First, the linear structures of mammary gland were extracted by the mean curvature whose sign showed the downward or upward curved surface at a point. The mean curvature of mammary gland showed the positive. Second, the suspect area was
Fig. 2. Extraction flow diagram for architectural distortion existing around skinline. (a) An original image with distorted area indicated by circle. (b) Extracted mammary gland region in (a). This region contains focal retraction area. (c) The smoothed image obtained by the closing of (b) by structuring elements. (d) The difference imagecontains the candidates of distorted areas. (e) Elimination of false positives by the features of their sizes and positions. The upper and lower candidates are true positive and false positive, respectively. This paper is organized as follows: the definitions of the mathematical morphology and Active contours are summarized in section 2.The new model is proposed in detail in section 3. Experimental results of the new model are presented in section 4. Concluding remarks are given in section 6 2 Back Ground 2. 1.Mathematical morphological operators Mathematical morphology theory is developed from geometry. It was introduced by Soile [3] as a technique for analysing geometric structure of metallic and geologic samples. It was extended to image analysis by Serra [10]. Based on set theory, mathematical morphology is established by introducing fundamental operators applied to two sets. One set is said to be processed by another
which is known as structuring element. Let I denote a grey-scale two dimensional image, B denote structuring element. The basic mathematical morphological operators are dilation and erosion, derived from these, opening and closing operations are also defined. Dilation of a grey-scale image I(x,y) by a grey-scale structuring element B(s,t) is denoted by
The domain of I B is the dilation of the domain of I by the domain of B. Erosion of a grey-scale image I(x,y) by a grey-scale structuring element B(s,t) is denoted by
The domain of I B is the erosion of the domain of I by the domain of B. Opening of a grey-scale image I(x,y) by a grey-scale structuring element B(s,t) is denoted by I B=(I B) B. Closing of a grey-scale image I(x,y) by a grey-scale structuring element B(s,t) is denoted by I•B=(I B) B. Dilation is the maximum pixels set union when structuring element overrides image, while erosion is the minimum pixels set union when image is overlapped by structuring element. Dilation expands image set and erosion shrinks it. Opening is erosion followed by dilation and closing is dilation followed by erosion. Opening generally smoothes the contour of an image, breaks narrow gaps. As opposed to opening, closing tends to fuse narrow breaks, eliminates small holes, and fills gaps in the contours. The edge of image I, denoted by Ed (I), is defined as the difference set of the dilation domain of I and the domain of I. This is also known as dilation residue edge detector:
Equivalently, the edge of image I, denoted by Ee (I), can also be defined as the difference set of the domain of I and the erosion domain of I. This is also known as erosion residue edge detector:
The opening top-hat transformation of image I, denoted as THo(I), is defined as the difference set of the domain of I and the opening domain of I. It is defined as
Similarly, the closing top-hat transformation of image I, denoted as THc (I), can also be defined as the difference set of the closing domain of I and the domain of I. It is defined as
2.2 Active contours
Web Site: www.ijettcs.org Email: [email protected], [email protected] Volume 2, Issue 2, March – April 2013 ISSN 2278-6856
Volume 2, Issue 2 March – April 2013 Page 476
Active contour model, also called snakes, is a framework for delineating an object out line from possibly noisy 2D image.[4]
This framework attempts to minimize an energy associated to the current contour as a sum of an internal and external energy:
The external energy is supposed to be minimal when the snake is at the object boundary position. The most straightforward approach consists in giving low values when the regularized gradient around the contour position reaches its peak value. The internal energy is supposed to be minimal when the snake has a shape which is supposed to be relevant considering the shape of the sought object. The most straightforward approach grants high energy to elongated contours (elastic force) and to bended/high curvature contours (rigid force), considering the shape should be as regular and smooth as possible.
Snake is an energy minimizing, deformable spline influenced by constraint and image forces that pull it towards object contours. Snakes are greatly used in applications like object tracking, shape recognition, segmentation, edge detection, stereo matching. Snakes may be understood as a special case of general technique of matching a deformable model to an image by means of energy minimization. Snake is an “active” model as it always minimizes its energy functional and therefore exhibits dynamic behaviour. [7]
A simple elastic snake is thus defined by the following ways.
1.A set of n points, 2.An internal elastic energy term, 3.An external edge based energy term
In Snakes, we use the technique of matching a deformable model to an image by means of energy minimization. A snake initialized near the target gets refined iteratively and is attracted towards the salient contour. A snake in the image can be represented as a set of n points.
Vi=(xi,yi)
where i=0,1…n-1
We can write its energy function as
Eext=Eim+Econ
where represents the internal energy of the spine (snake) due to bending, Eim denotes the image forces acting on spline and Econ serves as external
constraint forces introduced by user. The combination of Eim and Econ can be represented as Eext, that denote the external energy acting on the spline.
Internal energy
Internal Energy of the snake
Eint=Econ+Ecuv
is
where Econ denotes the energy of the snake contour and Ecuv denotes the energy of the spine curvature.
Where the is the coeifficents which icreases the interna energy of the contour snakes increases,however the small values streches the snake level. This is the second-order term makes it act like a thin plate.
Similarly, large values of will increase the internal energy of the snake as it develops more curves, whereas small values of will make the energy function insensitive to curves in the snake. Smaller values of
and will place fewer constraints on the size and shape of the snake.
Image forces
Further, Eimage has three components:
Lines
Edges
Terminations
The energies can be represented as follows:
Adjusting the weights in the image will determine salient features in the image which will be considered by the snake.
b) Edge functional c) Image gradient
Edges in the image can be found by the following energy function which will make the snake attract towards contours with large image gradients.
Eedge = -- (1) Scale space
It is rather common that a snake started far from the object converges to the desired object contour. If a part of

Web Site: www.ijettcs.org Email: [email protected], [email protected] Volume 2, Issue 2, March – April 2013 ISSN 2278-6856
Volume 2, Issue 2 March – April 2013 Page 477
the snake finds a low energy feature, it pulls the other parts of the snake to continue to the contour. Scale Space continuation can be used in order to achieve desired results. One can allow the snake to come to equilibrium on a blurry energy edge functional and reduce the blurring as the calculation progresses. The energy functional is
Eedge=
Where G is a Gaussian standard deviation minima of this functional lie on zero-crossings of which define edges in Marr-Hildreth Theory. Thus the snake gets attracted towards zero-crossing constrained by its own smoothness. Snakes have multiple advantages over classical feature attraction techniques.
1. Snakes are autonomous and self-adapting in their search for a minimal energy state.
2. They can be easily manipulated using external image forces.
3. They can be made sensitive to image scale by incorporating Gaussian smoothing in the image energy function.
4. They can be used to track dynamic objects in temporal as well as the spatial dimensions.
3. Detection of architectural distortion by proposed method The breast region contains the outline edges of various breast constituents bounded by the breast boundary that defines the breast region from the image background. For further processing it is importance to extract the boundary of the breast. In this research paper we now proposed a new method for extraction of the breast boundary. ALGORITHM Step 1: Read in the gray scale Image Step 2: use morphological techniques called "opening-by-reconstruction" and "closing-by-reconstruction" to "clean" up the image. These operations will create flat maxima inside each object that can be located. Step 3: Opening is an erosion followed by a dilation, Step4:while opening-by-reconstruction is an erosion followed by a morphological reconstruction. Step5: Let's compare the two Step 6: Now we need to mark the background. In the cleaned-up image, the dark pixels belong to the background, so you could apply with a thresholding operation. Step7: Convert the image to double data type
Step8: Show the image and select some points with the mouse (at least 4) Step 9: Make an array with the clicked coordinates Step 10: Start Active contour Process Step 11: Show the result We now proceed with the output image of the edge extraction process and our objective is to identify the outermost edge line that constitutes the edge of the breast. We scan the image from the right side of the image to locate the rightmost point at the first row of the image, which is the starting point of the processing. We first concentrate the all pixels which contains different of flash and fluids. We then apply the mathematical morphology opeatators to separated the boundaries this operation is done by consider all the surrounding pixels in a clockwise priority. We store the pixel traversed in a Plotting List to be used later for drawing the breast boundary. Now we need to mark the background ,In the clean up image the dark pixels belong to the background. So we applied a thresholds operation. Then the exact boundary is dislocated that was shaded by the active contours operations[8]. The various energies of the mammograms is plotted..
Fig 3:(a):Normal breast image (b) architectural detection of normal image,(c) infected image (d)architectural
detection of normal image The pixels that surrounded the starting pixel, but are of lower priority are stored in a Backtrack Stack to be used only if the traversal process reaches a dead end. If a dead end is reached, we pop out from the Backtrack stack a lesser priority pixel and continue with the traversal process as shown in the fig . 4. The traversal continues to
Web Site: www.ijettcs.org Email: [email protected], [email protected] Volume 2, Issue 2, March – April 2013 ISSN 2278-6856
Volume 2, Issue 2 March – April 2013 Page 478
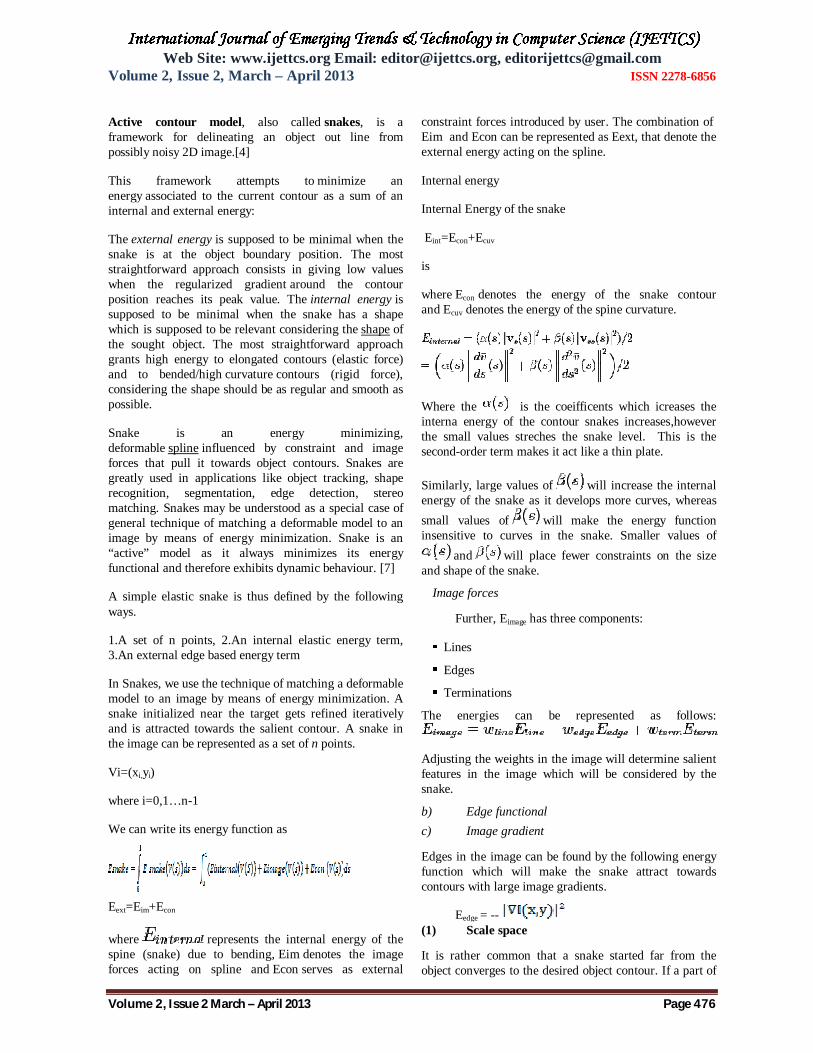
the next pixel and continues till it reaches the baseline or the bottom of the image, indicating the end of the breast region. The Plotting list contains the breast boundary pixels where the regions is highly dislocated
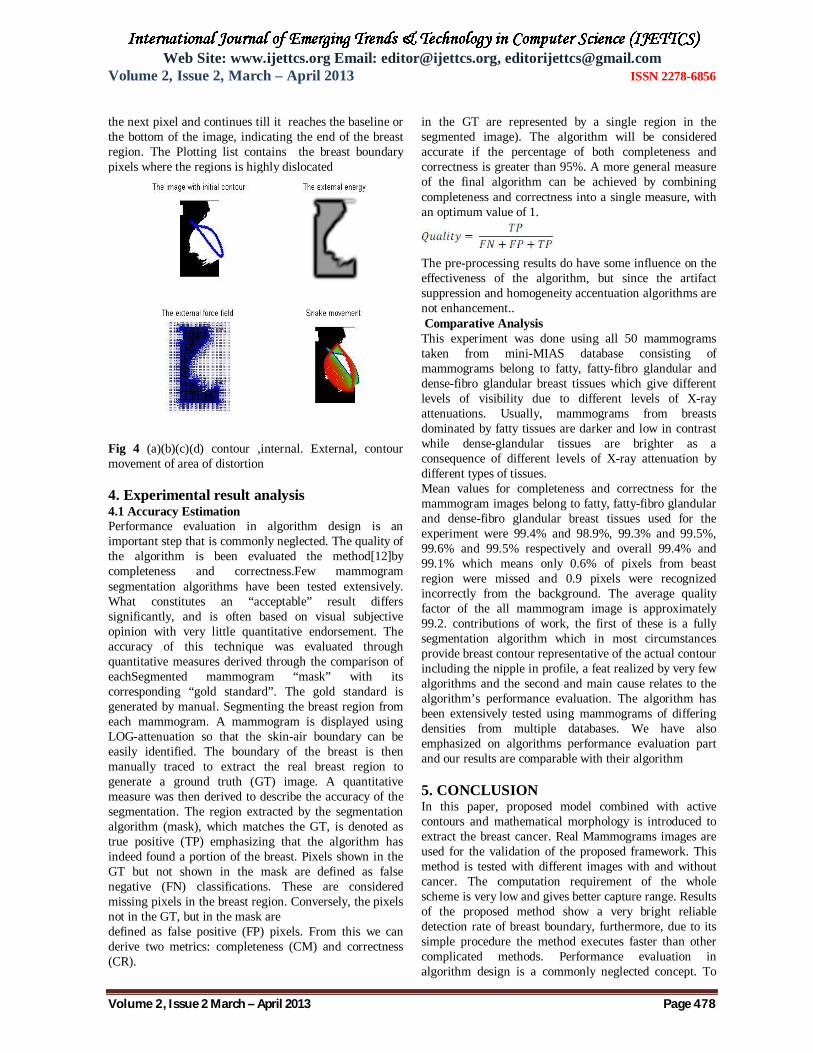
Fig 4 (a)(b)(c)(d) contour ,internal. External, contour movement of area of distortion 4. Experimental result analysis 4.1 Accuracy Estimation Performance evaluation in algorithm design is an important step that is commonly neglected. The quality of the algorithm is been evaluated the method[12]by completeness and correctness.Few mammogram segmentation algorithms have been tested extensively. What constitutes an “acceptable” result differs significantly, and is often based on visual subjective opinion with very little quantitative endorsement. The accuracy of this technique was evaluated through quantitative measures derived through the comparison of eachSegmented mammogram “mask” with its corresponding “gold standard”. The gold standard is generated by manual. Segmenting the breast region from each mammogram. A mammogram is displayed using LOG-attenuation so that the skin-air boundary can be easily identified. The boundary of the breast is then manually traced to extract the real breast region to generate a ground truth (GT) image. A quantitative measure was then derived to describe the accuracy of the segmentation. The region extracted by the segmentation algorithm (mask), which matches the GT, is denoted as true positive (TP) emphasizing that the algorithm has indeed found a portion of the breast. Pixels shown in the GT but not shown in the mask are defined as false negative (FN) classifications. These are considered missing pixels in the breast region. Conversely, the pixels not in the GT, but in the mask are defined as false positive (FP) pixels. From this we can derive two metrics: completeness (CM) and correctness (CR).
in the GT are represented by a single region in the segmented image). The algorithm will be considered accurate if the percentage of both completeness and correctness is greater than 95%. A more general measure of the final algorithm can be achieved by combining completeness and correctness into a single measure, with an optimum value of 1.
The pre-processing results do have some influence on the effectiveness of the algorithm, but since the artifact suppression and homogeneity accentuation algorithms are not enhancement.. Comparative Analysis This experiment was done using all 50 mammograms taken from mini-MIAS database consisting of mammograms belong to fatty, fatty-fibro glandular and dense-fibro glandular breast tissues which give different levels of visibility due to different levels of X-ray attenuations. Usually, mammograms from breasts dominated by fatty tissues are darker and low in contrast while dense-glandular tissues are brighter as a consequence of different levels of X-ray attenuation by different types of tissues. Mean values for completeness and correctness for the mammogram images belong to fatty, fatty-fibro glandular and dense-fibro glandular breast tissues used for the experiment were 99.4% and 98.9%, 99.3% and 99.5%, 99.6% and 99.5% respectively and overall 99.4% and 99.1% which means only 0.6% of pixels from beast region were missed and 0.9 pixels were recognized incorrectly from the background. The average quality factor of the all mammogram image is approximately 99.2. contributions of work, the first of these is a fully segmentation algorithm which in most circumstances provide breast contour representative of the actual contour including the nipple in profile, a feat realized by very few algorithms and the second and main cause relates to the algorithm’s performance evaluation. The algorithm has been extensively tested using mammograms of differing densities from multiple databases. We have also emphasized on algorithms performance evaluation part and our results are comparable with their algorithm 5. CONCLUSION In this paper, proposed model combined with active contours and mathematical morphology is introduced to extract the breast cancer. Real Mammograms images are used for the validation of the proposed framework. This method is tested with different images with and without cancer. The computation requirement of the whole scheme is very low and gives better capture range. Results of the proposed method show a very bright reliable detection rate of breast boundary, furthermore, due to its simple procedure the method executes faster than other complicated methods. Performance evaluation in algorithm design is a commonly neglected concept. To

Web Site: www.ijettcs.org Email: [email protected], [email protected] Volume 2, Issue 2, March – April 2013 ISSN 2278-6856
Volume 2, Issue 2 March – April 2013 Page 479
determine the robustness of the algorithm our method has been tested on mammograms with differing breast tissue densities: fatty, fatty-fibro glandular and dense-fibro glandular and proven a comparative rate of robustness with other recognized methods. This method can be used for other medical image processing applications with minor modification that need to automatically segment an exact part of the images for post-processing stages. The last part of the method that is Breast Boundary Smoothing Algorithm can further extended in future.
REFERENCES: [1.] Rangaraj M. Rangayyana,b,_, Fa´ bio J. Ayresa, J.E.
Leo DesautelA review of computer-aided diagnosis of breast cancer: Toward the detection of subtle signs Journal of the Franklin Institute 344 (2007) 312–348
[2.] Shantanu Banik, Rangaraj M. Rangayyan*, and J. E. Leo Desautels, Detection of Architectural Distortion in Prior Mammograms IEEE TRANSACTIONS ON MEDICAL IMAGING, VOL. 30, NO. 2, FEBRUARY 2011
[3.] Stelioos Halkiotis,taxiarchis,Marina Rangousssi ‘Automatic detection of clustered micro calcifications in digital mammograms using mathematical morphology and neural networks’ ELSEVIER signal processing 87(2007) 1559-1568.
[4.] Jinsan Tang ‘Amulti-direction GVF snake for the segmentation of skin cancer images’ELSEVIER Pattern recognition 42 20009 1172-1179.
[5.] Jelena Bozek, Kresimir Delac, Mislav Grgic ,Computer-Aided Detection and Diagnosis of Breast Abnormalities in Digital Mammography50th International Symposium ELMAR-2008, 10-12 September 2008, Zadar, Croatia
[6.] T. Matsubaraa,*, T. Ichikawab, T. Harab, H. Fujitab, S. Kasaic, T. Endod, T. Iwasee Automated detection methods for architectural distortions around skinline and within mammary gland on mammograms International Congress Series 1256 (2003) 950–955
[7.] George Papandreou ’Multigrid Geometric Active contour models’, IEEE Trans. Imageprocessing vol.16. no.1 jan 2007.
[8.] Luis Alvarez ’Morphological snakes’ In cononferencef. IEEE 2010
[9.] Dr.Williab Broday ’Hand Book on Medical imaging ‘ Academic press.
[10.] Frank Y Shi ’Mathematical morphology fundamentals & applications’, CRC press.
[11.] T. Matsubara, T. Ichikawa,T. Hara, H. Fujita,S. Kasai,T. Endo, T. Iwase “Automated detection methods for architectural distortions around skinline and within mammary gland on mammograms”International Congress Series 1256 (2003) 950 – 955
[12.] Indra Kanta Maitra ,Sanjay Nag, Samir K Bandyopadhyay “Accurate Breast Contour Detection
Algorithms in Digital Mammogram” International Journal of Computer Applications (0975 – 8887) Volume 25– No.5, July 2011