appendix g air quality
TRANSCRIPT

Appendix G
Air Quality

G-1
Appendix G: Air Quality
A. INTRODUCTION
Section 6-4-4, Air Quality, of this Draft Design Report/Draft Environmental Impact Statement (DDR/DEIS) summarizes the assessment of potential effects on ambient air quality from the operation of the Project in accordance with the procedures found in the New York State Department of Transportation (NYSDOT) Environmental Manual (TEM). Potential air quality effects associated with the construction phase are also described. This appendix describes the regulatory context, methodology, and results of the air quality assessment.
Mesoscale emissions for carbon monoxide (CO), volatile organic compounds (VOCs), oxides of nitrogen (NOx), particulate matter (PM) less than or equal to 2.5 micrometers (PM2.5) and PM less than or equal to 10 micrometers (PM10) were assessed over the area studied in the traffic modeling for the No Build, Viaduct and Community Grid Alternatives (see Chapter 5, Transportation and Engineering Considerations, for traffic information) for estimated time of completion, estimated time of completion+10, and estimated time of completion+30. The analysis years of 2020, 2030, and 2050, respectively, were determined to be reasonably representative of roadway conditions at the time of completion.
The Project would not introduce any new, permanent stationary emission sources, such as boilers or generators.
B. REGULATORY CONTEXT
NATIONAL AMBIENT AIR QUALITY STANDARDS
As required by the Clean Air Act and its Amendments of 1990 (CAA), primary and secondary National Ambient Air Quality Standards (NAAQS) have been established for six major air pollutants: CO, nitrogen dioxide (NO2), ozone, PM (PM2.5 and PM10), sulfur dioxide (SO2), and lead. The primary standards represent levels that are requisite to protect the public health, allowing an adequate margin of safety. The secondary standards are intended to protect the nation’s welfare and account for air pollutant effects on soil, water, visibility, materials, vegetation, and other aspects of the environment. The primary standards are generally either the same as the secondary standards or more restrictive. The NAAQS are presented in Table G-1.
In addition to the criteria pollutants discussed above, toxic air pollutants, or mobile source air toxics (MSATs), are pollutants known to cause or are suspected of causing cancer or other serious health ailments. The CAA Amendments of 1990 listed 188 air toxics and addressed the need to control toxic emissions from transportation. EPA identified nine compounds with significant contributions from mobile sources that are among the national and regional-scale cancer risk drivers or contributors and non-cancer hazard contributors from the 2011 National Air Toxics Assessment (NATA). These are 1,3-butadiene, acetaldehyde, acrolein, benzene, diesel particulate matter (diesel PM), ethylbenzene, formaldehyde, naphthalene, and polycyclic organic matter. While FHWA considers these the priority mobile source air toxics, the list is subject to change and may be adjusted in consideration of future EPA rules.

Appendix G: Air Quality
G-2
Table G-1
National Ambient Air Quality Standards (NAAQS)
Pollutant Primary /
Secondary Averaging
Time Level Form
Carbon Monoxide (CO) primary 8 hours 9 ppm Not to be exceeded more
than once per year 1 hour 35 ppm
Lead (Pb) primary and secondary
Rolling 3 month
average 0.15 μg/m3(1) Not to be exceeded
Nitrogen Dioxide (NO2)
primary 1 hour 100 ppb
98th percentile of 1-hour daily maximum
concentrations, averaged over 3 years
primary and secondary
1 year 53 ppb(2) Annual Mean
Ozone (O3) primary and secondary
8 hours 0.070 ppm(3)
Annual fourth-highest daily maximum 8-hour
concentration, averaged over 3 years
Particle Pollution
(PM)
PM2.5
primary 1 year 12.0 μg/m3 Annual mean, averaged
over 3 years
secondary 1 year 15.0 μg/m3 Annual mean, averaged
over 3 years
primary and secondary
24 hours 35 μg/m3 98th percentile, averaged
over 3 years
PM10 primary and secondary
24 hours 150 μg/m3 Not to be exceeded more
than once per year on average over 3 years
Sulfur Dioxide (SO2)
primary 1 hour 75 ppb(4)
99th percentile of 1-hour daily maximum
concentrations, averaged over 3 years
Sulfur Dioxide (SO2)
secondary 3 hours 0.5 ppm Not to be exceeded more
than once per year
Notes: ppm – parts per million (unit of measure for gases only) µg/m3 – micrograms per cubic meter (unit of measure for gases and particles, including lead) All annual periods refer to calendar year. (1) In areas that are designated to be in nonattainment for the Pb standards prior to the promulgation of the current
(2008) standards, and for which implementation plans to attain or maintain the current (2008) standards have not been submitted and approved, the previous standards (1.5 µg/m3 as a calendar quarter average) also remain in effect.
(2) The level of the annual NO2 standard is 0.053 ppm. It is shown here in terms of ppb for the purposes of clearer comparison to the 1-hour standard level.
(3) The final rule was signed on October 1, 2015, effective December 28, 2015. The previous (2008) O3 standards additionally remain in effect in some areas. Revocation of the previous (2008) O3 standards and transitioning to the current (2015) standards will be addressed in the implementation rule for the current standards.
(4) The previous SO2 standards (0.14 ppm 24-hour and 0.03 ppm annual) will also remain in effect in certain areas: (1) any area for which it is not yet 1 year since the effective date of designation under the current (2010) standards, and (2) any area for which an implementation plan providing for attainment of the current (2010) standard has not been submitted and approved and which is designated nonattainment under the previous SO2 standards or is not meeting the requirements of a SIP call under the previous SO2 standards (40 CFR 50.4[3]). A SIP call is an EPA action requiring a state to resubmit all or part of its State Implementation Plan to demonstrate attainment of the required NAAQS.
Sources: 40 CFR Part 50. National Primary and Secondary Ambient Air Quality Standards. USEPA. https://www.epa.gov/criteria-air-pollutants/naaqs-table. Retrieved October, 2018.

Appendix G: Air Quality
G-3
NAAQS ATTAINMENT STATUS AND STATE IMPLEMENTATION PLANS
The CAA, as amended in 1990, defines non-attainment areas (NAA) as geographic regions that have been designated as not meeting one or more of the NAAQS. When an area is designated as non-attainment by USEPA, the state is required to develop and implement a State Implementation Plan (SIP), which delineates how a state plans to achieve air quality that meets the NAAQS under the deadlines established by the CAA, followed by a plan for maintaining attainment status once the area is in attainment.
Onondaga County is currently in attainment for all standards of criteria pollutants.
C. METHODOLOGY
Emissions from motor vehicles are referred to as on-road emissions, while emissions from construction equipment are referred to as non-road emissions. In both cases, emissions result from combustion of fuels. On-road emission sources are predominantly gasoline passenger vehicles and diesel trucks.
POLLUTANTS FOR ANALYSIS
Air quality is affected by air pollutants produced by both motor vehicles and stationary sources. Emissions from motor vehicles are referred to as mobile source emissions, while emissions from fixed facilities are referred to as stationary source emissions. Ambient concentrations of CO are predominantly influenced by mobile source emissions. PM, VOCs, and NOx are emitted from both mobile and stationary sources. Fine PM is also formed when emissions of NOx, sulfur oxides (SOx), ammonia, organic compounds, and other gases react or condense in the atmosphere. Emissions of sulfur dioxide (SO2) are associated mainly with stationary sources, and some sources utilizing non-road diesel such as large international marine engines. On-road diesel vehicles currently contribute very little to SO2 emissions since the sulfur content of on-road diesel fuel, which is federally regulated, is extremely low. Ozone is formed in the atmosphere by complex photochemical processes that include NOx and VOCs. Ambient concentrations of CO, PM, NO2, SO2, ozone, and lead are regulated by USEPA under the CAA and are referred to as ‘criteria pollutants’; emissions of VOCs, NOx, and other precursors to criteria pollutants are also regulated by USEPA.
CARBON MONOXIDE
CO, a colorless and odorless gas, is produced primarily by the incomplete combustion of gasoline and other fossil fuels. In urban areas, approximately 80 to 90 percent of CO emissions are from motor vehicles. CO concentrations can diminish rapidly over relatively short distances; elevated concentrations are usually limited to locations near crowded intersections, heavily traveled and congested roadways, parking lots, and garages. Consequently, CO concentrations must be analyzed on a local (microscale) basis.
NITROGEN OXIDES, VOCS, AND OZONE
NOx are of principal concern because of their role, together with VOCs, as precursors in the formation of ozone. Ozone is formed through a series of reactions that take place in the atmosphere in the presence of sunlight. The effects of NOx and VOC emissions from all sources are generally examined on a regional basis. The contribution of an action or project to regional emissions of these pollutants would include any added stationary or mobile source emissions.

Appendix G: Air Quality
G-4
The Project would potentially result in changes to the regional vehicular travel patterns in the study areas. Therefore, the change in regional NOx and VOC emissions was analyzed.
In addition to being a precursor to the formation of ozone, NO2 (one component of NOx) is also a regulated pollutant. Since NO2 is mostly formed from the transformation of NO in the atmosphere, it has mostly been of concern further downwind from large stationary point sources, and not a local concern from mobile sources (NOx emissions from fuel combustion consist of approximately 90 percent NO and 10 percent NO2 at the source). However, with the promulgation of the 2010 1-hour average standard for NO2, local sources such as vehicular emissions may be of greater concern. The changes in NO2 concentrations associated with this Project have not been analyzed explicitly due to limitations in guidance and modeling tools. However, any changes in NO2 concentrations associated with the Project would be relatively small, as demonstrated below for CO and PM.
The Project would not involve the addition of any new stationary emission sources. Therefore, an analysis of potential local impacts on NO2 concentrations was not warranted.
LEAD
Airborne lead emissions are currently associated principally with industrial sources. Lead in gasoline has been banned under the CAA and would not be emitted from any other component of the Project. Therefore, an analysis of this pollutant was not warranted.
RESPIRABLE PARTICULATE MATTER—PM10 AND PM2.5
PM is a broad class of air pollutants that includes discrete particles of a wide range of sizes and chemical compositions, as either liquid droplets (aerosols) or solids suspended in the atmosphere. The constituents of PM are both numerous and varied, and they are emitted from a wide variety of sources (both natural and anthropogenic). Natural sources include the condensed and reacted forms of naturally occurring VOC; salt particles resulting from the evaporation of sea spray; wind-borne pollen, fungi, molds, algae, yeasts, rusts, bacteria, and material from live and decaying plant and animal life; particles eroded from beaches, soil, and rock; and particles emitted from volcanic and geothermal eruptions and from forest fires. Naturally occurring PM is generally greater than 2.5 micrometers in diameter. Major anthropogenic sources include the combustion of fossil fuels (e.g., vehicular exhaust, power generation, boilers, engines, and home heating), chemical and manufacturing processes, all types of construction, agricultural activities, as well as wood-burning stoves and fireplaces. PM also acts as a substrate for the adsorption (accumulation of gases, liquids, or solutes on the surface of a solid or liquid) of other pollutants, often toxic, and some likely carcinogenic compounds.
As described below, PM is regulated in two size categories: particles with an aerodynamic diameter of less than or equal to 2.5 micrometers (PM2.5) and particles with an aerodynamic diameter of less than or equal to 10 micrometers (PM10, which includes PM2.5). PM2.5 has the ability to reach the lower regions of the respiratory tract, delivering with it other compounds that adsorb to the surfaces of the particles and is also extremely persistent in the atmosphere. PM2.5 is mainly derived from combustion material that has volatilized and then condensed to form primary PM (often soon after the release from a source) or from precursor gases reacting in the atmosphere to form secondary PM.
All gasoline-powered and diesel-powered vehicles, especially heavy duty trucks and buses operating on diesel fuel, are a substantial source of respirable PM, most of which is PM2.5. PM concentrations may, consequently, be locally elevated near roadways. Therefore, PM was included in the mobile source analysis.
Appendix G: Air Quality
G-5
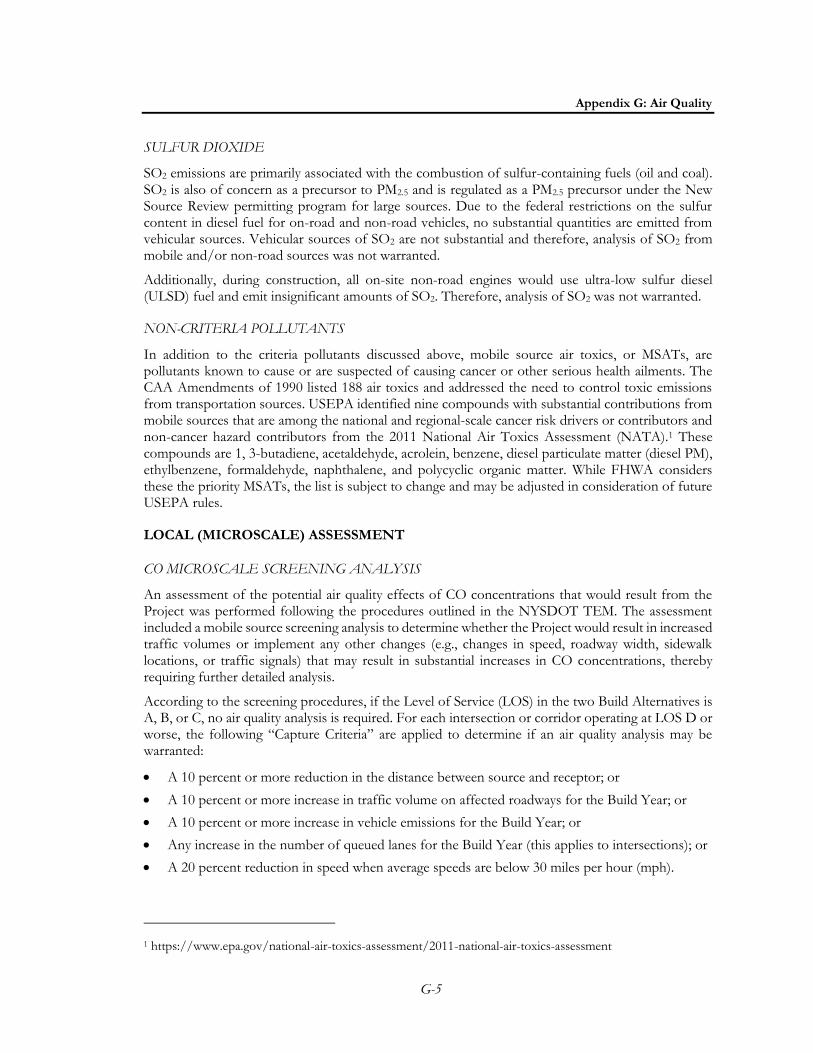
SULFUR DIOXIDE
SO2 emissions are primarily associated with the combustion of sulfur-containing fuels (oil and coal). SO2 is also of concern as a precursor to PM2.5 and is regulated as a PM2.5 precursor under the New Source Review permitting program for large sources. Due to the federal restrictions on the sulfur content in diesel fuel for on-road and non-road vehicles, no substantial quantities are emitted from vehicular sources. Vehicular sources of SO2 are not substantial and therefore, analysis of SO2 from mobile and/or non-road sources was not warranted.
Additionally, during construction, all on-site non-road engines would use ultra-low sulfur diesel (ULSD) fuel and emit insignificant amounts of SO2. Therefore, analysis of SO2 was not warranted.
NON-CRITERIA POLLUTANTS
In addition to the criteria pollutants discussed above, mobile source air toxics, or MSATs, are pollutants known to cause or are suspected of causing cancer or other serious health ailments. The CAA Amendments of 1990 listed 188 air toxics and addressed the need to control toxic emissions from transportation sources. USEPA identified nine compounds with substantial contributions from mobile sources that are among the national and regional-scale cancer risk drivers or contributors and non-cancer hazard contributors from the 2011 National Air Toxics Assessment (NATA).1 These compounds are 1, 3-butadiene, acetaldehyde, acrolein, benzene, diesel particulate matter (diesel PM), ethylbenzene, formaldehyde, naphthalene, and polycyclic organic matter. While FHWA considers these the priority MSATs, the list is subject to change and may be adjusted in consideration of future USEPA rules.
LOCAL (MICROSCALE) ASSESSMENT
CO MICROSCALE SCREENING ANALYSIS
An assessment of the potential air quality effects of CO concentrations that would result from the Project was performed following the procedures outlined in the NYSDOT TEM. The assessment included a mobile source screening analysis to determine whether the Project would result in increased traffic volumes or implement any other changes (e.g., changes in speed, roadway width, sidewalk locations, or traffic signals) that may result in substantial increases in CO concentrations, thereby requiring further detailed analysis.
According to the screening procedures, if the Level of Service (LOS) in the two Build Alternatives is A, B, or C, no air quality analysis is required. For each intersection or corridor operating at LOS D or worse, the following “Capture Criteria” are applied to determine if an air quality analysis may be warranted:
A 10 percent or more reduction in the distance between source and receptor; or
A 10 percent or more increase in traffic volume on affected roadways for the Build Year; or
A 10 percent or more increase in vehicle emissions for the Build Year; or
Any increase in the number of queued lanes for the Build Year (this applies to intersections); or
A 20 percent reduction in speed when average speeds are below 30 miles per hour (mph).
1 https://www.epa.gov/national-air-toxics-assessment/2011-national-air-toxics-assessment

Appendix G: Air Quality
G-6
If a project does not meet any of the above criteria, a microscale analysis is not required. Should any one of the above Capture Criteria be met, a Volume Threshold Screening is performed using traffic volume and emission factor data to compare with specific volume thresholds established in TEM. The Volume Thresholds (provided in the TEM) establish traffic volumes under which a violation of the NAAQS for CO is extremely unlikely. This approach uses region-specific emissions data to determine corresponding vehicle thresholds.
Both the Capture Criteria and Volume Threshold Screening were developed by NYSDOT to be conservative air quality estimates based on worst-case assumptions. TEM states that if the project-related traffic volumes are below the Volume Threshold criteria, then a microscale air quality analysis is unnecessary even if the other Capture Criteria are met for a location with LOS D or worse, since a violation of the NAAQS would be extremely unlikely.
VEHICLE EMISSIONS
Engine Emissions
Vehicular CO and PM (including brake wear and tire wear) emission factors for Onondaga County were computed using the USEPA mobile source emissions model, MOVES2014a (the model in effect at the time of the analysis).2 This emissions model is capable of calculating emission factors for various parameters relating to the on-road vehicles and the regional conditions. The model was run using a project level domain and took into consideration vehicle types, based on the fuel type (gasoline, diesel, or natural gas), meteorological conditions, vehicle speeds, vehicle age, roadway types, roadway grade, number of starts per day, engine soak time, and various other factors that influence emissions, such as inspection and maintenance programs. The inputs and use of MOVES2014a incorporate the most current guidance available from NYSDEC.
Vehicle classification data were based on data obtained from the results described in the traffic study (see Chapter 5, Transportation and Engineering Considerations). Appropriate credits were used to accurately reflect the inspection and maintenance programs.3 County-specific hourly temperature and relative humidity data obtained from NYSDEC were used.
Road Dust
The contribution of re-entrained road dust to PM10 concentrations, as presented in the PM10 SIP, is considered to be substantial; therefore, the PM10 estimates include exhaust, brake wear, tire wear, and road dust. Road dust emission factors were calculated according to the latest procedure delineated by USEPA.4 Road dust is not a substantial contributor to PM2.5 in New York State. Thus, based on USEPA guidance, road dust was not included in the PM2.5 microscale analysis.
TRAFFIC DATA
Vehicle classification data were based on field studies. Traffic data for the air quality analysis were derived from existing traffic counts, projected future growth in traffic, and other information
2 USEPA. Motor Vehicle Emission Simulator (MOVES): User Guide for MOVES2014a. EPA420B15095. November 2015.
3 The inspection and maintenance programs require inspections of automobiles and light trucks to determine if pollutant emissions from each vehicle exhaust system are lower than emission standards. Vehicles failing the emissions test must undergo maintenance and pass a repeat test to be registered in New York State.
4 USEPA. Compilations of Air Pollutant Emission Factors AP-42. Fifth Edition, Volume I: Stationary Point and Area Sources, Ch. 13.2.1. NC. http://www.epa.gov/ttn/chief/ap42. January 2011.
Appendix G: Air Quality
G-7
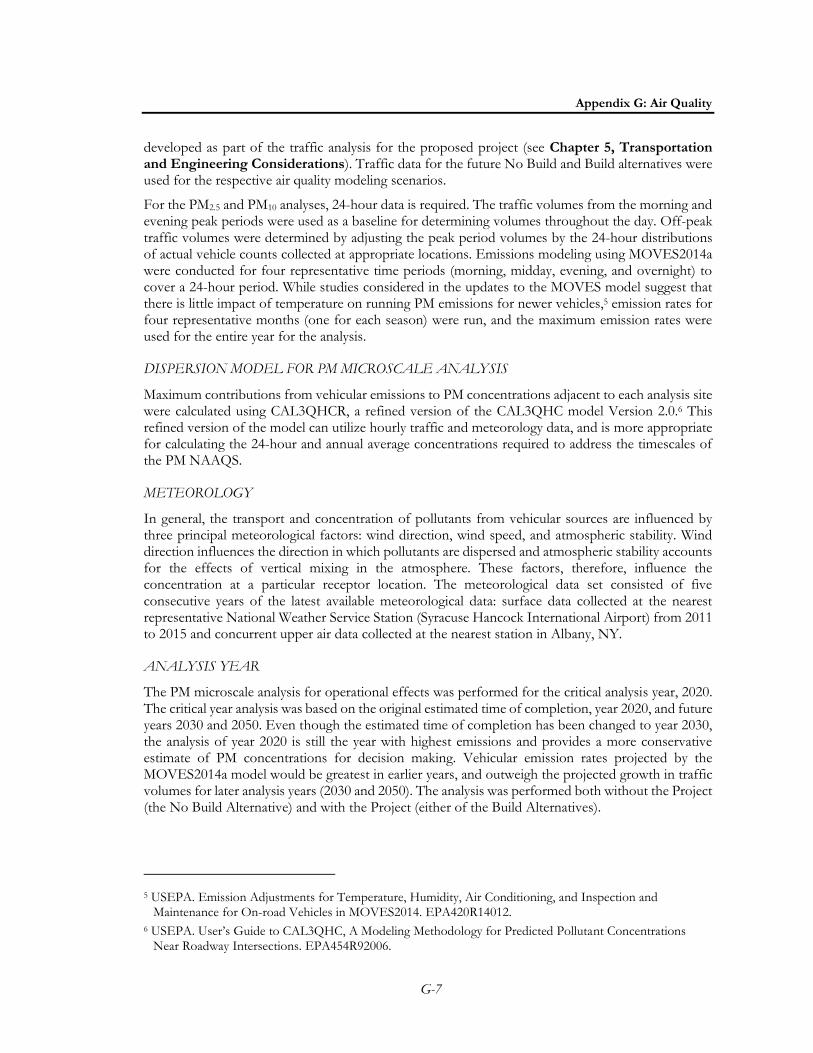
developed as part of the traffic analysis for the proposed project (see Chapter 5, Transportation and Engineering Considerations). Traffic data for the future No Build and Build alternatives were used for the respective air quality modeling scenarios.
For the PM2.5 and PM10 analyses, 24-hour data is required. The traffic volumes from the morning and evening peak periods were used as a baseline for determining volumes throughout the day. Off-peak traffic volumes were determined by adjusting the peak period volumes by the 24-hour distributions of actual vehicle counts collected at appropriate locations. Emissions modeling using MOVES2014a were conducted for four representative time periods (morning, midday, evening, and overnight) to cover a 24-hour period. While studies considered in the updates to the MOVES model suggest that there is little impact of temperature on running PM emissions for newer vehicles,5 emission rates for four representative months (one for each season) were run, and the maximum emission rates were used for the entire year for the analysis.
DISPERSION MODEL FOR PM MICROSCALE ANALYSIS
Maximum contributions from vehicular emissions to PM concentrations adjacent to each analysis site were calculated using CAL3QHCR, a refined version of the CAL3QHC model Version 2.0.6 This refined version of the model can utilize hourly traffic and meteorology data, and is more appropriate for calculating the 24-hour and annual average concentrations required to address the timescales of the PM NAAQS.
METEOROLOGY
In general, the transport and concentration of pollutants from vehicular sources are influenced by three principal meteorological factors: wind direction, wind speed, and atmospheric stability. Wind direction influences the direction in which pollutants are dispersed and atmospheric stability accounts for the effects of vertical mixing in the atmosphere. These factors, therefore, influence the concentration at a particular receptor location. The meteorological data set consisted of five consecutive years of the latest available meteorological data: surface data collected at the nearest representative National Weather Service Station (Syracuse Hancock International Airport) from 2011 to 2015 and concurrent upper air data collected at the nearest station in Albany, NY.
ANALYSIS YEAR
The PM microscale analysis for operational effects was performed for the critical analysis year, 2020. The critical year analysis was based on the original estimated time of completion, year 2020, and future years 2030 and 2050. Even though the estimated time of completion has been changed to year 2030, the analysis of year 2020 is still the year with highest emissions and provides a more conservative estimate of PM concentrations for decision making. Vehicular emission rates projected by the MOVES2014a model would be greatest in earlier years, and outweigh the projected growth in traffic volumes for later analysis years (2030 and 2050). The analysis was performed both without the Project (the No Build Alternative) and with the Project (either of the Build Alternatives).
5 USEPA. Emission Adjustments for Temperature, Humidity, Air Conditioning, and Inspection and Maintenance for On-road Vehicles in MOVES2014. EPA420R14012.
6 USEPA. User’s Guide to CAL3QHC, A Modeling Methodology for Predicted Pollutant Concentrations Near Roadway Intersections. EPA454R92006.

Appendix G: Air Quality
G-8
ANALYSIS SITES
Intersections in the project area where traffic data were developed, as described in Chapter 5, Transportation and Engineering Considerations, were reviewed for the PM microscale analysis for operational effects based on locations of high volumes, high traffic increments between No Build and each alternative, the greatest decrease in average travel speeds, and proximity to sensitive receptors. The traffic volumes for the AM and PM periods were reviewed and intersections with high volumes were identified. Of those intersections, four were selected for the microscale analysis (see Table G-2). The potential effects from vehicle emissions of PM10 and PM2.5 were analyzed at each site.
Table G-2
PM Microscale Analysis Sites (Operational Effects) Analysis Site Location Alternatives Analyzed
1 Crouse Avenue and Erie Boulevard No Build, Viaduct, and Community Grid
2 West Street and Erie Boulevard No Build, Viaduct, and Community Grid
3 Almond Street and Harrison Street No Build, Viaduct, and Community Grid
4 State Street and Erie Boulevard No Build and Community Grid
RECEPTOR PLACEMENT
Multiple receptors where the highest pollutant concentrations are expected were modeled at each of the selected sites. Receptors were placed along the approach and departure links and roadway segments at 7.6-meter intervals within approximately 23 meters of the intersections, and at 25-meter intervals along the remainder of the roadway links in the modeled extents (see Figures G-1 through G-11). Due to the presence of elevated roadways, receptors were also placed at elevated residential locations.
REGIONAL (MESOSCALE) ASSESSMENT
Mesoscale emissions were evaluated for the No Build, Viaduct, and Community Grid Alternatives.
The emissions were estimated using the projected vehicle miles traveled (VMT) reported in Chapter 5, Transportation and Engineering Considerations. Emission factors in grams per mile for criteria pollutants on both restricted roadways (i.e., expressways, freeways, and interstates) and unrestricted roadways (local roads) were obtained using the MOVES2014a model. Emission factors obtained from the MOVES2014a model for Onondaga County were calculated on a county level scale and summarized by vehicle type and speed for running exhaust (for engine and crankcase), brakewear, tirewear, evaporative permeation, evaporative fuel vapor venting, and evaporative fuel leaks where appropriate by pollutant. The average vehicle speeds and vehicle classifications for the AM and PM peak periods projected in the regional transportation analysis described in Chapter 5, Transportation and Engineering Considerations, were used to calculate emission factors along individual roadway segments.
Daily emissions were developed by multiplying the average projected daily traffic volumes of individual segments in the modeled area by the length of each modeled segment and the calculated emission factors. Regional emissions associated with the Project were then projected as the summation of all roadway emissions within the study area.
CONSTRUCTION EFFECTS ASSESSMENT

Figure G-1 Source & Receptor Diagram—No Build Alternative
Crouse Avenue & Erie Boulevard

Figure G-2 Source & Receptor Diagram—Viaduct Alternative
Crouse Avenue & Erie Boulevard

Figure G-3 Source & Receptor Diagram—Community Grid Alternative
Crouse Avenue & Erie Boulevard

Figure G-4 Source & Receptor Diagram—No Build Alternative
West Street & Genesee Street

Figure G-5 Source & Receptor Diagram—Viaduct Alternative
West Street & Genesee Street

Figure G-6 Source & Receptor Diagram—Community Grid Alternative
West Street & Genesee Street

Figure G-7 Source & Receptor Diagram—No Build Alternative
Almond Street & Harrison Street

Figure G-8 Source & Receptor Diagram—Viaduct Alternative
Almond Street & Harrison Street

Figure G-9 Source & Receptor Diagram—Community Grid Alternative
Almond Street & Harrison Street

Figure G-10 Source & Receptor Diagram—No Build Alternative
State Street & Erie Boulevard
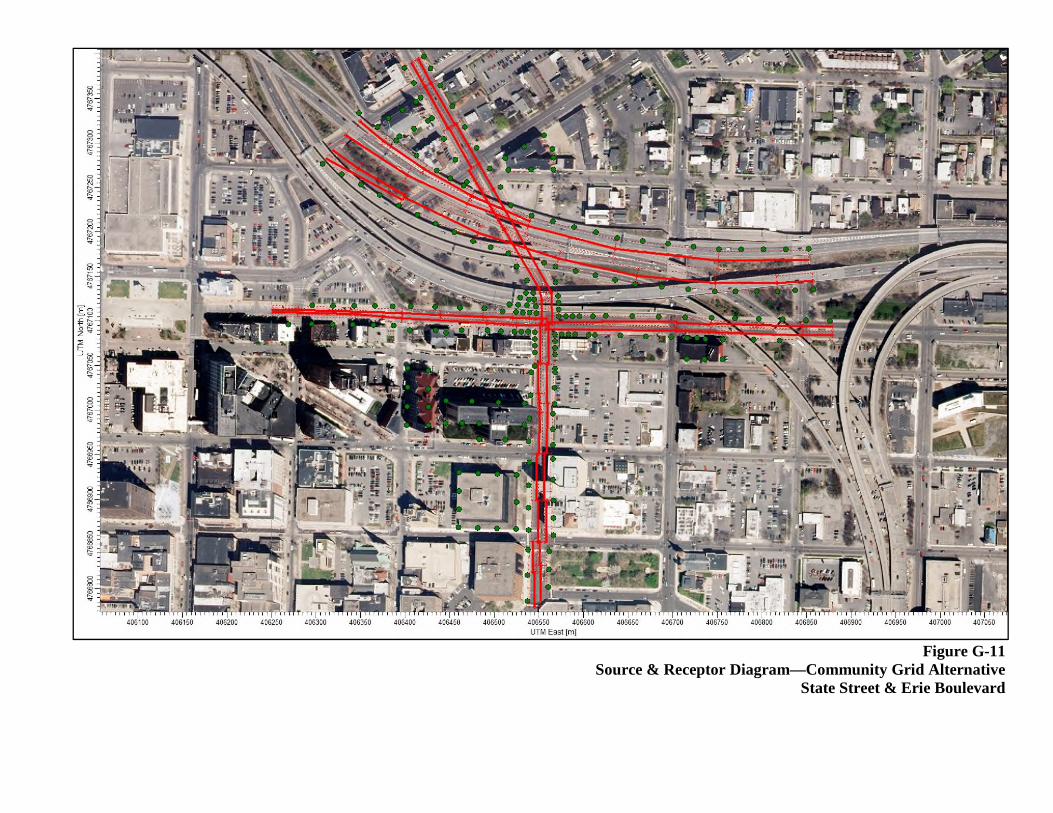
Figure G-11 Source & Receptor Diagram—Community Grid Alternative
State Street & Erie Boulevard

Appendix G: Air Quality
G-9
Emissions from on-site construction equipment, on-road construction-related vehicles, diverted traffic during construction, and dust-generating construction activities have the potential to affect air quality. In general, much of the heavy equipment used in construction is powered by diesel engines that have the potential to produce relatively high PM emissions. Fugitive dust generated by construction activities is also a source of PM. Gasoline engines produce relatively high levels of CO. Since USEPA mandates the use of ultra-low sulfur diesel (ULSD) fuel for all highway and non-road diesel engines, SOx emitted from the Project’s construction activities would be negligible. Therefore, the pollutants to be analyzed for the construction period are PM10, PM2.5, and CO. The analysis of potential construction air quality effects includes both on-site and on-road sources of air emissions, where applicable.
ON-SITE CONSTRUCTION ACTIVITY ASSESSMENT
The Martin Luther King, Jr. East (MLK, Jr. East) area was selected for the on-site air quality analysis because of the proximity of construction activities to a number of sensitive receptor locations there, including the Dr. King Elementary School, the State University of New York College of Environmental Science and Forestry, the Tucker Missionary Baptist Church, and several residential buildings (see Figure G-12. This location represents a reasonable-worst case scenario for the analysis. The dispersion analysis included modeling of the worst-case annual and short-term (i.e., 24-hour, 8-hour, and 1-hour) averaging periods. Other areas in the project corridor were not modeled but are discussed qualitatively, based on the reasonable worst-case analysis results.
Engine Emissions
The sizes, types, and number of units of construction equipment were estimated based on the construction activity schedule developed for the Project (see Chapter 4, Construction Means and Methods). Emission factors for CO, PM10, and PM2.5 from on-site construction engines were developed using USEPA’s NONROAD2008 emission model (NONROAD).7 Emission rates from truck engines were developed using the MOVES2014a emission model. Emission rates for the daily and annual periods were estimated by multiplying peak emissions factors by daily and annual usage factors.
On-Site Fugitive Dust
In addition to engine emissions, fugitive dust emissions from operations (e.g., excavation and transferring of excavated materials into dump trucks) were calculated based on USEPA procedures in AP-42 Table 13.2.3-1.8 In accordance with the NYSDOT Engineering Instruction 17-006, §107-11 Air Quality Protection, a dust control plan would be implemented during the construction of the project. Measures that could be included in a dust control plan include requiring trucks that are hauling loose material to be equipped with tight-fitting tailgates and have their loads securely covered prior to leaving the project site; and the use of water sprays for demolition, excavation, and transfer of soils to ensure that materials would be dampened as necessary to avoid the suspension of dust into the air. These measures would effectively reduce PM emissions from dust-generating construction activities.
7 https://www.epa.gov/moves/nonroad-model-nonroad-engines-equipment-and-vehicles – “NONROAD2008 has been incorporated into MOVES2014 and MOVES2014a. USEPA recommends using MOVES2014a if you are having problems installing or using NONROAD2008 on newer operating systems.”
8 EPA Compilation of Air Pollutant Emission Factors, AP-42, Fifth Edition, Volume I: Stationary Point and Area Sources, Section 1.3, Table 1.3-1.

Figure G-12 Source & Receptor Diagram—Construction

Appendix G: Air Quality
G-10
Dispersion Modeling
Potential effects from construction sources were evaluated using the USEPA/AMS AERMOD dispersion model. AERMOD is a state-of-the-art dispersion model, applicable to rural and urban areas, flat and complex terrain, surface and elevated releases, and multiple sources (including point, area, and volume sources). AERMOD is a steady-state plume model that incorporates current concepts about flow and dispersion in complex terrain and includes updated treatments of the boundary layer theory, understanding of turbulence and dispersion, and handling of terrain interactions.
Source Simulation
As discussed above, the MLK, Jr. East area was selected for the on-site air quality analysis because of the proximity of construction activities to several sensitive receptor locations. For short-term model scenarios (predicting concentration averages for periods of 24 hours or less), all stationary sources, such as cranes or concrete trucks, which idle in a single location while unloading, were simulated as point sources. Other engines, such as excavators that move around the site on any given day, were simulated as area sources. For periods of eight hours or less (less than the length of a shift), it was assumed that all engines would be active simultaneously. All sources would move around the site throughout the year and were therefore simulated as area sources in the annual analysis. Sources were assumed to be operating during a typical 8-hour construction workday (i.e., from 7 AM to 3 PM) and 5 days per week in the dispersion model, consistent with the assumption presented in Chapter 4, Construction Means and Methods.
Background Concentrations
To estimate the maximum expected total pollutant concentrations, the calculated concentrations from the emission sources were added to a background value that accounts for existing pollutant concentrations from other sources. The background levels are based on concentrations monitored at the nearest ambient air monitoring stations (see Table G-3).
Table G-3
Representative Monitored Ambient Air Quality Data Pollutant Location Averaging Period Concentration
PM2.5 East Syracuse, Onondaga 24-hour 14.3 µg/m3
Annual 6.1 µg/m3
PM10 Rochester 2, Monroe 24-hour 36.5 µg/m3
PM2.5 Rochester Near Road, Monroe 1-hour 1.5 ppm
8-hour 0.7 ppm
Source: NYSDEC, New York State Ambient Air Quality Report (2012–2016).
Meteorological Data
The meteorological data set consisted of five consecutive years of latest available meteorological data: surface data collected at the nearest representative National Weather Service Station (Syracuse Hancock International Airport) from 2011 to 2015 and concurrent upper air data collected at Albany, NY, the nearest upper air monitoring station. The meteorological data provide hour-by-hour wind speeds and directions, stability states, and temperature inversion elevation over the five-year period. These data were processed using the USEPA AERMET program to develop data in a format that could be readily processed by the AERMOD model.

Appendix G: Air Quality
G-11
Receptor Locations
Receptors were placed at locations that would be publicly accessible, at residential and other sensitive uses, such as schools, at both a ground-level pedestrian height of 1.8 meters, and elevated locations at a height of 6.1 meters (e.g., windows of residences) with a minimum distance of 2.1 meters from emission sources (i.e., roadways and areas of construction) at each analysis location. In addition, a ground-level receptor grid extending one kilometer from the construction sources was established.
Analysis Year
The highest emissions were predicted for 2018 when demolition, superstructure, and earthworks activities would overlap and that there would be an increasing percentage of in-use newer and cleaner vehicles and engines for construction in future years.
CONSTRUCTION-RELATED TRAFFIC DIVERSIONS
During construction of the Project, various connectors and ramps are expected to be closed at times. A shift in the traveling pattern due to temporary ramp and highway closures would increase traffic volumes at some local intersections, potentially increasing pollutant concentrations at those locations. Therefore, microscale analyses were performed to assess the effect of the traffic diversion on air quality.
Potential air quality effects associated with the traffic diversions that are expected to occur during construction activities were analyzed for PM10 and PM2.5 at MLK, Jr. East at the southbound I-81 on-ramp and MLK, Jr. East at the northbound I-81 off-ramp due the highest projected volume increase expected at this ramp location (see Figure G-12. The proximity to sensitive receptors at this location was also considered. Traffic diversions were analyzed for Phase 3 (see Chapter 4, Construction Means and Methods), during the closure of I-81 between MLK, Jr. East and Butternut Street. Additionally, construction activities would generate both worker automobile trips and construction truck trips.
COMBINED IMPACT
Since emissions from both on-site construction equipment and construction-related traffic diversion may contribute to concentrations concurrently at the same location, the combined effect was assessed where applicable. Roadway links were added to the construction AERMOD dispersion model alongside the on-site construction sources. Traffic conditions, volumes, and roadway locations from the mobile source analysis of construction-related traffic diversions were used for the combined modeling and were assumed to occur throughout the construction period.
D. EXISTING CONDITIONS
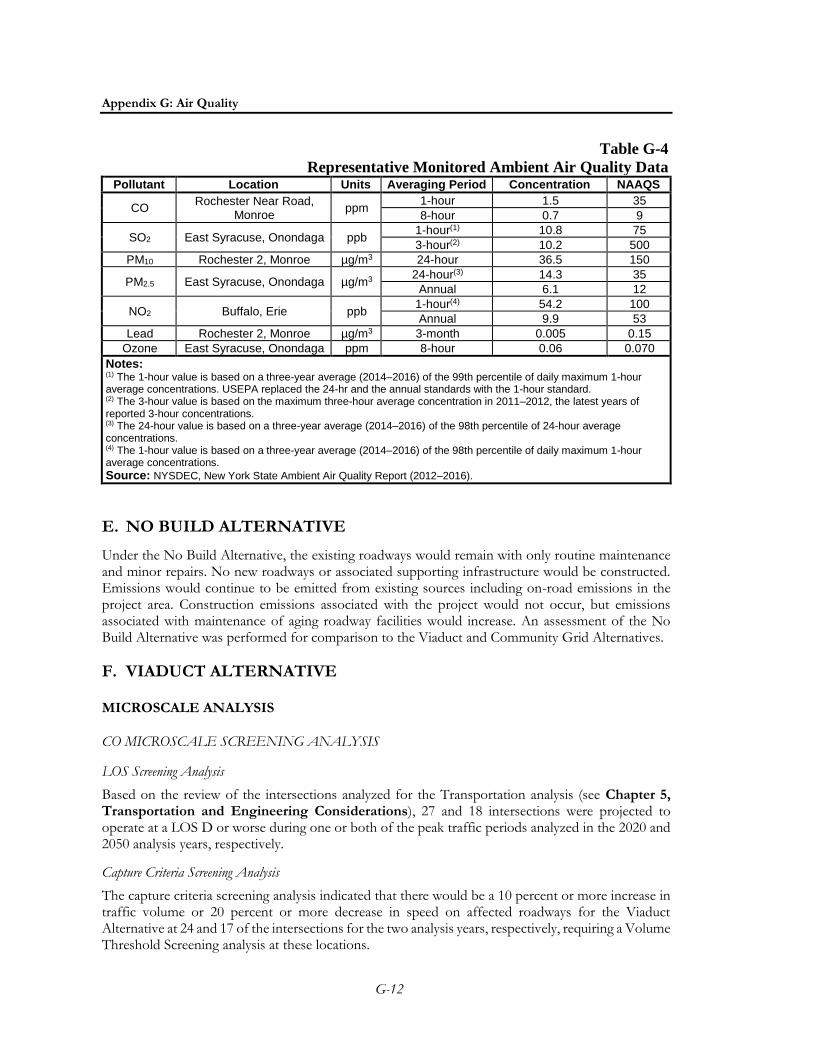
Pollutant levels measured at area monitoring stations are used to characterize existing conditions. Concentrations of relevant regulated pollutants at monitoring stations closest to the project area are shown in Table G-4. These values are the most recent data available at the time the analyses for this Project were undertaken, and are consistent with the background conditions used in the future conditions analyses (see below). As shown in the table, the monitored levels do not exceed the NAAQS.
Appendix G: Air Quality
G-12
Table G-4
Representative Monitored Ambient Air Quality Data Pollutant Location Units Averaging Period Concentration NAAQS
CO Rochester Near Road,
Monroe ppm
1-hour 1.5 35
8-hour 0.7 9
SO2 East Syracuse, Onondaga ppb 1-hour(1) 10.8 75
3-hour(2) 10.2 500
PM10 Rochester 2, Monroe µg/m3 24-hour 36.5 150
PM2.5 East Syracuse, Onondaga µg/m3 24-hour(3) 14.3 35
Annual 6.1 12
NO2 Buffalo, Erie ppb 1-hour(4) 54.2 100
Annual 9.9 53
Lead Rochester 2, Monroe µg/m3 3-month 0.005 0.15
Ozone East Syracuse, Onondaga ppm 8-hour 0.06 0.070
Notes: (1) The 1-hour value is based on a three-year average (2014–2016) of the 99th percentile of daily maximum 1-hour average concentrations. USEPA replaced the 24-hr and the annual standards with the 1-hour standard. (2) The 3-hour value is based on the maximum three-hour average concentration in 2011–2012, the latest years of reported 3-hour concentrations. (3) The 24-hour value is based on a three-year average (2014–2016) of the 98th percentile of 24-hour average concentrations. (4) The 1-hour value is based on a three-year average (2014–2016) of the 98th percentile of daily maximum 1-hour average concentrations.
Source: NYSDEC, New York State Ambient Air Quality Report (2012–2016).
E. NO BUILD ALTERNATIVE
Under the No Build Alternative, the existing roadways would remain with only routine maintenance and minor repairs. No new roadways or associated supporting infrastructure would be constructed. Emissions would continue to be emitted from existing sources including on-road emissions in the project area. Construction emissions associated with the project would not occur, but emissions associated with maintenance of aging roadway facilities would increase. An assessment of the No Build Alternative was performed for comparison to the Viaduct and Community Grid Alternatives.
F. VIADUCT ALTERNATIVE
MICROSCALE ANALYSIS
CO MICROSCALE SCREENING ANALYSIS
LOS Screening Analysis
Based on the review of the intersections analyzed for the Transportation analysis (see Chapter 5, Transportation and Engineering Considerations), 27 and 18 intersections were projected to operate at a LOS D or worse during one or both of the peak traffic periods analyzed in the 2020 and 2050 analysis years, respectively.
Capture Criteria Screening Analysis
The capture criteria screening analysis indicated that there would be a 10 percent or more increase in traffic volume or 20 percent or more decrease in speed on affected roadways for the Viaduct Alternative at 24 and 17 of the intersections for the two analysis years, respectively, requiring a Volume Threshold Screening analysis at these locations.

Appendix G: Air Quality
G-13
Volume Threshold Screening
The results of the LOS screening, capture criteria, and volume threshold screening analyses are included as an attachment to this appendix. The highest Build peak hour traffic volume at these locations was projected to be 1,807 at the northbound approach of Almond Street and Harrison Street, which is below the Volume Threshold criteria of 3,800 vehicles in the peak hour. This was determined by comparing the associated emission factor of 8.65 grams per mile (cruise emission factor) and 9.77 grams per hour (idle emission factor), developed from MOVES2014a based on speed and vehicle mix, to Table 3C of the TEM. Therefore, a CO microscale dispersion modeling was not warranted for all of the intersections for the Viaduct Alternative. The Viaduct Alternative would not increase traffic volumes, reduce source-receptor distances, or change other existing conditions to such a degree as to jeopardize attainment of the CO NAAQS.
PARTICULATE MATTER (PM) MICROSCALE ANALYSIS
PM concentrations for the critical analysis year 2020 would be below the NAAQS at all analysis sites. Due to improved speeds at Site 1, the maximum concentration at this site is projected to decrease when compared with the No Build Alternative.
Table G-5
PM2.5 and PM10 Maximum Predicted Concentrations at Analysis Sites (µg/m3)
Analysis Site Pollutant Averaging
Period No Build Total Concentration
Viaduct Alternative Total Concentration NAAQS
Site 1: Crouse Avenue and Burnet Avenue to Crouse
Avenue and Erie Boulevard
PM10 24-Hour 46.4 43.5 150
PM2.5 24-Hour 16.0 15.6 35
Annual 6.7 6.6 12
Site 2: N. West Street and W. Genesee Street
PM10 24-Hour 45.3 45.6 150
PM2.5 24-Hour 15.6 16.0 35
Annual 6.6 6.6 12
Site 3: Almond Street and Harrison Street
PM10 24-Hour 81.5 92.7 150
PM2.5 24-Hour 18.2 19.2 35
Annual 7.3 8.1 12
Notes: PM10 background concentration, 36.5 µg/m3, was based on 2014–2016 data at the Rochester 2 monitoring station. PM2.5 background concentrations for 24-hour and annual PM2.5 (14.3 and 6.1 µg/m3, respectively) were based on 2014–
2016 data at the East Syracuse monitoring station.
MESOSCALE ANALYSIS
A mesoscale emissions analysis for CO, VOC, NOx, and PM was conducted in accordance with TEM using the USEPA mobile source emissions model, MOVES2014a, and the results of the regional traffic modeling conducted for the Viaduct Alternative. The study area used for the regional traffic modeling, which includes a network of interstate segments, ramp connections, and intersections that span the county and incorporate planned transportation projects in the No Build Alternative and the Viaduct Alternative, was used as the study area for the mesoscale analysis (see Chapter 5, Transportation and Engineering Considerations for traffic information). The mesoscale analysis was conducted for the analysis years 2020, 2030, and 2050, respectively. Year 2020 was the year of estimated time completion when the analysis was started a few years ago. However, due to schedule changes, the estimated time of completion is projected to be 2030. Nevertheless, the analysis of years 2020, 2030, and 2050 still provides adequate emission trends. The mesoscale analysis used estimated annual vehicle miles traveled (VMT) by vehicle type and speed-based emission rates by link that were specific to each alternative.
Appendix G: Air Quality
G-14
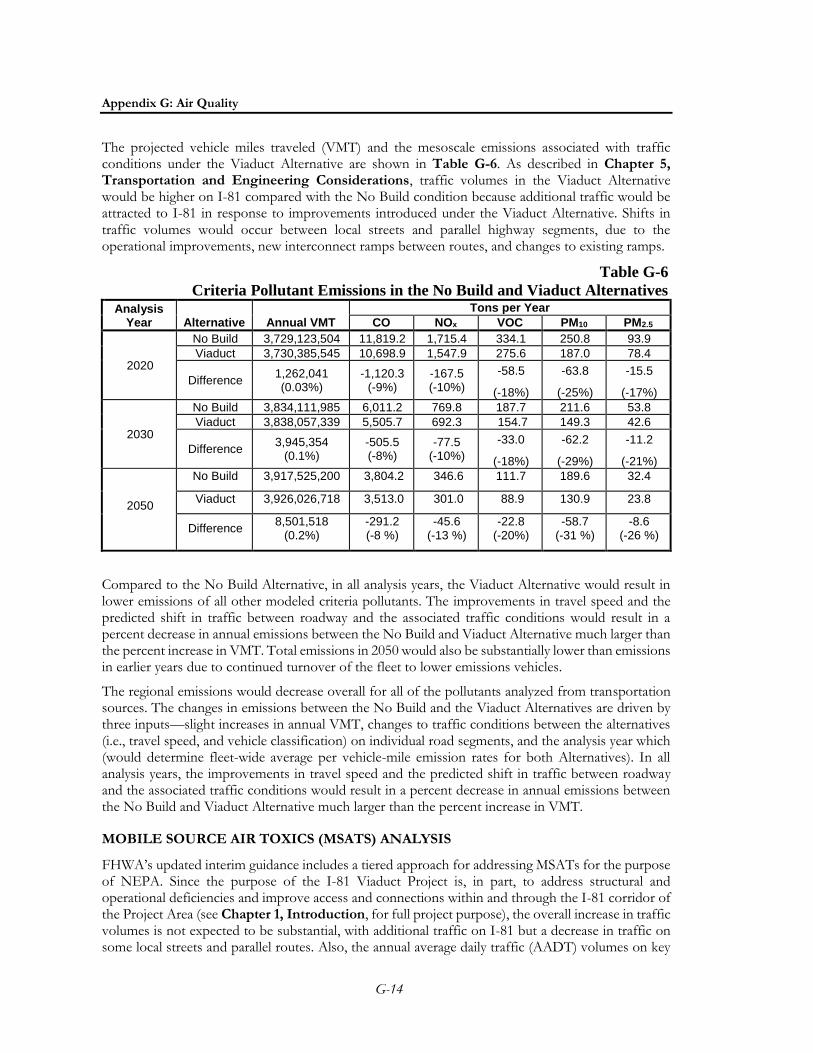
The projected vehicle miles traveled (VMT) and the mesoscale emissions associated with traffic conditions under the Viaduct Alternative are shown in Table G-6. As described in Chapter 5, Transportation and Engineering Considerations, traffic volumes in the Viaduct Alternative would be higher on I-81 compared with the No Build condition because additional traffic would be attracted to I-81 in response to improvements introduced under the Viaduct Alternative. Shifts in traffic volumes would occur between local streets and parallel highway segments, due to the operational improvements, new interconnect ramps between routes, and changes to existing ramps.
Table G-6
Criteria Pollutant Emissions in the No Build and Viaduct Alternatives Analysis
Year Alternative Annual VMT
Tons per Year
CO NOx VOC PM10 PM2.5
2020
No Build 3,729,123,504 11,819.2 1,715.4 334.1 250.8 93.9
Viaduct 3,730,385,545 10,698.9 1,547.9 275.6 187.0 78.4
Difference 1,262,041 (0.03%)
-1,120.3 (-9%)
-167.5 (-10%)
-58.5
(-18%)
-63.8
(-25%)
-15.5
(-17%)
2030
No Build 3,834,111,985 6,011.2 769.8 187.7 211.6 53.8
Viaduct 3,838,057,339 5,505.7 692.3 154.7 149.3 42.6
Difference 3,945,354
(0.1%) -505.5 (-8%)
-77.5 (-10%)
-33.0
(-18%)
-62.2
(-29%)
-11.2
(-21%)
2050
No Build 3,917,525,200 3,804.2 346.6 111.7 189.6 32.4
Viaduct 3,926,026,718 3,513.0 301.0 88.9 130.9 23.8
Difference 8,501,518
(0.2%) -291.2 (-8 %)
-45.6 (-13 %)
-22.8 (-20%)
-58.7 (-31 %)
-8.6 (-26 %)
Compared to the No Build Alternative, in all analysis years, the Viaduct Alternative would result in lower emissions of all other modeled criteria pollutants. The improvements in travel speed and the predicted shift in traffic between roadway and the associated traffic conditions would result in a percent decrease in annual emissions between the No Build and Viaduct Alternative much larger than the percent increase in VMT. Total emissions in 2050 would also be substantially lower than emissions in earlier years due to continued turnover of the fleet to lower emissions vehicles.
The regional emissions would decrease overall for all of the pollutants analyzed from transportation sources. The changes in emissions between the No Build and the Viaduct Alternatives are driven by three inputs—slight increases in annual VMT, changes to traffic conditions between the alternatives (i.e., travel speed, and vehicle classification) on individual road segments, and the analysis year which (would determine fleet-wide average per vehicle-mile emission rates for both Alternatives). In all analysis years, the improvements in travel speed and the predicted shift in traffic between roadway and the associated traffic conditions would result in a percent decrease in annual emissions between the No Build and Viaduct Alternative much larger than the percent increase in VMT.
MOBILE SOURCE AIR TOXICS (MSATS) ANALYSIS
FHWA’s updated interim guidance includes a tiered approach for addressing MSATs for the purpose of NEPA. Since the purpose of the I-81 Viaduct Project is, in part, to address structural and operational deficiencies and improve access and connections within and through the I-81 corridor of the Project Area (see Chapter 1, Introduction, for full project purpose), the overall increase in traffic volumes is not expected to be substantial, with additional traffic on I-81 but a decrease in traffic on some local streets and parallel routes. Also, the annual average daily traffic (AADT) volumes on key

Appendix G: Air Quality
G-15
routes are projected to be less than 140,000 by the design year under the Viaduct Alternative (see Chapter 5, Transportation and Engineering Considerations). Therefore, a qualitative assessment was conducted for this Project, in accordance with FHWA’s guidance.
MSAT emissions would be proportional to the VMT of the No Build and Viaduct Alternatives for a given year when variables such as fleet mix remain similar for each alternative. Since the estimated VMT under the No Build and Viaduct Alternatives vary by less than 0.1 percent for the analysis year 2020, and by approximately 0.2 percent for the design year 2050, it is expected there would be no appreciable difference in overall MSAT emissions among the alternatives in 2020. In locations where traffic volumes are predicted to increase or where new, expanded, or elevated roadway sections would be located closer to nearby residences, schools, and businesses, there may be localized areas of increased ambient concentrations of MSATs. The Viaduct Alternative would locate roadway segments closer to sensitive receptors adjacent to the segment of southbound I-81 between the entrance ramp from I-690 and Harrison Street when compared to the No Build Alternative. Under both alternatives, overall future MSAT emissions are expected to be substantially lower than under existing conditions due to implementation of USEPA’s vehicle and fuel regulations.
In general, information is incomplete or unavailable to credibly predict the project-specific health impacts due to changes in MSAT emissions. In order to determine the potential for significant adverse impacts, multiple levels of modeling must be performed (emissions, dispersion, exposure, etc.) with each subsequent model building on the predictions and assumptions of the previous model. Furthermore, there are considerable uncertainties associated with the existing estimates of toxicity of the various MSAT, because of factors such as low-dose extrapolation and translation of occupational exposure data to the general population.9 Due to these limitations described, any predicted potential for significant impact is likely to be much smaller than the uncertainties associated with the assumption made to predict the impacts.
CONSTRUCTION EFFECTS
Emissions from on-site construction equipment, on-road construction-related vehicles, diverted traffic during construction, and dust-generating construction activities have the potential to affect air quality. The potential effects of these activities on air quality are discussed in this section.
Construction of the Viaduct Alternative is anticipated to take six years to complete. An analysis was conducted to assess the effects of on-site construction activities on the surrounding community. Based on the CO screening methodologies used for the operational traffic analysis, it was determined that a microscale air quality analysis for CO is not warranted. However, to address concerns expressed from the public regarding PM air quality in the vicinity of I-81 during construction, a microscale detour traffic analysis was conducted. Traffic would be disrupted during the construction period, but detours/diversions are not expected to last more than three weeks in any one location (see Chapter 4, Construction Means and Methods). Therefore, in accordance with the NYSDOT’s TEM, a mesoscale emissions analysis for construction traffic detours/diversions is not warranted.
ON-SITE CONSTRUCTION ACTIVITY
In general, much of the heavy equipment used in construction is powered by diesel engines that have the potential to produce relatively high PM emissions. Fugitive dust generated by construction activities is also a source of PM. In addition, gasoline engines produce relatively high levels of CO.
9 Health Effects Institute. Special Report 16, “https://www.healtheffects.org/publication/mobile-source-air-toxics-critical-review-literature-exposure-and-health-effects”

Appendix G: Air Quality
G-16
Since USEPA mandates the use of ultra-low sulfur diesel (ULSD) fuel for all highway and non-road diesel engines,10 SO2 emitted from the Project’s construction activities would be negligible. Therefore, the three primary air pollutants of concern for construction activities are PM10, PM2.5, and CO.
The Martin Luther King, Jr. East (MLK, Jr. East, formerly East Castle Street) area was selected for the on-site air quality analysis because of the proximity of construction activities to a number of sensitive receptor locations there, including the Dr. King Elementary School, the State University of New York College of Environmental Science and Forestry, the Tucker Missionary Baptist Church, and a number of residential buildings. This location therefore represents a reasonable worst-case scenario for the analysis. The dispersion analysis included modeling of the worst-case annual and short-term (i.e., 24-hour, 8-hour, and 1-hour) averaging periods. Other areas in the Project corridor were not modeled, but are discussed qualitatively, based on the reasonable worst-case analysis results.
The following are the key factors and assumptions used for this analysis:
Engine Emissions: The sizes, types, and number of units of construction equipment were estimated based on the construction activity schedule anticipated for the Project (see Chapter 4, Construction Means and Methods). Emission factors for CO, PM10, and PM2.5 from on-site construction engines were developed using the USEPA NONROAD2008 emission model (NONROAD).11 Emission rates from truck engines were developed using the MOVES2014a emission model.
On-site Fugitive Dust: In addition to engine emissions, fugitive dust emissions from operations (e.g., excavation and transferring of excavated materials into dump trucks) were calculated based on USEPA procedures in AP-42 Table 13.2.3-1.12 In accordance with NYSDOT specifications, it is expected that a dust control plan would be implemented during the construction of the Project. Measures that could be included in a dust control plan include requiring trucks that are hauling loose material to be equipped with tight-fitting tailgates and have their loads securely covered prior to leaving the Project site and the use of water sprays for demolition, excavation, and transfer of soils to ensure that materials would be dampened as necessary to avoid the suspension of dust into the air. These measures would effectively reduce PM emissions from dust-generating construction activities.
Dispersion Modeling: Potential effects from construction sources were evaluated using the USEPA/AMS AERMOD, a refined dispersion model. AERMOD is a state-of-the-art dispersion model, applicable to rural and urban areas, flat and complex terrains, surface and elevated releases, and multiple sources (including point, area, and volume sources). AERMOD is a steady-state plume model that incorporates current concepts about flow and dispersion in complex terrain and includes updated treatments of the boundary layer theory, understanding of turbulence and dispersion, and handling of terrain interactions.
10 USEPA required a major reduction in the sulfur content of diesel fuel intended for use in locomotive, marine, and non-road engines and equipment, including construction equipment. As of 2015, the diesel fuel produced by all large refiners, small refiners, and importers must be ULSD fuel. Levels in non-road diesel fuel are limited to a maximum of 15 parts per million.
11 https://www.epa.gov/moves/nonroad-model-nonroad-engines-equipment-and-vehicles “NONROAD2008 has been incorporated into MOVES2014 and MOVES2014a. USEPA recommends using MOVES2014a if you are having problems installing or using NONROAD2008 on newer operating systems.”
12 USEPA Compilation of Air Pollutant Emission Factors, AP-42, Fifth Edition, Volume I: Stationary Point and Area Sources, Section 1.3, Table 1.3-1.
Appendix G: Air Quality
G-17
Source Simulation: As discussed above, the MLK, Jr. East area was selected for the on-site air quality analysis because of the proximity of construction activities to a number of sensitive receptor locations. For short-term model scenarios (predicting concentration averages for periods of 24 hours or less), all stationary sources, such as cranes and pile hammers, which idle in a single location while unloading, were simulated as point sources. Point sources were conservatively modeled at a single location throughout the year to capture the maximum potential short-term concentrations. Other engines, such as excavators and loaders that would move around the site on any given day, were simulated as area sources. For periods of eight hours or less, it was assumed that all engines would be active simultaneously. All sources are anticipated to move around the site throughout the year and were therefore simulated as area sources in the annual analysis. Sources were assumed to be operating during a typical 8-hour construction workday (i.e., from 7 AM to 3 PM) in the dispersion model, consistent with the assumption presented in Chapter 4, Construction Means and Methods.
Meteorological Data: The meteorological data set consisted of five consecutive years of latest available meteorological data: surface data collected at the nearest representative National Weather Service Station (Syracuse Hancock International Airport) from 2011 to 2015 and concurrent upper air data collected at Albany, NY, the nearest upper air monitoring station. The meteorological data provide hour-by-hour wind speeds and directions, stability states, and temperature inversion elevation over the five-year period. These data were processed using the USEPA AERMET program to develop data in a format that could be readily processed by the AERMOD model.
Background Concentrations: To estimate the maximum expected total pollutant concentrations, the calculated concentrations from the construction emission sources were added to a background value that accounts for existing pollutant concentrations from other sources. The background levels are based on concentrations monitored at the nearest ambient air monitoring stations (see Table G-2).
Receptor Locations: Receptors were placed at locations that would be publicly accessible, at residential and other sensitive uses, such as schools, at both ground-level and elevated locations (e.g., windows of residences). In addition, a ground-level receptor grid extending one kilometer from the construction sources was established.
Analysis Year: The highest emissions were predicted for 2018 when demolition, superstructure, and earthworks activities would overlap. There would be an increasing percentage of in-use newer and cleaner vehicles and engines for construction in future years.
Maximum predicted concentrations (including background) from peak construction activities under the Viaduct Alternative are presented in Table G-7. As shown, total maximum concentrations from the on-site sources are predicted to be lower than the corresponding NAAQS for PM2.5, PM10, and CO. The modeled results for the 2018 analysis year are based on construction activities at the reasonable worst-case location in the MLK, Jr. East area where sensitive receptor locations are near on-site construction activities. Lower concentration increments from construction would be expected at other locations in the study area since activities would generally be located farther away from sensitive receptor locations.

Appendix G: Air Quality
G-18
Table G-7
Maximum Predicted Pollutant Concentrations from
On-Site Construction Activity for the Viaduct Alternative Pollutant Averaging
Period Background Concentration Increment from On-Site
Construction Activity Total NAAQS
PM2.5 24-hour 14.3 μg/m3 4.9 μg/m3 19.2 μg/m3 35 μg/m3
Annual 6.1 μg/m3 0.3 μg/m3 6.4 μg/m3 12 μg/m3
PM10 24-hour 36.5 μg/m3 5.2 μg/m3 41.7 μg/m3 150 μg/m3
CO 1-hour 1.5 ppm 10.5 ppm 12 ppm 35 ppm
8-hour 0.7 ppm 2.6 ppm 3.3 ppm 9 ppm
Notes: PM10 and CO background concentrations were based on 2014–2016 data at the Rochester 2 monitoring station. PM2.5 background concentrations for 24-hour and annual PM2.5 were based on 2014–2016 data at the East Syracuse
monitoring station.
COMBINED EFFECT
Since emissions from both on-site construction equipment and construction-related traffic diversions may contribute to concentrations concurrently at the same location, the combined effect was assessed where applicable. Roadway links were added to the construction AERMOD dispersion model alongside the on-site construction sources. Traffic conditions, volumes, and roadway locations from the mobile source analysis of construction-related traffic diversions were used for the combined modeling and were assumed to occur throughout the construction period.
As presented in Table G-8, total maximum concentrations from the on-site sources and traffic diversions including background concentrations are projected to be lower than the corresponding NAAQS for PM2.5 and PM10. Therefore, construction under the Viaduct Alternative would not be anticipated to result in substantial air quality effects.
Table G-8
Maximum Combined Concentrations from On-Site Construction Activity and
Traffic Diversions during Construction for the Viaduct Alternative (μg/m3)
Pollutant Averaging
Period Background On-Site Construction Activity Contribution1
Mobile Sources Contribution1 Total NAAQS
PM2.5 24-hour 14.3 4.9 1.5 20.7 35
Annual 6.1 0.3 0.4 6.8 12
PM10 24-hour 36.5 5.2 8.8 50.5 150
Notes: 1 The values shown are the contributions that are predicted to occur at the receptor of maximum total concentration. PM10 background concentration, 36.5 µg/m3, was based on 2014–2016 data at the Rochester 2 monitoring station. PM2.5 background concentrations for 24-hour and annual PM2.5 (14.3 and 6.1 µg/m3, respectively) were based on 2014–
2016 data at the East Syracuse monitoring station.

Appendix G: Air Quality
G-19
G. COMMUNITY GRID ALTERNATIVE
MICROSCALE ANALYSIS
CO MICROSCALE SCREENING ANALYSIS
LOS Screening Analysis
Based on the review of the intersections analyzed for the Transportation analysis, 23 and 22 intersections were projected to operate at a LOS D or worse during one or both of the peak traffic periods analyzed in the 2020 and 2050 analysis years, respectively.
Capture Criteria Screening Analysis
The LOS screening analysis indicated that there would be a 10 percent or more increase in traffic volume or a 20 percent or more decrease in speed on affected roadways for the Community Grid Alternative at 23 and 22 of the intersections for the three analysis years, respectively, requiring a Volume Threshold Screening analysis at these locations.
Volume Threshold Screening
The results of the LOS Screening, Capture Criteria, and Volume Threshold screening analyses are included as an attachment to this appendix. The highest peak hour traffic volume at these locations was projected to be 1,387 at the northbound approach of West Street and Westbound I-690 Ramps, which is below the Volume Threshold criteria of 4,000 vehicles in the peak hour This was determined by comparing the associated emission factor of 5.63 grams per mile (cruise emission factor) and 9.77 grams per hour (idle emission factor), developed from MOVES2014a based on speed and vehicle mix, to Table 3C of the TEM. Therefore, a CO microscale dispersion modeling was not warranted for all of the intersections for the Community Grid Alternative. The Community Grid Alternative would not increase traffic volumes, reduce source-receptor distances, or change other existing conditions to such a degree as to jeopardize attainment of the CO NAAQS.
PARTICULATE MATTER (PM) MICROSCALE ANALYSIS
With the Community Grid Alternative, PM concentrations in the critical analysis year of 2020 would be below the NAAQS at all analysis sites. Furthermore, due to the shift in roadway geometry as well as the removal of the I-81 viaduct, concentrations at Site 3 are projected to decrease when compared with the No Build Alternative.

Appendix G: Air Quality
G-20
Table G-9
PM2.5 and PM10 Maximum Predicted Concentrations at Analysis Sites (µg/m3)
Analysis Site Pollutant Averaging
Period
No Build Total
Concentration
Community Grid Alternative
Total Concentration NAAQS
Site 1: Crouse Avenue and Burnet Avenue to Crouse Avenue
and Erie Boulevard
PM10 24-Hour 46.4 47.7 150
PM2.5 24-Hour 16.0 16.7 35
Annual 6.7 7.0 12
Site 2: N. West Street and W. Genesee Street
PM10 24-Hour 45.3 48.6 150
PM2.5 24-Hour 15.6 16.5 35
Annual 6.6 6.7 12
Site 3: Almond Street and Harrison Street
PM10 24-Hour 81.5 59.0 150
PM2.5 24-Hour 18.2 15.6 35
Annual 7.3 6.5 12
Site 4: State Street and Erie Boulevard
PM10 24-Hour 44.7 48.7 150
PM2.5 24-Hour 17.1 16.2 35
Annual 6.9 6.7 12
Notes: PM10 background concentration, 36.5 µg/m3, was based on 2014–2016 data at the Rochester 2 monitoring station. PM2.5 background concentrations for 24-hour and annual PM2.5 (14.3 and 6.1 µg/m3, respectively) were based on 2014–
2016 data at the East Syracuse monitoring station.
MESOSCALE ANALYSIS
A mesoscale emissions analysis for CO, VOC, NOx, and PM was conducted in accordance with the TEM using the USEPA mobile source emissions model, MOVES2014a, and the results of the regional traffic modeling conducted for the Community Grid Alternative. The study area used for the traffic modeling was used as the study area for the mesoscale analysis. This area includes a county-wide network of interstate segments, ramp connections, and intersections that incorporate planned transportation projects in the No Build Alternative and the Community Grid Alternative (see Chapter 5, Transportation and Engineering Considerations for traffic information). The mesoscale analysis was conducted for the analysis years 2020, 2030, and 2050, respectively. Year 2020 was the year of estimated time completion when the analysis was started a few years ago. However, due to schedule changes, the estimated time of completion is projected to be 2030. Nevertheless, the analysis of years 2020, 2030, and 2050 still provides adequate emission trends. The mesoscale analysis used estimated annual VMT by vehicle type and speed-based emission rates by link that were specific to each alternative.
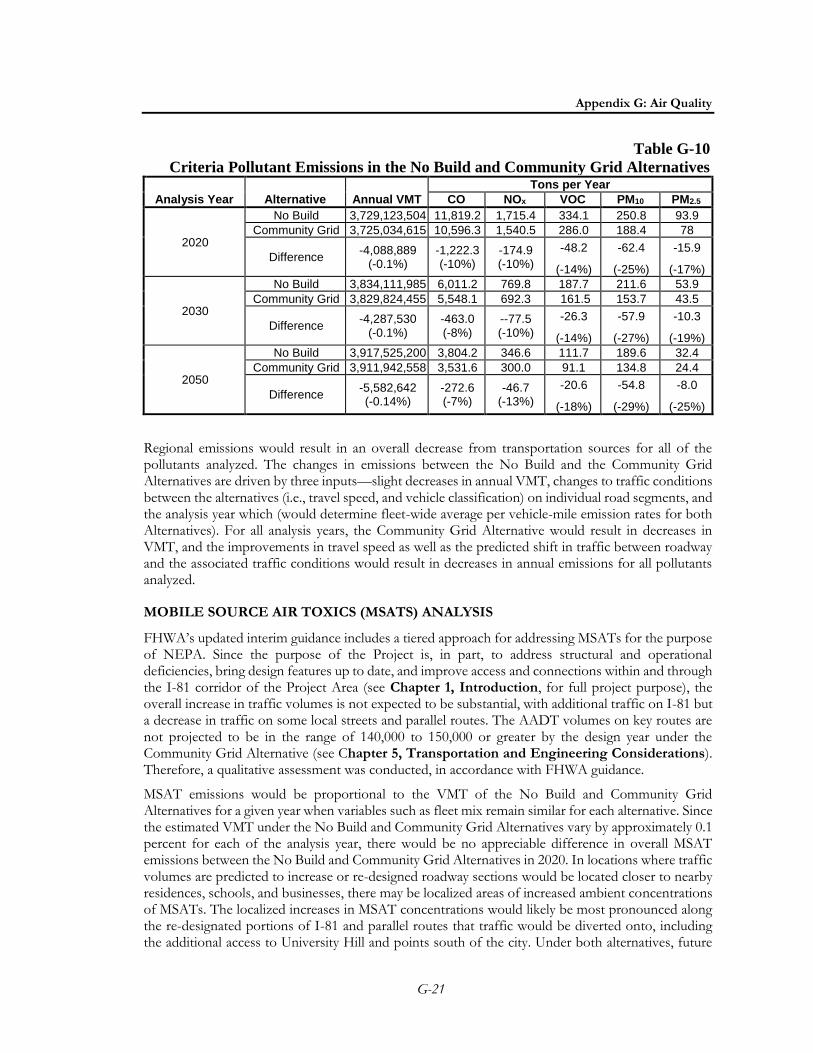
The mesoscale emissions associated with traffic conditions under the Community Grid Alternative are shown in Table G-10. Compared to the No Build Alternative, in all analysis years, the Community Grid Alternative would result in lower emissions of all modeled criteria pollutants. Furthermore, total emissions in 2050 would also be substantially lower than emissions in earlier years due to continued turnover of fleet to lower emissions vehicles.
Appendix G: Air Quality
G-21
Table G-10
Criteria Pollutant Emissions in the No Build and Community Grid Alternatives
Analysis Year Alternative Annual VMT
Tons per Year
CO NOx VOC PM10 PM2.5
2020
No Build 3,729,123,504 11,819.2 1,715.4 334.1 250.8 93.9
Community Grid 3,725,034,615 10,596.3 1,540.5 286.0 188.4 78
Difference -4,088,889
(-0.1%) -1,222.3 (-10%)
-174.9 (-10%)
-48.2
(-14%)
-62.4
(-25%)
-15.9
(-17%)
2030
No Build 3,834,111,985 6,011.2 769.8 187.7 211.6 53.9
Community Grid 3,829,824,455 5,548.1 692.3 161.5 153.7 43.5
Difference -4,287,530
(-0.1%) -463.0 (-8%)
--77.5 (-10%)
-26.3
(-14%)
-57.9
(-27%)
-10.3
(-19%)
2050
No Build 3,917,525,200 3,804.2 346.6 111.7 189.6 32.4
Community Grid 3,911,942,558 3,531.6 300.0 91.1 134.8 24.4
Difference -5,582,642 (-0.14%)
-272.6 (-7%)
-46.7 (-13%)
-20.6
(-18%)
-54.8
(-29%)
-8.0
(-25%)
Regional emissions would result in an overall decrease from transportation sources for all of the pollutants analyzed. The changes in emissions between the No Build and the Community Grid Alternatives are driven by three inputs—slight decreases in annual VMT, changes to traffic conditions between the alternatives (i.e., travel speed, and vehicle classification) on individual road segments, and the analysis year which (would determine fleet-wide average per vehicle-mile emission rates for both Alternatives). For all analysis years, the Community Grid Alternative would result in decreases in VMT, and the improvements in travel speed as well as the predicted shift in traffic between roadway and the associated traffic conditions would result in decreases in annual emissions for all pollutants analyzed.
MOBILE SOURCE AIR TOXICS (MSATS) ANALYSIS
FHWA’s updated interim guidance includes a tiered approach for addressing MSATs for the purpose of NEPA. Since the purpose of the Project is, in part, to address structural and operational deficiencies, bring design features up to date, and improve access and connections within and through the I-81 corridor of the Project Area (see Chapter 1, Introduction, for full project purpose), the overall increase in traffic volumes is not expected to be substantial, with additional traffic on I-81 but a decrease in traffic on some local streets and parallel routes. The AADT volumes on key routes are not projected to be in the range of 140,000 to 150,000 or greater by the design year under the Community Grid Alternative (see Chapter 5, Transportation and Engineering Considerations). Therefore, a qualitative assessment was conducted, in accordance with FHWA guidance.
MSAT emissions would be proportional to the VMT of the No Build and Community Grid Alternatives for a given year when variables such as fleet mix remain similar for each alternative. Since the estimated VMT under the No Build and Community Grid Alternatives vary by approximately 0.1 percent for each of the analysis year, there would be no appreciable difference in overall MSAT emissions between the No Build and Community Grid Alternatives in 2020. In locations where traffic volumes are predicted to increase or re-designed roadway sections would be located closer to nearby residences, schools, and businesses, there may be localized areas of increased ambient concentrations of MSATs. The localized increases in MSAT concentrations would likely be most pronounced along the re-designated portions of I-81 and parallel routes that traffic would be diverted onto, including the additional access to University Hill and points south of the city. Under both alternatives, future

Appendix G: Air Quality
G-22
MSATs are expected to be substantially lower than existing conditions due to implementation of USEPA’s vehicle and fuel regulations.
In general, information is incomplete or unavailable to credibly predict the project-specific health impacts due to changes in MSAT emissions. To determine the potential for adverse impacts, multiple levels of modeling must be performed (emissions, dispersion, exposure, etc.) with each subsequent model building on the predictions and assumptions of the previous model. Furthermore, there are considerable uncertainties associated with the existing estimates of toxicity of the various MSAT, because of factors such as low-dose extrapolation and translation of occupational exposure data to the general population.13 Due to these limitations described, any predicted potential for substantial impact is likely to be much smaller than the uncertainties associated with the assumption made in order to predict the impacts.
CONSTRUCTION EFFECTS
Emissions from on-site construction equipment, on-road construction-related vehicles, diverted traffic during construction, and dust-generating construction activities have the potential to affect air quality. The potential effects of these activities on air quality are discussed in this section.
Construction of the Community Grid Alternative is anticipated to take six years to complete. An analysis was conducted to assess the effects of on-site construction activities on the surrounding community. Based on the CO screening methodologies used for the operational traffic analysis, it was determined that a microscale air quality analysis for CO is not warranted. However, to address concerns expressed from the public regarding PM air quality in the vicinity of I-81 during construction, a microscale detour traffic analysis was conducted. Traffic would be disrupted during the construction period, but detours/diversions are not expected to last more than three weeks in any one location (see Chapter 4, Construction Means and Methods). Therefore, in accordance with the NYSDOT’s TEM, a mesoscale emissions analysis for construction traffic detours/diversions is not warranted.
ON-SITE CONSTRUCTION ACTIVITY
In general, much of the heavy equipment used in construction is powered by diesel engines that have the potential to produce relatively high PM emissions. Fugitive dust generated by construction activities is also a source of PM. In addition, gasoline engines produce relatively high levels of CO. Since USEPA mandates the use of ultra-low sulfur diesel (ULSD) fuel for all highway and non-road diesel engines,14 SO2 emitted from the Project’s construction activities would be negligible. Therefore, the three primary air pollutants of concern for construction activities are PM10, PM2.5, and CO.
The Martin Luther King, Jr. East (MLK, Jr. East, formerly East Castle Street) area was selected for the on-site air quality analysis because of the proximity of construction activities to several sensitive receptor locations there, including the Dr. King Elementary School, the State University of New York
13 USEPA required a major reduction in the sulfur content of diesel fuel intended for use in locomotive, marine, and non-road engines and equipment, including construction equipment. As of 2015, the diesel fuel produced by all large refiners, small refiners, and importers must be ULSD fuel. Levels in non-road diesel fuel are limited to a maximum of 15 parts per million.
14 USEPA required a major reduction in the sulfur content of diesel fuel intended for use in locomotive, marine, and non-road engines and equipment, including construction equipment. As of 2015, the diesel fuel produced by all large refiners, small refiners, and importers must be ULSD fuel. Levels in non-road diesel fuel are limited to a maximum of 15 parts per million.

Appendix G: Air Quality
G-23
College of Environmental Science and Forestry, the Tucker Missionary Baptist Church, and a number of residential buildings. This location therefore represents a reasonable worst-case scenario for the analysis. The dispersion analysis included modeling of the worst-case annual and short-term (i.e., 24-hour, 8-hour, and 1-hour) averaging periods. Other areas in the Project corridor were not modeled, but are discussed qualitatively, based on the reasonable worst-case analysis results.
Maximum predicted concentrations (including background) from peak construction activities under the Community Grid Alternative are presented in Table G-12. As shown, total maximum concentrations from the on-site sources are predicted to be lower than the corresponding NAAQS for PM2.5, PM10, and CO. The modeled results for the 2018 analysis year are based on construction activities at the reasonable worst-case location in the MLK, Jr. East area where sensitive receptor locations are near on-site construction activities. Lower concentration increments from construction would be expected at other locations in the study area since activities would generally be located farther away from sensitive receptor locations.
Table G-11
Maximum Predicted Pollutant Concentrations from
On-Site Construction Activity for the Community Grid Alternative
Pollutant Averaging Period Background Concentration Increment from On-Site Construction Activity Total NAAQS
PM2.5 24-hour 14.3 μg/m3 4.1 μg/m3 18.4 μg/m3 35 μg/m3
Annual 6.1 μg/m3 0.2 μg/m3 6.3 μg/m3 12 μg/m3
PM10 24-hour 36.5 μg/m3 4.3 μg/m3 40.8 μg/m3 150 μg/m3
CO 1-hour 1.5 ppm 10.5 ppm 12 ppm 35 ppm
8-hour 0.8 ppm 2.6 ppm 3.4 ppm 9 ppm
Notes: PM10 and CO background concentrations were based on 2014–2016 data at the Rochester 2 monitoring station. PM2.5 background concentrations for 24-hour and annual PM2.5 were based on 2014–2016 data at the East Syracuse
monitoring station.
COMBINED EFFECT
Since emissions from both on-site construction equipment and construction-related traffic diversions may contribute to concentrations concurrently at the same location, the combined effect was assessed where applicable. Roadway links were added to the construction AERMOD dispersion model alongside the on-site construction sources. Traffic conditions, volumes, and roadway locations from the mobile source analysis of construction-related traffic diversions were used for the combined modeling and were assumed to occur throughout the construction period.
As presented in Table G-12, total maximum concentrations from the on-site sources and traffic diversions including background concentrations are projected to be lower than the corresponding NAAQS for PM2.5 and PM10. Therefore, construction under the Viaduct Alternative would not be anticipated to result in substantial air quality effects.

Appendix G: Air Quality
G-24
Table G-12
Maximum Combined Concentrations from On-Site Construction Activity and
Traffic Diversions during Construction for the Community Grid Alternative (μg/m3)
Pollutant Averaging
Period Background On-Site Construction Activity Contribution1
Mobile Sources Contribution1 Total NAAQS
PM2.5 24-hour 14.3 4.1 1.2 19.6 35
Annual 6.1 0.2 0.5 6.8 12
PM10 24-hour 36.5 4.3 9.6 50.4 150
Notes: 1 The values shown are the contributions that are predicted to occur at the receptor of maximum total concentration. PM10 background concentration, 36.5 µg/m3, was based on 2014–2016 data at the Rochester 2 monitoring station. PM2.5 background concentrations for 24-hour and annual PM2.5 (14.3 and 6.1 µg/m3, respectively) were based on 2014–
2016 data at the East Syracuse monitoring station.

Attachments

AM PM AM PM AM PM AM PM AM PM AM PM Speed Cruise EF Idle EFThreshold (TEM
Tables 3b/3c)
Almond St & I-81 South Off-Ramp 991 417 966 155 -3% -63% 8.55 7.82 8.97 8.97 5% 15% - - -
393 459 406 462 3% 1% 6.40 6.73 6.07 6.07 -5% -10% - - -
Almond St & Harrison St 1332 1802 1012 574 -24% -68% 5.47 5.10 1.89 1.89 -66% -63% 1.89 8.65 9.77 3800 Pass
727 1261 576 574 -21% -54% 3.48 2.69 6.95 6.95 100% 159% - - -
1383 881 1383 801 0% -9% 5.87 6.95 5.47 5.47 -7% -21% 5.47 5.63 9.77 4000 Pass
Almond St & E. Adams St 271 428 102 574 -62% 34% 13.93 9.89 15.57 15.57 12% 57% 15.57 3.62 9.77 4000 Pass
936 786 707 607 -24% -23% 4.34 8.06 7.33 7.33 69% -9% - - -
368 680 307 487 -17% -28% 14.34 6.43 8.30 8.30 -42% 29% 8.30 4.12 9.77 4000 Pass
996 336 968 318 -3% -5% 3.23 3.27 3.34 3.34 3% 2% - - -
913 1416 775 574 -15% -59% 3.01 5.46 2.30 2.30 -24% -58% 2.30 8.65 9.77 3800 Pass
Irving Av & NY 92/E. Genesee St 114 212 117 248 3% 17% 9.57 3.91 9.59 9.59 0% 145% 9.59 4.12 9.77 4000 Pass
427 273 379 317 -11% 16% 2.99 2.27 9.36 9.36 213% 313% 9.36 4.12 9.77 4000 Pass
194 58 209 88 8% 52% 5.94 0.54 4.91 4.91 -17% 817% 4.91 5.63 9.77 4000 Pass
304 226 370 438 22% 94% 1.82 0.79 2.10 2.10 15% 166% 2.10 8.65 9.77 3800 Pass
Comstock Av & Stratford St 419 375 491 343 17% -9% 2.86 13.06 6.78 6.78 137% -48% 6.78 5.63 9.77 4000 Pass
41 72 40 73 -2% 1% 19.46 19.08 19.39 19.39 0% 2% - - -
264 473 291 499 10% 5% 17.25 9.33 15.82 15.82 -8% 69% 15.82 3.62 9.77 4000 Pass
27 123 27 121 0% -2% 13.91 13.07 13.89 13.89 0% 6% - - -
S. McBride St & E. Adams St 1006 1522 957 1677 -5% 10% 16.46 19.85 11.92 11.92 -28% -40% 11.92 4.12 9.77 4000 Pass
S. Townsend St & E. Adams St 116 232 99 156 -15% -33% 2.12 1.58 2.54 2.54 20% 61% - - -
604 399 473 486 -22% 22% 6.93 6.56 7.42 7.42 7% 13% 7.42 5.63 9.77 4000 Pass
999 1382 1012 1487 1% 8% 7.50 4.18 6.76 6.76 -10% 62% - - -
S. Salina St & Harrison St and Onondaga St 235 238 205 226 -13% -5% 4.24 3.01 4.48 4.48 6% 49% - - -
269 259 257 256 -4% -1% 2.78 3.20 2.86 2.86 3% -11% - - -
319 619 365 676 14% 9% 8.22 4.96 8.10 8.10 -2% 63% 8.10 4.12 9.77 4000 Pass
301 303 355 279 18% -8% 12.85 19.47 11.78 11.78 -8% -39% 11.78 4.12 9.77 4000 Pass
S. Salina St & E./W. Adams St 420 421 419 415 0% -1% 2.28 2.55 2.37 2.37 4% -7% - - -
23 266 47 277 104% 4% 1.37 3.32 1.28 1.28 -7% -62% 1.28 8.65 9.77 3800 Pass
314 383 342 372 9% -3% 5.03 3.50 5.17 5.17 3% 48% - - -
821 389 768 417 -6% 7% 2.86 7.28 2.88 2.88 1% -60% 2.88 5.63 9.77 4000 Pass
N./S. Franklin St & Erie Blvd W. 201 455 201 344 0% -24% 3.28 6.00 3.26 3.26 -1% -46% 3.26 5.63 9.77 4000 Pass
52 72 292 109 462% 51% 4.75 1.45 5.56 5.56 17% 283% 5.56 5.63 9.77 4000 Pass
637 328 641 320 1% -2% 4.16 18.46 3.48 3.48 -16% -81% 3.48 5.63 9.77 4000 Pass
547 165 522 201 -5% 22% 4.14 9.14 3.94 3.94 -5% -57% 3.94 5.63 9.77 4000 Pass
N. Geddes St & I-690 West Off-Ramp 315 463 213 466 -32% 1% 5.12 6.60 5.11 5.11 0% -23% 5.11 5.63 9.77 4000 Pass
619 707 830 906 34% 28% 11.55 10.25 12.71 12.71 10% 24% 12.71 3.62 9.77 4000 Pass
332 313 278 261 -16% -17% 7.08 9.51 7.33 7.33 3% -23% 7.33 5.63 9.77 4000 Pass
Table 1 - CO Screening Viaduct 2020INTERSECTIONS WITH LOS D OR WORSE IN ANY PEAK PERIOD
Volume Threshold Screening
Pass/FailNo Build 2020 Viaduct 2020
% Change in Volume No Build Speed Build Speed % ChangeVolumes
Analysis Year: 2020
Intersections with LOS D or Worse

AM PM AM PM AM PM AM PM AM PM AM PM Speed Cruise EF Idle EFThreshold (TEM
Tables 3b/3c)
Table 1 - CO Screening Viaduct 2020INTERSECTIONS WITH LOS D OR WORSE IN ANY PEAK PERIOD
Volume Threshold Screening
Pass/FailNo Build 2020 Viaduct 2020
% Change in Volume No Build Speed Build Speed % ChangeVolumes
Analysis Year: 2020
Intersections with LOS D or Worse
N. Geddes St & Wilkinson St 656 649 691 710 5% 9% 24.15 25.58 23.72 23.72 -2% -7% - - -
22 33 21 26 -5% -21% 22.92 22.35 22.84 22.84 0% 2% - - -
394 463 577 644 46% 39% 24.91 29.35 23.35 23.35 -6% -20% 23.35 2.71 9.77 4000 Pass
3 6 3 7 0% 17% 17.41 17.52 17.59 17.59 1% 0% 17.59 3.24 9.77 4000 Pass
N./S. Geddes St & Erie Blvd W. 926 815 958 747 3% -8% 5.18 4.03 4.78 4.78 -8% 19% - - -
291 278 332 280 14% 1% 7.25 8.20 6.99 6.99 -4% -15% 6.99 5.63 9.77 4000 Pass
396 537 561 674 42% 26% 9.86 3.08 11.82 11.82 20% 283% 11.82 4.12 9.77 4000 Pass
441 313 490 302 11% -4% 3.32 3.77 3.10 3.10 -6% -18% 3.10 5.63 9.77 4000 Pass
S. Geddes St & W. Fayette St 999 837 1014 679 2% -19% 4.91 5.87 3.67 3.67 -25% -38% 3.67 5.63 9.77 4000 Pass
922 807 958 738 4% -9% 8.57 9.45 4.92 4.92 -43% -48% 4.92 5.63 9.77 4000 Pass
445 559 688 716 55% 28% 13.44 21.76 12.82 12.82 -5% -41% 12.82 3.62 9.77 4000 Pass
441 334 436 267 -1% -20% 3.92 5.45 8.62 8.62 120% 58% - - -
S. Geddes St & Marcellus St 1042 809 1057 654 1% -19% 27.66 28.31 21.39 21.39 -23% -24% 21.39 3.24 9.77 4000 Pass
12 67 12 69 0% 3% 25.18 24.93 25.34 25.34 1% 2% - - -
723 1125 690 922 -5% -18% 26.60 26.33 30.69 30.69 15% 17% - - -
S. Geddes St & Grand Av/Shonnard St 571 443 597 348 5% -21% 13.58 6.13 13.42 13.42 -1% 119% - - -
811 530 805 534 -1% 1% 15.27 24.69 15.66 15.66 3% -37% 15.66 3.62 9.77 4000 Pass
331 215 242 0 -27% -100% 15.35 15.53 - - - - -
651 1229 598 943 -8% -23% 5.55 8.90 5.31 5.31 -4% -40% 5.31 5.63 9.77 4000 Pass
Midland Av & W. MLK Jr Dr 113 118 108 110 -4% -7% 27.54 27.34 27.48 27.48 0% 1% - - -
66 212 91 263 38% 24% 11.43 8.12 11.13 11.13 -3% 37% 11.13 4.12 9.77 4000 Pass
117 197 104 178 -11% -10% 25.33 8.13 26.73 26.73 6% 229% - - -
Solar St & Hiawatha Blvd W. 1023 1048 802 809 -22% -23% 4.81 13.30 3.18 3.18 -34% -76% 3.18 5.63 9.77 4000 Pass
53 311 46 270 -13% -13% 11.29 3.72 14.11 14.11 25% 280% - - -
607 954 503 860 -17% -10% 4.64 4.73 4.59 4.59 -1% -3% - - -
21 65 24 70 14% 8% 36.91 32.60 36.01 36.01 -2% 10% 36.01 2.41 9.77 4000 Pass
124 392 172 484 39% 23% 6.01 5.15 5.19 5.19 -14% 1% 5.19 5.63 9.77 4000 Pass
Solar St & Bear St 438 435 287 319 -34% -27% 4.13 6.50 4.38 4.38 6% -33% 4.38 5.63 9.77 4000 Pass
51 352 53 342 4% -3% 1.87 3.55 1.92 1.92 3% -46% 1.92 8.65 9.77 3800 Pass
590 687 431 444 -27% -35% 3.68 4.67 4.02 4.02 9% -14% - - -
171 219 232 299 36% 37% 6.18 10.72 5.38 5.38 -13% -50% 5.38 5.63 9.77 4000 Pass
US 11/N. Salina St & Hiawatha Blvd E. 920 1041 670 774 -27% -26% 10.81 4.81 12.09 12.09 12% 151% - - -
17 88 20 85 18% -3% 1.52 1.64 1.63 1.63 8% 0% 1.63 8.65 9.77 3800 Pass
97 276 75 276 -23% 0% 12.00 11.14 14.32 14.32 19% 29% - - -
350 681 342 711 -2% 4% 5.81 2.07 5.61 5.61 -3% 171% - - -
471 516 504 478 7% -7% 10.21 6.04 11.90 11.90 17% 97% - - -
US 11/N. Salina St & NY 298/Court St & Alford St 216 240 294 427 36% 78% 9.13 8.89 8.95 8.95 -2% 1% 8.95 4.12 9.77 4000 Pass

AM PM AM PM AM PM AM PM AM PM AM PM Speed Cruise EF Idle EFThreshold (TEM
Tables 3b/3c)
Table 1 - CO Screening Viaduct 2020INTERSECTIONS WITH LOS D OR WORSE IN ANY PEAK PERIOD
Volume Threshold Screening
Pass/FailNo Build 2020 Viaduct 2020
% Change in Volume No Build Speed Build Speed % ChangeVolumes
Analysis Year: 2020
Intersections with LOS D or Worse
313 560 308 503 -2% -10% 3.91 3.11 4.24 4.24 8% 36% - - -
20 46 21 47 5% 2% 8.14 7.30 7.85 7.85 -4% 8% - - -
249 301 268 331 8% 10% 5.83 5.61 5.87 5.87 1% 5% - - -
311 261 391 329 26% 26% 13.53 13.34 12.73 12.73 -6% -5% 12.73 3.62 9.77 4000 Pass
N. Townsend St & Westbound I-690 offramp 66 181 156 1214 136% 571% 2.04 3.93 2.16 2.16 6% -45% 2.16 8.65 9.77 3800 Pass
1392 605 10.99 13.37 - - 0.00 8.65 9.77 3800 Pass
167 197 488 361 192% 83% 5.21 2.56 3.12 3.12 -40% 22% 3.12 5.63 9.77 4000 Pass
6 7 27.24 27.65 - - 0.00 8.65 9.77 3800 Pass
Park St & Court St 217 285 324 476 49% 67% 10.11 9.77 8.16 8.16 -19% -16% 8.16 4.12 9.77 4000 Pass
70 121 68 114 -3% -6% 17.70 17.42 17.67 17.67 0% 1% - - -
254 322 279 336 10% 4% 24.38 23.42 24.18 24.18 -1% 3% - - -
87 131 87 138 0% 5% 25.94 24.89 26.09 26.09 1% 5% - - -
Teall Av & Erie Blvd E. 163 348 289 350 77% 1% 2.09 2.14 2.63 2.63 26% 22% 2.63 5.63 9.77 4000 Pass
38 30 22 25 -42% -17% 1.23 1.12 1.52 1.52 24% 36% - - -
373 571 323 547 -13% -4% 3.24 2.14 3.47 3.47 7% 62% - - -
502 422 564 523 12% 24% 2.20 1.98 2.53 2.53 15% 28% 2.53 5.63 9.77 4000 Pass
111 227 84 174 -24% -23% 1.75 1.85 4.16 4.16 137% 125% - - -
188 342 146 258 -22% -25% 1.63 1.58 2.96 2.96 82% 87% - - -
Westmoreland Av & Erie Blvd E. 58 140 52 137 -10% -2% 1.53 1.50 1.50 1.50 -2% 0% - - -
13 99 11 103 -15% 4% 3.00 3.08 2.76 2.76 -8% -10% - - -
403 622 356 592 -12% -5% 4.51 4.36 4.69 4.69 4% 8% - - -
147 214 136 218 -7% 2% 7.80 8.54 7.86 7.86 1% -8% - - -
36 113 33 100 -8% -12% 2.96 2.62 2.73 2.73 -8% 4% - - -
231 383 227 369 -2% -4% 2.03 1.93 2.21 2.21 9% 14% - - -
N. Clinton St & Southbound I-81 Ramps 169 157 376 233 122% 48% 23.57 23.81 - - 0.00 8.65 9.77 3800 Pass
358 525 376 407 5% -22% 26.31 30.36 - - - - -
465 650 - - 5.44 5.44 5.44 5.63 9.77 4000 Pass
I-81 South On-Ramp/Genant Dr & Bear St 418 508 254 47 -39% -91% 8.31 4.36 5.50 5.50 -34% 26% 5.50 5.63 9.77 4000 Pass
429 555 85 47 -80% -92% 23.86 21.31 5.05 5.05 -79% -76% 5.05 5.63 9.77 4000 Pass
379 541 411 47 8% -91% 7.69 2.92 4.76 4.76 -38% 63% 4.76 5.63 9.77 4000 Pass
607 644 419 47 -31% -93% 21.29 22.90 30.52 30.52 43% 33% - - -

AM PM AM PM AM PM AM PM AM PM AM PM Speed Cruise EF Idle EFThreshold (TEM
Tables 3b/3c)
Almond St & I-81 South Off-Ramp 949 524 972 527 2% 1% 10.89 5.44 5.50 5.50 -49% 1% 5.50 5.63 9.77 4000 Pass
448 543 421 545 -6% 0% 5.61 12.90 4.07 4.07 -27% -68% 4.07 5.63 9.77 4000 Pass
Almond St & Harrison St 1313 1876 1059 1807 -19% -4% 4.01 8.52 1.72 1.72 -57% -80% 1.72 8.65 9.77 3800 Pass
836 1571 714 451 -15% -71% 4.47 4.49 12.14 12.14 172% 171% - - -
1404 1082 1360 1071 -3% -1% 5.91 6.25 3.33 3.33 -44% -47% 3.33 5.63 9.77 4000 Pass
Almond St & E. Adams St 168 439 250 413 49% -6% 14.85 3.43 7.60 7.60 -49% 122% 7.60 4.12 9.77 4000 Pass
1029 908 749 632 -27% -30% 3.99 9.56 7.12 7.12 78% -26% 7.12 5.63 9.77 4000 Pass
420 816 318 595 -24% -27% 10.53 10.19 6.80 6.80 -35% -33% 6.80 5.63 9.77 4000 Pass
946 406 946 447 0% 10% 3.93 3.29 3.48 3.48 -11% 6% 3.48 5.63 9.77 4000 Pass
990 1452 250 1543 -75% 6% 5.88 3.93 4.63 4.63 -21% 18% 4.63 5.63 9.77 4000 Pass
Walnut Pl & Waverly Av 214 180 212 189 -1% 5% 3.64 1.89 3.56 3.56 -2% 89% - - -
277 369 267 379 -4% 3% 11.10 5.01 11.58 11.58 4% 131% - - -
353 275 332 266 -6% -3% 3.03 1.85 3.07 3.07 1% 66% - - -
Comstock Av & Euclid Av 470 411 456 372 -3% -9% 23.32 13.80 23.60 23.60 1% 71% - - -
394 233 369 204 -6% -12% 14.20 14.05 14.43 14.43 2% 3% - - -
78 293 115 287 47% -2% 2.98 3.99 3.02 3.02 1% -24% 3.02 5.63 9.77 4000 Pass
119 358 119 381 0% 6% 14.97 9.17 14.60 14.60 -2% 59% - - -
Comstock Av & Stratford St 438 393 423 352 -3% -10% 3.88 17.86 4.84 4.84 25% -73% 4.84 5.63 9.77 4000 Pass
41 72 41 71 0% -1% 19.45 19.07 19.43 19.43 0% 2% - - -
276 515 298 523 8% 2% 16.75 5.23 15.87 15.87 -5% 204% - - -
27 121 27 121 0% 0% 13.66 26.27 13.59 13.59 -1% -48% 13.59 3.62 9.77 4000 Pass
N./S. Townsend St & NY 5/Erie Blvd E. 118 371 167 453 42% 22% 5.72 3.07 7.82 7.82 37% 155% 7.82 4.12 9.77 4000 Pass
211 412 544 553 158% 34% 1.69 2.90 1.80 1.80 7% -38% 1.80 8.65 9.77 3800 Pass
1115 584 476 351 -57% -40% 4.59 5.45 2.01 2.01 -56% -63% 2.01 8.65 9.77 3800 Pass
459 592 417 519 -9% -12% 6.29 10.78 7.59 7.59 21% -30% 7.59 4.12 9.77 4000 Pass
US 11/S. State St & E. Washington St 287 399 288 477 0% 20% 6.85 3.18 6.24 6.24 -9% 96% 6.24 5.63 9.77 4000 Pass
196 226 201 198 3% -12% 10.39 8.44 6.36 6.36 -39% -25% 6.36 5.63 9.77 4000 Pass
465 417 469 434 1% 4% 6.92 1.56 4.91 4.91 -29% 214% 4.91 5.63 9.77 4000 Pass
189 220 173 205 -8% -7% 21.03 11.06 19.87 19.87 -6% 80% - - -
US 11/S. State St & E. Fayette St 240 327 237 393 -1% 20% 5.85 1.19 5.83 5.83 0% 389% 5.83 5.63 9.77 4000 Pass
179 229 182 213 2% -7% 1.29 1.90 1.29 1.29 0% -32% 1.29 8.65 9.77 3800 Pass
454 393 447 396 -2% 1% 6.49 1.08 8.54 8.54 31% 690% - - -
403 333 338 327 -16% -2% 11.45 8.38 13.90 13.90 21% 66% - - -
N./S. Geddes St & Erie Blvd W. 944 826 955 846 1% 2% 5.09 4.00 5.87 5.87 15% 47% - - -
250 308 235 326 -6% 6% 7.33 7.13 6.80 6.80 -7% -5% - - -
407 561 596 814 46% 45% 9.66 3.17 9.22 9.22 -5% 191% 9.22 4.12 9.77 4000 Pass
Table 2 - CO Screening Viaduct 2050INTERSECTIONS WITH LOS D OR WORSE IN ANY PEAK PERIOD
No Build Viaduct% Change in Volume No Build Speed Build Speed % Change Volume Threshold Screening
Analysis Year: 2050
Intersections with LOS D or WorsePass/Fail
Volumes

AM PM AM PM AM PM AM PM AM PM AM PM Speed Cruise EF Idle EFThreshold (TEM
Tables 3b/3c)
Table 2 - CO Screening Viaduct 2050INTERSECTIONS WITH LOS D OR WORSE IN ANY PEAK PERIOD
No Build Viaduct% Change in Volume No Build Speed Build Speed % Change Volume Threshold Screening
Analysis Year: 2050
Intersections with LOS D or WorsePass/Fail
Volumes
435 318 505 308 16% -3% 3.22 3.84 3.04 3.04 -6% -21% 3.04 5.63 9.77 4000 Pass
Solar St & Hiawatha Blvd W. 1179 1243 870 862 -26% -31% 8.76 4.66 6.81 6.81 -22% 46% 6.81 5.63 9.77 4000 Pass
99 364 68 298 -31% -18% 12.61 3.72 11.16 11.16 -11% 200% - - -
615 965 545 864 -11% -10% 4.72 3.45 4.47 4.47 -5% 30% - - -
26 81 42 79 62% -2% 35.29 31.60 35.89 35.89 2% 14% 35.89 2.41 9.77 4000 Pass
172 467 204 513 19% 10% 5.07 1.78 4.33 4.33 -15% 143% 4.33 5.63 9.77 4000 Pass
Solar St & Bear St 479 484 310 316 -35% -35% 4.16 10.07 3.40 3.40 -18% -66% 3.40 5.63 9.77 4000 Pass
100 413 98 388 -2% -6% 1.67 3.84 1.29 1.29 -23% -66% 1.29 8.65 9.77 3800 Pass
712 730 489 518 -31% -29% 3.49 6.07 3.94 3.94 13% -35% 3.94 5.63 9.77 4000 Pass
197 282 254 296 29% 5% 5.66 10.54 5.15 5.15 -9% -51% 5.15 5.63 9.77 4000 Pass
US 11/N. Salina St & NY 298/Court St & Alford St 214 232 80 335 -63% 44% 9.08 8.78 9.94 9.94 9% 13% 9.94 4.12 9.77 4000 Pass
293 547 318 546 9% 0% 4.94 3.08 5.05 5.05 2% 64% - - -
20 46 18 46 -10% 0% 7.97 7.25 7.72 7.72 -3% 6% - - -
251 322 258 334 3% 4% 5.89 5.47 5.90 5.90 0% 8% - - -
328 259 414 326 26% 26% 13.12 13.44 12.24 12.24 -7% -9% 12.24 4.12 9.77 4000 Pass
Teall Av & James St 564 711 629 758 12% 7% 3.27 3.88 3.46 3.46 6% -11% 3.46 5.63 9.77 4000 Pass
559 585 555 593 -1% 1% 3.13 2.03 2.96 2.96 -5% 46% - - -
492 529 455 517 -8% -2% 4.22 4.69 4.47 4.47 6% -5% - - -
401 636 399 648 0% 2% 5.39 3.74 5.27 5.27 -2% 41% - - -
Teall Av & Erie Blvd E. 146 413 162 373 11% -10% 2.19 2.14 2.64 2.64 21% 23% 2.64 5.63 9.77 4000 Pass
47 57 47 29 0% -49% 1.24 1.10 1.75 1.75 41% 58% - - -
358 561 357 577 0% 3% 3.40 1.96 3.67 3.67 8% 87% - - -
603 551 616 567 2% 3% 2.48 2.22 2.77 2.77 12% 25% - - -
145 219 88 230 -39% 5% 1.76 1.69 4.60 4.60 161% 173% - - -
196 326 163 380 -17% 17% 1.65 1.57 3.11 3.11 89% 98% 3.11 5.63 9.77 4000 Pass
Westmoreland Av & Erie Blvd E. 58 152 57 152 -2% 0% 1.70 1.57 1.61 1.61 -5% 3% - - -
12 98 12 98 0% 0% 3.52 3.00 2.90 2.90 -18% -3% - - -
397 625 398 608 0% -3% 4.50 4.30 4.56 4.56 1% 6% - - -
144 225 150 226 4% 0% 8.39 8.77 8.51 8.51 1% -3% - - -
46 128 40 133 -13% 4% 2.86 2.32 2.72 2.72 -5% 17% - - -
258 429 228 477 -12% 11% 2.09 2.06 2.30 2.30 10% 12% 2.30 8.65 9.77 3800 Pass
Beech St & Canal St 95 187 119 206 25% 10% 11.17 9.76 10.84 10.84 -3% 11% 10.84 4.12 9.77 4000 Pass
462 224 548 242 19% 8% 17.63 23.82 10.19 10.19 -42% -57% 10.19 4.12 9.77 4000 Pass
128 113 130 104 2% -8% 18.30 18.62 17.67 17.67 -3% -5% - - -
58 156 62 204 7% 31% 20.65 19.84 20.51 20.51 -1% 3% 20.51 3.24 9.77 4000 Pass
West St & Eastbound I-690 Ramps 905 1975 421 1445 -53% -27% 27.89 27.05 18.06 18.06 -35% -33% 18.06 3.24 9.77 4000 Pass

AM PM AM PM AM PM AM PM AM PM AM PM Speed Cruise EF Idle EFThreshold (TEM
Tables 3b/3c)
Table 2 - CO Screening Viaduct 2050INTERSECTIONS WITH LOS D OR WORSE IN ANY PEAK PERIOD
No Build Viaduct% Change in Volume No Build Speed Build Speed % Change Volume Threshold Screening
Analysis Year: 2050
Intersections with LOS D or WorsePass/Fail
Volumes
1336 1541 496 636 -63% -59% 29.10 30.04 6.02 6.02 -79% -80% 6.02 5.63 9.77 4000 Pass
573 107 1086 154 90% 44% 27.42 28.69 4.40 4.40 -84% -85% 4.40 5.63 9.77 4000 Pass

AM PM AM PM AM PM AM PM AM PM AM PM Speed Cruise EF Idle EF
Threshold
(TEM Tables
3b/3c)
Almond St & E. Washington St 89 118 81 67 -84% -85% 20.42 22.34 5.33 6.84 -74% -69% 5.33 5.63 9.77 4000 Pass
181 63 99 117 -89% -100% 15.49 5.50 24.79 20.01 60% 264% - - -
335 306 689 588 -84% -85% 5.95 16.37 11.08 8.95 86% -45% 8.95 4.12 9.77 4000 Pass
233 246 13 21 -89% -100% 4.04 5.33 - - - - -
Almond St & Harrison St 784 2102 542 1152 26.59 24.56 24.07 20.88 -9% -15% 20.88 3.24 9.77 4000 Pass
658 367 892 673 35.48 12.59 8.18 7.70 -77% -39% 7.70 4.12 9.77 4000 Pass
727 1261 504 665 3.48 2.69 22.63 19.86 551% 639% 19.86 3.24 9.77 4000 Pass
48 43 162 283 17.61 22.12 4.31 8.06 -76% -64% 4.31 5.63 9.77 4000 Pass
Almond St/Catherine St & NY 5/Erie Blvd E. 225 260 295 286 -89% -100% 8.31 19.07 6.89 4.79 -17% -75% 4.79 5.63 9.77 4000 Pass
195 197 573 344 -89% -100% 10.64 17.65 12.66 25.79 19% 46% - - -
216 331 468 888 -89% -100% 10.33 6.91 27.78 25.81 169% 273% - - -
386 318 13 21 -89% -100% 26.46 27.85 - - - - -
Comstock Av & Stratford St 347 393 28 123 -89% -100% 2.10 21.49 13.86 12.96 561% -40% 12.96 3.62 9.77 4000 Pass
264 473 83 79 -89% -100% 17.25 9.33 28.01 27.16 62% 191% - - -
89 62 281 509 -89% -100% 27.64 27.40 17.04 6.28 -38% -77% 6.28 5.63 9.77 4000 Pass
41 72 492 473 -89% -100% 19.46 19.08 26.68 23.25 37% 22% - - -
Crouse Av & Westbound I-690 273 379 603 498 -89% -100% 29.01 27.75 3.07 - -89% 3.07 5.63 9.77 4000 Pass
353 342 201 498 -89% -99% 26.27 26.62 2.21 - -92% 2.21 8.65 9.77 3800 Pass
N. Crouse Av & Burnet Av 121 157 150 682 -89% -100% 15.02 11.95 4.00 - -73% 4.00 5.63 9.77 4000 Pass
208 212 207 498 -89% -100% 11.93 9.39 6.85 - -43% 6.85 5.63 9.77 4000 Pass
182 137 85 377 -89% -100% 20.93 14.15 6.44 5.24 -69% -63% 5.24 5.63 9.77 4000 Pass
6 138 300 498 -89% -100% 22.41 21.20 2.07 - -91% 2.07 8.65 9.77 3800 Pass
N. Geddes St & W. Kirkpatrick St 251 421 267 408 -98% 51% 21.39 19.96 23.52 21.18 10% 6% 21.18 3.24 9.77 4000 Pass
228 263 188 216 -98% 51% 4.26 5.41 9.16 7.28 115% 35% 7.28 5.63 9.77 4000 Pass
332 313 467 457 -98% 51% 7.08 9.51 6.97 9.09 -2% -4% 6.97 5.63 9.77 4000 Pass
441 625 407 576 -98% 51% 10.61 9.83 8.43 2.42 -21% -75% 2.42 8.65 9.77 3800 Pass
N./S. Geddes St & Erie Blvd W. 445 559 780 818 -98% 51% 13.44 21.76 12.05 9.55 -10% -56% 9.55 4.12 9.77 4000 Pass
926 815 958 819 -89% -100% 5.18 4.03 4.88 3.87 -6% -4% - - -
291 278 454 319 -98% 51% 7.25 8.20 3.15 3.76 -57% -54% 3.15 5.63 9.77 4000 Pass
800 501 150 205 -98% 51% 21.70 24.18 33.21 30.51 53% 26% 30.51 2.60 9.77 4000 Pass
S. Geddes St & W. Fayette St 445 559 780 818 -98% 51% 13.44 21.76 12.05 9.55 -10% -56% 9.55 4.12 9.77 4000 Pass
922 807 961 809 -98% 51% 8.57 9.45 4.34 6.73 -49% -29% 4.34 5.63 9.77 4000 Pass
474 955 197 833 -98% 51% 8.63 4.95 11.76 12.16 36% 146% 11.76 4.12 9.77 4000 Pass
357 306 341 286 -98% -63% 28.66 21.96 28.39 21.90 -1% 0% - - -
S. Salina St & E./W. Adams St 314 383 413 365 -89% 51% 5.03 3.50 3.55 3.24 -29% -8% 3.24 5.63 9.77 4000 Pass
300 263 413 365 -89% 51% 22.85 24.98 3.55 3.24 -84% -87% 3.24 5.63 9.77 4000 Pass
912 513 90 356 -89% 51% 13.91 5.60 1.45 3.58 -90% -36% 1.45 8.65 9.77 3800 Pass
23 266 920 422 -89% 51% 1.37 3.32 10.29 4.44 650% 34% 4.44 5.63 9.77 4000 Pass
Table 3 - CO Screening Community Grid 2020INTERSECTIONS WITH LOS D OR WORSE IN ANY PEAK PERIOD
Pass/FailAnalysis Year: 2020
Intersections with LOS D or Worse
Volumes
No Build Community Grid% Change in Volume No Build Speed Build Speed % Change Volume Threshold Screening
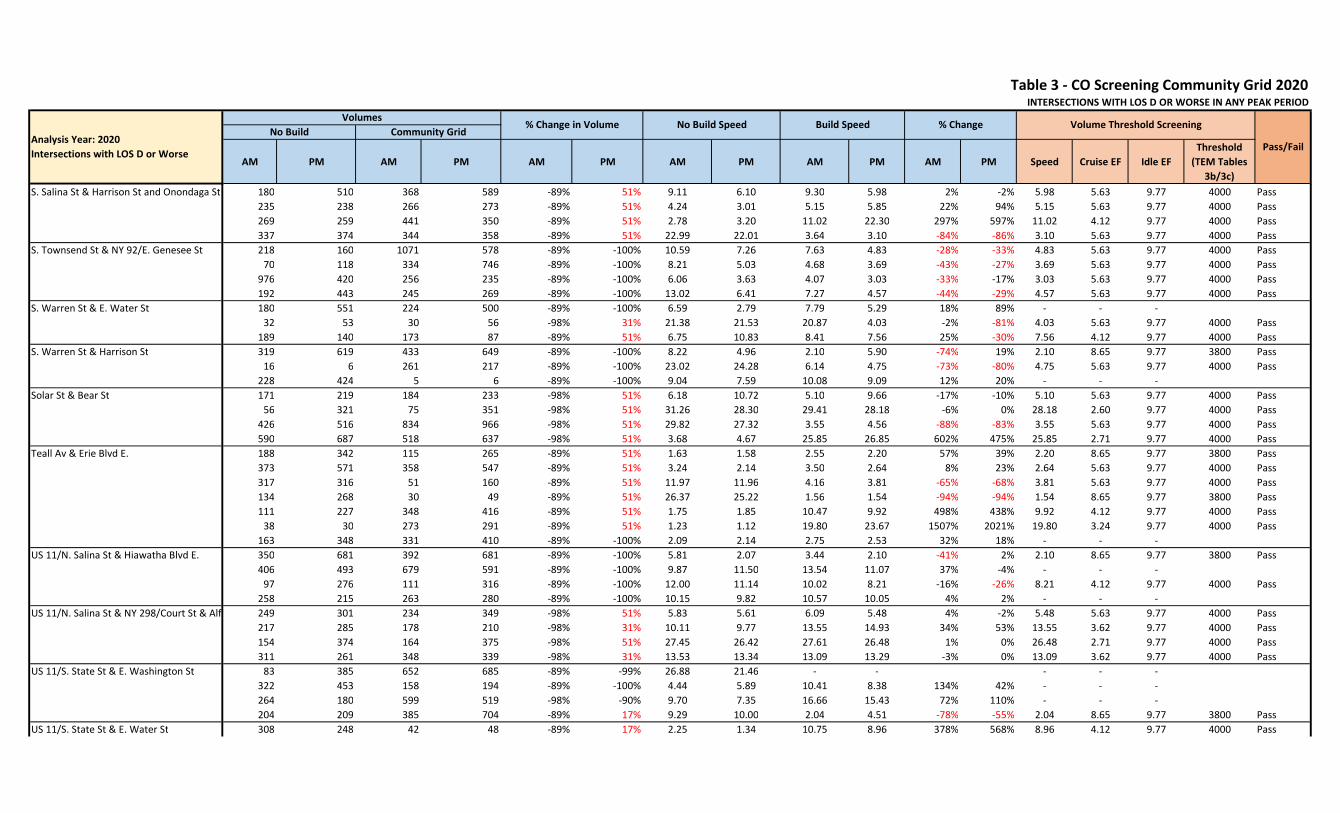
AM PM AM PM AM PM AM PM AM PM AM PM Speed Cruise EF Idle EF
Threshold
(TEM Tables
3b/3c)
Table 3 - CO Screening Community Grid 2020INTERSECTIONS WITH LOS D OR WORSE IN ANY PEAK PERIOD
Pass/FailAnalysis Year: 2020
Intersections with LOS D or Worse
Volumes
No Build Community Grid% Change in Volume No Build Speed Build Speed % Change Volume Threshold Screening
S. Salina St & Harrison St and Onondaga St 180 510 368 589 -89% 51% 9.11 6.10 9.30 5.98 2% -2% 5.98 5.63 9.77 4000 Pass
235 238 266 273 -89% 51% 4.24 3.01 5.15 5.85 22% 94% 5.15 5.63 9.77 4000 Pass
269 259 441 350 -89% 51% 2.78 3.20 11.02 22.30 297% 597% 11.02 4.12 9.77 4000 Pass
337 374 344 358 -89% 51% 22.99 22.01 3.64 3.10 -84% -86% 3.10 5.63 9.77 4000 Pass
S. Townsend St & NY 92/E. Genesee St 218 160 1071 578 -89% -100% 10.59 7.26 7.63 4.83 -28% -33% 4.83 5.63 9.77 4000 Pass
70 118 334 746 -89% -100% 8.21 5.03 4.68 3.69 -43% -27% 3.69 5.63 9.77 4000 Pass
976 420 256 235 -89% -100% 6.06 3.63 4.07 3.03 -33% -17% 3.03 5.63 9.77 4000 Pass
192 443 245 269 -89% -100% 13.02 6.41 7.27 4.57 -44% -29% 4.57 5.63 9.77 4000 Pass
S. Warren St & E. Water St 180 551 224 500 -89% -100% 6.59 2.79 7.79 5.29 18% 89% - - -
32 53 30 56 -98% 31% 21.38 21.53 20.87 4.03 -2% -81% 4.03 5.63 9.77 4000 Pass
189 140 173 87 -89% 51% 6.75 10.83 8.41 7.56 25% -30% 7.56 4.12 9.77 4000 Pass
S. Warren St & Harrison St 319 619 433 649 -89% -100% 8.22 4.96 2.10 5.90 -74% 19% 2.10 8.65 9.77 3800 Pass
16 6 261 217 -89% -100% 23.02 24.28 6.14 4.75 -73% -80% 4.75 5.63 9.77 4000 Pass
228 424 5 6 -89% -100% 9.04 7.59 10.08 9.09 12% 20% - - -
Solar St & Bear St 171 219 184 233 -98% 51% 6.18 10.72 5.10 9.66 -17% -10% 5.10 5.63 9.77 4000 Pass
56 321 75 351 -98% 51% 31.26 28.30 29.41 28.18 -6% 0% 28.18 2.60 9.77 4000 Pass
426 516 834 966 -98% 51% 29.82 27.32 3.55 4.56 -88% -83% 3.55 5.63 9.77 4000 Pass
590 687 518 637 -98% 51% 3.68 4.67 25.85 26.85 602% 475% 25.85 2.71 9.77 4000 Pass
Teall Av & Erie Blvd E. 188 342 115 265 -89% 51% 1.63 1.58 2.55 2.20 57% 39% 2.20 8.65 9.77 3800 Pass
373 571 358 547 -89% 51% 3.24 2.14 3.50 2.64 8% 23% 2.64 5.63 9.77 4000 Pass
317 316 51 160 -89% 51% 11.97 11.96 4.16 3.81 -65% -68% 3.81 5.63 9.77 4000 Pass
134 268 30 49 -89% 51% 26.37 25.22 1.56 1.54 -94% -94% 1.54 8.65 9.77 3800 Pass
111 227 348 416 -89% 51% 1.75 1.85 10.47 9.92 498% 438% 9.92 4.12 9.77 4000 Pass
38 30 273 291 -89% 51% 1.23 1.12 19.80 23.67 1507% 2021% 19.80 3.24 9.77 4000 Pass
163 348 331 410 -89% -100% 2.09 2.14 2.75 2.53 32% 18% - - -
US 11/N. Salina St & Hiawatha Blvd E. 350 681 392 681 -89% -100% 5.81 2.07 3.44 2.10 -41% 2% 2.10 8.65 9.77 3800 Pass
406 493 679 591 -89% -100% 9.87 11.50 13.54 11.07 37% -4% - - -
97 276 111 316 -89% -100% 12.00 11.14 10.02 8.21 -16% -26% 8.21 4.12 9.77 4000 Pass
258 215 263 280 -89% -100% 10.15 9.82 10.57 10.05 4% 2% - - -
US 11/N. Salina St & NY 298/Court St & Alford St 249 301 234 349 -98% 51% 5.83 5.61 6.09 5.48 4% -2% 5.48 5.63 9.77 4000 Pass
217 285 178 210 -98% 31% 10.11 9.77 13.55 14.93 34% 53% 13.55 3.62 9.77 4000 Pass
154 374 164 375 -98% 51% 27.45 26.42 27.61 26.48 1% 0% 26.48 2.71 9.77 4000 Pass
311 261 348 339 -98% 31% 13.53 13.34 13.09 13.29 -3% 0% 13.09 3.62 9.77 4000 Pass
US 11/S. State St & E. Washington St 83 385 652 685 -89% -99% 26.88 21.46 - - - - -
322 453 158 194 -89% -100% 4.44 5.89 10.41 8.38 134% 42% - - -
264 180 599 519 -98% -90% 9.70 7.35 16.66 15.43 72% 110% - - -
204 209 385 704 -89% 17% 9.29 10.00 2.04 4.51 -78% -55% 2.04 8.65 9.77 3800 Pass
US 11/S. State St & E. Water St 308 248 42 48 -89% 17% 2.25 1.34 10.75 8.96 378% 568% 8.96 4.12 9.77 4000 Pass
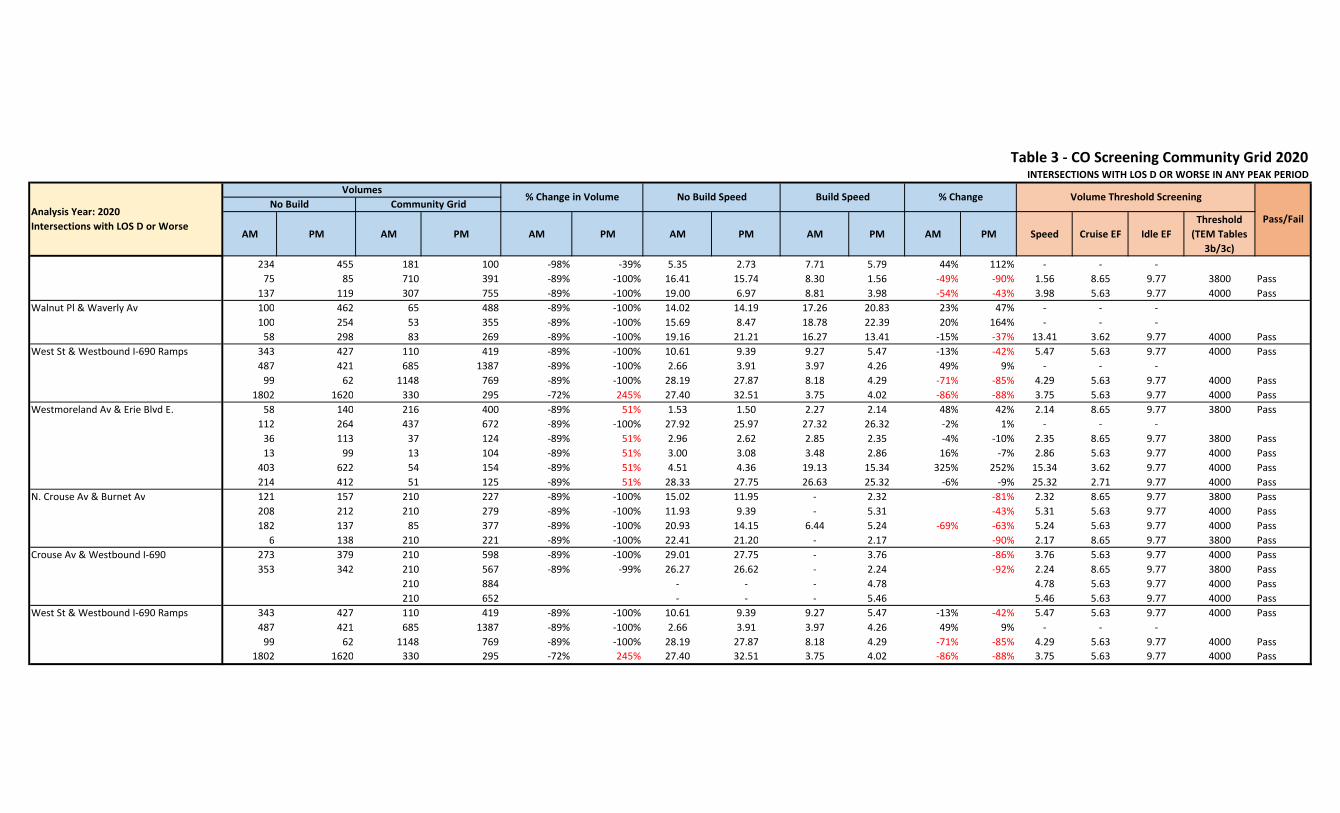
AM PM AM PM AM PM AM PM AM PM AM PM Speed Cruise EF Idle EF
Threshold
(TEM Tables
3b/3c)
Table 3 - CO Screening Community Grid 2020INTERSECTIONS WITH LOS D OR WORSE IN ANY PEAK PERIOD
Pass/FailAnalysis Year: 2020
Intersections with LOS D or Worse
Volumes
No Build Community Grid% Change in Volume No Build Speed Build Speed % Change Volume Threshold Screening
234 455 181 100 -98% -39% 5.35 2.73 7.71 5.79 44% 112% - - -
75 85 710 391 -89% -100% 16.41 15.74 8.30 1.56 -49% -90% 1.56 8.65 9.77 3800 Pass
137 119 307 755 -89% -100% 19.00 6.97 8.81 3.98 -54% -43% 3.98 5.63 9.77 4000 Pass
Walnut Pl & Waverly Av 100 462 65 488 -89% -100% 14.02 14.19 17.26 20.83 23% 47% - - -
100 254 53 355 -89% -100% 15.69 8.47 18.78 22.39 20% 164% - - -
58 298 83 269 -89% -100% 19.16 21.21 16.27 13.41 -15% -37% 13.41 3.62 9.77 4000 Pass
West St & Westbound I-690 Ramps 343 427 110 419 -89% -100% 10.61 9.39 9.27 5.47 -13% -42% 5.47 5.63 9.77 4000 Pass
487 421 685 1387 -89% -100% 2.66 3.91 3.97 4.26 49% 9% - - -
99 62 1148 769 -89% -100% 28.19 27.87 8.18 4.29 -71% -85% 4.29 5.63 9.77 4000 Pass
1802 1620 330 295 -72% 245% 27.40 32.51 3.75 4.02 -86% -88% 3.75 5.63 9.77 4000 Pass
Westmoreland Av & Erie Blvd E. 58 140 216 400 -89% 51% 1.53 1.50 2.27 2.14 48% 42% 2.14 8.65 9.77 3800 Pass
112 264 437 672 -89% -100% 27.92 25.97 27.32 26.32 -2% 1% - - -
36 113 37 124 -89% 51% 2.96 2.62 2.85 2.35 -4% -10% 2.35 8.65 9.77 3800 Pass
13 99 13 104 -89% 51% 3.00 3.08 3.48 2.86 16% -7% 2.86 5.63 9.77 4000 Pass
403 622 54 154 -89% 51% 4.51 4.36 19.13 15.34 325% 252% 15.34 3.62 9.77 4000 Pass
214 412 51 125 -89% 51% 28.33 27.75 26.63 25.32 -6% -9% 25.32 2.71 9.77 4000 Pass
N. Crouse Av & Burnet Av 121 157 210 227 -89% -100% 15.02 11.95 - 2.32 -81% 2.32 8.65 9.77 3800 Pass
208 212 210 279 -89% -100% 11.93 9.39 - 5.31 -43% 5.31 5.63 9.77 4000 Pass
182 137 85 377 -89% -100% 20.93 14.15 6.44 5.24 -69% -63% 5.24 5.63 9.77 4000 Pass
6 138 210 221 -89% -100% 22.41 21.20 - 2.17 -90% 2.17 8.65 9.77 3800 Pass
Crouse Av & Westbound I-690 273 379 210 598 -89% -100% 29.01 27.75 - 3.76 -86% 3.76 5.63 9.77 4000 Pass
353 342 210 567 -89% -99% 26.27 26.62 - 2.24 -92% 2.24 8.65 9.77 3800 Pass
210 884 - - - 4.78 4.78 5.63 9.77 4000 Pass
210 652 - - - 5.46 5.46 5.63 9.77 4000 Pass
West St & Westbound I-690 Ramps 343 427 110 419 -89% -100% 10.61 9.39 9.27 5.47 -13% -42% 5.47 5.63 9.77 4000 Pass
487 421 685 1387 -89% -100% 2.66 3.91 3.97 4.26 49% 9% - - -
99 62 1148 769 -89% -100% 28.19 27.87 8.18 4.29 -71% -85% 4.29 5.63 9.77 4000 Pass
1802 1620 330 295 -72% 245% 27.40 32.51 3.75 4.02 -86% -88% 3.75 5.63 9.77 4000 Pass

AM PM AM PM AM PM AM PM AM PM AM PM Speed Cruise EF Idle EF
Threshold
(TEM
Tables
3b/3c)
Irving Av & Harrison St 370 208 605 600 64% 188% 20.57 25.10 4.66 4.60 -77% -82% 4.60 5.63 9.77 4000 Pass
322 647 41 207 -87% -68% 6.33 3.98 14.64 5.39 131% 36% - - -
368 635 206 629 -44% -1% 3.00 4.07 - 11.60 185% - - -
36 97 206 541 472% 458% 26.38 21.17 - 11.36 -46% 11.36 4.12 9.77 4000 Pass
Irving Av & E. Adams St 864 608 206 473 -76% -22% 8.31 9.54 - 2.55 -73% 2.55 5.63 9.77 4000 Pass
369 205 206 706 -44% 244% 5.33 4.42 - 19.16 334% 19.16 3.24 9.77 4000 Pass
317 633 206 626 -35% -1% 21.67 18.93 - 14.13 -25% 14.13 3.62 9.77 4000 Pass
Irving Av & Waverly Av 305 569 280 999 -8% 76% 10.46 5.65 6.90 5.62 -34% -1% 5.62 5.63 9.77 4000 Pass
196 309 468 237 139% -23% 25.43 25.95 32.12 29.46 26% 14% 29.46 2.60 9.77 4000 Pass
16 17 52 214 225% 1159% 5.84 5.86 2.53 7.43 -57% 27% 2.53 5.63 9.77 4000 Pass
17 17 85 331 400% 1847% 6.29 6.24 27.28 19.56 334% 214% 19.56 3.24 9.77 4000 Pass
139 409 22.56 19.01 - - 0.00 8.65 9.77 3800 Pass
58 183 2.62 5.02 - - 0.00 8.65 9.77 3800 Pass
Comstock Av & NY 92/E. Genesee St 558 405 645 490 16% 21% 11.92 12.22 11.43 12.38 -4% 1% 11.43 4.12 9.77 4000 Pass
147 552 131 542 -11% -2% 25.79 23.58 25.56 23.49 -1% 0% - - -
205 123 250 146 22% 19% 17.69 22.29 17.04 22.23 -4% 0% 17.04 3.62 9.77 4000 Pass
294 383 361 553 23% 44% 17.39 15.62 13.38 6.59 -23% -58% 6.59 5.63 9.77 4000 Pass
Comstock Av & Stratford St 470 411 28 123 -94% -70% 23.32 13.80 13.44 26.40 -42% 91% 13.44 3.62 9.77 4000 Pass
276 515 74 79 -73% -85% 16.75 5.23 27.63 27.61 65% 428% - - -
38 61 285 537 650% 780% 28.06 27.73 17.57 6.47 -37% -77% 6.47 5.63 9.77 4000 Pass
41 72 474 471 1056% 554% 19.45 19.07 27.48 19.87 41% 4% 19.87 3.24 9.77 4000 Pass
S. Townsend St & Harrison St 960 865 724 493 -25% -43% 19.69 14.63 - - - - -
617 441 324 418 -47% -5% 16.67 19.50 17.26 19.92 4% 2% - - -
446 420 507 492 14% 17% 24.63 26.64 14.63 15.41 -41% -42% 14.63 3.62 9.77 4000 Pass
336 487 - - 11.19 12.17 11.19 4.12 9.77 4000 Pass
US 11/S. State St & E. Washington St 477 427 116 214 -76% -50% 20.88 2.08 12.08 9.46 -42% 355% 9.46 4.12 9.77 4000 Pass
287 399 207 170 -28% -57% 6.85 3.18 13.79 11.79 101% 271% - - -
6 0 650 492 10733% - - 4.35 4.47 4.35 5.63 9.77 4000 Pass
196 226 444 687 127% 204% 10.39 8.44 4.65 3.25 -55% -62% 3.25 5.63 9.77 4000 Pass
US 11/S. State St & E. Fayette St 296 413 460 706 55% 71% 24.94 23.32 20.81 10.74 -17% -54% 10.74 4.12 9.77 4000 Pass
454 393 620 464 37% 18% 6.49 1.08 2.68 1.47 -59% 36% 1.47 8.65 9.77 3800 Pass
239 274 243 286 2% 4% 23.05 21.95 23.91 26.08 4% 19% - - -
403 333 354 353 -12% 6% 11.45 8.38 10.83 5.03 -5% -40% 5.03 5.63 9.77 4000 Pass
S. Salina St & Harrison St and Onondaga St 206 671 186 484 -10% -28% 12.89 11.97 12.25 12.99 -5% 9% - - -
186 207 131 303 -30% 46% 9.57 5.77 - 6.69 16% 6.69 5.63 9.77 4000 Pass
264 255 340 336 29% 32% 5.58 2.62 23.04 9.07 313% 246% 9.07 4.12 9.77 4000 Pass
374 395 387 368 3% -7% 21.72 14.34 4.94 2.63 -77% -82% 2.63 5.63 9.77 4000 Pass
S. West St & W. Onondaga St 330 490 334 428 1% -13% 9.29 5.27 8.68 5.44 -7% 3% - - -
Table 4 - CO Screening Community Grid 2050INTERSECTIONS WITH LOS D OR WORSE IN ANY PEAK PERIOD
Pass/FailAnalysis Year: 2050
Intersections with LOS D or Worse
Volumes% Change in Volume No Build Speed Build Speed % Change Volume Threshold Screening
No Build Community Grid

AM PM AM PM AM PM AM PM AM PM AM PM Speed Cruise EF Idle EF
Threshold
(TEM
Tables
3b/3c)
Table 4 - CO Screening Community Grid 2050INTERSECTIONS WITH LOS D OR WORSE IN ANY PEAK PERIOD
Pass/FailAnalysis Year: 2050
Intersections with LOS D or Worse
Volumes% Change in Volume No Build Speed Build Speed % Change Volume Threshold Screening
No Build Community Grid
308 396 353 424 15% 7% 5.55 11.39 5.39 10.35 -3% -9% 5.39 5.63 9.77 4000 Pass
494 819 547 749 11% -9% 25.41 22.83 25.11 22.94 -1% 0% 22.94 2.71 9.77 4000 Pass
634 533 702 603 11% 13% 5.61 5.17 4.94 4.85 -12% -6% 4.85 5.63 9.77 4000 Pass
N./S. Geddes St & Erie Blvd W. 445 591 667 841 50% 42% 13.14 21.38 11.92 20.90 -9% -2% 11.92 4.12 9.77 4000 Pass
944 826 963 862 2% 4% 5.09 4.00 5.31 4.90 4% 22% - - -
250 308 467 330 87% 7% 7.33 7.13 3.12 2.29 -57% -68% 2.29 8.65 9.77 3800 Pass
828 503 156 225 -81% -55% 26.50 26.97 32.28 29.74 22% 10% - - -
S. Geddes St & W. Fayette St 445 591 667 841 50% 42% 13.14 21.38 11.92 20.90 -9% -2% 11.92 4.12 9.77 4000 Pass
930 817 960 860 3% 5% 7.75 8.71 4.77 10.27 -38% 18% 4.77 5.63 9.77 4000 Pass
324 940 171 835 -47% -11% 8.48 5.07 9.98 5.85 18% 15% - - -
340 300 367 317 8% 6% 28.86 21.90 28.59 21.99 -1% 0% - - -
Spencer St & Bear St/I-690 Ramps 227 371 217 346 -4% -7% 25.07 24.64 25.25 16.11 1% -35% 16.11 3.62 9.77 4000 Pass
183 307 185 303 1% -1% 30.73 29.88 31.63 31.75 3% 6% - - -
413 365 477 450 15% 23% 30.85 28.92 30.43 28.47 -1% -2% 28.47 2.60 9.77 4000 Pass
415 788 429 929 3% 18% 4.10 4.37 4.03 4.88 -2% 12% 4.03 5.63 9.77 4000 Pass
Solar St & Hiawatha Blvd W. 169 381 212 436 25% 14% 30.17 29.55 29.86 28.46 -1% -4% 28.46 2.60 9.77 4000 Pass
172 467 200 509 16% 9% 5.07 1.78 6.14 2.96 21% 66% 2.96 5.63 9.77 4000 Pass
615 965 744 1033 21% 7% 4.72 3.45 4.98 3.85 5% 12% 3.85 5.63 9.77 4000 Pass
1106 1246 1114 1250 1% 0% 29.25 21.90 29.67 28.76 1% 31% - - -
Solar St & Bear St 197 282 233 287 18% 2% 5.66 10.54 4.71 9.08 -17% -14% 4.71 5.63 9.77 4000 Pass
103 372 90 359 -13% -3% 30.80 28.09 29.88 28.14 -3% 0% - - -
463 588 857 1013 85% 72% 29.21 27.77 3.43 4.60 -88% -83% 3.43 5.63 9.77 4000 Pass
712 730 532 679 -25% -7% 3.49 6.07 20.56 26.04 489% 329% - - -
N. State St & Butternut St 353 485 206 214 -42% -56% 27.33 26.92 - 2.60 -90% 2.60 5.63 9.77 4000 Pass
224 371 206 98 -8% -74% 7.69 4.91 - 27.30 456% - - -
267 139 206 239 -23% 72% 2.76 3.52 - 23.97 581% 23.97 2.71 9.77 4000 Pass
101 172 206 251 104% 46% 27.55 26.47 - 3.17 -88% 3.17 5.63 9.77 4000 Pass
US 11/N. Salina St & Hiawatha Blvd E. 366 685 381 676 4% -1% 6.11 3.54 3.90 2.14 -36% -40% 2.14 8.65 9.77 3800 Pass
421 518 501 566 19% 9% 13.42 12.40 13.45 10.98 0% -11% 10.98 4.12 9.77 4000 Pass
84 283 88 300 5% 6% 13.25 10.80 9.60 8.36 -28% -23% 8.36 4.12 9.77 4000 Pass
260 221 326 279 25% 26% 10.88 10.38 10.18 10.46 -6% 1% 10.18 4.12 9.77 4000 Pass
US 11/N. Salina St & NY 298/Court St & Alford St 251 322 222 309 -12% -4% 5.89 5.47 5.91 5.67 0% 4% - - -
211 272 173 232 -18% -15% 10.22 10.03 13.91 13.31 36% 33% - - -
136 373 143 354 5% -5% 28.00 26.26 27.80 26.22 -1% 0% - - -
328 259 401 341 22% 32% 13.12 13.44 12.43 9.77 -5% -27% 9.77 4.12 9.77 4000 Pass
Teall Av & Erie Blvd E. 196 326 115 288 -41% -12% 1.65 1.57 2.95 2.17 79% 38% - - -
519 411 460 402 -11% -2% 34.23 34.79 35.01 35.11 2% 1% - - -
335 392 53 174 -84% -56% 18.27 11.13 4.53 3.64 -75% -67% 3.64 5.63 9.77 4000 Pass

AM PM AM PM AM PM AM PM AM PM AM PM Speed Cruise EF Idle EF
Threshold
(TEM
Tables
3b/3c)
Table 4 - CO Screening Community Grid 2050INTERSECTIONS WITH LOS D OR WORSE IN ANY PEAK PERIOD
Pass/FailAnalysis Year: 2050
Intersections with LOS D or Worse
Volumes% Change in Volume No Build Speed Build Speed % Change Volume Threshold Screening
No Build Community Grid
120 314 38 53 -68% -83% 26.26 20.65 1.86 1.41 -93% -93% 1.41 8.65 9.77 3800 Pass
145 219 377 430 160% 96% 1.76 1.69 16.59 10.06 840% 497% 10.06 4.12 9.77 4000 Pass
47 57 126 306 168% 437% 1.24 1.10 18.99 24.06 1433% 2079% 18.99 3.24 9.77 4000 Pass