appendix c air quality impact analysis
TRANSCRIPT

APPENDIX C AIR QUALITY IMPACT
ANALYSIS

Prepared for: Prepared by:Wistaria Ranch Solar, LLC AECOMOmaha, Nebraska Camarillo, CA
60250473June 2014
Environment
Air Quality Impact AnalysisWISTARIA RANCH SOLAR ENERGY CENTER PROJECTIMPERIAL COUNTY, CALIFORNIA

Prepared for: Prepared by:Wistaria Ranch Solar, LLC AECOMOmaha, Nebraska Camarillo, CA
60250473June 2014
Environment
Air Quality Impact AnalysisWISTARIA RANCH SOLAR ENERGY CENTER PROJECTIMPERIAL COUNTY, CALIFORNIA
_________________________________Prepared By Jason Paukovits
_________________________________Reviewed By Steve Heisler, Ph. D

AECOM Environment
Wistaria Ranch Solar Energy Center Project June 2014Air Quality Impact Analysis
i
Contents1.0 Introduction .................................................................................................................. 1
1.1 Project Description .........................................................................................................1
1.2 Project Construction Activities .........................................................................................21.2.1 Development Scenarios ...................................................................................21.2.2 Site Preparation ...............................................................................................31.2.3 Facility Components .........................................................................................4
1.3 Project Operations and Maintenance ..............................................................................6
1.4 Project Decommissioning and Site Restoration ...............................................................6
2.0 Air Pollutants ................................................................................................................ 92.1 Criteria Air Pollutants ......................................................................................................9
2.1.1 Ozone..............................................................................................................92.1.2 Carbon Monoxide .............................................................................................92.1.3 Nitrogen Dioxide...............................................................................................92.1.4 Sulfur Dioxide ................................................................................................ 102.1.5 Lead .............................................................................................................. 102.1.6 Particulate Matter ........................................................................................... 10
2.2 Toxic Air Contaminants ................................................................................................ 10
2.3 Asbestos ..................................................................................................................... 112.3.1 Naturally Occurring Asbestos bearing Serpentine ............................................ 11
2.4 Greenhouse Gases ...................................................................................................... 11
3.0 Regulatory Setting ..................................................................................................... 133.1 Air Quality Regulations ................................................................................................. 13
3.1.1 Federal Regulations ....................................................................................... 133.1.2 State Regulations ........................................................................................... 153.1.3 Regional and Local Air Quality Regulations ..................................................... 16
3.2 Climate Change Regulations ........................................................................................ 183.2.1 Federal Regulations ....................................................................................... 183.2.2 State Regulations ........................................................................................... 193.2.3 Regional and Local Regulations ...................................................................... 20
4.0 Existing Conditions .................................................................................................... 214.1 Environmental Setting, Climate, and Meteorology .......................................................... 21
4.2 Regional and Local Air Quality ...................................................................................... 21
4.3 GHG Emission Sources ............................................................................................... 24
4.4 State Greenhouse Gas Emissions Inventory ................................................................. 24
5.0 Thresholds of Significance, Impacts, and Mitigation Measures............................... 265.1 Thresholds of Significance ............................................................................................ 26

AECOM Environment
Wistaria Ranch Solar Energy Center Project June 2014Air Quality Impact Analysis
ii
5.2 Project Impacts ............................................................................................................ 28
5.3 Cumulative Impacts ...................................................................................................... 47
6.0 References ................................................................................................................. 49
List of AppendicesAppendix A Emission Estimates
Appendix B Cancer Risk and SCREEN3 Model Outputs
List of TablesTable 1 National and California Ambient Air Quality Standards ........................................................ 13
Table 2 SSAB Attainment Status.................................................................................................... 22
Table 3 Ambient Air Quality Summary for the El Centro Monitoring Station ...................................... 22
Table 4 ICAPCD Significance Thresholds for Construction Activities ............................................... 26
Table 5 ICAPCD Significance Thresholds for Operational Activities ................................................. 27
Table 6 Project Unmitigated Daily Construction Emissions .............................................................. 31
Table 7 Project Unmitigated Daily Operational Emissions ............................................................... 34
Table 8 CUP Area Unmitigated Daily Construction Emissions ......................................................... 35
Table 9 CUP Area Unmitigated Daily Operational Emissions........................................................... 36
Table 10 Decommissioning Unmitigated Daily Emissions.................................................................. 37
Table 11 Project GHG Emissions ..................................................................................................... 44
Table 12 CUP Area GHG Emissions ................................................................................................ 45
List of FiguresFigure 1 Project Location Map ..........................................................................................................7
Figure 2 Project Site and Vicinity Map ...............................................................................................8
Figure 3 2011 California GHG Emissions by Category ..................................................................... 25
Figure 4 Sensitive Receptor Locations ............................................................................................ 39

AECOM Environment
Wistaria Ranch Solar Energy Center Project June 2014Air Quality Impact Analysis
iii
List of AcronymsAB Assembly BillAC alternating currentADT average daily tripsALTA American Land Title AssociationAPN Assessor’s Parcel NumberAPS Alternative Planning StrategyAQAP Air Quality Attainment PlanAQMP Air Quality Management PlanARB California Air Resources BoardBACM best available control measuresCAA Clean Air ActCAAQS California ambient air quality standardsCalEEMod California Emissions Estimator ModelCDC California Department of ConservationCEQA California Environmental Quality ActCH4 methaneCO carbon monoxideCO2 carbon dioxideCO2e carbon dioxide equivalentCPV concentrated photovoltaicCUP Conditional Use PermitDC direct currentDPM diesel exhaust particulate matterEIR environmental impact reportEMFAC California Air Resources Board’s Emissions Factor modelEPA United States Environmental Protection Agency°F degrees FahrenheitGHG greenhouse gas emissionsGWP global warming potentialHFC hydrofluorocarbonhp horsepowerH2S hydrogen sulfideICAPCD Imperial County Air Pollution Control DistrictIID Imperial Irrigation DistrictIPCC Intergovernmental Panel on Climate ChangeISECS Imperial Solar Energy Center SouthkV kilovolt(s)lbs/day pounds per daymg/m3 milligrams per cubic meterµg/m3 micrograms per cubic meterMPO Metropolitan Planning Organization

AECOM Environment
Wistaria Ranch Solar Energy Center Project June 2014Air Quality Impact Analysis
iv
MT metric tonsMMT million metric tonsMW megawatt(s)NAAQS national ambient air quality standardsNO nitric oxideNO2 nitrogen dioxideNOx nitrogen oxideN2O nitrous oxideO&M operations and maintenanceOEHHA Office of Environmental Health Hazard AssessmentOFFROAD California Air Resources Board Offroad Emissions ModelPCS PowerPFC perfluorocarbonPM particulate matterPM10 suspended particulate matterPM2.5 fine particulate matterppb parts per billionppm parts per millionProject Wistaria Ranch Solar Energy Center ProjectPV photovoltaicREL Reference Exposure LevelROG reactive organic gasesRTP Regional Transportation PlanSB Senate BillSCADA Supervisory Control and Data AcquisitionSCAQMD South Coast Air Quality Management DistrictSCS Sustainable Communities StrategySF6 sulfur hexafluorideSIP State Implementation PlanSO2 sulfur dioxideSOx sulfur oxideSR State routeSSAB Salton Sea Air BasinTAC toxic air contaminant(s)UNFCC United Nations Framework Convention on Climate ChangeUSDOT United States Department of TransportationWRCC Western Region Climatic CenterWRS Wistaria Ranch Solar, LLC (also “Project Proponent” or “Applicant”)

AECOM Environment
Wistaria Ranch Solar Energy Center Project June 2014Air Quality Impact Analysis
ES-1
Executive Summary
The Wistaria Ranch Solar Energy Center Project (Project) is a proposed solar photovoltaic energy-generating facility located in Imperial County, California, approximately 6 miles southwest of the Cityof El Centro, California, and 5.5 miles directly west of Calexico, California. The Project is beingdeveloped by Wistaria Ranch Solar, LLC (WRS, Applicant, or Project Proponent) to sell itselectricity and all renewable and environmental attributes to an electric utility purchaser under along-term contract to help meet California Renewable Portfolio Standards goals.
This report analyzes the potential air quality impacts resulting from construction and operation ofthe Project and discusses potential air quality impacts resulting from decommissioning of theProject. The entire Project may be constructed at one time, or it may be built out based onconstruction of up to 17 different Conditional Use Permit (CUP) areas phased over an approximate10-year period. The analysis provides details of construction and operation of the entire Project, aswell as a discussion of impacts associated with construction and operation of a large CUP area toassist in understanding impacts associated with a phased build-out. Short-term construction-generated emissions of criteria air pollutants and greenhouse gases (GHG) were estimated inaccordance with methodology recommended by the Imperial County Air Pollution Control District(ICAPCD). Emissions from fugitive dust, construction equipment exhaust and construction vehiclesrelated to hauling materials and workers to and within the site were estimated using the CaliforniaEmissions Estimator Model, Version 2013.2.2, OFFROAD 2007 (OFFROAD), and EMFAC 2011(EMFAC) emission factors. Where available from the Project Proponent, modeling was based onProject-specific data. Where Project-specific information (e.g., amount of land to bedisturbed/graded per day, types of equipment to be used, number of construction employees) wasnot available, reasonable assumptions were used to estimate emissions.
Construction-related emissions of reactive organic gases (ROG), carbon monoxide (CO), sulfuroxides (SOx), and particulate matter (PM) would not exceed the ICAPCD’s recommendedthresholds of significance. However, nitrogen oxide (NOx) emissions would exceed the thresholds ofsignificance. Mitigation measures are recommended to reduce significant impacts for both the fullbuild-out Project and the phased build-out by CUP area. Implementation of mitigation measureswould reduce NOx emissions associated with construction for both the full build-out Project and thephased build-out by CUP area to a less than significant level.
Long-term (i.e., operational) regional emissions of criteria air pollutants and precursors, includingmobile and area-source emissions, were quantified using emission factors from OFFROAD andEMFAC. Mobile-source emissions were modeled based on the net increase in daily vehicle tripsand the net increase in regional vehicle miles traveled that would result from maintenance activities.Based on the modeling, operation of the full build-out Project or a phased build-out by CUP areawould not exceed the thresholds of significance and would not result in significant direct orcumulative air quality impacts.
It is estimated that decommissioning activities, which are anticipated to occur prior to 2050, wouldrequire approximately one-half of the off-road equipment and on-road vehicle trips as the initialconstruction period, as fewer workers would be needed to perform or inspect the decommissioningwork. Furthermore, construction equipment used in the decommissioning would be operating withcleaner engines (e.g., Tier 4 or better) that significantly reduce criteria pollutant emissions. Therefore,

AECOM Environment
Wistaria Ranch Solar Energy Center Project June 2014Air Quality Impact Analysis
ES-2
decommissioning-related emissions of ROG, NOx, CO, SOx, and PM would not exceed the ICAPCD’srecommended thresholds of significance.
Construction and decommissioning activities may expose sensitive receptors to diesel PMemissions. However, construction- and decommissioning-related toxic air contaminant emissionsare not anticipated to cause a significant impact due to the limited exposure time of constructionand decommissioning activities. Construction, operational, and decommissioning activities of the fullbuild-out Project or phased build-out by CUP area are not anticipated to expose a substantialnumber of people to objectionable odors. This impact would be considered less than significant.
The ICAPCD has not established quantitative significance thresholds for the evaluation of GHGemissions for California Environmental Quality Act analysis. Therefore, this analysis considersguidelines on the levels of GHG emissions that would constitute a cumulatively considerableincremental contribution to climate change based on recommendations from the South Coast AirQuality Management District (SCAQMD) for industrial projects. The total construction-related,operational, and decommissioning-related carbon dioxide equivalent (CO2e) emissions associatedwith full build-out of the Project or a phased build-out by CUP area would be less than theSCAQMD-adopted threshold of 10,000 MT CO2e per year. The full build-out Project or a phasedbuild-out by CUP area would not generate GHG emissions, either directly or indirectly, that mayhave a significant impact on the environment. The Project would not conflict with any applicableplan, policy, or regulation for reducing GHG emissions. These impacts would be considered lessthan significant.
AECOM Environment
Wistaria Ranch Solar Energy Center Project June 2014Air Quality Impact Analysis
1
1.0 Introduction
Wistaria Ranch Solar, LLC (WRS, Applicant, or Project Proponent) is proposing to construct andoperate the Wistaria Ranch Solar Energy Center Project (Project), a 250-megawatt (MW) photovoltaic(PV) or concentrated photovoltaic (CPV) solar power-generating facility in Imperial County, California,as is more fully described in Section 2.0 of the Project’s Environmental Impact Report (EIR) andsummarized herein. This chapter of the Air Quality Impact Analysis as well as Chapter 2 of the EIRdefines key terms relevant to understanding the spatial arrangement of the Project and surroundinglands. It also describes features and components of the Project including project construction,operation and decommissioning. Information identified in this chapter regarding the proposed WistariaRanch Solar Energy Center is based on technical studies, mapping, figures, and the 17 ConditionalUse Permit (CUP) applications submitted to the Imperial County Planning & Development ServicesDepartment (ICPDSD) by WRS. Land disturbance acreages, equipment, schedule, mileage, andworkforce information is based on the most up-to-date engineering available from the Applicant andgenerally represent conservative estimates. The Project configuration within the parcels may changebased on final engineering and permit requirements for the project components. The goal of theProject is to generate and sell electricity and all renewable and environmental attributes to an electricutility purchaser under a long-term contract in order to help meet California Renewable PortfolioStandards goals.
The purpose of this air quality and greenhouse gas (GHG) analysis is to describe the existing regionaland local air quality of the Project area, provide a summary of applicable regulations, and identify theconstruction, operational, and decommissioning impacts of the Project. This report also identifiesmeasures to mitigate or minimize pollutant emissions that may occur because of Project construction,operation, or decommissioning. The entire Project may be constructed at one time, or it may be builtbased on as many as 17 different CUP areas over an approximate 10-year period. The analysisprovides details of construction and operation of the entire Project, as well as a discussion of impactsassociated with construction and operation of a typical CUP area. At the end of the Project’s usefullife, the facility would be decommissioned and removed, and the Project site restored as anagricultural use.
In March 2012, the Applicant began performing environmental studies to support the Project’sCalifornia Environmental Quality Act (CEQA) process. This report was prepared in accordance withapplicable air quality regulations, and thresholds of significance pursuant to CEQA.
1.1 Project DescriptionThe Project is located in Imperial County, California, approximately 6 miles southwest of the City ofEl Centro, California, and 5.5 miles directly west of Calexico, California. The U.S./Mexico border islocated immediately south of the Project area. The Project is located on privately owned,agricultural land and would be built over approximately 2,793 acres. The Project consists of up to 17CUPs of approximately 20 MW each on 32 parcels totaling approximately 2,793 acres. The Project isanticipated to generate 250 MW, but the ultimate energy output is dependent on several variables,including off-take arrangements and the evolving efficiency of PV panels. As a result, the Project couldgenerate more or less than 250 MW, but shall not exceed 2,793 acres of disturbance area during onor off-site construction. Figures 1 and 2 locate the Project regionally and locally, respectively, as wellas define the 17 CUP areas.

AECOM Environment
Wistaria Ranch Solar Energy Center Project June 2014Air Quality Impact Analysis
2
The Project will use PV technology to convert sunlight directly into direct current (DC) electricity. TheProject may include only one PV technology or a combination of various PV technologies, includingcrystalline silicon-based systems, thin-film systems, and concentrating PV systems. Groups ofphotovoltaic modules (environmentally sealed collections of photovoltaic cells) will be wired togetherto form a PV array. The DC produced by the array will be collected at inverters (power conversiondevices) where the DC is converted to alternating current. The voltage of the electricity is increased bya transformer at each power conversion station to a medium voltage level (typically 34.5 kilovolts[kV]). Medium voltage electric lines (underground and/or overhead) will be used to collect theelectricity from each medium voltage transformer and transmit it to the facility substation, where thevoltage will be further increased by a high voltage transformer to match the electric grid for export tothe point of interconnection.
All CUP areas are anticipated to use the existing generation interconnection (gen-tie) line that extendsfrom the Project site parcels through the Mount Signal Solar Project to the Imperial Solar EnergyCenter South (ISECS) switchyard. Approximately eight additional poles will be added to the MountSignal Solar Project segment of the gen-tie to accommodate collocation of the Project’s lines with theMount Signal gen-tie area. The CUP areas are anticipated to use the main Project switchyard;however, each CUP area may independently construct a 230-kV step-up transformer and switchyard.Disconnect switches, fuses, circuit breakers, and other miscellaneous equipment will be installedthroughout the system for electrical protection and operations and maintenance (O&M) purposes. Inaddition to the structures associated with the solar field, such as PV panels, inverters, transformers,PCS enclosures, etc., the Project would include O&M buildings (it is assumed that each CUP area willinclude a separate O&M building) and a type of energy storage facility that could accommodate avariety of evolving energy storage technologies. The Project may also include additional auxiliaryfacilities, such as raw water/fire water storage, treated water storage, evaporation ponds, waterfiltration buildings and equipment, equipment control buildings, energy storage components, septicsystem(s) and parking. The design and construction of the buildings and solar arrays (panels, etc.)and auxiliary facilities will be consistent with Imperial County building standards.
The Project will include electric line and vehicular crossings of Imperial Irrigation District (IID) facilitiesand Imperial County facilities as identified in the EIR Project Description, some of which may includeinfrastructure improvements, such as bridge widening. The Project crossings will not interfere with thepurpose of the IID (drains, irrigation canals, electric lines, etc.) or Imperial County facilities (roads,etc.). It is anticipated that electric line crossings would be either overhead or underground, which mayinclude either trenching or horizontal directional drilling to place the electric or water lines underexisting IID and county facilities.
1.2 Project Construction Activities1.2.1 Development ScenariosThe Project entitlements provide the Applicant the flexibility to construct the Project by constructing all17 CUPs at one time or phases consisting of individual CUPs or smaller groupings of CUPs. Once aCUP is initiated by commencing construction or obtaining its ministerial permits, its term lasts for 30years. Any of the 17 individual CUPs not initiated within 10 years of approval shall expire. Thesecreate several development scenarios described as follows:
The Existing Conditions Scenario refers to the emissions associated with current agricultural andresidential land uses on the Project site. Consistent with the definition of baseline conditions pursuantto CEQA, the existing emissions levels could be estimated for the current land uses. The emissionsassociated with these land uses could then be subtracted from the total Project emissions to estimate

AECOM Environment
Wistaria Ranch Solar Energy Center Project June 2014Air Quality Impact Analysis
3
the net increase as a result of the Project. However, the emissions associated with existing orbaseline conditions were not analyzed, and the total emissions associated with the Project werecompared to the thresholds of significance. This represents a more conservative approach to the airquality and GHG analysis.1
The Near-Term Scenario refers to the Project’s direct and cumulative impacts if the entire Project (all17 CUPs) were constructed over 18 months starting in the Year 2015, the year that the Applicantanticipates construction could actually begin following project approval, final engineering andfinancing. Analysis of the Existing Conditions Scenario or earlier construction schedules for the Projectcould be misleading to the public and decision-makers, since air quality conditions could change andthe Project could not feasibly be constructed during that time. Therefore, the Near-Term Scenario isthe most accurate predictor of air quality impacts associated with construction of the Project. TheNear-Term Scenario also represents a conservative analysis of the air quality impacts because itsconstruction period results in a greater intensity of labor and equipment than other constructionscenarios.
The Long-Term Construction Scenario refers to the Project’s direct and cumulative impacts if theentire Project (all 17 CUPs) were constructed over 18 months starting in the Year 2024, the last yearthe Applicant could commence construction if the CUPs are approved in 2014. If construction were tooccur in later years, advancements in engine technology, retrofits, and turnover in the equipment fleetare anticipated to result in lower levels of emissions. In addition, mitigation measures that would beeffective in mitigating the Near-Term Construction Scenario’s impacts to below a level of significancewould also be effective in mitigating the Project’s impacts under the Long-Term ConstructionScenario. Therefore, emissions associated with the Long-Term Construction Scenario would be lessthan or equal to the Near-Term Construction Scenario. As a result, the Long-Term ConstructionScenario is not discussed further in this report.
The Phased Construction Scenario refers to the Project’s direct and cumulative impacts if the Projectwas constructed by individual CUPs from 2015 to 2024. For the purpose of informing the public anddecision-makers of a conservative analysis of impacts where the development is constructed in CUPphases, a large CUP area constructed over a 7-month period was analyzed.
1.2.2 Site PreparationInitial construction activities would include the development of the staging and assembly areas, andthe grading of site access roads for initial array installation. Construction staging and material lay-down areas would be distributed across the Project site evenly to allow for efficient distribution ofcomponents to different parts of the Project. These lay-down areas would be temporary and would beconverted to solar arrays as work was completed in the general area. Temporary facilities would bedeveloped on each site to facilitate the construction process. These facilities may include constructiontrailers, a temporary septic system or holding tank, parking areas, material receiving/storage areas,
1 The crop history for the agricultural land on the Project site includes production of alfalfa, wheat, and grass.Sources of agricultural emissions from crop growing and harvesting activities include energy use (e.g., fuelcombustion), crop residue burning, and soil management practices (fertilizer and manure applications). TheARB estimates that agricultural emissions were approximately 7percent of the total Statewide GHG emissions in2011 (ARB 2014). Based on information consistent with ARB reports regarding agricultural activities, includingcrop and soil management, the analysis assumed that the current agricultural activities would result in a netpositive amount of GHG emissions.
AECOM Environment
Wistaria Ranch Solar Energy Center Project June 2014Air Quality Impact Analysis
4
water storage ponds or tanks, construction power service, recycling / waste handling areas, andothers. These facilities will be located at the construction areas designated on the final site plans.
1.2.3 Facility ComponentsThe Project will use PV technology or a combination of various PV technologies, including crystallinesilicon-based systems, thin-film systems, and concentrating PV systems. The technology will be usedto convert sunlight into DC electricity. Groups of PV modules will be wired together to form a PV array.Through a system of inverters and transformers, power will be conveyed to the facility substation andultimately to the Imperial Valley Substation. Disconnect switches, fuses, circuit breakers, and othermiscellaneous equipment will be installed throughout the system as well for electrical protection andoperations and maintenance purposes.
Each CUP area includes the following facilities:
1. PV solar modules and tracking racking system and foundation;
2. Inverters/transformers/power conversion stations;
3. Pad-mounted transformers (if different from above);
4. Combining switchgear;
5. Communication system (fiber optic or microwave tower);
6. Breakers, buswork, protective relaying, Supervisory Control and Data Acquisition (SCADA),and associated substation equipment;
7. O&M building(s);
8. Back-up emergency generators; and an
9. Energy storage component.
Each of the major components of the Project is described below in more detail.
Photovoltaic Solar Modules and Trackers
The Project will utilize conventional PV modules (either crystalline or thin-film) or CPV modules. ThePV modules operate in response to sunlight (i.e., during daylight hours), and operate at peak outputwhen the sunlight is most intense, though they also produce power in low light conditions.
Depending on the selected manufacturer for the PV or CPV modules, the modules will be mounted onfixed-tilt, single or dual-axis tracking structures. CPV modules will be mounted on top of a dual-axistracker. The mast will either be secured to a foundation below grade or vibratory driven into theground, in which case the mast will serve as the foundation and the supporting structure. The solararray field will be arranged in groups, called “blocks.” The entire array block will be connected to aninverter and transformer station to convert the current from DC to alternating current (AC) and to stepup the voltage to a higher voltage, which is a more efficient for transmitting power to the Projectsubstation.
During normal operation, each substation will “back feed” power to maintain “house” power. Thiswould include O&M buildings, security systems, SCADA, communication systems, and Plant ControlSystems, etc. Therefore, much of the electrical equipment will be in some stage of electrical operation24 hours per day.

AECOM Environment
Wistaria Ranch Solar Energy Center Project June 2014Air Quality Impact Analysis
5
Inverters, Pad-mounted Transformers, and Transmission Facilities
At the center of each array, there will be a power conversion station where inverters take the DCpower output from the PV modules and convert it to AC power. An adjacent pad-mounted transformerwill step the voltage up to a medium voltage level (typically 34.5 kV). The medium voltage outputsfrom each of the pad-mounted transformers will be collected together in combining switchgear locatedat discrete locations on the Project site. The medium voltage output from the combining switchgearwill be connected to the Project substation where it will then be stepped up to 230 kV for export to thegrid. The Project’s gen-tie line will colocate with 8minutenergy Renewables’ and AES’s Mount SignalSolar Project gen-tie line and interconnect to the Imperial Solar Energy Center South switchyard inorder to connect to the San Diego Gas & Electric’s Imperial Valley Substation. The power may flow tothe Imperial Valley Substation via the Drew Road Switchyard or via the La Rosita to Imperial Valley230-kV circuit.
Substation, Switchyard, and Communication Systems
An on-site substation/switchyard on each of the 17 CUP areas will step-up the voltage from thecollection level voltage to 230 kV. Breakers, buswork, protective relaying, SCADA, and associatedsubstation equipment will be constructed as part of each phase as well. The communication systemmay include above or belowground fiber optic cable or a microwave tower.
O&M Building Complex
Each O&M Building Complex may contain administrative offices, parts storage, a maintenance shop,plant security systems, a site control center, and plant monitoring equipment. A specific design for thebuilding(s) has not been finalized as of the date of this analysis. The building(s) may have exteriorlighting on motion sensors and will include fire and security alarms. The building(s) will be located on agraded area with adjacent worker parking, per county building requirements.
The Project may also include additional auxiliary facilities, such as raw water/fire water storage,treated water storage, evaporation ponds, water filtration buildings and equipment, equipment controlbuildings, and a wastewater/septic system, as the O&M buildings will provide sanitary facilities foremployees and visitors.
Energy Storage Component
The Project may incorporate an energy storage component, or if the Project is constructed in phases,each CUP area may have its own energy storage component. The field of energy storage is rapidlyadvancing, thus, a single technology or provider has not yet been selected for the energy storagecomponent(s) of the Project. The energy storage component of the Project will utilize storagetechnologies that operate based upon the principles of potential (e.g., pumped storage), chemical(e.g., batteries), mechanical energy (e.g., a flywheel), or any combination thereof. The energy storagecomponent may be centralized and located adjacent to the substation or switchgear, or alternatively,the energy storage component may be distributed throughout the plant adjacent to individual powerconversion centers. The energy storage component would be housed in a warehouse-type building, oralternatively, in smaller modular structures, such as cargo shipping containers.
Site Access/Traffic and Circulation
There are many county-maintained roads providing access throughout the Project site. Primaryaccess to the Project site will be via County Highway S30, Lyons Road, Rockwood Road, and StateRoute 98 (SR-98), as well as other roads in the area. Access to components of the solar field will be

AECOM Environment
Wistaria Ranch Solar Energy Center Project June 2014Air Quality Impact Analysis
6
controlled through security gates at several entrances. Multiple gate-restricted access points will beused during construction and operation.
Daily trip generation during construction of the Project would primarily include the delivery ofconstruction equipment, vehicles, and materials, as well as construction worker trips. Road crossingsover IID canal or other feature may be widened in the unlikely event construction traffic accessing thesite required a wider crossing. In addition, parking for Project-related vehicles would be provided onsite during construction.
1.3 Project Operations and MaintenanceOnce the Project facilities are constructed, facility operation would be limited to general maintenance,panel washing, and security. It is possible that each CUP area could require approximately two full-time equivalent personnel to operate the facility; however, the Project may also be supported by onestaff who manages the entire Project. Assuming that all employees would work at their respectivesites, operation of 17 CUPs simultaneously would require up to 34 full-time equivalent workers toarrive and leave the Project site on a daily basis. These personnel would perform maintenance, panelwashing, and security functions. Panel washing would occur during the dry weather months of Aprilthrough October. Each solar panel surface would be washed with water from a pickup truck twiceduring that period to clean the active surface of solar panels to optimize transmission of light andenergy production. Security staff would traverse the perimeter of the Project site in a light-duty pickuptruck.
Operation of the Project site would be expected to generate approximately 30 trips per day frommaintenance and security personnel.
1.4 Project Decommissioning and Site RestorationOnce a CUP is initiated by commencing construction or obtaining its ministerial permits, its term lastsfor 30 years. At the end of the Project’s term, the facility would be decommissioned. Facility structuresand infrastructures would be removed from the Project site, and the Project site would then undergorestoration to the preconstruction agricultural land use. It is estimated that decommissioning activities,which are anticipated to occur prior to 2050, would require approximately one-half of the off-roadequipment and on-road vehicle trips as the initial construction period, as fewer workers are needed toperform or inspect the decommissioning work.

Figure 1Project Location Map
Source: ESRI; AECOM; Wistaria 2013; © Harris Corp, Earthstar Geographics LLC © 2013 Microsoft Corporation © 2010 NAVTEQ © AND
Path: P:\2012\60250473\06GIS\6.3_Layout\Proj_Descr\ProjectLocation.mxd, 7/24/2013, steinb
4 0 42 Miles
Wistaria Ranch Solar Energy Center I Scale: 1:253,440; 1 inch = 4 miles
ProjectLocation

Figure 2Project Site and Vicinity Map
Source: Image courtesy of USGS © AND © 2012 MapData Sciences Pty Ltd, PSMA © 2012 Zenrin ; ESRI; AECOM; Wistaria 2013
Path: P:\2012\60250473\06GIS\6.3_Layout\AirQuality\ProjectSite_and_Vicinity.mxd, 1/16/2014, steinb
0.5 0 0.50.25 Miles
Wistaria Ranch Solar Energy Center I
LEGEND
Scale: 1:31,680; 1 inch = 0.5 mile
Project Site ParcelsCUP BoundaryParcels
LEGEND

AECOM Environment
Wistaria Ranch Solar Energy Center Project June 2014Air Quality Impact Analysis
9
2.0 Air Pollutants
“Air pollution” is a general term that refers to one or more chemical substances that degrade thequality of the atmosphere. Individual air pollutants may adversely affect human or animal health,reduce visibility, damage property, and reduce the productivity or vigor of crops and naturalvegetation. The criteria air pollutants that are most important for this analysis are those that can betraced principally to motor vehicles and construction activities. In addition to the criteria pollutants,toxic air contaminants (TACs), asbestos, and GHGs are air pollutants of concern.
2.1 Criteria Air PollutantsSix air pollutants have been identified by the United States Environmental Protection Agency (EPA) asbeing of concern nationwide. These are ozone; carbon monoxide (CO); nitrogen dioxide (NO2); sulfurdioxide (SO2); lead; and particulate matter (PM), which is subdivided into two classes based onparticle size: PM equal to or less than 10 microns in diameter (PM10) and PM equal to or less than 2.5microns in diameter (PM2.5). These pollutants are collectively referred to as criteria pollutants and arediscussed in detail below and later in this report.
2.1.1 OzoneOzone is the principal component of smog and is formed in the atmosphere through a series ofreactions involving reactive organic gases (ROG) and nitrogen oxides (NOx) in the presence ofsunlight. ROG and NOx are called precursors of ozone. NOx includes various combinations of nitrogenand oxygen, including nitric oxide (NO), NO2, and others. Ozone is a principal cause of lung and eyeirritation in the urban environment. Significant ozone concentrations are usually produced only in thesummer, when atmospheric inversions are greatest and temperatures are high. ROG and NOxemissions are both considered critical in ozone formation.
2.1.2 Carbon MonoxideCO is a colorless and odorless gas that, in the urban environment, is associated primarily with theincomplete combustion of fossil fuels in motor vehicles. Relatively high concentrations are typicallyfound near crowded intersections and along heavily used roadways carrying slow-moving traffic. Evenunder most severe meteorological and traffic conditions, high concentrations of CO are limited tolocations within a relatively short distance (300 to 600 feet) of heavily traveled roadways. Vehicletraffic emissions can cause localized CO impacts, and severe vehicle congestion at major signalizedintersections can generate elevated CO levels, called “hot spots,” which can be hazardous to humanreceptors adjacent to the intersections.
2.1.3 Nitrogen DioxideNO2 is a product of combustion and is generated in vehicles and in stationary sources, such as powerplants and boilers. It is also formed when ozone reacts with NO in the atmosphere. NO2 can causelung damage. As noted above, NO2 is part of the NOx family and is a principal contributor to ozoneand smog generation.

AECOM Environment
Wistaria Ranch Solar Energy Center Project June 2014Air Quality Impact Analysis
10
2.1.4 Sulfur DioxideSO2 is a combustion product, with the primary source being power plants and heavy industries thatuse coal or oil as fuel. SO2 is also a product of diesel engine combustion. The health effects of SO2include lung disease and breathing problems for asthmatics. SO2 in the atmosphere contributes to theformation of acid rain.
2.1.5 LeadLead is a highly toxic metal that may cause a range of human health effects. Previously, the lead usedin gasoline anti-knock additives represented a major source of lead emissions to the atmosphere. TheEPA began working to reduce lead emissions soon after its inception, issuing the first reductionstandards in 1973. Lead emissions have significantly decreased due to the near elimination of leadedgasoline use.
2.1.6 Particulate MatterPM is a complex mixture of extremely small particles and liquid droplets. PM is made up of a numberof components, including acids (such as nitrates and sulfates), organic chemicals, metals, and soil ordust particles. Natural sources of particulate matter include windblown dust and ocean spray.
The size of PM is directly linked to the potential for causing health problems. The EPA is concernedabout particles that are 10 micrometers in diameter or smaller, because these particles generally passthrough the throat and nose and enter the lungs. Once inhaled, these particles can affect the heartand lungs and cause serious health effects. Health studies have shown a significant associationbetween exposure to PM and premature death. Other important effects include aggravation ofrespiratory and cardiovascular disease, lung disease, decreased lung function, asthma attacks, andcertain cardiovascular problems, such as heart attacks and irregular heartbeat (EPA 2007).Individuals particularly sensitive to fine particle exposure include older adults, people with heart andlung disease, and children. In addition to total PM, the EPA groups PM into the following categories:
Fine Particulate Matter (PM2.5)
Fine particles, such as those found in smoke and haze, are PM2.5. Sources of fine particles include alltypes of combustion activities (motor vehicles, power plants, wood burning, etc.) and certain industrialprocesses. PM2.5 is also formed through reactions of gases, such as SO2 and NOx, in the atmosphere.PM2.5 is the major cause of reduced visibility (haze) in California.
Inhalable Particulate Matter (PM10)
PM10 includes both fine and coarse particles; the fine particles are PM2.5. Coarse particles, such asthose found near roadways and dusty industries, are larger than 2.5 micrometers and smaller than 10micrometers in diameter. Sources of coarse particles include crushing or grinding operations and dustfrom paved or unpaved roads. The health effects of PM10 are similar to PM2.5. Control of PM10 isprimarily achieved through the control of dust at construction and industrial sites, the cleaning ofpaved roads, and the wetting or paving of frequently used unpaved roads.
2.2 Toxic Air ContaminantsThe EPA regulates TACs, also known as hazardous air pollutants. Concentrations of TACs are alsoused as indicators of ambient air quality conditions. A TAC is defined as an air pollutant that maycause or contribute to an increase in mortality or in serious illness, or that may pose a hazard tohuman health. TACs are usually present in minute quantities in ambient air; however, their high

AECOM Environment
Wistaria Ranch Solar Energy Center Project June 2014Air Quality Impact Analysis
11
toxicity may pose a threat to public health even at low concentrations. Most TACs originate fromhuman-made sources, including on-road mobile sources, non-road mobile sources (e.g., airplanesand construction equipment), area sources (e.g., dry cleaners), and stationary sources (e.g., factoriesand refineries).
2.3 AsbestosThe Clean Air Act (CAA) of 1970 requires the EPA to develop and enforce regulations to protect thegeneral public from exposure to airborne contaminants that are known to be hazardous to humanhealth. Asbestos is a known carcinogen and inhalation of asbestos may result in the development oflung cancer or mesothelioma. The Project does not include construction activities that would involveasbestos.
2.3.1 Naturally Occurring Asbestos bearing SerpentineSerpentine is a mineral commonly found in seismically active regions of California, usually inassociation with ultramafic rocks and along associated faults. Certain types of serpentine occurnaturally in a fibrous form known generically as asbestos. According to the report A General LocationGuide for Ultramafic Rocks in California Area Likely to Contain Naturally Occurring Asbestos (CDC2000), the naturally occurring asbestos-bearing serpentine is not typically found in the geologicalformations present on the Project site (CDC 2000).
2.4 Greenhouse GasesCertain gases in the earth’s atmosphere, classified as GHGs, play a critical role in determining theearth’s surface temperature. A portion of the solar radiation that enters the earth’s atmosphere isabsorbed by the earth’s surface, and a smaller portion of this radiation is reflected back towardsspace. This infrared radiation (i.e., thermal heat) is absorbed by GHGs within the earth’s atmosphere.As a result, infrared radiation released from the earth that otherwise would have escaped back intospace is instead “trapped,” resulting in a warming of the atmosphere. This phenomenon, known as the“greenhouse effect,” is, at certain GHG concentrations, responsible for maintaining a habitable climateon the earth.
GHGs are present in the atmosphere naturally, are released by natural and anthropogenic sources,and are formed from secondary reactions taking place in the atmosphere. Natural sources of GHGsinclude the respiration of humans, animals and plants, decomposition of organic matter, andevaporation from the oceans. Anthropogenic sources include the combustion of fossil fuels, wastetreatment, and agricultural processes. The following are GHGs that are widely accepted as theprincipal contributors to human-induced global climate change:
· Carbon dioxide (CO2)
· Methane (CH4)
· Nitrous oxide (N2O)
· Hydrofluorocarbons (HFCs)
· Perfluorocarbons (PFCs)
· Sulfur Hexaflouride (SF6)
Global warming potential (GWP) is a concept developed to compare the ability of each GHG to trapheat in the atmosphere relative to CO2. The GWP of a GHG is based on several factors, including the

AECOM Environment
Wistaria Ranch Solar Energy Center Project June 2014Air Quality Impact Analysis
12
relative effectiveness of a gas to absorb infrared radiation and length of time (i.e., lifetime) that the gasremains in the atmosphere (“atmospheric lifetime”). The reference gas for GWP is CO2; therefore,CO2 has a GWP of one. The other main GHGs that have been attributed to human activity includeCH4, which has a GWP of 21, and N2O, which has a GWP of 310 (UNFCC 2012). For example, 1 tonof CH4 has the same contribution to the greenhouse effect as approximately 21 tons of CO2. GHGswith lower emissions rates than CO2 may still contribute to climate change, because they are moreeffective at absorbing outgoing infrared radiation than CO2 (i.e., high GWP). The concept of CO2-equivalents (CO2e) is used to account for the different GWP potentials of GHGs to absorb infraredradiation.
GHG emissions related to human activities have been determined to be likely responsible forintensifying the greenhouse effect and leading to a trend of unnatural warming of the earth’satmosphere and oceans, with corresponding effects on global circulation patterns and climate (IPCC2007). Similarly, impacts of GHGs are borne globally, as opposed to the more localized air qualityeffects of criteria air pollutants and TACs. No single project alone is expected to measurablycontribute to a noticeable incremental change in the global average temperature, or to a global, local,or micro climate. From the standpoint of the California Environmental Quality Act (CEQA), GHGimpacts to global climate change are inherently cumulative.
AECOM Environment
Wistaria Ranch Solar Energy Center Project June 2014Air Quality Impact Analysis
13
3.0 Regulatory Setting
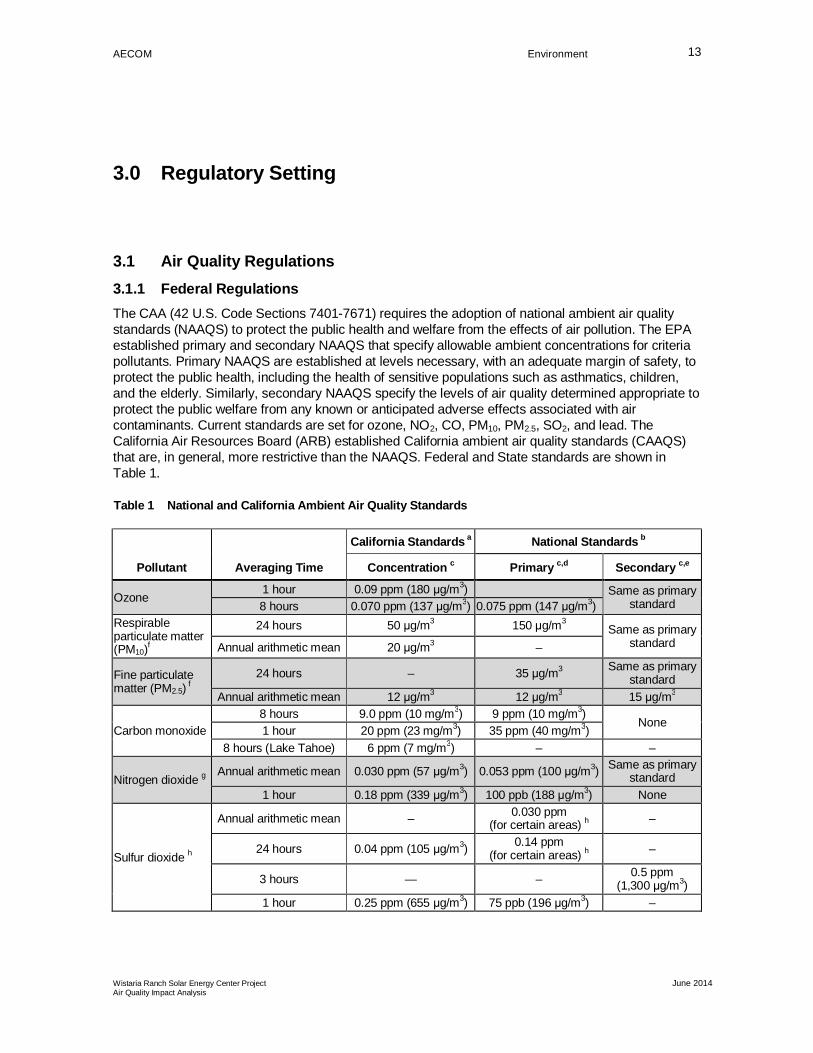
3.1 Air Quality Regulations3.1.1 Federal RegulationsThe CAA (42 U.S. Code Sections 7401-7671) requires the adoption of national ambient air qualitystandards (NAAQS) to protect the public health and welfare from the effects of air pollution. The EPAestablished primary and secondary NAAQS that specify allowable ambient concentrations for criteriapollutants. Primary NAAQS are established at levels necessary, with an adequate margin of safety, toprotect the public health, including the health of sensitive populations such as asthmatics, children,and the elderly. Similarly, secondary NAAQS specify the levels of air quality determined appropriate toprotect the public welfare from any known or anticipated adverse effects associated with aircontaminants. Current standards are set for ozone, NO2, CO, PM10, PM2.5, SO2, and lead. TheCalifornia Air Resources Board (ARB) established California ambient air quality standards (CAAQS)that are, in general, more restrictive than the NAAQS. Federal and State standards are shown inTable 1.
Table 1 National and California Ambient Air Quality Standards
Pollutant Averaging Time
California Standards a National Standards b
Concentration c Primary c,d Secondary c,e
Ozone1 hour 0.09 ppm (180 μg/m3) Same as primary
standard8 hours 0.070 ppm (137 μg/m3) 0.075 ppm (147 μg/m3)Respirableparticulate matter(PM10)f
24 hours 50 μg/m3 150 μg/m3Same as primary
standardAnnual arithmetic mean 20 μg/m3 –
Fine particulatematter (PM2.5) f
24 hours – 35 μg/m3 Same as primarystandard
Annual arithmetic mean 12 μg/m3 12 μg/m3 15 μg/m3
Carbon monoxide8 hours 9.0 ppm (10 mg/m3) 9 ppm (10 mg/m3)
None1 hour 20 ppm (23 mg/m3) 35 ppm (40 mg/m3)
8 hours (Lake Tahoe) 6 ppm (7 mg/m3) – –
Nitrogen dioxide g Annual arithmetic mean 0.030 ppm (57 μg/m3) 0.053 ppm (100 μg/m3) Same as primarystandard
1 hour 0.18 ppm (339 μg/m3) 100 ppb (188 μg/m3) None
Sulfur dioxide h
Annual arithmetic mean – 0.030 ppm(for certain areas) h –
24 hours 0.04 ppm (105 μg/m3) 0.14 ppm(for certain areas) h –
3 hours — – 0.5 ppm(1,300 μg/m3)
1 hour 0.25 ppm (655 μg/m3) 75 ppb (196 μg/m3) –

AECOM Environment
Wistaria Ranch Solar Energy Center Project June 2014Air Quality Impact Analysis
14
Table 1 National and California Ambient Air Quality Standards
Pollutant Averaging Time
California Standards a National Standards b
Concentration c Primary c,d Secondary c,e
Lead i,j
30-day average 1.5 μg/m3 – –
Calendar quarter – 1.5 μg/m3
(for certain areas) j Same as primarystandard
Rolling 3-month average – 0.15 μg/m3
Visibility-reducingparticles k 8 hours See footnote j
No national standardsSulfates 24 hours 25 μg/m3
Hydrogen sulfide 1 hour 0.03 ppm (42 μg/m3)Vinyl chloride i 24 hours 0.01 ppm (26 μg/m3)Notes: mg/m3 = milligrams per cubic meter; PM2.5 = fine particulate matter with an aerodynamic resistance diameter of 2.5 micrometers or less;PM10 = respirable particulate matter with an aerodynamic resistance diameter of 10 micrometers or less; ppb = parts per billion; ppm = parts permillion; µg/m3 = micrograms per cubic metera California standards for ozone, carbon monoxide (except 8-hour Lake Tahoe),
sulfur dioxide (1- and 24-hour), nitrogen dioxide, and particulate matter (PM10,PM2.5, and visibility-reducing particles), are values that are not to be exceeded. Allothers are not to be equaled or exceeded. California ambient air quality standardsare listed in the Table of Standards in Section 70200 of Title 17 of the CaliforniaCode of Regulations.
b National standards (other than ozone, particulate matter, and those based onannual arithmetic mean) are not to be exceeded more than once a year. Theozone standard is attained when the fourth highest 8-hour concentrationmeasured at each site in a year, averaged over 3 years, is equal to or less thanthe standard. For PM10, the 24-hour is attained when the expected number of daysper calendar year with a 24-hour average concentration above 150 µg/m3 is equalto or less than 1. For PM2.5, the 24-hour standard is attained when 98 percent ofthe daily concentrations, averaged over 3 years, are equal to or less than thestandards. Contact EPA for further clarification and current national policies.
c Concentration expressed first in the units in which it was promulgated. Equivalentunits given in parentheses are based upon a reference temperature of 25 degreesCelsius (°C) and a reference pressure of 760 torr. Most measurements of airquality are to be corrected to a reference temperature of 25°C and referencepressure of 760 torr; parts per million (ppm) in this table refers to ppm by volume,or micromoles of pollutant per mole of gas.
d National Primary Standards: The levels of air quality necessary, with an adequatemargin of safety to protect the public health.
e National Secondary Standards: The levels of air quality necessary to protect thepublic welfare from any known or anticipated adverse effects of a pollutant.
f On December 14, 2012, the national annual PM2.5 primary standard was loweredfrom 15 μg/m3 to 12.0 μg/m3. The existing national 24-hour PM2.5 standards(primary and secondary) were retained at 35 μg/m3, as was the annual secondarystandard of 15 μg/m3. The existing 24-hour PM10 standards (primary andsecondary) of 150 μg/m3 also were retained. The form of the annual primary andsecondary standards is the annual mean, averaged over 3 years.
g To attain the 1-hour national standard, the 3-year average of the annual 98thpercentile of the 1-hour daily maximum concentrations at each site must notexceed 100 ppb. Note the national 1-hour standard is in units of parts per billion(ppb). California standards are in units of ppm. To directly compare the national 1-hour standard to the California standards the units can be converted from ppb toppm. In this case, the national standard of 100 ppb is identical to 0.100 ppm.
Source: ARB 2013a
h On June 2, 2010, a new 1-hour SO2 standard wasestablished and the existing 24-hour and annual primarystandards were revoked. To attain the 1-hour nationalstandard, the 3-year average of the annual 99th percentileof the 1-hour daily maximum concentrations at each sitemust not exceed 75 ppb. The 1971 SO2 national standards(24-hour and annual) remain in effect until 1 year after anarea is designated for the 2010 standard, except that inareas designated nonattainment for the 1971 standards,the 1971 standards remain in effect until implementationplans to attain or maintain the 2010 standards areapproved.
Note that the 1-hour national standard is in units of ppb.California standards are in units of ppm. To directlycompare the 1-hour national standard to the Californiastandard, the units can be converted to ppm. In this case,the national standard of 75 ppb is identical of 0.075 ppm.
i The California Air Resources Board (ARB) has identifiedlead and vinyl chloride as toxic air contaminants with nothreshold level of exposure for adverse health effectsdetermined. These actions allow for the implementation ofcontrol measures at levels below the ambientconcentrations specified for these pollutants.
j The national standard for lead was revised on October 15,2008, to a rolling 3-month average. The 1978 leadstandard (1.5 µg/m3 as a quarterly average) remains ineffect until 1 year after an area is designated for the 2008standard, except that in areas designated nonattainmentfor the 1978 standard, the 1978 standard remains in effectuntil implementation plans to attain or maintain the 2008standards are approved.
k In 1989, ARB converted both the general statewide 10-mile visibility standard and the Lake Tahoe 30-mile visibilitystandard to instrumental equivalents, which are “extinctionof 0.23 per kilometer” and the “extinction of 0.07 perkilometer” for the statewide and Lake Tahoe Air Basinstandards, respectively.

AECOM Environment
Wistaria Ranch Solar Energy Center Project June 2014Air Quality Impact Analysis
15
The EPA, under the provisions of the CAA, requires each state with regions that have not attained theNAAQS to prepare a State Implementation Plan (SIP), detailing how these standards are to be met ineach local area. The SIP is a legal agreement between each state and the Federal government tocommit resources to improving air quality. It serves as the template for conducting regional andproject-level air quality analysis. The SIP is not a single document, but a compilation of new andpreviously submitted attainment plans, emissions reduction programs, district rules, state regulations,and Federal controls. The ARB is the lead agency for developing the SIP in California. Local airdistricts and other agencies prepare Air Quality Attainment Plans (AQAPs), or Air QualityManagement Plans (AQMPs), and submit them to the ARB for review, approval, and incorporationinto the applicable SIP.
General Conformity
General conformity requirements were adopted by the U.S. Congress as part of the CAAAmendments of 1990 and were implemented by EPA regulations in 1993. The purpose of the generalconformity program is to ensure that actions taken by the Federal government do not undermine stateor local efforts to achieve and maintain NAAQS. The General Conformity Rule applies to “any activitythat a department…of the Federal government supports in any way, provides financial assistance for,licenses, permits, or approves” (40 Code of Federal Regulations Section 51.852).
The General Conformity Rule (40 Code of Federal Regulations Sections 51.850–51.860 and93.150–93.160) requires any Federal agency responsible for an action in a Federal nonattainment orattainment/maintenance area to demonstrate conformity to the applicable SIP. To do so, the Federalagency must determine that the action is either exempt from General Conformity Rule requirements orsubject to a formal conformity determination. All reasonably foreseeable emissions predicted to resultfrom the action—both direct and indirect—must be considered, and the location and quantity ofemissions must be identified. Only Federal nonattainment and maintenance pollutant emissions areconsidered under a general conformity analysis.
3.1.2 State RegulationsThe ARB oversees activities of local air quality management agencies and is responsible forincorporating AQAPs and AQMPs from local air districts into the SIP for EPA approval. The ARB alsomaintains air quality monitoring stations throughout the State in conjunction with local air districts.Data collected at these stations are used by the ARB to classify air basins as being in attainment ornonattainment with respect to each pollutant and to monitor progress in attaining air quality standards.
The California CAA requires that each area exceeding the CAAQS for ozone, CO, SO2, and NO2develop a plan aimed at achieving those standards (California Health and Safety Code, 40911 etseq.). The California Health and Safety Code, Section 40914, requires air districts to design a planthat achieves an annual reduction in district-wide emissions of 5 percent or more, averaged everyconsecutive 3-year period. To satisfy this requirement, the Air Quality Management Districts and AirPollution Control Districts have to develop and implement air pollution reduction measures, which aredescribed in their AQAPs/AQMPs, and outline strategies for achieving the CAAQS for any criteriapollutants for which the region is classified as nonattainment.
ARB has established emission standards for vehicles sold in California and for various types ofequipment. California gasoline specifications are governed by both State and Federal agencies.During the past decade, Federal and State agencies have imposed numerous requirements on theproduction and sale of gasoline in California. ARB has also adopted control measures for diesel PM

AECOM Environment
Wistaria Ranch Solar Energy Center Project June 2014Air Quality Impact Analysis
16
and more stringent emissions standards for various on-road mobile sources of emissions, includingtransit buses and off-road diesel equipment (e.g., tractors, generators).
TACs in California are regulated primarily through the Tanner Air Toxics Act (Assembly Bill [AB] 1807[Chapter 1047, Statutes of 1983]) and the Air Toxics Hot Spots Information and Assessment Act (AB2588 [Chapter 1252, Statutes of 1987]). AB 1807 sets forth a formal procedure for ARB to designatesubstances as TACs. Research, public participation, and scientific peer review must occur beforeARB can designate a substance as a TAC. The Air Toxics Hot Spots Information and Assessment Actrequires that TAC emissions from individual stationary sources be quantified and compiled into aninventory according to criteria and guidelines developed by the ARB, and if directed to do so by thelocal air district, a health risk assessment must be prepared to determine the potential health impactsof such emissions.
3.1.3 Regional and Local Air Quality RegulationsIn Imperial County, the Imperial County Air Pollution Control District (ICAPCD) is the agencyresponsible for protecting the public health and welfare through the administration of Federal andState air quality laws and policies. The ICAPCD develops air quality plans that address State andFederal requirements. The air quality plans include strategies and tactics to be used to attain andmaintain acceptable air quality in Imperial County. The ICAPCD is also responsible for monitoring airpollution and adopting rules and regulations. The rules and regulations include procedures andrequirements to control the emission of pollutants and prevent significant adverse impacts.
ICAPCD Air Quality Plans
In order to demonstrate attainment of the Federal NAAQS, the ICAPCD adopted an 8-hour OzoneAQMP, which was approved by the ICAPCD in 2009. In 2009, the ICAPCD also developed andadopted a PM10 SIP to demonstrate attainment of the PM10 standard.
Ozone Air Quality Management Plan
As a result of the new ozone standards adopted by the EPA in 1997, strategies to decrease higherozone concentrations were required. In response, the ICAPCD adopted the 8-hour Ozone AQMP in2008. Subsequently, the ICAPCD requested further modifications to the AQMP. The final 2009 8-HourOzone Modified AQMP was adopted by the ICAPCD on July 13, 2010 (ICAPCD 2010).
The AQMP includes control measures, which are an integral part of how the ICAPCD currentlycontrols the ROG and NOx emissions within the nonattainment area. The AQMP control measuresinclude ICAPCD stationary source control measures, regional transportation control measures, andthe State strategy. Stationary source control measures include equipment and techniques that reduceair pollutant emissions from stationary sources, such as point sources (permitted facilities) and areasources (generally small and non-permitted). Transportation control measures are both regional andlocal. Regional measures are consistent with the Regional Transportation Plan (RTP) adopted by theSouthern California Association of Governments. ARB adopted the State Strategy for California’s2007 SIP to achieve the additional emission reductions needed for all areas of the State, includingImperial County. The State Strategy includes control measures related to passenger vehicles, trucks,construction equipment, agricultural equipment, goods movement, fuels, recreational vehicles andboats, and pesticides.
The local strategy of the ICAPCD is to rely on the reductions of vehicle miles traveled associated withthe implementation of the Imperial County CEQA Air Quality Handbook (November 2007) (CEQAHandbook). The CEQA Handbook provides guidance to all interested parties on the significance of

AECOM Environment
Wistaria Ranch Solar Energy Center Project June 2014Air Quality Impact Analysis
17
impacts resulting from the development of new residential, commercial, and industrial projects. Oncethe significance of the impact is determined, the CEQA Handbook provides a list of feasible mitigationmeasures that may be implemented to achieve a reduction of those direct and indirect emissionscreated by the development project. Specifically, the CEQA Handbook requires mitigation ofconstruction and operational air emissions.
PM10 State Implementation Plan
The final PM10 SIP was adopted by the ICAPCD on August 11, 2009 (ICAPCD 2009). The PM10 SIPwas required to address and include the following elements, required under the Federal CAA of areasclassified to be in serious nonattainment of the NAAQS:
· Emission inventories;
· Attainment of the Federal PM10 NAAQS;
· Annual reductions in PM10 or PM10 precursor emissions that are of not less than 5 percentfrom the date of SIP submission until attainment;
· Best available control measures (BACM) and best available control technologies forsignificant sources and major stationary sources of PM10, to be implemented no later than 4years after reclassification of the area as serious;
· Transportation conformity and motor vehicle emission budgets in accordance with theattainment plan;
· Reasonable further progress and quantitative milestones; and
· Contingency measures to be implemented in the event that the control measure regulationsincorporated in the plan cannot be successfully implemented or fail to give the expectedemission reductions.
The PM10 nonattainment status required the ICAPCD to begin the development of revised dust controlrules at the BACM level. This process began prior to the development of the SIP. In November 2005,the ICAPCD adopted revised fugitive dust control measures (Regulation VIII), which are the primarycontrol strategy for the PM10 SIP.
ICAPCD Rules and Regulations
The ICAPCD attains and maintains air quality conditions in Imperial County through a comprehensiveprogram of planning, regulation, enforcement, and promotion of the understanding of air qualityissues. ICAPCD regulations are primarily focused on stationary sources, indirect sources, and BACMto minimize air pollutants within their jurisdiction. Portable engines used during construction oroperations that are larger than 50 horsepower (hp) would need to obtain air operating permits fromICAPCD. The Project is required to comply with all ICAPCD rules, and conformance will beincorporated into Project specifications and procedures. In addition to developing rules andrequirements to address emissions, the ICAPCD also adopted guidance policy #5, which helps leadagencies and other interested parties evaluate off-site mitigation from mobile sources attracted tostationary sources.
The ICAPCD has established Regulation VIII to prevent, reduce, or mitigate the fugitive dustemissions. The specific rules applicable to the Project include:
· Rule 800 General Requirements for Control of Fine Particulate Matter,

AECOM Environment
Wistaria Ranch Solar Energy Center Project June 2014Air Quality Impact Analysis
18
· Rule 801 Construction and Earthmoving Activities,
· Rule 802 Bulk Materials,
· Rule 803 Carry-Out and Track-Out,
· Rule 804 Open Areas, and
· Rule 805 Paved and Unpaved Roads.
Compliance with Regulation VIII is mandatory on all construction sites, regardless of the size of theproject.
3.2 Climate Change Regulations3.2.1 Federal RegulationsThe EPA is the Federal agency responsible for implementing the Federal CAA. On April 2, 2007, inMassachusetts v. EPA, 549 U.S. 497 (2007), the Supreme Court found that GHGs are air pollutantscovered by the CAA and that the EPA has the authority to regulate GHGs. The Court held that theEPA Administrator must determine (1) whether or not emissions of GHGs from new motor vehiclescause or contribute to air pollution, which may reasonably be anticipated to endanger public health orwelfare, or (2) whether the science is too uncertain to make a reasoned decision. The EPAAdministrator issued these findings in 2009, which are discussed in greater detail, below.
Mandatory GHG Reporting Rule
On October 30, 2009, the EPA published the final version of the Mandatory GHG Reporting Rule inthe Federal Register. In general, this national reporting requirement provides the EPA with accurateand timely GHG emissions data from facilities that emit 25,000 metric tons (MT) or more of CO2 peryear. Subsequent rulings have expanded the emissions sources required to report emissions data,and now include oil and natural gas industries, industrial wastewater treatment, and landfills. Certaincategories, such as general stationary fuel combustion sources and electricity generation, beganreporting their yearly emissions with the 2010 reporting year. The 2010 emissions were reported toEPA in September 2011. Additional sources, such as the manufacture and use of electrictransmission and distribution equipment, began reporting 2011 emissions in September 2012. Thereare now a total of 41 source categories reporting emissions as a result of the Mandatory GHGReporting Rule (EPA 2013). An estimated 85 percent of the total U.S. GHG emissions, fromapproximately 10,000 facilities, are covered by this final rule.
GHG Findings under the Federal CAA
On December 7, 2009, the EPA Administrator signed two distinct findings regarding GHGs undersection 202(a) of the CAA:
· Endangerment Finding: The EPA Administrator found that the current and projectedconcentrations of the six key well-mixed GHGs (CO2, CH4, N2O, HFCs, PFCs, and SF6) in theatmosphere threaten the public health and welfare of current and future generations.
· Cause or Contribute Finding: The EPA Administrator found that the combined emissions ofthese well-mixed GHGs from new motor vehicles and new motor vehicle engines contribute tothe GHG pollution, which threatens public health and welfare.

AECOM Environment
Wistaria Ranch Solar Energy Center Project June 2014Air Quality Impact Analysis
19
Although these findings did not themselves impose any requirements on industries or other entities,this action was a prerequisite to finalizing the EPA’s Proposed Greenhouse Gas Emission Standardsfor Light-Duty Vehicles. On May 7, 2010, the final Light-Duty Vehicle Greenhouse Gas EmissionsStandards and Corporate Average Fuel Economy Standards were published in the Federal Register.The emissions standards will require model year 2016 vehicles to meet an estimated combinedaverage emissions level of 250 grams of CO2 per mile, which is equivalent to 35.5 miles per gallon ifthe automobile industry were to meet this CO2 level solely through fuel economy improvements.
On August 28, 2012, the U.S. Department of Transportation (USDOT) and the EPA issued a jointFinal Rulemaking requiring additional Federal GHG and fuel economy standards for model year 2017through 2025 passenger cars and light-duty trucks. The standards would require these vehicles tomeet an estimated combined average emissions level of 163 grams of CO2 per mile in model year2025, which is equivalent to 54.5 miles per gallon if the improvements were made solely through fuelefficiency. In addition to the standards for light-duty vehicles, the USDOT and the EPA announcedstandards to reduce GHG emissions and improve the fuel efficiency of heavy-duty trucks and buseson August 9, 2011.
3.2.2 State RegulationsWith the passage of several pieces of legislation, including State Senate Bills (SBs) and ABs andExecutive Orders, California launched an innovative and proactive approach to addressing GHGemissions and climate change at the State level.
Assembly Bill 1493 (Pavley)
AB 1493 requires ARB to develop and implement regulations to reduce automobile and light truckGHG emissions. These stricter emissions standards were designed to apply to automobiles and lighttrucks beginning with model year 2009. In June 2009, the EPA Administrator granted a CAA waiver ofpreemption to California. This waiver allowed California to implement its own GHG emissionsstandards for motor vehicles beginning with model year 2009. California agencies worked withFederal agencies to conduct joint rulemaking to reduce GHG emissions for passenger car modelyears 2017 to 2025.
Executive Order S-3-05
The goal of this Executive Order, signed on June 1, 2005, by Governor Arnold Schwarzenegger, is toreduce California’s GHG emissions to (1) 2000 levels by 2010, (2) 1990 levels by 2020 and (3) 80percent below the 1990 levels by the year 2050. In 2006, this goal was further reinforced with thepassage of AB 32.
Assembly Bill 32
AB 32, the Global Warming Solutions Act of 2006, sets the same overall GHG emissions reductiongoals as outlined in Executive Order S-3-05, while further mandating that ARB create a plan, whichincludes market mechanisms, and implement rules to achieve “real, quantifiable, cost-effectivereductions of greenhouse gases.” Executive Order S-20-06 further directs State agencies to beginimplementing AB 32, including the recommendations made by the State’s Climate Action Team.
Executive Order S-01-07Governor Schwarzenegger set forth the low carbon fuel standard for California. Under this ExecutiveOrder, the carbon intensity of California’s transportation fuels is to be reduced by at least 10 percentby 2020.

AECOM Environment
Wistaria Ranch Solar Energy Center Project June 2014Air Quality Impact Analysis
20
Senate Bill 1078, Senate Bill 107, and Senate Bill X1-2SB 1078 (CEC 2002) requires retail sellers of electricity, including investor-owned utilities andcommunity choice aggregators, to provide at least 20 percent of their supply from renewable sourcesby 2017. SB 107 changed the target date to 2010. Executive Order S-14-08 expands the State’sRenewable Energy Standard to 33 percent renewable power by 2020. This new goal was codified in2011 with the passage of SB X1-2. To meet the goals set out in SB X1-2, a significant effort will beneeded to reduce overall energy used in the State through energy efficiency efforts and a large effortto increase the amount of renewable energy generated and purchased by utility companies.
Senate Bill 97 (Chapter 185, 2007)SB 97 required the Governor’s Office of Planning and Research to develop recommendedamendments to the CEQA Guidelines for addressing GHG emissions. The Amendments becameeffective on March 18, 2010.
Senate Bill 375SB 375, signed in September 2008, aligns regional transportation planning efforts, regional GHGreduction targets, and land use and housing allocation. SB 375 requires Metropolitan PlanningOrganizations (MPOs) to adopt a Sustainable Communities Strategy (SCS) or an Alternative PlanningStrategy (APS), which will prescribe land use allocation in that MPO’s RTP. On September 23, 2010,ARB adopted regional GHG targets for passenger vehicles and light trucks for 2020 and 2035 for the18 MPOs in California. If MPOs do not meet the GHG reduction targets, transportation projects wouldnot be eligible for funding programmed after January 1, 2012.
This bill also extends the minimum time period for the Regional Housing Needs Allocation cycle from5 years to 8 years for local governments located within an MPO that meet certain requirements. Cityor county land use policies (including general plans) are not required to be consistent with the RTP(and associated SCS or APS). However, new provisions of the CEQA would incentivize qualifiedprojects that are consistent with an approved SCS or APS, categorized as “transit priority projects.”
3.2.3 Regional and Local RegulationsThe ARB’s Scoping Plan states that local governments are “essential partners” in the effort to reduceGHG emissions (ARB 2008). The Scoping Plan also acknowledges that local governments havebroad influence and, in some cases, exclusive jurisdiction over activities that contribute to significantdirect and indirect GHG emissions through their planning and permitting processes, local ordinances,outreach and education efforts, and municipal operations. Many of the proposed measures to reduceGHG emissions rely on local government actions.
ICAPCD Rule 903 applies to any stationary source that would have the potential to emit aircontaminants equal to or in excess of the threshold for a major source of regulated air pollutants. In2011, ICAPCD amended Rule 903 to add GHGs to the list of regulated pollutants. As part of therevised rule, stationary sources that do not exceed the de minimis emissions level of 20,000 tonsCO2e per year in a 12-month period would not need to meet recordkeeping and reportingrequirements. The ICAPCD has no regulations or additional guidelines relative to GHG emissions forresidential, commercial, or industrial projects.

AECOM Environment
Wistaria Ranch Solar Energy Center Project June 2014Air Quality Impact Analysis
21
4.0 Existing Conditions
4.1 Environmental Setting, Climate, and MeteorologyThe Project is located in the Salton Sea Air Basin (SSAB). The SSAB consists of the westernportion of Riverside County known as the Coachella Valley and all of Imperial County. ImperialCounty is located in the southeastern corner of California and is surrounded by mountain ranges tothe north and east, with vast open land containing desert sand. It is bordered by Riverside Countyto the north, Mexico to the south, San Diego County to the west, and Arizona to the east. ImperialCounty is a desert community with a warm, dry climate. Summers are extremely hot and dry whilewinters are temperate. The high temperatures, combined with low humidity, produce hot, drysummers that contribute to the buildup of ozone.
Rainfall at the El Centro Station in Imperial County, which is the closest climate monitoring stationto the Project site and represents the Project’s area, climate, and topography in the SSAB,averages approximately 2.64 inches annually (WRCC 2013). The heaviest precipitation occurs inJanuary through March. The mean annual air temperature ranges from 55 degrees Fahrenheit(°F) in January to 92°F in July, with an annual average temperature of approximately 73°F(WRCC 2013).
Air quality within the SSAB is affected by air pollutants transported from the South Coast Air Basinto the northwest and from Mexico to the south. Similarly, wind blowing in a northeast directiontransports pollutants from Mexicali into Calexico.
4.2 Regional and Local Air QualitySpecific geographic areas are classified as either “attainment,” “nonattainment,” or “unclassified”areas for each pollutant, based on the comparison of measured data with Federal and Statestandards. The “unclassified” designation is used in an area that cannot be classified on the basis ofavailable information as meeting or not meeting the standards. The Project area in the SSAB iscurrently designated as a moderate nonattainment area for 8-hour ozone and a serious nonattainmentarea for PM10. The portion of Imperial County encompassing the urban and surrounding areas ofBrawley, Calexico, El Centro, Heber, Holtville, Imperial, Seeley, and Westmorland is designated anonattainment area for the NAAQS for PM2.5. The Project area in the SSAB is in attainment with theNAAQS for the other applicable criteria pollutants. Table 2 shows the Federal and State attainmentstatus for the SSAB.

AECOM Environment
Wistaria Ranch Solar Energy Center Project June 2014Air Quality Impact Analysis
22
Table 2 SSAB Attainment Status
Criteria Pollutant State Designation Federal Designation
CO Attainment Attainment
NO2 Attainment Attainment
SO2 Attainment Attainment
PM10 Serious – Nonattainment Serious – Nonattainment
PM2.5 Unclassified Nonattainment
Ozone (8-hour) Moderate – Nonattainment Moderate – Nonattainment
Lead Attainment Unclassified/Attainment
Sulfates Attainment Not Applicable
H2S Unclassified Not Applicable
Visibility Reducing PM Unclassified Not Applicable
Source: ARB 2013b
Ambient air pollutant concentrations in the SSAB are measured at air quality monitoring stationsoperated by the ARB and the ICAPCD. The El Centro station monitors ozone, CO, NO2, PM10, andPM2.5. Table 3 summarizes the exceedances of the NAAQS and CAAQS and the highest pollutantlevels recorded at this station from 2010 through 2012. As shown in Table 3, ambient airconcentrations of CO and NO2 at the El Centro monitoring station have not exceeded the NAAQS orthe CAAQS in the past 3 years. Ozone concentrations have exceeded the NAAQS and CAAQS everyyear. Concentrations of PM10 and PM2.5 have exceeded the CAAQS and NAAQS at least once in thepast 3 years.
Table 3 Ambient Air Quality Summary for the El Centro Monitoring Station
Pollutant Standards 2010 2011 2012
Carbon Monoxide
Maximum 8-hour concentration (ppm) 5.61 9.01 3.64
Number of days standard exceeded
NAAQS 8-hour (>9 ppm) 0 0 0
CAAQS 8-hour (>9.0 ppm) 0 0 0
Nitrogen Dioxide
Maximum 1-hour concentration (ppm) 0.141 0.117 0.059
Annual average (ppm) 0.004 0.009 *
Number of days standard exceeded
NAAQS 1-hour 0 0 0
CAAQS 1-hour 0 0 0

AECOM Environment
Wistaria Ranch Solar Energy Center Project June 2014Air Quality Impact Analysis
23
Table 3 Ambient Air Quality Summary for the El Centro Monitoring Station
Pollutant Standards 2010 2011 2012
Ozone
Maximum 1-hour concentration (ppm) 0.122 0.103 0.111
Maximum 8-hour concentration (ppm) 0.082 0.084 0.091
Number of days standard exceeded
CAAQS 1-hour (>0.09 ppm) 3 5 9
CAAQS 8-hour (>0.070 ppm) 29 21 26
NAAQS 8-hour (>0.075 ppm) 10 12 14
Particulate Matter (PM10)a
National maximum 24-hour concentration (mg/m3) 69.4 81.9 75.6
State maximum 24-hour concentration (mg/m3) 70.2 80.3 72.1
National annual average concentration (mg/m3) 32.9 32.6 33.4
State annual average concentration (mg/m3) * * 33.5
Number of days standard exceeded
NAAQS 24-hour (>150 mg/m3) 0 0 0
CAAQS 24-hour (>50 mg/m3) * * 6
Particulate Matter (PM2.5)a
National maximum 24-hour concentration (mg/m3) 19.9 54.4 26.4
State maximum 24-hour concentration (mg/m3) 19.9 54.4 26.4
National annual average concentration (mg/m3) 6.5 7.5 7.5
State annual average concentration (mg/m3) 6.6 7.5 *
Number of days standard exceeded
NAAQS 24-hour (>35 mg/m3) 0 2 0
ppm = parts per million; µg/m3 = micrograms per cubic metera State and national statistics may differ for the following reasons: State statistics are based on California-approved
samplers, whereas national statistics are based on samplers using Federal reference or equivalent methods. Stateand national statistics may therefore be based on different samplers. State statistics are based on local conditions,while national statistics are based on standard conditions. State criteria for ensuring that data are sufficiently completefor calculating valid annual averages are more stringent than the national criteria.
* Insufficient or no available data available.Source: ARB 2013c

AECOM Environment
Wistaria Ranch Solar Energy Center Project June 2014Air Quality Impact Analysis
24
4.3 GHG Emission SourcesGHG emissions contributing to global climate change are attributable in large part to human activitiesEmissions of CO2 are byproducts of fossil fuel combustion, and CH4, a highly potent GHG, is theprimary component in natural gas and is associated with agricultural practices and landfills. N2O isalso largely attributable to agricultural practices and soil management.
For purposes of accounting for and regulating GHG emissions, sources of GHG emissions aregrouped into emission categories. The ARB identifies the following categories, which account for mostanthropogenic GHG emissions generated within California:
· Transportation: On-road motor vehicles, recreational vehicles, aviation, ships, and rail.
· Electric Power: Use and production of electrical energy.
· Industrial: Mainly stationary sources (e.g., boilers and engines) associated with processemissions.
· Commercial and Residential: Area sources, such as landscape maintenance equipment,fireplaces, and consumption of natural gas for space and water heating.
· Agriculture: Agricultural sources that include off-road farm equipment; irrigation pumps; cropresidue burning (CO2); and emissions from flooded soils, livestock waste, crop residuedecomposition, and fertilizer volatilization (CH4 and N2O).
· High GWP: Refrigerants for stationary and mobile source air conditioning and refrigeration,electrical insulation (e.g., SF6), and various consumer products that use pressurizedcontainers.
· Recycling and Waste: Waste management facilities and landfills; primary emissions are CO2from combustion and CH4 from landfills and wastewater treatment.
4.4 State Greenhouse Gas Emissions InventoryARB performs an annual GHG inventory for emissions and sinks of the six major GHGs. As shown inFigure 3, California produced 448.1 million metric tons of CO2e in 2011 (ARB 2014). Combustion offossil fuel in the transportation category was the single largest source of California’s GHG emissions in2011, accounting for 38 percent of total GHG emissions in the State. The transportation category wasfollowed by the industrial category, which accounts for 21 percent of total GHG emissions in the State,and electric power (including in- and out-of-state sources), which accounts for 19 percent of total GHGemissions in the State (ARB 2014).

AECOM Environment
Wistaria Ranch Solar Energy Center Project June 2014Air Quality Impact Analysis
25
Figure 3 2011 California GHG Emissions by Category

AECOM Environment
Wistaria Ranch Solar Energy Center Project June 2014Air Quality Impact Analysis
26
5.0 Thresholds of Significance, Impacts, and MitigationMeasures
5.1 Thresholds of SignificancePursuant to CEQA, the analysis of air quality impacts associated with the implementation of theProject and the determination of impact significance were based on the following questions:
· Would the Project conflict with or obstruct implementation of the applicable air quality plan?
· Would the Project violate any air quality standards or contribute substantially to an existing orprojected air quality violation?
· Would the Project result in a cumulatively considerable net increase of any criteria pollutantfor which the Project region is classified as nonattainment under an applicable Federal orState ambient air quality standard (including releasing emissions which exceed quantitativethresholds for ozone precursors)?
· Would the Project expose sensitive receptors to substantial pollutant concentrations?
· Would the Project create objectionable odors that would affect a substantial amount ofpeople?
Air pollutants would be generated during construction activities. The ICAPCD recognizes thetemporary, short-term increase of air pollutants during construction activities and recommends theimplementation of effective and comprehensive mitigation measures to reduce air quality impacts. Inaddition to the CEQA thresholds identified above, Table 4 indicates the ICAPCD’s significancethresholds for construction activities.
Table 4 ICAPCD Significance Thresholds for Construction Activities
Pollutant Thresholds (lbs/day)
PM10 150 lbs/day
ROG 75 lbs/day
NOX 100 lbs/day
CO 550 lbs/day
lbs/day = pounds per day
The ICAPCD also provides pollutant significance thresholds for operational or long-term air pollutantemissions. Projects with the potential to generate emissions exceeding the thresholds would have asignificant impact on air quality. If the Project’s impact exceeds any of the significance criteria, variousmitigation measures are available, depending on the nature of the air quality impact. Any proposedresidential, commercial, or industrial development with a potential to emit less than the thresholds inTable 5 would be considered a Tier I project and may potentially have an adverse impact on local airquality. However, an Initial Study would be required to help the Lead Agency determine whether theproject would have a less than significant impact. Any project with the potential to meet or exceed the

AECOM Environment
Wistaria Ranch Solar Energy Center Project June 2014Air Quality Impact Analysis
27
Tier II thresholds is considered to have a significant impact on regional and local air quality, and theproject is required to develop a Comprehensive Air Quality Analysis Report. Tier II projects are alsorequired to implement all standard mitigation measures as well as all feasible discretionary mitigationmeasures. Table 5 presents the ICAPCD’s significance thresholds for criteria pollutants duringoperational activities.
Table 5 ICAPCD Significance Thresholds for Operational Activities
PollutantTier I
(lb/day)Tier II
(lb/day)
NOx and ROG Less than 55 lbs/day 55 lbs/day and greater
PM10 and SOx Less than 150 lbs/day 150 lbs/day and greater
CO Less than 550 lbs/day 550 lbs/day and greater
Level of Significance Less Than Significant Significant Impact
Level of Analysis Initial Study Comprehensive Air Quality Analysis Report
Environmental Document Negative Declaration Mitigated Negative Declaration or EnvironmentalImpact Report
lbs/day = pounds per day
The CEQA Handbook does not include thresholds of significance for cancer and non-cancer healthrisks associated with construction of the Project. However, the Air Toxics Hot Spots Information andAssessment Act (AB 2588) requires each air district, including ICAPCD, to establish the notificationthreshold at which facilities are required to notify all exposed persons. Consistent with the AB 2588levels established by the ICAPCD, the recommended thresholds of significance for this analysis are(1) no greater than 10 in one million for cancer risks, and (2) a hazard index of less than 1.0 for non-cancer risks.
For this analysis and pursuant to the CEQA, the Project’s GHG emissions and its incrementalcontribution to global climate change would be considered significant if it would:
· Generate GHG emissions, either directly or indirectly, that may have a significant impact onthe environment; or
· Conflict with an applicable plan, policy, or regulation adopted for the purpose of reducing theemissions of GHG.
The ICAPCD has not established quantitative significance thresholds for the evaluation of GHGemissions for CEQA analysis; instead, each project is evaluated on a case-by-case basis using themost up-to-date calculation and analysis methods. Therefore, to establish additional context in whichto consider the order of magnitude of the Project’s construction-, operational-, and decommissioning-related GHG emissions, this analysis reviewed the following guidelines on the levels of GHGemissions other experts and public agencies have used to evaluate whether or not a project’s GHGemissions constitute a cumulatively considerable incremental contribution to climate change in orderto determine which one is most applicable to the Project:
AECOM Environment
Wistaria Ranch Solar Energy Center Project June 2014Air Quality Impact Analysis
28
· The County of San Diego has established a threshold of 2,500 MT CO2e per year as aproject-level GHG significance threshold that would apply to operational and constructionemissions from land use development projects (San Diego County 2012).
· The South Coast Air Quality Management District (SCAQMD) has adopted a significancethreshold for GHG emissions of 10,000 MT CO2e per year where SCAQMD is the leadagency for an industrial project (SCAQMD 2008).
· The SCAQMD GHG Working Group has proposed a significance screening level of 3,000 MTCO2 per year for residential and commercial projects (SCAQMD 2010).
In the absence of ICAPCD thresholds, the evaluation is based on known standards adopted byagencies representing areas that are geographically proximate to the Project site. Since the Project isprimarily industrial and does not involve residential or commercial land uses, the SCAQMD-adoptedthreshold of 10,000 MT CO2e per year is considered the appropriate screening threshold for thisanalysis.
Many California air districts, including SCAQMD, also recommend that construction emissionsassociated with a project be amortized over the life of the project (typically 30 years) and added to theoperational emissions. Therefore, modeled construction-related GHG emissions associated with theProject are discussed first, then operational GHG emissions are totaled and the amortizedconstruction emissions are added to the operational emissions.
As mentioned earlier, decommissioning would result in emissions that are less than construction forthe Project and CUP areas, because the traffic and off-road equipment use would be approximatelyone-half of the amount used during construction. In addition, advancements in engine technology,retrofits, and turnover in the equipment fleet would result in lower levels of emissions than theestimates presented in this report. Similar to the approach for construction emissions, the GHGemissions associated with decommissioning were amortized and added to the operational emissionsto provide a more accurate estimate of the total GHG emissions.
As mentioned earlier, the entire Project may be constructed over 18 months, or it may be built basedon up to 17 different CUP areas over an approximate 10-year period. Therefore, it is not knownexactly when each CUP area will be developed within this 10-year period. The analysis providesdetails of construction and operation of the entire Project, as well as a discussion of impactsassociated with construction and operation of a typical CUP area. The typical CUP area wasdetermined to be CUP 13-0037, based on the proposed energy generation (22 MW), total acreage(224 acres), and the location relative to sensitive receptors. While this is considered to be the typicalCUP area, the combination of characteristics for that CUP area also represents a conservativeapproach to the analysis. Both the overall Project and CUP area analyses are discussed in thepotential impacts in Section 5.2.
5.2 Project ImpactsWould the Project conflict with or obstruct implementation of the applicable air quality plan?
Project-Level Analysis (Near-Term Scenario)
Air quality plans describe air pollution control strategies and measures to be implemented by a city,county, region, and/or air district. The primary purpose of an air quality plan is to bring an area thatdoes not attain Federal and State air quality standards into compliance with the requirements of theFederal CAA and California CAA. In addition, air quality plans are also developed to ensure that an

AECOM Environment
Wistaria Ranch Solar Energy Center Project June 2014Air Quality Impact Analysis
29
area maintains a healthful level of air quality based on the NAAQS and the CAAQS. Projectconsistency is based on whether a Project would conflict with or obstruct implementation of the AQMPand/or applicable portions of the SIP, which would lead to increases in the frequency or severity ofexisting air quality violations.
General Plan and Zoning Designation Consistency
The Project is currently planned for areas that are zoned A-2 (General Agriculture), A-2-R (GeneralAgriculture Rural Zone), and A-3 (Heavy Agriculture). These zoning designations are intendedprimarily for agricultural uses and agricultural-related compatible uses. The Project would beconsistent with the Solar Energy Electrical Generator use and is a similar use to the uses permitted inthe A-2, A-2-R, and A-3 Zones, subject to securing a CUP. The Project Proponent is currently in theprocess of submitting a CUP application to Imperial County to receive approval for the Project.
O&M activities associated with the Project would generate approximately 30 motor vehicle trips perday. Based on the allowable residential density for the Project site and equipment associated withagricultural activities, the Project would not significantly increase activities and emissions that havebeen previously included in the AQMP and SIP.
AQMP and SIP Consistency
As discussed earlier, the ICAPCD has adopted several air quality plans, including the AQMP and SIP.The AQMP does not include any specific measures or requirements that relate to the Project. ThePM10 SIP includes measures to reduce fugitive dust emissions, and the Project would be required toimplement all fugitive dust control measures associated with Regulation VIII.
The Project must also meet the requirements of the CEQA Handbook, including generating emissionsthat do not exceed the thresholds of significance discussed earlier. Once the significance of theimpact is determined, the CEQA Handbook provides a list of feasible mitigation measures which areimplemented for the reduction of those direct and indirect emissions created by the Project.Specifically, the CEQA Handbook requires mitigation of construction and operational air emissions.
As discussed later in the emissions analysis, the Project would exceed the recommended threshold ofsignificance for NOx emissions during construction. Since the Project would result in a significantincrease in NOx emissions, the Project has the potential to conflict with or obstruct implementation ofthe AQMP and SIP. This impact would be potentially significant. However, implementation ofMitigation Measures AQ-1 through AQ-4 would reduce NOX emissions below the ICAPCD threshold ofsignificance. Therefore, compliance with all requirements of Mitigation Measure AQ-1 through AQ-4would reduce significant impacts associated with Project construction to a less than significant level.
CUP Area Analysis (Phased-Construction Scenario)
General Plan and Zoning Designation Consistency
As discussed above, the development of the overall Project, including the CUP area, would beconsistent with the land uses permitted in the A-2 and A-2-R Zones. Operation of the CUP area couldrequire approximately two full-time personnel and would generate approximately four motor vehicletrips per day. Based on the allowable residential density for the site and equipment associated withagricultural activities, the CUP area would not significantly increase activities and emissions that havebeen previously included in the AQMP and SIP.

AECOM Environment
Wistaria Ranch Solar Energy Center Project June 2014Air Quality Impact Analysis
30
AQMP and SIP Consistency
As discussed later in the emissions analysis, construction of the CUP area would exceed therecommended threshold of significance for NOx emissions. Since the CUP area would result in asignificant increase in NOx emissions, the CUP area has the potential to conflict with or obstructimplementation of the AQMP and SIP. This impact would be potentially significant. However,implementation of Mitigation Measures AQ-1 through AQ-3 would reduce NOX emissions below theICAPCD threshold of significance. Therefore, compliance with all requirements of Mitigation MeasureAQ-1 through AQ-3 would reduce significant impacts associated with Project construction of CUPareas to a less than significant level.
Would the Project violate any air quality standards or contribute substantially to an existing orprojected air quality violation?
Project-Level Analysis (Near-Term Scenario)
Construction Emissions
Construction of the Project would result in the temporary generation of ROG, NOx, CO, SO2, PM10,and PM2.5 emissions. ROG, NOx, CO, and SO2 emissions are primarily associated with mobileequipment exhaust, including off-road construction equipment and on-road motor vehicles. FugitivePM dust emissions are primarily associated with site preparation and vary as a function of suchparameters as soil silt content, soil moisture, wind speed, acreage of disturbance area, and milestraveled by construction vehicles on and off site. Construction emission estimates also include the useof five 5-hp diesel-powered generators that operate for 8 hours per day.
Project construction would consist of several types of activities, including site preparation, postinstallation, electrical work, module installation, construction of the substation and O&M buildings,and construction of electrical transmission facilities. The Project is assumed to be built over an 18-month period. Construction activities would generally occur for 8 hours per day and 5 days perweek. The Project’s construction emissions were modeled based on a worst-case scenariorepresenting an intensive day of construction to conservatively estimate the maximum dailyemissions. This assumes that all construction activities (except mobilization) will overlap for a fewmonths during the construction period. Given that exhaust emissions rates of the constructionequipment fleet in California are expected to decrease over time as stricter standards take effect,construction emissions were estimated using the earliest calendar year when construction couldbegin (i.e., 2015) to generate conservative estimates. If construction were to occur in later years,advancements in engine technology, retrofits, and turnover in the equipment fleet are anticipatedto result in lower levels of emissions. Therefore, using the earliest year of construction providesthe most conservative estimate of construction emissions.
Construction emissions associated with the Project were quantified using the California EmissionsEstimator Model (CalEEMod) Version 2013.2.2. CalEEMod allows the user to enter project-specificconstruction information, such as types, number and horsepower of construction equipment, andnumber and length of off-site motor vehicle trips. Additional information is provided in Appendix A.Table 6 shows the estimated criteria pollutant emissions from construction activities.

AECOM Environment
Wistaria Ranch Solar Energy Center Project June 2014Air Quality Impact Analysis
31
Table 6 Project Unmitigated Daily Construction Emissions
Construction PhaseROG
(lbs/day)NOX
(lbs/day)CO
(lbs/day)SO2
(lbs/day)PM10
(lbs/day)1,2PM2.5
(lbs/day)1
2015
Mobilization 1.22 13.54 7.71 0.02 0.67 0.52
Site Preparation 22.51 279.03 130.84 0.28 27.35 11.67
Post Installation 6.30 42.95 54.33 0.06 4.50 2.98
Below Grade Electrical 4.06 29.93 39.21 0.05 3.50 2.07
Above Grade Electrical 1.15 3.54 20.65 0.02 1.88 0.57
Module Installation 1.68 10.34 26.00 0.03 2.27 0.93
Substation 2.56 19.88 28.29 0.03 2.64 1.27
Transmission Line3 1.89 12.53 25.00 0.03 2.24 0.90
Miscellaneous 1.64 7.35 22.36 0.03 2.07 0.76
2015 Maximum Daily4,5
Emissions 41.79 405.55 346.70 0.54 46.44 21.15
2016
Site Preparation 21.00 257.44 122.88 0.28 26.42 10.81
Post Installation 6.15 41.12 52.43 0.06 4.39 2.88
Below Grade Electrical 3.79 27.85 37.01 0.05 3.39 1.97
Above Grade Electrical 1.02 3.19 18.53 0.02 1.86 0.56
Module Installation 1.50 9.28 23.84 0.03 2.20 0.87
Substation 2.36 18.61 26.05 0.03 2.59 1.22
Transmission Line3 1.72 11.57 22.63 0.03 2.20 0.87
O&M Buildings 2.36 18.62 26.06 0.03 2.59 1.22
Miscellaneous 1.47 6.70 20.14 0.03 2.04 0.73
Demobilization 1.22 13.54 7.71 0.02 0.67 0.52
2016 Maximum DailyEmissions4,5 41.37 394.36 349.56 0.57 47.66 21.11
Maximum DailyEmissions 41.79 405.55 349.56 0.57 47.66 21.15
Threshold of Significance 75 100 550 N/A 100 N/A
Significant Impact? No YES No No No No

AECOM Environment
Wistaria Ranch Solar Energy Center Project June 2014Air Quality Impact Analysis
32
Table 6 Project Unmitigated Daily Construction Emissions
1 PM10 emissions shown include the sum of particulate matter with aerodynamic diameter 0 to 2.5 microns and particulatematter with aerodynamic diameter 2.5 to 10 microns.2 Fugitive dust emissions were reduced based on watering two times per day, applying soil stabilizers, and limiting speeds onunpaved roads.3 The “Transmission Line” construction phase includes construction of the Wistaria Solar Energy Center Project gen-tie andelectrical collector corridor lines, as well as improvements to the existing Mount Signal Solar Project gen-tie line.4 Maximum daily emissions for 2015 and 2016 assume that all construction phases (except mobilization in 2015 anddemobilization in 2016) will overlap during each year.5 Totals may not add correctly due to rounding.
ROG = reactive organic gases; NOX = oxides of nitrogen; CO = carbon monoxide; SO2 = sulfur dioxide; PM10 = suspendedparticulate matter; PM2.5 = fine particulate matter
Source: Estimated by AECOM in 2014
As shown in Table 6, construction-related emissions of ROG, CO, SO2, PM10, and PM2.5 would notexceed the thresholds of significance and would not violate any air quality standard or contributesubstantially to an existing or projected air quality violation. However, construction-generated NOxemissions would exceed the applicable mass emission thresholds. Therefore, temporary constructionemissions would have a significant impact to regional air quality.
In addition to mitigation measures to reduce NOx emissions, mitigation measures are required toreduce PM10 emissions associated with construction of the Project. All construction sites, regardless ofsize, must comply with the requirements contained within Regulation VIII and implement standardmitigation measures for fugitive PM10 control even if there is no significant impact from PM10. Theimplementation of discretionary mitigation measures applies to those construction sites that are5 acres or more in size for non-residential developments.
The ICAPCD recommends the implementation of effective and comprehensive mitigation measures.To reduce construction-related emissions, the Project shall implement applicable control measures forthe duration of the construction period, as follows:
AQ-1 The Project Proponent shall submit to the ICAPCD for approval a dust control plan identifyingall sources of PM10 emissions and associated mitigation measures during the construction andoperational phases of the Project. The Project Proponent shall submit a “ConstructionNotification Form” to the ICAPCD 10 days prior to the commencement of any earthmovingactivity. The dust control plan submitted to the ICAPCD shall meet all applicable requirementsfor control of fugitive dust emissions, including the following measures:
· All disturbed areas, including bulk material storage that is not being actively utilized, shallbe effectively stabilized, and visible emissions shall be limited to no greater than 20percent opacity for dust emissions by using water, chemical stabilizers, dust suppressants,tarps or other suitable material, such as vegetative ground cover. Bulk material is definedas earth, rock, silt, sediment, and other organic and/or inorganic material consisting of orcontaining PM with 5 percent or greater silt content.
· All on-site and off-site unpaved roads shall be effectively stabilized, and visible emissionsshall be limited to no greater than 20 percent opacity for dust emissions by paving,chemical stabilizers, dust suppressants, and/or watering.

AECOM Environment
Wistaria Ranch Solar Energy Center Project June 2014Air Quality Impact Analysis
33
· All unpaved traffic areas 1 acre or more in size with 75 or more average vehicle trips perday, shall be effectively stabilized, and visible emissions shall be limited to no greater than20 percent opacity for dust emissions by paving, chemical stabilizers, dust suppressantsand/or watering.
· The transport of bulk materials shall be completely covered, unless 6 inches of freeboardspace from the top of the container is maintained with no spillage and loss of bulk material.In addition, the cargo compartment of all haul trucks is to be cleaned and/or washed at thedelivery site after removal of bulk material.
· All track-out or carry-out, which includes bulk materials that adhere to the exterior surfacesof motor vehicles and/or equipment (including tires) that may then fall onto the pavement,will be cleaned at the end of each workday, or immediately when mud or dirt extends acumulative distance of 50 linear feet or more onto a paved road within an urban area.
· Movement of bulk material handling or transfer shall be stabilized prior to handling, or atpoints of transfer with application of sufficient water, chemical stabilizers, or by shelteringor enclosing the operation and transfer line.
· The construction of new unpaved roads is prohibited within any area with a population of500 or more, unless the road meets ICAPCD’s definition of a “temporary unpaved road.”Any temporary unpaved road shall be effectively stabilized and visible emissions shall belimited to no greater than 20 percent opacity for dust emission by paving, chemicalstabilizers, dust suppressants and/or watering.
AQ-2 The Project Proponent shall comply with all applicable standard mitigation measures forconstruction combustion equipment for the reduction of excess NOx emissions as contained inthe Imperial County CEQA Air Quality Handbook and associated regulations. These measuresinclude:
· Use of alternative fueled or catalyst equipped diesel construction equipment, including alloff-road and portable diesel powered equipment.
· Minimize idling time, either by shutting equipment off when not in use or reducing the timeof idling to five minutes at a maximum.
· Limit the hours of operation of heavy-duty equipment and/or the amount of equipment inuse.
· Replace fossil-fueled equipment with electrically driven equivalents (provided they are notrun via a portable generator set and they are available, cost effective, and capable ofperforming the task in an effective, timely manner).
· Register all portable engines 50 hp or greater with the ICAPCD.
· Curtail construction during periods of high ambient pollutant concentrations; this mayinclude ceasing construction activity during the peak hour of vehicular traffic on adjacentroadways.
· Implement activity management (e.g. rescheduling activities to avoid overlap ofconstruction phases, which would reduce short-term impacts).
AQ-3 The Project Proponent shall also utilize all Tier 3 or better construction equipment, unless suchan engine is not available for a particular item of equipment.

AECOM Environment
Wistaria Ranch Solar Energy Center Project June 2014Air Quality Impact Analysis
34
AQ-4 The Project Proponent shall pay an emission mitigation fee sufficient to offset the amount bywhich the Project’s NOx emissions exceed the 100 lbs/day threshold consistent with ICAPCDPolicy #5. ICAPCD allows a project to pay in-lieu impact fees utilizing the most current CarlMoyer Cost Effective methodology to reduce excess NOx emissions. Under the ICAPCDprogram, the exact amount of the fee cannot be calculated until the time of construction whenmore precise data regarding the construction equipment types and hours of operation areknown and ICAPCD can calculate the fee. Prior to any earthmoving activity, the ProjectProponent shall submit to the ICAPCD a complete list of all construction equipment to beutilized during the construction phase identifying Make, Model, Year, Horsepower andestimated hours of usage.
Implementation of Mitigation Measures AQ-1 through AQ-4 would reduce criteria pollutant emissionsassociated with construction of the Project. NOx emission reductions were estimated for MitigationMeasure AQ-3, which requires the use of Tier 3 engines. Potential reductions were not estimated forthe remaining mitigation measures, since it is unknown the extent to which they would be incorporatedinto construction of the Project. The mitigated NOx emissions were estimated at 211.19 and 218.24pounds per day in 2015 and 2016, respectively. Therefore, construction-related NOx emissions wouldstill exceed the threshold of significance of 100 pounds per day. However, Mitigation Measure AQ-4would require payment of an offset fee to reduce total construction-related emissions below thethreshold of significance. The fees paid to the ICAPCD would be used to fund mitigation projects thatreduce NOx emissions throughout the county. Therefore, construction of the Project would not violateair quality standards or contribute substantially to an existing or projected air quality violation. Thisimpact would be less than significant with mitigation.
Operational Emissions
The Project would incorporate an on-site O&M building for each CUP area. The Project is expected togenerate approximately 30 average daily trips associated with worker commute trips. Given theProject location, it was estimated that each one-way trip would be approximately 40 miles.
On-site operations activity would include in-place panel washing, which would require approximately60 acre feet of water per year. Operational emissions would also result from intermittent use of diesel-powered emergency generators for maintenance and testing purposes. Each 250-hp generator wouldbe run for testing and maintenance for approximately 1 hour each week, for a total of 50 hours peryear. Table 7 shows the estimated criteria pollutant emissions from operational activities. Additionaldetails are included in Appendix A.
Table 7 Project Unmitigated Daily Operational Emissions
Emissions SourceROG
(lbs/day)NOX
(lbs/day)CO
(lbs/day)SO2
3
(lbs/day)PM10
(lbs/day)PM2.5
(lbs/day)Operational Emissions 2.34 26.34 17.64 0.06 44.35 7.34
Threshold of Significance 55 55 550 150 150 N/A
Significant Impact? No No No No No No1 Emissions shown represent the maximum daily emissions that would occur from summertime or wintertime
operations.2 Totals may not add correctly due to rounding.3 SO2 emissions are used to represent SOx emissions for purposes of comparing Project-related emissions to the
threshold, as the ICAPCD does not have a threshold of significance for SO2.ROG = reactive organic gases; NOX = oxides of nitrogen; CO = carbon monoxide; SO2 = sulfur dioxide;
PM10 = suspended particulate matter; PM2.5 = fine particulate matter.Source: Estimated by AECOM in 2014

AECOM Environment
Wistaria Ranch Solar Energy Center Project June 2014Air Quality Impact Analysis
35
As shown in Table 7, the Project’s operational emissions would not exceed the thresholds ofsignificance for the identified criteria pollutants. Therefore, the Project would not result in a significantincrease in operational emissions. However, the Project site would include unpaved areas, andoperational activities would include travel on unpaved roads. Similar to construction-related PM10impacts, mitigation measures are required to reduce PM10 emissions associated with operation of theProject. The Project will implement Mitigation Measure AQ-1 to reduce any potential impactsassociated with the generation of fugitive dust emissions. This impact would be less than significantwith mitigation.
CUP Area Analysis (Phased-Construction Scenario)
Construction Emissions
Based on a total construction schedule of 10 years for all 17 CUP areas, each CUP area would beconstructed over approximately 7 months. Construction of the CUP area would consist of the sameactivities as the overall Project, including site preparation, post installation, electrical work, moduleinstallation, construction of the substation and O&M building, and construction of electricaltransmission facilities. Construction activities would generally occur for 8 hours per day and 5 days perweek, which includes the use of three 5-hp diesel-powered generators that operate for 8 hours perday.
Construction emissions were quantified using the CalEEMod. Table 8 shows the estimated criteriapollutant emissions from construction activities. Additional information is provided in Appendix A.
Table 8 CUP Area Unmitigated Daily Construction Emissions
Construction PhaseROG
(lbs/day)NOX
(lbs/day)CO
(lbs/day)SO2
(lbs/day)PM10
(lbs/day)1,2PM2.5
(lbs/day)1
2015 Maximum DailyEmissions
9.86 105.86 68.46 0.11 14.09 5.55
2016 Maximum DailyEmissions
3.51 33.76 29.71 0.04 2.79 1.76
Maximum DailyEmissions 3 9.86 105.86 68.46 0.11 14.09 5.55
Threshold of Significance 75 100 550 N/A 100 N/A
Significant Impact? No YES No No No No1 PM10 emissions shown include the sum of particulate matter with aerodynamic diameter 0 to 2.5 microns and particulatematter with aerodynamic diameter 2.5 to 10 microns.2 Fugitive dust emissions were reduced based on watering two times per day, applying soil stabilizers, and limiting speeds onunpaved roads.3 Totals may not add correctly due to rounding.
ROG = reactive organic gases; NOX = oxides of nitrogen; CO = carbon monoxide; SO2 = sulfur dioxide; PM10 = suspendedparticulate matter; PM2.5 = fine particulate matter
Source: Estimated by AECOM in 2014

AECOM Environment
Wistaria Ranch Solar Energy Center Project June 2014Air Quality Impact Analysis
36
As shown in Table 8, construction-related emissions of ROG, CO, SO2, PM10, and PM2.5 would notexceed the thresholds of significance and would not violate any air quality standard or contributesubstantially to an existing or projected air quality violation. However, construction-generated NOxemissions would exceed the applicable mass emission thresholds. Therefore, temporary constructionemissions would have a significant impact to regional air quality.
Implementation of Mitigation Measures AQ-1 through AQ-3 would reduce NOx emissions associatedwith construction of the CUP area. The mitigated NOx emissions were estimated at 50.04 pounds perday in 2015 and would not exceed the threshold of significance of 100 pounds per day. This impactwould be less than significant with mitigation.
Operational Emissions
The CUP area would incorporate an on-site O&M building and would be expected to generateapproximately four average daily trips associated with worker commutes. It was estimated that eachone-way trip would be approximately 40 miles. On-site operations activity would include in-place panelwashing and intermittent use of diesel-powered emergency generators for maintenance and testingpurposes. This analysis assumes that one 250-hp generator would be run for approximately 1 houreach week, for a total of 50 hours per year. Table 9 shows the estimated criteria pollutant emissionsfrom operational activities. Additional details are included in Appendix A.
Table 9 CUP Area Unmitigated Daily Operational Emissions
Emissions SourceROG
(lbs/day)NOX
(lbs/day)CO
(lbs/day)SO2
3
(lbs/day)PM10
(lbs/day)PM2.5
(lbs/day)
Operational Emissions 0.21 1.96 2.53 0.01 10.8 1.6
Threshold of Significance 55 55 550 150 150 N/A
Significant Impact? No No No No No No1 Emissions shown represent the maximum daily emissions that would occur from summertime or wintertime
operations.2 Totals may not add correctly due to rounding.3 SO2 emissions are used to represent SOx emissions for purposes of comparing CUP area emissions to the threshold, as
the ICAPCD does not have a threshold of significance for SO2. ROG = reactive organic gases; NOX = oxides of nitrogen; CO = carbon monoxide; SO2 = sulfur dioxide;
PM10 = suspended particulate matter; PM2.5 = fine particulate matter.Source: Estimated by AECOM in 2014
As shown in Table 9, the operational emissions for the CUP area would not exceed the thresholds ofsignificance for the identified criteria pollutants. Therefore, the CUP area would not result in asignificant increase in operational emissions. However, the CUP area would include unpaved areas,and operational activities would include travel on unpaved roads. Implementation of MitigationMeasure AQ-1 would reduce any potential impacts associated with the generation of fugitive dustemissions. This impact would be less than significant with mitigation.
Decommissioning Phase
Construction emissions for the decommissioning phase were estimated using the CalEEMod. Thedecommissioning analysis for criteria pollutant emissions is applicable to both the Project-LevelAnalysis (Near-Term Scenario) and CUP area Analysis (Phased-Construction Scenario), since the
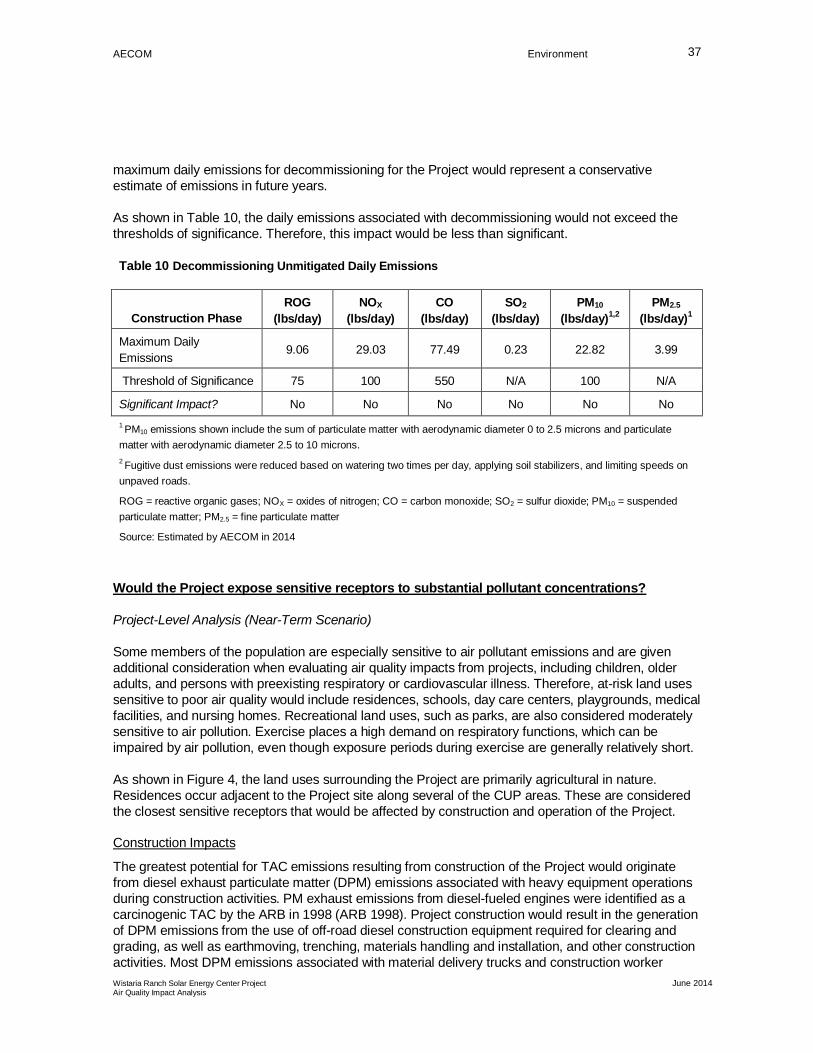
AECOM Environment
Wistaria Ranch Solar Energy Center Project June 2014Air Quality Impact Analysis
37
maximum daily emissions for decommissioning for the Project would represent a conservativeestimate of emissions in future years.
As shown in Table 10, the daily emissions associated with decommissioning would not exceed thethresholds of significance. Therefore, this impact would be less than significant.
Table 10 Decommissioning Unmitigated Daily Emissions
Construction PhaseROG
(lbs/day)NOX
(lbs/day)CO
(lbs/day)SO2
(lbs/day)PM10
(lbs/day)1,2PM2.5
(lbs/day)1
Maximum DailyEmissions
9.06 29.03 77.49 0.23 22.82 3.99
Threshold of Significance 75 100 550 N/A 100 N/A
Significant Impact? No No No No No No1 PM10 emissions shown include the sum of particulate matter with aerodynamic diameter 0 to 2.5 microns and particulatematter with aerodynamic diameter 2.5 to 10 microns.2 Fugitive dust emissions were reduced based on watering two times per day, applying soil stabilizers, and limiting speeds onunpaved roads.
ROG = reactive organic gases; NOX = oxides of nitrogen; CO = carbon monoxide; SO2 = sulfur dioxide; PM10 = suspendedparticulate matter; PM2.5 = fine particulate matter
Source: Estimated by AECOM in 2014
Would the Project expose sensitive receptors to substantial pollutant concentrations?
Project-Level Analysis (Near-Term Scenario)
Some members of the population are especially sensitive to air pollutant emissions and are givenadditional consideration when evaluating air quality impacts from projects, including children, olderadults, and persons with preexisting respiratory or cardiovascular illness. Therefore, at-risk land usessensitive to poor air quality would include residences, schools, day care centers, playgrounds, medicalfacilities, and nursing homes. Recreational land uses, such as parks, are also considered moderatelysensitive to air pollution. Exercise places a high demand on respiratory functions, which can beimpaired by air pollution, even though exposure periods during exercise are generally relatively short.
As shown in Figure 4, the land uses surrounding the Project are primarily agricultural in nature.Residences occur adjacent to the Project site along several of the CUP areas. These are consideredthe closest sensitive receptors that would be affected by construction and operation of the Project.
Construction Impacts
The greatest potential for TAC emissions resulting from construction of the Project would originatefrom diesel exhaust particulate matter (DPM) emissions associated with heavy equipment operationsduring construction activities. PM exhaust emissions from diesel-fueled engines were identified as acarcinogenic TAC by the ARB in 1998 (ARB 1998). Project construction would result in the generationof DPM emissions from the use of off-road diesel construction equipment required for clearing andgrading, as well as earthmoving, trenching, materials handling and installation, and other constructionactivities. Most DPM emissions associated with material delivery trucks and construction worker

AECOM Environment
Wistaria Ranch Solar Energy Center Project June 2014Air Quality Impact Analysis
38
vehicles would occur off site. For the purposes of this analysis, PM10 exhaust emissions from on-sitediesel-fueled construction equipment were used to represent DPM emissions, as DPM is consideredto be less than or equal to 10 micrometers in diameter. Therefore, PM10 represents the upper limit forDPM emissions associated with construction of the Project.
The generation of DPM from construction projects typically occurs in a single area for a short period oftime. The dose of TACs to which receptors are exposed is the primary factor used to determine healthrisk. Dose is a function of the concentration of a substance or substances in the environment and theextent of exposure a person has with the substance. Dose is positively correlated with time, meaningthat a longer exposure period to a fixed amount of emissions results in a higher exposure level andhigher health risks for the maximally exposed individual. According to the Office of EnvironmentalHealth Hazard Assessment’s health risk assessments program (OEHHA 2003), which is used todetermine the exposure of sensitive receptors to TAC emissions, cancer risk should be based on a70-year exposure period; however, such assessments can be limited to the period/duration ofactivities associated with the Project.
The longest period that construction activities would occur at a distance reasonably considered tohave an effect on a sensitive receptor is approximately 18 months. Thus, if the duration ofconstruction activities near a sensitive receptor is 18 months, then the exposure would beapproximately two percent of the total exposure period used for typical health risk calculations(i.e., 70 years).

Figure 4Sensitive Receptor Locations
Source: Image courtesy of USGS © AND © 2013 Nokia © AND ; ESRI; AECOM; Wistaria 2013
Path: P:\2012\60250473\06GIS\6.3_Layout\AirQuality\SR_Locs.mxd, 1/16/2014, steinb
0.5 0 0.50.25 Mile
Wistaria Ranch Solar Energy Center I
LEGEND
Scale: 1:31,680; 1 inch = 0.5 mile
Project Site Parcels") Sensitive Receptor
CUP BoundaryParcels
LEGEND

AECOM Environment
Wistaria Ranch Solar Energy Center Project June 2014Air Quality Impact Analysis
40
The SCREEN3 emissions modeling program is used to estimate pollutant concentrations at specificdistances from emission sources. SCREEN3 incorporates conservative assumptions, such as a singlewind direction blowing toward the receptor, limited mixing (of air and pollutants), and simple terrain. Avolume source in SCREEN3 was used to represent construction activities that would occur on theProject site. The area of the volume source was assumed to be the total acreage of the two CUPareas to account for the fact that construction emissions may occur on a given day over that entirearea. The volume sources representing emissions from the construction equipment were given aninitial exhaust release height of 5 meters to account for the height of the equipment exhaust stack andinitial plume rise of the heated exhaust. An initial vertical dimension of 1.2 meters was also applied tothe volume sources. The edge of the volume source was assumed to be located at the boundary ofthe Project site closest to the nearest sensitive receptor (SR 17), which is located southeast ofAssessor’s Parcel Number 052-180-028 and north of State Route 98. The location of this sensitivereceptor is adjacent to two CUP areas (CUP 13-0036 and CUP 13-0037) and would be subject to thehighest potential emission concentrations. The results of the SCREEN3 dispersion modelingestimated that the nearest sensitive receptor would be exposed to an average annual DPMconcentration of 0.16 micrograms per cubic meter (µg/m3).
This assessment considers exposure via inhalation only. The potential exposure through otherpathways (e.g., ingestion) requires substance and site-specific data, and the specific parameters forDPM are not known for these pathways (ARB 1998). The risk is calculated by multiplying the dose bythe inhalation potency factor. The inhalation potency factor for diesel PM is 1.1 milligrams per kilogramper day (mg/kg/day) (OEHHA 2003).
The resulting estimated cancer risk is 1.10 in one million. The estimated cancer risk was based on theannual average DPM concentration estimated with the SCREEN3 model, inhalation potency factor,and default estimates of breathing rate, body weight, and exposure period (OEHHA 2003). Additionaldetails are provided in Appendix B. The modeled cancer risks would not exceed the significancethreshold of ten in one million. Therefore, the Project’s construction-related cancer risk to sensitivereceptors would be less than significant.
In addition to the potential cancer risk, DPM may result in chronic (i.e., long-term) noncancer healthimpacts. The chronic noncancer inhalation hazard indices for the Project were calculated by dividingthe modeled annual average DPM concentrations by the Reference Exposure Level (REL). The RELis the concentration below which no adverse non-cancer health effects are anticipated. The OEHHAhas recommended an ambient concentration of 5 µg/m3 as the chronic inhalation REL for DPM. Noinhalation REL for acute (i.e., short-term) effects has been determined for DPM by OEHHA. Thechronic hazard index for the nearest sensitive receptor would be 0.032, which is less than thesignificance threshold of 1.0 for non-cancer health impacts. Therefore, the non-cancer health impactsassociated with the Project’s construction-related TAC impacts to sensitive receptors would be lessthan significant.
Operational Impacts
Operation of the Project would primarily involve gasoline- and/or diesel-fueled vehicles associatedwith worker commutes and in-place solar panel washing. Worker commutes would involve 30 averagedaily trips and would occur off site. Panel washing would involve substantially fewer vehicles thanconstruction activities (up to four vehicles per day), and diesel equipment used for panel washingwould operate intermittently over the entire Project site. Operational emissions would also result fromintermittent use of diesel-powered emergency generators for maintenance and testing purposes andwould be permitted by the ICAPCD. No stationary sources of TAC emissions are anticipated to be
AECOM Environment
Wistaria Ranch Solar Energy Center Project June 2014Air Quality Impact Analysis
41
located on the Project site. Therefore, it is not anticipated that individual receptors would be exposedto TAC emissions during operation of the Project.
The Project would not expose sensitive receptors to substantial operational pollutant concentrations.The impact would be less than significant.
CUP Area Analysis (Phased-Construction Scenario)
As shown in Figure 4, the land uses surrounding CUP 13-0037 are primarily agricultural in nature.Several residential properties are located adjacent to the site. These are considered the closestsensitive receptors that would be affected by construction and operation of the CUP area.
Construction Impacts
The greatest potential for TAC emissions resulting from construction of the CUP area would originatefrom DPM emissions associated with heavy equipment operations during construction activities. Thelongest period that construction activities would occur at a distance reasonably considered to have aneffect on a sensitive receptor is approximately 7 months. Thus, if the duration of construction activitiesnear a sensitive receptor is 7 months, then the exposure would be approximately 1 percent of the totalexposure period used for typical health risk calculations.
As discussed under the Project-level analysis, SCREEN3 was used to estimate pollutantconcentrations from construction activities. The SCREEN3 modeling included CUP 13-0037, as wellas the emissions associated with construction of CUP 13-0036. The estimated cancer risk for thecombined CUP areas was less than the significance threshold of ten in one million. In addition, thechronic hazard index was less than the significance threshold of 1.0 for non-cancer health impacts.Additional details are provided in Appendix B. Since the combined impacts related to TAC emissionsfrom CUP 13-0036 and CUP 13-0037 would not result in a significant impact, it can be expected thatthe individual impacts of those CUP areas would also be less than significant.
Operational Impacts
Operation of the CUP area would primarily involve gasoline- and/or diesel-fueled vehicles associatedwith worker commutes and in-place solar panel washing. Operational emissions would also resultfrom intermittent use of diesel-powered emergency generators for maintenance and testing purposesand would be permitted by the ICAPCD. No stationary sources of TAC emissions are anticipated to belocated in the CUP area. Therefore, it is not anticipated that individual receptors would be exposed toTAC emissions during operations.
The CUP area would not expose sensitive receptors to substantial operational pollutantconcentrations. The impact would be less than significant.
Decommissioning Phase
As discussed earlier, SCREEN3 was used to estimate pollutant concentrations from constructionactivities. The estimated cancer risk was less than the significance threshold of ten in one million. Inaddition, the chronic hazard index was less than the significance threshold of 1.0 for non-cancerhealth impacts. Since the decommissioning activities would require approximately one-half the off-road equipment as the initial construction period, it can be expected that the impacts associated withthe decommissioning phase would also be less than significant. Furthermore, construction equipmentused in the decommissioning would be operating with cleaner engines (e.g., Tier 4 or better) thatsignificantly reduce criteria pollutant and TAC emissions. Therefore, the Project would not expose

AECOM Environment
Wistaria Ranch Solar Energy Center Project June 2014Air Quality Impact Analysis
42
sensitive receptors to substantial pollutant concentrations during the decommissioning phase. Theimpact would be less than significant.
Would the Project create objectionable odors that would affect a substantial amount ofpeople?
Project-Level Analysis (Near-Term Scenario)
The occurrence and severity of odor impacts depend on numerous factors, including the nature,frequency, and intensity of the source; wind speed and direction; and the presence of sensitivereceptors. While offensive odors rarely cause physical harm, they still can be very unpleasant, andcan generate citizen complaints to local governments and regulatory agencies.
Potential sources that may emit odors during construction and decommissioning activities includeexhaust from diesel construction equipment. However, because of the temporary nature of theseemissions and the highly diffusive properties of diesel exhaust, nearby receptors are not anticipated tobe adversely affected by diesel exhaust odors associated with Project construction. Odors from thesesources would be localized and generally confined to the immediate area surrounding the Project site.The odors would be typical of most construction sites and temporary in nature. Operation of theProject would not be expected to add new odor sources. As a result, the Project would not createobjectionable odors affecting a substantial number of people. The impact would be less thansignificant.
CUP Area Analysis (Phased-Construction Scenario)
Odor impacts for the CUP area would be similar to the overall Project. Odors from construction anddecommissioning activities, including diesel exhaust, would be localized and generally confined to theimmediate area surrounding the construction site. The odors would be typical of most constructionsites and temporary in nature. Operation of the CUP area would not be expected to add new odorsources. As a result, the CUP area would not create objectionable odors affecting a substantialnumber of people. The impact would be less than significant.
Would the Project generate greenhouse gas emissions, either directly or indirectly, that mayhave a significant impact on the environment?
Project-Level Analysis
Construction Impacts
Short-term construction of the Project would generate GHG emissions. Construction emissions wouldbe associated with vehicle engine exhaust from construction equipment, haul trips, constructionworker trips, and water consumption. Construction activities will require approximately 1,200 acre-feetof water for dust control and other construction activities. GHG emissions generated by the Projectwould predominantly consist of CO2. While emissions of other GHGs, such as CH4, are important withrespect to global climate change, emission levels of other GHGs are less dependent on theemissions-generating activities associated with the Project than are levels of CO2. However, whereappropriate emission factors were available, emissions of CH4 and N2O were included in the analysisof the Project.
Total construction-related GHG emissions were estimated using CalEEMod with the same inputs andassumptions that were used to estimate criteria pollutant construction emissions. Construction of the

AECOM Environment
Wistaria Ranch Solar Energy Center Project June 2014Air Quality Impact Analysis
43
Project was estimated to generate approximately 7,463 MT CO2 over the duration of the 18-monthconstruction period.2 Therefore, the total estimated construction-related GHG emissions of 7,463 MTCO2 associated with the Project is divided by 30 years (approximately 249 MT CO2 per year) toestimate the amortized construction emissions over the lifetime of the Project.
Decommissioning of the Project was estimated to generate approximately 4,580 MT CO2 over theduration of the decommissioning period.3 Therefore, the total estimated GHG emissions are dividedby 30 years to estimate the amortized decommissioning emissions (approximately 153 MT CO2 peryear).
Operational Impacts
Operational-period GHG emissions would originate from direct and indirect emissions sourcesgenerated by mobile sources, electricity use, water consumption, and treatment of wastewatergenerated at the Project site. Mobile source emissions would be associated with activities such as off-road equipment use, diesel generator testing and maintenance, and vehicle travel required formaintenance of the PV units and the surrounding site. On-site operational activities would include in-place panel washing, which would require approximately 60 acre feet of water per year.
As stated in the Project Description, the PV modules will be mounted on fixed-tilt, single, or dual-axistracking structures. The estimate of GHG emissions assumes that all PV modules will be on trackers,and that there would be use of grid-provided electricity to power the PV trackers. Consumption ofwater may result in indirect GHG emissions from electricity used to power off-site conveyance,distribution, and treatment of water and associated wastewater. The analysis also assumes thatwastewater would be conveyed to a water reclamation facility. This likely overestimates wastewater-related emissions, because (1) most water would be used and disposed of on site, and (2) no organicmaterial, which affects GHG emissions in wastewater treatment, would be added to the wastewatercoming from the Project.
The Project will include gas-insulated switchgear (e.g., circuit breakers) that uses SF6, which is a GHGoften associated with high-voltage switching devices as an electrical insulating medium. The circuitbreakers have the potential to leak small amounts of SF6 to the atmosphere. New circuit breakers arereported to have a potential upper-bound leakage rate of 0.5 percent (Blackman 2006). The total SF6capacity for the Project is estimated at 960 pounds. Using the leakage rate of 0.5 percent per year, theannual SF6 emissions for the Project would be 4.8 pounds. Based on the high GWP of SF6, theestimated CO2e emissions are approximately 52 MT per year.
Table 11 shows the summary of operational GHG emissions estimated for the Project. The annualoperational emissions levels were estimated using the best available methodologies and emissionfactors available at the time of writing this report. Additional details are available in Appendix A.
2 Total construction-related emissions include CalEEMod estimates (4,943 MT CO2) and water use (2,520 MTCO2).
3 Total decommissioning-related emissions include CalEEMod estimates (2,060 MT CO2) and water use (2,520MT CO2). Water use for decommissioning was conservatively estimated to be the same as the initialconstruction period.

AECOM Environment
Wistaria Ranch Solar Energy Center Project June 2014Air Quality Impact Analysis
44
Table 11 Project GHG Emissions
Emissions Source MT CO2e per Year
Off-Road Equipment/On-Road Vehicles 321
Energy 1,721
Water 126
Wastewater 30
Gas-Insulated Switches 52
Total (Operational) 2,250
Total Amortized Construction 243
Total Amortized Decommissioning 153
Total (Operational + Amortized Construction) 2,646
Note: Totals may not add correctly due to rounding.
Source: Estimated by AECOM in 2014
The total construction-related and operational CO2e emissions associated with the Project would beless than the SCAQMD threshold of 10,000 MT CO2e per year. Therefore, the Project would notgenerate GHG emissions, either directly or indirectly, that may have a significant impact on theenvironment. This impact would be less than significant.
CUP Area Analysis
Construction Impacts
Short-term construction of the CUP area would generate GHG emissions. Construction emissionswould be associated with vehicle engine exhaust from construction equipment, haul trips, andconstruction worker trips. Construction of the CUP area was estimated to generate approximately 671MT CO2 over the duration of the 7-month construction period.4 Therefore, the total estimatedconstruction-related GHG emissions are divided by 30 years to estimate the amortized constructionemissions (approximately 22 MT CO2 per year).
Decommissioning of the CUP area was estimated to generate approximately 474 MT CO2 over theduration of the decommissioning period.5 Therefore, the total estimated GHG emissions are dividedby 30 years to estimate the amortized decommissioning emissions (approximately 16 MT CO2 peryear).
4 Total construction-related emissions include CalEEMod estimates (449 MT CO2) and water use (222 MT CO2).
5 Total decommissioning-related emissions include CalEEMod estimates (252 MT CO2) and water use (222 MTCO2). Water use for decommissioning was conservatively estimated to be the same as the initial constructionperiod.

AECOM Environment
Wistaria Ranch Solar Energy Center Project June 2014Air Quality Impact Analysis
45
Operational Impacts
Operational GHG emissions would be generated by mobile sources, electricity use, waterconsumption, wastewater treatment, and the use of gas-insulated switches. Mobile source emissionswould be associated with off-road equipment use, diesel generator testing and maintenance, andvehicle travel required for maintenance of the PV units and the surrounding site. On-site operationalactivity would include in-place panel washing, which would require approximately 5 acre feet of waterper year.6 The total SF6 capacity for the CUP area is estimated at 84 pounds with annual SF6emissions for the CUP at 0.42 pounds. Based on the high GWP of SF6, the estimated CO2e emissionsare approximately 5 MT per year.
Table 12 shows the summary of operational GHG emissions estimated for the CUP area. The annualoperational emissions levels were estimated using the best available methodologies and emissionfactors available at the time of writing this report. Additional details are available in Appendix A.
Table 12 CUP Area GHG Emissions
Emissions Source MT CO2e per Year
Off-Road Equipment/On-Road Vehicles 27
Energy 151
Water 11
Wastewater 3
Gas-Insulated Switches 5
Total (Operational) 197
Total Amortized Construction 22
Total Amortized Decommissioning 16
Total (Operational + Amortized Construction) 235
Note: Totals may not add correctly due to rounding.
Source: Estimated by AECOM in 2014
The total construction-related and operational CO2e emissions associated with the CUP area wouldbe less than the SCAQMD threshold of 10,000 MT CO2e per year. Therefore, the CUP area would notgenerate GHG emissions, either directly or indirectly, that may have a significant impact on theenvironment. This impact would be less than significant.
6 The water use estimates for the CUP area are based on the ratio of CUP MW to the total Project MW (22MW/250MW).

AECOM Environment
Wistaria Ranch Solar Energy Center Project June 2014Air Quality Impact Analysis
46
Would the Project conflict with an applicable plan, policy, or regulation adopted for thepurpose of reducing the emissions of greenhouse gases?
Project-Level Analysis
ARB’s Scoping Plan includes measures to meet California’s goal of reducing emissions to 1990 levelsby 2020 and also reiterates the State’s role in the long-term goal established in Executive Order S-3-05, which is to reduce GHG emissions to 80 percent below 1990 levels by 2050. According to ARB,the 2020 goal was established as an achievable, mid-term target, and the 2050 GHG emissionsreduction goal represents the level scientists believe is necessary to stabilize the climate (ARB 2008).
None of the measures listed in the ARB Scoping Plan, which contains the main strategies thatCalifornia will use to achieve emission reductions necessary to meet the goals of AB 32, directly relateto construction activity. The Scoping Plan includes some measures that would indirectly address GHGemissions levels associated with construction activity, such as the phasing in of cleaner technology fordiesel engine fleets (including construction equipment) and the development of a Low Carbon FuelStandard. However, successful implementation of these measures will predominantly depend on thedevelopment of laws and policies at the State level. It is assumed that those policies formulated underthe mandate of AB 32 that are applicable to construction-related activity, either directly or indirectly,would be implemented during construction of the Project if those policies and laws are in factdeveloped and adopted before the commencement of Project construction. Therefore, Projectconstruction would not conflict with the Scoping Plan.
The measures in the Scoping Plan also put California on a path to meet the long-term 2050 goal ofreducing California’s GHG emissions to 80 percent below 1990 levels. Implementing light-duty vehicleGHG emission standards, LCFS, regional transportation-related GHG targets, and the RPS as setforth in the Scoping Plan would continue to achieve reductions through at least 2030. However, theScoping Plan does not recommend additional measures for meeting specific GHG emissions limitsbeyond 2020. The Scoping Plan is currently being updated, and additional information on the revisedmeasures is not available at the time this report was developed. In addition, operation anddecommissioning of the Project is anticipated to be completed prior to 2050.
Although construction and operation of the Project would result in an increase of GHG emissions, it isaligned with the goals of AB 32. The Project would provide non-fossil-fuel-based electricity and wouldsupport the State’s goal to obtain 33 percent of all electricity from renewable sources and, therefore,help to achieve 1990 statewide emissions levels by 2020.
In order to demonstrate that the Project is aligned with and supporting the goals of AB 32, the ScopingPlan, and the RPS, it is important to understand the indirect (secondary) impacts of its approval -- theamount of carbon savings that would be derived from implementation of the Project, as opposed toimplementation of a carbon-based power plant, was estimated for this report.
The total amount of carbon savings from implementation of the Project is estimated at 341,200 MTCO2e per year. After accounting for annual operational emissions and amortized construction anddecommissioning emissions of 2,646 MT CO2e per year, the Project would result in a net carbonsavings of 338,554 MT CO2e per year. As these emissions reductions are accounted for by a utilitythat will be using them to meet its RPS goal, the reductions are not factored into the significancefindings for this report; however, quantifying them does demonstrate that the Project will assist theState in meeting its RPS goal.

AECOM Environment
Wistaria Ranch Solar Energy Center Project June 2014Air Quality Impact Analysis
47
As discussed earlier, the Project would not generate GHG emissions that would have a significantimpact on the environment. Neither the county nor any other agency with jurisdiction over this Projecthas adopted climate change or GHG reduction measures with which the Project would conflict. TheProject would not conflict with any applicable plan, policy, or regulation for the purpose of reducingGHG emissions. Therefore, this impact would be less than significant.
CUP Area Analysis
Construction and operation of the CUP area is aligned with the goals of AB 32 and would provide non-fossil-fuel-based electricity. Therefore, the CUP area would support the State’s goal to obtain 33percent of all electricity from renewable sources and help to achieve 1990 statewide GHG emissionslevels by 2020.
The total amount of carbon savings from implementation of the CUP area is estimated at 30,026 MTCO2e per year. After accounting for annual emissions of 235 MT CO2e per year, the CUP area wouldresult in a net carbon savings of 29,791 MT CO2e per year. As these emissions reductions areaccounted for by a utility that will be using them to meet its RPS goal, the reductions are not factoredinto the significance findings for this report; however, quantifying them does demonstrate that the CUParea will assist the State in meeting its RPS goal.
As discussed earlier, the CUP area would not generate GHG emissions that would have a significantimpact on the environment. Construction and operation of the CUP area would not conflict with anyapplicable plan, policy, or regulation for the purpose of reducing GHG emissions. Therefore, thisimpact would be less than significant.
5.3 Cumulative ImpactsWould the Project result in a cumulatively considerable net increase of any criteria pollutantfor which the Project region is classified as nonattainment under an applicable Federal orState ambient air quality standard (including releasing emissions which exceed quantitativethresholds for ozone precursors)?
Project-Level Analysis
The cumulative analysis focuses on whether a specific project would result in a cumulativelyconsiderable increase in emissions. By its very nature, air pollution is largely a cumulative impact. Thenonattainment status of regional pollutants is a result of past and present development within theSSAB, and this regional impact is cumulative rather than being attributable to any one source. Aproject’s emissions may be individually limited, but cumulatively considerable when taken incombination with past, present, and future development projects. The thresholds of significance arerelevant to whether a project’s individual emissions would result in a cumulatively considerableincremental contribution to the existing cumulative air quality conditions. If a project’s emissions wouldbe less than those threshold levels, the project would not be expected to result in a considerableincremental contribution to the significant cumulative impact.
As discussed earlier, the Project would result in the generation of NOx emissions at levels that exceedthe thresholds for construction activities. The Project’s operational emissions would not exceed thethresholds of significance for any criteria pollutants. These thresholds are designed to identify thoseprojects that would result in significant levels of air pollution and to assist the region in attaining theapplicable State and Federal ambient air quality standards. Projects that would not exceed thethresholds of significance would not contribute a considerable amount of criteria air pollutant

AECOM Environment
Wistaria Ranch Solar Energy Center Project June 2014Air Quality Impact Analysis
48
emissions to the region’s emissions profile, and would not impede attainment and maintenance ofambient air quality standards.
Implementation of Mitigation Measures AQ-1 through AQ-4 would reduce the Project’s constructionand operational emissions below the ICAPCD threshold of significance. Therefore, impacts related toa cumulatively considerable net increase of criteria pollutants would be less than significant.
CUP Area Analysis
As discussed earlier, the CUP area would generate NOx emissions at levels that exceed thethresholds for construction activities and would have a cumulatively considerable contribution to theregion’s air quality. Operational emissions would not exceed the thresholds of significance for anycriteria pollutants. Implementation of Mitigation Measures AQ-1 through AQ-3 would reduce criteriapollutant emissions below the air quality significance thresholds. Therefore, impacts related to acumulatively considerable net increase of criteria pollutants would be reduced to a less than significantlevel.
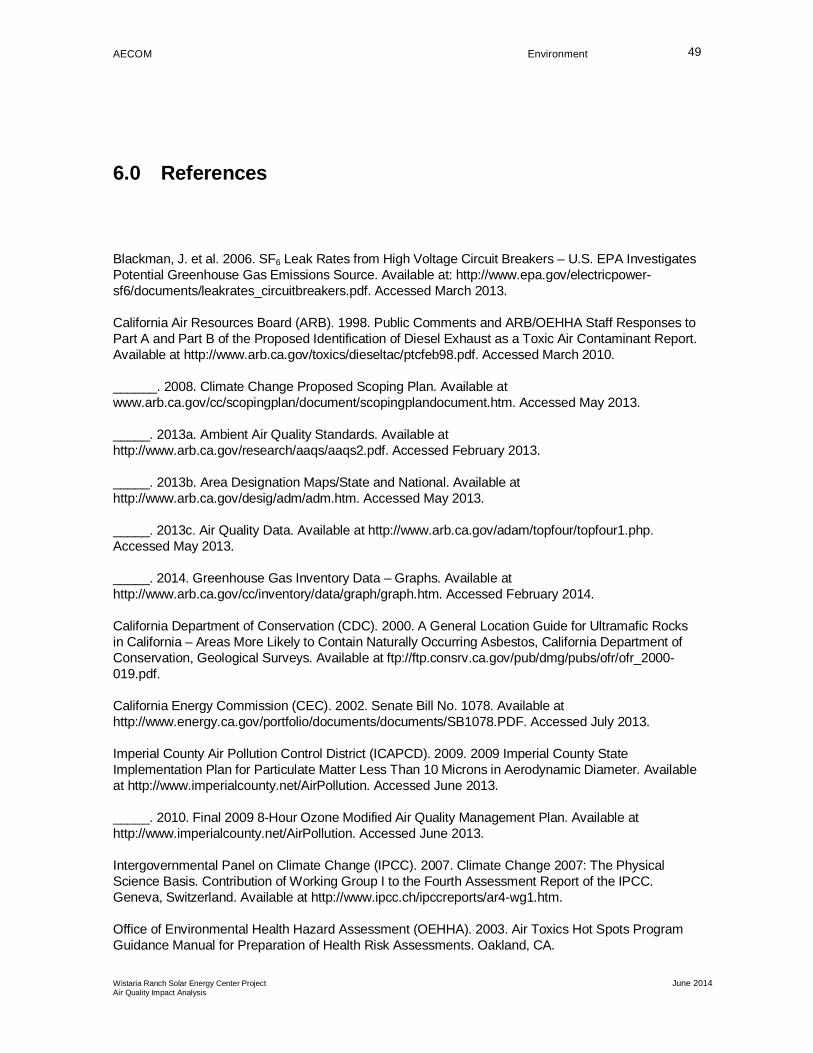
AECOM Environment
Wistaria Ranch Solar Energy Center Project June 2014Air Quality Impact Analysis
49
6.0 References
Blackman, J. et al. 2006. SF6 Leak Rates from High Voltage Circuit Breakers – U.S. EPA InvestigatesPotential Greenhouse Gas Emissions Source. Available at: http://www.epa.gov/electricpower-sf6/documents/leakrates_circuitbreakers.pdf. Accessed March 2013.
California Air Resources Board (ARB). 1998. Public Comments and ARB/OEHHA Staff Responses toPart A and Part B of the Proposed Identification of Diesel Exhaust as a Toxic Air Contaminant Report.Available at http://www.arb.ca.gov/toxics/dieseltac/ptcfeb98.pdf. Accessed March 2010.
______. 2008. Climate Change Proposed Scoping Plan. Available atwww.arb.ca.gov/cc/scopingplan/document/scopingplandocument.htm. Accessed May 2013.
_____. 2013a. Ambient Air Quality Standards. Available athttp://www.arb.ca.gov/research/aaqs/aaqs2.pdf. Accessed February 2013.
_____. 2013b. Area Designation Maps/State and National. Available athttp://www.arb.ca.gov/desig/adm/adm.htm. Accessed May 2013.
_____. 2013c. Air Quality Data. Available at http://www.arb.ca.gov/adam/topfour/topfour1.php.Accessed May 2013.
_____. 2014. Greenhouse Gas Inventory Data – Graphs. Available athttp://www.arb.ca.gov/cc/inventory/data/graph/graph.htm. Accessed February 2014.
California Department of Conservation (CDC). 2000. A General Location Guide for Ultramafic Rocksin California – Areas More Likely to Contain Naturally Occurring Asbestos, California Department ofConservation, Geological Surveys. Available at ftp://ftp.consrv.ca.gov/pub/dmg/pubs/ofr/ofr_2000-019.pdf.
California Energy Commission (CEC). 2002. Senate Bill No. 1078. Available athttp://www.energy.ca.gov/portfolio/documents/documents/SB1078.PDF. Accessed July 2013.
Imperial County Air Pollution Control District (ICAPCD). 2009. 2009 Imperial County StateImplementation Plan for Particulate Matter Less Than 10 Microns in Aerodynamic Diameter. Availableat http://www.imperialcounty.net/AirPollution. Accessed June 2013.
_____. 2010. Final 2009 8-Hour Ozone Modified Air Quality Management Plan. Available athttp://www.imperialcounty.net/AirPollution. Accessed June 2013.
Intergovernmental Panel on Climate Change (IPCC). 2007. Climate Change 2007: The PhysicalScience Basis. Contribution of Working Group I to the Fourth Assessment Report of the IPCC.Geneva, Switzerland. Available at http://www.ipcc.ch/ipccreports/ar4-wg1.htm.
Office of Environmental Health Hazard Assessment (OEHHA). 2003. Air Toxics Hot Spots ProgramGuidance Manual for Preparation of Health Risk Assessments. Oakland, CA.

AECOM Environment
Wistaria Ranch Solar Energy Center Project June 2014Air Quality Impact Analysis
50
San Diego County. 2012. County of San Diego Guidelines for Determining Significance. ClimateChange. Available athttp://www.sdcounty.ca.gov/pds/advance/Draft_Guidelines_for_Determining_SignificanceClimate_Change.pdf. Accessed July 2013.
South Coast Air Quality Management District (SCAQMD). 2008. Interim CEQA GHG SignificanceThreshold for Stationary Sources, Rules and Plans. Available athttp://www.aqmd.gov/hb/2008/December/081231a.htm. Accessed July 2013.
_____. 2010 Greenhouse Gases (GHG) CEQA Significance Thresholds. Available athttp://www.aqmd.gov/ceqa/handbook/GHG/2010/sept28mtg/ghgmtg15-web.pdf. Accessed July 2013.
United Nations Framework Convention on Climate Change (UNFCCC). 2012. Global WarmingPotentials.” Available at: http://unfccc.int/ghg_data/items/3825.php. Accessed March 2013.
U.S. Environmental Protection Agency (EPA). 2007. Six Common Pollutants, Particulate Matter.Available at http://www.epa.gov/air/particlepollution/index.html.
_____. 2013. Greenhouse Gas Reporting Program. Available athttp://www.epa.gov/ghgreporting/index.html. Accessed July 2013.
Western Region Climatic Center (WRCC). 2013. Monthly Climate Summary, El Centro, California.Available at http://www.wrcc.dri.edu/cgi-bin/cliMAIN.pl?ca2713. Accessed June 2013.

AECOM Environment
Wistaria Ranch Solar Energy Center Project June 2014Air Quality Impact Analysis
Appendix A
Emission Estimates

Imperial County, Summer
Wistaria Ranch Solar Energy Center
1.1 Land Usage
Land Uses Size Metric Lot Acreage Floor Surface Area Population
User Defined Industrial 2,793.00 User Defined Unit 2,793.00 0.00 0
1.2 Other Project Characteristics
Urbanization
Climate Zone
Urban
15
Wind Speed (m/s) Precipitation Freq (Days)3.4 12
1.3 User Entered Comments & Non-Default Data
1.0 Project Characteristics
Utility Company Imperial Irrigation District
2016Operational Year
CO2 Intensity (lb/MWhr)
1270.9 0.029CH4 Intensity (lb/MWhr)
0.006N2O Intensity (lb/MWhr)
CalEEMod Version: CalEEMod.2013.2.2 Date: 2/11/2014 3:32 PMPage 1 of 55

Cancer Risk Calculation
Cancer Risk Equations (Risk = Dose‐Inhalation * CPF)
Cancer Potency Factor (Inhalation) 1.1 mg/kg/day
Concentration (annual avg) 0.161856 µg/m3
Breathing Rate 302 liter/kg/day
Inhalation Absorption Factor 1 DPM
Exposure Frequency 350 days/year
Exposure Duration 70 years
Averaging Time Period 25550 days/period
Multiplying Factor 318.55 µg/m3
Adjustment Exposure Period 1.5 years
Cancer Risk (w/ adjustment) 1.10
Health Hazard REL (DPM) 5 µg/m3
Health Hazard Index 0.032
Adjustment Factor 0.1
Concentration 1.61856

Wistaria Ranch - Source 1.OUT 12/10/13 21:45:51 *** SCREEN3 MODEL RUN *** *** VERSION DATED 96043 ***
Wistaria Ranch - Source 1
SIMPLE TERRAIN INPUTS: SOURCE TYPE = VOLUME EMISSION RATE (G/S) = .141000E-02 SOURCE HEIGHT (M) = 5.0000 INIT. LATERAL DIMEN (M) = 124.9100 INIT. VERTICAL DIMEN (M) = 1.1600 RECEPTOR HEIGHT (M) = 2.0000 URBAN/RURAL OPTION = RURAL
THE REGULATORY (DEFAULT) MIXING HEIGHT OPTION WAS SELECTED. THE REGULATORY (DEFAULT) ANEMOMETER HEIGHT OF 10.0 METERS WAS ENTERED.
BUOY. FLUX = .000 M**4/S**3; MOM. FLUX = .000 M**4/S**2.
*** FULL METEOROLOGY ***
********************************* *** SCREEN DISCRETE DISTANCES *** *********************************
*** TERRAIN HEIGHT OF 0. M ABOVE STACK BASE USED FOR FOLLOWING DISTANCES ***
DIST CONC U10M USTK MIX HT PLUME SIGMA SIGMA (M) (UG/M**3) STAB (M/S) (M/S) (M) HT (M) Y (M) Z (M) DWASH ------- ---------- ---- ----- ----- ------ ------ ------ ------ ----- 50. .0000 0 .0 .0 .0 .00 .00 .00 100. .0000 0 .0 .0 .0 .00 .00 .00 150. .0000 0 .0 .0 .0 .00 .00 .00 200. .0000 0 .0 .0 .0 .00 .00 .00 250. .0000 0 .0 .0 .0 .00 .00 .00 300. .3927 6 1.0 1.0 10000.0 5.00 130.67 6.21 NO 350. .3712 6 1.0 1.0 10000.0 5.00 131.99 6.91 NO 380. .3583 6 1.0 1.0 10000.0 5.00 132.79 7.32 NO 400. .3499 6 1.0 1.0 10000.0 5.00 133.32 7.60 NO 450. .3297 6 1.0 1.0 10000.0 5.00 134.64 8.26 NO 500. .3109 6 1.0 1.0 10000.0 5.00 135.96 8.92 NO
DWASH= MEANS NO CALC MADE (CONC = 0.0) DWASH=NO MEANS NO BUILDING DOWNWASH USED DWASH=HS MEANS HUBER-SNYDER DOWNWASH USED DWASH=SS MEANS SCHULMAN-SCIRE DOWNWASH USED DWASH=NA MEANS DOWNWASH NOT APPLICABLE, X<3*LB
*************************************** *** SUMMARY OF SCREEN MODEL RESULTS *** ***************************************
CALCULATION MAX CONC DIST TO TERRAIN PROCEDURE (UG/M**3) MAX (M) HT (M) -------------- ----------- ------- ------- SIMPLE TERRAIN .3927 300. 0.
***************************************************
Page 1

Wistaria Ranch - Source 2.OUT 12/10/13 21:48:52 *** SCREEN3 MODEL RUN *** *** VERSION DATED 96043 ***
Wistaria Ranch - Source 2
SIMPLE TERRAIN INPUTS: SOURCE TYPE = VOLUME EMISSION RATE (G/S) = .302000E-02 SOURCE HEIGHT (M) = 5.0000 INIT. LATERAL DIMEN (M) = 182.7000 INIT. VERTICAL DIMEN (M) = 1.1600 RECEPTOR HEIGHT (M) = 2.0000 URBAN/RURAL OPTION = RURAL
THE REGULATORY (DEFAULT) MIXING HEIGHT OPTION WAS SELECTED. THE REGULATORY (DEFAULT) ANEMOMETER HEIGHT OF 10.0 METERS WAS ENTERED.
BUOY. FLUX = .000 M**4/S**3; MOM. FLUX = .000 M**4/S**2.
*** FULL METEOROLOGY ***
********************************* *** SCREEN DISCRETE DISTANCES *** *********************************
*** TERRAIN HEIGHT OF 0. M ABOVE STACK BASE USED FOR FOLLOWING DISTANCES ***
DIST CONC U10M USTK MIX HT PLUME SIGMA SIGMA (M) (UG/M**3) STAB (M/S) (M/S) (M) HT (M) Y (M) Z (M) DWASH ------- ---------- ---- ----- ----- ------ ------ ------ ------ ----- 50. .0000 0 .0 .0 .0 .00 .00 .00 100. .0000 0 .0 .0 .0 .00 .00 .00 150. .0000 0 .0 .0 .0 .00 .00 .00 200. .0000 0 .0 .0 .0 .00 .00 .00 250. .0000 0 .0 .0 .0 .00 .00 .00 300. .0000 0 .0 .0 .0 .00 .00 .00 350. .0000 0 .0 .0 .0 .00 .00 .00 400. .5312 6 1.0 1.0 10000.0 5.00 188.10 7.60 NO 450. .5021 6 1.0 1.0 10000.0 5.00 189.36 8.26 NO 460. .4965 6 1.0 1.0 10000.0 5.00 189.62 8.40 NO 500. .4749 6 1.0 1.0 10000.0 5.00 190.63 8.92 NO
DWASH= MEANS NO CALC MADE (CONC = 0.0) DWASH=NO MEANS NO BUILDING DOWNWASH USED DWASH=HS MEANS HUBER-SNYDER DOWNWASH USED DWASH=SS MEANS SCHULMAN-SCIRE DOWNWASH USED DWASH=NA MEANS DOWNWASH NOT APPLICABLE, X<3*LB
*************************************** *** SUMMARY OF SCREEN MODEL RESULTS *** ***************************************
CALCULATION MAX CONC DIST TO TERRAIN PROCEDURE (UG/M**3) MAX (M) HT (M) -------------- ----------- ------- ------- SIMPLE TERRAIN .5312 400. 0.
***************************************************
Page 1

Wistaria Ranch - Source 3.OUT 12/10/13 21:51:11 *** SCREEN3 MODEL RUN *** *** VERSION DATED 96043 ***
Wistaria Ranch - Source 3
SIMPLE TERRAIN INPUTS: SOURCE TYPE = VOLUME EMISSION RATE (G/S) = .110000E-02 SOURCE HEIGHT (M) = 5.0000 INIT. LATERAL DIMEN (M) = 110.2800 INIT. VERTICAL DIMEN (M) = 1.1600 RECEPTOR HEIGHT (M) = 2.0000 URBAN/RURAL OPTION = RURAL
THE REGULATORY (DEFAULT) MIXING HEIGHT OPTION WAS SELECTED. THE REGULATORY (DEFAULT) ANEMOMETER HEIGHT OF 10.0 METERS WAS ENTERED.
BUOY. FLUX = .000 M**4/S**3; MOM. FLUX = .000 M**4/S**2.
*** FULL METEOROLOGY ***
********************************* *** SCREEN DISCRETE DISTANCES *** *********************************
*** TERRAIN HEIGHT OF 0. M ABOVE STACK BASE USED FOR FOLLOWING DISTANCES ***
DIST CONC U10M USTK MIX HT PLUME SIGMA SIGMA (M) (UG/M**3) STAB (M/S) (M/S) (M) HT (M) Y (M) Z (M) DWASH ------- ---------- ---- ----- ----- ------ ------ ------ ------ ----- 50. .0000 0 .0 .0 .0 .00 .00 .00 100. .0000 0 .0 .0 .0 .00 .00 .00 150. .0000 0 .0 .0 .0 .00 .00 .00 200. .0000 0 .0 .0 .0 .00 .00 .00 250. .3610 6 1.0 1.0 10000.0 5.00 115.33 5.48 NO 300. .3431 6 1.0 1.0 10000.0 5.00 116.68 6.21 NO 350. .3239 6 1.0 1.0 10000.0 5.00 118.02 6.91 NO 400. .3049 6 1.0 1.0 10000.0 5.00 119.36 7.60 NO 450. .2869 6 1.0 1.0 10000.0 5.00 120.70 8.26 NO 500. .2702 6 1.0 1.0 10000.0 5.00 122.04 8.92 NO 980. .1731 6 1.0 1.0 10000.0 5.00 134.81 13.95 NO
DWASH= MEANS NO CALC MADE (CONC = 0.0) DWASH=NO MEANS NO BUILDING DOWNWASH USED DWASH=HS MEANS HUBER-SNYDER DOWNWASH USED DWASH=SS MEANS SCHULMAN-SCIRE DOWNWASH USED DWASH=NA MEANS DOWNWASH NOT APPLICABLE, X<3*LB
*************************************** *** SUMMARY OF SCREEN MODEL RESULTS *** ***************************************
CALCULATION MAX CONC DIST TO TERRAIN PROCEDURE (UG/M**3) MAX (M) HT (M) -------------- ----------- ------- ------- SIMPLE TERRAIN .3610 250. 0.
***************************************************
Page 1

Wistaria Ranch - Source 4.OUT 12/10/13 21:53:55 *** SCREEN3 MODEL RUN *** *** VERSION DATED 96043 ***
Wistaria Ranch - Source 4
SIMPLE TERRAIN INPUTS: SOURCE TYPE = VOLUME EMISSION RATE (G/S) = .122000E-02 SOURCE HEIGHT (M) = 5.0000 INIT. LATERAL DIMEN (M) = 115.9400 INIT. VERTICAL DIMEN (M) = 1.1600 RECEPTOR HEIGHT (M) = 2.0000 URBAN/RURAL OPTION = RURAL
THE REGULATORY (DEFAULT) MIXING HEIGHT OPTION WAS SELECTED. THE REGULATORY (DEFAULT) ANEMOMETER HEIGHT OF 10.0 METERS WAS ENTERED.
BUOY. FLUX = .000 M**4/S**3; MOM. FLUX = .000 M**4/S**2.
*** FULL METEOROLOGY ***
********************************* *** SCREEN DISCRETE DISTANCES *** *********************************
*** TERRAIN HEIGHT OF 0. M ABOVE STACK BASE USED FOR FOLLOWING DISTANCES ***
DIST CONC U10M USTK MIX HT PLUME SIGMA SIGMA (M) (UG/M**3) STAB (M/S) (M/S) (M) HT (M) Y (M) Z (M) DWASH ------- ---------- ---- ----- ----- ------ ------ ------ ------ ----- 50. .0000 0 .0 .0 .0 .00 .00 .00 100. .0000 0 .0 .0 .0 .00 .00 .00 150. .0000 0 .0 .0 .0 .00 .00 .00 200. .0000 0 .0 .0 .0 .00 .00 .00 250. .0000 0 .0 .0 .0 .00 .00 .00 300. .3637 6 1.0 1.0 10000.0 5.00 122.09 6.21 NO 350. .3435 6 1.0 1.0 10000.0 5.00 123.43 6.91 NO 390. .3274 6 1.0 1.0 10000.0 5.00 124.50 7.46 NO 400. .3235 6 1.0 1.0 10000.0 5.00 124.77 7.60 NO 450. .3046 6 1.0 1.0 10000.0 5.00 126.10 8.26 NO 500. .2870 6 1.0 1.0 10000.0 5.00 127.43 8.92 NO
DWASH= MEANS NO CALC MADE (CONC = 0.0) DWASH=NO MEANS NO BUILDING DOWNWASH USED DWASH=HS MEANS HUBER-SNYDER DOWNWASH USED DWASH=SS MEANS SCHULMAN-SCIRE DOWNWASH USED DWASH=NA MEANS DOWNWASH NOT APPLICABLE, X<3*LB
*************************************** *** SUMMARY OF SCREEN MODEL RESULTS *** ***************************************
CALCULATION MAX CONC DIST TO TERRAIN PROCEDURE (UG/M**3) MAX (M) HT (M) -------------- ----------- ------- ------- SIMPLE TERRAIN .3637 300. 0.
***************************************************
Page 1

Wistaria Ranch - Source 5.OUT 12/10/13 21:56:46 *** SCREEN3 MODEL RUN *** *** VERSION DATED 96043 ***
Wistaria Ranch - Source 5
SIMPLE TERRAIN INPUTS: SOURCE TYPE = VOLUME EMISSION RATE (G/S) = .100000E-04 SOURCE HEIGHT (M) = 5.0000 INIT. LATERAL DIMEN (M) = 9.1200 INIT. VERTICAL DIMEN (M) = 1.1600 RECEPTOR HEIGHT (M) = 2.0000 URBAN/RURAL OPTION = RURAL
THE REGULATORY (DEFAULT) MIXING HEIGHT OPTION WAS SELECTED. THE REGULATORY (DEFAULT) ANEMOMETER HEIGHT OF 10.0 METERS WAS ENTERED.
BUOY. FLUX = .000 M**4/S**3; MOM. FLUX = .000 M**4/S**2.
*** FULL METEOROLOGY ***
********************************* *** SCREEN DISCRETE DISTANCES *** *********************************
*** TERRAIN HEIGHT OF 0. M ABOVE STACK BASE USED FOR FOLLOWING DISTANCES ***
DIST CONC U10M USTK MIX HT PLUME SIGMA SIGMA (M) (UG/M**3) STAB (M/S) (M/S) (M) HT (M) Y (M) Z (M) DWASH ------- ---------- ---- ----- ----- ------ ------ ------ ------ ----- 50. .2926E-01 5 1.0 1.0 10000.0 5.00 11.84 2.82 NO 100. .2875E-01 6 1.0 1.0 10000.0 5.00 12.59 3.11 NO 150. .2703E-01 6 1.0 1.0 10000.0 5.00 14.28 3.97 NO 200. .2430E-01 6 1.0 1.0 10000.0 5.00 15.96 4.72 NO 250. .2148E-01 6 1.0 1.0 10000.0 5.00 17.62 5.48 NO 300. .1889E-01 6 1.0 1.0 10000.0 5.00 19.26 6.21 NO 350. .1663E-01 6 1.0 1.0 10000.0 5.00 20.89 6.91 NO 400. .1470E-01 6 1.0 1.0 10000.0 5.00 22.51 7.60 NO 450. .1305E-01 6 1.0 1.0 10000.0 5.00 24.12 8.26 NO 460. .1276E-01 6 1.0 1.0 10000.0 5.00 24.44 8.40 NO 500. .1166E-01 6 1.0 1.0 10000.0 5.00 25.72 8.92 NO
DWASH= MEANS NO CALC MADE (CONC = 0.0) DWASH=NO MEANS NO BUILDING DOWNWASH USED DWASH=HS MEANS HUBER-SNYDER DOWNWASH USED DWASH=SS MEANS SCHULMAN-SCIRE DOWNWASH USED DWASH=NA MEANS DOWNWASH NOT APPLICABLE, X<3*LB
*************************************** *** SUMMARY OF SCREEN MODEL RESULTS *** ***************************************
CALCULATION MAX CONC DIST TO TERRAIN PROCEDURE (UG/M**3) MAX (M) HT (M) -------------- ----------- ------- ------- SIMPLE TERRAIN .2926E-01 50. 0.
***************************************************
Page 1

Wistaria Ranch - Source 6.OUT 12/10/13 21:59:38 *** SCREEN3 MODEL RUN *** *** VERSION DATED 96043 ***
Wistaria Ranch - Source 6
SIMPLE TERRAIN INPUTS: SOURCE TYPE = VOLUME EMISSION RATE (G/S) = .145000E-02 SOURCE HEIGHT (M) = 5.0000 INIT. LATERAL DIMEN (M) = 126.7200 INIT. VERTICAL DIMEN (M) = 1.1600 RECEPTOR HEIGHT (M) = 2.0000 URBAN/RURAL OPTION = RURAL
THE REGULATORY (DEFAULT) MIXING HEIGHT OPTION WAS SELECTED. THE REGULATORY (DEFAULT) ANEMOMETER HEIGHT OF 10.0 METERS WAS ENTERED.
BUOY. FLUX = .000 M**4/S**3; MOM. FLUX = .000 M**4/S**2.
*** FULL METEOROLOGY ***
********************************* *** SCREEN DISCRETE DISTANCES *** *********************************
*** TERRAIN HEIGHT OF 0. M ABOVE STACK BASE USED FOR FOLLOWING DISTANCES ***
DIST CONC U10M USTK MIX HT PLUME SIGMA SIGMA (M) (UG/M**3) STAB (M/S) (M/S) (M) HT (M) Y (M) Z (M) DWASH ------- ---------- ---- ----- ----- ------ ------ ------ ------ ----- 50. .0000 0 .0 .0 .0 .00 .00 .00 100. .0000 0 .0 .0 .0 .00 .00 .00 150. .0000 0 .0 .0 .0 .00 .00 .00 200. .0000 0 .0 .0 .0 .00 .00 .00 250. .0000 0 .0 .0 .0 .00 .00 .00 300. .3986 6 1.0 1.0 10000.0 5.00 132.40 6.21 NO 350. .3768 6 1.0 1.0 10000.0 5.00 133.72 6.91 NO 400. .3552 6 1.0 1.0 10000.0 5.00 135.04 7.60 NO 450. .3348 6 1.0 1.0 10000.0 5.00 136.36 8.26 NO 500. .3157 6 1.0 1.0 10000.0 5.00 137.68 8.92 NO 730. .2505 6 1.0 1.0 10000.0 5.00 143.73 11.53 NO
DWASH= MEANS NO CALC MADE (CONC = 0.0) DWASH=NO MEANS NO BUILDING DOWNWASH USED DWASH=HS MEANS HUBER-SNYDER DOWNWASH USED DWASH=SS MEANS SCHULMAN-SCIRE DOWNWASH USED DWASH=NA MEANS DOWNWASH NOT APPLICABLE, X<3*LB
*************************************** *** SUMMARY OF SCREEN MODEL RESULTS *** ***************************************
CALCULATION MAX CONC DIST TO TERRAIN PROCEDURE (UG/M**3) MAX (M) HT (M) -------------- ----------- ------- ------- SIMPLE TERRAIN .3986 300. 0.
***************************************************
Page 1

Project Characteristics -
Land Use - Estimated acreage based on most recent project description
Construction Phase - Estimated construction schedule provided by project applicant
Off-road Equipment - Estimated construction equipment per project applicant
Off-road Equipment - Estimated construction equipment per project applicant
Off-road Equipment - Estimated construction equipment per project applicant
Off-road Equipment - Equipment estimates based on total construction equipment divided by number of construction days
Off-road Equipment - Estimated construction equipment per project applicant
Off-road Equipment - Estimated construction equipment per project applicant
Off-road Equipment - Estimated construction equipment per project applicant
Off-road Equipment - Estimated construction equipment per project applicant
Off-road Equipment - Estimated construction equipment per project applicant
Off-road Equipment - Estimated construction equipment per project applicant
Trips and VMT - Construction worker trips based on a maximum of 350 workers per day (525 ADT including carpools). Haul trucks based on a maximum of 46 trips per day.
On-road Fugitive Dust - Assumes travel on paved roads
Grading - Estimated disturbed acreage based on project area and construction schedule
Vehicle Trips - Does not include estimates of operational emissions.
Vechicle Emission Factors -
Vechicle Emission Factors -
Vechicle Emission Factors -
Area Coating -
Water And Wastewater -
Construction Off-road Equipment Mitigation - Includes mitigation to Tier 3 engines for all equipment greater than 50 hp.
Area Mitigation -
Table Name Column Name Default Value New Value
tblAreaMitigation UseLowVOCPaintNonresidentialExteriorValue
150 100
tblConstEquipMitigation NumberOfEquipmentMitigated 0.00 2.00
CalEEMod Version: CalEEMod.2013.2.2 Date: 2/11/2014 3:32 PMPage 2 of 55

tblConstEquipMitigation NumberOfEquipmentMitigated 0.00 2.00
tblConstEquipMitigation NumberOfEquipmentMitigated 0.00 6.00
tblConstEquipMitigation NumberOfEquipmentMitigated 0.00 8.00
tblConstEquipMitigation NumberOfEquipmentMitigated 0.00 6.00
tblConstEquipMitigation NumberOfEquipmentMitigated 0.00 22.00
tblConstEquipMitigation NumberOfEquipmentMitigated 0.00 28.00
tblConstEquipMitigation NumberOfEquipmentMitigated 0.00 4.00
tblConstEquipMitigation NumberOfEquipmentMitigated 0.00 12.00
tblConstEquipMitigation NumberOfEquipmentMitigated 0.00 2.00
tblConstEquipMitigation Tier No Change Tier 3
tblConstEquipMitigation Tier No Change Tier 3
tblConstEquipMitigation Tier No Change Tier 3
tblConstEquipMitigation Tier No Change Tier 3
tblConstEquipMitigation Tier No Change Tier 3
tblConstEquipMitigation Tier No Change Tier 3
tblConstEquipMitigation Tier No Change Tier 3
tblConstEquipMitigation Tier No Change Tier 3
tblConstEquipMitigation Tier No Change Tier 3
tblConstEquipMitigation Tier No Change Tier 3
tblConstructionPhase NumDays 155,000.00 79.00
tblConstructionPhase NumDays 155,000.00 348.00
tblConstructionPhase NumDays 155,000.00 168.00
tblConstructionPhase NumDays 155,000.00 149.00
tblConstructionPhase NumDays 155,000.00 240.00
tblConstructionPhase NumDays 155,000.00 242.00
tblConstructionPhase NumDays 6,000.00 23.00
tblConstructionPhase NumDays 6,000.00 195.00
tblConstructionPhase PhaseEndDate 3/21/2017 4/29/2016
CalEEMod Version: CalEEMod.2013.2.2 Date: 2/11/2014 3:32 PMPage 3 of 55

tblConstructionPhase PhaseEndDate 8/30/2017 11/30/2016
tblConstructionPhase PhaseEndDate 7/24/2017 3/31/2016
tblConstructionPhase PhaseEndDate 12/23/2016 4/30/2016
tblConstructionPhase PhaseEndDate 9/1/2017 10/31/2016
tblConstructionPhase PhaseEndDate 10/4/2017 11/30/2016
tblConstructionPhase PhaseEndDate 12/22/2016 5/30/2016
tblConstructionPhase PhaseEndDate 3/30/2017 9/30/2016
tblConstructionPhase PhaseStartDate 12/1/2016 1/12/2016
tblConstructionPhase PhaseStartDate 4/30/2016 8/1/2015
tblConstructionPhase PhaseStartDate 12/1/2016 8/11/2015
tblConstructionPhase PhaseStartDate 5/31/2016 10/6/2015
tblConstructionPhase PhaseStartDate 10/1/2016 12/1/2015
tblConstructionPhase PhaseStartDate 11/1/2016 12/29/2015
tblConstructionPhase PhaseStartDate 4/1/2016 9/8/2015
tblConstructionPhase PhaseStartDate 5/1/2016 11/3/2015
tblGrading AcresOfGrading 1,170.00 2,793.00
tblLandUse LotAcreage 0.00 2,793.00
tblOffRoadEquipment HorsePower 226.00 200.00
tblOffRoadEquipment HorsePower 226.00 200.00
tblOffRoadEquipment HorsePower 226.00 500.00
tblOffRoadEquipment HorsePower 226.00 220.00
tblOffRoadEquipment HorsePower 84.00 5.00
tblOffRoadEquipment HorsePower 97.00 150.00
tblOffRoadEquipment HorsePower 97.00 150.00
tblOffRoadEquipment HorsePower 97.00 150.00
tblOffRoadEquipment HorsePower 62.00 110.00
tblOffRoadEquipment HorsePower 78.00 75.00
tblOffRoadEquipment HorsePower 205.00 45.00
CalEEMod Version: CalEEMod.2013.2.2 Date: 2/11/2014 3:32 PMPage 4 of 55

tblOffRoadEquipment HorsePower 162.00 45.00
tblOffRoadEquipment HorsePower 174.00 200.00
tblOffRoadEquipment HorsePower 122.00 250.00
tblOffRoadEquipment HorsePower 400.00 350.00
tblOffRoadEquipment HorsePower 400.00 300.00
tblOffRoadEquipment HorsePower 400.00 300.00
tblOffRoadEquipment HorsePower 400.00 180.00
tblOffRoadEquipment HorsePower 400.00 350.00
tblOffRoadEquipment HorsePower 400.00 210.00
tblOffRoadEquipment HorsePower 8.00 100.00
tblOffRoadEquipment HorsePower 8.00 15.00
tblOffRoadEquipment HorsePower 100.00 75.00
tblOffRoadEquipment HorsePower 100.00 75.00
tblOffRoadEquipment HorsePower 100.00 75.00
tblOffRoadEquipment HorsePower 100.00 75.00
tblOffRoadEquipment HorsePower 361.00 300.00
tblOffRoadEquipment HorsePower 97.00 150.00
tblOffRoadEquipment HorsePower 80.00 100.00
tblOffRoadEquipment OffRoadEquipmentUnitAmount 1.00 2.00
tblOffRoadEquipment OffRoadEquipmentUnitAmount 1.00 2.00
tblOffRoadEquipment OffRoadEquipmentUnitAmount 1.00 5.00
tblOffRoadEquipment OffRoadEquipmentUnitAmount 3.00 2.00
tblOffRoadEquipment OffRoadEquipmentUnitAmount 3.00 2.00
tblOffRoadEquipment OffRoadEquipmentUnitAmount 0.00 2.00
tblOffRoadEquipment OffRoadEquipmentUnitAmount 0.00 2.00
tblOffRoadEquipment OffRoadEquipmentUnitAmount 0.00 12.00
tblOffRoadEquipment OffRoadEquipmentUnitAmount 0.00 4.00
tblOffRoadEquipment OffRoadEquipmentUnitAmount 0.00 8.00
CalEEMod Version: CalEEMod.2013.2.2 Date: 2/11/2014 3:32 PMPage 5 of 55
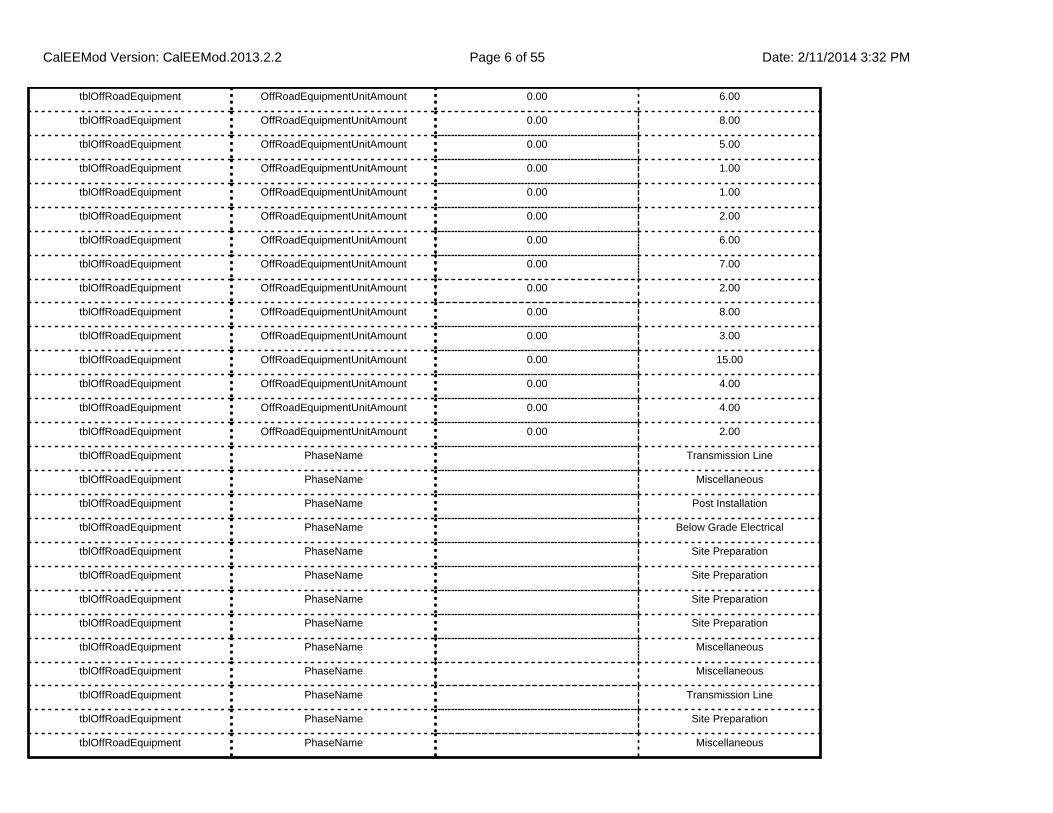
tblOffRoadEquipment OffRoadEquipmentUnitAmount 0.00 6.00
tblOffRoadEquipment OffRoadEquipmentUnitAmount 0.00 8.00
tblOffRoadEquipment OffRoadEquipmentUnitAmount 0.00 5.00
tblOffRoadEquipment OffRoadEquipmentUnitAmount 0.00 1.00
tblOffRoadEquipment OffRoadEquipmentUnitAmount 0.00 1.00
tblOffRoadEquipment OffRoadEquipmentUnitAmount 0.00 2.00
tblOffRoadEquipment OffRoadEquipmentUnitAmount 0.00 6.00
tblOffRoadEquipment OffRoadEquipmentUnitAmount 0.00 7.00
tblOffRoadEquipment OffRoadEquipmentUnitAmount 0.00 2.00
tblOffRoadEquipment OffRoadEquipmentUnitAmount 0.00 8.00
tblOffRoadEquipment OffRoadEquipmentUnitAmount 0.00 3.00
tblOffRoadEquipment OffRoadEquipmentUnitAmount 0.00 15.00
tblOffRoadEquipment OffRoadEquipmentUnitAmount 0.00 4.00
tblOffRoadEquipment OffRoadEquipmentUnitAmount 0.00 4.00
tblOffRoadEquipment OffRoadEquipmentUnitAmount 0.00 2.00
tblOffRoadEquipment PhaseName Transmission Line
tblOffRoadEquipment PhaseName Miscellaneous
tblOffRoadEquipment PhaseName Post Installation
tblOffRoadEquipment PhaseName Below Grade Electrical
tblOffRoadEquipment PhaseName Site Preparation
tblOffRoadEquipment PhaseName Site Preparation
tblOffRoadEquipment PhaseName Site Preparation
tblOffRoadEquipment PhaseName Site Preparation
tblOffRoadEquipment PhaseName Miscellaneous
tblOffRoadEquipment PhaseName Miscellaneous
tblOffRoadEquipment PhaseName Transmission Line
tblOffRoadEquipment PhaseName Site Preparation
tblOffRoadEquipment PhaseName Miscellaneous
CalEEMod Version: CalEEMod.2013.2.2 Date: 2/11/2014 3:32 PMPage 6 of 55
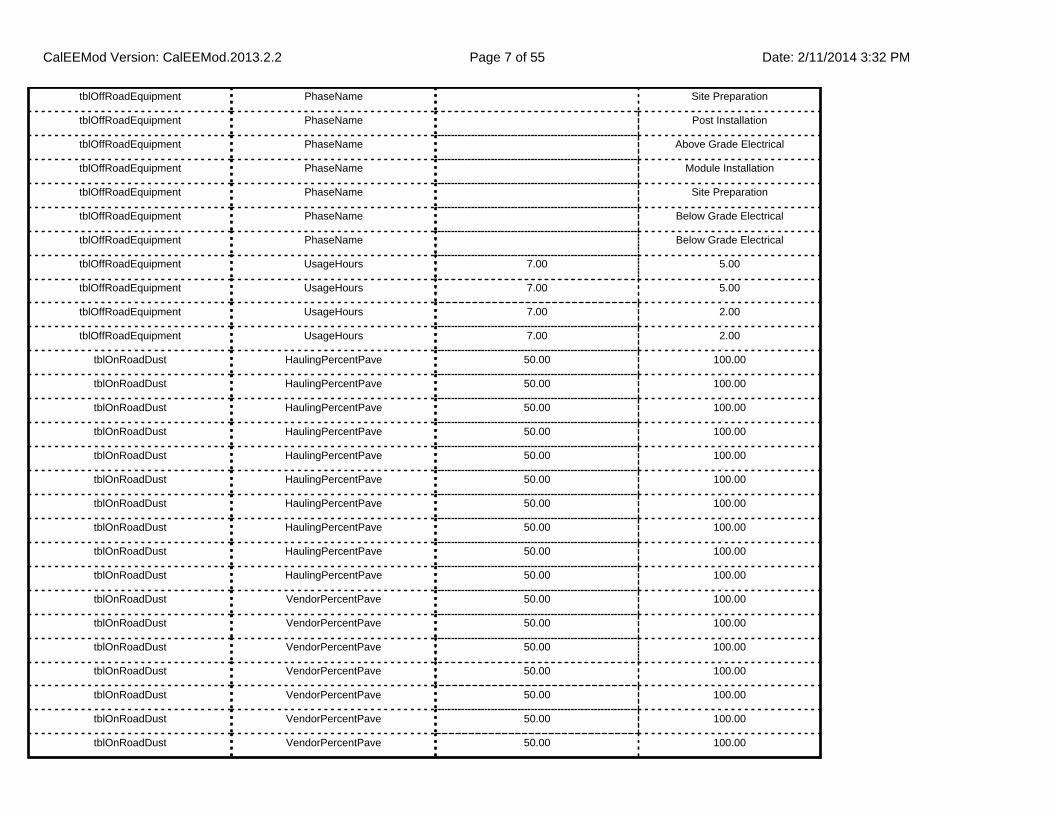
tblOffRoadEquipment PhaseName Site Preparation
tblOffRoadEquipment PhaseName Post Installation
tblOffRoadEquipment PhaseName Above Grade Electrical
tblOffRoadEquipment PhaseName Module Installation
tblOffRoadEquipment PhaseName Site Preparation
tblOffRoadEquipment PhaseName Below Grade Electrical
tblOffRoadEquipment PhaseName Below Grade Electrical
tblOffRoadEquipment UsageHours 7.00 5.00
tblOffRoadEquipment UsageHours 7.00 5.00
tblOffRoadEquipment UsageHours 7.00 2.00
tblOffRoadEquipment UsageHours 7.00 2.00
tblOnRoadDust HaulingPercentPave 50.00 100.00
tblOnRoadDust HaulingPercentPave 50.00 100.00
tblOnRoadDust HaulingPercentPave 50.00 100.00
tblOnRoadDust HaulingPercentPave 50.00 100.00
tblOnRoadDust HaulingPercentPave 50.00 100.00
tblOnRoadDust HaulingPercentPave 50.00 100.00
tblOnRoadDust HaulingPercentPave 50.00 100.00
tblOnRoadDust HaulingPercentPave 50.00 100.00
tblOnRoadDust HaulingPercentPave 50.00 100.00
tblOnRoadDust HaulingPercentPave 50.00 100.00
tblOnRoadDust VendorPercentPave 50.00 100.00
tblOnRoadDust VendorPercentPave 50.00 100.00
tblOnRoadDust VendorPercentPave 50.00 100.00
tblOnRoadDust VendorPercentPave 50.00 100.00
tblOnRoadDust VendorPercentPave 50.00 100.00
tblOnRoadDust VendorPercentPave 50.00 100.00
tblOnRoadDust VendorPercentPave 50.00 100.00
CalEEMod Version: CalEEMod.2013.2.2 Date: 2/11/2014 3:32 PMPage 7 of 55

tblOnRoadDust VendorPercentPave 50.00 100.00
tblOnRoadDust VendorPercentPave 50.00 100.00
tblOnRoadDust VendorPercentPave 50.00 100.00
tblOnRoadDust WorkerPercentPave 50.00 100.00
tblOnRoadDust WorkerPercentPave 50.00 100.00
tblOnRoadDust WorkerPercentPave 50.00 100.00
tblOnRoadDust WorkerPercentPave 50.00 100.00
tblOnRoadDust WorkerPercentPave 50.00 100.00
tblOnRoadDust WorkerPercentPave 50.00 100.00
tblOnRoadDust WorkerPercentPave 50.00 100.00
tblOnRoadDust WorkerPercentPave 50.00 100.00
tblOnRoadDust WorkerPercentPave 50.00 100.00
tblOnRoadDust WorkerPercentPave 50.00 100.00
tblProjectCharacteristics OperationalYear 2014 2016
tblTripsAndVMT HaulingTripLength 20.00 40.00
tblTripsAndVMT HaulingTripLength 20.00 40.00
tblTripsAndVMT HaulingTripLength 20.00 40.00
tblTripsAndVMT HaulingTripLength 20.00 40.00
tblTripsAndVMT HaulingTripLength 20.00 40.00
tblTripsAndVMT HaulingTripLength 20.00 40.00
tblTripsAndVMT HaulingTripLength 20.00 40.00
tblTripsAndVMT HaulingTripLength 20.00 40.00
tblTripsAndVMT HaulingTripLength 20.00 40.00
tblTripsAndVMT HaulingTripLength 20.00 40.00
tblTripsAndVMT HaulingTripNumber 0.00 5.00
tblTripsAndVMT HaulingTripNumber 0.00 5.00
tblTripsAndVMT HaulingTripNumber 0.00 5.00
tblTripsAndVMT HaulingTripNumber 0.00 5.00
CalEEMod Version: CalEEMod.2013.2.2 Date: 2/11/2014 3:32 PMPage 8 of 55

2.0 Emissions Summary
tblTripsAndVMT HaulingTripNumber 0.00 5.00
tblTripsAndVMT HaulingTripNumber 0.00 5.00
tblTripsAndVMT HaulingTripNumber 0.00 5.00
tblTripsAndVMT HaulingTripNumber 0.00 5.00
tblTripsAndVMT HaulingTripNumber 0.00 5.00
tblTripsAndVMT HaulingTripNumber 0.00 5.00
tblTripsAndVMT WorkerTripLength 7.30 40.00
tblTripsAndVMT WorkerTripLength 7.30 40.00
tblTripsAndVMT WorkerTripLength 7.30 40.00
tblTripsAndVMT WorkerTripLength 7.30 40.00
tblTripsAndVMT WorkerTripLength 7.30 40.00
tblTripsAndVMT WorkerTripLength 7.30 40.00
tblTripsAndVMT WorkerTripLength 7.30 40.00
tblTripsAndVMT WorkerTripLength 7.30 40.00
tblTripsAndVMT WorkerTripLength 7.30 40.00
tblTripsAndVMT WorkerTripLength 7.30 40.00
tblTripsAndVMT WorkerTripNumber 13.00 5.00
tblTripsAndVMT WorkerTripNumber 0.00 58.00
tblTripsAndVMT WorkerTripNumber 108.00 58.00
tblTripsAndVMT WorkerTripNumber 0.00 58.00
tblTripsAndVMT WorkerTripNumber 0.00 58.00
tblTripsAndVMT WorkerTripNumber 50.00 58.00
tblTripsAndVMT WorkerTripNumber 0.00 58.00
tblTripsAndVMT WorkerTripNumber 25.00 58.00
tblTripsAndVMT WorkerTripNumber 0.00 58.00
tblTripsAndVMT WorkerTripNumber 0.00 58.00
CalEEMod Version: CalEEMod.2013.2.2 Date: 2/11/2014 3:32 PMPage 9 of 55

2.1 Overall Construction (Maximum Daily Emission)
ROG NOx CO SO2 Fugitive PM10
Exhaust PM10
PM10 Total
Fugitive PM2.5
Exhaust PM2.5
PM2.5 Total
Bio- CO2 NBio- CO2 Total CO2 CH4 N2O CO2e
Year lb/day lb/day
2015 41.7887 405.5505 346.7006 0.5342 29.3564 17.1410 46.4974 5.3952 15.7816 21.1768 0.0000 52,533.6200
52,533.6200
12.7942 0.0000 52,802.2985
2016 41.3706 394.3645 349.5563 0.5682 31.0702 16.5870 47.6572 5.8506 15.2710 21.1216 0.0000 54,684.1922
54,684.1922
13.2741 0.0000 54,962.9484
Total 83.1593 799.9150 696.2569 1.1024 60.4266 33.7280 94.1546 11.2457 31.0526 42.2983 0.0000 107,217.8122
107,217.8122
26.0683 0.0000 107,765.2469
Unmitigated Construction
ROG NOx CO SO2 Fugitive PM10
Exhaust PM10
PM10 Total
Fugitive PM2.5
Exhaust PM2.5
PM2.5 Total
Bio- CO2 NBio- CO2 Total CO2 CH4 N2O CO2e
Year lb/day lb/day
2015 21.4907 211.1880 383.1034 0.5342 19.9768 9.5046 29.4814 4.3824 9.3199 13.7022 0.0000 52,533.6200
52,533.6200
12.7942 0.0000 52,802.2985
2016 21.8996 218.2430 393.3851 0.5682 21.6906 9.8129 31.5035 4.8378 9.6282 14.4660 0.0000 54,684.1921
54,684.1921
13.2741 0.0000 54,962.9484
Total 43.3903 429.4310 776.4885 1.1024 41.6674 19.3175 60.9849 9.2202 18.9481 28.1682 0.0000 107,217.8121
107,217.8121
26.0683 0.0000 107,765.2469
Mitigated Construction
ROG NOx CO SO2 Fugitive PM10
Exhaust PM10
PM10 Total
Fugitive PM2.5
Exhaust PM2.5
PM2.5 Total
Bio- CO2 NBio-CO2 Total CO2 CH4 N20 CO2e
Percent Reduction
47.82 46.32 -11.52 0.00 31.04 42.73 35.23 18.01 38.98 33.41 0.00 0.00 0.00 0.00 0.00 0.00
CalEEMod Version: CalEEMod.2013.2.2 Date: 2/11/2014 3:32 PMPage 10 of 55

2.2 Overall Operational
ROG NOx CO SO2 Fugitive PM10
Exhaust PM10
PM10 Total
Fugitive PM2.5
Exhaust PM2.5
PM2.5 Total
Bio- CO2 NBio- CO2 Total CO2 CH4 N2O CO2e
Category lb/day lb/day
Area 0.0285 2.8000e-003
0.2925 2.0000e-005
1.0600e-003
1.0600e-003
1.0600e-003
1.0600e-003
0.6113 0.6113 1.7300e-003
0.6476
Energy 0.0000 0.0000 0.0000 0.0000 0.0000 0.0000 0.0000 0.0000 0.0000 0.0000 0.0000 0.0000 0.0000
Mobile 0.0000 0.0000 0.0000 0.0000 0.0000 0.0000 0.0000 0.0000 0.0000 0.0000 0.0000 0.0000 0.0000 0.0000
Total 0.0285 2.8000e-003
0.2925 2.0000e-005
0.0000 1.0600e-003
1.0600e-003
0.0000 1.0600e-003
1.0600e-003
0.6113 0.6113 1.7300e-003
0.0000 0.6476
Unmitigated Operational
ROG NOx CO SO2 Fugitive PM10
Exhaust PM10
PM10 Total
Fugitive PM2.5
Exhaust PM2.5
PM2.5 Total
Bio- CO2 NBio- CO2 Total CO2 CH4 N2O CO2e
Category lb/day lb/day
Area 0.0285 2.8000e-003
0.2925 2.0000e-005
1.0600e-003
1.0600e-003
1.0600e-003
1.0600e-003
0.6113 0.6113 1.7300e-003
0.6476
Energy 0.0000 0.0000 0.0000 0.0000 0.0000 0.0000 0.0000 0.0000 0.0000 0.0000 0.0000 0.0000 0.0000
Mobile 0.0000 0.0000 0.0000 0.0000 0.0000 0.0000 0.0000 0.0000 0.0000 0.0000 0.0000 0.0000 0.0000 0.0000
Total 0.0285 2.8000e-003
0.2925 2.0000e-005
0.0000 1.0600e-003
1.0600e-003
0.0000 1.0600e-003
1.0600e-003
0.6113 0.6113 1.7300e-003
0.0000 0.6476
Mitigated Operational
CalEEMod Version: CalEEMod.2013.2.2 Date: 2/11/2014 3:32 PMPage 11 of 55

3.0 Construction Detail
Construction Phase
Phase Number
Phase Name Phase Type Start Date End Date Num Days Week
Num Days Phase Description
1 Mobilization Site Preparation 7/1/2015 7/31/2015 5 23
2 Site Preparation Site Preparation 8/1/2015 4/29/2016 5 195
3 Miscellaneous Building Construction 8/1/2015 11/30/2016 5 348
4 Substation Building Construction 8/11/2015 3/31/2016 5 168
5 Post Installation Trenching 9/8/2015 5/30/2016 5 190
6 Transmission Line Building Construction 10/6/2015 4/30/2016 5 149
7 Below Grade Electrical Trenching 11/3/2015 9/30/2016 5 239
8 Above Grade Electrical Building Construction 12/1/2015 10/31/2016 5 240
9 Module Installation Building Construction 12/29/2015 11/30/2016 5 242
10 O&M Building Building Construction 1/12/2016 4/29/2016 5 79
OffRoad Equipment
Phase Name Offroad Equipment Type Amount Usage Hours Horse Power Load Factor
Mobilization Off-Highway Trucks 5 2.00 350 0.38
ROG NOx CO SO2 Fugitive PM10
Exhaust PM10
PM10 Total
Fugitive PM2.5
Exhaust PM2.5
PM2.5 Total
Bio- CO2 NBio-CO2 Total CO2 CH4 N20 CO2e
Percent Reduction
0.00 0.00 0.00 0.00 0.00 0.00 0.00 0.00 0.00 0.00 0.00 0.00 0.00 0.00 0.00 0.00
Residential Indoor: 0; Residential Outdoor: 0; Non-Residential Indoor: 0; Non-Residential Outdoor: 0 (Architectural Coating – sqft)
Acres of Grading (Site Preparation Phase): 2793
Acres of Grading (Grading Phase): 0
Acres of Paving: 0
CalEEMod Version: CalEEMod.2013.2.2 Date: 2/11/2014 3:32 PMPage 12 of 55
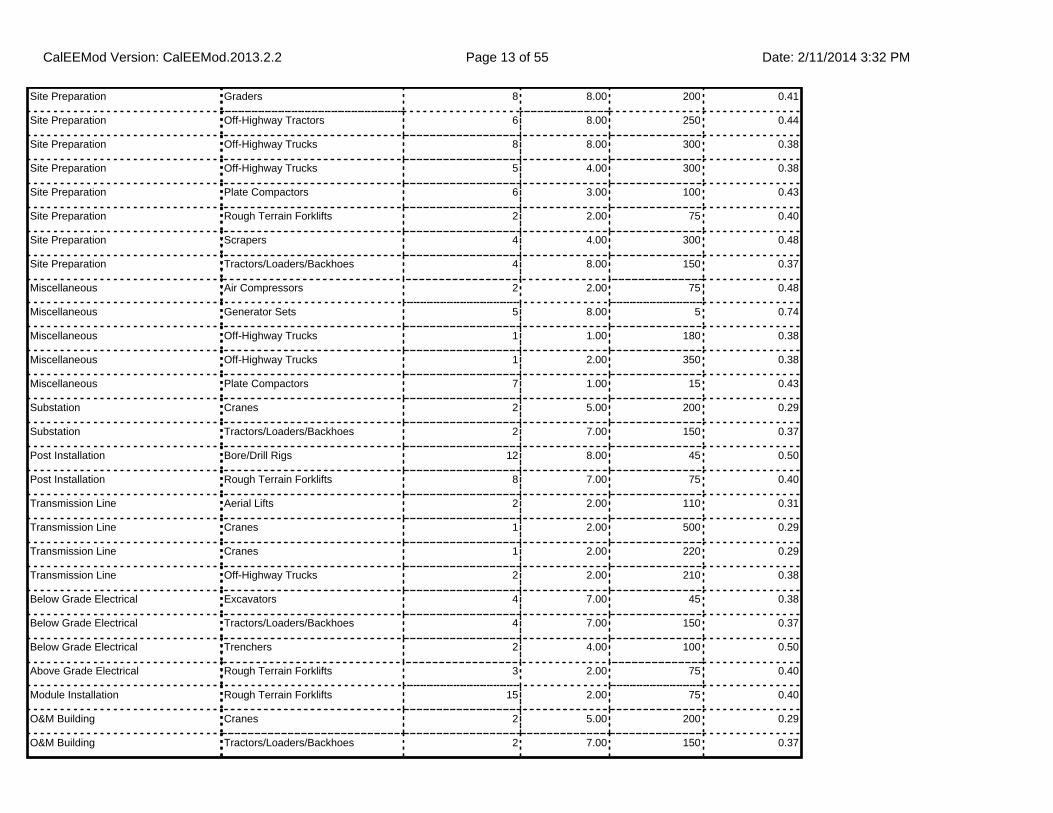
Site Preparation Graders 8 8.00 200 0.41
Site Preparation Off-Highway Tractors 6 8.00 250 0.44
Site Preparation Off-Highway Trucks 8 8.00 300 0.38
Site Preparation Off-Highway Trucks 5 4.00 300 0.38
Site Preparation Plate Compactors 6 3.00 100 0.43
Site Preparation Rough Terrain Forklifts 2 2.00 75 0.40
Site Preparation Scrapers 4 4.00 300 0.48
Site Preparation Tractors/Loaders/Backhoes 4 8.00 150 0.37
Miscellaneous Air Compressors 2 2.00 75 0.48
Miscellaneous Generator Sets 5 8.00 5 0.74
Miscellaneous Off-Highway Trucks 1 1.00 180 0.38
Miscellaneous Off-Highway Trucks 1 2.00 350 0.38
Miscellaneous Plate Compactors 7 1.00 15 0.43
Substation Cranes 2 5.00 200 0.29
Substation Tractors/Loaders/Backhoes 2 7.00 150 0.37
Post Installation Bore/Drill Rigs 12 8.00 45 0.50
Post Installation Rough Terrain Forklifts 8 7.00 75 0.40
Transmission Line Aerial Lifts 2 2.00 110 0.31
Transmission Line Cranes 1 2.00 500 0.29
Transmission Line Cranes 1 2.00 220 0.29
Transmission Line Off-Highway Trucks 2 2.00 210 0.38
Below Grade Electrical Excavators 4 7.00 45 0.38
Below Grade Electrical Tractors/Loaders/Backhoes 4 7.00 150 0.37
Below Grade Electrical Trenchers 2 4.00 100 0.50
Above Grade Electrical Rough Terrain Forklifts 3 2.00 75 0.40
Module Installation Rough Terrain Forklifts 15 2.00 75 0.40
O&M Building Cranes 2 5.00 200 0.29
O&M Building Tractors/Loaders/Backhoes 2 7.00 150 0.37
CalEEMod Version: CalEEMod.2013.2.2 Date: 2/11/2014 3:32 PMPage 13 of 55

3.1 Mitigation Measures Construction
Use Cleaner Engines for Construction Equipment
Use Soil Stabilizer
Replace Ground Cover
Water Exposed Area
Reduce Vehicle Speed on Unpaved Roads
Trips and VMT
Phase Name Offroad Equipment Count
Worker Trip Number
Vendor Trip Number
Hauling Trip Number
Worker Trip Length
Vendor Trip Length
Hauling Trip Length
Worker Vehicle Class
Vendor Vehicle Class
Hauling Vehicle Class
Mobilization 5 5.00 0.00 5.00 40.00 8.90 40.00 LD_Mix HDT_Mix HHDT
Site Preparation 43 58.00 0.00 5.00 40.00 8.90 40.00 LD_Mix HDT_Mix HHDT
Miscellaneous 16 58.00 0.00 5.00 40.00 8.90 40.00 LD_Mix HDT_Mix HHDT
Substation 4 58.00 0.00 5.00 40.00 8.90 40.00 LD_Mix HDT_Mix HHDT
Post Installation 20 58.00 0.00 5.00 40.00 8.90 40.00 LD_Mix HDT_Mix HHDT
Transmission Line 6 58.00 0.00 5.00 40.00 8.90 40.00 LD_Mix HDT_Mix HHDT
Below Grade Electrical
10 58.00 0.00 5.00 40.00 8.90 40.00 LD_Mix HDT_Mix HHDT
Above Grade Electrical
3 58.00 0.00 5.00 40.00 8.90 40.00 LD_Mix HDT_Mix HHDT
Module Installation 15 58.00 0.00 5.00 40.00 8.90 40.00 LD_Mix HDT_Mix HHDT
O&M Building 4 58.00 0.00 5.00 40.00 8.90 40.00 LD_Mix HDT_Mix HHDT
CalEEMod Version: CalEEMod.2013.2.2 Date: 2/11/2014 3:32 PMPage 14 of 55

3.2 Mobilization - 2015
ROG NOx CO SO2 Fugitive PM10
Exhaust PM10
PM10 Total
Fugitive PM2.5
Exhaust PM2.5
PM2.5 Total
Bio- CO2 NBio- CO2 Total CO2 CH4 N2O CO2e
Category lb/day lb/day
Fugitive Dust 0.0000 0.0000 0.0000 0.0000 0.0000 0.0000 0.0000 0.0000
Off-Road 1.1273 13.2766 5.9719 0.0144 0.5071 0.5071 0.4666 0.4666 1,512.5249
1,512.5249
0.4516 1,522.0075
Total 1.1273 13.2766 5.9719 0.0144 0.0000 0.5071 0.5071 0.0000 0.4666 0.4666 1,512.5249
1,512.5249
0.4516 1,522.0075
Unmitigated Construction On-Site
ROG NOx CO SO2 Fugitive PM10
Exhaust PM10
PM10 Total
Fugitive PM2.5
Exhaust PM2.5
PM2.5 Total
Bio- CO2 NBio- CO2 Total CO2 CH4 N2O CO2e
Category lb/day lb/day
Hauling 6.7100e-003
0.1054 0.0770 3.0000e-004
7.6000e-003
2.6100e-003
0.0102 2.0800e-003
2.4000e-003
4.4800e-003
30.2875 30.2875 1.8000e-004
30.2912
Vendor 0.0000 0.0000 0.0000 0.0000 0.0000 0.0000 0.0000 0.0000 0.0000 0.0000 0.0000 0.0000 0.0000 0.0000
Worker 0.0874 0.1581 1.6648 1.7100e-003
0.1520 1.0300e-003
0.1530 0.0403 9.4000e-004
0.0412 141.7361 141.7361 0.0117 141.9820
Total 0.0941 0.2634 1.7418 2.0100e-003
0.1596 3.6400e-003
0.1632 0.0424 3.3400e-003
0.0457 172.0236 172.0236 0.0119 172.2733
Unmitigated Construction Off-Site
CalEEMod Version: CalEEMod.2013.2.2 Date: 2/11/2014 3:32 PMPage 15 of 55

3.2 Mobilization - 2015
ROG NOx CO SO2 Fugitive PM10
Exhaust PM10
PM10 Total
Fugitive PM2.5
Exhaust PM2.5
PM2.5 Total
Bio- CO2 NBio- CO2 Total CO2 CH4 N2O CO2e
Category lb/day lb/day
Fugitive Dust 0.0000 0.0000 0.0000 0.0000 0.0000 0.0000 0.0000 0.0000
Off-Road 0.3519 6.8026 7.6236 0.0144 0.2580 0.2580 0.2580 0.2580 0.0000 1,512.5249
1,512.5249
0.4516 1,522.0075
Total 0.3519 6.8026 7.6236 0.0144 0.0000 0.2580 0.2580 0.0000 0.2580 0.2580 0.0000 1,512.5249
1,512.5249
0.4516 1,522.0075
Mitigated Construction On-Site
ROG NOx CO SO2 Fugitive PM10
Exhaust PM10
PM10 Total
Fugitive PM2.5
Exhaust PM2.5
PM2.5 Total
Bio- CO2 NBio- CO2 Total CO2 CH4 N2O CO2e
Category lb/day lb/day
Hauling 6.7100e-003
0.1054 0.0770 3.0000e-004
7.6000e-003
2.6100e-003
0.0102 2.0800e-003
2.4000e-003
4.4800e-003
30.2875 30.2875 1.8000e-004
30.2912
Vendor 0.0000 0.0000 0.0000 0.0000 0.0000 0.0000 0.0000 0.0000 0.0000 0.0000 0.0000 0.0000 0.0000 0.0000
Worker 0.0874 0.1581 1.6648 1.7100e-003
0.1520 1.0300e-003
0.1530 0.0403 9.4000e-004
0.0412 141.7361 141.7361 0.0117 141.9820
Total 0.0941 0.2634 1.7418 2.0100e-003
0.1596 3.6400e-003
0.1632 0.0424 3.3400e-003
0.0457 172.0236 172.0236 0.0119 172.2733
Mitigated Construction Off-Site
CalEEMod Version: CalEEMod.2013.2.2 Date: 2/11/2014 3:32 PMPage 16 of 55

3.3 Site Preparation - 2015
ROG NOx CO SO2 Fugitive PM10
Exhaust PM10
PM10 Total
Fugitive PM2.5
Exhaust PM2.5
PM2.5 Total
Bio- CO2 NBio- CO2 Total CO2 CH4 N2O CO2e
Category lb/day lb/day
Fugitive Dust 15.1896 0.0000 15.1896 1.6401 0.0000 1.6401 0.0000 0.0000
Off-Road 21.4974 277.1830 111.5230 0.2623 10.3847 10.3847 9.5539 9.5539 27,528.0297
27,528.0297
8.2183 27,700.6133
Total 21.4974 277.1830 111.5230 0.2623 15.1896 10.3847 25.5743 1.6401 9.5539 11.1940 27,528.0297
27,528.0297
8.2183 27,700.6133
Unmitigated Construction On-Site
ROG NOx CO SO2 Fugitive PM10
Exhaust PM10
PM10 Total
Fugitive PM2.5
Exhaust PM2.5
PM2.5 Total
Bio- CO2 NBio- CO2 Total CO2 CH4 N2O CO2e
Category lb/day lb/day
Hauling 7.9000e-004
0.0124 9.0900e-003
4.0000e-005
1.4300e-003
3.1000e-004
1.7400e-003
3.8000e-004
2.8000e-004
6.6000e-004
3.5724 3.5724 2.0000e-005
3.5728
Vendor 0.0000 0.0000 0.0000 0.0000 0.0000 0.0000 0.0000 0.0000 0.0000 0.0000 0.0000 0.0000 0.0000 0.0000
Worker 1.0142 1.8333 19.3117 0.0198 1.7631 0.0120 1.7751 0.4675 0.0109 0.4784 1,644.1390
1,644.1390
0.1358 1,646.9916
Total 1.0150 1.8458 19.3208 0.0199 1.7645 0.0123 1.7768 0.4678 0.0112 0.4791 1,647.7113
1,647.7113
0.1359 1,650.5644
Unmitigated Construction Off-Site
CalEEMod Version: CalEEMod.2013.2.2 Date: 2/11/2014 3:32 PMPage 17 of 55

3.3 Site Preparation - 2015
ROG NOx CO SO2 Fugitive PM10
Exhaust PM10
PM10 Total
Fugitive PM2.5
Exhaust PM2.5
PM2.5 Total
Bio- CO2 NBio- CO2 Total CO2 CH4 N2O CO2e
Category lb/day lb/day
Fugitive Dust 5.8100 0.0000 5.8100 0.6274 0.0000 0.6274 0.0000 0.0000
Off-Road 6.4297 124.4194 143.9090 0.2623 4.8366 4.8366 4.8366 4.8366 0.0000 27,528.0297
27,528.0297
8.2183 27,700.6133
Total 6.4297 124.4194 143.9090 0.2623 5.8100 4.8366 10.6467 0.6274 4.8366 5.4640 0.0000 27,528.0297
27,528.0297
8.2183 27,700.6133
Mitigated Construction On-Site
ROG NOx CO SO2 Fugitive PM10
Exhaust PM10
PM10 Total
Fugitive PM2.5
Exhaust PM2.5
PM2.5 Total
Bio- CO2 NBio- CO2 Total CO2 CH4 N2O CO2e
Category lb/day lb/day
Hauling 7.9000e-004
0.0124 9.0900e-003
4.0000e-005
1.4300e-003
3.1000e-004
1.7400e-003
3.8000e-004
2.8000e-004
6.6000e-004
3.5724 3.5724 2.0000e-005
3.5728
Vendor 0.0000 0.0000 0.0000 0.0000 0.0000 0.0000 0.0000 0.0000 0.0000 0.0000 0.0000 0.0000 0.0000 0.0000
Worker 1.0142 1.8333 19.3117 0.0198 1.7631 0.0120 1.7751 0.4675 0.0109 0.4784 1,644.1390
1,644.1390
0.1358 1,646.9916
Total 1.0150 1.8458 19.3208 0.0199 1.7645 0.0123 1.7768 0.4678 0.0112 0.4791 1,647.7113
1,647.7113
0.1359 1,650.5644
Mitigated Construction Off-Site
CalEEMod Version: CalEEMod.2013.2.2 Date: 2/11/2014 3:32 PMPage 18 of 55

3.3 Site Preparation - 2016
ROG NOx CO SO2 Fugitive PM10
Exhaust PM10
PM10 Total
Fugitive PM2.5
Exhaust PM2.5
PM2.5 Total
Bio- CO2 NBio- CO2 Total CO2 CH4 N2O CO2e
Category lb/day lb/day
Fugitive Dust 15.1896 0.0000 15.1896 1.6401 0.0000 1.6401 0.0000 0.0000
Off-Road 20.1023 255.7713 105.6717 0.2621 9.4456 9.4456 8.6900 8.6900 27,226.4735
27,226.4735
8.2125 27,398.9354
Total 20.1023 255.7713 105.6717 0.2621 15.1896 9.4456 24.6353 1.6401 8.6900 10.3301 27,226.4735
27,226.4735
8.2125 27,398.9354
Unmitigated Construction On-Site
ROG NOx CO SO2 Fugitive PM10
Exhaust PM10
PM10 Total
Fugitive PM2.5
Exhaust PM2.5
PM2.5 Total
Bio- CO2 NBio- CO2 Total CO2 CH4 N2O CO2e
Category lb/day lb/day
Hauling 6.7000e-004
0.0106 8.2200e-003
3.0000e-005
1.7600e-003
2.6000e-004
2.0200e-003
4.6000e-004
2.4000e-004
7.0000e-004
3.5254 3.5254 2.0000e-005
3.5258
Vendor 0.0000 0.0000 0.0000 0.0000 0.0000 0.0000 0.0000 0.0000 0.0000 0.0000 0.0000 0.0000 0.0000 0.0000
Worker 0.8972 1.6548 17.1984 0.0198 1.7631 0.0112 1.7743 0.4675 0.0102 0.4777 1,578.7688
1,578.7688
0.1245 1,581.3823
Total 0.8979 1.6653 17.2067 0.0198 1.7649 0.0114 1.7763 0.4679 0.0105 0.4784 1,582.2942
1,582.2942
0.1245 1,584.9081
Unmitigated Construction Off-Site
CalEEMod Version: CalEEMod.2013.2.2 Date: 2/11/2014 3:32 PMPage 19 of 55
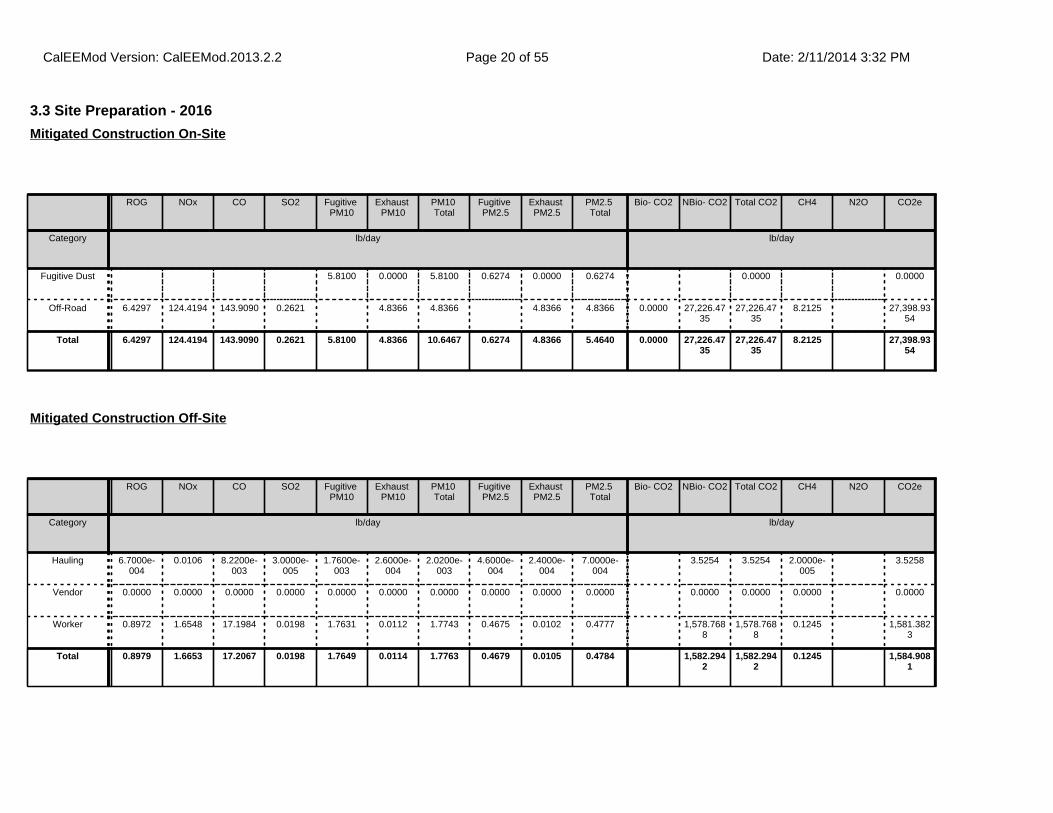
3.3 Site Preparation - 2016
ROG NOx CO SO2 Fugitive PM10
Exhaust PM10
PM10 Total
Fugitive PM2.5
Exhaust PM2.5
PM2.5 Total
Bio- CO2 NBio- CO2 Total CO2 CH4 N2O CO2e
Category lb/day lb/day
Fugitive Dust 5.8100 0.0000 5.8100 0.6274 0.0000 0.6274 0.0000 0.0000
Off-Road 6.4297 124.4194 143.9090 0.2621 4.8366 4.8366 4.8366 4.8366 0.0000 27,226.4735
27,226.4735
8.2125 27,398.9354
Total 6.4297 124.4194 143.9090 0.2621 5.8100 4.8366 10.6467 0.6274 4.8366 5.4640 0.0000 27,226.4735
27,226.4735
8.2125 27,398.9354
Mitigated Construction On-Site
ROG NOx CO SO2 Fugitive PM10
Exhaust PM10
PM10 Total
Fugitive PM2.5
Exhaust PM2.5
PM2.5 Total
Bio- CO2 NBio- CO2 Total CO2 CH4 N2O CO2e
Category lb/day lb/day
Hauling 6.7000e-004
0.0106 8.2200e-003
3.0000e-005
1.7600e-003
2.6000e-004
2.0200e-003
4.6000e-004
2.4000e-004
7.0000e-004
3.5254 3.5254 2.0000e-005
3.5258
Vendor 0.0000 0.0000 0.0000 0.0000 0.0000 0.0000 0.0000 0.0000 0.0000 0.0000 0.0000 0.0000 0.0000 0.0000
Worker 0.8972 1.6548 17.1984 0.0198 1.7631 0.0112 1.7743 0.4675 0.0102 0.4777 1,578.7688
1,578.7688
0.1245 1,581.3823
Total 0.8979 1.6653 17.2067 0.0198 1.7649 0.0114 1.7763 0.4679 0.0105 0.4784 1,582.2942
1,582.2942
0.1245 1,584.9081
Mitigated Construction Off-Site
CalEEMod Version: CalEEMod.2013.2.2 Date: 2/11/2014 3:32 PMPage 20 of 55

3.4 Miscellaneous - 2015
ROG NOx CO SO2 Fugitive PM10
Exhaust PM10
PM10 Total
Fugitive PM2.5
Exhaust PM2.5
PM2.5 Total
Bio- CO2 NBio- CO2 Total CO2 CH4 N2O CO2e
Category lb/day lb/day
Off-Road 0.6233 5.5058 3.0453 6.3100e-003
0.2932 0.2932 0.2824 0.2824 616.0638 616.0638 0.1425 619.0570
Total 0.6233 5.5058 3.0453 6.3100e-003
0.2932 0.2932 0.2824 0.2824 616.0638 616.0638 0.1425 619.0570
Unmitigated Construction On-Site
ROG NOx CO SO2 Fugitive PM10
Exhaust PM10
PM10 Total
Fugitive PM2.5
Exhaust PM2.5
PM2.5 Total
Bio- CO2 NBio- CO2 Total CO2 CH4 N2O CO2e
Category lb/day lb/day
Hauling 4.4000e-004
6.9600e-003
5.0900e-003
2.0000e-005
1.3400e-003
1.7000e-004
1.5100e-003
3.4000e-004
1.6000e-004
5.0000e-004
2.0018 2.0018 1.0000e-005
2.0020
Vendor 0.0000 0.0000 0.0000 0.0000 0.0000 0.0000 0.0000 0.0000 0.0000 0.0000 0.0000 0.0000 0.0000 0.0000
Worker 1.0142 1.8333 19.3117 0.0198 1.7631 0.0120 1.7751 0.4675 0.0109 0.4784 1,644.1390
1,644.1390
0.1358 1,646.9916
Total 1.0146 1.8403 19.3168 0.0199 1.7645 0.0122 1.7766 0.4678 0.0111 0.4789 1,646.1407
1,646.1407
0.1359 1,648.9936
Unmitigated Construction Off-Site
CalEEMod Version: CalEEMod.2013.2.2 Date: 2/11/2014 3:32 PMPage 21 of 55

3.4 Miscellaneous - 2015
ROG NOx CO SO2 Fugitive PM10
Exhaust PM10
PM10 Total
Fugitive PM2.5
Exhaust PM2.5
PM2.5 Total
Bio- CO2 NBio- CO2 Total CO2 CH4 N2O CO2e
Category lb/day lb/day
Off-Road 0.1924 2.9925 3.4367 6.3100e-003
0.1419 0.1419 0.1419 0.1419 0.0000 616.0638 616.0638 0.1425 619.0570
Total 0.1924 2.9925 3.4367 6.3100e-003
0.1419 0.1419 0.1419 0.1419 0.0000 616.0638 616.0638 0.1425 619.0570
Mitigated Construction On-Site
ROG NOx CO SO2 Fugitive PM10
Exhaust PM10
PM10 Total
Fugitive PM2.5
Exhaust PM2.5
PM2.5 Total
Bio- CO2 NBio- CO2 Total CO2 CH4 N2O CO2e
Category lb/day lb/day
Hauling 4.4000e-004
6.9600e-003
5.0900e-003
2.0000e-005
1.3400e-003
1.7000e-004
1.5100e-003
3.4000e-004
1.6000e-004
5.0000e-004
2.0018 2.0018 1.0000e-005
2.0020
Vendor 0.0000 0.0000 0.0000 0.0000 0.0000 0.0000 0.0000 0.0000 0.0000 0.0000 0.0000 0.0000 0.0000 0.0000
Worker 1.0142 1.8333 19.3117 0.0198 1.7631 0.0120 1.7751 0.4675 0.0109 0.4784 1,644.1390
1,644.1390
0.1358 1,646.9916
Total 1.0146 1.8403 19.3168 0.0199 1.7645 0.0122 1.7766 0.4678 0.0111 0.4789 1,646.1407
1,646.1407
0.1359 1,648.9936
Mitigated Construction Off-Site
CalEEMod Version: CalEEMod.2013.2.2 Date: 2/11/2014 3:32 PMPage 22 of 55

3.4 Miscellaneous - 2016
ROG NOx CO SO2 Fugitive PM10
Exhaust PM10
PM10 Total
Fugitive PM2.5
Exhaust PM2.5
PM2.5 Total
Bio- CO2 NBio- CO2 Total CO2 CH4 N2O CO2e
Category lb/day lb/day
Off-Road 0.5753 5.0346 2.9335 6.3100e-003
0.2629 0.2629 0.2533 0.2533 611.7514 611.7514 0.1402 614.6954
Total 0.5753 5.0346 2.9335 6.3100e-003
0.2629 0.2629 0.2533 0.2533 611.7514 611.7514 0.1402 614.6954
Unmitigated Construction On-Site
ROG NOx CO SO2 Fugitive PM10
Exhaust PM10
PM10 Total
Fugitive PM2.5
Exhaust PM2.5
PM2.5 Total
Bio- CO2 NBio- CO2 Total CO2 CH4 N2O CO2e
Category lb/day lb/day
Hauling 3.8000e-004
5.9200e-003
4.6100e-003
2.0000e-005
6.8000e-004
1.5000e-004
8.2000e-004
1.8000e-004
1.3000e-004
3.1000e-004
1.9755 1.9755 1.0000e-005
1.9757
Vendor 0.0000 0.0000 0.0000 0.0000 0.0000 0.0000 0.0000 0.0000 0.0000 0.0000 0.0000 0.0000 0.0000 0.0000
Worker 0.8972 1.6548 17.1984 0.0198 1.7631 0.0112 1.7743 0.4675 0.0102 0.4777 1,578.7688
1,578.7688
0.1245 1,581.3823
Total 0.8976 1.6607 17.2030 0.0198 1.7638 0.0113 1.7751 0.4676 0.0104 0.4780 1,580.7443
1,580.7443
0.1245 1,583.3580
Unmitigated Construction Off-Site
CalEEMod Version: CalEEMod.2013.2.2 Date: 2/11/2014 3:32 PMPage 23 of 55

3.4 Miscellaneous - 2016
ROG NOx CO SO2 Fugitive PM10
Exhaust PM10
PM10 Total
Fugitive PM2.5
Exhaust PM2.5
PM2.5 Total
Bio- CO2 NBio- CO2 Total CO2 CH4 N2O CO2e
Category lb/day lb/day
Off-Road 0.1924 2.9925 3.4367 6.3100e-003
0.1419 0.1419 0.1419 0.1419 0.0000 611.7514 611.7514 0.1402 614.6954
Total 0.1924 2.9925 3.4367 6.3100e-003
0.1419 0.1419 0.1419 0.1419 0.0000 611.7514 611.7514 0.1402 614.6954
Mitigated Construction On-Site
ROG NOx CO SO2 Fugitive PM10
Exhaust PM10
PM10 Total
Fugitive PM2.5
Exhaust PM2.5
PM2.5 Total
Bio- CO2 NBio- CO2 Total CO2 CH4 N2O CO2e
Category lb/day lb/day
Hauling 3.8000e-004
5.9200e-003
4.6100e-003
2.0000e-005
6.8000e-004
1.5000e-004
8.2000e-004
1.8000e-004
1.3000e-004
3.1000e-004
1.9755 1.9755 1.0000e-005
1.9757
Vendor 0.0000 0.0000 0.0000 0.0000 0.0000 0.0000 0.0000 0.0000 0.0000 0.0000 0.0000 0.0000 0.0000 0.0000
Worker 0.8972 1.6548 17.1984 0.0198 1.7631 0.0112 1.7743 0.4675 0.0102 0.4777 1,578.7688
1,578.7688
0.1245 1,581.3823
Total 0.8976 1.6607 17.2030 0.0198 1.7638 0.0113 1.7751 0.4676 0.0104 0.4780 1,580.7443
1,580.7443
0.1245 1,583.3580
Mitigated Construction Off-Site
CalEEMod Version: CalEEMod.2013.2.2 Date: 2/11/2014 3:32 PMPage 24 of 55
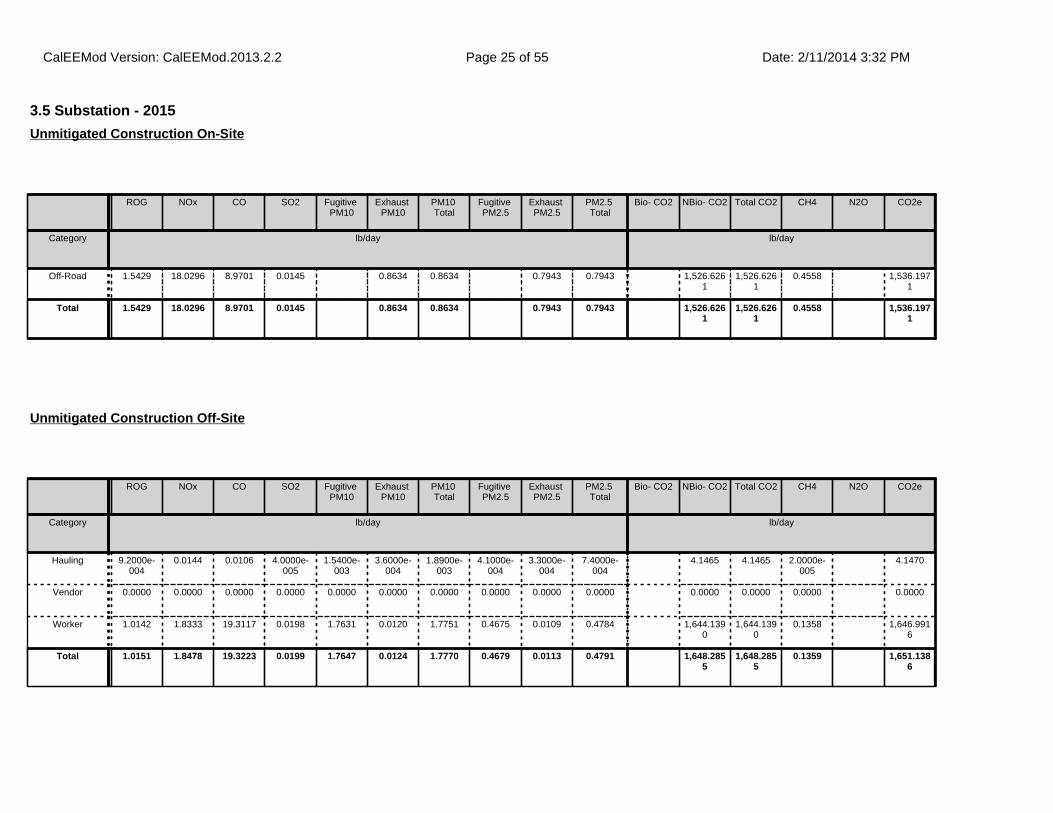
3.5 Substation - 2015
ROG NOx CO SO2 Fugitive PM10
Exhaust PM10
PM10 Total
Fugitive PM2.5
Exhaust PM2.5
PM2.5 Total
Bio- CO2 NBio- CO2 Total CO2 CH4 N2O CO2e
Category lb/day lb/day
Off-Road 1.5429 18.0296 8.9701 0.0145 0.8634 0.8634 0.7943 0.7943 1,526.6261
1,526.6261
0.4558 1,536.1971
Total 1.5429 18.0296 8.9701 0.0145 0.8634 0.8634 0.7943 0.7943 1,526.6261
1,526.6261
0.4558 1,536.1971
Unmitigated Construction On-Site
ROG NOx CO SO2 Fugitive PM10
Exhaust PM10
PM10 Total
Fugitive PM2.5
Exhaust PM2.5
PM2.5 Total
Bio- CO2 NBio- CO2 Total CO2 CH4 N2O CO2e
Category lb/day lb/day
Hauling 9.2000e-004
0.0144 0.0106 4.0000e-005
1.5400e-003
3.6000e-004
1.8900e-003
4.1000e-004
3.3000e-004
7.4000e-004
4.1465 4.1465 2.0000e-005
4.1470
Vendor 0.0000 0.0000 0.0000 0.0000 0.0000 0.0000 0.0000 0.0000 0.0000 0.0000 0.0000 0.0000 0.0000 0.0000
Worker 1.0142 1.8333 19.3117 0.0198 1.7631 0.0120 1.7751 0.4675 0.0109 0.4784 1,644.1390
1,644.1390
0.1358 1,646.9916
Total 1.0151 1.8478 19.3223 0.0199 1.7647 0.0124 1.7770 0.4679 0.0113 0.4791 1,648.2855
1,648.2855
0.1359 1,651.1386
Unmitigated Construction Off-Site
CalEEMod Version: CalEEMod.2013.2.2 Date: 2/11/2014 3:32 PMPage 25 of 55

3.5 Substation - 2015
ROG NOx CO SO2 Fugitive PM10
Exhaust PM10
PM10 Total
Fugitive PM2.5
Exhaust PM2.5
PM2.5 Total
Bio- CO2 NBio- CO2 Total CO2 CH4 N2O CO2e
Category lb/day lb/day
Off-Road 0.3590 6.9407 9.6626 0.0145 0.3044 0.3044 0.3044 0.3044 0.0000 1,526.6261
1,526.6261
0.4558 1,536.1971
Total 0.3590 6.9407 9.6626 0.0145 0.3044 0.3044 0.3044 0.3044 0.0000 1,526.6261
1,526.6261
0.4558 1,536.1971
Mitigated Construction On-Site
ROG NOx CO SO2 Fugitive PM10
Exhaust PM10
PM10 Total
Fugitive PM2.5
Exhaust PM2.5
PM2.5 Total
Bio- CO2 NBio- CO2 Total CO2 CH4 N2O CO2e
Category lb/day lb/day
Hauling 9.2000e-004
0.0144 0.0106 4.0000e-005
1.5400e-003
3.6000e-004
1.8900e-003
4.1000e-004
3.3000e-004
7.4000e-004
4.1465 4.1465 2.0000e-005
4.1470
Vendor 0.0000 0.0000 0.0000 0.0000 0.0000 0.0000 0.0000 0.0000 0.0000 0.0000 0.0000 0.0000 0.0000 0.0000
Worker 1.0142 1.8333 19.3117 0.0198 1.7631 0.0120 1.7751 0.4675 0.0109 0.4784 1,644.1390
1,644.1390
0.1358 1,646.9916
Total 1.0151 1.8478 19.3223 0.0199 1.7647 0.0124 1.7770 0.4679 0.0113 0.4791 1,648.2855
1,648.2855
0.1359 1,651.1386
Mitigated Construction Off-Site
CalEEMod Version: CalEEMod.2013.2.2 Date: 2/11/2014 3:32 PMPage 26 of 55

3.5 Substation - 2016
ROG NOx CO SO2 Fugitive PM10
Exhaust PM10
PM10 Total
Fugitive PM2.5
Exhaust PM2.5
PM2.5 Total
Bio- CO2 NBio- CO2 Total CO2 CH4 N2O CO2e
Category lb/day lb/day
Off-Road 1.4632 16.9395 8.8387 0.0145 0.8085 0.8085 0.7438 0.7438 1,509.4898
1,509.4898
0.4553 1,519.0514
Total 1.4632 16.9395 8.8387 0.0145 0.8085 0.8085 0.7438 0.7438 1,509.4898
1,509.4898
0.4553 1,519.0514
Unmitigated Construction On-Site
ROG NOx CO SO2 Fugitive PM10
Exhaust PM10
PM10 Total
Fugitive PM2.5
Exhaust PM2.5
PM2.5 Total
Bio- CO2 NBio- CO2 Total CO2 CH4 N2O CO2e
Category lb/day lb/day
Hauling 7.8000e-004
0.0123 9.5400e-003
4.0000e-005
2.2900e-003
3.0000e-004
2.5900e-003
5.9000e-004
2.8000e-004
8.7000e-004
4.0920 4.0920 2.0000e-005
4.0925
Vendor 0.0000 0.0000 0.0000 0.0000 0.0000 0.0000 0.0000 0.0000 0.0000 0.0000 0.0000 0.0000 0.0000 0.0000
Worker 0.8972 1.6548 17.1984 0.0198 1.7631 0.0112 1.7743 0.4675 0.0102 0.4777 1,578.7688
1,578.7688
0.1245 1,581.3823
Total 0.8980 1.6670 17.2080 0.0198 1.7654 0.0115 1.7769 0.4680 0.0105 0.4786 1,582.8608
1,582.8608
0.1245 1,585.4748
Unmitigated Construction Off-Site
CalEEMod Version: CalEEMod.2013.2.2 Date: 2/11/2014 3:32 PMPage 27 of 55

3.5 Substation - 2016
ROG NOx CO SO2 Fugitive PM10
Exhaust PM10
PM10 Total
Fugitive PM2.5
Exhaust PM2.5
PM2.5 Total
Bio- CO2 NBio- CO2 Total CO2 CH4 N2O CO2e
Category lb/day lb/day
Off-Road 0.3590 6.9407 9.6626 0.0145 0.3044 0.3044 0.3044 0.3044 0.0000 1,509.4898
1,509.4898
0.4553 1,519.0514
Total 0.3590 6.9407 9.6626 0.0145 0.3044 0.3044 0.3044 0.3044 0.0000 1,509.4898
1,509.4898
0.4553 1,519.0514
Mitigated Construction On-Site
ROG NOx CO SO2 Fugitive PM10
Exhaust PM10
PM10 Total
Fugitive PM2.5
Exhaust PM2.5
PM2.5 Total
Bio- CO2 NBio- CO2 Total CO2 CH4 N2O CO2e
Category lb/day lb/day
Hauling 7.8000e-004
0.0123 9.5400e-003
4.0000e-005
2.2900e-003
3.0000e-004
2.5900e-003
5.9000e-004
2.8000e-004
8.7000e-004
4.0920 4.0920 2.0000e-005
4.0925
Vendor 0.0000 0.0000 0.0000 0.0000 0.0000 0.0000 0.0000 0.0000 0.0000 0.0000 0.0000 0.0000 0.0000 0.0000
Worker 0.8972 1.6548 17.1984 0.0198 1.7631 0.0112 1.7743 0.4675 0.0102 0.4777 1,578.7688
1,578.7688
0.1245 1,581.3823
Total 0.8980 1.6670 17.2080 0.0198 1.7654 0.0115 1.7769 0.4680 0.0105 0.4786 1,582.8608
1,582.8608
0.1245 1,585.4748
Mitigated Construction Off-Site
CalEEMod Version: CalEEMod.2013.2.2 Date: 2/11/2014 3:32 PMPage 28 of 55

3.6 Post Installation - 2015
ROG NOx CO SO2 Fugitive PM10
Exhaust PM10
PM10 Total
Fugitive PM2.5
Exhaust PM2.5
PM2.5 Total
Bio- CO2 NBio- CO2 Total CO2 CH4 N2O CO2e
Category lb/day lb/day
Off-Road 5.2839 41.1072 35.0137 0.0446 2.7222 2.7222 2.5045 2.5045 4,683.2205
4,683.2205
1.3981 4,712.5814
Total 5.2839 41.1072 35.0137 0.0446 2.7222 2.7222 2.5045 2.5045 4,683.2205
4,683.2205
1.3981 4,712.5814
Unmitigated Construction On-Site
ROG NOx CO SO2 Fugitive PM10
Exhaust PM10
PM10 Total
Fugitive PM2.5
Exhaust PM2.5
PM2.5 Total
Bio- CO2 NBio- CO2 Total CO2 CH4 N2O CO2e
Category lb/day lb/day
Hauling 8.1000e-004
0.0128 9.3300e-003
4.0000e-005
1.8200e-003
3.2000e-004
2.1300e-003
4.7000e-004
2.9000e-004
7.6000e-004
3.6664 3.6664 2.0000e-005
3.6668
Vendor 0.0000 0.0000 0.0000 0.0000 0.0000 0.0000 0.0000 0.0000 0.0000 0.0000 0.0000 0.0000 0.0000 0.0000
Worker 1.0142 1.8333 19.3117 0.0198 1.7631 0.0120 1.7751 0.4675 0.0109 0.4784 1,644.1390
1,644.1390
0.1358 1,646.9916
Total 1.0150 1.8461 19.3211 0.0199 1.7649 0.0123 1.7772 0.4679 0.0112 0.4792 1,647.8053
1,647.8053
0.1359 1,650.6584
Unmitigated Construction Off-Site
CalEEMod Version: CalEEMod.2013.2.2 Date: 2/11/2014 3:32 PMPage 29 of 55

3.6 Post Installation - 2015
ROG NOx CO SO2 Fugitive PM10
Exhaust PM10
PM10 Total
Fugitive PM2.5
Exhaust PM2.5
PM2.5 Total
Bio- CO2 NBio- CO2 Total CO2 CH4 N2O CO2e
Category lb/day lb/day
Off-Road 4.4776 35.4033 36.2501 0.0446 2.5171 2.5171 2.3726 2.3726 0.0000 4,683.2205
4,683.2205
1.3981 4,712.5814
Total 4.4776 35.4033 36.2501 0.0446 2.5171 2.5171 2.3726 2.3726 0.0000 4,683.2205
4,683.2205
1.3981 4,712.5814
Mitigated Construction On-Site
ROG NOx CO SO2 Fugitive PM10
Exhaust PM10
PM10 Total
Fugitive PM2.5
Exhaust PM2.5
PM2.5 Total
Bio- CO2 NBio- CO2 Total CO2 CH4 N2O CO2e
Category lb/day lb/day
Hauling 8.1000e-004
0.0128 9.3300e-003
4.0000e-005
1.8200e-003
3.2000e-004
2.1300e-003
4.7000e-004
2.9000e-004
7.6000e-004
3.6664 3.6664 2.0000e-005
3.6668
Vendor 0.0000 0.0000 0.0000 0.0000 0.0000 0.0000 0.0000 0.0000 0.0000 0.0000 0.0000 0.0000 0.0000 0.0000
Worker 1.0142 1.8333 19.3117 0.0198 1.7631 0.0120 1.7751 0.4675 0.0109 0.4784 1,644.1390
1,644.1390
0.1358 1,646.9916
Total 1.0150 1.8461 19.3211 0.0199 1.7649 0.0123 1.7772 0.4679 0.0112 0.4792 1,647.8053
1,647.8053
0.1359 1,650.6584
Mitigated Construction Off-Site
CalEEMod Version: CalEEMod.2013.2.2 Date: 2/11/2014 3:32 PMPage 30 of 55

3.6 Post Installation - 2016
ROG NOx CO SO2 Fugitive PM10
Exhaust PM10
PM10 Total
Fugitive PM2.5
Exhaust PM2.5
PM2.5 Total
Bio- CO2 NBio- CO2 Total CO2 CH4 N2O CO2e
Category lb/day lb/day
Off-Road 5.2566 39.4526 35.2182 0.0446 2.6115 2.6115 2.4026 2.4026 4,636.7961
4,636.7961
1.3986 4,666.1672
Total 5.2566 39.4526 35.2182 0.0446 2.6115 2.6115 2.4026 2.4026 4,636.7961
4,636.7961
1.3986 4,666.1672
Unmitigated Construction On-Site
ROG NOx CO SO2 Fugitive PM10
Exhaust PM10
PM10 Total
Fugitive PM2.5
Exhaust PM2.5
PM2.5 Total
Bio- CO2 NBio- CO2 Total CO2 CH4 N2O CO2e
Category lb/day lb/day
Hauling 6.9000e-004
0.0108 8.4400e-003
4.0000e-005
1.4600e-003
2.7000e-004
1.7300e-003
3.8000e-004
2.5000e-004
6.3000e-004
3.6182 3.6182 2.0000e-005
3.6186
Vendor 0.0000 0.0000 0.0000 0.0000 0.0000 0.0000 0.0000 0.0000 0.0000 0.0000 0.0000 0.0000 0.0000 0.0000
Worker 0.8972 1.6548 17.1984 0.0198 1.7631 0.0112 1.7743 0.4675 0.0102 0.4777 1,578.7688
1,578.7688
0.1245 1,581.3823
Total 0.8979 1.6656 17.2069 0.0198 1.7646 0.0114 1.7760 0.4678 0.0105 0.4783 1,582.3870
1,582.3870
0.1245 1,585.0009
Unmitigated Construction Off-Site
CalEEMod Version: CalEEMod.2013.2.2 Date: 2/11/2014 3:32 PMPage 31 of 55

3.6 Post Installation - 2016
ROG NOx CO SO2 Fugitive PM10
Exhaust PM10
PM10 Total
Fugitive PM2.5
Exhaust PM2.5
PM2.5 Total
Bio- CO2 NBio- CO2 Total CO2 CH4 N2O CO2e
Category lb/day lb/day
Off-Road 4.5840 35.3783 36.5452 0.0446 2.5332 2.5332 2.3875 2.3875 0.0000 4,636.7961
4,636.7961
1.3986 4,666.1672
Total 4.5840 35.3783 36.5452 0.0446 2.5332 2.5332 2.3875 2.3875 0.0000 4,636.7961
4,636.7961
1.3986 4,666.1672
Mitigated Construction On-Site
ROG NOx CO SO2 Fugitive PM10
Exhaust PM10
PM10 Total
Fugitive PM2.5
Exhaust PM2.5
PM2.5 Total
Bio- CO2 NBio- CO2 Total CO2 CH4 N2O CO2e
Category lb/day lb/day
Hauling 6.9000e-004
0.0108 8.4400e-003
4.0000e-005
1.4600e-003
2.7000e-004
1.7300e-003
3.8000e-004
2.5000e-004
6.3000e-004
3.6182 3.6182 2.0000e-005
3.6186
Vendor 0.0000 0.0000 0.0000 0.0000 0.0000 0.0000 0.0000 0.0000 0.0000 0.0000 0.0000 0.0000 0.0000 0.0000
Worker 0.8972 1.6548 17.1984 0.0198 1.7631 0.0112 1.7743 0.4675 0.0102 0.4777 1,578.7688
1,578.7688
0.1245 1,581.3823
Total 0.8979 1.6656 17.2069 0.0198 1.7646 0.0114 1.7760 0.4678 0.0105 0.4783 1,582.3870
1,582.3870
0.1245 1,585.0009
Mitigated Construction Off-Site
CalEEMod Version: CalEEMod.2013.2.2 Date: 2/11/2014 3:32 PMPage 32 of 55

3.7 Transmission Line - 2015
ROG NOx CO SO2 Fugitive PM10
Exhaust PM10
PM10 Total
Fugitive PM2.5
Exhaust PM2.5
PM2.5 Total
Bio- CO2 NBio- CO2 Total CO2 CH4 N2O CO2e
Category lb/day lb/day
Off-Road 0.8748 10.6847 5.6785 9.3500e-003
0.4625 0.4625 0.4255 0.4255 982.1393 982.1393 0.2932 988.2967
Total 0.8748 10.6847 5.6785 9.3500e-003
0.4625 0.4625 0.4255 0.4255 982.1393 982.1393 0.2932 988.2967
Unmitigated Construction On-Site
ROG NOx CO SO2 Fugitive PM10
Exhaust PM10
PM10 Total
Fugitive PM2.5
Exhaust PM2.5
PM2.5 Total
Bio- CO2 NBio- CO2 Total CO2 CH4 N2O CO2e
Category lb/day lb/day
Hauling 1.0400e-003
0.0163 0.0119 5.0000e-005
2.3800e-003
4.0000e-004
2.7900e-003
6.2000e-004
3.7000e-004
9.9000e-004
4.6753 4.6753 3.0000e-005
4.6758
Vendor 0.0000 0.0000 0.0000 0.0000 0.0000 0.0000 0.0000 0.0000 0.0000 0.0000 0.0000 0.0000 0.0000 0.0000
Worker 1.0142 1.8333 19.3117 0.0198 1.7631 0.0120 1.7751 0.4675 0.0109 0.4784 1,644.1390
1,644.1390
0.1358 1,646.9916
Total 1.0152 1.8496 19.3236 0.0199 1.7655 0.0124 1.7779 0.4681 0.0113 0.4794 1,648.8142
1,648.8142
0.1359 1,651.6674
Unmitigated Construction Off-Site
CalEEMod Version: CalEEMod.2013.2.2 Date: 2/11/2014 3:32 PMPage 33 of 55

3.7 Transmission Line - 2015
ROG NOx CO SO2 Fugitive PM10
Exhaust PM10
PM10 Total
Fugitive PM2.5
Exhaust PM2.5
PM2.5 Total
Bio- CO2 NBio- CO2 Total CO2 CH4 N2O CO2e
Category lb/day lb/day
Off-Road 0.2310 4.5925 5.3360 9.3500e-003
0.2007 0.2007 0.2007 0.2007 0.0000 982.1393 982.1393 0.2932 988.2967
Total 0.2310 4.5925 5.3360 9.3500e-003
0.2007 0.2007 0.2007 0.2007 0.0000 982.1393 982.1393 0.2932 988.2967
Mitigated Construction On-Site
ROG NOx CO SO2 Fugitive PM10
Exhaust PM10
PM10 Total
Fugitive PM2.5
Exhaust PM2.5
PM2.5 Total
Bio- CO2 NBio- CO2 Total CO2 CH4 N2O CO2e
Category lb/day lb/day
Hauling 1.0400e-003
0.0163 0.0119 5.0000e-005
2.3800e-003
4.0000e-004
2.7900e-003
6.2000e-004
3.7000e-004
9.9000e-004
4.6753 4.6753 3.0000e-005
4.6758
Vendor 0.0000 0.0000 0.0000 0.0000 0.0000 0.0000 0.0000 0.0000 0.0000 0.0000 0.0000 0.0000 0.0000 0.0000
Worker 1.0142 1.8333 19.3117 0.0198 1.7631 0.0120 1.7751 0.4675 0.0109 0.4784 1,644.1390
1,644.1390
0.1358 1,646.9916
Total 1.0152 1.8496 19.3236 0.0199 1.7655 0.0124 1.7779 0.4681 0.0113 0.4794 1,648.8142
1,648.8142
0.1359 1,651.6674
Mitigated Construction Off-Site
CalEEMod Version: CalEEMod.2013.2.2 Date: 2/11/2014 3:32 PMPage 34 of 55

3.7 Transmission Line - 2016
ROG NOx CO SO2 Fugitive PM10
Exhaust PM10
PM10 Total
Fugitive PM2.5
Exhaust PM2.5
PM2.5 Total
Bio- CO2 NBio- CO2 Total CO2 CH4 N2O CO2e
Category lb/day lb/day
Off-Road 0.8219 9.9027 5.4239 9.3600e-003
0.4231 0.4231 0.3893 0.3893 972.0517 972.0517 0.2932 978.2090
Total 0.8219 9.9027 5.4239 9.3600e-003
0.4231 0.4231 0.3893 0.3893 972.0517 972.0517 0.2932 978.2090
Unmitigated Construction On-Site
ROG NOx CO SO2 Fugitive PM10
Exhaust PM10
PM10 Total
Fugitive PM2.5
Exhaust PM2.5
PM2.5 Total
Bio- CO2 NBio- CO2 Total CO2 CH4 N2O CO2e
Category lb/day lb/day
Hauling 8.8000e-004
0.0138 0.0108 5.0000e-005
1.8200e-003
3.4000e-004
2.1600e-003
4.8000e-004
3.1000e-004
7.9000e-004
4.6138 4.6138 2.0000e-005
4.6143
Vendor 0.0000 0.0000 0.0000 0.0000 0.0000 0.0000 0.0000 0.0000 0.0000 0.0000 0.0000 0.0000 0.0000 0.0000
Worker 0.8972 1.6548 17.1984 0.0198 1.7631 0.0112 1.7743 0.4675 0.0102 0.4777 1,578.7688
1,578.7688
0.1245 1,581.3823
Total 0.8981 1.6686 17.2092 0.0199 1.7649 0.0115 1.7764 0.4679 0.0105 0.4785 1,583.3826
1,583.3826
0.1245 1,585.9966
Unmitigated Construction Off-Site
CalEEMod Version: CalEEMod.2013.2.2 Date: 2/11/2014 3:32 PMPage 35 of 55

3.7 Transmission Line - 2016
ROG NOx CO SO2 Fugitive PM10
Exhaust PM10
PM10 Total
Fugitive PM2.5
Exhaust PM2.5
PM2.5 Total
Bio- CO2 NBio- CO2 Total CO2 CH4 N2O CO2e
Category lb/day lb/day
Off-Road 0.2310 4.5925 5.3360 9.3600e-003
0.2007 0.2007 0.2007 0.2007 0.0000 972.0517 972.0517 0.2932 978.2090
Total 0.2310 4.5925 5.3360 9.3600e-003
0.2007 0.2007 0.2007 0.2007 0.0000 972.0517 972.0517 0.2932 978.2090
Mitigated Construction On-Site
ROG NOx CO SO2 Fugitive PM10
Exhaust PM10
PM10 Total
Fugitive PM2.5
Exhaust PM2.5
PM2.5 Total
Bio- CO2 NBio- CO2 Total CO2 CH4 N2O CO2e
Category lb/day lb/day
Hauling 8.8000e-004
0.0138 0.0108 5.0000e-005
1.8200e-003
3.4000e-004
2.1600e-003
4.8000e-004
3.1000e-004
7.9000e-004
4.6138 4.6138 2.0000e-005
4.6143
Vendor 0.0000 0.0000 0.0000 0.0000 0.0000 0.0000 0.0000 0.0000 0.0000 0.0000 0.0000 0.0000 0.0000 0.0000
Worker 0.8972 1.6548 17.1984 0.0198 1.7631 0.0112 1.7743 0.4675 0.0102 0.4777 1,578.7688
1,578.7688
0.1245 1,581.3823
Total 0.8981 1.6686 17.2092 0.0199 1.7649 0.0115 1.7764 0.4679 0.0105 0.4785 1,583.3826
1,583.3826
0.1245 1,585.9966
Mitigated Construction Off-Site
CalEEMod Version: CalEEMod.2013.2.2 Date: 2/11/2014 3:32 PMPage 36 of 55
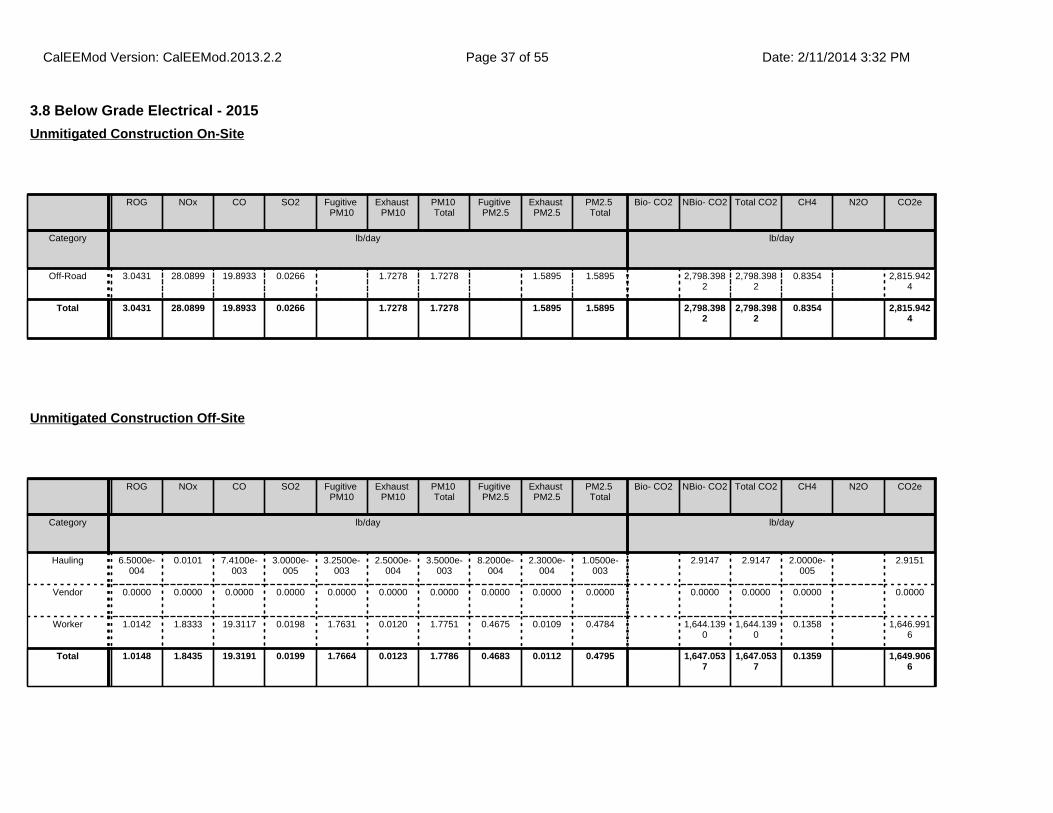
3.8 Below Grade Electrical - 2015
ROG NOx CO SO2 Fugitive PM10
Exhaust PM10
PM10 Total
Fugitive PM2.5
Exhaust PM2.5
PM2.5 Total
Bio- CO2 NBio- CO2 Total CO2 CH4 N2O CO2e
Category lb/day lb/day
Off-Road 3.0431 28.0899 19.8933 0.0266 1.7278 1.7278 1.5895 1.5895 2,798.3982
2,798.3982
0.8354 2,815.9424
Total 3.0431 28.0899 19.8933 0.0266 1.7278 1.7278 1.5895 1.5895 2,798.3982
2,798.3982
0.8354 2,815.9424
Unmitigated Construction On-Site
ROG NOx CO SO2 Fugitive PM10
Exhaust PM10
PM10 Total
Fugitive PM2.5
Exhaust PM2.5
PM2.5 Total
Bio- CO2 NBio- CO2 Total CO2 CH4 N2O CO2e
Category lb/day lb/day
Hauling 6.5000e-004
0.0101 7.4100e-003
3.0000e-005
3.2500e-003
2.5000e-004
3.5000e-003
8.2000e-004
2.3000e-004
1.0500e-003
2.9147 2.9147 2.0000e-005
2.9151
Vendor 0.0000 0.0000 0.0000 0.0000 0.0000 0.0000 0.0000 0.0000 0.0000 0.0000 0.0000 0.0000 0.0000 0.0000
Worker 1.0142 1.8333 19.3117 0.0198 1.7631 0.0120 1.7751 0.4675 0.0109 0.4784 1,644.1390
1,644.1390
0.1358 1,646.9916
Total 1.0148 1.8435 19.3191 0.0199 1.7664 0.0123 1.7786 0.4683 0.0112 0.4795 1,647.0537
1,647.0537
0.1359 1,649.9066
Unmitigated Construction Off-Site
CalEEMod Version: CalEEMod.2013.2.2 Date: 2/11/2014 3:32 PMPage 37 of 55

3.8 Below Grade Electrical - 2015
ROG NOx CO SO2 Fugitive PM10
Exhaust PM10
PM10 Total
Fugitive PM2.5
Exhaust PM2.5
PM2.5 Total
Bio- CO2 NBio- CO2 Total CO2 CH4 N2O CO2e
Category lb/day lb/day
Off-Road 1.3960 15.5560 21.1376 0.0266 0.9486 0.9486 0.9169 0.9169 0.0000 2,798.3982
2,798.3982
0.8354 2,815.9424
Total 1.3960 15.5560 21.1376 0.0266 0.9486 0.9486 0.9169 0.9169 0.0000 2,798.3982
2,798.3982
0.8354 2,815.9424
Mitigated Construction On-Site
ROG NOx CO SO2 Fugitive PM10
Exhaust PM10
PM10 Total
Fugitive PM2.5
Exhaust PM2.5
PM2.5 Total
Bio- CO2 NBio- CO2 Total CO2 CH4 N2O CO2e
Category lb/day lb/day
Hauling 6.5000e-004
0.0101 7.4100e-003
3.0000e-005
3.2500e-003
2.5000e-004
3.5000e-003
8.2000e-004
2.3000e-004
1.0500e-003
2.9147 2.9147 2.0000e-005
2.9151
Vendor 0.0000 0.0000 0.0000 0.0000 0.0000 0.0000 0.0000 0.0000 0.0000 0.0000 0.0000 0.0000 0.0000 0.0000
Worker 1.0142 1.8333 19.3117 0.0198 1.7631 0.0120 1.7751 0.4675 0.0109 0.4784 1,644.1390
1,644.1390
0.1358 1,646.9916
Total 1.0148 1.8435 19.3191 0.0199 1.7664 0.0123 1.7786 0.4683 0.0112 0.4795 1,647.0537
1,647.0537
0.1359 1,649.9066
Mitigated Construction Off-Site
CalEEMod Version: CalEEMod.2013.2.2 Date: 2/11/2014 3:32 PMPage 38 of 55

3.8 Below Grade Electrical - 2016
ROG NOx CO SO2 Fugitive PM10
Exhaust PM10
PM10 Total
Fugitive PM2.5
Exhaust PM2.5
PM2.5 Total
Bio- CO2 NBio- CO2 Total CO2 CH4 N2O CO2e
Category lb/day lb/day
Off-Road 2.8887 26.1830 19.8074 0.0266 1.6164 1.6164 1.4871 1.4871 2,766.7922
2,766.7922
0.8346 2,784.3180
Total 2.8887 26.1830 19.8074 0.0266 1.6164 1.6164 1.4871 1.4871 2,766.7922
2,766.7922
0.8346 2,784.3180
Unmitigated Construction On-Site
ROG NOx CO SO2 Fugitive PM10
Exhaust PM10
PM10 Total
Fugitive PM2.5
Exhaust PM2.5
PM2.5 Total
Bio- CO2 NBio- CO2 Total CO2 CH4 N2O CO2e
Category lb/day lb/day
Hauling 5.5000e-004
8.6200e-003
6.7100e-003
3.0000e-005
8.5000e-004
2.1000e-004
1.0700e-003
2.3000e-004
2.0000e-004
4.3000e-004
2.8764 2.8764 2.0000e-005
2.8767
Vendor 0.0000 0.0000 0.0000 0.0000 0.0000 0.0000 0.0000 0.0000 0.0000 0.0000 0.0000 0.0000 0.0000 0.0000
Worker 0.8972 1.6548 17.1984 0.0198 1.7631 0.0112 1.7743 0.4675 0.0102 0.4777 1,578.7688
1,578.7688
0.1245 1,581.3823
Total 0.8977 1.6634 17.2051 0.0198 1.7640 0.0114 1.7753 0.4677 0.0104 0.4781 1,581.6452
1,581.6452
0.1245 1,584.2590
Unmitigated Construction Off-Site
CalEEMod Version: CalEEMod.2013.2.2 Date: 2/11/2014 3:32 PMPage 39 of 55

3.8 Below Grade Electrical - 2016
ROG NOx CO SO2 Fugitive PM10
Exhaust PM10
PM10 Total
Fugitive PM2.5
Exhaust PM2.5
PM2.5 Total
Bio- CO2 NBio- CO2 Total CO2 CH4 N2O CO2e
Category lb/day lb/day
Off-Road 1.3773 15.4570 21.1556 0.0266 0.9316 0.9316 0.9013 0.9013 0.0000 2,766.7922
2,766.7922
0.8346 2,784.3180
Total 1.3773 15.4570 21.1556 0.0266 0.9316 0.9316 0.9013 0.9013 0.0000 2,766.7922
2,766.7922
0.8346 2,784.3180
Mitigated Construction On-Site
ROG NOx CO SO2 Fugitive PM10
Exhaust PM10
PM10 Total
Fugitive PM2.5
Exhaust PM2.5
PM2.5 Total
Bio- CO2 NBio- CO2 Total CO2 CH4 N2O CO2e
Category lb/day lb/day
Hauling 5.5000e-004
8.6200e-003
6.7100e-003
3.0000e-005
8.5000e-004
2.1000e-004
1.0700e-003
2.3000e-004
2.0000e-004
4.3000e-004
2.8764 2.8764 2.0000e-005
2.8767
Vendor 0.0000 0.0000 0.0000 0.0000 0.0000 0.0000 0.0000 0.0000 0.0000 0.0000 0.0000 0.0000 0.0000 0.0000
Worker 0.8972 1.6548 17.1984 0.0198 1.7631 0.0112 1.7743 0.4675 0.0102 0.4777 1,578.7688
1,578.7688
0.1245 1,581.3823
Total 0.8977 1.6634 17.2051 0.0198 1.7640 0.0114 1.7753 0.4677 0.0104 0.4781 1,581.6452
1,581.6452
0.1245 1,584.2590
Mitigated Construction Off-Site
CalEEMod Version: CalEEMod.2013.2.2 Date: 2/11/2014 3:32 PMPage 40 of 55

3.9 Above Grade Electrical - 2015
ROG NOx CO SO2 Fugitive PM10
Exhaust PM10
PM10 Total
Fugitive PM2.5
Exhaust PM2.5
PM2.5 Total
Bio- CO2 NBio- CO2 Total CO2 CH4 N2O CO2e
Category lb/day lb/day
Off-Road 0.1340 1.6985 1.3358 1.9400e-003
0.0982 0.0982 0.0903 0.0903 203.2121 203.2121 0.0607 204.4861
Total 0.1340 1.6985 1.3358 1.9400e-003
0.0982 0.0982 0.0903 0.0903 203.2121 203.2121 0.0607 204.4861
Unmitigated Construction On-Site
ROG NOx CO SO2 Fugitive PM10
Exhaust PM10
PM10 Total
Fugitive PM2.5
Exhaust PM2.5
PM2.5 Total
Bio- CO2 NBio- CO2 Total CO2 CH4 N2O CO2e
Category lb/day lb/day
Hauling 6.4000e-004
0.0101 7.3800e-003
3.0000e-005
5.9300e-003
2.5000e-004
6.1800e-003
1.4800e-003
2.3000e-004
1.7100e-003
2.9026 2.9026 2.0000e-005
2.9029
Vendor 0.0000 0.0000 0.0000 0.0000 0.0000 0.0000 0.0000 0.0000 0.0000 0.0000 0.0000 0.0000 0.0000 0.0000
Worker 1.0142 1.8333 19.3117 0.0198 1.7631 0.0120 1.7751 0.4675 0.0109 0.4784 1,644.1390
1,644.1390
0.1358 1,646.9916
Total 1.0148 1.8434 19.3191 0.0199 1.7690 0.0123 1.7813 0.4689 0.0112 0.4801 1,647.0415
1,647.0415
0.1359 1,649.8945
Unmitigated Construction Off-Site
CalEEMod Version: CalEEMod.2013.2.2 Date: 2/11/2014 3:32 PMPage 41 of 55

3.9 Above Grade Electrical - 2015
ROG NOx CO SO2 Fugitive PM10
Exhaust PM10
PM10 Total
Fugitive PM2.5
Exhaust PM2.5
PM2.5 Total
Bio- CO2 NBio- CO2 Total CO2 CH4 N2O CO2e
Category lb/day lb/day
Off-Road 0.0476 1.0873 1.4683 1.9400e-003
0.0762 0.0762 0.0762 0.0762 0.0000 203.2121 203.2121 0.0607 204.4861
Total 0.0476 1.0873 1.4683 1.9400e-003
0.0762 0.0762 0.0762 0.0762 0.0000 203.2121 203.2121 0.0607 204.4861
Mitigated Construction On-Site
ROG NOx CO SO2 Fugitive PM10
Exhaust PM10
PM10 Total
Fugitive PM2.5
Exhaust PM2.5
PM2.5 Total
Bio- CO2 NBio- CO2 Total CO2 CH4 N2O CO2e
Category lb/day lb/day
Hauling 6.4000e-004
0.0101 7.3800e-003
3.0000e-005
5.9300e-003
2.5000e-004
6.1800e-003
1.4800e-003
2.3000e-004
1.7100e-003
2.9026 2.9026 2.0000e-005
2.9029
Vendor 0.0000 0.0000 0.0000 0.0000 0.0000 0.0000 0.0000 0.0000 0.0000 0.0000 0.0000 0.0000 0.0000 0.0000
Worker 1.0142 1.8333 19.3117 0.0198 1.7631 0.0120 1.7751 0.4675 0.0109 0.4784 1,644.1390
1,644.1390
0.1358 1,646.9916
Total 1.0148 1.8434 19.3191 0.0199 1.7690 0.0123 1.7813 0.4689 0.0112 0.4801 1,647.0415
1,647.0415
0.1359 1,649.8945
Mitigated Construction Off-Site
CalEEMod Version: CalEEMod.2013.2.2 Date: 2/11/2014 3:32 PMPage 42 of 55

3.9 Above Grade Electrical - 2016
ROG NOx CO SO2 Fugitive PM10
Exhaust PM10
PM10 Total
Fugitive PM2.5
Exhaust PM2.5
PM2.5 Total
Bio- CO2 NBio- CO2 Total CO2 CH4 N2O CO2e
Category lb/day lb/day
Off-Road 0.1197 1.5239 1.3261 1.9400e-003
0.0846 0.0846 0.0778 0.0778 201.2200 201.2200 0.0607 202.4946
Total 0.1197 1.5239 1.3261 1.9400e-003
0.0846 0.0846 0.0778 0.0778 201.2200 201.2200 0.0607 202.4946
Unmitigated Construction On-Site
ROG NOx CO SO2 Fugitive PM10
Exhaust PM10
PM10 Total
Fugitive PM2.5
Exhaust PM2.5
PM2.5 Total
Bio- CO2 NBio- CO2 Total CO2 CH4 N2O CO2e
Category lb/day lb/day
Hauling 5.5000e-004
8.5800e-003
6.6800e-003
3.0000e-005
7.9000e-004
2.1000e-004
1.0000e-003
2.1000e-004
1.9000e-004
4.1000e-004
2.8644 2.8644 2.0000e-005
2.8647
Vendor 0.0000 0.0000 0.0000 0.0000 0.0000 0.0000 0.0000 0.0000 0.0000 0.0000 0.0000 0.0000 0.0000 0.0000
Worker 0.8972 1.6548 17.1984 0.0198 1.7631 0.0112 1.7743 0.4675 0.0102 0.4777 1,578.7688
1,578.7688
0.1245 1,581.3823
Total 0.8977 1.6633 17.2051 0.0198 1.7639 0.0114 1.7753 0.4677 0.0104 0.4781 1,581.6332
1,581.6332
0.1245 1,584.2470
Unmitigated Construction Off-Site
CalEEMod Version: CalEEMod.2013.2.2 Date: 2/11/2014 3:32 PMPage 43 of 55

3.9 Above Grade Electrical - 2016
ROG NOx CO SO2 Fugitive PM10
Exhaust PM10
PM10 Total
Fugitive PM2.5
Exhaust PM2.5
PM2.5 Total
Bio- CO2 NBio- CO2 Total CO2 CH4 N2O CO2e
Category lb/day lb/day
Off-Road 0.0476 1.0873 1.4683 1.9400e-003
0.0762 0.0762 0.0762 0.0762 0.0000 201.2200 201.2200 0.0607 202.4946
Total 0.0476 1.0873 1.4683 1.9400e-003
0.0762 0.0762 0.0762 0.0762 0.0000 201.2200 201.2200 0.0607 202.4946
Mitigated Construction On-Site
ROG NOx CO SO2 Fugitive PM10
Exhaust PM10
PM10 Total
Fugitive PM2.5
Exhaust PM2.5
PM2.5 Total
Bio- CO2 NBio- CO2 Total CO2 CH4 N2O CO2e
Category lb/day lb/day
Hauling 5.5000e-004
8.5800e-003
6.6800e-003
3.0000e-005
7.9000e-004
2.1000e-004
1.0000e-003
2.1000e-004
1.9000e-004
4.1000e-004
2.8644 2.8644 2.0000e-005
2.8647
Vendor 0.0000 0.0000 0.0000 0.0000 0.0000 0.0000 0.0000 0.0000 0.0000 0.0000 0.0000 0.0000 0.0000 0.0000
Worker 0.8972 1.6548 17.1984 0.0198 1.7631 0.0112 1.7743 0.4675 0.0102 0.4777 1,578.7688
1,578.7688
0.1245 1,581.3823
Total 0.8977 1.6633 17.2051 0.0198 1.7639 0.0114 1.7753 0.4677 0.0104 0.4781 1,581.6332
1,581.6332
0.1245 1,584.2470
Mitigated Construction Off-Site
CalEEMod Version: CalEEMod.2013.2.2 Date: 2/11/2014 3:32 PMPage 44 of 55

3.10 Module Installation - 2015
ROG NOx CO SO2 Fugitive PM10
Exhaust PM10
PM10 Total
Fugitive PM2.5
Exhaust PM2.5
PM2.5 Total
Bio- CO2 NBio- CO2 Total CO2 CH4 N2O CO2e
Category lb/day lb/day
Off-Road 0.6701 8.4923 6.6791 9.6800e-003
0.4909 0.4909 0.4516 0.4516 1,016.0606
1,016.0606
0.3033 1,022.4307
Total 0.6701 8.4923 6.6791 9.6800e-003
0.4909 0.4909 0.4516 0.4516 1,016.0606
1,016.0606
0.3033 1,022.4307
Unmitigated Construction On-Site
ROG NOx CO SO2 Fugitive PM10
Exhaust PM10
PM10 Total
Fugitive PM2.5
Exhaust PM2.5
PM2.5 Total
Bio- CO2 NBio- CO2 Total CO2 CH4 N2O CO2e
Category lb/day lb/day
Hauling 6.4000e-004
0.0100 7.3200e-003
3.0000e-005
0.0443 2.5000e-004
0.0445 0.0109 2.3000e-004
0.0111 2.8786 2.8786 2.0000e-005
2.8789
Vendor 0.0000 0.0000 0.0000 0.0000 0.0000 0.0000 0.0000 0.0000 0.0000 0.0000 0.0000 0.0000 0.0000 0.0000
Worker 1.0142 1.8333 19.3117 0.0198 1.7631 0.0120 1.7751 0.4675 0.0109 0.4784 1,644.1390
1,644.1390
0.1358 1,646.9916
Total 1.0148 1.8433 19.3190 0.0199 1.8074 0.0123 1.8196 0.4783 0.0112 0.4895 1,647.0175
1,647.0175
0.1359 1,649.8705
Unmitigated Construction Off-Site
CalEEMod Version: CalEEMod.2013.2.2 Date: 2/11/2014 3:32 PMPage 45 of 55

3.10 Module Installation - 2015
ROG NOx CO SO2 Fugitive PM10
Exhaust PM10
PM10 Total
Fugitive PM2.5
Exhaust PM2.5
PM2.5 Total
Bio- CO2 NBio- CO2 Total CO2 CH4 N2O CO2e
Category lb/day lb/day
Off-Road 0.2381 5.4366 7.3414 9.6800e-003
0.3810 0.3810 0.3810 0.3810 0.0000 1,016.0606
1,016.0606
0.3033 1,022.4307
Total 0.2381 5.4366 7.3414 9.6800e-003
0.3810 0.3810 0.3810 0.3810 0.0000 1,016.0606
1,016.0606
0.3033 1,022.4307
Mitigated Construction On-Site
ROG NOx CO SO2 Fugitive PM10
Exhaust PM10
PM10 Total
Fugitive PM2.5
Exhaust PM2.5
PM2.5 Total
Bio- CO2 NBio- CO2 Total CO2 CH4 N2O CO2e
Category lb/day lb/day
Hauling 6.4000e-004
0.0100 7.3200e-003
3.0000e-005
0.0443 2.5000e-004
0.0445 0.0109 2.3000e-004
0.0111 2.8786 2.8786 2.0000e-005
2.8789
Vendor 0.0000 0.0000 0.0000 0.0000 0.0000 0.0000 0.0000 0.0000 0.0000 0.0000 0.0000 0.0000 0.0000 0.0000
Worker 1.0142 1.8333 19.3117 0.0198 1.7631 0.0120 1.7751 0.4675 0.0109 0.4784 1,644.1390
1,644.1390
0.1358 1,646.9916
Total 1.0148 1.8433 19.3190 0.0199 1.8074 0.0123 1.8196 0.4783 0.0112 0.4895 1,647.0175
1,647.0175
0.1359 1,649.8705
Mitigated Construction Off-Site
CalEEMod Version: CalEEMod.2013.2.2 Date: 2/11/2014 3:32 PMPage 46 of 55

3.10 Module Installation - 2016
ROG NOx CO SO2 Fugitive PM10
Exhaust PM10
PM10 Total
Fugitive PM2.5
Exhaust PM2.5
PM2.5 Total
Bio- CO2 NBio- CO2 Total CO2 CH4 N2O CO2e
Category lb/day lb/day
Off-Road 0.5984 7.6193 6.6305 9.6900e-003
0.4229 0.4229 0.3891 0.3891 1,006.1000
1,006.1000
0.3035 1,012.4730
Total 0.5984 7.6193 6.6305 9.6900e-003
0.4229 0.4229 0.3891 0.3891 1,006.1000
1,006.1000
0.3035 1,012.4730
Unmitigated Construction On-Site
ROG NOx CO SO2 Fugitive PM10
Exhaust PM10
PM10 Total
Fugitive PM2.5
Exhaust PM2.5
PM2.5 Total
Bio- CO2 NBio- CO2 Total CO2 CH4 N2O CO2e
Category lb/day lb/day
Hauling 5.4000e-004
8.5100e-003
6.6200e-003
3.0000e-005
7.3000e-004
2.1000e-004
9.4000e-004
2.0000e-004
1.9000e-004
3.9000e-004
2.8407 2.8407 2.0000e-005
2.8411
Vendor 0.0000 0.0000 0.0000 0.0000 0.0000 0.0000 0.0000 0.0000 0.0000 0.0000 0.0000 0.0000 0.0000 0.0000
Worker 0.8972 1.6548 17.1984 0.0198 1.7631 0.0112 1.7743 0.4675 0.0102 0.4777 1,578.7688
1,578.7688
0.1245 1,581.3823
Total 0.8977 1.6633 17.2051 0.0198 1.7638 0.0114 1.7752 0.4677 0.0104 0.4781 1,581.6095
1,581.6095
0.1245 1,584.2234
Unmitigated Construction Off-Site
CalEEMod Version: CalEEMod.2013.2.2 Date: 2/11/2014 3:32 PMPage 47 of 55

3.10 Module Installation - 2016
ROG NOx CO SO2 Fugitive PM10
Exhaust PM10
PM10 Total
Fugitive PM2.5
Exhaust PM2.5
PM2.5 Total
Bio- CO2 NBio- CO2 Total CO2 CH4 N2O CO2e
Category lb/day lb/day
Off-Road 0.2381 5.4366 7.3414 9.6900e-003
0.3810 0.3810 0.3810 0.3810 0.0000 1,006.1000
1,006.1000
0.3035 1,012.4730
Total 0.2381 5.4366 7.3414 9.6900e-003
0.3810 0.3810 0.3810 0.3810 0.0000 1,006.1000
1,006.1000
0.3035 1,012.4730
Mitigated Construction On-Site
ROG NOx CO SO2 Fugitive PM10
Exhaust PM10
PM10 Total
Fugitive PM2.5
Exhaust PM2.5
PM2.5 Total
Bio- CO2 NBio- CO2 Total CO2 CH4 N2O CO2e
Category lb/day lb/day
Hauling 5.4000e-004
8.5100e-003
6.6200e-003
3.0000e-005
7.3000e-004
2.1000e-004
9.4000e-004
2.0000e-004
1.9000e-004
3.9000e-004
2.8407 2.8407 2.0000e-005
2.8411
Vendor 0.0000 0.0000 0.0000 0.0000 0.0000 0.0000 0.0000 0.0000 0.0000 0.0000 0.0000 0.0000 0.0000 0.0000
Worker 0.8972 1.6548 17.1984 0.0198 1.7631 0.0112 1.7743 0.4675 0.0102 0.4777 1,578.7688
1,578.7688
0.1245 1,581.3823
Total 0.8977 1.6633 17.2051 0.0198 1.7638 0.0114 1.7752 0.4677 0.0104 0.4781 1,581.6095
1,581.6095
0.1245 1,584.2234
Mitigated Construction Off-Site
CalEEMod Version: CalEEMod.2013.2.2 Date: 2/11/2014 3:32 PMPage 48 of 55

3.11 O&M Building - 2016
ROG NOx CO SO2 Fugitive PM10
Exhaust PM10
PM10 Total
Fugitive PM2.5
Exhaust PM2.5
PM2.5 Total
Bio- CO2 NBio- CO2 Total CO2 CH4 N2O CO2e
Category lb/day lb/day
Off-Road 1.4632 16.9395 8.8387 0.0145 0.8085 0.8085 0.7438 0.7438 1,509.4898
1,509.4898
0.4553 1,519.0514
Total 1.4632 16.9395 8.8387 0.0145 0.8085 0.8085 0.7438 0.7438 1,509.4898
1,509.4898
0.4553 1,519.0514
Unmitigated Construction On-Site
ROG NOx CO SO2 Fugitive PM10
Exhaust PM10
PM10 Total
Fugitive PM2.5
Exhaust PM2.5
PM2.5 Total
Bio- CO2 NBio- CO2 Total CO2 CH4 N2O CO2e
Category lb/day lb/day
Hauling 1.6600e-003
0.0261 0.0203 9.0000e-005
2.2100e-003
6.4000e-004
2.8600e-003
6.1000e-004
5.9000e-004
1.2000e-003
8.7020 8.7020 5.0000e-005
8.7030
Vendor 0.0000 0.0000 0.0000 0.0000 0.0000 0.0000 0.0000 0.0000 0.0000 0.0000 0.0000 0.0000 0.0000 0.0000
Worker 0.8972 1.6548 17.1984 0.0198 1.7631 0.0112 1.7743 0.4675 0.0102 0.4777 1,578.7688
1,578.7688
0.1245 1,581.3823
Total 0.8989 1.6808 17.2187 0.0199 1.7653 0.0118 1.7771 0.4681 0.0108 0.4789 1,587.4708
1,587.4708
0.1245 1,590.0853
Unmitigated Construction Off-Site
CalEEMod Version: CalEEMod.2013.2.2 Date: 2/11/2014 3:32 PMPage 49 of 55
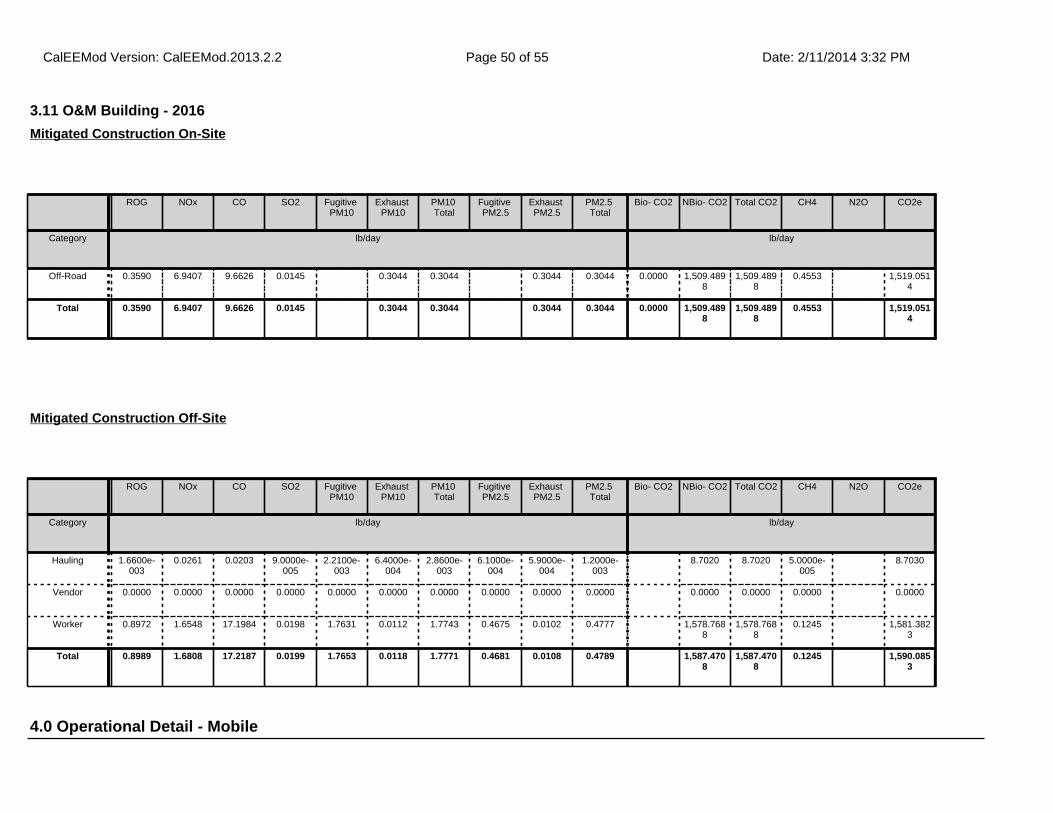
4.0 Operational Detail - Mobile
3.11 O&M Building - 2016
ROG NOx CO SO2 Fugitive PM10
Exhaust PM10
PM10 Total
Fugitive PM2.5
Exhaust PM2.5
PM2.5 Total
Bio- CO2 NBio- CO2 Total CO2 CH4 N2O CO2e
Category lb/day lb/day
Off-Road 0.3590 6.9407 9.6626 0.0145 0.3044 0.3044 0.3044 0.3044 0.0000 1,509.4898
1,509.4898
0.4553 1,519.0514
Total 0.3590 6.9407 9.6626 0.0145 0.3044 0.3044 0.3044 0.3044 0.0000 1,509.4898
1,509.4898
0.4553 1,519.0514
Mitigated Construction On-Site
ROG NOx CO SO2 Fugitive PM10
Exhaust PM10
PM10 Total
Fugitive PM2.5
Exhaust PM2.5
PM2.5 Total
Bio- CO2 NBio- CO2 Total CO2 CH4 N2O CO2e
Category lb/day lb/day
Hauling 1.6600e-003
0.0261 0.0203 9.0000e-005
2.2100e-003
6.4000e-004
2.8600e-003
6.1000e-004
5.9000e-004
1.2000e-003
8.7020 8.7020 5.0000e-005
8.7030
Vendor 0.0000 0.0000 0.0000 0.0000 0.0000 0.0000 0.0000 0.0000 0.0000 0.0000 0.0000 0.0000 0.0000 0.0000
Worker 0.8972 1.6548 17.1984 0.0198 1.7631 0.0112 1.7743 0.4675 0.0102 0.4777 1,578.7688
1,578.7688
0.1245 1,581.3823
Total 0.8989 1.6808 17.2187 0.0199 1.7653 0.0118 1.7771 0.4681 0.0108 0.4789 1,587.4708
1,587.4708
0.1245 1,590.0853
Mitigated Construction Off-Site
CalEEMod Version: CalEEMod.2013.2.2 Date: 2/11/2014 3:32 PMPage 50 of 55

ROG NOx CO SO2 Fugitive PM10
Exhaust PM10
PM10 Total
Fugitive PM2.5
Exhaust PM2.5
PM2.5 Total
Bio- CO2 NBio- CO2 Total CO2 CH4 N2O CO2e
Category lb/day lb/day
Mitigated 0.0000 0.0000 0.0000 0.0000 0.0000 0.0000 0.0000 0.0000 0.0000 0.0000 0.0000 0.0000 0.0000 0.0000
Unmitigated 0.0000 0.0000 0.0000 0.0000 0.0000 0.0000 0.0000 0.0000 0.0000 0.0000 0.0000 0.0000 0.0000 0.0000
4.1 Mitigation Measures Mobile
4.2 Trip Summary Information
4.3 Trip Type Information
Average Daily Trip Rate Unmitigated Mitigated
Land Use Weekday Saturday Sunday Annual VMT Annual VMT
User Defined Industrial 0.00 0.00 0.00
Total 0.00 0.00 0.00
Miles Trip % Trip Purpose %
Land Use H-W or C-W H-S or C-C H-O or C-NW H-W or C-W H-S or C-C H-O or C-NW Primary Diverted Pass-by
User Defined Industrial 6.70 5.00 8.90 0.00 0.00 0.00 0 0 0
5.0 Energy Detail4.4 Fleet Mix
LDA LDT1 LDT2 MDV LHD1 LHD2 MHD HHD OBUS UBUS MCY SBUS MH
0.452463 0.070907 0.165532 0.163183 0.043777 0.005595 0.012812 0.078576 0.001869 0.000152 0.002393 0.000687 0.002054
Historical Energy Use: N
CalEEMod Version: CalEEMod.2013.2.2 Date: 2/11/2014 3:32 PMPage 51 of 55

ROG NOx CO SO2 Fugitive PM10
Exhaust PM10
PM10 Total
Fugitive PM2.5
Exhaust PM2.5
PM2.5 Total
Bio- CO2 NBio- CO2 Total CO2 CH4 N2O CO2e
Category lb/day lb/day
NaturalGas Mitigated
0.0000 0.0000 0.0000 0.0000 0.0000 0.0000 0.0000 0.0000 0.0000 0.0000 0.0000 0.0000 0.0000
NaturalGas Unmitigated
0.0000 0.0000 0.0000 0.0000 0.0000 0.0000 0.0000 0.0000 0.0000 0.0000 0.0000 0.0000 0.0000
5.2 Energy by Land Use - NaturalGas
NaturalGas Use
ROG NOx CO SO2 Fugitive PM10
Exhaust PM10
PM10 Total
Fugitive PM2.5
Exhaust PM2.5
PM2.5 Total
Bio- CO2 NBio- CO2 Total CO2 CH4 N2O CO2e
Land Use kBTU/yr lb/day lb/day
User Defined Industrial
0 0.0000 0.0000 0.0000 0.0000 0.0000 0.0000 0.0000 0.0000 0.0000 0.0000 0.0000 0.0000 0.0000
Total 0.0000 0.0000 0.0000 0.0000 0.0000 0.0000 0.0000 0.0000 0.0000 0.0000 0.0000 0.0000 0.0000
Unmitigated
5.1 Mitigation Measures Energy
Historical Energy Use: N
CalEEMod Version: CalEEMod.2013.2.2 Date: 2/11/2014 3:32 PMPage 52 of 55

6.1 Mitigation Measures Area
6.0 Area Detail
ROG NOx CO SO2 Fugitive PM10
Exhaust PM10
PM10 Total
Fugitive PM2.5
Exhaust PM2.5
PM2.5 Total
Bio- CO2 NBio- CO2 Total CO2 CH4 N2O CO2e
Category lb/day lb/day
Mitigated 0.0285 2.8000e-003
0.2925 2.0000e-005
1.0600e-003
1.0600e-003
1.0600e-003
1.0600e-003
0.6113 0.6113 1.7300e-003
0.6476
Unmitigated 0.0285 2.8000e-003
0.2925 2.0000e-005
1.0600e-003
1.0600e-003
1.0600e-003
1.0600e-003
0.6113 0.6113 1.7300e-003
0.6476
5.2 Energy by Land Use - NaturalGas
NaturalGas Use
ROG NOx CO SO2 Fugitive PM10
Exhaust PM10
PM10 Total
Fugitive PM2.5
Exhaust PM2.5
PM2.5 Total
Bio- CO2 NBio- CO2 Total CO2 CH4 N2O CO2e
Land Use kBTU/yr lb/day lb/day
User Defined Industrial
0 0.0000 0.0000 0.0000 0.0000 0.0000 0.0000 0.0000 0.0000 0.0000 0.0000 0.0000 0.0000 0.0000
Total 0.0000 0.0000 0.0000 0.0000 0.0000 0.0000 0.0000 0.0000 0.0000 0.0000 0.0000 0.0000 0.0000
Mitigated
CalEEMod Version: CalEEMod.2013.2.2 Date: 2/11/2014 3:32 PMPage 53 of 55
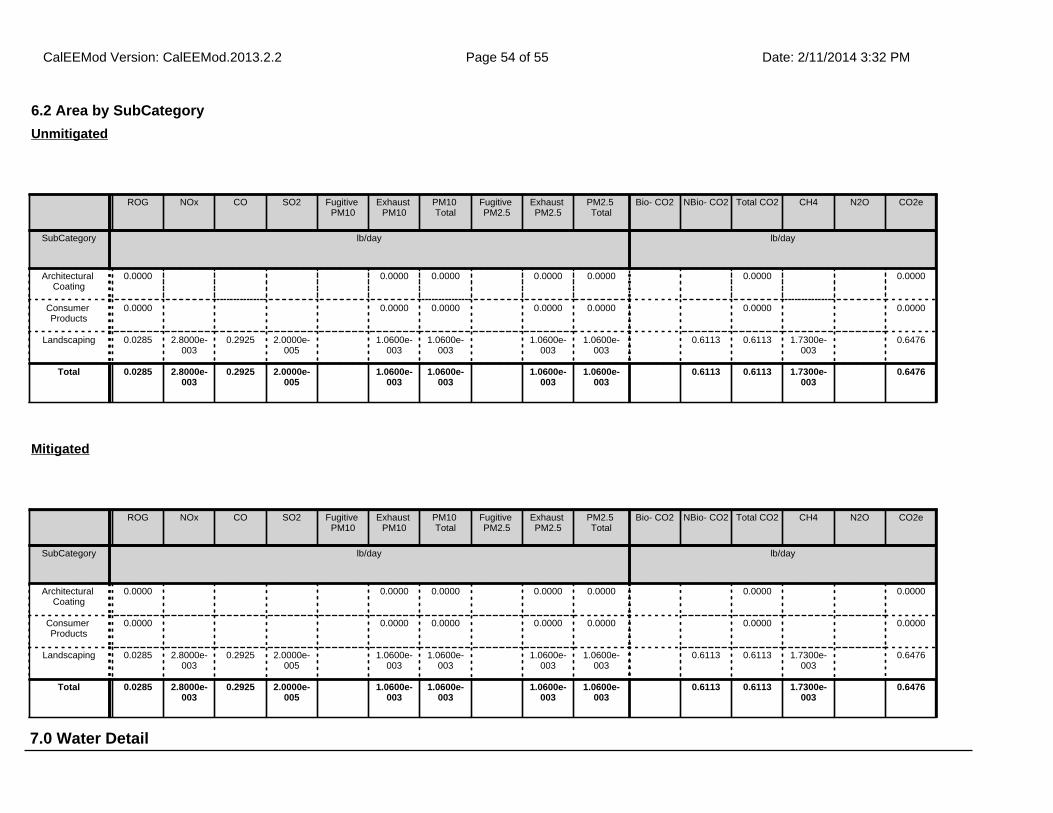
7.0 Water Detail
6.2 Area by SubCategory
ROG NOx CO SO2 Fugitive PM10
Exhaust PM10
PM10 Total
Fugitive PM2.5
Exhaust PM2.5
PM2.5 Total
Bio- CO2 NBio- CO2 Total CO2 CH4 N2O CO2e
SubCategory lb/day lb/day
Architectural Coating
0.0000 0.0000 0.0000 0.0000 0.0000 0.0000 0.0000
Consumer Products
0.0000 0.0000 0.0000 0.0000 0.0000 0.0000 0.0000
Landscaping 0.0285 2.8000e-003
0.2925 2.0000e-005
1.0600e-003
1.0600e-003
1.0600e-003
1.0600e-003
0.6113 0.6113 1.7300e-003
0.6476
Total 0.0285 2.8000e-003
0.2925 2.0000e-005
1.0600e-003
1.0600e-003
1.0600e-003
1.0600e-003
0.6113 0.6113 1.7300e-003
0.6476
Unmitigated
ROG NOx CO SO2 Fugitive PM10
Exhaust PM10
PM10 Total
Fugitive PM2.5
Exhaust PM2.5
PM2.5 Total
Bio- CO2 NBio- CO2 Total CO2 CH4 N2O CO2e
SubCategory lb/day lb/day
Architectural Coating
0.0000 0.0000 0.0000 0.0000 0.0000 0.0000 0.0000
Consumer Products
0.0000 0.0000 0.0000 0.0000 0.0000 0.0000 0.0000
Landscaping 0.0285 2.8000e-003
0.2925 2.0000e-005
1.0600e-003
1.0600e-003
1.0600e-003
1.0600e-003
0.6113 0.6113 1.7300e-003
0.6476
Total 0.0285 2.8000e-003
0.2925 2.0000e-005
1.0600e-003
1.0600e-003
1.0600e-003
1.0600e-003
0.6113 0.6113 1.7300e-003
0.6476
Mitigated
CalEEMod Version: CalEEMod.2013.2.2 Date: 2/11/2014 3:32 PMPage 54 of 55

8.1 Mitigation Measures Waste
7.1 Mitigation Measures Water
8.0 Waste Detail
10.0 Vegetation
9.0 Operational Offroad
Equipment Type Number Hours/Day Days/Year Horse Power Load Factor Fuel Type
CalEEMod Version: CalEEMod.2013.2.2 Date: 2/11/2014 3:32 PMPage 55 of 55
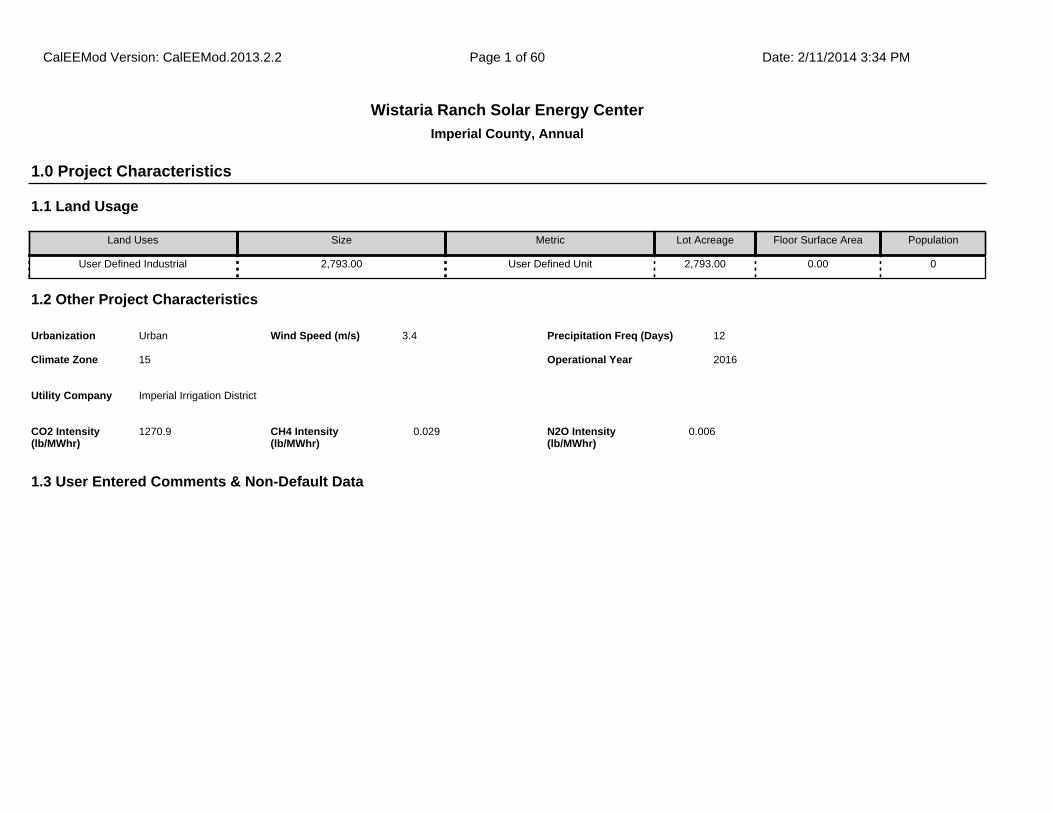
Imperial County, Annual
Wistaria Ranch Solar Energy Center
1.1 Land Usage
Land Uses Size Metric Lot Acreage Floor Surface Area Population
User Defined Industrial 2,793.00 User Defined Unit 2,793.00 0.00 0
1.2 Other Project Characteristics
Urbanization
Climate Zone
Urban
15
Wind Speed (m/s) Precipitation Freq (Days)3.4 12
1.3 User Entered Comments & Non-Default Data
1.0 Project Characteristics
Utility Company Imperial Irrigation District
2016Operational Year
CO2 Intensity (lb/MWhr)
1270.9 0.029CH4 Intensity (lb/MWhr)
0.006N2O Intensity (lb/MWhr)
CalEEMod Version: CalEEMod.2013.2.2 Date: 2/11/2014 3:34 PMPage 1 of 60

Project Characteristics -
Land Use - Estimated acreage based on most recent project description
Construction Phase - Estimated construction schedule provided by project applicant
Off-road Equipment - Estimated construction equipment per project applicant
Off-road Equipment - Estimated construction equipment per project applicant
Off-road Equipment - Estimated construction equipment per project applicant
Off-road Equipment - Equipment estimates based on total construction equipment divided by number of construction days
Off-road Equipment - Estimated construction equipment per project applicant
Off-road Equipment - Estimated construction equipment per project applicant
Off-road Equipment - Estimated construction equipment per project applicant
Off-road Equipment - Estimated construction equipment per project applicant
Off-road Equipment - Estimated construction equipment per project applicant
Off-road Equipment - Estimated construction equipment per project applicant
Trips and VMT - Construction worker trips based on a maximum of 350 workers per day (525 ADT including carpools). Haul trucks based on a maximum of 46 trips per day.
On-road Fugitive Dust - Assumes travel on paved roads
Grading - Estimated disturbed acreage based on project area and construction schedule
Vehicle Trips - Does not include estimates of operational emissions.
Vechicle Emission Factors -
Vechicle Emission Factors -
Vechicle Emission Factors -
Area Coating -
Water And Wastewater -
Construction Off-road Equipment Mitigation - Includes mitigation to Tier 3 engines for all equipment greater than 50 hp.
Area Mitigation -
Table Name Column Name Default Value New Value
tblAreaMitigation UseLowVOCPaintNonresidentialExteriorValue
150 100
tblConstEquipMitigation NumberOfEquipmentMitigated 0.00 2.00
CalEEMod Version: CalEEMod.2013.2.2 Date: 2/11/2014 3:34 PMPage 2 of 60

tblConstEquipMitigation NumberOfEquipmentMitigated 0.00 2.00
tblConstEquipMitigation NumberOfEquipmentMitigated 0.00 6.00
tblConstEquipMitigation NumberOfEquipmentMitigated 0.00 8.00
tblConstEquipMitigation NumberOfEquipmentMitigated 0.00 6.00
tblConstEquipMitigation NumberOfEquipmentMitigated 0.00 22.00
tblConstEquipMitigation NumberOfEquipmentMitigated 0.00 28.00
tblConstEquipMitigation NumberOfEquipmentMitigated 0.00 4.00
tblConstEquipMitigation NumberOfEquipmentMitigated 0.00 12.00
tblConstEquipMitigation NumberOfEquipmentMitigated 0.00 2.00
tblConstEquipMitigation Tier No Change Tier 3
tblConstEquipMitigation Tier No Change Tier 3
tblConstEquipMitigation Tier No Change Tier 3
tblConstEquipMitigation Tier No Change Tier 3
tblConstEquipMitigation Tier No Change Tier 3
tblConstEquipMitigation Tier No Change Tier 3
tblConstEquipMitigation Tier No Change Tier 3
tblConstEquipMitigation Tier No Change Tier 3
tblConstEquipMitigation Tier No Change Tier 3
tblConstEquipMitigation Tier No Change Tier 3
tblConstructionPhase NumDays 155,000.00 79.00
tblConstructionPhase NumDays 155,000.00 348.00
tblConstructionPhase NumDays 155,000.00 168.00
tblConstructionPhase NumDays 155,000.00 149.00
tblConstructionPhase NumDays 155,000.00 240.00
tblConstructionPhase NumDays 155,000.00 242.00
tblConstructionPhase NumDays 6,000.00 23.00
tblConstructionPhase NumDays 6,000.00 195.00
tblConstructionPhase PhaseEndDate 3/21/2017 4/29/2016
CalEEMod Version: CalEEMod.2013.2.2 Date: 2/11/2014 3:34 PMPage 3 of 60

tblConstructionPhase PhaseEndDate 8/30/2017 11/30/2016
tblConstructionPhase PhaseEndDate 7/24/2017 3/31/2016
tblConstructionPhase PhaseEndDate 12/23/2016 4/30/2016
tblConstructionPhase PhaseEndDate 9/1/2017 10/31/2016
tblConstructionPhase PhaseEndDate 10/4/2017 11/30/2016
tblConstructionPhase PhaseEndDate 12/22/2016 5/30/2016
tblConstructionPhase PhaseEndDate 3/30/2017 9/30/2016
tblConstructionPhase PhaseStartDate 12/1/2016 1/12/2016
tblConstructionPhase PhaseStartDate 4/30/2016 8/1/2015
tblConstructionPhase PhaseStartDate 12/1/2016 8/11/2015
tblConstructionPhase PhaseStartDate 5/31/2016 10/6/2015
tblConstructionPhase PhaseStartDate 10/1/2016 12/1/2015
tblConstructionPhase PhaseStartDate 11/1/2016 12/29/2015
tblConstructionPhase PhaseStartDate 4/1/2016 9/8/2015
tblConstructionPhase PhaseStartDate 5/1/2016 11/3/2015
tblGrading AcresOfGrading 1,170.00 2,793.00
tblLandUse LotAcreage 0.00 2,793.00
tblOffRoadEquipment HorsePower 226.00 200.00
tblOffRoadEquipment HorsePower 226.00 200.00
tblOffRoadEquipment HorsePower 226.00 500.00
tblOffRoadEquipment HorsePower 226.00 220.00
tblOffRoadEquipment HorsePower 84.00 5.00
tblOffRoadEquipment HorsePower 97.00 150.00
tblOffRoadEquipment HorsePower 97.00 150.00
tblOffRoadEquipment HorsePower 97.00 150.00
tblOffRoadEquipment HorsePower 62.00 110.00
tblOffRoadEquipment HorsePower 78.00 75.00
tblOffRoadEquipment HorsePower 205.00 45.00
CalEEMod Version: CalEEMod.2013.2.2 Date: 2/11/2014 3:34 PMPage 4 of 60
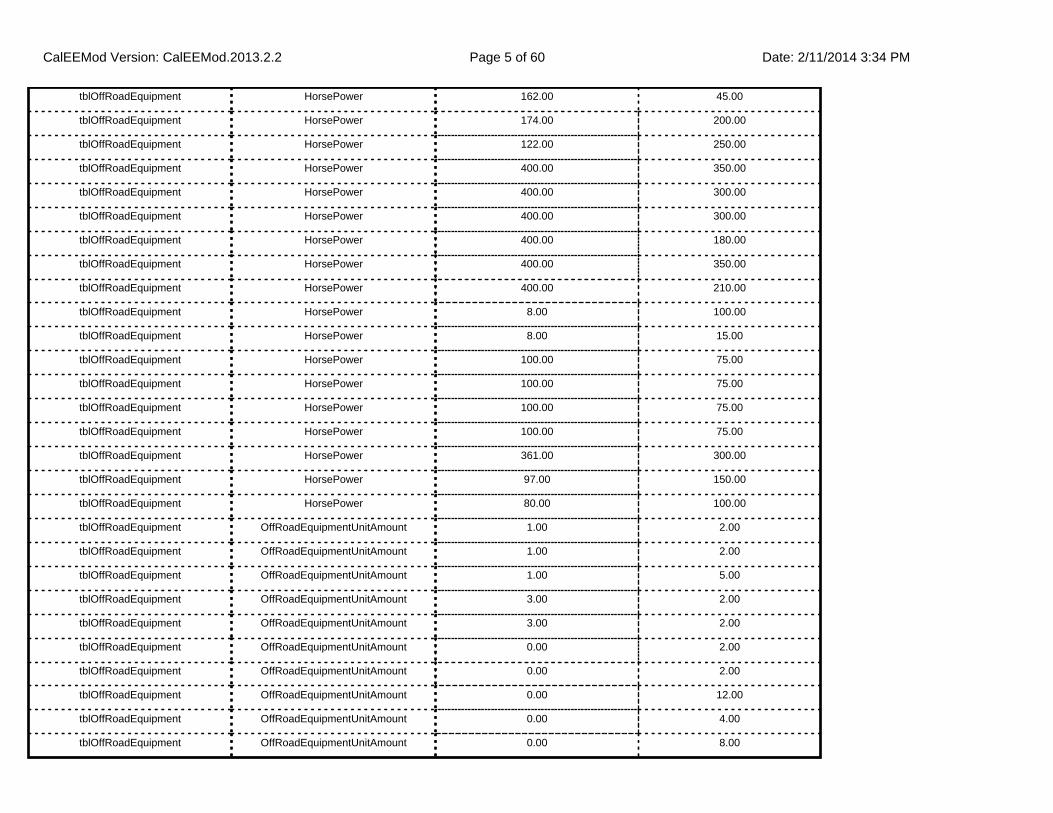
tblOffRoadEquipment HorsePower 162.00 45.00
tblOffRoadEquipment HorsePower 174.00 200.00
tblOffRoadEquipment HorsePower 122.00 250.00
tblOffRoadEquipment HorsePower 400.00 350.00
tblOffRoadEquipment HorsePower 400.00 300.00
tblOffRoadEquipment HorsePower 400.00 300.00
tblOffRoadEquipment HorsePower 400.00 180.00
tblOffRoadEquipment HorsePower 400.00 350.00
tblOffRoadEquipment HorsePower 400.00 210.00
tblOffRoadEquipment HorsePower 8.00 100.00
tblOffRoadEquipment HorsePower 8.00 15.00
tblOffRoadEquipment HorsePower 100.00 75.00
tblOffRoadEquipment HorsePower 100.00 75.00
tblOffRoadEquipment HorsePower 100.00 75.00
tblOffRoadEquipment HorsePower 100.00 75.00
tblOffRoadEquipment HorsePower 361.00 300.00
tblOffRoadEquipment HorsePower 97.00 150.00
tblOffRoadEquipment HorsePower 80.00 100.00
tblOffRoadEquipment OffRoadEquipmentUnitAmount 1.00 2.00
tblOffRoadEquipment OffRoadEquipmentUnitAmount 1.00 2.00
tblOffRoadEquipment OffRoadEquipmentUnitAmount 1.00 5.00
tblOffRoadEquipment OffRoadEquipmentUnitAmount 3.00 2.00
tblOffRoadEquipment OffRoadEquipmentUnitAmount 3.00 2.00
tblOffRoadEquipment OffRoadEquipmentUnitAmount 0.00 2.00
tblOffRoadEquipment OffRoadEquipmentUnitAmount 0.00 2.00
tblOffRoadEquipment OffRoadEquipmentUnitAmount 0.00 12.00
tblOffRoadEquipment OffRoadEquipmentUnitAmount 0.00 4.00
tblOffRoadEquipment OffRoadEquipmentUnitAmount 0.00 8.00
CalEEMod Version: CalEEMod.2013.2.2 Date: 2/11/2014 3:34 PMPage 5 of 60

tblOffRoadEquipment OffRoadEquipmentUnitAmount 0.00 6.00
tblOffRoadEquipment OffRoadEquipmentUnitAmount 0.00 8.00
tblOffRoadEquipment OffRoadEquipmentUnitAmount 0.00 5.00
tblOffRoadEquipment OffRoadEquipmentUnitAmount 0.00 1.00
tblOffRoadEquipment OffRoadEquipmentUnitAmount 0.00 1.00
tblOffRoadEquipment OffRoadEquipmentUnitAmount 0.00 2.00
tblOffRoadEquipment OffRoadEquipmentUnitAmount 0.00 6.00
tblOffRoadEquipment OffRoadEquipmentUnitAmount 0.00 7.00
tblOffRoadEquipment OffRoadEquipmentUnitAmount 0.00 2.00
tblOffRoadEquipment OffRoadEquipmentUnitAmount 0.00 8.00
tblOffRoadEquipment OffRoadEquipmentUnitAmount 0.00 3.00
tblOffRoadEquipment OffRoadEquipmentUnitAmount 0.00 15.00
tblOffRoadEquipment OffRoadEquipmentUnitAmount 0.00 4.00
tblOffRoadEquipment OffRoadEquipmentUnitAmount 0.00 4.00
tblOffRoadEquipment OffRoadEquipmentUnitAmount 0.00 2.00
tblOffRoadEquipment PhaseName Transmission Line
tblOffRoadEquipment PhaseName Miscellaneous
tblOffRoadEquipment PhaseName Post Installation
tblOffRoadEquipment PhaseName Below Grade Electrical
tblOffRoadEquipment PhaseName Site Preparation
tblOffRoadEquipment PhaseName Site Preparation
tblOffRoadEquipment PhaseName Site Preparation
tblOffRoadEquipment PhaseName Site Preparation
tblOffRoadEquipment PhaseName Miscellaneous
tblOffRoadEquipment PhaseName Miscellaneous
tblOffRoadEquipment PhaseName Transmission Line
tblOffRoadEquipment PhaseName Site Preparation
tblOffRoadEquipment PhaseName Miscellaneous
CalEEMod Version: CalEEMod.2013.2.2 Date: 2/11/2014 3:34 PMPage 6 of 60

tblOffRoadEquipment PhaseName Site Preparation
tblOffRoadEquipment PhaseName Post Installation
tblOffRoadEquipment PhaseName Above Grade Electrical
tblOffRoadEquipment PhaseName Module Installation
tblOffRoadEquipment PhaseName Site Preparation
tblOffRoadEquipment PhaseName Below Grade Electrical
tblOffRoadEquipment PhaseName Below Grade Electrical
tblOffRoadEquipment UsageHours 7.00 5.00
tblOffRoadEquipment UsageHours 7.00 5.00
tblOffRoadEquipment UsageHours 7.00 2.00
tblOffRoadEquipment UsageHours 7.00 2.00
tblOnRoadDust HaulingPercentPave 50.00 100.00
tblOnRoadDust HaulingPercentPave 50.00 100.00
tblOnRoadDust HaulingPercentPave 50.00 100.00
tblOnRoadDust HaulingPercentPave 50.00 100.00
tblOnRoadDust HaulingPercentPave 50.00 100.00
tblOnRoadDust HaulingPercentPave 50.00 100.00
tblOnRoadDust HaulingPercentPave 50.00 100.00
tblOnRoadDust HaulingPercentPave 50.00 100.00
tblOnRoadDust HaulingPercentPave 50.00 100.00
tblOnRoadDust HaulingPercentPave 50.00 100.00
tblOnRoadDust VendorPercentPave 50.00 100.00
tblOnRoadDust VendorPercentPave 50.00 100.00
tblOnRoadDust VendorPercentPave 50.00 100.00
tblOnRoadDust VendorPercentPave 50.00 100.00
tblOnRoadDust VendorPercentPave 50.00 100.00
tblOnRoadDust VendorPercentPave 50.00 100.00
tblOnRoadDust VendorPercentPave 50.00 100.00
CalEEMod Version: CalEEMod.2013.2.2 Date: 2/11/2014 3:34 PMPage 7 of 60

tblOnRoadDust VendorPercentPave 50.00 100.00
tblOnRoadDust VendorPercentPave 50.00 100.00
tblOnRoadDust VendorPercentPave 50.00 100.00
tblOnRoadDust WorkerPercentPave 50.00 100.00
tblOnRoadDust WorkerPercentPave 50.00 100.00
tblOnRoadDust WorkerPercentPave 50.00 100.00
tblOnRoadDust WorkerPercentPave 50.00 100.00
tblOnRoadDust WorkerPercentPave 50.00 100.00
tblOnRoadDust WorkerPercentPave 50.00 100.00
tblOnRoadDust WorkerPercentPave 50.00 100.00
tblOnRoadDust WorkerPercentPave 50.00 100.00
tblOnRoadDust WorkerPercentPave 50.00 100.00
tblOnRoadDust WorkerPercentPave 50.00 100.00
tblProjectCharacteristics OperationalYear 2014 2016
tblTripsAndVMT HaulingTripLength 20.00 40.00
tblTripsAndVMT HaulingTripLength 20.00 40.00
tblTripsAndVMT HaulingTripLength 20.00 40.00
tblTripsAndVMT HaulingTripLength 20.00 40.00
tblTripsAndVMT HaulingTripLength 20.00 40.00
tblTripsAndVMT HaulingTripLength 20.00 40.00
tblTripsAndVMT HaulingTripLength 20.00 40.00
tblTripsAndVMT HaulingTripLength 20.00 40.00
tblTripsAndVMT HaulingTripLength 20.00 40.00
tblTripsAndVMT HaulingTripLength 20.00 40.00
tblTripsAndVMT HaulingTripNumber 0.00 5.00
tblTripsAndVMT HaulingTripNumber 0.00 5.00
tblTripsAndVMT HaulingTripNumber 0.00 5.00
tblTripsAndVMT HaulingTripNumber 0.00 5.00
CalEEMod Version: CalEEMod.2013.2.2 Date: 2/11/2014 3:34 PMPage 8 of 60

2.0 Emissions Summary
tblTripsAndVMT HaulingTripNumber 0.00 5.00
tblTripsAndVMT HaulingTripNumber 0.00 5.00
tblTripsAndVMT HaulingTripNumber 0.00 5.00
tblTripsAndVMT HaulingTripNumber 0.00 5.00
tblTripsAndVMT HaulingTripNumber 0.00 5.00
tblTripsAndVMT HaulingTripNumber 0.00 5.00
tblTripsAndVMT WorkerTripLength 7.30 40.00
tblTripsAndVMT WorkerTripLength 7.30 40.00
tblTripsAndVMT WorkerTripLength 7.30 40.00
tblTripsAndVMT WorkerTripLength 7.30 40.00
tblTripsAndVMT WorkerTripLength 7.30 40.00
tblTripsAndVMT WorkerTripLength 7.30 40.00
tblTripsAndVMT WorkerTripLength 7.30 40.00
tblTripsAndVMT WorkerTripLength 7.30 40.00
tblTripsAndVMT WorkerTripLength 7.30 40.00
tblTripsAndVMT WorkerTripLength 7.30 40.00
tblTripsAndVMT WorkerTripNumber 13.00 5.00
tblTripsAndVMT WorkerTripNumber 0.00 58.00
tblTripsAndVMT WorkerTripNumber 108.00 58.00
tblTripsAndVMT WorkerTripNumber 0.00 58.00
tblTripsAndVMT WorkerTripNumber 0.00 58.00
tblTripsAndVMT WorkerTripNumber 50.00 58.00
tblTripsAndVMT WorkerTripNumber 0.00 58.00
tblTripsAndVMT WorkerTripNumber 25.00 58.00
tblTripsAndVMT WorkerTripNumber 0.00 58.00
tblTripsAndVMT WorkerTripNumber 0.00 58.00
CalEEMod Version: CalEEMod.2013.2.2 Date: 2/11/2014 3:34 PMPage 9 of 60
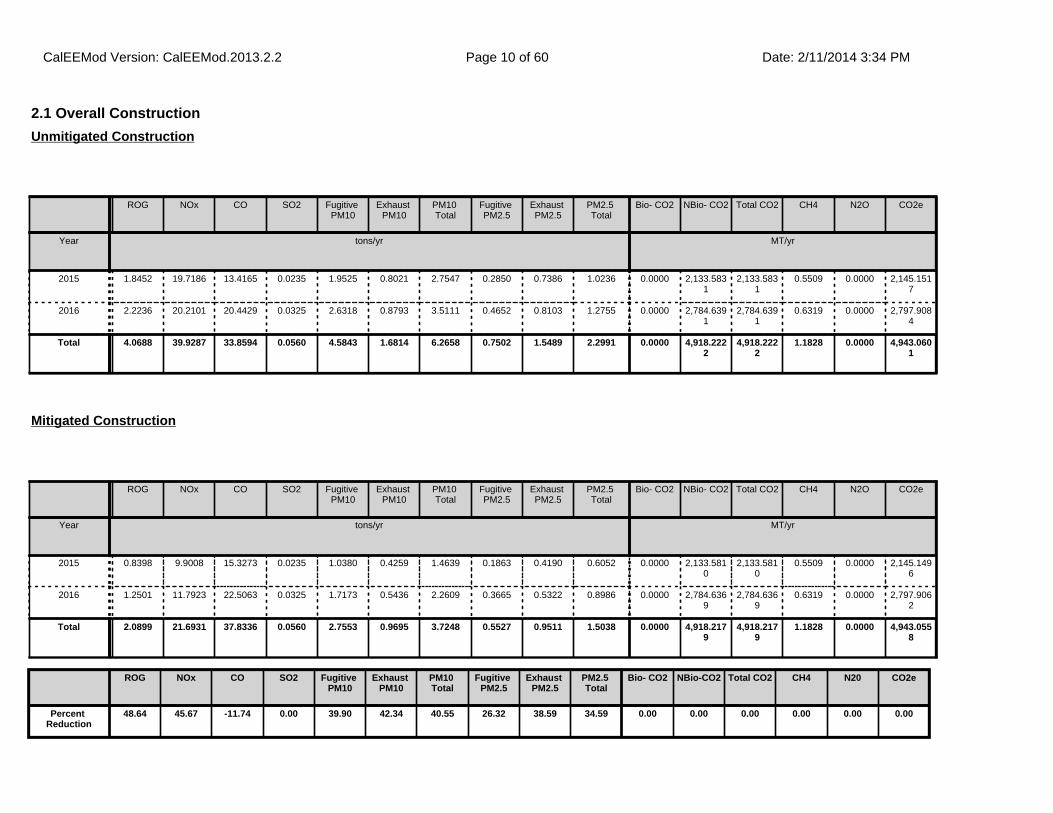
2.1 Overall Construction
ROG NOx CO SO2 Fugitive PM10
Exhaust PM10
PM10 Total
Fugitive PM2.5
Exhaust PM2.5
PM2.5 Total
Bio- CO2 NBio- CO2 Total CO2 CH4 N2O CO2e
Year tons/yr MT/yr
2015 1.8452 19.7186 13.4165 0.0235 1.9525 0.8021 2.7547 0.2850 0.7386 1.0236 0.0000 2,133.5831
2,133.5831
0.5509 0.0000 2,145.1517
2016 2.2236 20.2101 20.4429 0.0325 2.6318 0.8793 3.5111 0.4652 0.8103 1.2755 0.0000 2,784.6391
2,784.6391
0.6319 0.0000 2,797.9084
Total 4.0688 39.9287 33.8594 0.0560 4.5843 1.6814 6.2658 0.7502 1.5489 2.2991 0.0000 4,918.2222
4,918.2222
1.1828 0.0000 4,943.0601
Unmitigated Construction
ROG NOx CO SO2 Fugitive PM10
Exhaust PM10
PM10 Total
Fugitive PM2.5
Exhaust PM2.5
PM2.5 Total
Bio- CO2 NBio- CO2 Total CO2 CH4 N2O CO2e
Year tons/yr MT/yr
2015 0.8398 9.9008 15.3273 0.0235 1.0380 0.4259 1.4639 0.1863 0.4190 0.6052 0.0000 2,133.5810
2,133.5810
0.5509 0.0000 2,145.1496
2016 1.2501 11.7923 22.5063 0.0325 1.7173 0.5436 2.2609 0.3665 0.5322 0.8986 0.0000 2,784.6369
2,784.6369
0.6319 0.0000 2,797.9062
Total 2.0899 21.6931 37.8336 0.0560 2.7553 0.9695 3.7248 0.5527 0.9511 1.5038 0.0000 4,918.2179
4,918.2179
1.1828 0.0000 4,943.0558
Mitigated Construction
ROG NOx CO SO2 Fugitive PM10
Exhaust PM10
PM10 Total
Fugitive PM2.5
Exhaust PM2.5
PM2.5 Total
Bio- CO2 NBio-CO2 Total CO2 CH4 N20 CO2e
Percent Reduction
48.64 45.67 -11.74 0.00 39.90 42.34 40.55 26.32 38.59 34.59 0.00 0.00 0.00 0.00 0.00 0.00
CalEEMod Version: CalEEMod.2013.2.2 Date: 2/11/2014 3:34 PMPage 10 of 60

2.2 Overall Operational
ROG NOx CO SO2 Fugitive PM10
Exhaust PM10
PM10 Total
Fugitive PM2.5
Exhaust PM2.5
PM2.5 Total
Bio- CO2 NBio- CO2 Total CO2 CH4 N2O CO2e
Category tons/yr MT/yr
Area 2.5700e-003
2.5000e-004
0.0263 0.0000 9.0000e-005
9.0000e-005
9.0000e-005
9.0000e-005
0.0000 0.0499 0.0499 1.4000e-004
0.0000 0.0529
Energy 0.0000 0.0000 0.0000 0.0000 0.0000 0.0000 0.0000 0.0000 0.0000 0.0000 0.0000 0.0000 0.0000 0.0000
Mobile 0.0000 0.0000 0.0000 0.0000 0.0000 0.0000 0.0000 0.0000 0.0000 0.0000 0.0000 0.0000 0.0000 0.0000 0.0000 0.0000
Waste 0.0000 0.0000 0.0000 0.0000 0.0000 0.0000 0.0000 0.0000 0.0000 0.0000
Water 0.0000 0.0000 0.0000 0.0000 0.0000 0.0000 0.0000 0.0000 0.0000 0.0000
Total 2.5700e-003
2.5000e-004
0.0263 0.0000 0.0000 9.0000e-005
9.0000e-005
0.0000 9.0000e-005
9.0000e-005
0.0000 0.0499 0.0499 1.4000e-004
0.0000 0.0529
Unmitigated Operational
CalEEMod Version: CalEEMod.2013.2.2 Date: 2/11/2014 3:34 PMPage 11 of 60

2.2 Overall Operational
ROG NOx CO SO2 Fugitive PM10
Exhaust PM10
PM10 Total
Fugitive PM2.5
Exhaust PM2.5
PM2.5 Total
Bio- CO2 NBio- CO2 Total CO2 CH4 N2O CO2e
Category tons/yr MT/yr
Area 2.5700e-003
2.5000e-004
0.0263 0.0000 9.0000e-005
9.0000e-005
9.0000e-005
9.0000e-005
0.0000 0.0499 0.0499 1.4000e-004
0.0000 0.0529
Energy 0.0000 0.0000 0.0000 0.0000 0.0000 0.0000 0.0000 0.0000 0.0000 0.0000 0.0000 0.0000 0.0000 0.0000
Mobile 0.0000 0.0000 0.0000 0.0000 0.0000 0.0000 0.0000 0.0000 0.0000 0.0000 0.0000 0.0000 0.0000 0.0000 0.0000 0.0000
Waste 0.0000 0.0000 0.0000 0.0000 0.0000 0.0000 0.0000 0.0000 0.0000 0.0000
Water 0.0000 0.0000 0.0000 0.0000 0.0000 0.0000 0.0000 0.0000 0.0000 0.0000
Total 2.5700e-003
2.5000e-004
0.0263 0.0000 0.0000 9.0000e-005
9.0000e-005
0.0000 9.0000e-005
9.0000e-005
0.0000 0.0499 0.0499 1.4000e-004
0.0000 0.0529
Mitigated Operational
3.0 Construction Detail
Construction Phase
ROG NOx CO SO2 Fugitive PM10
Exhaust PM10
PM10 Total
Fugitive PM2.5
Exhaust PM2.5
PM2.5 Total
Bio- CO2 NBio-CO2 Total CO2 CH4 N20 CO2e
Percent Reduction
0.00 0.00 0.00 0.00 0.00 0.00 0.00 0.00 0.00 0.00 0.00 0.00 0.00 0.00 0.00 0.00
CalEEMod Version: CalEEMod.2013.2.2 Date: 2/11/2014 3:34 PMPage 12 of 60

Phase Number
Phase Name Phase Type Start Date End Date Num Days Week
Num Days Phase Description
1 Mobilization Site Preparation 7/1/2015 7/31/2015 5 23
2 Site Preparation Site Preparation 8/1/2015 4/29/2016 5 195
3 Miscellaneous Building Construction 8/1/2015 11/30/2016 5 348
4 Substation Building Construction 8/11/2015 3/31/2016 5 168
5 Post Installation Trenching 9/8/2015 5/30/2016 5 190
6 Transmission Line Building Construction 10/6/2015 4/30/2016 5 149
7 Below Grade Electrical Trenching 11/3/2015 9/30/2016 5 239
8 Above Grade Electrical Building Construction 12/1/2015 10/31/2016 5 240
9 Module Installation Building Construction 12/29/2015 11/30/2016 5 242
10 O&M Building Building Construction 1/12/2016 4/29/2016 5 79
OffRoad Equipment
Phase Name Offroad Equipment Type Amount Usage Hours Horse Power Load Factor
Mobilization Off-Highway Trucks 5 2.00 350 0.38
Site Preparation Graders 8 8.00 200 0.41
Site Preparation Off-Highway Tractors 6 8.00 250 0.44
Site Preparation Off-Highway Trucks 8 8.00 300 0.38
Site Preparation Off-Highway Trucks 5 4.00 300 0.38
Site Preparation Plate Compactors 6 3.00 100 0.43
Site Preparation Rough Terrain Forklifts 2 2.00 75 0.40
Site Preparation Scrapers 4 4.00 300 0.48
Residential Indoor: 0; Residential Outdoor: 0; Non-Residential Indoor: 0; Non-Residential Outdoor: 0 (Architectural Coating – sqft)
Acres of Grading (Site Preparation Phase): 2793
Acres of Grading (Grading Phase): 0
Acres of Paving: 0
CalEEMod Version: CalEEMod.2013.2.2 Date: 2/11/2014 3:34 PMPage 13 of 60

Site Preparation Tractors/Loaders/Backhoes 4 8.00 150 0.37
Miscellaneous Air Compressors 2 2.00 75 0.48
Miscellaneous Generator Sets 5 8.00 5 0.74
Miscellaneous Off-Highway Trucks 1 1.00 180 0.38
Miscellaneous Off-Highway Trucks 1 2.00 350 0.38
Miscellaneous Plate Compactors 7 1.00 15 0.43
Substation Cranes 2 5.00 200 0.29
Substation Tractors/Loaders/Backhoes 2 7.00 150 0.37
Post Installation Bore/Drill Rigs 12 8.00 45 0.50
Post Installation Rough Terrain Forklifts 8 7.00 75 0.40
Transmission Line Aerial Lifts 2 2.00 110 0.31
Transmission Line Cranes 1 2.00 500 0.29
Transmission Line Cranes 1 2.00 220 0.29
Transmission Line Off-Highway Trucks 2 2.00 210 0.38
Below Grade Electrical Excavators 4 7.00 45 0.38
Below Grade Electrical Tractors/Loaders/Backhoes 4 7.00 150 0.37
Below Grade Electrical Trenchers 2 4.00 100 0.50
Above Grade Electrical Rough Terrain Forklifts 3 2.00 75 0.40
Module Installation Rough Terrain Forklifts 15 2.00 75 0.40
O&M Building Cranes 2 5.00 200 0.29
O&M Building Tractors/Loaders/Backhoes 2 7.00 150 0.37
Trips and VMT
CalEEMod Version: CalEEMod.2013.2.2 Date: 2/11/2014 3:34 PMPage 14 of 60

3.1 Mitigation Measures Construction
Use Cleaner Engines for Construction Equipment
Use Soil Stabilizer
Replace Ground Cover
Water Exposed Area
Reduce Vehicle Speed on Unpaved Roads
Phase Name Offroad Equipment Count
Worker Trip Number
Vendor Trip Number
Hauling Trip Number
Worker Trip Length
Vendor Trip Length
Hauling Trip Length
Worker Vehicle Class
Vendor Vehicle Class
Hauling Vehicle Class
Mobilization 5 5.00 0.00 5.00 40.00 8.90 40.00 LD_Mix HDT_Mix HHDT
Site Preparation 43 58.00 0.00 5.00 40.00 8.90 40.00 LD_Mix HDT_Mix HHDT
Miscellaneous 16 58.00 0.00 5.00 40.00 8.90 40.00 LD_Mix HDT_Mix HHDT
Substation 4 58.00 0.00 5.00 40.00 8.90 40.00 LD_Mix HDT_Mix HHDT
Post Installation 20 58.00 0.00 5.00 40.00 8.90 40.00 LD_Mix HDT_Mix HHDT
Transmission Line 6 58.00 0.00 5.00 40.00 8.90 40.00 LD_Mix HDT_Mix HHDT
Below Grade Electrical
10 58.00 0.00 5.00 40.00 8.90 40.00 LD_Mix HDT_Mix HHDT
Above Grade Electrical
3 58.00 0.00 5.00 40.00 8.90 40.00 LD_Mix HDT_Mix HHDT
Module Installation 15 58.00 0.00 5.00 40.00 8.90 40.00 LD_Mix HDT_Mix HHDT
O&M Building 4 58.00 0.00 5.00 40.00 8.90 40.00 LD_Mix HDT_Mix HHDT
CalEEMod Version: CalEEMod.2013.2.2 Date: 2/11/2014 3:34 PMPage 15 of 60

3.2 Mobilization - 2015
ROG NOx CO SO2 Fugitive PM10
Exhaust PM10
PM10 Total
Fugitive PM2.5
Exhaust PM2.5
PM2.5 Total
Bio- CO2 NBio- CO2 Total CO2 CH4 N2O CO2e
Category tons/yr MT/yr
Fugitive Dust 0.0000 0.0000 0.0000 0.0000 0.0000 0.0000 0.0000 0.0000 0.0000 0.0000 0.0000 0.0000
Off-Road 0.0130 0.1527 0.0687 1.7000e-004
5.8300e-003
5.8300e-003
5.3700e-003
5.3700e-003
0.0000 15.7796 15.7796 4.7100e-003
0.0000 15.8785
Total 0.0130 0.1527 0.0687 1.7000e-004
0.0000 5.8300e-003
5.8300e-003
0.0000 5.3700e-003
5.3700e-003
0.0000 15.7796 15.7796 4.7100e-003
0.0000 15.8785
Unmitigated Construction On-Site
ROG NOx CO SO2 Fugitive PM10
Exhaust PM10
PM10 Total
Fugitive PM2.5
Exhaust PM2.5
PM2.5 Total
Bio- CO2 NBio- CO2 Total CO2 CH4 N2O CO2e
Category tons/yr MT/yr
Hauling 8.0000e-005
1.3300e-003
8.9000e-004
0.0000 9.0000e-005
3.0000e-005
1.2000e-004
2.0000e-005
3.0000e-005
5.0000e-005
0.0000 0.3158 0.3158 0.0000 0.0000 0.3159
Vendor 0.0000 0.0000 0.0000 0.0000 0.0000 0.0000 0.0000 0.0000 0.0000 0.0000 0.0000 0.0000 0.0000 0.0000 0.0000 0.0000
Worker 8.6000e-004
2.0200e-003
0.0168 2.0000e-005
1.7400e-003
1.0000e-005
1.7500e-003
4.6000e-004
1.0000e-005
4.7000e-004
0.0000 1.4425 1.4425 1.2000e-004
0.0000 1.4450
Total 9.4000e-004
3.3500e-003
0.0177 2.0000e-005
1.8300e-003
4.0000e-005
1.8700e-003
4.8000e-004
4.0000e-005
5.2000e-004
0.0000 1.7583 1.7583 1.2000e-004
0.0000 1.7609
Unmitigated Construction Off-Site
CalEEMod Version: CalEEMod.2013.2.2 Date: 2/11/2014 3:34 PMPage 16 of 60

3.2 Mobilization - 2015
ROG NOx CO SO2 Fugitive PM10
Exhaust PM10
PM10 Total
Fugitive PM2.5
Exhaust PM2.5
PM2.5 Total
Bio- CO2 NBio- CO2 Total CO2 CH4 N2O CO2e
Category tons/yr MT/yr
Fugitive Dust 0.0000 0.0000 0.0000 0.0000 0.0000 0.0000 0.0000 0.0000 0.0000 0.0000 0.0000 0.0000
Off-Road 4.0500e-003
0.0782 0.0877 1.7000e-004
2.9700e-003
2.9700e-003
2.9700e-003
2.9700e-003
0.0000 15.7796 15.7796 4.7100e-003
0.0000 15.8785
Total 4.0500e-003
0.0782 0.0877 1.7000e-004
0.0000 2.9700e-003
2.9700e-003
0.0000 2.9700e-003
2.9700e-003
0.0000 15.7796 15.7796 4.7100e-003
0.0000 15.8785
Mitigated Construction On-Site
ROG NOx CO SO2 Fugitive PM10
Exhaust PM10
PM10 Total
Fugitive PM2.5
Exhaust PM2.5
PM2.5 Total
Bio- CO2 NBio- CO2 Total CO2 CH4 N2O CO2e
Category tons/yr MT/yr
Hauling 8.0000e-005
1.3300e-003
8.9000e-004
0.0000 9.0000e-005
3.0000e-005
1.2000e-004
2.0000e-005
3.0000e-005
5.0000e-005
0.0000 0.3158 0.3158 0.0000 0.0000 0.3159
Vendor 0.0000 0.0000 0.0000 0.0000 0.0000 0.0000 0.0000 0.0000 0.0000 0.0000 0.0000 0.0000 0.0000 0.0000 0.0000 0.0000
Worker 8.6000e-004
2.0200e-003
0.0168 2.0000e-005
1.7400e-003
1.0000e-005
1.7500e-003
4.6000e-004
1.0000e-005
4.7000e-004
0.0000 1.4425 1.4425 1.2000e-004
0.0000 1.4450
Total 9.4000e-004
3.3500e-003
0.0177 2.0000e-005
1.8300e-003
4.0000e-005
1.8700e-003
4.8000e-004
4.0000e-005
5.2000e-004
0.0000 1.7583 1.7583 1.2000e-004
0.0000 1.7609
Mitigated Construction Off-Site
CalEEMod Version: CalEEMod.2013.2.2 Date: 2/11/2014 3:34 PMPage 17 of 60

3.3 Site Preparation - 2015
ROG NOx CO SO2 Fugitive PM10
Exhaust PM10
PM10 Total
Fugitive PM2.5
Exhaust PM2.5
PM2.5 Total
Bio- CO2 NBio- CO2 Total CO2 CH4 N2O CO2e
Category tons/yr MT/yr
Fugitive Dust 1.4810 0.0000 1.4810 0.1599 0.0000 0.1599 0.0000 0.0000 0.0000 0.0000 0.0000 0.0000
Off-Road 1.1716 15.1065 6.0780 0.0143 0.5660 0.5660 0.5207 0.5207 0.0000 1,361.0290
1,361.0290
0.4063 0.0000 1,369.5618
Total 1.1716 15.1065 6.0780 0.0143 1.4810 0.5660 2.0470 0.1599 0.5207 0.6806 0.0000 1,361.0290
1,361.0290
0.4063 0.0000 1,369.5618
Unmitigated Construction On-Site
ROG NOx CO SO2 Fugitive PM10
Exhaust PM10
PM10 Total
Fugitive PM2.5
Exhaust PM2.5
PM2.5 Total
Bio- CO2 NBio- CO2 Total CO2 CH4 N2O CO2e
Category tons/yr MT/yr
Hauling 4.0000e-005
7.4000e-004
5.0000e-004
0.0000 8.0000e-005
2.0000e-005
9.0000e-005
2.0000e-005
2.0000e-005
4.0000e-005
0.0000 0.1765 0.1765 0.0000 0.0000 0.1766
Vendor 0.0000 0.0000 0.0000 0.0000 0.0000 0.0000 0.0000 0.0000 0.0000 0.0000 0.0000 0.0000 0.0000 0.0000 0.0000 0.0000
Worker 0.0470 0.1109 0.9226 1.0500e-003
0.0954 6.5000e-004
0.0961 0.0253 6.0000e-004
0.0259 0.0000 79.2969 79.2969 6.7200e-003
0.0000 79.4379
Total 0.0471 0.1116 0.9231 1.0500e-003
0.0955 6.7000e-004
0.0962 0.0253 6.2000e-004
0.0259 0.0000 79.4734 79.4734 6.7200e-003
0.0000 79.6145
Unmitigated Construction Off-Site
CalEEMod Version: CalEEMod.2013.2.2 Date: 2/11/2014 3:34 PMPage 18 of 60

3.3 Site Preparation - 2015
ROG NOx CO SO2 Fugitive PM10
Exhaust PM10
PM10 Total
Fugitive PM2.5
Exhaust PM2.5
PM2.5 Total
Bio- CO2 NBio- CO2 Total CO2 CH4 N2O CO2e
Category tons/yr MT/yr
Fugitive Dust 0.5665 0.0000 0.5665 0.0612 0.0000 0.0612 0.0000 0.0000 0.0000 0.0000 0.0000 0.0000
Off-Road 0.3504 6.7809 7.8430 0.0143 0.2636 0.2636 0.2636 0.2636 0.0000 1,361.0273
1,361.0273
0.4063 0.0000 1,369.5601
Total 0.3504 6.7809 7.8430 0.0143 0.5665 0.2636 0.8301 0.0612 0.2636 0.3248 0.0000 1,361.0273
1,361.0273
0.4063 0.0000 1,369.5601
Mitigated Construction On-Site
ROG NOx CO SO2 Fugitive PM10
Exhaust PM10
PM10 Total
Fugitive PM2.5
Exhaust PM2.5
PM2.5 Total
Bio- CO2 NBio- CO2 Total CO2 CH4 N2O CO2e
Category tons/yr MT/yr
Hauling 4.0000e-005
7.4000e-004
5.0000e-004
0.0000 8.0000e-005
2.0000e-005
9.0000e-005
2.0000e-005
2.0000e-005
4.0000e-005
0.0000 0.1765 0.1765 0.0000 0.0000 0.1766
Vendor 0.0000 0.0000 0.0000 0.0000 0.0000 0.0000 0.0000 0.0000 0.0000 0.0000 0.0000 0.0000 0.0000 0.0000 0.0000 0.0000
Worker 0.0470 0.1109 0.9226 1.0500e-003
0.0954 6.5000e-004
0.0961 0.0253 6.0000e-004
0.0259 0.0000 79.2969 79.2969 6.7200e-003
0.0000 79.4379
Total 0.0471 0.1116 0.9231 1.0500e-003
0.0955 6.7000e-004
0.0962 0.0253 6.2000e-004
0.0259 0.0000 79.4734 79.4734 6.7200e-003
0.0000 79.6145
Mitigated Construction Off-Site
CalEEMod Version: CalEEMod.2013.2.2 Date: 2/11/2014 3:34 PMPage 19 of 60

3.3 Site Preparation - 2016
ROG NOx CO SO2 Fugitive PM10
Exhaust PM10
PM10 Total
Fugitive PM2.5
Exhaust PM2.5
PM2.5 Total
Bio- CO2 NBio- CO2 Total CO2 CH4 N2O CO2e
Category tons/yr MT/yr
Fugitive Dust 1.4810 0.0000 1.4810 0.1599 0.0000 0.1599 0.0000 0.0000 0.0000 0.0000 0.0000 0.0000
Off-Road 0.8644 10.9982 4.5439 0.0113 0.4062 0.4062 0.3737 0.3737 0.0000 1,062.0760
1,062.0760
0.3204 0.0000 1,068.8035
Total 0.8644 10.9982 4.5439 0.0113 1.4810 0.4062 1.8872 0.1599 0.3737 0.5336 0.0000 1,062.0760
1,062.0760
0.3204 0.0000 1,068.8035
Unmitigated Construction On-Site
ROG NOx CO SO2 Fugitive PM10
Exhaust PM10
PM10 Total
Fugitive PM2.5
Exhaust PM2.5
PM2.5 Total
Bio- CO2 NBio- CO2 Total CO2 CH4 N2O CO2e
Category tons/yr MT/yr
Hauling 3.0000e-005
5.0000e-004
3.6000e-004
0.0000 7.0000e-005
1.0000e-005
9.0000e-005
2.0000e-005
1.0000e-005
3.0000e-005
0.0000 0.1375 0.1375 0.0000 0.0000 0.1375
Vendor 0.0000 0.0000 0.0000 0.0000 0.0000 0.0000 0.0000 0.0000 0.0000 0.0000 0.0000 0.0000 0.0000 0.0000 0.0000 0.0000
Worker 0.0328 0.0789 0.6487 8.3000e-004
0.0753 4.8000e-004
0.0758 0.0200 4.4000e-004
0.0204 0.0000 60.0721 60.0721 4.8500e-003
0.0000 60.1741
Total 0.0328 0.0794 0.6491 8.3000e-004
0.0753 4.9000e-004
0.0758 0.0200 4.5000e-004
0.0204 0.0000 60.2096 60.2096 4.8500e-003
0.0000 60.3115
Unmitigated Construction Off-Site
CalEEMod Version: CalEEMod.2013.2.2 Date: 2/11/2014 3:34 PMPage 20 of 60