cjmt eis/oeis appendix g april 2015 draft air quality...
TRANSCRIPT
CJMT EIS/OEIS Appendix G
April 2015 Draft Air Quality
i
APPENDIX G
AIR QUALITY TECHNICAL MEMO
TABLE OF CONTENTS
1.0 INTRODUCTION ........................................................................................................................ 1
1.1 AIR QUALITY STANDARDS AND REGULATIONS ........................................................................... 1
1.1.1 NATIONAL AMBIENT AIR QUALITY STANDARDS .................................................................... 2
1.1.2 ATTAINMENT STATUS AND AREA CLASSIFICATION AND CLEAN AIR ACT CONFORMITY ....................................................................................................................... 10
1.1.3 STATIONARY SOURCE PERMITTING REGULATION .............................................................. 11
1.1.4 MOBILE SOURCES REGULATION .......................................................................................... 12
1.2 GREENHOUSE GAS EMISSIONS ................................................................................................ 12
1.3 VOLCANO EMISSIONS ............................................................................................................. 13
1.4 CRITERIA POLLUTANT AND GREENHOUSE GAS EMISSIONS ANALYSIS ....................................... 13
1.4.1 CONSTRUCTION EMISSIONS ................................................................................................ 14
1.4.2 OPERATIONAL EMISSIONS ................................................................................................... 21
1.5 CUMULATIVE REGIONAL EMISSIONS UNDER PREFERRED ALTERNATIVES .................................. 29
1.5.1 CRITERIA POLLUTANTS ........................................................................................................ 29
1.5.2 GREENHOUSE GASES AND GLOBAL WARMING .................................................................. 30
1.5.3 PROPOSED ACTION AND CUMULATIVE GREENHOUSE GAS IMPACTS ................................ 31
1.6 VOLCANIC IMPACTS ON OPERATION ....................................................................................... 33
1.7 REFERENCES ........................................................................................................................... 36

CJMT EIS/OEIS Appendix G
April 2015 Draft Air Quality
i i
List of Tables
1 Criteria Pollutants - Sources and Impacts ........................................................................................... 3
2 National and CNMI Ambient Air Quality Standards for Criteria Pollutants ........................................ 9
3 Construction Elements on Tinian ...................................................................................................... 15
4 Construction Elements on Pagan ...................................................................................................... 17
5 Annual Construction Emissions on Tinian ......................................................................................... 21
6 Annual Construction Emissions on Pagan ......................................................................................... 21
7 Annual Aircraft Emissions around Airports ....................................................................................... 23
8 Training Annual Emissions ................................................................................................................ 23
9 Marine Vessel Annual Emissions ....................................................................................................... 24
10 Ground Vehicle Annual Emissions .................................................................................................... 25
11 Training Support Equipment Annual Emissions ................................................................................ 25
12 Mobile and Stationary Generator Annual Emissions ........................................................................ 26
13 Solid Waste Transfer Annual Emissions ............................................................................................ 26
14 Munitions Annual Emissions ............................................................................................................. 27
15 Training Annual Emissions - Tinian Alternatives 1, 2, and 3 ............................................................. 28
16 Training Activity Annual Emissions- Pagan Alternatives 1 and 2 ...................................................... 28
17 Regional Combined Annual Emissions .............................................................................................. 29
18 Health Effects of Respiratory Exposure to Sulfur Dioxide................................................................. 33
19 Occupational Guidelines for Sulfur Dioxide ...................................................................................... 34
20 The Hawaii Volcanoes National Park and Hawaiian Volcano Observatory's Sulfur Dioxide Advisory ............................................................................................................................................. 34
List of Attachments
1 MOVES Sample Input/Output ........................................................................................................... 39
2 Construction Emissions Estimate ...................................................................................................... 51
3 Aircraft Emissions Estimate ............................................................................................................... 65
4 Vehicle and Other Mobile Source Emissions Estimate ..................................................................... 98
5 Generator Emissions ....................................................................................................................... 109
6 Solid Waste Transfer Emissions ...................................................................................................... 113
7 Annual Munitions Emissions ........................................................................................................... 115
8 Total Annual Operational Emissions ............................................................................................... 124

CJMT EIS/OEIS Appendix G
April 2015 Draft Air Quality
G-1
1.0 INTRODUCTION
This technical memo supports discussions in Sections 3.4 and 4.4, Air Quality Affected Environment and
Environmental Consequences, respectively, of the Commonwealth of the Northern Mariana Islands Joint
Military Training (CJMT) Environmental Impact Statement (EIS)/Overseas Environmental Impact
Statement (OEIS). In this technical memo, a more detailed discussion of the resource definition,
regulatory framework approach used to evaluate potential impacts, and determination of impact
significance is presented. This approach to National Environmental Policy Act (NEPA) documentation is
taken to allow the layperson to read the EIS/OEIS unencumbered by information of interest to resource
specialists and regulators; however, anyone can read this technical memo and be assured that the
resource was thoroughly examined and that a hard look was taken to identify potential impacts.
Air quality can be affected by air pollutants produced by mobile sources, such as vehicular traffic,
aircraft, or non-road equipment used for construction activities, and by operational activities, such as
training with aircraft, vessels, and vehicles, and fixed or immobile facilities, referred to as “stationary
sources.” Stationary sources can include stationary combustion sources such as a power plant.
This Appendix is organized as follows:
Introduction
Air Quality Standards and Regulations. Discusses U.S. National, and Commonwealth of the
Northern Mariana Islands (CNMI) air quality standards and regulations and their application to
the proposed action.
Air Emissions Analysis. This section contains the analyses performed for this study. It is divided
into the following sections:
o Construction Activity Emissions. Describes various construction activities associated with
different components of the proposed action and how associated air emissions were
estimated for components such as equipment, vehicles, and generators. Construction
estimates for all parts of the proposed action are referenced.
o Operational Activity Emissions. Discusses and provides references to the summary impact to
air quality resources from aircraft, vessels, live-fire, training vehicles, and Range and Training
Areas (RTAs).
1.1 AIR QUALITY STANDARDS AND REGULATIONS
Air quality can be affected by air pollutants produced by mobile sources, such as vehicular traffic,
aircraft, or non-road equipment used for construction activities, and by fixed or immobile facilities,
referred to as “stationary sources.” Stationary sources can include combustion and industrial stacks and
exhaust vents.

CJMT EIS/OEIS Appendix G
April 2015 Draft Air Quality
G-2
1.1.1 National Ambient Air Quality Standards
The U.S. Environmental Protection Agency (USEPA), under the requirements of the 1970 Clean Air Act
(CAA), as amended in 1977 and 1990 (Clean Air Act Amendments), has established National Ambient Air
Quality Standards (NAAQS) for six contaminants, referred to as criteria pollutants (40 Code of Federal
Regulations [CFR] 50). These six criteria pollutants are:
Carbon monoxide (CO)
Nitrogen dioxide (NO2)
Ozone (O3), with nitrogen oxides (NOx) and volatile organic compounds (VOCs) as precursors
Particulate matter (PM10—less than 10 microns in particle diameter; PM2.5—less than 2.5
microns in particle diameter)
Lead (Pb)
Sulfur dioxide (SO2)
Table 1 presents a description of the criteria pollutants and their effects on public health and welfare.

CJMT EIS/OEIS Appendix G
April 2015 Draft Air Quality
G-3
Table 1. Criteria Pollutants - Sources and Impacts
Pollutants and Their Sources Health and Environmental Impacts
Ozone (O3): a gas composed of three oxygen atoms. It is
not usually emitted directly into the air, but is created at
ground level by a chemical reaction between nitrogen
oxides (NOx) and volatile organic compounds (VOC) in
the presence of heat and sunlight. Ground-level O3 is
known as smog. O3 has the same chemical structure
whether it occurs miles above the earth or at ground
level and can have positive or negative effects,
depending on its location in the atmosphere. Most O3
(about 90%) occurs naturally in the stratosphere
approximately 10 to 30 miles above the earth’s surface.
It forms a layer that protects life on earth by absorbing
most of the biologically damaging ultraviolet sunlight. In
the earth’s lower atmosphere, O3 comes into direct
contact with living organisms. High levels of ground-level
O3 can cause toxic effects, detailed in the adjacent
column.
VOC + NOx + Heat + Sunlight = O3: Motor vehicle exhaust
and industrial emissions, gasoline vapors, and chemical
solvents are some of the major sources of NOx and VOC
that help to form O3. Sunlight and hot weather cause
ground-level O3 to form in harmful concentrations in the
air. As a result, it is considered an air pollutant,
particularly in summer. Many urban areas tend to have
high levels of O3, but even rural areas are also subject to
increased O3 levels because wind carries O3 and
associated pollutants hundreds of miles away from their
original sources.
Health Problems:
O3 can irritate lung airways and cause inflammation
much like sunburn. Other symptoms include wheezing,
coughing, pain when taking a deep breath, and
breathing difficulties during exercise or outdoor
activities. People with respiratory problems are most
vulnerable, but even healthy people that are active
outdoors can be affected when O3 levels are high.
Repeated exposure to O3 pollution for several months
may cause permanent lung damage. Anyone who
spends time outdoors in the summer is at risk,
particularly children and other people who are active
outdoors.
Even at very low levels, ground-level O3 triggers a
variety of health problems including aggravated asthma,
reduced lung capacity, and increased susceptibility to
respiratory illnesses like pneumonia and bronchitis.
Plant and Ecosystem Damage:
Ground-level O3 interferes with the ability of plants to
produce and store food, which makes them more
susceptible to disease, insects, and harsh weather.
O3 damages the leaves of trees and other plants,
injuring them and impacting the appearance of cities,
national parks, and recreation areas.
O3 reduces crop and forest yields and increases plant
vulnerability to disease, pests, and harsh weather.

CJMT EIS/OEIS Appendix G
April 2015 Draft Air Quality
G-4
Table 1. Criteria Pollutants - Sources and Impacts
Pollutants and Their Sources Health and Environmental Impacts
Carbon Monoxide (CO): a colorless, odorless gas that is
formed when carbon in fuel is incompletely burned. It is
a component of motor vehicle exhaust, which
contributes about 56% of all CO emissions nationwide.
Non-road engines and vehicles (such as construction
equipment and boats) contribute about 22% of all CO
emissions nationwide. Higher levels of CO generally
occur in areas with heavy traffic congestion. In cities, 85
to 95% of all CO emissions may come from motor vehicle
exhaust. Other sources of CO emissions include
industrial processes (e.g., metals processing and
chemical manufacturing), residential wood burning, and
natural sources such as forest fires. Woodstoves, gas
stoves, cigarette smoke, and unvented gas and kerosene
space heaters are sources of CO indoors. The highest
levels of CO in the outside air typically occur during the
colder months of the year when inversion conditions are
more frequent. The air pollution becomes trapped near
the ground beneath a layer of warm air.
Health Problems:
CO can cause harmful health effects by reducing oxygen
delivery to the body’s organs (e.g., heart, brain) and
tissues.
Cardiovascular Effects – The health threat from
lower levels of CO is most serious for those who
suffer from heart disease (e.g., clogged arteries,
congestive heart failure). For a person with heart
disease, a single exposure to CO at low levels may
cause chest pain and reduce their ability to exercise;
repeated exposures may contribute to other
cardiovascular effects.
Central Nervous System Effects – Even healthy
people can be affected by high levels of CO. People
who breathe high levels of CO can develop vision
problems, reduced ability to work or learn, reduced
manual dexterity, and difficulty performing complex
tasks. At extremely high levels, CO is poisonous and
can cause death.
Smog – CO contributes to the formation of smog
(ground-level O3), which can trigger serious
respiratory problems.

CJMT EIS/OEIS Appendix G
April 2015 Draft Air Quality
G-5
Table 1. Criteria Pollutants - Sources and Impacts
Pollutants and Their Sources Health and Environmental Impacts
Sulfur Dioxide (SO2): SO2 belongs to the family of sulfur
oxide gases (SOx). These gases dissolve easily in water.
Sulfur is prevalent in raw materials, including crude oil,
coal, and ore that contains common metals like
aluminum, copper, zinc, lead, and iron. SOx gases are
formed when fuel containing sulfur, such as coal and oil,
is burned, when gasoline is extracted from oil, or when
metals are extracted from ore. SO2 dissolves in water
vapor to form acid, and interacts with other gases and
particles in the air to form sulfates and other products
that can be harmful to people and their environment.
Over 65% of SO2 released to the air, or more than 13
million tons per year, comes from electric utilities,
especially those that burn coal. Other sources of SO2 are
industrial facilities that derive their products from raw
materials like metallic ore, coal, and crude oil, or that
burn coal or oil to produce process heat. Examples are
petroleum refineries, cement manufacturing, and metal
processing facilities. Also, locomotives, large ships, and
some non-road diesel equipment currently burn high
sulfur fuel and release SO2 emissions to the air in large
quantities.
SO2 causes a wide variety of health and environmental
impacts because of the way it reacts with other
substances in the air. Particularly sensitive groups
include people with asthma who are active outdoors,
and children, the elderly, and people with heart or lung
disease.
Health Problems:
Respiratory Effects from Gaseous SO2 – High levels of
SO2 in the air can cause temporary breathing
difficulty for people with asthma who are active
outdoors. Longer-term exposures to high levels of
SO2 gas and particles cause respiratory illness and
aggravate existing heart disease.
Respiratory Effects from Sulfate Particles – SO2
reacts with other chemicals in the air to form tiny
sulfate particles. When these are breathed, they
gather in the lungs and are associated with increased
respiratory symptoms and disease, difficulty in
breathing, and premature death.
Plant and Ecosystem Damage:
Acid Rain – SO2 and NOx react with other substances
in the air to form acids, which fall to earth as rain,
fog, snow, or dry particles. Some may be carried by
the wind for hundreds of miles.
Plant and Water Damage – Acid rain damages forests
and crops, changes the makeup of soil, and makes
lakes and streams acidic and unsuitable for fish and
other aquatic life. Continued exposure over a long
time changes the community of plants and animals in
an ecosystem.
Visibility Impairment:
Haze occurs when light is scattered or absorbed by
particles and gases in the air. Sulfate particles are the
major cause of reduced visibility in many parts of the
United States.
Aesthetic Damage:
SO2 accelerates the decay of building materials and
paints, including irreplaceable monuments, statues,
and sculptures that are part of our cultural heritage.

CJMT EIS/OEIS Appendix G
April 2015 Draft Air Quality
G-6
Table 1. Criteria Pollutants - Sources and Impacts
Pollutants and Their Sources Health and Environmental Impacts
Nitrogen Oxides (NOx): the generic term for a group of
highly reactive gases, all of which contain nitrogen and
oxygen in varying amounts. Many of the NOx are
colorless and odorless. However, one common
pollutant, nitrogen dioxide (NO2), along with particles in
the air can often be seen as a reddish-brown layer over
many urban areas.
NOx forms when fuel is burned at high temperatures, as
in a combustion process. The primary sources of NOx are
motor vehicles, electric utilities, and other industrial,
commercial, and residential sources that burn fuels.
NOx causes a wide variety of health and environmental
impacts because of various compounds and derivatives
in the family of NOx, including NO2, nitric acid, nitrous
oxide (N2O), nitrates, and nitric oxide.
Health Problems:
Ground-level O3 (smog) is formed when NOx and
VOCs react in the presence of heat and sunlight.
Children, people with lung diseases (e.g., asthma),
and people who work or exercise outside are
susceptible to adverse effects such as damage to lung
tissue and reduction in lung function. O3 can be
transported by wind currents and cause health
impacts far from original sources. Millions of
Americans live in areas that do not meet the health
standards for O3.
Particles – NOx reacts with ammonia, moisture, and
other compounds to form nitric acid and related
particles. Human health concerns include effects on
breathing and the respiratory system, damage to
lung tissue, and premature death. Small particles
penetrate deeply into sensitive parts of the lungs and
can cause or worsen respiratory diseases such as
emphysema and bronchitis, and aggravate existing
heart disease.
Toxic Chemicals – In the air, NOx reacts readily with
common organic chemicals and even O3, to form a
wide variety of toxic products. Examples of these
chemicals include the nitrate radical, nitroarenes,
and nitrosamines.

CJMT EIS/OEIS Appendix G
April 2015 Draft Air Quality
G-7
Table 1. Criteria Pollutants - Sources and Impacts
Pollutants and Their Sources Health and Environmental Impacts
Nitrogen Oxides (NOx) - continued Plant and Ecosystem Damage:
Acid Rain – NOx and SO2 react with other substances
in the air to form acids that fall to earth as rain, fog,
snow, or dry particles, which can be carried by wind
for hundreds of miles. Acid rain causes lakes and
streams to become acidic and unsuitable for many
fish and other aquatic life.
Water Quality Deterioration – Increased nitrogen
loading in water bodies, particularly coastal estuaries,
upsets the chemical balance of nutrients used by
aquatic plants and animals. Additional nitrogen
accelerates "eutrophication," which leads to oxygen
depletion and reduces fish and shellfish populations.
Global Warming – One of the NOx, N2O, is a
greenhouse gas. It accumulates in the atmosphere
with other greenhouse gasses causing a gradual rise
in the earth’s temperature. This leads to increased
risks to human health, a rise in sea level, and other
adverse changes to plant and animal habitat.
Visibility Impairment:
Nitrate particles and NO2 can block the transmission
of light, reducing visibility in urban areas and on a
regional scale in other areas.
Aesthetic Damage:
Acid rain damages cars, buildings, and historical
monuments.

CJMT EIS/OEIS Appendix G
April 2015 Draft Air Quality
G-8
Table 1. Criteria Pollutants - Sources and Impacts
Pollutants and Their Sources Health and Environmental Impacts
Particulates (PM10 and PM2.5): Particulate matter (PM)
is the term for particles found in the air, including dust,
dirt, soot, smoke, and liquid droplets. Particles can be
suspended in the air for long periods of time. Some
particles are large or dark enough to be seen as soot or
smoke. Others are so small that individually they can
only be detected with an electron microscope.
Some particles are directly emitted into the air. They
come from a variety of sources such as cars, trucks,
buses, factories, construction sites, tilled fields, unpaved
roads, stone crushing, and burning of wood. Other
particles may be formed in the air from the chemical
change of gases. They are indirectly formed when gases
from burning fuels react with sunlight and water vapor.
These can result from fuel combustion in motor
vehicles, at power plants, and in other industrial
processes.
Health Problems:
Many scientific studies have linked breathing PM to a
series of significant health problems, including:
Aggravated asthma. Increases in respiratory symptoms (e.g.,
coughing; difficult or painful breathing etc.). Chronic bronchitis. Decreased lung function. Premature death.
Plant and Ecosystem Damage:
PM can be carried over long distances by wind,
settling on ground or water. The effects of this
atmospheric deposition include:
Contributing to acidification of water bodies. Changing the nutrient balance in coastal waters
and large river basins. Depleting the nutrients in soil. Damaging sensitive forests and farm crops. Visibility impairment:
PM is the major cause of reduced visibility (haze) in
parts of the United States.
Aesthetic damage:
Soot, a type of PM, stains and damages stone and
other materials, including culturally important
objects such as monuments and statues.
Legend: CO = carbon monoxide; NOx – nitrogen oxides; NO2 = nitrogen dioxide; N2O = nitrous oxide; O3 = ozone; PM = particulate matter; SO2 = sulfur dioxide; SOx = sulfur oxides; VOC = volatile organic compound.
Source: USEPA 2012b.
The NAAQS are comprised of primary and secondary standards, as in Table 2. The primary standards
were established to protect human public health. Typical sensitive land uses and associated sensitive
receptors protected by the primary standards include publicly accessible areas, such as residences,
hospitals, libraries, churches, parks, playgrounds, and schools. The secondary standards were
established to protect the environment, including plants and animals, from adverse effects associated
with pollutants in the ambient air.
The CNMI Air Pollution Control Regulations require compliance with NAAQS and permitting for
stationary sources of air emissions. The CNMI Bureau of Environmental and Coastal Quality reviews air
permit applications and issues air permits for stationary sources.
CJMT EIS/OEIS Appendix G
April 2015 Draft Air Quality
G-9
Table 2. National and CNMI Ambient Air Quality Standards for Criteria Pollutants
Pollutant Primary/
Secondary Averaging
Time Level Form
Carbon Monoxide Primary 8-hour 9 ppm Not to be exceeded more than
once per year 1-hour 35 ppm
Lead primary and secondary
Rolling 3- month
average 0.15 μg/m3(1) Not to be exceeded
Nitrogen Dioxide primary 1-hour 100 ppb
98th percentile, averaged over 3 years
primary and secondary
Annual 53 ppb(2) Annual mean
Ozone primary and secondary
8-hour 0.075 ppm(3) Annual fourth-highest daily
maximum 8-hr concentration, averaged over 3 years
Particulate Matter
PM2.5
primary Annual 12 μg/m3(4) Annual mean, averaged over 3
years
secondary Annual 15 μg/m3 Annual mean, averaged over 3
years
primary and secondary
24-hour 35 μg/m3 98th percentile, averaged over 3
years
PM10 primary and secondary
24-hour 150 μg/m3 Not to be exceeded more than
once per year on average over 3 years
Sulfur Dioxide
primary 1-hour 75 ppb(5) 99th percentile of 1-hour daily
maximum concentrations, averaged over 3 years
secondary 3-hour 0.5 ppm Not to be exceeded more than
once per year Legend: ppm = parts per million; ppb = parts per billion; μg/m3=micrograms per cubic meter. Notes: 1Final rule signed October 15, 2008. The 1978 lead standard (1.5 µg/m3 as a quarterly average) remains in effect until
one year after an area is designated for the 2008 standard, except that in areas designated nonattainment for the 1978 standard, the 1978 standard remains in effect until implementation plans to attain or maintain the 2008 standard are approved.
2The official level of the annual nitrogen dioxide standard is 0.053 ppm, equal to 53 ppb, which is shown here for the purpose of a clearer comparison to the 1-hour standard.
3Final rule signed March 12, 2008. The 1997 ozone standard (0.08 ppm, annual fourth-highest daily maximum 8-hour concentration, averaged over 3 years) and related implementation rules remain in place. In 1997, the USEPA revoked the 1-hour ozone standard (0.12 ppm, not to be exceeded more than once per year) in all areas, although some areas have continued obligations under that standard (“anti-backsliding”). The 1-hour ozone standard is attained when the expected number of days per calendar year with maximum hourly average concentrations above 0.12 ppm is less than or equal to 1.
4Final rule signed January 15, 2013. The primary annual fine particle (PM2.5) standard was lowered from 15 to 12 μg/m3.
5Final rule signed June 2, 2010. The 1971 annual and 24-hour sulfur dioxide standards were revoked in that same rulemaking. However, these standards remain in effect until one year after an area is designated for the 2010 standard, except in areas designated nonattainment for the 1971 standards, where the 1971 standards remain in effect until implementation plans to attain or maintain the 2010 standard are approved.
Source: USEPA 2012c.

CJMT EIS/OEIS Appendix G
April 2015 Draft Air Quality
G-10
The air emissions that may result from the proposed action are addressed in this study for all criteria
pollutants with the exception of lead. Lead emissions have been reduced significantly over years as a
result of federal programs to control vehicle emissions by eliminating the use of lead-containing fuel.
Ozone is a regional pollutant that normally is not addressed on a project basis; however, its precursor’s
emissions (NOx and VOCs) are quantified in this study.
1.1.2 Attainment Status and Area Classification and Clean Air Act
Conformity
Areas where concentration levels are below the NAAQS for a criteria pollutant are designated as being in
“attainment.” Areas where a criteria pollutant level equals or exceeds the NAAQS are designated as
being in “nonattainment.” Based on the severity of the pollution problem, nonattainment areas are
categorized as marginal, moderate, serious, severe, or extreme. Where insufficient data exist to
determine an area’s attainment status, it is designated as either unclassifiable or in attainment.
The CAA, as amended in 1990, mandates that state agencies adopt State Implementation Plans that
target the elimination or reduction of the severity and number of violations of the NAAQS in a
nonattainment area. State Implementation Plans set forth policies to expeditiously achieve and maintain
attainment of the NAAQS. For those nonattainment areas that are redesignated attainment, the state is
required to develop a 10-year maintenance plan to ensure that the areas remain in attainment status
for the same pollutant.
The CAA, as amended in 1990, also expands the scope and content of the act's conformity provisions in
terms of their relationship to the State Implementation Plan. Under Section 176(c) of the CAA, a project
is in “conformity” if it corresponds to State Implementation Plans’ purpose of eliminating or reducing
the severity and number of violations of the NAAQS and achieving their expeditious attainment.
Conformity further requires that such activities would not:
Cause or contribute to any new violations of any standards in any area
Increase the frequency or severity of any existing violation of any standards in any area
Delay timely attainment of any standard or any required interim emission reductions or other
milestones in any area
The USEPA published final rules on general conformity (40 CFR Parts 51 and 93) in the Federal Register
on November 30, 1993 and subsequently revised the rules on March 24, 2010. The rules apply to federal
actions in nonattainment or maintenance areas for any of the applicable criteria pollutants. The rules
specify de minimis emission levels by pollutant to determine the applicability of conformity
requirements for a project. A conformity applicability analysis is the first step of a conformity evaluation
and assesses if a federal action must be supported by a conformity determination. However, the rules
do not apply in unclassifiable/attainment areas for the NAAQS.

CJMT EIS/OEIS Appendix G
April 2015 Draft Air Quality
G-11
Both Tinian and Pagan are unclassifiable and are considered in attainment for all criteria pollutants;
therefore, the rules do not apply to the proposed action and a general conformity applicability analysis
is not required.
1.1.3 Stationary Source Permitting Regulation
Stationary sources of air emissions include combustion turbines, boilers, generators, and fuel tanks. The
1990 amendments to the CAA set permit rules and emission standards for pollution sources of certain
sizes. An air permit application is submitted by the prospective owner or operator of an emitting source
in order to obtain approval of the source construction permit. A construction permit generally specifies
a time period within which the source must be constructed. Permits are reviewed for any modifications
to the site or the air emissions sources to determine permit applicability.
The USEPA oversees the programs that grant stationary source operating permits (Title V of the CAA)
and new or modified major stationary source construction and operation permits. The New Source
Review program requires new major stationary sources or major modifications of existing major
stationary sources of pollutants to obtain permits before initiating construction. The New Source
Performance Standards apply to sources emitting criteria pollutants, while the National Emission
Standards for hazardous air pollutants apply to sources emitting hazardous air pollutants.
Hazardous air pollutants, also known as toxic air pollutants, are chemicals that can cause adverse effects
to human health or the environment. The 1990 amendments to the CAA directed the USEPA to set
standards for all major sources of air toxics. Thus, the USEPA established a list of 188 hazardous air
pollutants. This list includes substances that cause cancer, neurological, respiratory, and reproductive
effects.
The Title V major source thresholds for pollutant emissions that are applicable to Tinian and Pagan are:
100 tons per year for any criteria pollutant
25 tons per year total hazardous air pollutants
10 tons per year for any one hazardous air pollutant
The USEPA also established Prevention of Significant Deterioration (PSD) regulations to ensure that air
quality in attainment or unclassified areas does not significantly deteriorate as a result of construction
and operation of major stationary sources. A PSD increment is the maximum allowable increase in
concentration of a pollutant that is allowed to occur above a baseline concentration. A typical major PSD
source is classified as any source of air pollutant emissions with the potential to emit 250 tons per year
of any regulated pollutant in an attainment area. However, for several types of major source operations,
including fossil fuel-fired steam electric plants of more than 250 million British Thermal Units per hour
heat input, 100 tons per year is the major PSD threshold.
Because the proposed activities would not affect the permitted operational capacity of existing power
facilities on Tinian and would not involve installation of any permanent stationary sources on Pagan, no
adverse air quality impacts from stationary sources (i.e., new or modified fixed or immobile facilities)
would occur. Therefore, an impact analysis for stationary sources is not warranted. However, several
backup emergency diesel generators that are exempt from above permitting regulations would be
installed on Tinian and the potential operating emissions from these generators were quantified.

CJMT EIS/OEIS Appendix G
April 2015 Draft Air Quality
G-12
1.1.4 Mobile Sources Regulation
Mobile sources would result from the following operational components of the proposed action:
Aircraft around airport
Aircraft around training ranges
Marine vessels along shoreline
Ground vehicles within and around training ranges
Supporting equipment emissions within the base camp and training ranges
Weapons firing within training ranges
Construction equipment and vehicles within project areas
The emissions from these mobile sources are regulated under Title II of the CAA, which establishes
emission standards that manufacturers must achieve. Therefore, unlike stationary sources, no
permitting requirements exist for operating mobile sources.
1.2 GREENHOUSE GAS EMISSIONS
Greenhouse gases are gas emissions that trap heat in the atmosphere. These emissions occur from
natural processes and human activities. The primary long-lived greenhouse gases directly emitted by
human activities are carbon dioxide (CO2), methane (CH4), nitrous oxide (N2O), hydrofluorocarbons
(HFCs), perfluorocarbons (PFCs), and sulfur hexafluoride (SF6).
Scientific evidence indicates a trend of increasing global temperature over the past century due to an
increase in greenhouse gas emissions from human activities. The heating effect from these gases is
considered the probable cause of the global warming observed over the last 50 years (Endangerment
and Cause or Contribute Findings for Greenhouse Gases under Section 202(a) of the CAA; Final Rule
2009). The climate change associated with this global warming is predicted to produce negative
economic and social consequences across the globe. Under Section 202(a) of the CAA, the USEPA
Administrator has recognized potential risks to public health or welfare and signed an endangerment
finding regarding greenhouse gases (USEPA 2009a). This finding indicates that the current and projected
concentrations of greenhouse gases in the atmosphere threaten the public health and welfare of
current and future generations.
To estimate global warming potential (GWP), all potential greenhouse gas contributions are expressed
relative to a reference gas, CO2, which is assigned a GWP equal to one. All six greenhouse gases are
multiplied by their GWP and the results are added to calculate the total equivalent emissions of carbon
dioxide (CO2e). However, the dominant greenhouse gas emitted is CO2, mostly from fossil fuel
combustion. This EIS/OEIS considers CO2 as the representative greenhouse gas emission.
On a national scale, federal agencies are addressing emissions of greenhouse gases by reductions
mandated in federal laws and Executive Orders. Most recently, Executive Order 13423, Strengthening
Federal Environmental, Energy, and Transportation Management, and Executive Order 13514, Federal
Leadership in Environmental, Energy, and Economic Performance, were enacted to address greenhouse

CJMT EIS/OEIS Appendix G
April 2015 Draft Air Quality
G-13
gases, including greenhouse gas emissions inventory, reduction, and reporting. The Department of the
Navy has implemented a number of renewable energy projects in an effort to reduce energy
consumption, reduce greenhouse gases, reduce dependence on petroleum, and increase the use of
renewable resources in accordance with the goals set by Executive Order 13123 (subsequently replaced
by Executive Order 13423) and the Energy Policy Act of 2005.
This CJMT EIS/OEIS follows the Draft NEPA Guidance on Consideration of the Effects of Climate Change
and Greenhouse Gas Emissions issued by the Council on Environmental Quality (CEQ) (2010). Although
greenhouse gas emissions occur locally, the potential effects of greenhouse gas emissions are by nature
global in scale, and accumulate geographically and over time. As individual sources of greenhouse gas
emissions are not large enough to have an effect on global climate change, this CJMT EIS/OEIS predicts
CO2 levels as appropriate for disclosure purposes.
1.3 VOLCANO EMISSIONS
The composition of volcanic gases erupted at a volcano vent is, in general, controlled by the equilibrium
between a hydrous fluid at the top and the silicate melt in the magma chamber below. It varies widely
between volcanoes depending on the magma type, and is also dependent on the individual volcano’s
state of activity.
Sulfur dioxide is one of the most common gases released in volcanic eruptions (following water and CO2
with 2 to 35% by volume of volcanic gas emissions) and is of concern on the global scale due to its
potential to influence climate. Sulfur dioxide is a colorless gas with a characteristic and irritating smell.
This odor is perceptible at different levels, depending on the individual's sensitivity, but is generally
perceived between 0.3 to 1.4 parts per million and is easily noticeable at 3.0 parts per million. On
contact with moist membranes, SO2 forms sulfuric acid, which is responsible for its severe irritant effects
on the eyes, mucous membranes, and skin. On the local scale, SO2 is a hazard to humans in its gaseous
form, and also because it oxidizes to form sulfate aerosol.
Typically, the concentration of SO2 in dilute volcanic plumes is less than 10 parts per million at 6.6 miles
(10 kilometers) downwind of the source. Assuming that the gas has a half-life of 6 to 24 hours, only
about 5% of the emitted gas is present in the lower atmosphere after 1 to 4 days.
1.4 CRITERIA POLLUTANT AND GREENHOUSE GAS EMISSIONS
ANALYSIS
The air emissions analysis was performed for both construction and operational phases under each
alternative. All reasonably foreseeable emissions (both direct and indirect) associated with the
implementation of the proposed action were quantified and compared to the 250 tons per year
threshold on an annual basis to determine potential air quality impacts. If the total emissions exceed
this threshold, a further evaluation of the emissions resulting from each activity element was conducted
to assess the emissions impact on sensitive land uses on a local basis to determine the potential
significance of the air quality impacts.

CJMT EIS/OEIS Appendix G
April 2015 Draft Air Quality
G-14
1.4.1 Construction Emissions
Increased direct and indirect criteria pollutants and greenhouse gas emissions would result from the
following potential construction activities:
Use of diesel and gas-powered demolition and construction equipment
Movement of trucks containing construction and removal materials
Commuting of construction workers
1.4.1.1 Construction Activity Forecasts
On Tinian, the proposed work includes the construction of various training ranges and support facilities
throughout the islands of Tinian and Pagan, within the CNMI. Table 3 and Table 4. Construction
Elements on Pagan summarize the construction elements at Tinian and Pagan, followed by a description
of prototype elements (whose use is described in the tables and detailed in the following sections).
The equipment, material, and manpower requirements for the construction associated with the CJMT
facilities on Tinian and Pagan were estimated to calculate construction-related emissions. Estimates of
construction crew and equipment requirements and productivity are based on data presented in:
2003 RSMeans Facilities Construction Cost Data (RSMeans 2002)
2011 RSMeans Facilities Construction Cost Data (RSMeans 2010)
The assumptions and calculations presented below are based on information provided in the EIS/OEIS
that provides planning-level descriptions of the proposed action associated construction/earth
disturbance layouts under each alternative. The construction duration is anticipated to be 8 to 10 years.
Many of the training elements identified above are similar in terms of primary construction elements. To
that end, several prototype elements are used to extrapolate to the overall construction effort.

CJMT EIS/OEIS Appendix G
April 2015 Draft Air Quality
G-15
Table 3. Construction Elements on Tinian
Tinian Elements Common Elements Alternative-Specific Options
1 Base Camp
1,500 trainees in 15 open-bay barrack buildings (est. at 112,500 SF), and various other buildings (HQ, dining, medical aid, security & fire protection, utilities, fuel storage, etc. – estimated at total of 195,000 SF) plus 20 ac. of vehicular pavement. Total area of disturbance is 253 ac.
2 Munitions Storage
Permanent munitions storage area; 8 acres is new impervious surface. Assume building space totals 140,000 SF and the remaining impervious surface is vehicular pavement (4.5 ac).
3 Airport Improvements 41 acres of new impervious space created; approximately 30 acres is aircraft pavement and remainder vehicular pavement.
4 Port of Tinian Improvements
5 acres of new impervious surface. Assume 1 acre is for a new building and the remainder is vehicular pavement. Assume remaining two acres is general stormwater pond (2 ac., general clearing & grading)
5 Bulk Fuel Storage
Assume 25,000 SF of vehicular pavement to create base for the storage tanks, but that tanks themselves are prefab and installation effort is incidental.
6 Access Road Improvements
133 ac. total of ground disturbance, of which 83 ac. is new impervious surface. Assume remaining 50 ac. represents replacement pavement, so 133 ac. of vehicular pavement to be installed.
7 Utilities
Utilities would be installed in a number of different configurations, including underground along roadways and above ground. Assume a utility prototype for complete underground installation of water, sewer, electric, etc. utilities along roadways is a conservative overestimate, and that approximate 30 miles of utility are to be constructed. For solid waste transfer building, add a 20,000 SF new building.

CJMT EIS/OEIS Appendix G
April 2015 Draft Air Quality
G-16
Table 3. Construction Elements on Tinian
Tinian Elements Common Elements Alternative-Specific Options
8 Range Complex A Includes 527 acres, which would require clearing for target placement, requiring general clearing.
9 Range Complex B Includes 47 acres, which would require clearing for target placement, requiring general clearing.
10 Range Complex C
Includes 80 acres, which would require clearing for target placement, requiring general clearing. In addition, 20 open-roof target structures would be constructed. For estimate purposes, it is assumed that these have a total footprint of 40,000 SF.
11 Range Complex D For alternatives 1 and 2, 486 ac. would be cleared. For alternative 3, 453 ac. would be cleared.
12 Field Artillery Indirect Range
85 acres to be cleared for firing points.
13 Convoy Course For alternative 1, 97 acres of ground disturbance. For alternatives 2 and 3, 143 acres.
14 Tracked Vehicle Drivers’ Course
100 acres to be cleared for driving courses.
15 Tactical Amphibious Beach Landing
22,600 cu. meters of dredging, and require installation of an estimated 520 piles, 1,300 LF of sheeting to 40-ft depth and temporary trestles.
16 Observation Posts
Assume eight 2,000 SF pre-engineered structures to be built (so 16,000 SF total) as equivalent measure to the elevated unprotected structures, and that 0.5 acres would require clearing.
17 Surface Radar Sites
Assume six 4,000 SF pre-engineered structures to be built (so 24,000 SF total) as equivalent measure to the radar stations, and that 1 acre would require clearing.
18 International Broadcasting Bureau
For alternative 1, no change. For alternatives 2 and 3, assume a new 20,000 SF structure.

CJMT EIS/OEIS Appendix G
April 2015 Draft Air Quality
G-17
Table 4. Construction Elements on Pagan
Pagan Elements Common Elements Alternative-Specific Options
1 Base Camp
Bivouac area for 2,000, with surge capacity of 4,000; no permanent facilities, only prepared ground for camping. Total area is 42 acres.
2 Expeditionary Airfield Approximately 41 acres of ground disturbance; assumed this is entirely new aircraft pavement.
3 Munitions Storage
Assumes a 10-acre pad (vehicular pavement, grading and clearing) and an additional 9 acres of clearing to create access, but no new roads to be constructed.
4 Training Trails 39 acres would be cleared and graded.
5 North Range Complex A total of 319 acres would be cleared.
6 South Range Complex For alternative 1, 167 acres would be cleared.
1.4.1.1.1 General Range Clearing and Grading
On a per acre basis, for basic removal and grading:
Clear and grub, cut and chip light trees to 6 inches (15 centimeters)
Grade subgrade for base course, roadways, and finish grade slopes over 1 acre (0.40 hectare)
1.4.1.1.2 Open-Roof Training Structures
Assume each structure occupies a 1,000-square foot footprint (40 feet x 25 feet). Buildings are assumed
to not have any utility services.
Foundation, assumes a mat foundation, 40-feet x 25-feet (12 meters x 7.6 meters)
Finishing grade slopes, gentle 1,000 square feet (93 square meters)
Footprint site preparation, gravel placed over entire building footprint, 12-inch thick lift x 111
square feet = 1,000 cubic feet (28 cubic meters)
Concrete slab, 130 linear feet (40 meters), 24 inches (0.6 meter) high
Rebar, 8 linear feet per square-foot of slab = 21.36 pounds/square foot; total = 11 tons
Concrete, 15-inch thick slab. 1,000 square feet x 15 inches = 1,250 cubic feet (35 cubic meters)
Enclosure, precast concrete panels (8-foot high x 16 feet x 4 feet), total perimeter per structure
is 130 linear feet (40 meters), wall area of 1,040 square feet (93 square meters)

CJMT EIS/OEIS Appendix G
April 2015 Draft Air Quality
G-18
1.4.1.1.3 Base Camp
1.4.1.1.3.1 Tinian
For permanent base camp installations, it is assumed that the general construction prototypes
developed above or for similar purposes on Guam represent an equivalent or conservative measure. On
Tinian, a basic “austere” camp is to be provided, while at Pagan an expeditionary bivouac area is to be
provided.
The base camp at Tinian is designed to support up to 1,500 trainees in 15 permanent, open-bay
barracks. Tent pads and a temporary mess hall would also be constructed to support an additional 1,500
surge trainees, providing a total capacity of to accommodate 3,000 personnel at the base camp.
It is assumed that a 200-square feet per trainee space allowance is required in the camp
accommodations (i.e., approximately 600,000 square feet or 14 acres [5.7 hectares]).
For other base camp installations on Tinian (ammunition storage, range control), it is assumed that the
industrial and commercial building prototypes employed in the Guam and the CNMI Military Relocation
EIS are comparable. Sizes are not specified, but based on a maximum mobilization of 3,000 personnel
and an assumption that 10% of this number act in a command or logistics capacity, it is assumed that
the range control complex must accommodate 300 people in a commercial-type building, with a space
requirement of 200 square feet (19 square meters) per command personnel (60,000 square feet [5,575
square meters] total); similarly, assuming a 20 square feet (19 square meters) per trainee requirement
for ammunition storage, a 60,000-square feet (5,575 square meters) industrial building is required.
1.4.1.1.3.2 Pagan
On Pagan, an expeditionary base camp/bivouac area would be provided with space for up to 2,200
personnel, with additional surge capacity to accommodate up to 4,000 personnel. There would be no
permanent buildings; only minimal facilities (e.g., established tent pads). A bivouac area would consist of
crushed and compacted lava rock. This is assumed to be entirely in a camp (bivouac) setting, with an
allowance of 200 square feet (19 square meters) per person (200,000 square feet or 1,860 square
meters total), using general site clearing prototype, above, for 5 acres (2 hectares).
A munitions storage area would be established north of the airfield. It would consist of: (1) security
fencing; (2) open magazines; (3) a munitions assembly pad; (4) a munitions storage area; (5) a
load/unload dock (pad); and (6) a biosecurity pad. Exact size is not specified in Chapter 2, but it is
assumed that 2,000 square feet (185 square meters) would be sufficient.
1.4.1.1.4 Airfield Improvements
Airfield improvements at Tinian consist primarily of providing new paved areas for taxiways, cargo pads,
parking, etc. While some other incidental structures are to be constructed, it is assumed that in general
new pavement with a 21-inch (53-centimeter) typical cross-section is used. The prototype, per acre, is
defined as follows:
Grading – Grade subgrade for base course, roadways and finishing grade slopes, gentle, 4,840
square yards (1 acre) each.

CJMT EIS/OEIS Appendix G
April 2015 Draft Air Quality
G-19
Base Courses – 8-inch (20-centimeter) deep and 6-inch (15-centimeter) deep, 4,840 square
yards (1 acre) each.
Pavement – Asphaltic concrete, 4-inch (10-centimeter) thick binder course and asphaltic
concrete, 3-inch (7.5-centimeter) thick wearing course, 4,840 square yards (1 acre) each.
For Tinian, an aerial extent of 5 acres (2 hectares) substantively represents the extent of airfield
construction. The areal extent of airfield improvements at Pagan is not specified; however, 10
acres (4 hectares) is assumed.
1.4.1.1.5 Roadway Construction
Roadway construction requirements were not quantified but were estimated from the EIS/OEIS figures
based on approximate measuring of roadway lengths. The per-acre prototype for roadway pavement is
as follows:
Grading – grade subgrade for base course, roadways and finishing grade slopes, gentle, 4,840
square yards (1 acre).
Base Course – 8-inch (20-centimeter) deep, square yards (1 acre).
Pavement – Asphaltic concrete, 4-inch (10-centimeter) thick binder course and 1.5-inch (4-
centimeter) thick wearing course, 4,840 square yards (1 acre).
It is assumed that all roadways are 25-feet (7.6-meters) wide. Based on scaling from EIS/OEIS figures, it
is estimated that approximately 20 miles (61 acres) of roadways are required on Tinian. Also required is
a 5-mile (16-acre) stretch of roadway on Tinian for convoy course live-fire training exercises.
On Pagan, roadway improvements consist of gravel roadways without pavement. The extent of new
roadways is estimated at approximately 22 miles (35 kilometers). All roads are assumed to be 16-feet (5-
meters) wide.
Grading –Grade subgrade for base course, roadways and finishing grade slopes, gentle 4,840
square yards (1 acre).
Base Course – 8-inch (20-centimeter) deep, 4,840 square yards (1 acre).
1.4.1.2 Construction Emissions Forecasts
Estimates of the emissions from construction equipment were developed based on the estimated hours
of equipment use and the emission factors for each type of equipment. Given the lack of specific
construction schedule for individual projects as summarized in Table 5, the total construction emissions
were evenly distributed in each construction year. Emission factors were taken from USEPA’s NONROAD
emission factor model (USEPA 2009b) for Tier 2 engines associated with the national default model
database for non-road engines. The quantity and type of equipment necessary were determined based
on the activities necessary to implement the proposed action as described above. All equipment was
assumed to be diesel-powered unless otherwise noted. Pieces of equipment to be used include, but are
not limited to:

CJMT EIS/OEIS Appendix G
April 2015 Draft Air Quality
G-20
Backhoes
Compressors
Cranes
Dozer
Dredges
Excavators
Front end loaders
Gas engine vibrators
Grader
Concrete pumps
Hammers
Construction trucks
The USEPA recommends the following formula to calculate hourly emissions from non-road engine
sources including cranes, front end loaders, and other machines:
Mi = N x HP x LF x EFi where:
Mi = mass of emissions of ith pollutants during inventory period;
N = source population (units);
HP = average rated horsepower;
LF = typical load factor; and
EFi = average emissions of ith pollutant per unit of use (e.g., grams per horsepower-hour).
Truck and commuting vehicle operations would result in indirect emissions. It is assumed each truck or
commuting vehicle trip would take a 20-mile (32-kilometer) round trip to and from the project area.
USEPA's Motor Vehicle Emission Simulator (MOVES) program was used to predict truck and commuter
vehicle running emission factors for all criteria pollutants and CO2 (USEPA 2012a). The national default
input parameters available for Virgin Islands were used in emissions factor modeling per USEPA
recommendation. Samples of MOVES input and output printout are shown in Attachment 1. Detail
construction emissions estimate worksheets are included in Attachment 2.
1.4.1.2.1 Construction Emissions on Tinian
The total predicted annual air emissions resulting from potential construction activities on Tinian under
Alternatives 1 through 3 are evenly divided over the likely nine years as summarized in Table 5. The
annual emissions are well below the 250 tons (227 metric tons) per year threshold; therefore,
construction under each Tinian alternative would result in less than significant impacts to air quality.

CJMT EIS/OEIS Appendix G
April 2015 Draft Air Quality
G-21
Table 5. Annual Construction Emissions on Tinian Construction
Year
Pollutant (tons per year)
SO2 CO PM10 PM2.5 NOx VOC CO2
1-9
Alternative 1
0.19 9.25 0.69 0.65 8.09 1.71 1207.57
Alternative 2
0.19 9.49 0.70 0.66 8.20 1.75 1223.55
Alternative 3
0.19 9.30 0.69 0.65 8.12 1.72 1210.85 Legend: CO = carbon monoxide; CO2 = carbon dioxide; NOx = nitrogen oxides; PM10 = particulate matter with an aerodynamic
diameter of less than or equal to a nominal 10 micrometers; PM2.5 = particulate matter with an aerodynamic diameter of less than or equal to a nominal 2.5 micrometers; SO2 = sulfur dioxide; VOC = volatile organic compound.
Note: 250 tons per year comparative impact threshold does not apply to CO2.
1.4.1.2.2 Construction Emissions on Pagan
The total annual emissions on Pagan under Alternatives 1 and 2 are evenly but conservatively divided
over the first four years assuming construction activities on Pagan would be front loaded as summarized
in Table 6. Total emissions are well below the 250 tons (227 metric tons) per year threshold; therefore,
construction activities under Pagan Alternatives 1 and 2 would result in less than significant impacts to
air quality.
Table 6. Annual Construction Emissions on Pagan
Construction Year
Pollutant (tons per year)
SO2 CO PM10 PM2.5 NOx VOC CO2
1-4
Alternative 1
0.07 5.76 0.33 0.31 3.00 1.14 369.53
Alternative 2
0.05 4.21 0.24 0.23 2.22 0.84 273.91 Note: 250 tons per year comparative impact threshold does not apply to CO2.
1.4.2 Operational Emissions
The equipment horsepower values were provided by the training personnel and equipment power load
factors were obtained in association with the NONROAD emission factors.
1.4.2.1 Aircraft Airport Emissions
Operational category emissions would remain the same for each alternative. Although the alternatives
are located in different areas, the number of operations would remain the same based on training
requirements. The detail-calculated aircraft emissions at the airports are shown in Attachment 3 of this
report.
Aircraft and helicopter engines emit criteria pollutants during all phases of operation whether climb out,
approach, touch and go, Ground Control Approach Box, or cruise. Aircraft emissions were estimated
based on the number of additional flight operations at Tinian on an annual basis as described in the
noise section of the Supplemental EIS and the aircraft emissions factors provided primarily by the Navy
Aircraft Environmental Support Office (AESO) (AESO 1999-2002).

CJMT EIS/OEIS Appendix G
April 2015 Draft Air Quality
G-22
Under the Tinian action alternatives, the estimated aircraft trip numbers associated with the notional
airlift requirements are considered. The rotary-wing sorties would be between Andersen Air Force Base
North Field on Guam and Tinian International Airport (West Field). A biosecurity quarantine protocol
would be developed for other tactical and training requirements.
Marine Corps rotary-wing (CH-53), tilt-rotor aircraft (MV-22), and fixed-wing aircraft (C-130) are planned
to provide personnel and equipment lift to Tinian. These aircraft may use either Tinian International
Airport (also termed West Field) or North Field. Other modes of aviation movement include Air Force C-
17 and/or C-130 aircraft.
Under the Pagan action alternatives, the estimated aircraft trip numbers associated with the airlift
requirements are used for emissions estimate. The rotary-wing sorties would be between Andersen Air
Force Base North Field on Guam, Tinian International Airport (West Field), and Pagan. Rotary- and fixed-
wing aircraft would provide personnel and equipment lift to Pagan. In-flight or ground refueling would
be required for organic rotary-wing (CH-53) and tilt-rotor aircraft (MV-22) transiting between Pagan and
Guam. Marine fixed-wing aircraft (C-130) may also provide personnel and equipment lift to Pagan.
Air pollutants would be emitted during all phases of these operations, including on-ground parking and
engine idling, maintenance testing, and flight. Future annual emissions of criteria pollutants were
estimated using:
Procedures for Emission Inventory Preparation, Volume IV: Mobile Sources (USEPA 1992)
Navy aircraft engine emission factors developed by the Navy’s Aircraft Environmental Support
Office (AESO 1999-2002)
Joint Strike Fighter (JSF) emission factor worksheets (Joint Strike Fighter Work Force 2009)
Air Emissions Guide for Air Force Mobile Sources (Air Force Civil Engineer Center 2013) and
Federal Aviation Administration Emissions and Dispersion Modeling System (Version 5.0.1) for
other non-naval aircraft emissions factors (Federal Aviation Administration 2014)
The airfield operations types for the no-action and proposed action scenarios include departures,
straight-in (non-break) arrivals, overhead break arrivals, touch-and-go patterns, and ground controlled
approach patterns.
Procedures to calculate emissions for each aircraft type typically include the following steps:
Obtain emission factors for each aircraft engine type
Consider the range of operation types for each aircraft
Apply the applicable aircraft operating mode associated with annual flight operations
Calculate the emission rates for each aircrafts’ type and operating mode by multiplying the
respective emissions rates by annual flight operation numbers
Determine the total annual emissions by combining the emissions from all operations for all
aircraft types
Although air pollutant emissions occur during all phases of aircraft operation (parking, idling, and in-
flight), only those emissions emitted in the lower atmosphere’s mixing layer have the potential to result

CJMT EIS/OEIS Appendix G
April 2015 Draft Air Quality
G-23
in ground-level ambient air quality impacts. The mixing layer is the air layer extending from ground level
up to the point at which the vertical mixing of pollutants decreases significantly. The USEPA
recommends that a default mixing layer of 3,000 feet (914 meters) be used in aircraft emission
calculations (USEPA 1992). Consistent with this recommendation, aircraft emissions released above
3,000 feet (914 meters) were not included in this study. Emissions results for aircraft operations at the
airport/airfield are summarized in Table 7 and detailed in Attachment 3.
Table 7. Annual Aircraft Emissions around Airports Pollutant (tons per year)
SO2 CO PM10 PM2.5 NOx VOC CO2
Aircraft Sorties around Tinian International Airport
8.12 256.27 42.69 42.69 89.02 75.18 25048.85
Aircraft Sorties around Pagan Airport
2.98 74.22 17.16 17.16 42.66 29.71 7607.25
1.4.2.2 Aircraft Emissions during Training Exercise
Annual training flight missions and flight hours within 3,000 feet (914 meters) above ground defined in
both Tinian and Pagan were based on information described in Chapter 2, Proposed Action and
Alternatives, of this EIS/OEIS. The annual training hours for each aircraft type during the exercise were
forecasted based on the scale of training event and the number of events on an annual basis. The
emissions from aircraft flight operations were estimated using the same references as described in
Section 1.4.4.1.
The emissions from aircraft training at existing airfields were estimated using the same methods and
emission factors guidance described previously. The annual aircraft training flight emissions are
summarized in Table 8 and detailed in Attachment 3.
Table 8. Training Annual Emissions Pollutant (tons per year)
SO2 CO PM10 PM2.5 NOx VOC CO2
Aircraft Training Exercises on Tinian
2.74 3.25 11.29 11.29 28.70 0.37 3740.83
Aircraft Training Exercises on Pagan
2.29 2.31 8.00 8.00 42.64 0.28 4810.82
1.4.2.3 Marine Vessel Training Emissions
Administrative and non-tactical logistics movement of equipment and personnel would be by
commercial or military vessels including, but not limited to, High Speed Vessels, commercial high-speed
ferry, other ferry, or other passenger/cargo vessel. Marine emissions come primarily from diesel engines
operating on oceangoing vessels, tugs and tows, and other vessels operating near the shoreline around
training ranges.
The emissions from training vessels, including barges, were calculated using vessel type and number
during each event, associated engine power levels for each vessel, operational hours per event and
number of event per year provided by the training team. Vessel emissions were calculated using the
methodologies, emission factors, and load factors related to diesel marine vessels obtained from
Current Methodologies in Preparing Mobile Source Port-Related Emission Inventories (USEPA 2009c).

CJMT EIS/OEIS Appendix G
April 2015 Draft Air Quality
G-24
Potential ship transportation to Tinian includes U.S. Navy Dock Landing Ships and High Speed Vessels or
contracted commercial shipping. All units (personnel and equipment) moving to Tinian via ship would
disembark at Tinian’s commercial pier.
A total running time was calculated by adding any additional idling time that may occur. The marine
vessel operational running times are detailed in Attachment 4.
The total running time was then multiplied by the emission factor for each vessel. The marine vessel
training operational emissions are summarized in Table 9. These emissions are considered to be the
same for all action alternatives.
Table 9. Marine Vessel Annual Emissions Pollutant (tons per year)
SO2 CO PM10 PM2.5 NOx VOC CO2
Marine Vessels on Tinian
31.61 8.85 3.75 3.43 106.28 4.02 5144.48
Marine Vessels on Pagan
2.18 0.84 0.27 0.25 10.22 0.36 353.86
1.4.2.4 Ground Training Vehicles Emissions
Training operations associated with the action alternative would generate emissions from ground
vehicle training operations on both paved and unpaved roadways.
Ground transportation would be provided by each unit transporting its own organic equipment required
for training. These would include high mobility multipurpose wheeled vehicles, medium tactical vehicle
replacements, 7-ton trucks, battalion landing team artillery, amphibious assault vehicles, and light
armored vehicles.
In addition to the above, various types of military and commercial vehicles are planned for permanent
support of administrative and range maintenance functions. These include approximately eight buses,
two cars, and five commercial flat-bed trucks. Also, forklifts, dump trucks, fire trucks, firefighting water
supply trucks, commercial 4-wheel drive trucks, and mowers would be dedicated to base functions.
Ground training vehicle exhaust emissions from trucks, high mobility multipurpose wheeled vehicles,
and buses used during training exercises were estimated with the same method used to predict
construction vehicle emissions. The USEPA MOVES emission factor model (USEPA 2012a) was used to
predict emissions factors associated with each type of training vehicle. The model-established emission
factors that are based on the average weight and fuel type of each type of training vehicle. The emission
factors were then multiplied by the annual vehicle running hours to determine exhaust emissions on an
annual basis.
In addition, because most of these training vehicles would maneuver on paved roads, unpaved roads
and military training trails with potential to generate fugitive dust, the USEPA AP-42, Compilation of Air
Pollution Emission Factors (USEPA 1995) was used to predict fugitive dust emissions from training
vehicles. Given the lack of inputs to divide the time for training vehicle running on paved or unpaved
roads, it is conservatively assumed that roadway surface fugitive dust emissions would be all generated
from unpaved roadways. Total training vehicle operational exhaust emissions and fugitive dust
emissions are shown in Table 10 for activities on Tinian and Pagan and detailed in Attachment 4.

CJMT EIS/OEIS Appendix G
April 2015 Draft Air Quality
G-25
Table 10. Ground Vehicle Annual Emissions Pollutant (tons per year)
SO2 CO PM10 PM2.5 NOx VOC CO2
Ground Vehicles on Tinian
13.38 42.31 109.13 19.38 141.71 9.11 1192.42
Ground Vehicles on Pagan
32.80 94.12 155.51 35.46 335.45 20.41 1421.42
1.4.2.5 Supporting Equipment Emissions
It is anticipated that during the training exercises, other supporting mobile equipment such as water and
fuel trucks, forklift, etc. would be required and operational hours during annual training events were
estimated by the training team. The supporting mobile equipment emission factors are based on the
NONROAD model database (USEPA 2009b) and the methodologies used are the same as those used for
construction equipment emissions as described in Section 1.4.2. The emission factors were multiplied by
the annual mobile equipment running hours to determine emissions on an annual basis. The estimated
annual supporting equipment emissions are summarized in Table 11 and detailed in Attachment 4.
Table 11. Training Support Equipment Annual Emissions Pollutant (tons per year)
SO2 CO PM10 PM2.5 NOx VOC CO2
Support Equipment on Tinian
0.17 3.43 16.48 2.12 7.50 0.64 794.05
Support Equipment on Pagan
0.02 0.49 1.24 0.20 0.92 0.09 102.75
1.4.2.6 Mobile and Stationary Generator Emissions
To support the training exercises, multiple mobile power generators would be implemented and several
back-up stationary generators would be installed at the Base Camp and a total of six Surface Radar sites.
The USEPA AP-42, Compilation of Air Pollution Emission Factors (USEPA 1995) and the anticipated
training associated mobile diesel generator parameters in terms of number, size, and operating hours on
an annual basis were used to predict mobile generator emissions. For permanent stationary emergency
diesel generators, a maximum of 500 hours of emergency operational capacity was assumed for each
stationary generator in predicting emissions. The generator emissions predicted are summarized in
Table 12 and detailed in Attachment 5.

CJMT EIS/OEIS Appendix G
April 2015 Draft Air Quality
G-26
Table 12. Mobile and Stationary Generator Annual Emissions Pollutant (tons per year)
SO2 CO PM10 PM2.5 NOx VOC CO2
Generators on Tinian
0.35 4.71 0.34 0.29 20.57 0.60 994.00
Generators on Pagan
0.30 4.04 0.29 0.25 17.61 0.52 851.20 Note: 250 tons per year comparative impact threshold does not apply to CO2.
1.4.2.7 Solid Waste Transfer Emissions
Solid waste generated as part of training exercises would be processed and recycled in a new waste
transfer station and a recycling center to be constructed at Tinian and then transferred from Tinian to a
regulatory compliant facility off-island through a barge. The waste quantity generated is approximately 7
pounds per person per day and the daily generation rate on Tinian is 21,700 pounds per day (i.e., under
11 tons per day). This quantity of waste could be handled by a single loader and a grapple at the
proposed transfer station & recycling center. The recycling center is anticipated to have a baler and
shredder that would be powered by electricity. The tug with a barge transport, assuming a typical
transport speed of 16 knots on open ocean for a large tug, the trip time from Tinian to Saipan is about
one hour one way trip and it is anticipated that one tug trip per week would be sufficient to haul 77 tons
of baled waste material.
The equipment and barge (tug) emission factors are based on the same references used previously for
construction non-road equipment and training barges. Solid waste processing and transfer activity
associated emissions with potential to occur at Tinian are summarized in Table 13 and detailed in
Attachment 6. The solid waste generated during training operations on Pagan would be minimal and the
associated waste storage containers transfer emissions are negligible.
Table 13. Solid Waste Transfer Annual Emissions Pollutant (tons per year)
SO2 CO PM10 PM2.5 NOx VOC CO2
Tinian
0.10 0.31 0.06 0.06 0.95 0.07 84.56 Note: 250 tons per year comparative impact threshold does not apply to CO2.
1.4.2.8 Munitions Emissions
Air emissions are potentially released during each weapon firing a round. Potential emission releases
occur during the launching of a projectile, from the propellant charge at the firing position, and from the
detonation explosion of the projectile in the target vicinity. The USEPA has published draft emission
factors for ordnance in the AP-42 handbook. These emission factors for weapons firing and explosive
detonation were used to predict munitions emissions. The munition emission factors for each applicable
weapon expenditure were multiplied by the number of rounds anticipated during firing to predict
munitions emissions. The munitions emissions predicted are summarized in Table 14 and detailed in
Attachment 7.

CJMT EIS/OEIS Appendix G
April 2015 Draft Air Quality
G-27
Table 14. Munitions Annual Emissions Pollutant (tons per year)
SO2 CO PM10 PM2.5 NOx VOC CO2
Munitions on Tinian
0.03 56.01 38.68 13.80 1.72 0.01 82.21
Munitions on Pagan
0.04 6.63 24.92 23.05 0.19 0.06 315.34 Note: 250 tons per year comparative impact threshold does not apply to CO2.
1.4.2.9 Combined Operational Emissions
Combined operational emissions are evaluated in this section.
1.4.2.9.1 Tinian
The combined training emissions from each training source element discussed previously were
calculated for the Tinian alternatives. The training-related combined emissions for Tinian alternatives
(Table 15) are below the comparative impact threshold of 250 tons (227 metric tons) per year for all
criteria pollutants, except CO and NOx. The training-related CO and NOx emissions would occur across a
large geographic area that consists of the airspace around the airport and training facilities where
aircraft would operate, the proposed RTA where training vehicles and aircraft would operate, and
coastal areas where aircraft and marine vessels would operate.
More than 70% of CO and 50% of NOx emissions would be generated by aircraft and marine vessels.
Consequently, the total ground level CO and NOx emissions (where there are sensitive receptors) would
be well below the 250 tons (227 metric tons) per year comparative impact threshold. Furthermore, the
dominant trade winds in the region blowing from the east and northeast would quickly disperse
emissions towards the ocean. Therefore, operational activities under each of the Tinian alternatives
would result in less than significant impacts to air quality.
1.4.2.9.2 Pagan
Military training operational emissions were estimated using the same methodologies implemented for
Tinian alternatives. The annual emissions for the combined operational elements and training exercises
are summarized in Table 16 and are below the comparative impact threshold of 250 tons (227 metric
tons) per year for all criteria pollutants, except for NOx. Approximately 75% of NOx emissions would be
generated by ground training vehicles. Since no sensitive land uses are located close to the proposed
RTA, and the dominant trade winds in the region blowing from the east and northeast would quickly
disperse emissions towards the ocean, operational activities under the Pagan alternatives would result
in less than significant impacts to air quality.

CJMT EIS/OEIS Appendix G
April 2015 Draft Air Quality
G-28
Table 15. Training Annual Emissions - Tinian Alternatives 1, 2, and 3 Pollutant (tons per year)
SO2 CO PM10 PM2.5 NOx VOC CO2
Aircraft Sorties around Tinian International Airport
8.12 256.27 42.69 42.69 89.02 75.18 25048.85
Aircraft Training Exercises
2.74 3.25 11.29 11.29 28.70 0.37 3740.83
Marine Vessels
31.61 8.85 3.75 3.43 106.28 4.02 5144.48
Ground Vehicles
13.38 42.31 109.13 19.38 141.71 9.11 1192.42
Support Equipment
0.17 3.43 16.48 2.12 7.50 0.64 794.05
Generators
0.35 4.71 0.34 0.29 20.57 0.60 994.00
Solid Waste Transfer
0.10 0.31 0.06 0.06 0.95 0.07 84.56
Munitions
0.03 56.01 38.68 13.80 1.72 0.01 82.21
Total
56.45 375.14 222.42 93.06 396.45 90.00 37081.40 Note: 250 tons per year comparative impact threshold does not apply to CO2.
Table 16. Training Activity Annual Emissions- Pagan Alternatives 1 and 2 Pollutant (tons per year)
SO2 CO PM10 PM2.5 NOx VOC CO2
Aircraft Sorties around Pagan Airport
2.98 74.22 17.16 17.16 42.66 29.71 7607.25
Aircraft Training Exercises
2.29 2.31 8.00 8.00 42.64 0.28 4810.82
Marine Vessels
2.18 0.84 0.27 0.25 10.22 0.36 353.86
Ground Vehicles
32.80 94.12 155.51 35.46 335.45 20.41 1421.42
Support Equipment
0.02 0.49 1.24 0.20 0.92 0.09 102.75
Generators
0.30 4.04 0.29 0.25 17.61 0.52 851.20
Munitions
0.04 6.63 24.92 23.05 0.19 0.06 315.34
Total
40.61 182.65 207.39 84.37 449.69 51.43 15462.64 Note: 250 tons per year comparative impact threshold does not apply to CO2.

CJMT EIS/OEIS Appendix G
April 2015 Draft Air Quality
G-29
1.5 CUMULATIVE REGIONAL EMISSIONS UNDER PREFERRED
ALTERNATIVES
The preferred alternatives were evaluated for potential air quality impacts to Tinian and Pagan. Regional
emissions occurring under the combined alternatives from the proposed action at both islands were
analyzed. The criterion used to determine potential air quality impacts is based on PSD major source
threshold of 250 tons (227 metric tons) per year as a comparative impact threshold. It should be noted
that this level is used as an indication of a potentially significant impact that would need to be further
evaluated based on geographic coverage of these emissions and the close proximity of sensitive land
uses to the emission sources generating these emissions.
1.5.1 Criteria Pollutants
The cumulative regional emissions under the preferred alternatives with training activities on Tinian and
Pagan combined (Table 17) would exceed the comparative impact threshold of 250 tons (227 metric
tons) per year for CO, PM10, and NOx on a regional basis. However, these emissions would occur across a
large geographic area that consists of the airspace around the airport and training facilities where
aircraft would operate, the proposed RTAs where training vehicles and aircraft would operate, and
coastal areas where aircraft and marine vessels would operate. Consequently, the total ground level CO,
PM10, and NOx emissions (where there are sensitive receptors) are anticipated to be well below the 250
tons (227 metric tons) per year comparative impact threshold. Furthermore, the dominant trade winds
in the region blowing from the east and northeast would quickly disperse emissions towards the ocean.
Therefore, cumulative operational activities under the preferred combined alternative would result in
less than significant impacts to air quality.
Table 17. Regional Combined Annual Emissions Pollutant (tons per year)
SO2 CO PM10 PM2.5 NOx VOC CO2
Aircraft Sorties around Tinian International Airport and Pagan Airport
11.1 330.49 59.85 59.85 131.68 104.89 32656.1
Aircraft Training Exercises
5.03 5.56 19.29 19.29 71.34 0.65 8551.65
Marine Vessels
33.79 9.69 4.02 3.68 116.5 4.38 5498.34
Ground Vehicles
46.18 136.43 264.64 54.84 477.16 29.52 2613.84
Support Equipment
0.19 3.92 17.72 2.32 8.42 0.73 896.8
Generators
0.65 8.75 0.63 0.54 38.18 1.12 1845.20
Solid Waste Transfer
0.10 0.31 0.06 0.06 0.95 0.07 84.56
Munitions
0.07 62.64 63.6 36.85 1.91 0.07 397.55
Total
97.06 555.20 429.09 177.41 849.47 141.48 52544.04 Note: 250 tons per year comparative impact threshold does not apply to CO2.

CJMT EIS/OEIS Appendix G
April 2015 Draft Air Quality
G-30
1.5.2 Greenhouse Gases and Global Warming
Greenhouse gas emissions in the atmosphere are of concern because they contribute to global warming
by trapping re-radiated energy. The total quantity of greenhouse gas emissions was expressed in terms
of CO2 emissions resulting under the preferred alternative. CO2 is not a criteria pollutant and the 250
tons (227 metric tons) per year comparative impact threshold is not applicable to CO2. Therefore,
greenhouse gases in terms of CO2 emissions are presented only for disclosure purposes.
Since the proposed action would mostly involve the military training exercises that are currently
occurring in various regions in the U.S., energy consumption from activities in the region are unlikely to
change significantly and the overall global greenhouse gas emissions associated with the proposed
action are likely to remain at the current levels on a regional scale.
1.5.2.1 Background and Regulatory Framework
This section provides the background and regulatory framework for greenhouse gases and a
quantitative evaluation of the increase in greenhouse gas emissions from cumulative emissions from the
proposed alternatives.
Greenhouse gases trap heat in the atmosphere by absorbing infrared radiation. These emissions occur
from both natural processes and human activities. The primary long-lived greenhouse gases directly
emitted by human activities are CO2, CH4, N2O, HFCs, PFCs, and SF6. Although CO2, CH4, and N2O occur
naturally in the atmosphere, their concentrations have increased by 38, 149, and 23%, respectively,
from the preindustrial era (1750) to 2007/2008 (USEPA 2009d).
Federal agencies address emissions of greenhouse gases by reporting and meeting reductions mandated
in laws, Executive Orders, and policies. The most recent of these are Executive Order 13514, Federal
Leadership in Environmental, Energy, and Economic Performance, of October 5, 2009 and Executive
Order 13423, Strengthening Federal Environmental, Energy, and Transportation Management of January
26, 2007.
Executive Order 13514 shifts the way the government operates by: (1) establishing greenhouse gases as
the integrating metric for tracking progress in federal sustainability; (2) requiring a deliberative planning
process; and (3) linking to budget allocations and Office of Management and Budget scorecards to
ensure goal achievement.
The targets for reducing greenhouse gas emissions discussed in Executive Order 13514 for Scope 1 -
direct greenhouse gas emissions from sources that are owned or controlled by a federal agency; Scope 2
- direct greenhouse gas emissions resulting from the generation of electricity, heat, or steam purchased
by a federal agency - have been set for the Department of Defense at a 34% reduction of greenhouse
gas from the 2008 baseline by 2020 and; Scope 3 targets - greenhouse gas emissions from sources not
owned or directly controlled by a Federal agency but related to agency activities such as vendor supply
chains, delivery services, and employee travel and commuting – have been proposed to set for the
Department of Defense at a 13.5% reduction. The Executive Order 13514 Strategic Sustainability
Performance Plan (SSPP) was submitted to the CEQ on June 2, 2010 and contains a guide for meeting
these goals.

CJMT EIS/OEIS Appendix G
April 2015 Draft Air Quality
G-31
Greenhouse gases for the proposed action would be reduced by incorporating the Leadership in Energy
and Environmental Design (LEED) program into the proposed action. LEED is an internationally
recognized green building certification system, providing third-party verification that a building or
community was designed and built using strategies aimed at improving performance across all the
metrics that matter most: energy savings, water efficiency, CO2 emissions reduction, improved indoor
environmental quality, and stewardship of resources and sensitivity to their impacts. There are four
levels of certification in LEED and buildings constructed for action associated with this EIS would aim to
attain a rating of LEED silver. Low-impact land development would also be used during design in order to
save water and energy to meet the targets established under Executive Order 13514.
Executive Order 13423 established a policy that Federal agencies conduct their environmental,
transportation, and energy-related activities in support of their respective missions in an
environmentally economic way. It included a goal of improving energy efficiency and reducing
greenhouse gas emissions of the agency, through reduction of energy intensity by 3% annually through
the end of fiscal year 2015, or 30% by the end of fiscal year 2015, relative to the baseline of the agency’s
energy use in fiscal year 2003.
CEQ Draft NEPA Guidance on Consideration of the Effects of Climate Change and Greenhouse Gas
Emissions (CEQ 2010) states that “if a proposed action would be reasonably anticipated to cause direct
emissions of 25,000 metric tons or more of CO2-equivalent greenhouse gas emissions on an annual basis,
agencies should consider this an indicator that a quantitative and qualitative assessment may be
meaningful to decision makers and the public.” These recommendations are consistent with the
Mandatory Reporting of Greenhouse Gases rule (40 CFRs Parts 86, 87, 89 et al.) effective December 29,
2009 and applies to fossil fuel suppliers and industrial gas suppliers, direct greenhouse gas emitters and
manufacturers of heavy-duty and off-road vehicles and engines. Under the rule, suppliers of fossil fuels
or industrial greenhouse gases, manufacturers of vehicles and engines, and facilities that emit 25,000
metric tons per year of greenhouse gas emissions are required to submit annual reports to USEPA. The
Mandatory Reporting rule for the proposed action applies to the Department of Defense stationary
sources. However, because the proposed action would not result in any modification or construction of
new stationary sources other than exempted emergency generators, these rules do not apply. This
analysis provided here follows the recent Draft NEPA Guidance on Consideration of the Effects of
Climate Change and Greenhouse Gas issued by the CEQ (CEQ 2010).
1.5.3 Proposed Action and Cumulative Greenhouse Gas Impacts
The potential effects of proposed greenhouse gas emissions are by nature global and cumulative
impacts, as individual sources of greenhouse gas emissions are not large enough to have an appreciable
effect on climate change. In keeping with CEQ guidance, the focus of the cumulative air quality
greenhouse gas analysis is on greenhouse gas emissions that are affected by the proposed action and its
significance on climate change as compared to the no-action alternative. The impact of proposed
greenhouse gas emissions as they pertain to climate change is discussed in the context of the combined
impacts as compared to the total amount of greenhouse gas emissions that the U.S. produces.
To estimate total greenhouse gas emissions, each greenhouse gas is assigned a GWP. The GWP is the
ability of a gas or aerosol to trap heat in the atmosphere. The GWP rating system is standardized to CO2,
which has a value of one. For example, CH4 has a GWP of 21, which means that it has a global warming

CJMT EIS/OEIS Appendix G
April 2015 Draft Air Quality
G-32
effect 21 times greater than CO2 on an equal-mass basis (Intergovernmental Panel on Climate Change
2007). To simplify greenhouse gas analyses, total greenhouse gas emissions from a source are often
expressed as CO2 equivalents (CO2e). The CO2e is calculated by multiplying the emissions of each
greenhouse gas by its GWP and adding the results together to produce a single, combined emission rate
representing all greenhouse gases. While CH4 and N2O have much higher GWPs than CO2, CO2 is emitted
in much higher quantities, so that CO2 is the overwhelming contributor to CO2e from both natural
processes and human activities. GWP-weighted emissions are presented in terms of equivalent
emissions of CO2, using units of teragrams (1 million metric tons or 1 billion kilograms) of carbon dioxide
equivalents (Tg CO2e).
The total greenhouse gas emissions in terms of CO2e for the proposed alternatives were predicted for
the mobile fossil fuel combustion sources.
Among the primary long-lived greenhouse gases directly emitted by human activities, only CH4 and N2O
have potential to be produced from fossil fuel combustion sources (USEPA 2009a).
Although the USEPA final rule on Mandatory Reporting of Greenhouse Gases (October 30, 2009)
provides various methodologies to estimate CO2 equivalencies based on fuel test and consumption data,
this rule is essentially designed for specific stationary facility reporting purposes and cannot be directly
implemented in this EIS to address various source categories. Most of the USEPA tools that are widely
used for NEPA study purposes (e.g., AP-42 [USEPA 1995], NONROAD [USEPA 2009b]) do not provide
emission factors for CO2e other than for CO2. Therefore, given the lack of regulatory tools to provide
reasonable estimates of CO2e, this appendix utilizes the inventory ratios among CO2, CH4, and N2O
summarized in the most recent USEPA inventory report (USEPA 2014) and provided in the introduction
to this section as the basis for approximating and prorating CH4 and N2O emission levels.
The most recent 2012 inventory data (USEPA 2014) shows that CO2, CH4, and N2O contributed from
fossil fuel combustion process from mobile and stationary sources include approximately:
5,072 teragrams (Tg) (or million metric tons) of CO2
7 Tg CH4
39 Tg N2O
The ratios among CO2, CH4, and N2O based on above inventory levels were used to predict CH4 and N2O
equivalencies from mobile combustion sources as follows:
CH4 = (tons per year [TPY] of CO2) * (7 / 5,072) = 0.14% TPY of CO2.
N2O = (TPY of CO2) * (39/ 5,072) = 0.77% TPY of CO2.
Based on these ratios, the greenhouse gas contribution from CH4 and N2O is less than 1% of the total CO2
equivalency for fossil fuel combustion sources.
In 2012, the U.S. generated about 6,526 Tg (million metric tons) CO2e (USEPA 2014). However, the U.S.
inventory does not provide a baseline for Tinian or Pagan; therefore, using the U.S. baseline condition
for a comparison is considered appropriate for current conditions. The total maximum quantity of
greenhouse gas emissions from the preferred alternatives (i.e., 52,544 short tons as shown in Table 17
which is equivalent to 47,709 metric tons) comprises less than 0.00073% of the annual U.S. emissions.

CJMT EIS/OEIS Appendix G
April 2015 Draft Air Quality
G-33
The change in climate conditions caused by greenhouse gas resulting from the burning of fossil fuels
from proposed mobile sources is a global effect, and requires that the emissions be assessed on a global
scale. Therefore, the disclosure of localized incremental emissions has limited or no weight in addressing
climate change. The proposed action mainly involves the military operations that are already occurring
in the U.S.; therefore, fossil fuel burning activities in the U.S. are unlikely to change significantly.
Consequently, overall global greenhouse gas emissions are likely to remain near the current level on a
regional or global scale under the proposed condition, resulting in an insignificant cumulative impact to
global climate change. No specific greenhouse gas emission mitigation measures are warranted.
1.6 VOLCANIC IMPACTS ON OPERATION
Existing volcanic gases would continue to be released from Pagan volcano eruptions as part of natural
geological processes. SO2, a criteria pollutant, is one of the most common gases released in volcanic
eruptions and is hazardous to humans. During the training operations, periodic SO2 releases due to
volcanic eruptions could have adverse air quality impacts. Table 18 summarizes human health effects as
a function of SO2 exposure concentration levels. Table 19 shows the permissible occupational exposure
level of SO2 for multiple averaging periods. An advisory table used at the Hawaii Volcanoes National Park
to protect public health from high concentrations of SO2 is provided in Table 20.
Table 18. Health Effects of Respiratory Exposure to Sulfur Dioxide Exposure Limits
(parts per million) Sulfur Dioxide Health Effects
1 – 5 Threshold for respiratory response in healthy individuals upon exercise or deep breathing.
3 – 5 Gas is easily noticeable. Fall in lung function at rest and increased airway resistance.
5 Increased airway resistance in healthy individuals.
6 Immediate irritation of eyes, nose, and throat.
10 Worsening irritation of eyes, nose, and throat.
10 – 15 Threshold of toxicity for prolonged exposure.
20+ Paralysis or death occurs after extended exposure.
150 Maximum concentration that can be withstood for a few minutes by healthy individuals.
Source: International Volcanic Health Hazard Network 2013.

CJMT EIS/OEIS Appendix G
April 2015 Draft Air Quality
G-34
Table 19. Occupational Guidelines for Sulfur Dioxide Sulfur Dioxide Level (parts per million)
Averaging Period Relevant Law Ref.
5 15 minutes NIOSH/ ACGIH B
5 8-hour OSHA Regulations1 (Standards - 29 CFR) A
2 8-hour NIOSH/ ACGIH B
0.3 1-hour Emergency Response Planning
Guideline-12 C
3 1-hour Emergency Response Planning
Guideline-23 C
25 1-hour Emergency Response Planning
Guideline-34 C
Notes 1. Parts per million by volume at 25ºC. 2. The Emergency Response Planning Guideline-1 is the maximum airborne concentration below which it is believed nearly all individuals could be exposed for up to 1 hour without experiencing other mild transient adverse health effects or without perceiving a clearly defined objectionable odor. 3. The Emergency Response Planning Guideline-2 is the maximum airborne concentration below which it is believed nearly all individuals could be exposed for up to 1 hour without experiencing or developing irreversible or serious health effects or symptoms that could impair an individual’s ability to take protective action. 4. The Emergency Response Planning Guideline-3 is the maximum airborne concentration below which it is believed nearly all individuals could be exposed for up to 1 hour without experiencing or developing life threatening health effects.
Legend: ACGIH = American Conference of Governmental Industrial Hygienists; CFR = Code of Federal Regulations; NIOSH = National Institute for Occupational Safety and Health; OSHA = Occupational Safety and Health Administration.
Sources: a. Occupational Safety and Health Administration 2013. b. National Institute for Occupational Safety and Health 1994. c. American Industrial Hygiene Association (AIHA) 2013. Table adapted from the International Volcanic Health Hazard Network (2013).
Table 20. The Hawaii Volcanoes National Park and Hawaiian Volcano Observatory's Sulfur Dioxide Advisory
Hawaii Volcanoes Sulfur Dioxide Response Plan
Condition Response
GREEN (Good)
sulfur dioxide <300 parts per billion 15-min average
Business as usual
YELLOW (Moderate)
sulfur dioxide >300 parts per billion 30-minute average
Basic Protective Actions Dispatcher alerts staff Inform visitors of hazard
ORANGE (Unhealthy for sensitive groups)
sulfur dioxide >500 parts per billion 15-minute average
Moderate Protective Actions Relocate/cancel nature walks and other outdoor work
RED (Unhealthy)
sulfur dioxide >1,000 parts per billion 15-minute average
Extended Protective Actions Consider closing entrance station and Visitor Centers
Source: U.S. Geological Survey 2008.

CJMT EIS/OEIS Appendix G
April 2015 Draft Air Quality
G-35
In order to compare the advisory limit for a typical volcanic eruption shown in Table 20, it is assumed
that approximately 5% of the emitted gas is present in the lower atmosphere 1-4 days after a volcanic
eruption (International Volcanic Health Hazard Network 2013), resulting in likely SO2 concentration
levels less than 1,000 parts per billion. In addition, the color in the air could be an indicator of the
concentration of SO2. Caution should be used during operation activities to minimize personnel from
potential exposure to high SO2 air concentrations (e.g., avoiding training activities for 1-4 days after a
volcanic eruption). High SO2 concentrations could result in human health risks; however, with
implementation of planning procedures to limit or avoid training activities during periods of high SO2
concentration, Pagan Alternatives 1 and 2 would result in less than significant impacts to human health.

CJMT EIS/OEIS Appendix G
April 2015 Draft Air Quality
G-36
1.7 REFERENCES
AESO. (1999). Aircraft Emissions Estimates (AESO Memorandum Reports).
Air Force Civil Engineer Center. (2013). Air Emissions Guide for Air Force Mobile Sources. Methods for Estimating Emissions of Air Pollutants for Mobile Sources at U.S. Air Force Installations. Retrieved from http://www.aqhelp.com/Documents/Air%20Emissions%20Guide%20for%20Air%20Force%20Mobile%20Sources%20Final%202013.pdf
American Industrial Hygiene Association (AIHA). (2013). 2013 Emergency Response Planning Guidelines. Retrieved from https://www.aiha.org/get-involved/AIHAGuidelineFoundation/EmergencyResponsePlanningGuidelines/Documents/2013ERPGValues.pdf
CEQ. (2010). Draft NEPA Guidance on Consideration of the Effects of Climate Change and Greenhouse Gas Emissions. Retrieved from http://www.whitehouse.gov/sites/default/files/microsites/ceq/20100218-nepa-consideration-effects-ghg-draft-guidance.pdf
Federal Aviation Administration. (2014, July 31). U.S. Federal Aviation Administration Emissions and Dispersion Modeling System (Version 5.01). Retrieved September 18, 2014, from http://www.faa.gov/about/office_org/headquarters_offices/apl/research/models/edms_model/
Intergovernmental Panel on Climate Change. (2007). Climate Change 2007: The Physical Science Basis. Contribution of Working Group I to the Fourth Assessment Report of the Intergovernmental Panel on Climate Change.
International Volcanic Health Hazard Network. (2013). Sulphur Dioxide. Retrieved November 11, 2013, from http://www.ivhhn.org/index.php?option=com_content&view=article&id=82
Joint Strike Fighter Work Force. (2009). JSF Emission Factor Worksheets.
National Institute for Occupational Safety and Health. (1994). NIOSH Manual of Analytical Methods. Sulfur Dioxide (DHHS (NIOSH) Publication No. 94-113). Retrieved from http://www.cdc.gov/niosh/docs/2003-154/pdfs/6004.pdf
Occupational Safety and Health Administration. (2013). Sulfur Dioxide. U.S. Department of Labor. Retrieved from http://www.osha.gov/dts/chemicalsampling/data/CH_268500.html
RSMeans. (2002). 2003 Facilities Construction Cost Data (18th Annual.).
RSMeans. (2010). 2011 Facilities Construction Cost Data (26th Annual.). Retrieved from http://www.valorebooks.com/textbooks/rsmeans-facilities-construction-cost-data-26-annualth-edition/9781936335077#default=buy&utm_source=Froogle&utm_medium=referral&utm_campaign=Froogle&date=11/30/13
USEPA. (1992). Procedures for Emission Inventory Preparation, Volume IV: Mobile Sources (No. EPA420-R-92-009). Retrieved from http://www.epa.gov/otaq/models/nonrdmdl/r92009.pdf
USEPA. (1995). Compilation of Air Pollutant Emission Factors, AP-42. Retrieved from https://www.aiha.org/get-involved/AIHAGuidelineFoundation/EmergencyResponsePlanningGuidelines/Documents/2013ERPGValues.pdf

CJMT EIS/OEIS Appendix G
April 2015 Draft Air Quality
G-37
U.S. Environmental Protection Agency. (2009a). Inventory of U.S. Greenhouse Gas Emissions and Sinks: 1990-2007 (EPA 430-R-09-004). Retrieved from http://www.epa.gov/climatechange/Downloads/ghgemissions/GHG2007-ES-508.pdf
USEPA. (2009b). NONROAD2008a Model worksheet.
USEPA. (2009c). Current Methodologies in Preparing Mobile Source Port-related Emission Inventories. Final Report. Prepared by ICF International. Retrieved from http://epa.gov/cleandiesel/documents/ports-emission-inv-april09.pdf
USEPA. (2009d, December 7). Technical Support Document for Endangerment and Cause or Contribute Findings for Greenhouse Gases under Section 202(a) of the Clean Air Act. Retrieved from http://epa.gov/climatechange/Downloads/endangerment/Endangerment_TSD.pdf
USEPA. (2012a). MOVES (Motor Vehicle Emission Simulator). Modeling and Inventories. Retrieved from http://www.epa.gov/otaq/models/moves/
USEPA. (2012b, April 20). Six Common Air Pollutants. Air & Radiation. Retrieved June 27, 2014, from http://www.epa.gov/air/urbanair/
USEPA. (2012c, December 14). National Ambient Air Quality Standards (NAAQS). Retrieved September 18, 2013, from http://www.epa.gov/air/criteria.html
USEPA. (2014). Inventory of U.S. Greenhouse Gas Emissions and Sinks: 1990-2012 (EPA 430-R-14-003). Retrieved from http://www.epa.gov/climatechange/Downloads/ghgemissions/US-GHG-Inventory-2014-Main-Text.pdf
U.S. Geological Survey. (2014). Volcano Hazards Program. Retrieved June 2, 2014, from http://volcanoes.usgs.gov/hazards/index.php

CJMT EIS/OEIS Appendix G
April 2015 Draft Air Quality
G-38
Attachments-Calculation Backups

CJMT EIS/OEIS Appendix G
April 2015 Draft Air Quality
G-39
Attachment 1 - MOVES Sample Input/Output

CJMT EIS/OEIS Appendix G
April 2015 Draft Air Quality
G-40
CJMT MOVES Inputs
MOVES Run Summary
Vehicle Types Time Location Road Type
Gasoline Passenger Vehicle 2016 Weekdays January & July Virgin Islands - St. Thomas Rural Unrestricted Access
Diesel Combination Short Haul Truck
Fuel Supply
CountyID FuelYearID MonthGroupID FuelFormulationID MarketShare MarketShareCV
78030 2012 1 9172 1 0.5
78030 2012 7 9190 1 0.5
78030 2012 1 20011 1 0.5
78030 2012 7 20011 1 0.5
Hour VMT Fraction
SourceTypeID RoadTypeID DayID HourID HourVMTFraction
21 3 2 1 0.016421
21 3 2 2 0.011192
21 3 2 3 0.008542
21 3 2 4 0.006793
21 3 2 5 0.007219
21 3 2 6 0.010762
21 3 2 7 0.01768
21 3 2 8 0.026875
21 3 2 9 0.038659
21 3 2 10 0.052239
21 3 2 11 0.063174
21 3 2 12 0.069944
21 3 2 13 0.072933

CJMT EIS/OEIS Appendix G
April 2015 Draft Air Quality
G-41
Hour VMT Fraction
SourceTypeID RoadTypeID DayID HourID HourVMTFraction
21 3 2 14 0.073122
21 3 2 15 0.073616
21 3 2 16 0.074461
21 3 2 17 0.074217
21 3 2 18 0.070009
21 3 2 19 0.061404
21 3 2 20 0.050504
21 3 2 21 0.041207
21 3 2 22 0.033637
21 3 2 23 0.026224
21 3 2 24 0.019167
61 3 2 1 0.016421
61 3 2 2 0.011192
61 3 2 3 0.008542
61 3 2 4 0.006793
61 3 2 5 0.007219
61 3 2 6 0.010762
61 3 2 7 0.01768
61 3 2 8 0.026875
61 3 2 9 0.038659
61 3 2 10 0.052239
61 3 2 11 0.063174
61 3 2 12 0.069944
61 3 2 13 0.072933
61 3 2 14 0.073122
61 3 2 15 0.073616
61 3 2 16 0.074461
61 3 2 17 0.074217

CJMT EIS/OEIS Appendix G
April 2015 Draft Air Quality
G-42
Hour VMT Fraction
SourceTypeID RoadTypeID DayID HourID HourVMTFraction
61 3 2 18 0.070009
61 3 2 19 0.061404
61 3 2 20 0.050504
61 3 2 21 0.041207
61 3 2 22 0.033637
61 3 2 23 0.026224
61 3 2 24 0.019167
Road Type Distribution
SourceTypeID RoadTypeID RoadTypeVMTFraction
21 1 0
21 2 0.083421
21 3 0.289053
21 4 0.209684
21 5 0.417842
61 1 0
61 2 0.324692
61 3 0.294068
61 4 0.207526
61 5 0.173714

CJMT EIS/OEIS Appendix G
April 2015 Draft Air Quality
G-43
Source Type Age Distribution
SourceTypeID YearID AgeID AgeFraction
21 1999 0 0.0646
21 1999 1 0.0602
21 1999 2 0.061
21 1999 3 0.0624
21 1999 4 0.0626
21 1999 5 0.0642
21 1999 6 0.0597
21 1999 7 0.0562
21 1999 8 0.0543
21 1999 9 0.0596
21 1999 10 0.0608
21 1999 11 0.0622
21 1999 12 0.0549
21 1999 13 0.0522
21 1999 14 0.0419
21 1999 15 0.032
21 1999 16 0.0226
21 1999 17 0.0155
21 1999 18 0.0129
21 1999 19 0.0105
21 1999 20 0.008
21 1999 21 0.006
21 1999 22 0.0045
21 1999 23 0.0034
21 1999 24 0.0026
21 1999 25 0.0019
21 1999 26 0.0014

CJMT EIS/OEIS Appendix G
April 2015 Draft Air Quality
G-44
Source Type Age Distribution
SourceTypeID YearID AgeID AgeFraction
21 1999 27 0.0008
21 1999 28 0.0006
21 1999 29 0.0005
21 1999 30 0
61 1999 0 0.084252
61 1999 1 0.067209
61 1999 2 0.057562
61 1999 3 0.050629
61 1999 4 0.0693
61 1999 5 0.056228
61 1999 6 0.048773
61 1999 7 0.037878
61 1999 8 0.045255
61 1999 9 0.053548
61 1999 10 0.056029
61 1999 11 0.054994
61 1999 12 0.059676
61 1999 13 0.05284
61 1999 14 0.048713
61 1999 15 0.040034
61 1999 16 0.016687
61 1999 17 0.014696
61 1999 18 0.013335
61 1999 19 0.017959
61 1999 20 0.011167
61 1999 21 0.00904
61 1999 22 0.009914
61 1999 23 0.003839

CJMT EIS/OEIS Appendix G
April 2015 Draft Air Quality
G-45
Source Type Age Distribution
SourceTypeID YearID AgeID AgeFraction
61 1999 24 0.004789
61 1999 25 0.004765
61 1999 26 0.004
61 1999 27 0.003639
61 1999 28 0.002622
61 1999 29 0.000628
61 1999 30 0

CJMT EIS/OEIS Appendix G
April 2015 Draft Air Quality
G-46
Zone Month Hour
MonthID ZoneID HourID Temperature RelHumidity
1 780300 1 73.7 81.8
7 780300 1 79.5 81.7
1 780300 2 73 82.9
7 780300 2 79 82.2
1 780300 3 72.6 83.5
7 780300 3 78.3 83.3
1 780300 4 72 84.3
7 780300 4 77.7 83.8
1 780300 5 71.6 84.6
7 780300 5 77.4 84
1 780300 6 71.3 84.8
7 780300 6 77 84.9
1 780300 7 70.9 85.4
7 780300 7 76.7 84.9
1 780300 8 70.9 85.4
7 780300 8 78.6 82.4
1 780300 9 73.1 82.6
7 780300 9 82.1 77.6
1 780300 10 78.1 75.4
7 780300 10 85.1 72.4
1 780300 11 81.1 71
7 780300 11 87 69.3
1 780300 12 82.7 67.4
7 780300 12 88.5 67.8
1 780300 13 83.7 65.7
7 780300 13 89.2 66.6
1 780300 14 84.4 64.5

CJMT EIS/OEIS Appendix G
April 2015 Draft Air Quality
G-47
Zone Month Hour
MonthID ZoneID HourID Temperature RelHumidity
7 780300 14 89.5 66.4
1 780300 15 84.3 64.9
7 780300 15 89.4 66.8
1 780300 16 83.7 65.5
7 780300 16 88.8 67.6
1 780300 17 83 66.1
7 780300 17 87.9 68.4
1 780300 18 81.2 68.6
7 780300 18 86.7 69.9
1 780300 19 78.8 72.5
7 780300 19 85 72.6
1 780300 20 76.9 76.1
7 780300 20 82.8 76.1
1 780300 21 76.2 77.4
7 780300 21 81.5 78.1
1 780300 22 75.5 78.6
7 780300 22 80.9 79.1
1 780300 23 74.9 79.7
7 780300 23 80.5 80.1
1 780300 24 74.4 80.5
7 780300 24 79.9 81.4

CJMT EIS/OEIS Appendix G
April 2015 Draft Air Quality
G-48
CJMT MOVES Output
MOVESScenari
oID
MOVESRu
nID
yearI
D
month
ID
dayI
D
hourI
D linkID
pollutant
ID
process
ID
sourceTyp
eID
SC
C
fuelType
ID
modelYea
rID
roadType
ID
avgSpeedBi
nID
temperat
ure
relHumid
ity
ratePerDista
nce
Guam_EF_AllP
op 1 2016 1 5 1
7803003
02 3 1 21
1 0 3 2 73.7 81.8 0.324642
Guam_EF_AllP
op 1 2016 1 5 1
7803003
02 3 15 21
1 0 3 2 73.7 81.8 6.49284E-06
Guam_EF_AllP
op 1 2016 1 5 2
7803003
02 3 1 21
1 0 3 2 73 82.9 0.314503
Guam_EF_AllP
op 1 2016 1 5 2
7803003
02 3 15 21
1 0 3 2 73 82.9 6.29006E-06
Guam_EF_AllP
op 1 2016 1 5 3
7803003
02 3 1 21
1 0 3 2 72.6 83.5 0.308652
Guam_EF_AllP
op 1 2016 1 5 3
7803003
02 3 15 21
1 0 3 2 72.6 83.5 6.17306E-06
Guam_EF_AllP
op 1 2016 1 5 4
7803003
02 3 1 21
1 0 3 2 72 84.3 0.299878
Guam_EF_AllP
op 1 2016 1 5 4
7803003
02 3 15 21
1 0 3 2 72 84.3 5.99757E-06
Guam_EF_AllP
op 1 2016 1 5 5
7803003
02 3 1 21
1 0 3 2 71.6 84.6 0.294259
Guam_EF_AllP
op 1 2016 1 5 5
7803003
02 3 15 21
1 0 3 2 71.6 84.6 5.88517E-06
Guam_EF_AllP
op 1 2016 1 5 6
7803003
02 3 1 21
1 0 3 2 71.3 84.8 0.290003
Guam_EF_AllP
op 1 2016 1 5 6
7803003
02 3 15 21
1 0 3 2 71.3 84.8 5.80007E-06
Guam_EF_AllP
op 1 2016 1 5 7
7803003
02 3 1 21
1 0 3 2 70.9 85.4 0.283777
Guam_EF_AllP
op 1 2016 1 5 7
7803003
02 3 15 21
1 0 3 2 70.9 85.4 5.67554E-06
Guam_EF_AllP
op 1 2016 1 5 8
7803003
02 3 1 21
1 0 3 2 70.9 85.4 0.283777
Guam_EF_AllP
op 1 2016 1 5 8
7803003
02 3 15 21
1 0 3 2 70.9 85.4 5.67553E-06
Guam_EF_AllP
op 1 2016 1 5 9
7803003
02 3 1 21
1 0 3 2 73.1 82.6 0.316202
Guam_EF_AllP
op 1 2016 1 5 9
7803003
02 3 15 21
1 0 3 2 73.1 82.6 6.32404E-06
Guam_EF_AllP
op 1 2016 1 5 10
7803003
02 3 1 21
1 0 3 2 78.1 75.4 0.41452
Guam_EF_AllP
op 1 2016 1 5 10
7803003
02 3 15 21
1 0 3 2 78.1 75.4 8.29042E-06
Guam_EF_AllP
op 1 2016 1 5 11
7803003
02 3 1 21
1 0 3 2 81.1 71 0.467609
Guam_EF_AllP
op 1 2016 1 5 11
7803003
02 3 15 21
1 0 3 2 81.1 71 9.35221E-06

CJMT EIS/OEIS Appendix G
April 2015 Draft Air Quality
G-49
CJMT MOVES Output
MOVESScenari
oID
MOVESRu
nID
yearI
D
month
ID
dayI
D
hourI
D linkID
pollutant
ID
process
ID
sourceTyp
eID
SC
C
fuelType
ID
modelYea
rID
roadType
ID
avgSpeedBi
nID
temperat
ure
relHumid
ity
ratePerDista
nce
Guam_EF_AllP
op 1 2016 1 5 12
7803003
02 3 1 21
1 0 3 2 82.7 67.4 0.494102
Guam_EF_AllP
op 1 2016 1 5 12
7803003
02 3 15 21
1 0 3 2 82.7 67.4 9.88205E-06
Guam_EF_AllP
op 1 2016 1 5 13
7803003
02 3 1 21
1 0 3 2 83.7 65.7 0.509014
Guam_EF_AllP
op 1 2016 1 5 13
7803003
02 3 15 21
1 0 3 2 83.7 65.7 1.01803E-05
Guam_EF_AllP
op 1 2016 1 5 14
7803003
02 3 1 21
1 0 3 2 84.4 64.5 0.519041
Guam_EF_AllP
op 1 2016 1 5 14
7803003
02 3 15 21
1 0 3 2 84.4 64.5 1.03808E-05
Guam_EF_AllP
op 1 2016 1 5 15
7803003
02 3 1 21
1 0 3 2 84.3 64.9 0.517462
Guam_EF_AllP
op 1 2016 1 5 15
7803003
02 3 15 21
1 0 3 2 84.3 64.9 1.03493E-05
Guam_EF_AllP
op 1 2016 1 5 16
7803003
02 3 1 21
1 0 3 2 83.7 65.5 0.509167
Guam_EF_AllP
op 1 2016 1 5 16
7803003
02 3 15 21
1 0 3 2 83.7 65.5 1.01834E-05
Guam_EF_AllP
op 1 2016 1 5 17
7803003
02 3 1 21
1 0 3 2 83 66.1 0.499314
Guam_EF_AllP
op 1 2016 1 5 17
7803003
02 3 15 21
1 0 3 2 83 66.1 9.98627E-06
Guam_EF_AllP
op 1 2016 1 5 18
7803003
02 3 1 21
1 0 3 2 81.2 68.6 0.471862
Guam_EF_AllP
op 1 2016 1 5 18
7803003
02 3 15 21
1 0 3 2 81.2 68.6 9.43725E-06
Guam_EF_AllP
op 1 2016 1 5 19
7803003
02 3 1 21
1 0 3 2 78.8 72.5 0.431142
Guam_EF_AllP
op 1 2016 1 5 19
7803003
02 3 15 21
1 0 3 2 78.8 72.5 8.62282E-06
Guam_EF_AllP
op 1 2016 1 5 20
7803003
02 3 1 21
1 0 3 2 76.9 76.1 0.369763
Guam_EF_AllP
op 1 2016 1 5 20
7803003
02 3 15 21
1 0 3 2 76.9 76.1 7.39527E-06
Guam_EF_AllP
op 1 2016 1 5 21
7803003
02 3 1 21
1 0 3 2 76.2 77.4 0.360086
Guam_EF_AllP
op 1 2016 1 5 21
7803003
02 3 15 21
1 0 3 2 76.2 77.4 7.20174E-06
Guam_EF_AllP
op 1 2016 1 5 22
7803003
02 3 1 21
1 0 3 2 75.5 78.6 0.350461
Guam_EF_AllP
op 1 2016 1 5 22
7803003
02 3 15 21
1 0 3 2 75.5 78.6 7.00919E-06
CJMT EIS/OEIS Appendix G
April 2015 Draft Air Quality
G-50
CJMT MOVES Output
MOVESScenari
oID
MOVESRu
nID
yearI
D
month
ID
dayI
D
hourI
D linkID
pollutant
ID
process
ID
sourceTyp
eID
SC
C
fuelType
ID
modelYea
rID
roadType
ID
avgSpeedBi
nID
temperat
ure
relHumid
ity
ratePerDista
nce
Guam_EF_AllP
op 1 2016 1 5 23
7803003
02 3 1 21
1 0 3 2 74.9 79.7 0.341924
Guam_EF_AllP
op 1 2016 1 5 23
7803003
02 3 15 21
1 0 3 2 74.9 79.7 6.83847E-06
Guam_EF_AllP
op 1 2016 1 5 24
7803003
02 3 1 21
1 0 3 2 74.4 80.5 0.334931
Guam_EF_AllP
op 1 2016 1 5 24
7803003
02 3 15 21
1 0 3 2 74.4 80.5 6.69863E-06

CJMT EIS/OEIS Appendix G
April 2015 Draft Air Quality
G-51
Attachment 2 - Construction Emissions Estimate

CJMT EIS/OEIS Appendix G
April 2015 Draft Air Quality
G-52
CJMT Construction Emissions
Total Construction Equipment Emissions – Tinian Alternative 1
Tinian Alternative 1
Equipment Type Number of Units
Days Hours Horsepower
(hp)
Load Factor
(%)
Emission Factor (grams/hp-hour)
Emission Rate (tons)
SO2 CO PM10 PM2.5 NOx VOC CO2 SO2 CO PM10 PM2.5 NOx VOC CO2
Construction Equipment Emissions
Asphalt paver, 130 HP 1 377 3016 130 59 0.12 1.60 0.33 0.32 4.54 0.37 536.21 0.03 0.41 0.08 0.08 1.16 0.09 136.61
Backhoe loader, 48hp 1 6759 54072 48 21 0.15 6.20 1.00 0.97 5.75 1.49 692.19 0.09 3.72 0.60 0.58 3.45 0.90 415.50
Chain saws, 36" 1 3066 24528 7 70 0.14 349.18 9.76 8.98 0.91 70.10 686.61 0.02 44.96 1.26 1.16 0.12 9.03 88.42
Chipping machine 1 1533 12264 144 43 0.12 2.46 0.45 0.43 5.98 0.59 550.61 0.10 2.05 0.37 0.36 5.00 0.49 460.15
Compressor, 250 cfm 1 238 1904 90 43 0.13 2.63 0.38 0.37 4.01 0.32 589.94 0.01 0.21 0.03 0.03 0.33 0.03 47.87
Concrete pump, small 1 121 968 53 43 0.12 3.03 0.57 0.56 6.18 0.75 567.14 0.00 0.07 0.01 0.01 0.15 0.02 13.71
Crane, 90-ton 1 242 1936 225 43 0.11 0.94 0.21 0.20 4.69 0.33 530.54 0.02 0.19 0.04 0.04 0.97 0.07 109.44
Crane, hydraulic, 33 ton 1 48 384 315 43 0.11 1.55 0.25 0.25 5.59 0.34 530.50 0.01 0.09 0.01 0.01 0.32 0.02 30.39
Crane, SP, 12 ton 1 5540 44320 175 43 0.11 0.94 0.21 0.20 4.69 0.33 530.54 0.42 3.46 0.77 0.75 17.23 1.21 1948.67
Crane, SP, 5 ton 1 1693 13544 175 43 0.11 0.94 0.21 0.20 4.69 0.33 530.54 0.13 1.06 0.24 0.23 5.26 0.37 595.51
Crane, 40 ton 1 10 80 282 43 0.11 0.94 0.21 0.20 4.69 0.33 530.54 0.00 0.01 0.00 0.00 0.05 0.00 5.67
Vibratory hammer and generator 1 10 80 503 59 0.12 2.75 0.39 0.37 5.60 0.42 537.08 0.00 0.07 0.01 0.01 0.15 0.01 14.04
Diesel hammer, 41k ft-lb 1 101 808 329 59 0.12 2.75 0.39 0.37 5.60 0.42 537.08 0.02 0.47 0.07 0.06 0.97 0.07 92.66
Dozer, 300 HP 1 263 2104 300 59 0.12 1.93 0.30 0.29 4.72 0.33 539.34 0.05 0.79 0.12 0.12 1.94 0.13 221.21
Front end loader, 1.5 cy, 1 263 2104 243 59 0.12 2.09 0.33 0.32 5.05 0.37 539.44 0.04 0.69 0.11 0.11 1.67 0.12 178.88
Front end loader, TM, 2.5cy 1 1533 12264 243 59 0.12 2.09 0.33 0.32 5.05 0.37 539.44 0.22 4.05 0.64 0.62 9.75 0.71 1042.67
Gas engine vibrator 1 242 1936 2 55 0.22 291.97 7.64 7.03 1.42 57.01 1053.35 0.00 0.56 0.01 0.01 0.00 0.11 2.04
Gas welding machine 1 68 544 17 68 0.21 642.74 0.11 0.10 3.24 11.35 996.20 0.00 4.53 0.00 0.00 0.02 0.08 7.02
Grader, 30,000 lb 1 3609 28872 204 59 0.12 1.45 0.28 0.27 4.26 0.32 537.25 0.44 5.57 1.07 1.03 16.33 1.22 2060.36
Pneumatic wheel roller 1 377 3016 99 59 0.16 2.37 0.24 0.23 4.70 0.37 559.00 0.03 0.46 0.05 0.05 0.91 0.07 108.45
Roller, vibratory 1 263 2104 92 59 0.12 2.49 0.41 0.40 4.77 0.42 558.97 0.02 0.31 0.05 0.05 0.60 0.05 70.51
Rollers, steel wheel 1 278 2224 92 59 0.12 2.49 0.41 0.40 4.77 0.42 558.97 0.02 0.33 0.05 0.05 0.64 0.06 74.53
Tandem roller, 10 ton 1 238 1904 70 59 0.12 2.64 0.44 0.42 5.00 0.47 555.84 0.01 0.23 0.04 0.04 0.43 0.04 47.84
Total Emissions 1.68 74.32 5.65 5.42 67.44 14.91 7772.14
CJMT EIS/OEIS Appendix G
April 2015 Draft Air Quality
G-53
Total Construction Equipment Emissions – Tinian Alternative 2
Tinian Alternative 2
Equipment Type Number of Units
Days Hours Horsepower
(hp)
Load Factor
(%)
Emission Factor (grams/hp-hour)
Emission Rate (tons)
SO2 CO PM10 PM2.5 NOx VOC CO2 SO2 CO PM10 PM2.5 NOx VOC CO2
Construction Equipment Emissions
Asphalt paver, 130 HP 1 377 3016 130 59 0.12 1.60 0.33 0.32 4.54 0.37 536.21 0.03 0.41 0.08 0.08 1.16 0.09 136.61
Backhoe loader, 48hp 1 6759 54072 48 21 0.15 6.20 1.00 0.97 5.75 1.49 692.19 0.09 3.72 0.60 0.58 3.45 0.90 415.50
Chain saws, 36" 1 3158 25264 7 70 0.14 349.18 9.76 8.98 0.91 70.10 686.61 0.02 46.31 1.29 1.19 0.12 9.30 91.07
Chipping machine 1 1579 12632 144 43 0.12 2.46 0.45 0.43 5.98 0.59 550.61 0.10 2.12 0.39 0.37 5.15 0.51 473.96
Compressor, 250 cfm 1 255 2040 90 43 0.13 2.63 0.38 0.37 4.01 0.32 589.94 0.01 0.23 0.03 0.03 0.35 0.03 51.29
Concrete pump, small 1 126 1008 53 43 0.12 3.03 0.57 0.56 6.18 0.75 567.14 0.00 0.08 0.01 0.01 0.16 0.02 14.28
Crane, 90-tons 1 244 1952 225 43 0.11 0.94 0.21 0.20 4.69 0.33 530.54 0.02 0.20 0.04 0.04 0.98 0.07 110.35
Crane, hydraulic, 33 ton 1 48 384 315 43 0.11 1.55 0.25 0.25 5.59 0.34 530.50 0.01 0.09 0.01 0.01 0.32 0.02 30.39
Crane, SP, 12 ton 1 5540 44320 175 43 0.11 0.94 0.21 0.20 4.69 0.33 530.54 0.42 3.46 0.77 0.75 17.23 1.21 1948.67
Crane, SP, 5 ton 1 1693 13544 175 43 0.11 0.94 0.21 0.20 4.69 0.33 530.54 0.13 1.06 0.24 0.23 5.26 0.37 595.51
Crane, 40 ton 1 10 80 282 43 0.11 0.94 0.21 0.20 4.69 0.33 530.54 0.00 0.01 0.00 0.00 0.05 0.00 5.67
Vibratory hammer and generator 1 10 80 503 59 0.12 2.75 0.39 0.37 5.60 0.42 537.08 0.00 0.07 0.01 0.01 0.15 0.01 14.04
Diesel hammer, 41k ft-lb 1 101 808 329 59 0.12 2.75 0.39 0.37 5.60 0.42 537.08 0.02 0.47 0.07 0.06 0.97 0.07 92.66
Dozer, 300 HP 1 263 2104 300 59 0.12 1.93 0.30 0.29 4.72 0.33 539.34 0.05 0.79 0.12 0.12 1.94 0.13 221.21
Front end loader, 1.5 cy 1 263 2104 243 59 0.12 2.09 0.33 0.32 5.05 0.37 539.44 0.04 0.69 0.11 0.11 1.67 0.12 178.88
Front end loader, TM, 2.5cy 1 1579 12632 243 59 0.12 2.09 0.33 0.32 5.05 0.37 539.44 0.23 4.17 0.66 0.64 10.05 0.73 1073.96
Gas engine vibrator 1 252 2016 2 55 0.22 291.97 7.64 7.03 1.42 57.01 1053.35 0.00 0.59 0.02 0.01 0.00 0.11 2.12
Gas welding machine 1 72 576 17 68 0.21 642.74 0.11 0.10 3.24 11.35 996.20 0.00 4.80 0.00 0.00 0.02 0.08 7.43
Gradder, 30000 lb 1 3697 29576 204 59 0.12 1.45 0.28 0.27 4.26 0.32 537.25 0.45 5.71 1.09 1.06 16.73 1.25 2110.59
Pneumatic wheel roller 1 377 3016 99 59 0.18 2.37 0.24 0.23 4.70 0.37 559.00 0.04 0.46 0.05 0.05 0.91 0.07 108.45
Vibratory roller 1 263 2104 92 59 0.12 2.49 0.41 0.40 4.77 0.42 558.97 0.02 0.31 0.05 0.05 0.60 0.05 70.51
Rollers, steel wheel 1 278 2224 92 59 0.12 2.49 0.41 0.40 4.77 0.42 558.97 0.02 0.33 0.05 0.05 0.64 0.06 74.53
Tandem roller, 10 ton 1 238 1904 70 59 0.12 2.64 0.44 0.42 5.00 0.47 555.84 0.01 0.23 0.04 0.04 0.43 0.04 47.84
Total Emissions 1.70 76.30 5.75 5.51 68.33 15.26 7875.52

CJMT EIS/OEIS Appendix G
April 2015 Draft Air Quality
G-54
Total Construction Equipment Emissions – Tinian Alternative 3
Tinian Alternative 3
Equipment Type Number of Units
Days Hours Horsepower
(hp)
Load Factor
(%)
Emission Factor (grams/hp-hour)
Emission Rate (tons)
SO2 CO PM10 PM2.5 NOx VOC CO2 SO2 CO PM10 PM2.5 NOx VOC CO2
Construction Equipment Emissions
Asphalt paver, 130 HP 1 377 3016 130 59 0.12 1.60 0.33 0.32 4.54 0.37 536.21 0.03 0.41 0.08 0.08 1.16 0.09 136.61
Backhoe loader, 48hp 1 6759 54072 48 21 0.15 6.20 1.00 0.97 5.75 1.49 692.19 0.09 3.72 0.60 0.58 3.45 0.90 415.50
Chain saws, 36" 1 3092 24736 7 70 0.14 349.18 9.76 8.98 0.91 70.10 686.61 0.02 45.35 1.27 1.17 0.12 9.10 89.17
Chipping machine 1 1546 12368 144 43 0.12 2.46 0.45 0.43 5.98 0.59 550.61 0.10 2.07 0.38 0.37 5.04 0.50 464.05
Compressor, 250 cfm 1 238 1904 90 43 0.13 2.63 0.38 0.37 4.01 0.32 589.94 0.01 0.21 0.03 0.03 0.33 0.03 47.87
Concrete pump, small 1 121 968 53 43 0.12 3.03 0.57 0.56 6.18 0.75 567.14 0.00 0.07 0.01 0.01 0.15 0.02 13.71
Crane, 90-ton 1 242 1936 225 43 0.11 0.94 0.21 0.20 4.69 0.33 530.54 0.02 0.19 0.04 0.04 0.97 0.07 109.44
Crane, hydraulic, 33 ton 1 48 384 315 43 0.11 1.55 0.25 0.25 5.59 0.34 530.50 0.01 0.09 0.01 0.01 0.32 0.02 30.39
Crane, SP, 12 ton 1 5540 44320 175 43 0.11 0.94 0.21 0.20 4.69 0.33 530.54 0.42 3.46 0.77 0.75 17.23 1.21 1948.67
Crane, SP, 5 ton 1 1693 13544 175 43 0.11 0.94 0.21 0.20 4.69 0.33 530.54 0.13 1.06 0.24 0.23 5.26 0.37 595.51
Crane, 40 ton 1 10 80 282 43 0.11 0.94 0.21 0.20 4.69 0.33 530.54 0.00 0.01 0.00 0.00 0.05 0.00 5.67
Vibratory hammer and generator 1 10 80 503 59 0.12 2.75 0.39 0.37 5.60 0.42 537.08 0.00 0.07 0.01 0.01 0.15 0.01 14.04
Diesel hammer, 41k ft-lb 1 101 808 329 59 0.12 2.75 0.39 0.37 5.60 0.42 537.08 0.02 0.47 0.07 0.06 0.97 0.07 92.66
Dozer, 300 HP 1 263 2104 300 59 0.12 1.93 0.30 0.29 4.72 0.33 539.34 0.05 0.79 0.12 0.12 1.94 0.13 221.21
Front end loader, 1.5 cy 1 263 2104 243 59 0.12 2.09 0.33 0.32 5.05 0.37 539.44 0.04 0.69 0.11 0.11 1.67 0.12 178.88
Front end loader, TM, 2.5cy 1 1546 12368 243 59 0.12 2.09 0.33 0.32 5.05 0.37 539.44 0.23 4.08 0.64 0.62 9.84 0.71 1051.51
Gas engine vibrator 1 242 1936 2 55 0.22 291.97 7.64 7.03 1.42 57.01 1053.35 0.00 0.56 0.01 0.01 0.00 0.11 2.04
Gas welding machine 1 68 544 17 68 0.21 642.74 0.11 0.10 3.24 11.35 996.20 0.00 4.53 0.00 0.00 0.02 0.08 7.02
Grader, 30,000 lb 1 3634 29072 204 59 0.12 1.45 0.28 0.27 4.26 0.32 537.25 0.45 5.61 1.07 1.04 16.45 1.23 2074.63
Pneumatic wheel roller 1 377 3016 99 59 0.18 2.37 0.24 0.23 4.70 0.37 559.00 0.04 0.46 0.05 0.05 0.91 0.07 108.45
Roller, vibratory 1 263 2104 92.3 59 0.12 2.49 0.41 0.40 4.77 0.42 558.97 0.02 0.31 0.05 0.05 0.60 0.05 70.51
Rollers, steel wheel 1 278 2224 92 59 0.12 2.49 0.41 0.40 4.77 0.42 558.97 0.02 0.33 0.05 0.05 0.64 0.06 74.53
Tandem roller, 10 ton 1 238 1904 70 59 0.12 2.64 0.44 0.42 5.00 0.47 555.84 0.01 0.23 0.04 0.04 0.43 0.04 47.84
Total Emissions 1.69 74.80 5.68 5.44 67.68 15.01 7799.91

CJMT EIS/OEIS Appendix G
April 2015 Draft Air Quality
G-55
Total Construction Equipment Emissions – Pagan Alternative 1
Pagan Alternative 1
Equipment Type Number of Units
Days Hours Horsepower
(hp)
Load Factor
(%)
Emission Factor (grams/hp-hour)
Emission Rate (tons)
SO2 CO PM10 PM2.5 NOx VOC CO2 SO2 CO PM10 PM2.5 NOx VOC CO2
Construction Equipment Emissions
Asphalt paver, 130 HP 1 19 152 130 59 0.12 1.60 0.33 0.32 4.54 0.37 536.21 0.00 0.02 0.00 0.00 0.06 0.00 6.88
Chain saws, 36" 1 1234 9872 7 70 0.14 349.18 9.76 8.98 0.91 70.10 686.61 0.01 18.10 0.51 0.47 0.05 3.63 35.59
Chipping machine 1 617 4936 144 43 0.12 2.46 0.45 0.43 5.98 0.59 550.61 0.04 0.83 0.15 0.15 2.01 0.20 185.20
Crane, hydraulic, 33 ton 1 2 16 315 43 0.11 1.55 0.25 0.25 5.59 0.34 530.50 0.00 0.00 0.00 0.00 0.01 0.00 1.27
Dozer, 300 HP 1 11 88 300 59 0.12 1.93 0.30 0.29 4.72 0.33 539.34 0.00 0.03 0.01 0.00 0.08 0.01 9.25
Front end loader, 1.5 cy 1 11 88 243 59 0.12 2.09 0.33 0.32 5.05 0.37 539.44 0.00 0.03 0.00 0.00 0.07 0.01 7.48
Front end loader, TM, 2.5cy 1 617 4936 243 59 0.12 2.09 0.33 0.32 5.05 0.37 539.44 0.09 1.63 0.26 0.25 3.93 0.28 419.65
Grader, 30,000 lb 1 1220 9760 204 59 0.12 1.45 0.28 0.27 4.26 0.32 537.25 0.15 1.88 0.36 0.35 5.52 0.41 696.49
Pneumatic wheel roller 1 19 152 99 59 0.16 2.37 0.24 0.23 4.70 0.37 559.00 0.00 0.02 0.00 0.00 0.05 0.00 5.47
Roller, vibratory 1 11 88 92 59 0.12 2.49 0.41 0.40 4.77 0.42 558.97 0.00 0.01 0.00 0.00 0.03 0.00 2.95
Rollers, steel wheel 1 14 112 92 59 0.12 2.49 0.41 0.40 4.77 0.42 558.97 0.00 0.02 0.00 0.00 0.03 0.00 3.75
Tandem roller, 10 ton 1 12 96 70 59 0.12 2.64 0.44 0.42 5.00 0.47 555.84 0.00 0.01 0.00 0.00 0.02 0.00 2.41
Total Emissions 0.30 22.59 1.30 1.23 11.85 4.56 1376.40

CJMT EIS/OEIS Appendix G
April 2015 Draft Air Quality
G-56
Total Construction Equipment Emissions – Pagan Alternative 2
Pagan Alternative 2
Equipment Type Number of Units
Days Hours Horsepower
(hp)
Load Factor
(%)
Emission Factor (grams/hp-hour)
Emission Rate (tons)
SO2 CO PM10 PM2.5 NOx VOC CO2 SO2 CO PM10 PM2.5 NOx VOC CO2
Construction Equipment Emissions
Asphalt paver, 130 HP 1 19 152 130 59 0.12 1.60 0.33 0.32 4.54 0.37 536.21 0.00 0.02 0.00 0.00 0.06 0.00 6.88
Chain saws, 36" 1 900 7200 7 70 0.14 349.18 9.76 8.98 0.91 70.10 686.61 0.01 13.20 0.37 0.34 0.03 2.65 25.95
Chipping machine 1 450 3600 144 43 0.12 2.46 0.45 0.43 5.98 0.59 550.61 0.03 0.60 0.11 0.11 1.47 0.15 135.07
Crane, hydraulic, 33 ton 1 2 16 315 43 0.11 1.55 0.25 0.25 5.59 0.34 530.50 0.00 0.00 0.00 0.00 0.01 0.00 1.27
Dozer, 300 HP 1 11 88 282 43 0.11 0.94 0.21 0.20 4.69 0.33 530.54 0.00 0.01 0.00 0.00 0.06 0.00 6.23
Front end loader, 1.5 cy 1 11 88 243 59 0.12 2.09 0.33 0.32 5.05 0.37 539.44 0.00 0.03 0.00 0.00 0.07 0.01 7.48
Front end loader, TM, 2.5cy 1 450 3600 243 59 0.12 2.09 0.33 0.32 5.05 0.37 539.44 0.07 1.19 0.19 0.18 2.86 0.21 306.07
Grader, 30,000 lb 1 899 7192 204 59 0.12 1.45 0.28 0.27 4.26 0.32 537.25 0.11 1.39 0.27 0.26 4.07 0.30 513.23
Pneumatic wheel roller 1 19 152 99 59 0.16 2.37 0.24 0.23 4.70 0.37 559.00 0.00 0.02 0.00 0.00 0.05 0.00 5.47
Roller, vibratory 1 11 88 92 59 0.12 2.49 0.41 0.40 4.77 0.42 558.97 0.00 0.01 0.00 0.00 0.03 0.00 2.95
Rollers, steel wheel 1 14 112 92 59 0.12 2.49 0.41 0.40 4.77 0.42 558.97 0.00 0.02 0.00 0.00 0.03 0.00 3.75
Tandem roller, 10 ton 1 12 96 70 59 0.12 2.64 0.44 0.42 5.00 0.47 555.84 0.00 0.01 0.00 0.00 0.02 0.00 2.41
Total Emissions 0.22 16.51 0.95 0.91 8.75 3.33 1016.78

CJMT EIS/OEIS Appendix G
April 2015 Draft Air Quality
G-57
Total Construction Vehicle Emissions – Tinian Alternative 1
On Site Vehicle Emission
Emission Factor (lb/hr) Emissions (tons)
Days Total
Hours SO2 CO PM10 PM2.5 NOX VOC CO2 SO2 CO PM10 PM2.5 NOX VOC CO2
On Site Vehicle1
Trucks 526 8 0.00 0.07 0.02 0.01 0.15 0.02 60.71 0.00 0.14 0.05 0.03 0.32 0.04 127.74
Off Site Vehicle Emission
Emission Factor (lb/Miles) Emissions (tons)
Number of
Units
Total
Miles SO2 CO PM10 PM2.5 NOX VOC CO2 SO2 CO PM10 PM2.5 NOX VOC CO2
Off Site Vehicle2
Trucks 36510 20 0.00 0.00 0.00 0.00 0.01 0.00 5.70 0.01 1.51 0.45 0.36 4.60 0.26 2080.56
Cars 109186 20 0.00 0.01 0.00 0.00 0.00 0.00 0.81 0.02 7.27 0.07 0.03 0.45 0.17 887.69
Total motor vehicle emissions 0.03 8.93 0.58 0.41 5.37 0.46 3095.99
Assumption
1. Onsite vehicles speed: 5 mph
2. Offsite vehicles speed: 30 mph
3. Roadway type: Rural unrestricted
4. Offsite trucks includes material delivery trucks and dump trucks running 20 miles round trip
5. Offsite passenger cars are running 20 miles round trip
6. Onsite trucks includes water trucks and tractor trucks, running 8 hours per day

CJMT EIS/OEIS Appendix G
April 2015 Draft Air Quality
G-58
Total Construction Vehicle Emissions – Tinian Alternative 2
On Site Vehicle Emission
Emission Factor (lb/hr) Emissions (tons)
Days Total
Hours SO2 CO PM10 PM2.5 NOX VOC CO2 SO2 CO PM10 PM2.5 NOX VOC CO2
On Site Vehicle1
Trucks 526 8 0.00 0.07 0.02 0.01 0.15 0.02 60.71 0.00 0.14 0.05 0.03 0.32 0.04 127.74
Off Site Vehicle Emission
Emission Factor (lb/Miles) Emissions (tons)
Days Total
Miles SO2 CO PM10 PM2.5 NOX VOC CO2 SO2 CO PM10 PM2.5 NOX VOC CO2
Off Site Vehicle2
Trucks 36898 20 0.00 0.00 0.00 0.00 0.01 0.00 5.70 0.01 1.53 0.46 0.37 4.65 0.26 2102.67
Cars 111439 20 0.00 0.01 0.00 0.00 0.00 0.00 0.81 0.02 7.42 0.08 0.03 0.46 0.17 906.01
Total motor vehicle emissions 0.03 9.09 0.58 0.42 5.43 0.47 3136.41
Assumption
1. Onsite vehicles speed: 5 mph
2. Offsite vehicles speed: 30 mph
3. Roadway type: Rural unrestricted
4. Offsite trucks includes material delivery trucks and dump trucks running 20 miles round trip
5. Offsite passenger cars are running 20 miles round trip
6. Onsite trucks includes water trucks and tractor trucks, running 8 hours per day

CJMT EIS/OEIS Appendix G
April 2015 Draft Air Quality
G-59
Total Construction Vehicle Emissions – Tinian Alternative 3
On Site Vehicle Emission
Emission Factor (lb/hr) Emissions (tons)
Days Total
Hours SO2 CO PM10 PM2.5 NOX VOC CO2 SO2 CO PM10 PM2.5 NOX VOC CO2
On Site Vehicle1
Trucks 526 8 0.00 0.07 0.02 0.01 0.15 0.02 60.71 0.00 0.14 0.05 0.03 0.32 0.04 127.74
Off Site Vehicle Emission
Emission Factor (lb/Miles) Emissions (tons)
Days Total
Miles SO2 CO PM10 PM2.5 NOX VOC CO2 SO2 CO PM10 PM2.5 NOX VOC CO2
Off Site Vehicle2
Trucks 36523 20 0.00 0.00 0.00 0.00 0.01 0.00 5.70 0.01 1.51 0.45 0.36 4.61 0.26 2081.30
Cars 109314 20 0.00 0.01 0.00 0.00 0.00 0.00 0.81 0.02 7.28 0.07 0.03 0.45 0.17 888.73
Total motor vehicle emissions 0.03 8.94 0.58 0.41 5.37 0.46 3097.77
Assumption
1. Onsite vehicles speed: 5 mph
2. Offsite vehicles speed: 30 mph
3. Roadway type: Rural unrestricted
4. Offsite trucks includes material delivery trucks and dump trucks running 20 miles round trip
5. Offsite passenger cars are running 20 miles round trip
6. Onsite trucks includes water trucks and tractor trucks, running 8 hours per day

CJMT EIS/OEIS Appendix G
April 2015 Draft Air Quality
G-60
Total Construction Vehicle Emissions – Pagan Alternative 1
On Site Vehicle Emission
Emission Factor (lb/hr) Emissions (tons)
Days Total
Hours SO2 CO PM10 PM2.5 NOX VOC CO2 SO2 CO PM10 PM2.5 NOX VOC CO2
On Site Vehicle1
Trucks 22 8 0.00 0.07 0.02 0.01 0.15 0.02 60.71 0.00 0.01 0.00 0.00 0.01 0.00 5.34
Off Site Vehicle Emission
Emission Factor (lb/Miles) Emissions (tons)
Days Total
Miles SO2 CO PM10 PM2.5 NOX VOC CO2 SO2 CO PM10 PM2.5 NOX VOC CO2
Off Site Vehicle2
Trucks 769 20 0.00 0.00 0.00 0.00 0.01 0.00 5.70 0.00 0.03 0.01 0.01 0.10 0.01 43.82
Cars 6466 20 0.00 0.01 0.00 0.00 0.00 0.00 0.81 0.00 0.43 0.00 0.00 0.03 0.01 52.57
Total motor vehicle emissions 0.00 0.47 0.02 0.01 0.14 0.02 101.73
Assumption
1. Onsite vehicles speed: 5 mph
2. Offsite vehicles speed: 30 mph
3. Roadway type: Rural unrestricted
4. Offsite trucks includes material delivery trucks and dump trucks running 20 miles round trip
5. Offsite passenger cars are running 20 miles round trip
6. Onsite trucks includes water trucks and tractor trucks, running 8 hours per day

CJMT EIS/OEIS Appendix G
April 2015 Draft Air Quality
G-61
Total Construction Vehicle Emissions – Pagan Alternative 2
On Site Vehicle Emission
Emission Factor (lb/hr) Emissions (tons)
Days Total
Hours SO2 CO PM10 PM2.5 NOX VOC CO2 SO2 CO PM10 PM2.5 NOX VOC CO2
On Site Vehicle1
Trucks 22 8 0.00 0.07 0.02 0.01 0.15 0.02 60.71 0.00 0.01 0.00 0.00 0.01 0.00 5.34
Off Site Vehicle Emission
Emission Factor (lb/Miles) Emissions (tons)
Days Total
Miles SO2 CO PM10 PM2.5 NOX VOC CO2 SO2 CO PM10 PM2.5 NOX VOC CO2
Off Site Vehicle2
Trucks 602 20 0.00 0.00 0.00 0.00 0.01 0.00 5.70 0.00 0.02 0.01 0.01 0.08 0.00 34.31
Cars 4822 20 0.00 0.01 0.00 0.00 0.00 0.00 0.81 0.00 0.32 0.00 0.00 0.02 0.01 39.20
Total motor vehicle emissions 0.00 0.35 0.01 0.01 0.11 0.01 78.85
Assumption
1. Onsite vehicles speed: 5 mph
2. Offsite vehicles speed: 30 mph
3. Roadway type: Rural unrestricted
4. Offsite trucks includes material delivery trucks and dump trucks running 20 miles round trip
5. Offsite passenger cars are running 20 miles round trip
6. Onsite trucks includes water trucks and tractor trucks, running 8 hours per day

CJMT EIS/OEIS Appendix G
April 2015 Draft Air Quality
G-62
Annual Construction Emissions – Tinian Alternative 1
Construction
Year
Pollutant (tpy)
SO2 CO PM10 PM2.5 NOx VOC CO2
1 0.19 9.25 0.69 0.65 8.09 1.71 1207.57
2 0.19 9.25 0.69 0.65 8.09 1.71 1207.57
3 0.19 9.25 0.69 0.65 8.09 1.71 1207.57
4 0.19 9.25 0.69 0.65 8.09 1.71 1207.57
5 0.19 9.25 0.69 0.65 8.09 1.71 1207.57
6 0.19 9.25 0.69 0.65 8.09 1.71 1207.57
7 0.19 9.25 0.69 0.65 8.09 1.71 1207.57
8 0.19 9.25 0.69 0.65 8.09 1.71 1207.57
9 0.19 9.25 0.69 0.65 8.09 1.71 1207.57
Legend: CO = carbon monoxide; CO2 = carbon dioxide; NOx = nitrogen oxides; PM10 = particulate matter with an aerodynamic
diameter of less than or equal to a nominal 10 micrometers; PM2.5 = particulate matter with an aerodynamic diameter of less
than or equal to a nominal 2.5 micrometers; SO2 = sulfur dioxide; VOC = volatile organic compound.
Annual Construction Emissions – Tinian Alternative 2
Construction
Year
Pollutant (tpy)
SO2 CO PM10 PM2.5 NOx VOC CO2
1 0.19 9.49 0.70 0.66 8.20 1.75 1223.55
2 0.19 9.49 0.70 0.66 8.20 1.75 1223.55
3 0.19 9.49 0.70 0.66 8.20 1.75 1223.55
4 0.19 9.49 0.70 0.66 8.20 1.75 1223.55
5 0.19 9.49 0.70 0.66 8.20 1.75 1223.55
6 0.19 9.49 0.70 0.66 8.20 1.75 1223.55
7 0.19 9.49 0.70 0.66 8.20 1.75 1223.55
8 0.19 9.49 0.70 0.66 8.20 1.75 1223.55
9 0.19 9.49 0.70 0.66 8.20 1.75 1223.55
Legend: CO = carbon monoxide; CO2 = carbon dioxide; NOx = nitrogen oxides; PM10 = particulate matter with an aerodynamic
diameter of less than or equal to a nominal 10 micrometers; PM2.5 = particulate matter with an aerodynamic diameter of less
than or equal to a nominal 2.5 micrometers; SO2 = sulfur dioxide; VOC = volatile organic compound.

CJMT EIS/OEIS Appendix G
April 2015 Draft Air Quality
G-63
Annual Construction Emissions – Tinian Alternative 3
Construction
Year
Pollutant (tpy)
SO2 CO PM10 PM2.5 NOx VOC CO2
1 0.19 9.30 0.69 0.65 8.12 1.72 1210.85
2 0.19 9.30 0.69 0.65 8.12 1.72 1210.85
3 0.19 9.30 0.69 0.65 8.12 1.72 1210.85
4 0.19 9.30 0.69 0.65 8.12 1.72 1210.85
5 0.19 9.30 0.69 0.65 8.12 1.72 1210.85
6 0.19 9.30 0.69 0.65 8.12 1.72 1210.85
7 0.19 9.30 0.69 0.65 8.12 1.72 1210.85
8 0.19 9.30 0.69 0.65 8.12 1.72 1210.85
9 0.19 9.30 0.69 0.65 8.12 1.72 1210.85
Legend: CO = carbon monoxide; CO2 = carbon dioxide; NOx = nitrogen oxides; PM10 = particulate matter with an aerodynamic
diameter of less than or equal to a nominal 10 micrometers; PM2.5 = particulate matter with an aerodynamic diameter of less
than or equal to a nominal 2.5 micrometers; SO2 = sulfur dioxide; VOC = volatile organic compound.
Annual Construction Emissions – Pagan Alternative 1
Construction
Year
Pollutant (tpy)
SO2 CO PM10 PM2.5 NOx VOC CO2
3 0.07 5.76 0.33 0.31 3.00 1.14 369.53
4 0.07 5.76 0.33 0.31 3.00 1.14 369.53
5 0.07 5.76 0.33 0.31 3.00 1.14 369.53
6 0.07 5.76 0.33 0.31 3.00 1.14 369.53
Legend: CO = carbon monoxide; CO2 = carbon dioxide; NOx = nitrogen oxides; PM10 = particulate matter with an aerodynamic
diameter of less than or equal to a nominal 10 micrometers; PM2.5 = particulate matter with an aerodynamic diameter of less
than or equal to a nominal 2.5 micrometers; SO2 = sulfur dioxide; VOC = volatile organic compound.

CJMT EIS/OEIS Appendix G
April 2015 Draft Air Quality
G-64
Annual Construction Emissions – Pagan Alternative 2
Construction
Year
Pollutant (tpy)
SO2 CO PM10 PM2.5 NOx VOC CO2
3 0.05 4.21 0.24 0.23 2.22 0.84 273.91
4 0.05 4.21 0.24 0.23 2.22 0.84 273.91
5 0.05 4.21 0.24 0.23 2.22 0.84 273.91
6 0.05 4.21 0.24 0.23 2.22 0.84 273.91
Legend: CO = carbon monoxide; CO2 = carbon dioxide; NOx = nitrogen oxides; PM10 = particulate matter with an aerodynamic
diameter of less than or equal to a nominal 10 micrometers; PM2.5 = particulate matter with an aerodynamic diameter of
less than or equal to a nominal 2.5 micrometers; SO2 = sulfur dioxide; VOC = volatile organic compound.

CJMT EIS/OEIS Appendix G
April 2015 Draft Air Quality
G-65
Attachment 3 - Aircraft Emissions Estimate

CJMT EIS/OEIS Appendix G
April 2015 Draft Air Quality
G-66
CJMT Airfield Emissions
Aircrafts, LTO and Operation at Tinian
Aircraft
Type
Pounds per LTO / Operation
Model Percentage Operation Mode CO CO2 NOx VOC SO2 PM10 or
PM2.5
Transport Tilt-rotor MV-22 100
Vertical Takeoff (Conversion mode) 2.45 2578.9 6.79 0.04 0.32 1.13
Short Takeoff (Airplane mode) 2.37 2216.1 5.38 0.03 0.28 0.95
Short Landing (Airplane mode) 2.96 1934.8 3.87 0.05 0.24 0.78
Vertical Landing (Conversion mode) 2.96 1934.8 3.87 0.05 0.24 0.78
Landing w/ Break (Airplane mode) 3.07 2498.7 6.13 0.05 0.31 1.06
Transport Rotary Wing CH-53E 100 LTO 22.9 - 8.9 11.2 0.7 3.8
Attack Helo AH-1Y 50 LTO (AH-1W) 7.08 852.02 2.09 0.33 0.17 1.8
UH-1Z 50 LTO (UH-1N) 3.32 893.27 1.28 0.67 0.11 1.18
Transport Fixed Wing
KC-130 50 Single KC-130 LTO with Straight In Arrival 14.8 7570 17.35 7.65 0.95 9.03
Single KC-130 LTO with Break at Arrival 13.8 7896 19.17 7.39 0.99 9.42
C-17 50
Idle (Taxi) 23.53 3371.76 3.90 0.38 1.10 11.06
Approach 0.81 5136.61 24.46 0.08 1.67 8.73
Takeoff 0.12 1206.01 12.99 0.00 0.39 0.02
Unmanned RQ-7 100 no info - - - - - -
Fight Jet (not including
FCLP)*
FA-18C/D* 25
APU Use 0.03 52.04 0.10 0.00 0.03 0.00
Start/Warm up 42.85 857.06 0.36 18.15 0.64 4.30
Unstick(s) per Dep: 1 0.71 46.11 0.05 0.09 0.03 0.15
Taxi Out 14.28 285.69 0.12 6.05 0.21 1.43
Engine Run-up 0.39 126.02 0.19 0.04 0.08 0.33
Takeoff 12.24 1652.79 4.88 0.07 1.09 -
Climbout 0.35 1031.59 6.41 0.10 0.67 1.10
Approach to Break 0.27 676.65 2.35 0.07 0.44 1.02
Break 1.68 38.24 0.03 0.60 0.03 0.17
On Runway (WonW) 2.86 57.14 0.02 1.21 0.04 0.29
Unstick(s) per Arr: 1 0.71 46.11 0.05 0.09 0.03 0.15
Taxi In 22.85 457.10 0.19 9.68 0.34 2.29
Hot Refuel %: 100 42.85 857.06 0.36 18.15 0.64 4.30
FA-18E/F* 25 APU Use 0.03 52.04 0.10 0.00 0.03 0.00
Start/Warm up 34.13 1033.58 1.10 22.71 0.72 4.39

CJMT EIS/OEIS Appendix G
April 2015 Draft Air Quality
G-67
Unstick(s) per Dep: 1 0.26 54.87 0.10 0.03 0.04 0.18
Taxi Out 11.38 344.53 0.37 7.57 0.24 1.46
Engine Run-up 0.10 164.44 0.46 0.01 0.11 0.45
Takeoff 163.89 1616.61 5.77 2.90 1.23 -
Climbout 0.26 1199.63 13.69 0.05 0.78 1.11
Approach to Break 0.18 843.92 6.27 0.03 0.55 1.20
Break 1.07 41.60 0.05 0.58 0.03 0.17
On Runway (WonW) 2.28 68.91 0.07 1.51 0.05 0.29
Unstick(s) per Arr: 1 0.26 54.87 0.10 0.03 0.04 0.18
Taxi In 18.20 551.24 0.59 12.11 0.38 2.34
Hot Refuel %: 100 34.13 1033.58 1.10 22.71 0.72 4.39
F-35B* 20 F-35B Conventional LTO Cycle 4.65 8757 22.51 0.25 1.08 13.78
F-35B Short LTO Cycle 4.63 10687 41.34 0.22 1.32 14.69
F-35B Vertical LTO Cycle 4.61 11101 45.69 0.22 1.37 14.87
F-35C* 30 F-35C LTO Cycle 17.08 5584 14.65 0.2 0.69 9.52
Heavy Commercial
Transport
Assumed
C-17 100
Idle (Taxi) 23.53 3371.76 3.90 0.38 1.10 11.06
Approach 0.81 5136.61 24.46 0.08 1.67 8.73
Takeoff 0.12 1206.01 12.99 0.00 0.39 0.02
Note:
* All fight jets 100% afterburner departures.
Emission factors for following Navy aircraft are obtained from AESO reports as indicated:
KC-130 – (#2000-09, Revision B, January 2001)
AH-1 – (#9824, Revision B, November 2009)
F-35 – (JSF worksheet for F-135 engine)
C-17 – (Air Emissions Guide for Air Force Mobile Sources)
UH-1 – (#9904, Revision B, November 2009) F/A-18 – (F-18 Emissions Calculator-Version 1-Sep.27, 2013)
H-53 – (#9822, Revision C, February 2000) MV-22 – (#9946, Revision E, January 2001)

CJMT EIS/OEIS Appendix G
April 2015 Draft Air Quality
G-68
Aircrafts, LTO and Operation at Pagan
Aircraft
Type
Pounds per LTO / Operation
Model Percentage Operation Mode CO CO2 NOx VOC SO2 PM10 or
PM2.5
Transport Tilt-rotor MV-22 100
Vertical Takeoff (Conversion mode) 2.45 2578.9 6.79 0.04 0.32 1.13
Short Takeoff (Airplane mode) 2.37 2216.1 5.38 0.03 0.28 0.95
Short Landing (Airplane mode) 2.96 1934.8 3.87 0.05 0.24 0.78
Vertical Landing (Conversion mode) 2.96 1934.8 3.87 0.05 0.24 0.78
Landing w/ Break (Airplane mode) 3.07 2498.7 6.13 0.05 0.31 1.06
Transport Rotary Wing CH-53E 100 LTO 22.9 - 8.9 11.2 0.7 3.8
Attack Helo AH-1Y 50 LTO (AH-1W) 7.08 852.02 2.09 0.33 0.17 1.8
UH-1Z 50 LTO (UH-1N) 3.32 893.27 1.28 0.67 0.11 1.18
Transport Fixed Wing
KC-130 50 Single KC-130 LTO with Straight In Arrival 14.79 7570 17.35 7.65 0.95 9.03
Single KC-130 LTO with Break at Arrival 13.78 7896 19.17 7.39 0.99 9.42
C-17 50 Idle (Taxi) 23.53 3371.76 3.90 0.38 1.10 11.06
Approach 0.81 5136.61 24.46 0.08 1.67 8.73
Takeoff 0.12 1206.01 12.99 0.00 0.39 0.02
Unmanned RQ-7 100
Note:
Emission factors for following Navy aircraft are obtained from AESO reports as indicated:
KC-130 – (#2000-09, Revision B, January 2001)
AH-1 – (#9824, Revision B, November 2009)
C-17 – (Air Emissions Guide for Air Force Mobile Sources)
RQ-7 – (EDMS)
UH-1 – (#9904, Revision B, November 2009) MV-22 – (#9946, Revision E, January 2001)
H-53 – (#9822, Revision C, February 2000)

CJMT EIS/OEIS Appendix G
April 2015 Draft Air Quality
G-69
Airfield Emissions - Tinian International Airport
Aircraft Type
Annual #
Take-offs
Annual #
Landings
Annual # Closed
Field Patterns
Total Annual LTOs per
Aircraft Type
Total Annual LTOs per
Aircraft Model
Operational Emissions (tons)
Model Total Total Total CO CO2 NOx VOC SO2 PM10 or PM2.5
Transport
Tilt-rotor MV-22 200 200 300 500 500 1.38 1269.4 3.23 0.0225 0.1575 0.5475
Transport
Rotary
Wing
CH-53E 180 180 300 480 480 5.496 - 2.136 2.688 0.168 0.912
Attack Helo AH-1Y 80 80 300 380
190 0.6726 80.9419 0.19855 0.03135 0.01615 0.171
UH-1Z 190 0.3154 84.86065 0.1216 0.06365 0.01045 0.1121
Transport
Fixed Wing
KC-130 600 600 0 600
300 2.067 1184.4 2.8755 1.1085 0.1485 1.413
C-17 300 3.67 1457.16 6.20 0.07 0.47 2.97
Unmanned RQ-7 150 150 0 150 150 - - - - - -
Fighter (not
including
FCLP)*
FA-
18C/D*
1000 1000 0 1000
250 17.76 772.95 1.89 6.79 0.54 1.94
FA-
18E/F* 250 33.27 882.48 3.72 8.78 0.61 2.02
F-35B* 200 0.461 1110.1 4.569 0.022 0.137 1.487
F-35C* 300 2.562 837.6 2.1975 0.03 0.1035 1.428
Heavy
Commercial
Transport
Assumed
C-17 12 12 0 12 12 0.15 58.29 0.25 0.00 0.02 0.12
Total
67.80 7738.17 27.39 19.61 2.38 13.13

CJMT EIS/OEIS Appendix G
April 2015 Draft Air Quality
G-70
Airfield Emissions - Tinian International Airport (FCLP)
Aircraft
Type
Annual
#
Take-
offs
Annual #
Landings
Annual #
Closed
Field
Patterns
Total
Annual
LTOs per
Aircraft
Type
Total Annual
LTOs per
Aircraft
Model
Operational Emissions (tons)
Model Total Total Total CO CO2 NOx VOC SO2 PM10 or
PM2.5
Transport
Tilt-rotor MV-22 - - - - - - - - - - -
Transport
Rotary
Wing
CH-53E - - - - - - - - - - -
Attack Helo AH-1Y - - - -
- - - - - - -
UH-1Z - - - - - - -
Transport
Fixed Wing
KC-130 - - - -
- - - - - - -
C-17 - - - - - - -
Unmanned RQ-7 - - - - - - - - - - -
Fighter (not
including
FCLP)*
FA-
18C/D*
- - 3000 3000
750 53.28 2318.85 5.67 20.37 1.61 5.83
FA-
18E/F* 750 99.82 2647.43 11.16 26.34 1.83 6.07
F-35B* 600 1.383 3330.3 13.707 0.066 0.411 4.461
F-35C* 900 7.686 2512.8 6.5925 0.09 0.3105 4.284
Heavy
Commercial
Transport
Assumed
C-17
Total
162.17 10809.38 37.14 46.87 4.17 20.65

CJMT EIS/OEIS Appendix G
April 2015 Draft Air Quality
G-71
Airfield Emissions - Tinian FARP North Field
Aircraft
Type
Annual
#
Take-
offs
Annual
#
Landings
Annual
# Closed
Field
Patterns
Total
Annual
LTOs
per
Aircraft
Type
Total
Annual
LTOs
per
Aircraft
Model
Operational Emissions (tons)
Model Total Total Total CO CO2 NOx VOC SO2 PM10 or
PM2.5
Transport
Tilt-rotor MV-22 200 200 0 200 200 0.552 507.76 1.292 0.009 0.063 0.219
Transport
Rotary
Wing
CH-53E 180 180 0 180 180 2.061 - 0.801 1.008 0.063 0.342
Attack Helo AH-1Y 80 80 0 80
40 0.1416 17.0404 0.0418 0.0066 0.0034 0.036
UH-1Z 40 0.0664 17.865 0.0256 0.0134 0.0022 0.0236
Transport
Fixed Wing
KC-130 600 600 0 600
300 2.067 1184.4 2.8755 1.1085 0.1485 1.413
C-17 300 3.67 1457.16 6.20 0.07 0.47 2.97
Unmanned RQ-7 150 150 0 150 150 - - - - - -
Fighter (not
including
FCLP)*
FA-
18C/D*
- - - -
- - - - - - -
FA-
18E/F* - - - - - - -
F-35B* - - - - - - -
F-35C* - - - - - - -
Heavy
Commercial
Transport
Assumed
C-17 - - - -
Total
8.56 3184.22 11.24 2.22 0.75 5.01

CJMT EIS/OEIS Appendix G
April 2015 Draft Air Quality
G-72
Airfield Emissions - Tinian LZ Base Camp
Aircraft
Type
Annual
# Take-
offs
Annual #
Landings
Annual #
Closed
Field
Patterns
Total
Annual
LTOs per
Aircraft
Type
Total
Annual
LTOs per
Aircraft
Model
Operational Emissions (tons)
Model Total Total Total CO CO2 NOx VOC SO2 PM10 or
PM2.5
Transport
Tilt-rotor MV-22 200 200 0 200 200 0.552 507.76 1.292 0.009 0.063 0.219
Transport
Rotary
Wing
CH-53E 180 180 0 180 180 2.061 - 0.801 1.008 0.063 0.342
Attack Helo AH-1Y 80 80 0 80
40 0.1416 17.0404 0.0418 0.0066 0.0034 0.036
UH-1Z 40 0.0664 17.8654 0.0256 0.0134 0.0022 0.0236
Transport
Fixed Wing
KC-130 - - - -
- - - - - - -
C-17 - - - - - - -
Unmanned RQ-7 - - - - - - - - - - -
Fighter (not
including
FCLP)*
FA-
18C/D*
- - - -
- - - - - - -
FA-
18E/F* - - - - - - -
F-35B* - - - - - - -
F-35C* - - - - - - -
Heavy
Commercial
Transport
Assumed
C-17 - - - -
Total
2.821 542.6658 2.1604 1.037 0.1316 0.6206

CJMT EIS/OEIS Appendix G
April 2015 Draft Air Quality
G-73
Airfield Emissions - Tinian LZ MSA
Aircraft
Type
Annual
# Take-
offs
Annual #
Landings
Annual #
Closed
Field
Patterns
Total
Annual
LTOs per
Aircraft
Type
Total
Annual
LTOs per
Aircraft
Model
Operational Emissions (tons)
Model Total Total Total CO CO2 NOx VOC SO2 PM10 or
PM2.5
Transport
Tilt-rotor MV-22 100 100 0 100 100 0.276 253.88 0.646 0.0045 0.0315 0.1095
Transport
Rotary Wing CH-53E 100 100 0 100 100 1.145 - 0.445 0.56 0.035 0.19
Attack Helo AH-1Y - - - -
- - - - - - -
UH-1Z - - - - - - -
Transport
Fixed Wing
KC-130 - - - -
- - - - - - -
C-17 - - - - - - -
Unmanned RQ-7 - - - - - - - - - - -
Fighter (not
including
FCLP)*
FA-
18C/D*
- - - -
- - - - - - -
FA-
18E/F* - - - - - - -
F-35B* - - - - - - -
F-35C* - - - - - - -
Heavy
Commercial
Transport
Assumed
C-17 - - -
Total
1.421 253.88 1.091 0.5645 0.0665 0.2995

CJMT EIS/OEIS Appendix G
April 2015 Draft Air Quality
G-74
Airfield Emissions - Tinian LZ OP 3
Aircraft
Type
Annual #
Take-offs
Annual #
Landings
Annual #
Closed
Field
Patterns
Total
Annual
LTOs per
Aircraft
Type
Total
Annual
LTOs per
Aircraft
Model
Operational Emissions (tons)
Model Total Total Total CO CO2 NOx VOC SO2 PM10 or
PM2.5
Transport
Tilt-rotor MV-22 200 200 0 200 200 0.552 507.76 1.292 0.009 0.063 0.219
Transport
Rotary Wing CH-53E 180 180 0 180 180 2.061 - 0.801 1.008 0.063 0.342
Attack Helo AH-1Y 80 80 0 80
40 0.1416 17.0404 0.0418 0.0066 0.0034 0.036
UH-1Z 40 0.0664 17.8654 0.0256 0.0134 0.0022 0.0236
Transport
Fixed Wing
KC-130 - - - -
- - - - - - -
C-17 - - - - - - -
Unmanned RQ-7 - - - - - - - - - - -
Fighter (not
including
FCLP)*
FA-
18C/D*
- - - -
- - - - - - -
FA-
18E/F* - - - - - - -
F-35B* - - - - - - -
F-35C* - - - - - - -
Heavy
Commercial
Transport
Assumed
C-17 - - -
Total
2.821 542.666 2.1604 1.037 0.1316 0.6206

CJMT EIS/OEIS Appendix G
April 2015 Draft Air Quality
G-75
Airfield Emissions - Tinian LZ BAX S
Aircraft
Type
Annual #
Take-
offs
Annual #
Landings
Annual #
Closed
Field
Patterns
Total
Annual
LTOs per
Aircraft
Type
Total
Annual
LTOs per
Aircraft
Model
Operational Emissions (tons)
Model Total Total Total CO CO2 NOx VOC SO2 PM10 or
PM2.5
Transport
Tilt-rotor MV-22 200 200 0 200 200 0.552 507.76 1.292 0.009 0.063 0.219
Transport
Rotary Wing CH-53E 180 180 0 180 180 2.061 - 0.801 1.008 0.063 0.342
Attack Helo AH-1Y 80 80 0 80
40 0.1416 17.0404 0.0418 0.0066 0.0034 0.036
UH-1Z 40 0.0664 17.8654 0.0256 0.0134 0.0022 0.0236
Transport
Fixed Wing
KC-130 - - - -
- - - - - - -
C-17 - - - - - - -
Unmanned RQ-7 - - - - - - - - - - -
Fighter (not
including
FCLP)*
FA-
18C/D*
- - - -
- - - - - - -
FA-
18E/F* - - - - - - -
F-35B* - - - - - - -
F-35C* - - - - - - -
Heavy
Commercial
Transport
Assumed
C-17 - - - -
Total
2.821 542.666 2.1604 1.037 0.1316 0.6206

CJMT EIS/OEIS Appendix G
April 2015 Draft Air Quality
G-76
Airfield Emissions - Tinian LZ Chulu
Aircraft
Type
Annual #
Take-offs
Annual #
Landings
Annual #
Closed
Field
Patterns
Total
Annual
LTOs per
Aircraft
Type
Total
Annual
LTOs per
Aircraft
Model
Operational Emissions (tons)
Model Total Total Total CO CO2 NOx VOC SO2 PM10 or
PM2.5
Transport
Tilt-rotor MV-22 200 200 0 200 200 0.552 507.76 1.292 0.009 0.063 0.219
Transport
Rotary
Wing
CH-53E 180 180 0 180 180 2.061 - 0.801 1.008 0.063 0.342
Attack Helo AH-1Y 80 80 0 80
40 0.1416 17.0404 0.0418 0.0066 0.0034 0.036
UH-1Z 40 0.0664 17.8654 0.0256 0.0134 0.0022 0.0236
Transport
Fixed Wing
KC-130 - - - -
- - - - - - -
C-17 - - - - - - -
Unmanned RQ-7 - - - - - - - - - - -
Fighter (not
including
FCLP)*
FA-
18C/D*
- - - -
- - - - - - -
FA-
18E/F* - - - - - - -
F-35B* - - - - - - -
F-35C* - - - - - - -
Heavy
Commercial
Transport
Assumed
C-17 - - - -
Total
2.821 542.666 2.1604 1.037 0.1316 0.6206

CJMT EIS/OEIS Appendix G
April 2015 Draft Air Quality
G-77
Airfield Emissions - Tinian International Airport (LHD)
Aircraft
Type
Annual #
Take-offs
Annual #
Landings
Annual #
Closed
Field
Patterns
Total
Annual
LTOs per
Aircraft
Type
Total
Annual
LTOs per
Aircraft
Model
Operational Emissions (tons)
Model Total Total Total CO CO2 NOx VOC SO2 PM10 or
PM2.5
Transport
Tilt-rotor MV-22 0 0 300 300 300 0.828 761.64 1.938 0.0135 0.0945 0.3285
Transport
Rotary
Wing
CH-53E 0 0 300 300 300 3.435 - 1.335 1.68 0.105 0.57
Attack Helo AH-1Y 0 0 300 300
150 0.531 63.9015 0.15675 0.02475 0.01275 0.135
UH-1Z 150 0.249 66.9953 0.096 0.05025 0.00825 0.0885
Transport
Fixed Wing
KC-130 - - - -
- - - - - - -
C-17 - - - - - - -
Unmanned RQ-7 - - - - - - - - - - -
Fighter (not
including
FCLP)*
FA-
18C/D*
- - - -
- - - - - - -
FA-18E/F* - - - - - - -
F-35B* - - - - - - -
F-35C* - - - - - - -
Heavy
Commercial
Transport
Assumed
C-17 - - - -
Total 5.043 892.537 3.52575 1.7685 0.2205 1.122

CJMT EIS/OEIS Appendix G
April 2015 Draft Air Quality
G-78
Airfield Emissions - Pagan Airfield
Aircraft
Type
Annual
# Take-
offs
Annual #
Landings
Annual #
Closed
Field
Patterns
Total Annual
LTOs per
Aircraft
Type
Total Annual
LTOs per
Aircraft
Model
Operational Emissions (tons)
Model Total Total Total CO CO2 NOx VOC SO2 PM10 or
PM2.5
Transport
Tilt-rotor MV-22 300 300 0 300 300 0.828 761.64 1.938 0.0135 0.0945 0.3285
Transport
Rotary
Wing
CH-53E 1080 1080 0 1080 1080 12.366 - 4.806 6.048 0.378 2.052
Attack
Helo AH-1Y
480 480 0 480 240 0.8496 102.2424 0.2508 0.0396 0.0204 0.216
UH-1Z 240 0.3984 107.1924 0.1536 0.0804 0.0132 0.1416
Transport
Fixed Wing
KC-130 500 500 0 500
250 1.7225 987.0 2.39625 0.92375 0.12375 1.1775
C-17 250 3.06 1214.30 5.17 0.06 0.40 2.48
Unmanne
d RQ-7 150 200 0 150 150 - - - - - -
No fighter
aircraft
operations
on Pagan
- Not applicable
Total 19.22 3172.37 14.71 7.16 1.03 6.39

CJMT EIS/OEIS Appendix G
April 2015 Draft Air Quality
G-79
Airfield Emissions - Pagan LZ Mid
Aircraft
Type
Annual #
Take-offs
Annual #
Landings
Annual #
Closed Field
Patterns
Total Annual
LTOs per
Aircraft Type
Total Annual
LTOs per
Aircraft
Model
Operational Emissions (tons)
Model Total Total Total CO CO2 NOx VOC SO2 PM10 or
PM2.5
Transport
Tilt-rotor MV-22 100 100 0 100 100 0.276 253.88 0.646 0.0045 0.0315 0.1095
Transport
Rotary
Wing
CH-
53E 300 300 0 300 300 3.435 - 1.335 1.68 0.105 0.57
Attack Helo AH-1Y 200 200 0 200
100 0.354 42.601 0.1045 0.0165 0.0085 0.09
UH-1Z 100 0.166 44.6635 0.064 0.0335 0.0055 0.059
Transport
Fixed Wing
KC-130
Not applicable
C-17
Unmanned RQ-7
No fighter
aircraft
operations
on Pagan
-
Total 4.231 341.1445 2.1495 1.7345 0.1505 0.8285

CJMT EIS/OEIS Appendix G
April 2015 Draft Air Quality
G-80
Airfield Emissions - Pagan LZ Gold East
Aircraft
Type
Annual #
Take-offs
Annual #
Landings
Annual #
Closed
Field
Patterns
Total
Annual
LTOs per
Aircraft
Type
Total
Annual
LTOs per
Aircraft
Model
Operational Emissions (tons)
Model Total Total Total CO CO2 NOx VOC SO2 PM10 or
PM2.5
Transport
Tilt-rotor MV-22
100 100 0 100 100 0.276 253.88 0.646 0.0045 0.0315 0.1095
Transport
Rotary
Wing
CH-53E 300 300 0 300 300 3.435 - 1.335 1.68 0.105 0.57
Attack Helo AH-1Y 200 200 0 200
100 0.354 42.601 0.1045 0.0165 0.0085 0.09
UH-1Z 100 0.166 44.6635 0.064 0.0335 0.0055 0.059
Transport
Fixed Wing KC-130
Not applicable
C-17
Unmanned RQ-7
No fighter
aircraft
operations
on Pagan
-
Total 4.231 341.1445 2.1495 1.7345 0.1505 0.8285

CJMT EIS/OEIS Appendix G
April 2015 Draft Air Quality
G-81
Airfield Emissions - Pagan LZ West
Aircraft
Type
Annual #
Take-offs
Annual #
Landings
Annual #
Closed
Field
Patterns
Total
Annual
LTOs per
Aircraft
Type
Total
Annual
LTOs per
Aircraft
Model
Operational Emissions (tons)
Model Total Total Total CO CO2 NOx VOC SO2 PM10 or
PM2.5
Transport
Tilt-rotor MV-22 100 100 0 100 100 0.276 253.88 0.646 0.0045 0.0315 0.1095
Transport
Rotary
Wing
CH-
53E 300 300 0 300 300 3.435 - 1.335 1.68 0.105 0.57
Attack Helo AH-1Y 200 200 0 200
100 0.354 42.601 0.1045 0.0165 0.0085 0.09
UH-1Z 100 0.166 44.6635 0.064 0.0335 0.0055 0.059
Transport
Fixed Wing
KC-130
Not applicable
C-17
Unmanned RQ-7
No fighter
aircraft
operations
on Pagan
-
Total 4.231 341.1445 2.1495 1.7345 0.1505 0.8285

CJMT EIS/OEIS Appendix G
April 2015 Draft Air Quality
G-82
Airfield Emissions - Pagan LZ Ring Road South
Aircraft
Type
Annual #
Take-
offs
Annual #
Landings
Annual #
Closed
Field
Patterns
Total
Annual
LTOs per
Aircraft
Type
Total
Annual
LTOs per
Aircraft
Model
Operational Emissions (tons)
Model Total Total Total CO CO2 NOx VOC SO2 PM10 or
PM2.5
Transport
Tilt-rotor MV-22 100 100 0 100 100 0.276 253.88 0.646 0.0045 0.0315 0.1095
Transport
Rotary
Wing
CH-53E 300 300 0 300 300 3.435 - 1.335 1.68 0.105 0.57
Attack Helo AH-1Y 200 200 0 200
100 0.354 42.601 0.1045 0.0165 0.0085 0.09
UH-1Z 100 0.166 44.6635 0.064 0.0335 0.0055 0.059
Transport
Fixed Wing
KC-130
Not applicable
C-17
Unmanned RQ-7
No fighter
aircraft
operations
on Pagan
-
Total 4.231 341.1445 2.1495 1.7345 0.1505 0.8285

CJMT EIS/OEIS Appendix G
April 2015 Draft Air Quality
G-83
Airfield Emissions - Pagan LZ Ring Road North
Aircraft
Type
Annual #
Take-offs
Annual #
Landings
Annual #
Closed
Field
Patterns
Total
Annual
LTOs per
Aircraft
Type
Total
Annual
LTOs per
Aircraft
Model
Operational Emissions (tons)
Model Total Total Total CO CO2 NOx VOC SO2 PM10 or
PM2.5
Transport
Tilt-rotor MV-22 100 100 0 100 100 0.276 253.88 0.646 0.0045 0.0315 0.1095
Transport
Rotary
Wing
CH-53E 300 300 0 300 300 3.435 - 1.335 1.68 0.105 0.57
Attack
Helo AH-1Y
200 200 0 200 100 0.354 42.601 0.1045 0.0165 0.0085 0.09
UH-1Z 100 0.166 44.6635 0.064 0.0335 0.0055 0.059
Transport
Fixed Wing
KC-130
Not applicable
C-17
Unmanned RQ-7
No fighter
aircraft
operations
on Pagan
-
Total 4.231 341.1445 2.1495 1.7345 0.1505 0.8285

CJMT EIS/OEIS Appendix G
April 2015 Draft Air Quality
G-84
Airfield Emissions - Pagan LZ Hill South
Aircraft
Type
Annual #
Take-offs
Annual #
Landings
Annual #
Closed
Field
Patterns
Total
Annual
LTOs per
Aircraft
Type
Total
Annual
LTOs per
Aircraft
Model
Operational Emissions (tons)
Model Total Total Total CO CO2 NOx VOC SO2 PM10 or
PM2.5
Transport
Tilt-rotor MV-22 100 100 0 100 100 0.276 253.88 0.646 0.0045 0.0315 0.1095
Transport
Rotary
Wing
CH-53E 300 300 0 300 300 3.435 42.601 1.335 1.68 0.105 0.57
Attack
Helo AH-1Y
200 200 0 200 100 0.354 44.6635 0.1045 0.0165 0.0085 0.09
UH-1Z 100 0.166 - 0.064 0.0335 0.0055 0.059
Transport
Fixed Wing
KC-130
Not applicable
C-17
Unmanned RQ-7
No fighter
aircraft
operations
on Pagan
-
Total 4.231 341.1445 2.1495 1.7345 0.1505 0.8285

CJMT EIS/OEIS Appendix G
April 2015 Draft Air Quality
G-85
Airfield Emissions - Pagan LZ Hill North
Aircraft
Type
Annual #
Take-offs
Annual #
Landings
Annual #
Closed
Field
Patterns
Total
Annual
LTOs per
Aircraft
Type
Total
Annual
LTOs per
Aircraft
Model
Operational Emissions (tons)
Model Total Total Total CO CO2 NOx VOC SO2 PM10 or
PM2.5
Transport
Tilt-rotor MV-22 100 100 0 100 100 0.276 253.88 0.646 0.0045 0.0315 0.1095
Transport
Rotary
Wing
CH-53E 300 300 0 300 300 3.435 - 1.335 1.68 0.105 0.57
Attack
Helo AH-1Y
200 200 0 200 100 0.354 42.601 0.1045 0.0165 0.0085 0.09
UH-1Z 100 0.166 44.6635 0.064 0.0335 0.0055 0.059
Transport
Fixed Wing
KC-130
Not applicable
C-17
Unmanned RQ-7
No fighter
aircraft
operations
on Pagan
-
Total 4.231 341.1445 2.1495 1.7345 0.1505 0.8285

CJMT EIS/OEIS Appendix G
April 2015 Draft Air Quality
G-86
Airfield Emissions - Pagan LZ Northeast
Aircraft
Type
Annual #
Take-offs
Annual #
Landings
Annual #
Closed
Field
Patterns
Total
Annual
LTOs per
Aircraft
Type
Total
Annual
LTOs per
Aircraft
Model
Operational Emissions (tons)
Model Total Total Total CO CO2 NOx VOC SO2 PM10 or
PM2.5
Transport
Tilt-rotor MV-22 100 100 0 100 100 0.276 253.88 0.646 0.0045 0.0315 0.1095
Transport
Rotary
Wing
CH-53E 300 300 0 300 300 3.435 - 1.335 1.68 0.105 0.57
Attack
Helo AH-1Y
200 200 0 200 100 0.354 42.601 0.1045 0.0165 0.0085 0.09
UH-1Z 100 0.166 44.6635 0.064 0.0335 0.0055 0.059
Transport
Fixed Wing
KC-130
Not applicable
C-17
Unmanned RQ-7
No fighter
aircraft
operations
on Pagan
-
Total 4.231 341.1445 2.1495 1.7345 0.1505 0.8285

CJMT EIS/OEIS Appendix G
April 2015 Draft Air Quality
G-87
Airfield Emissions - Pagan LZ North Beach
Aircraft
Type
Annual #
Take-offs
Annual #
Landings
Annual #
Closed
Field
Patterns
Total
Annual
LTOs per
Aircraft
Type
Total
Annual
LTOs per
Aircraft
Model
Operational Emissions (tons)
Model Total Total Total CO CO2 NOx VOC SO2 PM10 or
PM2.5
Transport
Tilt-rotor MV-22 100 100 0 100 100 0.276 253.88 0.646 0.0045 0.0315 0.1095
Transport
Rotary
Wing
CH-53E 300 300 0 300 300 3.435 - 1.335 1.68 0.105 0.57
Attack
Helo AH-1Y
200 200 0 200 100 0.354 42.601 0.1045 0.0165 0.0085 0.09
UH-1Z 100 0.166 44.6635 0.064 0.0335 0.0055 0.059
Transport
Fixed Wing
KC-130
Not applicable
C-17
Unmanned RQ-7
No fighter
aircraft
operations
on Pagan
-
Total 4.231 341.1445 2.1495 1.7345 0.1505 0.8285

CJMT EIS/OEIS Appendix G
April 2015 Draft Air Quality
G-88
Airfield Emissions - Pagan LZ Northwest
Aircraft
Type
Annual #
Take-offs
Annual #
Landings
Annual #
Closed
Field
Patterns
Total
Annual
LTOs per
Aircraft
Type
Total
Annual
LTOs per
Aircraft
Model
Operational Emissions (tons)
Model Total Total Total CO CO2 NOx VOC SO2 PM10 or
PM2.5
Transport
Tilt-rotor MV-22 100 100 0 100 100 0.276 253.88 0.646 0.0045 0.0315 0.1095
Transport
Rotary
Wing
CH-53E 300 300 0 300 300 3.435 - 1.335 1.68 0.105 0.57
Attack
Helo AH-1Y
200 200 0 200 100 0.354 42.601 0.1045 0.0165 0.0085 0.09
UH-1Z 100 0.166 44.6635 0.064 0.0335 0.0055 0.059
Transport
Fixed Wing
KC-130
Not applicable
C-17
Unmanned RQ-7
No fighter
aircraft
operations
on Pagan
-
Total 4.231 341.1445 2.1495 1.7345 0.1505 0.8285

CJMT EIS/OEIS Appendix G
April 2015 Draft Air Quality
G-89
Airfield Emissions - Pagan LZ Ring Road Lake
Aircraft
Type
Annual #
Take-offs
Annual #
Landings
Annual #
Closed
Field
Patterns
Total
Annual
LTOs per
Aircraft
Type
Total
Annual
LTOs per
Aircraft
Model
Operational Emissions (tons)
Model Total Total Total CO CO2 NOx VOC SO2 PM10 or
PM2.5
Transport
Tilt-rotor MV-22 100 100 0 100 100 0.276 253.88 0.646 0.0045 0.0315 0.1095
Transport
Rotary
Wing
CH-53E 300 300 0 300 300 3.435 - 1.335 1.68 0.105 0.57
Attack
Helo AH-1Y
200 200 0 200 100 0.354 42.601 0.1045 0.0165 0.0085 0.09
UH-1Z 100 0.166 44.6635 0.064 0.0335 0.0055 0.059
Transport
Fixed Wing
KC-130
Not applicable
C-17
Unmanned RQ-7
No fighter
aircraft
operations
on Pagan
-
Total 4.231 341.1445 2.1495 1.7345 0.1505 0.8285
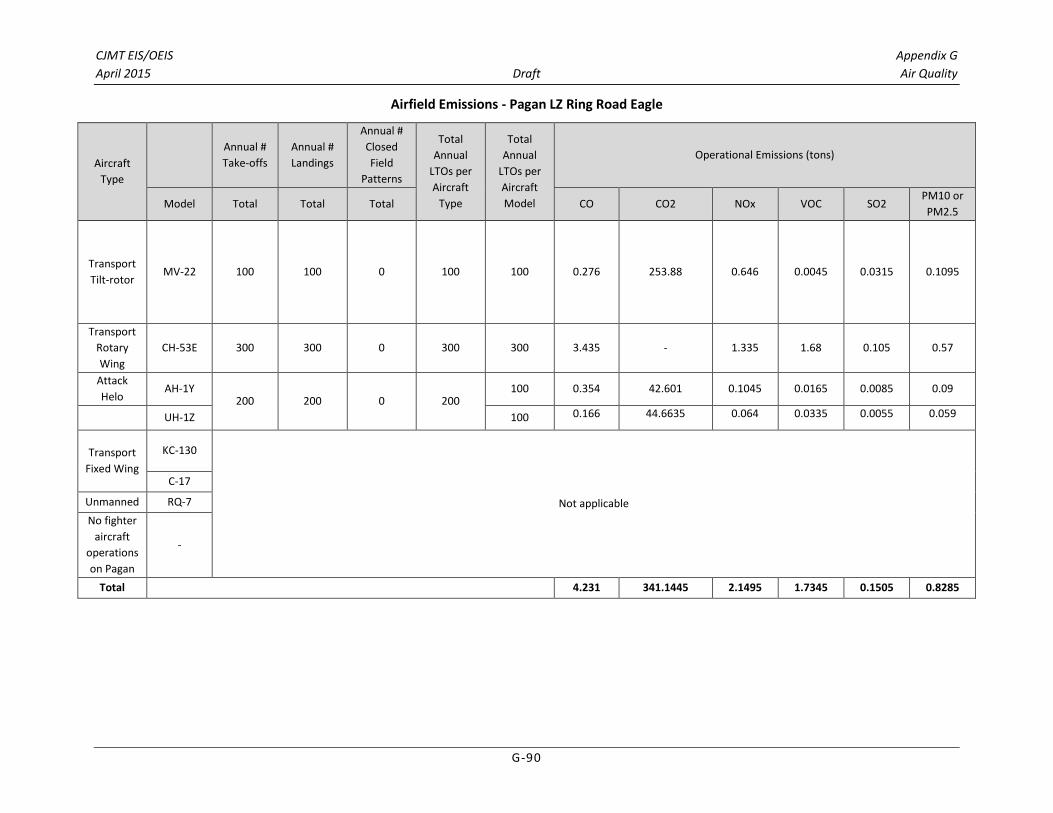
CJMT EIS/OEIS Appendix G
April 2015 Draft Air Quality
G-90
Airfield Emissions - Pagan LZ Ring Road Eagle
Aircraft
Type
Annual #
Take-offs
Annual #
Landings
Annual #
Closed
Field
Patterns
Total
Annual
LTOs per
Aircraft
Type
Total
Annual
LTOs per
Aircraft
Model
Operational Emissions (tons)
Model Total Total Total CO CO2 NOx VOC SO2 PM10 or
PM2.5
Transport
Tilt-rotor MV-22 100 100 0 100 100 0.276 253.88 0.646 0.0045 0.0315 0.1095
Transport
Rotary
Wing
CH-53E 300 300 0 300 300 3.435 - 1.335 1.68 0.105 0.57
Attack
Helo AH-1Y
200 200 0 200 100 0.354 42.601 0.1045 0.0165 0.0085 0.09
UH-1Z 100 0.166 44.6635 0.064 0.0335 0.0055 0.059
Transport
Fixed Wing
KC-130
Not applicable
C-17
Unmanned RQ-7
No fighter
aircraft
operations
on Pagan
-
Total 4.231 341.1445 2.1495 1.7345 0.1505 0.8285

CJMT EIS/OEIS Appendix G
April 2015 Draft Air Quality
G-91
Airfield Emissions - Pagan LZ Owl
Aircraft
Type
Annual #
Take-offs
Annual #
Landings
Annual #
Closed
Field
Patterns
Total
Annual
LTOs per
Aircraft
Type
Total
Annual
LTOs per
Aircraft
Model
Operational Emissions (tons)
Model Total Total Total CO CO2 NOx VOC SO2 PM10 or
PM2.5
Transport
Tilt-rotor MV-22 100 100 0 100 100 0.276 253.88 0.646 0.0045 0.0315 0.1095
Transport
Rotary
Wing
CH-53E 300 300 0 300 300 3.435 - 1.335 1.68 0.105 0.57
Attack
Helo AH-1Y
200 200 0 200 100 0.354 42.601 0.1045 0.0165 0.0085 0.09
UH-1Z 100 0.166 44.6635 0.064 0.0335 0.0055 0.059
Transport
Fixed Wing
KC-130
Not applicable
C-17
Unmanned RQ-7
No fighter
aircraft
operations
on Pagan
-
Total 4.231 341.1445 2.1495 1.7345 0.1505 0.8285

CJMT EIS/OEIS Appendix G
April 2015 Draft Air Quality
G-92
Total Airfield Operation Emissions – Tinian (tons)
CO CO2 NOx VOC SO2 PM10 or
PM2.5
256.27 25048.85 89.02 75.18 8.12 42.69
Total Airfield Operation Emissions – Pagan (tons)
CO CO2 NOx VOC SO2 PM10 or
PM2.5
74.22 7607.25 42.66 29.71 2.98 17.16

CJMT EIS/OEIS Appendix G
April 2015 Draft Air Quality
G-93
CJMT Range Flight Aircraft Emissions
Range Flight Hours – Fighter Type Aircraft
Aircraft Type Fighter Type (i.e., FA-18, F-35, AV-8, F-16)
Airspace Tinian
MOA
Tinian
R-7203N
Tinian
R-7203S
Tinian
R-7203E
Tinian
R-7203W
Pagan
R-7204
Pagan
W-14
# Events/Year 7400 7400 7400 7400 7400 2350 2350
Avg # minutes in Airspace/Event 25 5 5 5 5 10 35
# Events/Year < 3,000 FT 0 1726.7 1726.7 1726.7 0 430.8 235
Total hr in Airspace < 3,000 FT 0 143.9 143.9 143.9 0 71.8 137.1
Total Combined Hours (<3,000 FT) 431.67 208.89
Range Flight Hours – Transport Tilt-Rotor Type Aircraft
Aircraft Type Transport Tilt-Rotor Type (i.e., MV-22)
Airspace Tinian
MOA
Tinian
R-7203N
Tinian
R-7203S
Tinian
R-7203E
Tinian
R-7203W
Pagan
R-7204
Pagan
W-14
# Events/Year 200 200 200 0 0 100 100
Avg # minutes in Airspace/Event 20 20 30 5 5 10 35
# Events/Year < 3,000 FT 0 156.7 156.7 0.0 0 75.0 73.3
Total hr in Airspace < 3,000 FT 0 52.2 78.3 0.0 0 12.5 42.8
Total Combined Hours (<3,000 FT) 130.56 55.28

CJMT EIS/OEIS Appendix G
April 2015 Draft Air Quality
G-94
Range Flight Hours – Transport Rotary Wing Type Aircraft
Aircraft Type Transport Rotary Wing Type (i.e., CH-53)
Airspace Tinian
MOA
Tinian
R-7203N
Tinian
R-7203S
Tinian
R-7203E
Tinian
R-7203W
Pagan
R-7204
Pagan
W-14
# Events/Year NA 180 180 0 0 360 360
Avg # minutes in Airspace/Event NA 25 25 5 5 20 5
# Events/Year < 3,000 FT NA 150.0 150.0 0.0 0 252.0 252
Total hr in Airspace < 3,000 FT NA 62.5 62.5 0.0 0 84.0 21.0
Total Combined Hours (<3,000 FT) 125.00 105.00
Range Flight Hours – Attack Helo Type Aircraft
Aircraft Type Attack Helo Type (i.e., AH-1, AH-64)
Airspace Tinian MOA Tinian
R-7203N
Tinian
R-7203S
Tinian
R-7203E
Tinian
R-7203W
Pagan
R-7204
Pagan
W-14
# Events/Year NA 80 80 80 80 160 160
Avg # minutes in Airspace/Event NA 25 5 15 0 20 10
# Events/Year < 3,000 FT NA 66.7 66.7 61.3 61 120.0 93.3
Total hr in Airspace < 3,000 FT NA 27.8 5.6 15.3 0 40.0 15.6
Total Combined Hours (<3,000 FT) 48.67 55.56

CJMT EIS/OEIS Appendix G
April 2015 Draft Air Quality
G-95
Range Flight Hours – Transport Fixed Wing Type Aircraft
Aircraft Type Transport Fixed Wing (i.e., KC-130, C-17)
Airspace Tinian
MOA
Tinian
R-7203N
Tinian
R-7203S
Tinian
R-7203E
Tinian
R-7203W
Pagan
R-7204
Pagan
W-14
# Events/Year 1500 600 200 200 200 900 900
Avg # minutes in Airspace/Event 10 10 5 5 5 35 10
# Events/Year < 3,000 FT 0 80.0 26.7 26.7 27 120.0 120
Total hr in Airspace < 3,000 FT 0 13.3 2.2 2.2 2 70.0 20.0
Total Combined Hours (<3,000 FT) 20.00 90.00
Range Flight Hours – UAV Type Aircraft
Aircraft Type UAV (i.e., RQ-7 Shadow)
Airspace Tinian
MOA
Tinian
R-7203N
Tinian
R-7203S
Tinian
R-7203E
Tinian
R-7203W
Pagan
R-7204
Pagan
W-14
# Events/Year 200 200 200 200 200 400 400
Avg # minutes in Airspace/Event 0 90 90 30 30 200 40
# Events/Year < 3,000 FT 0 43.3 43.3 23.3 23 86.7 46.7
Total hr in Airspace < 3,000 FT 0 65.0 65.0 11.7 12 288.9 31.1
Total Combined Hours (<3,000 FT) 153.33 320.00

CJMT EIS/OEIS Appendix G
April 2015 Draft Air Quality
G-96
Range Emissions – Tinian
Total hr
in
Airspace
< 3,000
FT
Percentage
Total hr
in
Airspace
< 3,000
FT per
Aircraft
Emission Factors for One hour of Cruise Time (lb/hr)* Cruise Emissions (tons)
Type Model Tinian Tinian CO CO2 NOx VOC SO2 PM10 or PM2.5 CO CO2 NOx VOC SO2 PM10 or PM2.5
Transport
Tilt-rotor MV-22 130.56 100 130.6 2.0 12258.4 53.8 0.0 1.5 6.0 0.13 800.20 3.51 0.00 0.10 0.39
Transport
Rotary
Wing
CH-53E 125.00 100 125.0 9.5 - 36.1 0.7 1.8 9.9 0.59 - 2.26 0.04 0.11 0.62
Attack
Helo
AH-1Y 48.67
50 24.3 9.0 2734.5 4.7 0.5 0.3 3.6 0.11 33.27 0.06 0.01 0.00 0.04
UH-1Z 50 24.3 0.7 2220.7 4.0 0.1 0.3 2.9 0.01 27.02 0.05 0.00 0.00 0.04
Transport
Fixed Wing
KC-130 20.00
50 10.0 9.3 14458.0 36.7 2.1 1.8 17.9 0.05 72.29 0.18 0.01 0.01 0.09
C-17 50 10.0 13.3 135406.4 1362.2 1.7 44.1 96.2 0.07 677.03 6.81 0.01 0.22 0.48
Unmanned RQ-7 153.3 100 153.3 - - - - - - - - - - - -
Fighter
(not
including
FCLP)*
FA-
18C/D*
431.67
25 107.9 19.2 - 53.0 3.5 3.1 50.1 1.04 - 2.86 0.19 0.17 2.70
FA-
18E/F* 25 107.9
7.5 - 152.5 1.2 21.3 67.8 0.40 - 8.23 0.07 1.15 3.66
F-35B* 20 86.3 8.0 19898.7 44.6 0.5 2.5 30.5 0.34 858.96 1.92 0.02 0.11 1.32
F-35C* 30 129.5 7.9 19645.7 43.5 0.5 2.4 30.2 0.51 1272.06 2.82 0.03 0.16 1.96
Total 3.25 3740.83 28.70 0.37 2.74 11.29
* Emission Factors obtained from the following:
MV-22: AESO Memorandum Report No. 9946 Revision E, January 2001
CH-53E: AESO Memorandum Report No. 9822 Revision C, February 2000
AH-1Y: AESO Memorandum Report No. 9824 Revision B, November 2009
UH-1: AESO Memorandum Report No. 9904 Revision B, November 2009
KC-130: AESO Memorandum Report No. 2000-10 Revision B, January 2001
C-17: Air Emissions Guide for Air Force Mobile Sources, AFCEE, August 2013, page 28, Emission -page 46 F/A-18: AESO Memorandum Report No. 9933 Revision D, circle emission factor
F-35: Joint Strike Fighter (JSF) emission factor worksheets (Joint Strike Fighter Work Force 2009)

CJMT EIS/OEIS Appendix G
April 2015 Draft Air Quality
G-97
Range Emissions – Pagan
Total hr
in
Airspace
< 3,000
FT
Percentage
Total hr
in
Airspace
< 3,000
FT per
Aircraft
Emission Factors for One hour of Cruise Time (lb/hr) Cruise Emissions (tons)
Type Model Pagan Pagan CO CO2 NOx VOC SO2 PM10 or PM2.5 CO CO2 NOx VOC SO2 PM10 or PM2.5
Transport
Tilt-rotor MV-22 55.28 100 55.3 2.0 12258.4 53.8 0.0 1.5 6.0 0.06 338.81 1.49 0.00 0.04 0.17
Transport
Rotary Wing CH-53E 105.00 100 105.0 9.5 - 36.1 0.7 1.8 9.9 0.50 - 1.90 0.04 0.09 0.52
Attack Helo AH-1Y
55.56 50 27.8 9.0 2734.5 4.7 0.5 0.3 3.6 0.12 37.98 0.07 0.01 0.00 0.05
UH-1Z 50 27.8 0.7 2220.7 4.0 0.1 0.3 2.9 0.01 30.84 0.06 0.00 0.00 0.04
Transport
Fixed Wing
KC-130 90.00
50 45.0 9.3 14458.0 36.7 2.1 1.8 17.9 0.21 325.30 0.83 0.05 0.04 0.40
C-17 50 45.0 13.3 135406.4 1362.2 1.7 44.1 96.2 0.30 3046.64 30.65 0.04 0.99 2.16
Unmanned RQ-7 320.0 100 320.0 - - - - - - - - - - - -
Fighter (not
including
FCLP)*
FA-18C/D*
208.89
25 52.2 19.2 - 53.0 3.5 16.2 50.1 0.50 - 1.39 0.09 0.08 1.31
FA-18E/F* 25 52.2 7.5 - 152.5 1.2 21.3 67.8 0.19 - 2.45 0.03 0.08 1.33
F-35B* 20 41.8 8.0 19898.7 44.6 0.5 2.5 30.5 0.17 415.66 0.93 0.01 0.05 0.64
F-35C* 30 62.7 7.9 19645.7 43.5 0.5 2.4 30.2 0.25 615.56 1.36 0.01 0.08 0.95
Total 2.31 4810.82 42.64 0.28 2.29 8.00
* Emission Factors obtained from the following:
MV-22: AESO Memorandum Report No. 9946 Revision E, January 2001
CH-53E: AESO Memorandum Report No. 9822 Revision C, February 2000
AH-1Y: AESO Memorandum Report No. 9824 Revision B, November 2009
UH-1: AESO Memorandum Report No. 9904 Revision B, November 2009
KC-130: AESO Memorandum Report No. 2000-10 Revision B, January 2001
C-17: Air Emissions Guide for Air Force Mobile Sources, AFCEE, August 2013, page 28, Emission -page 46
F/A-18: AESO Memorandum Report No. 9933 Revision D, circle emission factor
F-35: Joint Strike Fighter (JSF) emission factor worksheets (Joint Strike Fighter Work Force 2009)

CJMT EIS/OEIS Appendix G
April 2015 Draft Air Quality
G-98
Attachment 4 - Vehicle and Other Mobile Source Emissions Estimate

CJMT EIS/OEIS Appendix G
April 2015 Draft Air Quality
G-99
Vessels – Tinian
Type Number
Annual
Total
Operating
Hours
Number
of
hours
per
training
event
Total
number
of
annual
training
events
Number
of
Engines
BHP /
kW
Load
Factor
Speed
(mph)
Emission Factors (g/kWh, g/HP-hr or g/mi) Emissions (tons)
NOx PM10 PM2.5 VOC CO SOx CO2 NOx PM10 PM2.5 VOC CO SOx CO2
Joint High Speed
Vessel (JHSV)/
HSV (i.e., WPE)
1 180 12 15 4 12,203 80 13.2 0.47 0.43 0.5 1.1 3.97 646.08 102.27 3.64 3.33 3.87 8.52 30.76 5005.87
Barge 1 180 12 15 2 4,000 17
17 0.45 0.42 0.6 1.4 3.62 588.79 3.42 0.09 0.08 0.12 0.28 0.73 118.48
LCU (Landing
Craft Utility) 1 180 12 15 2 680 17
17 0.45 0.42 0.6 1.4 3.62 588.79 0.58 0.02 0.01 0.02 0.05 0.12 20.14
Total
106.28 3.75 3.43 4.02 8.85 31.61 5144.48
Ground Vehicles – Tinian
Type Number
Annual
Total
Operating
Hours
Number
of
hours
per
training
event
Total
number
of
annual
training
events
Number
of
Engines
BHP /
kW
Load
Factor
Speed
(mph)
Emission Factors (g/kWh, g/HP-hr or g/mi) Emissions (tons)
NOx PM10 PM2.5 VOC CO SOx CO2 NOx PM10 PM2.5 VOC CO SOx CO2
Landing Vehicles
LAV-25 7 672 12 56 1 275 21
6.79 0.82 0.80 1.34 5.36 0.13 623.1 2.03 0.25 0.24 0.40 1.60 0.04 186.60
AAV 14 672 12 56 1 400 21
6.79 0.74 0.71 1.19 5.68 0.13 623.6 5.92 0.64 0.62 1.04 4.94 0.12 543.21
LCAC 4 672 12 42 4 5,500 80
4.44 0.29 0.29 0.25 1.15 0.45
129.50 8.46 8.46 7.29 33.54 13.12 0.00
Tactical Vehicles
HMMV 63 840 12 70 1 160 59
4.50 0.33 0.32 0.37 1.57 0.12 536.2 0.39 0.03 0.03 0.03 0.14 0.01 46.87
MTVR 30 840 12 70 1 440 59
4.97 0.29 0.28 0.31 2.26 0.12 536.4 1.20 0.07 0.07 0.07 0.54 0.03 128.93
D7 Bulldozer 3 840 12 70 1 200 59
4.16 0.26 0.25 0.32 1.29 0.12 536.38 0.45 0.03 0.03 0.03 0.14 0.01 58.61
Rough Terrain
Forklift 2 840
12 70 1 81.6 59
5.15 0.63 0.61 0.60 4.22 0.13 594.90
0.23 0.03 0.03 0.03 0.19 0.01 26.52
MTVR Dump
Truck 1 840
12 70 1 440 59
4.97 0.29 0.28 0.31 2.26 0.12 536.4
1.20 0.07 0.07 0.07 0.54 0.03 128.93
Logistics
Vehicle System 4 840
12 70
600 21
6.79 0.74 0.71 1.19 5.68 0.13 623.6
0.79 0.09 0.08 0.14 0.66 0.02 72.75
Total
141.71 109.13 19.38 9.11 42.31 13.38 1192.42

CJMT EIS/OEIS Appendix G
April 2015 Draft Air Quality
G-100
Ground Vehicles (Fugitive Dust) – Tinian
Type Number
Annual
Total
Operating
Hours
Number
of
hours
per
training
event
Total
number
of
annual
training
events
Speed
(mph)
Average
Driving
Time
Percentage
Total
Annual
Miles
Emission Factors
(lb/VMT)
Emissions
(tons)
PM10 PM2.5 PM10 PM2.5
Landing Vehicles
LAV-25 7 672 12 56 >5 NA NA NA NA - -
AAV 14 672 12 56 >5 NA NA NA NA - -
LCAC 4 672 12 42 >5 NA NA NA NA - -
Tactical Vehicles
HMMV 63 840 12 70 30 50% 793800 0.1611 0.0158 63.94 6.27
MTVR 30 840 12 70 30 50% 378000 0.1611 0.0158 30.45 2.99
D7 Bulldozer 3 840 12 70 >5 NA NA NA NA - -
Rough
Terrain
Forklift
2 840 12 70 >5 NA NA NA NA - -
MTVR Dump
Truck 1 840 12 70 30 50% 12600 0.1611 0.0158 1.01 0.10
Logistics
Vehicle
System
4 840 12 70 30 50% 50400 0.1611 0.0158 4.06 0.40
Total 99.46 9.76

CJMT EIS/OEIS Appendix G
April 2015 Draft Air Quality
G-101
Support Equipment – Tinian
Type Number
Annual
Total
Operati
ng
Hours
Number
of hours
per
training
event
Total
numbe
r of
annual
training
events
Number
of
Engines
BHP /
kW
Load
Factor
Speed
(mph)
Emission Factors (g/kWh, g/HP-hr or g/mi) Emissions (tons)
NOx PM10 PM2.5 VOC CO SOx CO2 NOx PM10 PM2.5 VOC CO SOx CO2
Buses (troop
transport) 8 420 12 35
30 7.90 0.78 0.63 0.39 2.61 0.02 2188.50 0.00 0.00 0.00 0.00 0.00 0.00 0.27
Sedans (for
staff use) 2 210 6 35
30 0.19 0.03 0.01 0.07 3.02 0.01 369.39 0.00 0.00 0.00 0.00 0.00 0.00 0.01
4WD truck
(range
maintenance)
15 1680 12 140
160 59
4.50 0.33 0.32 0.37 1.57 0.12 536.2 0.79 0.06 0.06 0.06 0.27 0.02 93.74
MTVR 7 ton
truck (range
maintenance)
5 840 6 140 1 440 59
4.97 0.29 0.28 0.31 2.26 0.12 536.4 1.20 0.07 0.07 0.07 0.54 0.03 128.93
Commercial
flatbed truck 5 420 6 70
30 5.72 0.56 0.45 0.32 1.88 0.02 2586.72 0.00 0.00 0.00 0.00 0.00 0.00 0.20
D7 Bulldozer 2 420 6 70 1 200 59
4.16 0.26 0.25 0.32 1.29 0.12 536.38 0.23 0.01 0.01 0.02 0.07 0.01 29.30
Front End
Loader 2 420 6 70
242.6 59
5.05 0.33 0.32 0.37 2.09 0.12 539.44 0.33 0.02 0.02 0.02 0.14 0.01 35.74
MTVR 7 ton
Dump Truck 2 420 6 70 1 440 59
4.97 0.29 0.28 0.31 2.26 0.12 536.4 0.60 0.04 0.03 0.04 0.27 0.01 64.47
Rough Terrain
Forklift 1 840 6 140 1 81.6 59
5.15 0.63 0.61 0.60 4.22 0.13 594.90 0.23 0.03 0.03 0.03 0.19 0.01 26.52
Material
Handling
Equipment
(Rough Terrain)
1 840 6 140 1 81.6 21
7.91 1.25 1.21 1.82 7.62 0.15 691.22 0.13 0.02 0.02 0.03 0.12 0.00 10.97
Fire Trucks
(Brush Trucks) 3 560 4 140
30 5.72 0.56 0.45 0.32 1.88 0.02 2586.72 0.00 0.00 0.00 0.00 0.00 0.00 0.16
Firefighting
Water Supply
Trucks
1 560 4 140
30 5.72 0.56 0.45 0.32 1.88 0.02 2586.72 0.00 0.00 0.00 0.00 0.00 0.00 0.05
Extended Boom
Forklift 1 840 6 140
93.9 59
4.16 0.37 0.36 0.37 2.88 0.12 573.48 0.21 0.02 0.02 0.02 0.15 0.01 29.42
4WD 4-
Passenger
Gators with
dump bed
8 840 6 140
160 59
3.74 0.31 0.30 0.32 1.42 0.12 536.35 0.33 0.03 0.03 0.03 0.12 0.01 46.88

CJMT EIS/OEIS Appendix G
April 2015 Draft Air Quality
G-102
Support Equipment – Tinian
Type Number
Annual
Total
Operati
ng
Hours
Number
of hours
per
training
event
Total
numbe
r of
annual
training
events
Number
of
Engines
BHP /
kW
Load
Factor
Speed
(mph)
Emission Factors (g/kWh, g/HP-hr or g/mi) Emissions (tons)
NOx PM10 PM2.5 VOC CO SOx CO2 NOx PM10 PM2.5 VOC CO SOx CO2
Gang Mowers
w/Tractor 2 2160 12 180
145 59
5.66 0.46 0.45 0.53
2.5
3 0.12 535.75 1.15 0.09 0.09 0.11 0.52 0.02 109.13
Bush Hog
w/Tractor 2 2160 12 180
145 59
5.66 0.46 0.45 0.53
2.5
3 0.12 535.75 1.15 0.09 0.09 0.11 0.52 0.02 109.13
Mower (John
Deere 850) 4 2160 12 180
145 59
5.66 0.46 0.45 0.53
2.5
3 0.12 535.75 1.15 0.09 0.09 0.11 0.52 0.02 109.13
Total
7.50 16.48 2.12 0.64 3.43 0.17 794.05
Support Equipment (Fugitive Dust) – Tinian
Type Number
Annual
Total
Operat
ing
Hours
Number
of hours
per
training
event
Total
numbe
r of
annual
training
events
Speed
(mph)
Average
Driving
Time
Percentag
e
Total
Annual
Miles
Emission Factors
(lb/VMT) Emissions (tons)
PM10 PM2.5 PM10 PM2.5
Buses (troop transport) 8 420 12 35 30 50% 50400 0.1611 0.0158 4.06 0.40
Sedans (for staff use) 2 210 6 35 30 50% 6300 0.1611 0.0158 0.51 0.05
4WD truck (range
maintenance) 15 1680 12 140 >5 NA NA NA NA - -
MTVR 7 ton truck (range
maintenance) 5 840 6 140 30 50% 63000 0.1611 0.0158 5.07 0.50
Commercial flatbed truck 5 420 6 70 30 50% 31500 0.1611 0.0158 2.54 0.25
D7 Bulldozer 2 420 6 70 >5 NA NA NA NA - -
Front End Loader 2 420 6 70 >5 NA NA NA NA - -
MTVR 7 ton Dump Truck 2 420 6 70 30 50% 12600 0.1611 0.0158 1.01 0.10
Rough Terrain Forklift 1 840 6 140 >5 NA NA NA NA - -
Material Handling 1 840 6 140 >5 NA NA NA NA - -

CJMT EIS/OEIS Appendix G
April 2015 Draft Air Quality
G-103
Support Equipment (Fugitive Dust) – Tinian
Type Number
Annual
Total
Operat
ing
Hours
Number
of hours
per
training
event
Total
numbe
r of
annual
training
events
Speed
(mph)
Average
Driving
Time
Percentag
e
Total
Annual
Miles
Emission Factors
(lb/VMT) Emissions (tons)
PM10 PM2.5 PM10 PM2.5
Equipment (Rough Terrain)
Fire Trucks (Brush Trucks) 3 560 4 140 30 50% 25200 0.1611 0.0158 2.03 0.20
Firefighting Water Supply
Trucks 1 560 4 140 30 50% 8400 0.1611 0.0158 0.68 0.07
Extended Boom Forklift 1 840 6 140 >5 NA NA NA NA - -
4WD 4-Passenger Gators
with dump bed 8 840 6 140 >5 NA NA NA NA - -
Gang Mowers w/Tractor 2 2160 12 180 >5 NA NA NA NA - -
Bush Hog w/Tractor 2 2160 12 180 >5 NA NA NA NA - -
Mower (John Deere 850) 4 2160 12 180 >5 NA NA NA NA - -
Total
15.90 1.57

CJMT EIS/OEIS Appendix G
April 2015 Draft Air Quality
G-104
Vessels – Pagan
Type Number
Annual
Total
Operating
Hours
Number
of
hours
per
training
event
Total
number
of
annual
training
events
Number
of
Engines
BHP /
kW
Load
Factor
Speed
(mph)
Emission Factors (g/kWh, g/HP-hr or g/mi) Emissions (tons)
NOx PM10 PM2.5 VOC CO SOx CO2 NOx PM10 PM2.5 VOC CO SOx CO2
Joint High
Speed Vessel 1 0
0 0 4 12,203
80
13.2 0.47 0.43 0.5 1.1 3.97 646.08 0.00 0.00 0.00 0.00 0.00 0.00 0.00
Barge 1 252 6 42 2 4,000 17 17 0.45 0.42 0.6 1.4 3.62 588.79 4.79 0.13 0.12 0.17 0.39 1.02 165.87
LCU (Landing
Craft Utility) 1 1680
24 70 2 680
17 17 0.45 0.42 0.6 1.4 3.62 588.79
5.43 0.14 0.13 0.19 0.45 1.16 187.99
Total 10.22 0.27 0.25 0.36 0.84 2.18 353.86

CJMT EIS/OEIS Appendix G
April 2015 Draft Air Quality
G-105
Ground Vehicles – Pagan
Type Number
Annual
Total
Operating
Hours
Number
of
hours
per
training
event
Total
number
of
annual
training
events
Number
of
Engines
BHP
/ kW
Load
Factor
Speed
(mph)
Emission Factors (g/kWh, g/HP-hr or g/mi) Emissions (tons)
NOx PM10 PM2.5 VOC CO SOx CO2 NOx PM10 PM2.5 VOC CO SOx CO2
Landing
Vehicles
LAV-25 7 936 12 78 1 275 21
6.79 0.82 0.80 1.34 5.36 0.13 623.1 2.83 0.34 0.33 0.56 2.23 0.06 259.90
AAV 14 936 12 78 1 400 21
6.79 0.74 0.71 1.19 5.68 0.13 623.6 8.24 0.89 0.87 1.44 6.89 0.16 756.62
LCAC 4 1248 12 104 4 5,500 80
4.44 0.29 0.29 0.25 1.15 0.45
320.66 20.94 20.94 18.05 83.05 32.50 0.00
Tactical
Vehicles
HMMV 63
6 35 1 160 59
4.50 0.33 0.32 0.37 1.57 0.12 536.2 0.63 0.05 0.04 0.05 0.22 0.02 74.99
MTVR 30
6 35 1 440 59
4.97 0.29 0.28 0.31 2.26 0.12 536.4 1.02 0.06 0.06 0.06 0.47 0.02 110.51
D7 Bulldozer 3
6 35 1 200 59
4.16 0.26 0.25 0.32 1.29 0.12 536.38 0.39 0.02 0.02 0.03 0.12 0.01 50.23
Rough Terrain
Forklift 2
6 35 1 81.6 59
5.15 0.63 0.61 0.60 4.22 0.13 594.90
0.20 0.02 0.02 0.02 0.16 0.00 22.73
MTVR Dump
Truck 1
6 35 1 440 59
4.97 0.29 0.28 0.31 2.26 0.12 536.4
0.68 0.04 0.04 0.04 0.31 0.02 73.68
Logistics
Vehicle
System
4
6 35
600 21
6.79 0.74 0.71 1.19 5.68 0.13 623.6
0.79 0.09 0.08 0.14 0.66 0.02 72.75
Total
335.45 155.51 35.46 20.41 94.12 32.80 1421.42

CJMT EIS/OEIS Appendix G
April 2015 Draft Air Quality
G-106
Ground Vehicles (Fugitive Dust) – Pagan
Type Number
Annual
Total
Operating
Hours
Number
of
hours
per
training
event
Total
number
of
annual
training
events
Speed
(mph)
Average
Driving
Time
Percentage
Total
Annual
Miles
Emission Factors
(lb/VMT) Emissions (tons)
PM10 PM2.5 PM10 PM2.5
Landing Vehicles
LAV-25 7 936 12 78 <5 NA NA NA NA - -
AAV 14 936 12 78 <5 NA NA NA NA - -
LCAC 4 1248 12 104 <5 NA NA NA NA - -
Tactical Vehicles
HMMV 63 1344 12 112 30 50% 1270080 0.1611 0.0158 102.31 10.03
MTVR 30 720 12 60 30 50% 324000 0.1611 0.0158 26.10 2.56
D7 Bulldozer 3 720 12 60 <5 NA NA NA NA - -
Rough
Terrain
Forklift
2 720 12 60 <5 NA NA NA NA - -
MTVR Dump
Truck 1 480 12 40 30 50% 7200 0.1611 0.0158 0.58 0.06
Logistics
Vehicle
System
4 840 12 70 30 50% 50400 0.1611 0.0158 4.06 0.40
Total 133.05 13.05

CJMT EIS/OEIS Appendix G
April 2015 Draft Air Quality
G-107
Support Equipment – Pagan
Type Number
Annual
Total
Operating
Hours
Number
of hours
per
training
event
Total
number
of
annual
training
events
Number
of
Engines
BHP /
kW
Load
Factor
Speed
(mph)
Emission Factors (g/kWh, g/HP-hr or g/mi) Emissions (tons)
NOx PM10 PM2.5 VOC CO SOx CO2 NOx PM10 PM2.5 VOC CO SOx CO2
4WD truck
(range
maintenance)
1 720 12 60
160 59
4.50 0.33 0.32 0.37 1.57 0.12 536.2 0.34 0.02 0.02 0.03 0.12 0.01 40.17
Rough
Terrain
Forklift
1 480 8 60 1 81.6 59
5.15 0.63 0.61 0.60 4.22 0.13 594.90 0.13 0.02 0.02 0.02 0.11 0.00 15.15
Material
Handling
Equipment
(Rough
Terrain)
1 480 8 60 1 81.6 21
7.91 1.25 1.21 1.82 7.62 0.15 691.22 0.07 0.01 0.01 0.02 0.07 0.00 6.27
Fire Trucks
(Brush
Trucks)
3 240 4 60
30 5.72 0.56 0.45 0.32 1.88 0.02 2586.72 0.00 0.00 0.00 0.00 0.00 0.00 0.07
Fire Fighting
Water Supply
Trucks
1 240 4 60
30 5.72 0.56 0.45 0.32 1.88 0.02 2586.72 0.00 0.00 0.00 0.00 0.00 0.00 0.02
Extended
Boom Forklift 1 480 8 60
93.9 59
4.16 0.37 0.36 0.37 2.88 0.12 573.48 0.12 0.01 0.01 0.01 0.08 0.00 16.81
Bush Hog
w/Tractor 2 480 8 60
145 59
5.66 0.46 0.45 0.53 2.53 0.12 535.75 0.26 0.02 0.02 0.02 0.11 0.01 24.25
Total
0.92 1.24 0.20 0.09 0.49 0.02 102.75
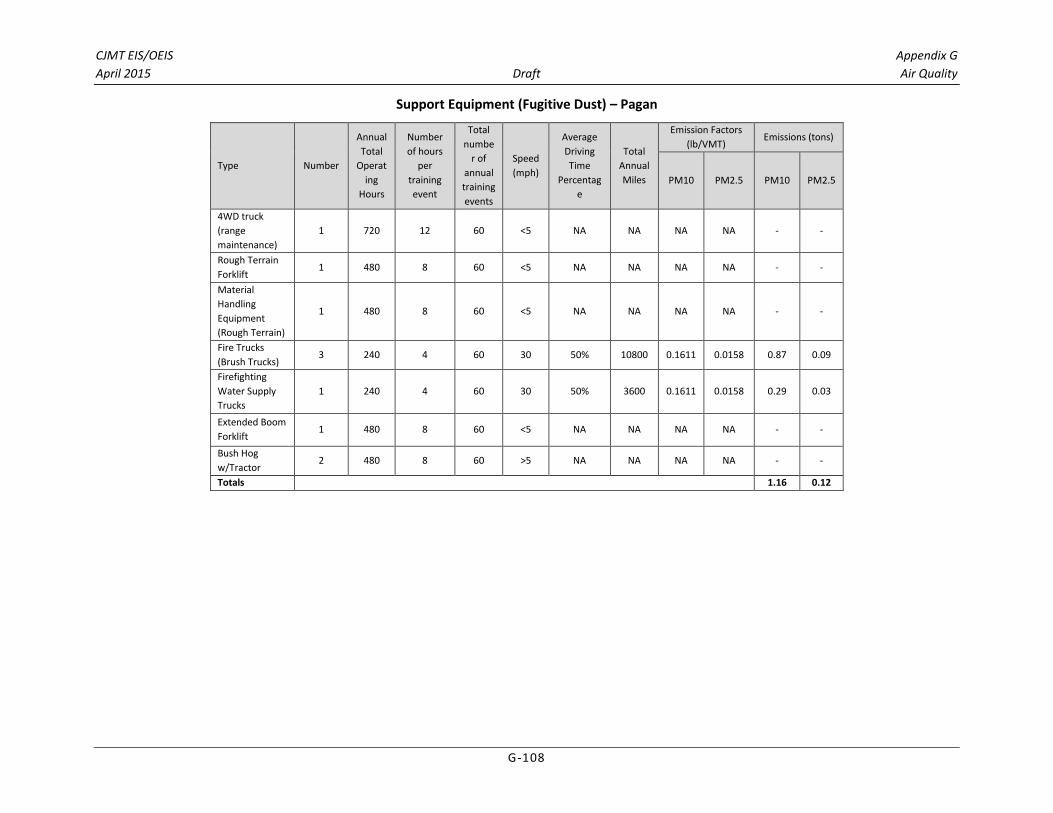
CJMT EIS/OEIS Appendix G
April 2015 Draft Air Quality
G-108
Support Equipment (Fugitive Dust) – Pagan
Type Number
Annual
Total
Operat
ing
Hours
Number
of hours
per
training
event
Total
numbe
r of
annual
training
events
Speed
(mph)
Average
Driving
Time
Percentag
e
Total
Annual
Miles
Emission Factors
(lb/VMT) Emissions (tons)
PM10 PM2.5 PM10 PM2.5
4WD truck
(range
maintenance)
1 720 12 60 <5 NA NA NA NA - -
Rough Terrain
Forklift 1 480 8 60 <5 NA NA NA NA - -
Material
Handling
Equipment
(Rough Terrain)
1 480 8 60 <5 NA NA NA NA - -
Fire Trucks
(Brush Trucks) 3 240 4 60 30 50% 10800 0.1611 0.0158 0.87 0.09
Firefighting
Water Supply
Trucks
1 240 4 60 30 50% 3600 0.1611 0.0158 0.29 0.03
Extended Boom
Forklift 1 480 8 60 <5 NA NA NA NA - -
Bush Hog
w/Tractor 2 480 8 60 >5 NA NA NA NA - -
Totals
1.16 0.12

CJMT EIS/OEIS Appendix G
April 2015 Draft Air Quality
G-109
Attachment 5 - Generator Emissions

CJMT EIS/OEIS Appendix G
April 2015 Draft Air Quality
G-110
CJMT Generator Emissions – Tinian
Generator Power (kW)
Generator Power (HP)
Annual Hours
Diesel Generator Emission Factor (lb/hp-hr)1 Diesel Generator Annual Emissions (TPY)
VOC3 NOx2 CO PM10 PM2.5 SOx CO2 VOC NOx CO PM10 PM2.5 SOx CO2
Tinian
Emergency Generator w/ 153 Sub-Base Fuel Tank & 3,000 gal AST double-walled 200 268 1600 0.00071 0.024 0.0055 0.0004 0.00034 0.0004 1.16 0.15 5.15 1.18 0.09 0.07 0.09 248.9
Emergency Generator w/ 90 Sub-Base Fuel Tank & 2,000 gal AST double-walled 100 134 1600 0.00071 0.024 0.0055 0.0004 0.00034 0.0004 1.16 0.08 2.57 0.59 0.04 0.04 0.04 124.4
Emergency Generator w/ 54 Sub-Base Fuel Tank & 1000 gal AST double-walled 30 40 1600 0.00071 0.024 0.0055 0.0004 0.00034 0.0004 1.16 0.02 0.77 0.18 0.01 0.01 0.01 37.3
Back-up Generator for surface radar stations (6x100kw) 600 805 500 0.00071 0.024 0.0055 0.0004 0.00034 0.0004 1.16 0.14 4.83 1.11 0.08 0.07 0.08 233.3
Back-up Generator for Base Camp (2x250kw) 500 671 500 0.00071 0.024 0.0055 0.0004 0.00034 0.0004 1.16 0.12 4.02 0.92 0.07 0.06 0.07 194.4
Back-up Generator for Base Camp (2x200kw) 400 536 1600 0.00071 0.024 0.0055 0.0004 0.00034 0.0004 1.16 0.09 3.22 0.74 0.05 0.04 0.05 155.6
Total
0.60 20.57 4.71 0.34 0.29 0.35 994.00
Notes 1. USEPA AP-42 emission factors for large diesel engines
2. Uncontrolled NOx emission factor 3. VOC emissions use TOC (as CH4) emission factor

CJMT EIS/OEIS Appendix G
April 2015 Draft Air Quality
G-111
4. Assumed Low Sulfur Diesel (500 ppm) 5. 7000 Btu/hp-hr

CJMT EIS/OEIS Appendix G
April 2015 Draft Air Quality
G-112
CJMT Generator Emissions – Pagan
Generator Power (kW)
Generator Power (HP)
Annual Hours
# of Generators
Total Hours
Diesel Generator Emission Factor (lb/hp-hr)1 Diesel Generator Annual Emissions (TPY)
VOC3 NOx2 CO PM10 PM2.5 SOx CO2 VOC NOx CO PM10 PM2.5 SOx CO2
Pagan
30kW Generator (MEP-1060)
30 40 3648 10 36480 0.00071 0.024 0.0055 0.0004 0.00034 0.0004 1.16 0.52 17.61 4.04 0.29 0.25 0.30 851.20
Total
0.52 17.61 4.04 0.29 0.25 0.30 851.20
Notes
1. USEPA AP-42 emission factors for large diesel engines
2. Uncontrolled NOx emission factor
3. VOC emissions use TOC (as CH4) emission factor
4. Assumed Low Sulfur Diesel (500 ppm)
5. 7000 Btu/hp-hr

CJMT EIS/OEIS Appendix G
April 2015 Draft Air Quality
G-113
Attachment 6 - Solid Waste Transfer Emissions

CJMT EIS/OEIS Appendix G
April 2015 Draft Air Quality
G-114
Solid Waste Transfer Emissions – Tinian
Solid Waste Transfer Emission Factors (g/kWh, g/HP-hr or g/mi) Emissions (tons)
Type Number of Units
Days Hours BHP / kW or Horsepower
(hp)
Load Factor
(%) VOC NOx CO PM10 PM2.5 SOx CO2 VOC NOx CO PM10 PM2.5 SOx CO2
Barge 1 20 40 4000 17 0.60 17.00 1.40 0.45 0.42 3.62 588.79 0.01 0.38 0.03 0.01 0.01 0.08 13.16
Loader 1 140 1120 93 21 1.47 6.80 6.42 1.01 0.98 0.14 662.28 0.03 0.12 0.12 0.02 0.02 0.00 11.97
Grapple/Skidder 1 140 1120 203 59 0.30 4.02 1.45 0.27 0.26 0.12 537.81 0.03 0.44 0.16 0.03 0.03 0.01 59.43
Total 0.07 0.95 0.31 0.06 0.06 0.10 84.56

CJMT EIS/OEIS Appendix G
April 2015 Draft Air Quality
G-115
Attachment 7 - Annual Munitions Emissions

CJMT EIS/OEIS Appendix G
April 2015 Draft Air Quality
G-116
Representative Annual Munitions Estimate – Tinian
System Type Ammunition Type Annual Total Ordnance/ Ammunition
Expenditure Estimate - Tinian
Field Artillery / Mortar / Rocket / Grenade
Artillery 155 mm HE 13,600
Artillery 155 mm Illum 1,060
Artillery 155 mm Smoke 660
Mortar 120 mm HE 6,600
Mortar 120 mm Illum 1,670
Mortar 120 mm Smoke 1,670
Rocket (Personnel) 21 mm 4,100
Shoulder Mounted Assault Weapon Practice Round 890
Grenade Launcher 40 mm TP 7,370
Mortar 60 mm HE 1,450
Mortar 60 mm Illum 340
Mortar 60 mm Smoke 170
Mortar 60 mm Inert 1,540
66 mm HE 370
Mortar 81 mm HE 1,630
Mortar 81 mm Illum 610
Mortar 81 mm Smoke 340
Rocket (Personnel) 83 mm 400
Rocket (Personnel) 84 mm 370
Hand Grenade Grenade (practice) 6,170
Hand Grenade HE Fragmentation 3,190
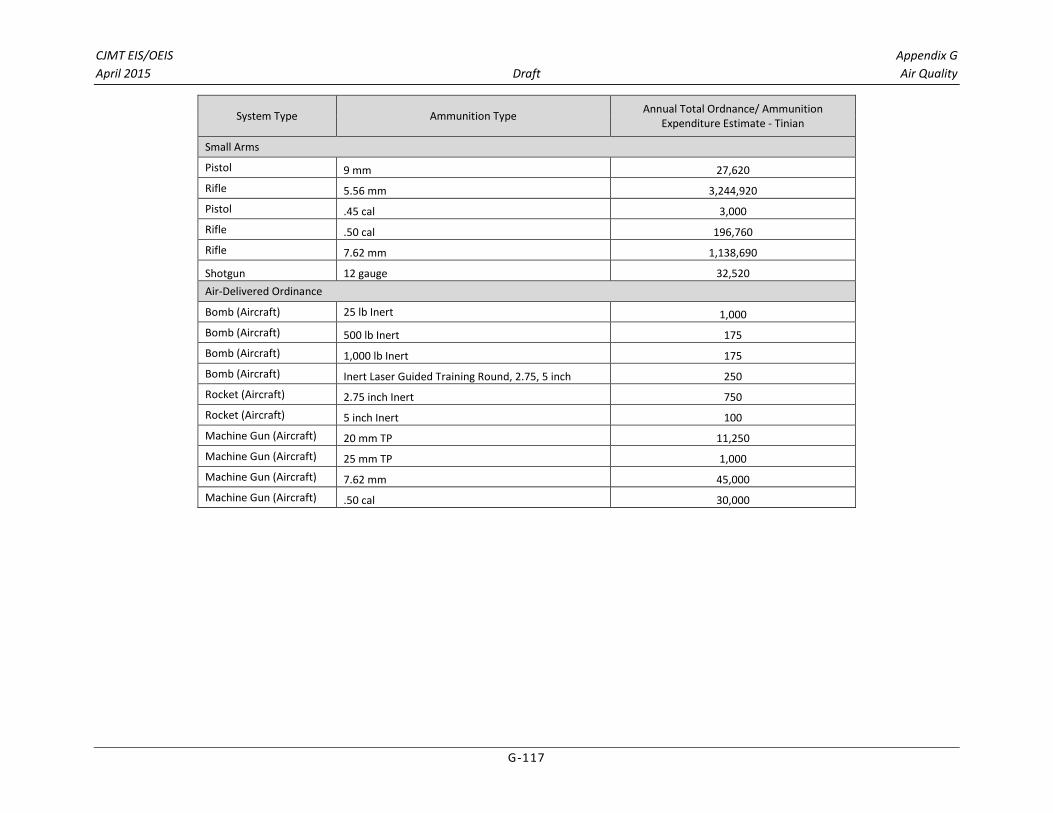
CJMT EIS/OEIS Appendix G
April 2015 Draft Air Quality
G-117
System Type Ammunition Type Annual Total Ordnance/ Ammunition
Expenditure Estimate - Tinian
Small Arms
Pistol 9 mm 27,620
Rifle 5.56 mm 3,244,920
Pistol .45 cal 3,000
Rifle .50 cal 196,760
Rifle 7.62 mm 1,138,690
Shotgun 12 gauge 32,520
Air-Delivered Ordinance
Bomb (Aircraft) 25 lb Inert 1,000
Bomb (Aircraft) 500 lb Inert 175
Bomb (Aircraft) 1,000 lb Inert 175
Bomb (Aircraft) Inert Laser Guided Training Round, 2.75, 5 inch 250
Rocket (Aircraft) 2.75 inch Inert 750
Rocket (Aircraft) 5 inch Inert 100
Machine Gun (Aircraft) 20 mm TP 11,250
Machine Gun (Aircraft) 25 mm TP 1,000
Machine Gun (Aircraft) 7.62 mm 45,000
Machine Gun (Aircraft) .50 cal 30,000

CJMT EIS/OEIS Appendix G
April 2015 Draft Air Quality
G-118
Representative Annual Munitions Estimate – Pagan
System Type Ammunition Type Annual Total Ordnance/Ammunition
Expenditure Estimate - Pagan
Field Artillery Fire Range
Artillery 155 mm HE 592
Artillery 155 mm Illum 40
Artillery 155 mm Smoke 320
Mortar 120 mm HE 200
Mortar 120 mm Smoke 200
Mortar 81 mm Smoke 40
Small Arms
Rifle 5.56 mm 382,575
Machine Gun .50 cal 36,800
Rifle 7.62 mm 192,960
Grenade/Mortar/Rocket
Grenade Launcher 40 mm HE 10,460
Mortar 60 mm HE 480
Mortar 60 mm Illum 80
Mortar 60 mm Smoke 40
Mortar 81 mm HE 1000
Mortar 81 mm Illum 80
Mortar 81 mm Smoke 40
Rocket (Personnel) 83 mm HE 8
Missile (Personnel) TOW HEAT 4
Rocket (Personnel) AT-4 HE 4
Machine Gun (Aircraft) 20 mm TP 160

CJMT EIS/OEIS Appendix G
April 2015 Draft Air Quality
G-119
System Type Ammunition Type Annual Total Ordnance/Ammunition
Expenditure Estimate - Pagan
Air-Delivered Ordnance Bomb (Aircraft) 25 lb Inert 1,000
Bomb (Aircraft) 500 lb Inert 175
Bomb (Aircraft) 500 lb HE 175
Bomb (Aircraft) 1,000 lb HE 175
Bomb (Aircraft) 2,000 lb HE 175
Rocket (Aircraft) 2.75 inch HE 500
Rocket (Aircraft) 2.75 inch Illum 50
Rocket (Aircraft) 2.75 inch Smoke 75
Rocket (Aircraft) 5 inch HE 150
Machine Gun (Aircraft) 20 mm TP 11,250
Machine Gun (Aircraft) 25 mm TP 1,000
Machine Gun (Aircraft) 7.62 mm 45,000
Machine Gun (Aircraft) .50 cal 30,000
Round (Aircraft) LGTR Inert 250
System Type Ammunition Type Annual Total Ordnance/Ammunition
Expenditure Estimate - Pagan
Naval Ship Delivered Ordnance
Naval Gun (Ship) 5 inch HE 150
Air-to-Air Ordnance and Expendables (Warning Areas Only)
AIM 7 5
AIM 9 5
AIM 120 3
Dispenser (Aircraft) Chaff 2,400
Dispenser (Aircraft) Flares 2,400

CJMT EIS/OEIS Appendix G
April 2015 Draft Air Quality
G-120
Annual Munitions Emissions – Tinian
Ammunition Type
Annual Total
Ordnance/ Ammunition Expenditure Estimate -
Tinian
Emission Factors (lb/Round) Emissions (tons)
SO2 CO PM10 PM2.5 NOX VOC CO2 SO2 CO PM10 PM2.5 NOX VOC CO2
Field Artillery / Mortar / Rocket / Grenade
155 mm HE 13,600 2.70E-03 6.03E+00 3.32E+00 1.40E-01 1.73E-01 1.50E-03 6.50E+00 1.84E-02 4.10E+01 2.26E+01 9.52E-01 1.18E+00 1.02E-02 4.42E+01
155 mm Illum 1,060 2.70E-03 6.03E+00 3.32E+00 1.40E-01 1.73E-01 1.50E-03 6.50E+00 1.43E-03 3.19E+00 1.76E+00 7.42E-02 9.17E-02 7.95E-04 3.45E+00
155 mm Smoke 660 2.70E-03 6.03E+00 3.32E+00 1.40E-01 1.73E-01 1.50E-03 6.50E+00 8.91E-04 1.99E+00 1.10E+00 4.62E-02 5.71E-02 4.95E-04 2.15E+00
120 mm HE 6,600 0.00E+00 4.70E-01 3.64E-01 1.90E-01 3.40E-02 0.00E+00 5.47E+00 0.00E+00 1.55E+00 1.20E+00 6.27E-01 1.12E-01 0.00E+00 1.80E+01
120 mm Illum 1,670 7.80E-04 5.15E-01 4.08E-01 2.01E-01 3.03E-02 2.10E-03 6.99E-01 6.51E-04 4.30E-01 3.41E-01 1.68E-01 2.53E-02 1.75E-03 5.84E-01
120 mm Smoke 1,670 8.40E-04 5.17E-01 1.23E+01 1.29E+01 1.93E-02 0.00E+00 9.19E-01 7.01E-04 4.32E-01 1.03E+01 1.08E+01 1.61E-02 0.00E+00 7.68E-01
21 mm 4,100 0.00E+00 3.30E-02 6.60E-04 4.60E-04 4.30E-04 0.00E+00 1.60E-02 0.00E+00 6.77E-02 1.35E-03 9.43E-04 8.82E-04 0.00E+00 3.28E-02
Shoulder Mounted Assault Weapon Practice Round 890 6.00E-04 3.30E-03 6.00E-03 6.00E-03 2.35E-03 2.05E-04 3.85E+00 2.67E-04 1.47E-03 2.67E-03 2.67E-03 1.05E-03 9.12E-05 1.71E+00
40 mm TP 7,370 0.00E+00 3.50E-04 2.60E-05 2.30E-05 3.60E-05 0.00E+00 2.60E-04 0.00E+00 1.29E-03 9.58E-05 8.48E-05 1.33E-04 0.00E+00 9.58E-04
60 mm HE 1,450 0.00E+00 6.71E-02 6.88E-02 3.31E-02 5.72E-03 0.00E+00 4.47E-01 0.00E+00 4.86E-02 4.99E-02 2.40E-02 4.15E-03 0.00E+00 3.24E-01
60 mm Illum 340 0.000151 0.00754 0.2088 0.4872 0.00812 0.005626 0.03886 2.56E-05 1.28E-03 3.55E-02 8.28E-02 1.38E-03 9.56E-04 6.61E-03
60 mm Smoke 170 0.00E+00 7.80E-03 1.40E-03 1.20E-03 9.80E-05 0.00E+00 6.30E-03 0.00E+00 6.63E-04 1.19E-04 1.02E-04 8.33E-06 0.00E+00 5.36E-04
60 mm Inert 1,540 0.00E+00 7.80E-03 1.40E-03 1.20E-03 9.80E-05 0.00E+00 6.30E-03 0.00E+00 6.01E-03 1.08E-03 9.24E-04 7.55E-05 0.00E+00 4.85E-03
66 mm HE 370 0.00E+00 6.71E-02 6.88E-02 3.31E-02 5.72E-03 0.00E+00 4.47E-01 0.00E+00 1.24E-02 1.27E-02 6.12E-03 1306E-03 0.00E+00 8.27E-02
81 mm HE 1,630 0.00E+00 2.74E-01 3.63E-01 1.99E-01 3.38E-02 0.00E+00 3.01E+00 0.00E+00 2.23E-01 2.96E-01 1.63E-01 2.75E-02 0.00E+00 2.45E+00
81 mm Illum 610 3.53E-05 5.08E-02 7.23E-02 5.48E-02 3.22E-03 1.39E-04 2.24E-01 1.08E-05 1.55E-02 2.21E-02 1.67E-02 9.82E-04 4.23E-05 6.83E-02
81 mm Smoke 340 1.50E-03 3.20E-03 3.50E+00 3.50E+00 1.50E-02 1.30E-04 3.40E-01 2.55E-04 5.44E-04 5.95E-01 5.95E-01 2.55E-03 2.21E-05 5.78E-02
83 mm 400 6.00E-04 6.03E-02 1.36E-01 7.20E-02 2.04E-02 2.05E-04 4.29E+00 1.20E-04 1.21E-02 2.72E-02 1.44E-02 4.07E-03 4.10E-05 8.58E-01
84 mm 370 6.00E-04 6.03E-02 1.36E-01 7.20E-02 2.04E-02 2.05E-04 4.29E+00 1.11E-04 1.12E-02 2.52E-02 1.33E-02 3.76E-03 3.79E-05 7.94E-01

CJMT EIS/OEIS Appendix G
April 2015 Draft Air Quality
G-121
Ammunition Type
Annual Total
Ordnance/ Ammunition Expenditure Estimate -
Tinian
Emission Factors (lb/Round) Emissions (tons)
SO2 CO PM10 PM2.5 NOX VOC CO2 SO2 CO PM10 PM2.5 NOX VOC CO2
Grenade (practice) 6,170 - - - - - - - - - - - - - -
HE Fragmentation 3,190 4.90E-05 1.40E-02 3.50E-02 2.00E-02 7.40E-03 0.00E+00 6.20E-01 7.82E-05 2.23E-02 5.58E-02 3.19E-02 1.18E-02 0.00E+00 9.89E-01
Small Arms
9 mm 27,620 8.20E-08 3.10E-04 2.40E-05 2.00E-05 1.50E-05 0.00E+00 2.00E-04 1.13E-06 4.28E-03 3.31E-04 2.76E-04 2.07E-04 0.00E+00 2.76E-03
5.56 mm 3,244,920 0.00E+00 1.60E-03 3.90E-05 2.80E-05 8.50E-05 0.00E+00 8.70E-04 0.00E+00 2.60E+00 6.33E-02 4.54E-02 1.38E-01 0.00E+00 1.41E+00
.45 cal 3,000 0.00E+00 2.60E-04 3.70E-05 3.10E-05 8.10E-06 0.00E+00 2.20E-04 0.00E+00 3.90E-04 5.55E-05 4.65E-05 1.22E-05 0.00E+00 3.30E-04
.50 cal 196,760 0.00E+00 1.60E-02 9.70E-04 4.40E-04 3.30E-05 0.00E+00 9.20E-03 0.00E+00 1.57E+00 9.54E-02 4.33E-02 3.25E-03 0.00E+00 9.05E-01
7.62 mm 1,138,690 0.00E+00 3.00E-03 8.20E-05 5.80E-05 4.10E-05 0.00E+00 1.70E-03 0.00E+00 1.71E+00 4.67E-02 3.30E-02 2.33E-02 0.00E+00 9.68E-01
12 gauge 32,520 0.00E+00 1.50E-03 7.40E-05 6.70E-05 4.20E-05 0.00E+00 1.30E-03 0.00E+00 2.44E-02 1.20E-03 1.09E-03 6.83E-04 0.00E+00 2.11E-02
Air-Delivered Ordinance
25 lb Inert 1,000 - - - - - - - - - - - - - -
500 lb Inert 175 - - - - - - - - - - - - - -
1,000 lb Inert 175 - - - - - - - - - - - - - -
Inert Laser Guided Training Round, 2.75, 5 inch 250 - - - - - - - - - - - - - -
2.75 inch Inert 750 0.00E+00 1.50E+00 1.10E-01 1.00E-01 2.60E-02 0.00E+00 2.40E+00 0.00E+00 5.63E-01 4.13E-02 3.75E-02 9.75E-03 0.00E+00 9.00E-01
5 inch Inert 100 6.05E-02 2.31E-01 0.00E+00 0.00E+00 5.50E-02 0.00E+00 2.31E+01 3.03E-03 1.16E-02 0.00E+00 0.00E+00 2.75E-03 0.00E+00 1.16E+00
20 mm TP 11,250 0.00E+00 3.30E-02 6.60E-04 4.60E-04 4.30E-04 0.00E+00 1.60E-02 0.00E+00 1.86E-01 3.71-03 2.59E-03 2.42E-03 0.00E+00 9.00E-02
25 mm TP 1,000 0.00E+00 8.50E-02 3.30E-03 1.70E-03 1.50E-03 0.00E+00 4.30E-02 0.00E+00 4.25E-02 1.65E-03 8.50E-04 7.50E-04 0.00E+00 2.15E-02
7.62 mm 45,000 0.00E+00 3.00E-03 8.20E-05 5.80E-05 4.10E-05 0.00E+00 1.70E-03 0.00E+00 6.75E-02 1.85E-03 1.31E-03 9.23E-04 0.00E+00 3.83E-02
.50 cal 30,000 0.00E+00 1.60E-02 9.70E-04 4.40E-04 3.30E-05 0.00E+00 9.20E-03 0.00E+00 2.40E-01 1.46E-02 6.60E-03 4.95E-04 0.00E+00 1.38E-01
Total 0.03 56.01 38.68 13.80 1.72 0.01 82.21

CJMT EIS/OEIS Appendix G
April 2015 Draft Air Quality
G-122
Annual Munitions Emissions – Pagan
Ammunition Type
Annual Total
Ordnance/ Ammunition Expenditure Estimate -
Pagan
Emission Factors (lb/Round) Emissions (tons)
SO2 CO PM10 PM2.5 NOX VOC CO2 SO2 CO PM10 PM2.5 NOX VOC CO2
Field Artillery Fire Range
155 mm HE 592 2.70E-03 6.03E+00 3.32E+00 1.40E-01 1.73E-01 1.50E-03 6.50E+00 7.99E-04 1.78E+00 9.83E-01 4.14E-02 5.12E-02 4.44E-04 1.92E+00
155 mm Illum 40 2.70E-03 6.03E+00 3.32E+00 1.40E-01 1.73E-01 1.50E-03 6.50E+00 5.40E-05 1.21E-01 6.64E-02 2.80E-03 3.46E-03 3.00E-05 1.30E-01
155 mm Smoke 320 2.70E-03 6.03E+00 3.32E+00 1.40E-01 1.73E-01 1.50E-03 6.50E+00 4.32E-04 9.64E-01 5.31E-01 2.24E-02 2.77E-02 2.40E-04 1.04E+00
120 mm HE 200 0.00E+00 1.02E+00 8.47E-01 4.31E-01 8.09E-02 0.00E+00 5.47E+00 0.00E+00 1.02E-01 8.47E-02 4.31E-02 8.09E-03 0.00E+00 5.47E-01
120 mm Smoke 200 8.40E-04 5.17E-01 1.23E+01 1.29E+01 1.93E-02 0.00E+00 9.19E-01 8.40E-05 5.17E-02 1.23E+00 1.29E+00 1.93E-03 0.00E+00 9.19E-02
81 mm Smoke 40 1.50E-03 3.20E-03 3.50E+00 3.50E+00 1.50E-02 1.30E-04 3.40E-01 3.00E-05 6.40E-05 7.00E-02 7.00E-02 3.00E-04 2.60E-06 6.80E-03
Small Arms
5.56 mm 382,575 0.00E+00 1.60E-03 3.90E-05 2.80E-05 8.50E-05 0.00E+00 8.70E-04 0.00E+00 3.06E-01 7.46E-03 5.36E-03 1.63E-02 0.00E+00 1.66E-01
.50 cal 36,800 0.00E+00 1.60E-02 9.70E-04 4.40E-04 3.30E-05 0.00E+00 9.20E-03 0.00E+00 2.94E-01 1.78E-02 8.10E-03 6.07E-04 0.00E+00 1.69E-01
7.62 mm 192,960 0.00E+00 3.00E-03 8.20E-05 5.80E-05 4.10E-05 0.00E+00 1.70E-03 0.00E+00 2.89E-01 7.91E-03 5.60E-03 3.96E-03 0.00E+00 1.64E-01
Grenade Mortar/Rocket
40 mm HE 10,460 0.00E+00 7.35E-03 1.30E-02 6.62E-03 1.64E-03 0.00E+00 6.63E-02 0.00E+00 3.84E-02 6.81E-02 3.46E-02 8.56E-03 0.00E+00 3.47E-01
60 mm HE 480 0 0.06705 0.068838 0.033078 0.0057216 0 4.47E-01 0.00E+00 1.61E-02 1.65E-02 7.94E-03 1.37E-03 0.00E+00 1.07E-01
60 mm Illum 80 1.51E-04 0.00754 0.2088 0.4872 0.00812 5.63E-03 0.03886 6.03E-06 3.02E-04 8.35E-03 1.95E-02 3.25E-04 2.25E-04 1.55E-03
60 mm Smoke 40 0.00E+00 7.80E-03 1.40E-03 1.20E-03 9.80E-05 0.00E+00 6.30E-03 0.00E+00 1.56E-04 2.80E-05 2.40E-05 1.96E-06 0.00E+00 1.26E-04
81 mm HE 1000 0.00E+00 2.74E-01 3.63E-01 1.99E-01 3.38E-02 0.00E+00 3.01E+00 0.00E+00 1.37E-01 1.81E-01 9.97E-02 1.69E-02 0.00E+00 1.50E+00
81 mm Illum 80 3.53E-05 5.08E-02 7.23E-02 5.48E-02 3.22E-03 1.39E-04 2.24E-01 1.41E-06 2.03E-03 2.89E-03 2.19E-03 1.29E-04 5.54E-06 8.96E-03
81 mm Smoke 40 1.30E-04 4.40E-03 1.70E-01 0.00E+00 5.70E-03 8.50E-05 3.80E-03 2.60E-06 8.80E-05 3.40E-03 0.00E+00 1.14E-04 1.70E-06 7.60E-05
83 mm HE 8 6.00E-04 6.03E-02 1.36E-01 7.20E-02 2.04E-02 2.05E-04 4.29E+00 2.40E-06 2.41E-04 5.44E-04 2.88E-04 8.14E-05 8.20E-07 1.72E-02
TOW HEAT 4 1.95E-03 6.29E-02 9.26E-01 9.26E-01 3.15E-03 2.91E-03 1.70E+01 3.91E-06 1.26E-04 1.85E-03 1.85E-03 6.30E-06 5.82E-06 3.40E-02
AT-4 HE 4 6.00E-04 6.03E-02 1.36E-01 7.80E-02 2.04E-02 2.05E-04 4.29E+00 1.20E-06 1.21E-04 2.72E-04 1.56E-04 4.07E-05 4.10E-07 8.58E-03
20 mm TP 160 0.00E+00 3.30E-02 6.60E-04 4.60E-04 4.30E-04 0.00E+00 1.60E-02 0.00E+00 2.64E-03 5.28E-05 3.68E-05 3.44E-05 0.00E+00 1.28E-03

CJMT EIS/OEIS Appendix G
April 2015 Draft Air Quality
G-123
Ammunition Type
Annual Total
Ordnance/ Ammunition Expenditure Estimate -
Pagan
Emission Factors (lb/Round) Emissions (tons)
SO2 CO PM10 PM2.5 NOX VOC CO2 SO2 CO PM10 PM2.5 NOX VOC CO2
Air-Delivered Ordnance
25 lb Inert 1,000 - - - - - - - - - - - - - -
500 lb Inert 175 - - - - - - - - - - - - - -
500 lb HE 175 5.00E-02 2.20E+00 3.40E+01 3.40E+01 2.95E-02 1.00E-01 4.85E+02 4.38E-03 1.93E-01 2.98E+00 2.98E+00 2.58E-03 8.75E-03 4.24E+01
1,000 lb HE 175 1.00E-01 4.40E+00 6.80E+01 6.80E+01 5.90E-02 2.00E-01 9.70E+02 8.75E-03 3.85E-01 5.95E+00 5.95E+00 5.16E-03 1.75E-02 8.49E+01
2,000 lb HE 175 2.00E-01 8.80E+00 1.36E+02 1.36E+02 1.18E-01 4.00E-01 1.94E+03 1.75E-02 7.70E-01 1.19E+01 1.19E+01 1.03E-02 3.50E-02 1.70E+02
2.75 inch HE 500 0.00E+00 1.90E+00 3.50E-01 2.20E-01 3.16E-02 0.00E+00 3.10E+00 0.00E+00 4.75E-01 8.75E-02 5.50E-02 7.90E-03 0.00E+00 7.75E-01
2.75 inch Illum 50 0.00E+00 1.50E+00 1.10E-01 1.00E-01 2.60E-02 0.00E+00 2.40E+00 0.00E+00 3.75E-02 2.75E-03 2.50E-03 6.50E-04 0.00E+00 6.00E-02
2.75 inch Smoke 75 0.00E+00 1.50E+00 1.10E-01 1.00E-01 2.60E-02 0.00E+00 2.40E+00 0.00E+00 5.63E-02 4.13E-03 3.75E-03 9.75E-04 0.00E+00 9.00E-02
5 inch HE 150 6.50E-02 4.29E-01 3.06E+00 3.06E+00 5.77E-02 9.00E-03 6.68E+01 4.88E-03 3.22E-02 2.30E-01 2.30E-01 4.32E-03 6.75E-04 5.01E+00
20 mm TP 11,250 0.00E+00 3.30E-02 6.60E-04 4.60E-04 4.30E-04 0.00E+00 1.60E-02 0.00E+00 1.86E-01 3.71E-03 2.59E-03 2.42E-03 0.00E+00 9.00E-02
25 mm TP 1,000 0.00E+00 8.50E-02 3.30E-03 1.70E-03 1.50E-03 0.00E+00 4.30E-02 0.00E+00 4.25E-02 1.65E-03 8.50E-04 7.50E-04 0.00E+00 2.15E-02
7.62 mm 45,000 0.00E+00 3.00E-03 8.20E-05 5.80E-05 4.10E-05 0.00E+00 1.70E-03 0.00E+00 6.75E-02 1.85E-03 1.31E-03 9.23E-04 0.00E+00 3.83E-02
.50 cal 30,000 0.00E+00 1.60E-02 9.70E-04 4.40E-04 3.30E-05 0.00E+00 9.20E-03 0.00E+00 2.40E-01 1.46E-02 6.60E-03 4.95E-04 0.00E+00 1.38E-01
LGTR Inert 250 - - - - - - - - - - - - - -
Naval Ship Delivered Ordnance
5 inch HE 150 6.50E-02 4.29E-01 3.06E+00 3.06E+00 5.77E-02 9.00E-03 6.68E+01 4.88E-03 3.22E-02 2.30E-01 2.30E-01 4.32E-03 6.75E-04 5.01E+00
Air-to-Air Ordnance and Expendables (Warning Areas Only)
AIM 7 5 1.78E-02 4.37E-01 6.07E+00 6.07E+00 4.04E-02 2.07E-02 1.43E+02 4.45E-05 1.09E-03 1.52E-02 1.52E-02 1.01E-04 5.17E-05 3.58E-01
AIM 9 5 1.11E-02 1.41E-01 1.50E+00 1.50E+00 3.65E-02 7.24E-03 7.79E+01 2.77E-05 3.53E-04 3.76E-03 3.76E-03 9.12E-05 1.81E-05 1.95E-01
AIM 120 3 2.00E-02 3.03E-01 3.55E+00 3.55E+00 6.17E-02 1.51E-02 1.45E+02 3.00E-05 4.54E-04 5.33E-03 5.33E-03 9.26E-05 2.27E-05 2.17E-01
Chaff 2,400 7.90E-06 1.30E-03 6.20E-03 6.20E-03 1.30E-04 4.00E-04 1.10E-02 9.48E-06 1.56E-03 7.44E-03 7.44E-03 1.56E-04 4.80E-04 1.32E-02
Flares 2,400 1.30E-04 4.40E-03 1.70E-01 0.00E+00 5.70E-03 8.50E-05 3.80E-03 1.56E-04 5.28E-03 2.04E-01 0.00E+00 6.84E-03 1.02E-04 4.56E-03
Total 0.04 6.63 24.92 23.05 0.19 0.06 315.34
CJMT EIS/OEIS Appendix G
April 2015 Draft Air Quality
G-124
Attachment 8 - Total Annual Operational Emissions
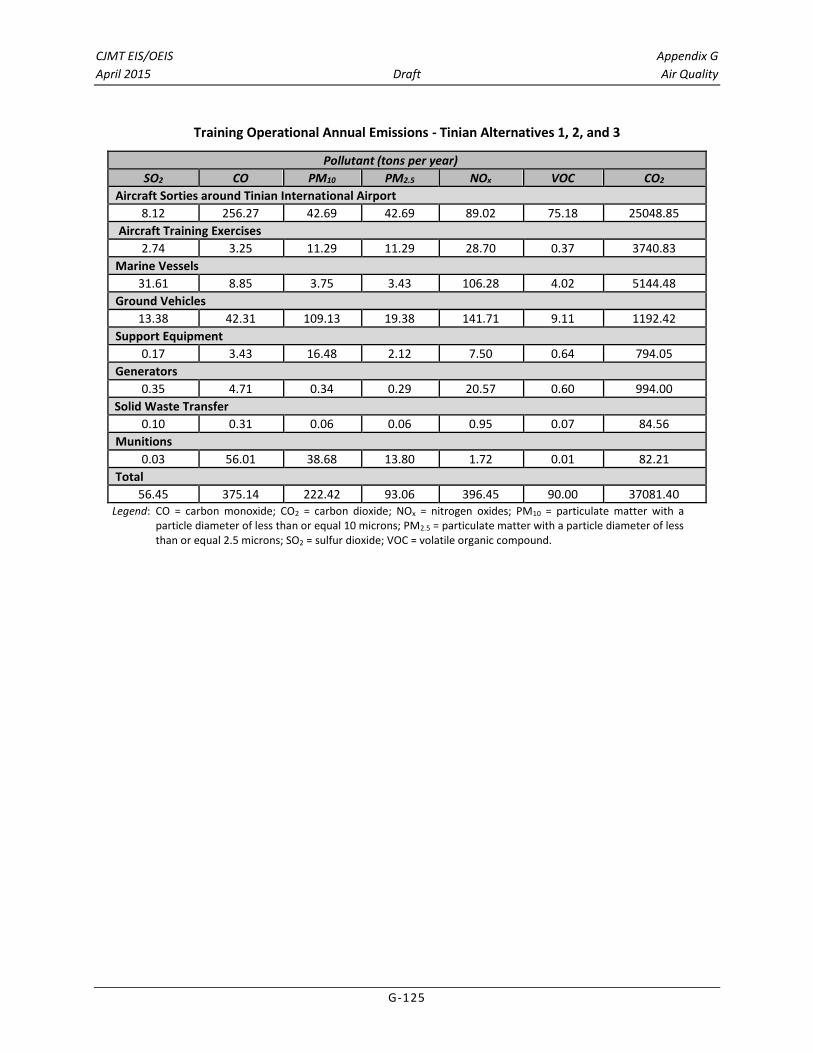
CJMT EIS/OEIS Appendix G
April 2015 Draft Air Quality
G-125
Training Operational Annual Emissions - Tinian Alternatives 1, 2, and 3
Pollutant (tons per year)
SO2 CO PM10 PM2.5 NOx VOC CO2
Aircraft Sorties around Tinian International Airport
8.12 256.27 42.69 42.69 89.02 75.18 25048.85
Aircraft Training Exercises
2.74 3.25 11.29 11.29 28.70 0.37 3740.83
Marine Vessels
31.61 8.85 3.75 3.43 106.28 4.02 5144.48
Ground Vehicles
13.38 42.31 109.13 19.38 141.71 9.11 1192.42
Support Equipment
0.17 3.43 16.48 2.12 7.50 0.64 794.05
Generators
0.35 4.71 0.34 0.29 20.57 0.60 994.00
Solid Waste Transfer
0.10 0.31 0.06 0.06 0.95 0.07 84.56
Munitions
0.03 56.01 38.68 13.80 1.72 0.01 82.21
Total
56.45 375.14 222.42 93.06 396.45 90.00 37081.40 Legend: CO = carbon monoxide; CO2 = carbon dioxide; NOx = nitrogen oxides; PM10 = particulate matter with a
particle diameter of less than or equal 10 microns; PM2.5 = particulate matter with a particle diameter of less than or equal 2.5 microns; SO2 = sulfur dioxide; VOC = volatile organic compound.

CJMT EIS/OEIS Appendix G
April 2015 Draft Air Quality
G-126
Training Operational Annual Emissions - Pagan Alternatives 1 and 2
Pollutant (tons per year)
SO2 CO PM10 PM2.5 NOx VOC CO2
Aircraft Sorties around Pagan Airport
2.98 74.22 17.16 17.16 42.66 29.71 7607.25
Aircraft Training Exercises
2.29 2.31 8.00 8.00 42.64 0.28 4810.82
Marine Vessels
2.18 0.84 0.27 0.25 10.22 0.36 353.86
Ground Vehicles
32.80 94.12 155.51 35.46 335.45 20.41 1421.42
Support Equipment
0.02 0.49 1.24 0.20 0.92 0.09 102.75
Generators
0.30 4.04 0.29 0.25 17.61 0.52 851.20
Munitions
0.04 6.63 24.92 23.05 0.19 0.06 315.34
Total
40.61 182.65 207.39 84.37 449.69 51.43 15462.64 Legend: CO = carbon monoxide; CO2 = carbon dioxide; NOx = nitrogen oxides; PM10 = particulate matter with a particle
diameter of less than or equal 10 microns; PM2.5 = particulate matter with a particle diameter of less than or equal 2.5 microns; SO2 = sulfur dioxide; VOC = volatile organic compound.

CJMT EIS/OEIS Appendix G
April 2015 Draft Air Quality
G-127
Combined Regional Training Operational Annual Emissions – Tinian and Pagan Combined
Pollutant (tons per year)
SO2 CO PM10 PM2.5 NOx VOC CO2
Aircraft Sorties around Tinian International Airport and Pagan Airport
11.1 330.49 59.85 59.85 131.68 104.89 32656.1
Aircraft Training Exercises
5.03 5.56 19.29 19.29 71.34 0.65 8551.65
Marine Vessels
33.79 9.69 4.02 3.68 116.5 4.38 5498.34
Ground Vehicles
46.18 136.43 264.64 54.84 477.16 29.52 2613.84
Support Equipment
0.19 3.92 17.72 2.32 8.42 0.73 896.8
Generators
0.65 8.75 0.63 0.54 38.18 1.12 1845.20
Solid Waste Transfer
0.10 0.31 0.06 0.06 0.95 0.07 84.56
Munitions
0.07 62.64 63.6 36.85 1.91 0.07 397.55
Total
97.06 555.20 429.09 177.41 849.47 141.48 52544.04 Legend: CO = carbon monoxide; CO2 = carbon dioxide; NOx = nitrogen oxides; PM10 = particulate matter with a
particle diameter of less than or equal 10 microns; PM2.5 = particulate matter with a particle diameter of less than or equal 2.5 microns; SO2 = sulfur dioxide; VOC = volatile organic compound.

CJMT EIS/OEIS Appendix G
April 2015 Draft Air Quality
G-128
This page intentionally left blank.